Featured Application
This study highlights the potential of biochars for industrial and domestic wastewater treatment by leveraging their adsorption properties. Converting renewable agricultural waste into value-added products enhances environmental sustainability. Our findings demonstrate the dual functionality of activated rice husk biochar, combining adsorption with antimicrobial effects, and offering a significant advancement for real-world water purification applications.
Abstract
The objective of this research was to investigate silver adsorption on biochars prepared by the carbonization of desiliconized rice husks and cotton fabric, and to elucidate the adsorption mechanism. The biochars were characterized using various instrumental techniques, including thermogravimetric analysis (TGA), X-ray diffraction (XRD), Fourier-transform infrared spectroscopy (FTIR), scanning electron microscopy (SEM), X-ray photoelectron spectroscopy (XPS), and low-temperature nitrogen adsorption. The adsorption process was studied under multiple parameters affecting silver adsorption and was best described by the pseudo-second-order kinetic model. Both the Langmuir and Freundlich isotherm models provided good correlations for the adsorption of silver ions onto the biochars. Thermodynamic analysis indicated that the adsorption of Ag+ ions was spontaneous and exothermic. XPS confirmed the presence of metallic silver (Ag0) in the biochars RHB and ARHB, suggesting that a reduction process occurred during silver adsorption. Additionally, in vitro studies were conducted to evaluate the antimicrobial activity of silver-loaded activated rice husk biochar against E. coli strains.
1. Introduction
In recent years, the production, research, and application of biochar across various fields has been rapidly advancing and gaining widespread popularity [1,2]. As defined by the International Biochar Initiative (IBI), biochar is a solid material containing stable carbon obtained by the thermal conversion of plant biomass at temperatures below 700 °C under limited oxygen conditions [3]. This process breaks down the lignin–cellulose matrix into solid carbon while releasing a substantial number of volatile compounds [4]. The resulting pyrolyzed carbon has a well-developed porous structure and a high specific surface. In addition, its surface contains various active functional groups, which impart high reactivity and excellent cation exchange capacity [5]. The production process for biochar is relatively simple and energy-efficient, utilizing a wide range of waste materials as feedstock. Additionally, the pyrolysis process generates environmentally friendly energy byproducts, including pyrolysis gas and oil. The totality of the listed advantages makes biochar, either in its raw form or after modification, applicable in various sectors of industry [6,7].
Numerous studies have shown that adding biochar to soil enhances its physicochemical and biological properties, as well as soil fertility [8,9,10,11]. Moreover, biochar use is closely linked to soil carbon sequestration [12]. The unique structure of biochar, along with its tunable properties, makes it an attractive material for various advanced applications, including as a filler or electrode material in lithium-ion batteries, sodium-ion batteries, supercapacitors, and more [13,14,15,16]. Biochar also exhibits excellent adsorption capacity, making it a promising candidate for water purification, capable of removing various organic and inorganic pollutants [17,18,19,20,21,22,23]. The possibility of producing biochar from renewable lignocellulosic agricultural waste and using it to clean up the environment multiplies the environmental impact of processing this renewable waste. The alarming rise in household and industrial waste worldwide, driven by population growth and economic expansion, underscores the urgent need for improved waste management and treatment methods. Current disposal practices often harm the environment and public health, necessitating more sustainable solutions.
Among water pollutants, silver occupies a special role. Silver is a noble metal highly valued for its esthetic appeal and versatile applications, from jewellery to electronics. It is known that silver prevents the growth of bacteria and algae in water media [24,25,26].
Silver acts as a powerful sanitizer when combined with oxygen. However, it can also have toxic effects on humans and aquatic ecosystems. Silver ions can harm fish, algae, and other aquatic organisms that are found in aquatic environments, disrupting the ecological balance. Addressing silver contamination requires considering both environmental and economic factors and prioritizing the enhancement of recovery techniques [27].
Conventional methods like chemical precipitation and ion exchange are expensive and lead to secondary pollution. Adsorption has emerged as a promising method for this purpose. Researchers continue to search for effective adsorbents, exploring a diverse range of materials, including activated carbon, zeolites, metal oxides, and various organic polymers. Biochar derived from lignocellulosic renewable waste has emerged as a sustainable and cost-effective alternative. Their structural properties and surface functionalities enable selective binding of silver ions, making them ideal candidates for the removal and recovery of silver [28,29].
Numerous studies confirm that biochar-based adsorbents exhibit high silver uptake capacities [11,28,29]. For instance, rice husk biochar has demonstrated significant potential for removing or concentrating Ag+ ions from wastewater, making it an economical and environmentally friendly option [30]. Cotton, containing over 90% cellulose, is another promising feedstock for biochar production through direct carbonization or activation processes [13,31,32].
Unlike some chemical methods, the use of biochar generates less secondary waste, further enhancing its environmental benefits. Ongoing research and development in this area are critical to fully harness the potential of biochar-based adsorbents.
In the present research, the efficiency of biochars prepared by the carbonization of desiliconized rice husks and cotton fabric in adsorbing silver ions from aqueous solutions was investigated. The kinetics, equilibrium, and thermodynamics of the adsorption process were analyzed in detail.
As has been stated above, silver and silver ions have impressive antimicrobial and antiseptic properties, making them valuable for various applications. Silver has been used since ancient times for its ability to inhibit the growth of bacteria, viruses, and fungi. These properties have found applications in medical devices, wound dressings, and water purification systems. Silver nanoparticles are also being incorporated into textiles, coatings, and consumer products to impart antimicrobial properties, reduce the spread of pathogens, and improve hygiene. Research continues to explore the exact mechanisms of silver’s antimicrobial action [33,34].
Considering the increasing resistance of microorganisms to antibiotics and the urgent need for alternative solutions, this study investigated the antimicrobial activity of biochar with adsorbed silver ions. In vitro studies were conducted to evaluate the antimicrobial properties of biochar produced by the pyrolysis of desiliconized rice husks that had adsorbed Ag+ ions.
2. Materials and Methods
Rice husks separated after processing the arpa were used to produce biochar. The rice husks used in this investigation were provided by the rice factory LM Ltd., Parardjik, Bulgaria.
The husks were pre-washed three times with deionized water to remove the mechanical impurities. They were then dried in an electric dryer at 120 °C until a constant weight was achieved, ensuring complete moisture removal. The cotton used in the experiments was a commercial product. It was previously mercerized in an alkaline solution. All chemicals used in the study, including HF acid, ZnCl2, HCl acid, and AgNO3, were of pure grade and supplied by Honeywell Fluka.
2.1. Preparation of the Samples
Three biochar samples were prepared:
- Rice Husk Biochar
The dried rice husks were treated with concentrated HF acid for ten days to completely remove the biogenic SiO2 from the lignin–cellulose matrix fully. The husks were then washed several times with deionized water until the wash water was neutral, and dried at 120 °C. The husks were subjected to pyrolysis under static conditions in a corundum crucible with limited air access at 480 °C for 3 h. A heating rate of 5 °C/min was applied. This biochar was designated as sample RHB.
- Activated Rice Husk Biochar
The second sample was obtained by the chemical activation of the RHB sample. A portion of the RHB sample was mixed with a concentrated ZnCl2 solution at ~60 °C under continuous stirring for 1 h. After cooling, the mixture was filtered, and the wet sludge was dried at room temperature. The air-dried sample was pyrolyzed at 700 °C under vacuum for 1 h. After cooling, the biochar was treated with a 1:1 water solution of HCl for 1 h to remove excess ZnO. The material was washed with deionized water until the wash water was neutral, and then dried at 110 °C. The sample was designated as ARHB.
- Cotton Biochar
The sample labelled CB was obtained by carbonizing commercial cotton that had been pre-mercerized. The cotton was treated with a 17.7% NaOH solution at room temperature for 24 h, then washed with deionized water until the wash water was neutral. It was subsequently dried at 120 °C to a constant weight. The dried cotton was pyrolyzed under static conditions in a corundum crucible with limited air access at 320 °C for 3 h.
2.2. Materials Characterization
The fixed carbon content in the samples was determined using thermogravimetric analysis on a LABSYSEvo (SETARAM, Calure, France), employing a corundum crucible and a heating rate of 10 °C/min in air.
The phase composition of the samples was examined through powder X-ray diffraction (XRD). Diffraction patterns were recorded between 5 and 80 degrees 2θ using a Bruker D8-Advance diffractometer equipped with CuKα radiation, and a LynxEye detector from Karlsruhe, Germany. Phase identification was conducted using the EVA v4 software, which references the ICDD-PDF-2(2021) database.
Fourier-transform infrared (FTIR) spectra of the biochars were obtained by mixing them with KBr. This mixture was then analyzed with a Thermo Nicolet Avatar 360 FTIR spectrometer from Thermo Fisher Scientific, based in Waltham, MA, USA. The instrument operated at a resolution of 2 cm−1, enabling detailed spectral analysis.
The surface morphology of the biosorbents was observed on a scanning electron microscope (SEM), Tescan model SEM/FIB Lyra I XMU, sourced from Tescan Orsay Holding, Brno, Czech Republic, utilizing secondary electron imaging (SEI) modes. Elemental analysis was performed using a Quantax200 EDX detector from Bruker, Berlin, Germany.
Low-temperature nitrogen adsorption at 77 K was conducted using a Quantachrome Nova 1200e instrument(Anton Paar Quanta Tech Inc., Boynton Beach, FL, USA) to determine the texture parameters of the samples. The specific surface area was calculated using the BET equation, while the total pore volume and mean pore diameter were determined at p/p0 ≈ 0.99, following the Gurvitch rule. Pore size distributions were analyzed using the BHJ method.
The surface state of biochars after adsorption of silver ions was investigated with X-ray photoelectron spectroscopy (XPS). The analysis was carried out with an ESCALAB MKII spectrometer (VG Scientific, Manchester, UK), quipped with an unmonochromatized Al Kα source at 1486.6 eV, achieving a total instrumental resolution of approximately 1 eV, under a base pressure of 10−8 mbar. The Ag 3d photoelectron lines were recorded and referenced to the C1s line at 285.0 eV. The XPSPEAK 4.0 software was used to deconvolute the photoelectron peaks, with all data being collected at a 45° take-off angle.
2.3. Adsorption Studies
Adsorption experiments were conducted using 50 mL conical flasks, each containing 0.1 g of biochar mixed with 10 mL of a silver ion solution. These mixtures were then agitated on a rotary shaker for different periods to investigate the adsorption process. After shaking, the solid particles were separated from the solution by filtration. The concentrations of silver ions in the filtrate were measured by inductively coupled plasma optical emission spectrometry (ICP-OES) using a Prodigy 7 ICP-OES spectrometer (Teledyne Leeman Labs, Mason, OH, USA).
A stock solution of silver ions at 1000 mg L−1 was prepared using Titrisol (Merck, Darmstadt, Germany), and was diluted to the required initial concentrations for the experiments. All reagents used were of analytical grade. Batch experiments were performed to determine the influence of variables such as contact time, pH, initial silver ion concentration, and temperature on the adsorption process. The equilibrium adsorption capacity (Qe, expressed in mg/g) was calculated using the following formula:
where C0 is the initial concentration of silver ions, Ce is the equilibrium concentration, V is the volume of the solution, and m is the mass of the biosorbent used.
Qe = (C0 − Ce) × V/m
The adsorption behaviour of silver ions (Ag+) was explored under various conditions to understand how different factors influence the process. First, the effect of contact time was studied at a pH of 3.5 with a silver ion concentration of 50 mg L−1. Next, to determine the impact of acidity on silver ion removal, experiments were conducted over a pH range of 1.9 to 5.5 using a silver ion concentration of 20 mg L−1. The influence of initial silver ion concentration on adsorption capacity was examined by testing concentrations from 10 to 200 mg L−1 at a pH of 3.5. Additionally, the effect of temperature on the adsorption process was investigated at three different temperatures, 293 K, 303 K, and 333 K, with a silver ion concentration maintained at 200 mg L−1. For all experiments, the pH of the initial solutions was precisely adjusted to the required level using 0.1 M nitric acid and 0.1 M sodium hydroxide solutions before mixing the suspensions.
2.4. The In Vitro Antimicrobial Effect of Biochars Adsorbing Silver Ions
Microorganisms: Pure cultures of four strains of Escherichia coli were tested: 1 reference, ATCC 8739, and 3 clinical isolates. The clinical strains used were from the Microbial Strain Collection of the Microbiological Laboratory, Faculty of Veterinary Medicine, University of Forestry, Sofia, Bulgaria, which belongs to the Global Register of Scientific Collections. Suspensions with a density of 2 by McFarland were prepared in sterile saline and brought to a concentration of 107 cells/mL.
Nutrient media: Nutrient agar and the selective and differentiating Endo agar for Gram-negative aerobic and facultatively anaerobic bacteria (BUL BIO—National Centre for Infectious and Parasitic Diseases—NCIPD—Sofia, Bulgaria) were used.
Antimicrobial tests: The antibacterial effect was investigated using the classic agar-gel diffusion method of Bauer–Kirby, according to Weinstein and NCCLS [35,36,37], designed for rapidly growing microbes under aerobic conditions on nutrient agar with a pH of 7.2–7.4 and a layer thickness of 4 mm. The 10% suspension of biochar loaded with silver in saline solution, homogenized at Vortex model Heidolph, 100–2500 rpm, was administered by the instillation of 0.1 mL into wells with a diameter of 9 mm. The control antibiotic thiamphenicol was tested by instilling into wells 0.1 mL of a solution in sterile saline at standard final concentrations of 30 μg per well. Inoculation of the bacterial suspensions at a dose of 2.106 cells/mL was followed by cultivation at 35–37 °C for 18–24 h.
The results were recorded by measuring the diameters of the inhibitory zones in millimetres, rounded to the nearest whole millimetres. This measurement included the diameter of the well and was performed using a transparent ruler on the outside bottom of the Petri dishes.
The measured zones of inhibition were interpreted according to the Bauer–Kirby three-level categorization system. The sensitivity of the tested microorganisms to the examined product was determined, as in the case of non-antibiotic agents, as sulfonamides, namely: resistant (R)—for areas with diameters <12 mm; intermediate (I)—for areas within 13–16 mm; and sensitive (S)—>17 mm. For thiamphenicol, the corresponding limits were R < 12 mm; I—13–17 mm; and S—>18 mm [35,37].
Suspension method: Suspensions of the tested plant material with silver were made at a ratio of 1:10 in a sterile physiological saline solution. To 9 mL solutions of the studied material, 1 mL of a suspension of each studied strain with a concentration of 107 cells/mL was added. At such a tenfold dilution, a bacterial cell density of 106 cells/mL was achieved. Cultures were made on nutrient agar and Endo agar at different time intervals (0 min, 30 min, and 60 min) of exposure to the studied product with silver. Cultures were also made directly from the tested bacterial strains, with a concentration of 106 cells/mL without treatment serving as controls. They were cultured at 37 °C for 24 h. Colonies that developed were then counted and compared to those in untreated controls.
The broad-spectrum antibiotic thiamphenicol (Nikovet—Sofia) was used as a positive control. Sterile saline served as a negative control.
The statistical analysis of the results was carried out using the classic Student–Fisher method.
3. Results and Discussion
3.1. Materials Characterization by Thermogravimetry and XRD
Pyrolysis of the cotton at 320 °C is associated with the degradation of cellulose and its structure, producing sample CB. At temperatures above 300 °C, the degradation of the carbohydrate contributes to an increased fixed carbon content, which reaches 6 wt.% in sample CB.
Sample RHB was prepared by the pyrolysis of rice husks at 480° C, while sample ARHB was synthesized by chemically activating sample RHB at 700° C. In this higher temperature range, the lignocellulose matrix undergoes significant decomposition, releasing large amounts of volatile matter and increasing the carbon fraction in the biochar. The amount of fixed carbon in both samples is about 10 wt.%, as shown in Figure 1. The pyrolysis process is associated with an increase in the sp2 content of biochar, which is proportional to the pyrolysis temperature [38].
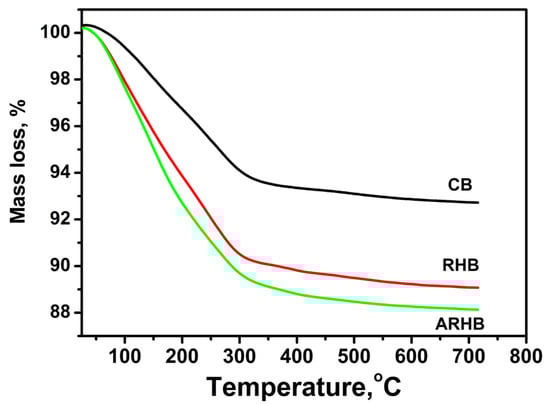
Figure 1.
TG analysis of the biochars, heating rate 10 °C min−1; atmosphere—air.
In general, the solid pyrolysis residue retains the structure of the lignocellulosic matrix if the latter has not been subjected to chemical pretreatment. The typical three well-defined crystalline peaks in cellulose around 16°, 22°, and 35° 2θ, as reported by Ishak et al., are not present in the spectrum of the CB sample (Figure 2) [39]. Despite the low pyrolysis temperature, the two prominent peaks at 24.5° and 43° 2θ degrees in the CB sample indicate the presence of an ordered carbon structure. The preliminary removal of Si from the lignocellulosic matrix, associated with hydrolysis processes, leads to more disordered carbon structures in the RHB and ARHB samples, as shown in Figure 2.
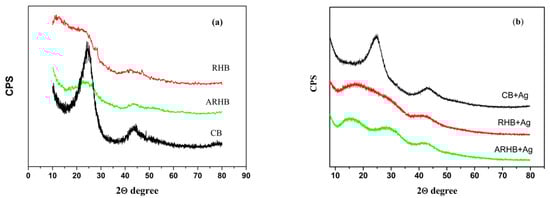
Figure 2.
XRD diffractograms of the samples before (a) and after Ag adsorption (b).
The adsorption of silver onto ARHB resulted in structural changes, as evidenced by the appearance of new diffraction peaks in the 10–35° 2θ range (Figure 2b). These peaks suggest the formation of silver-related crystalline phases, potentially due to the presence of silver nanoparticles, silver oxide (Ag2O), or silver clusters interacting with the biochar surface. Such transformations could arise from the reduction in Ag ions or their complexation with functional groups on the biochar, leading to distinct XRD features.
3.2. FTIR Analysis
Biochars derived from rice husks and cotton exhibit FTIR bands that reflect the presence of typical organic and inorganic components found in pyrolyzed biomass. During pyrolysis, emitted gases partially condense onto the solid residue, contributing to surface functionalities. All three biochars (RHB, ARHB, and CB) show common bands at approximately 3450 cm−1, corresponding to O-H stretching of hydrogen-bonded hydroxyl groups, and a doublet between 2930 and 2850 cm−1, attributed to aliphatic C-H stretching (see Figure 3).
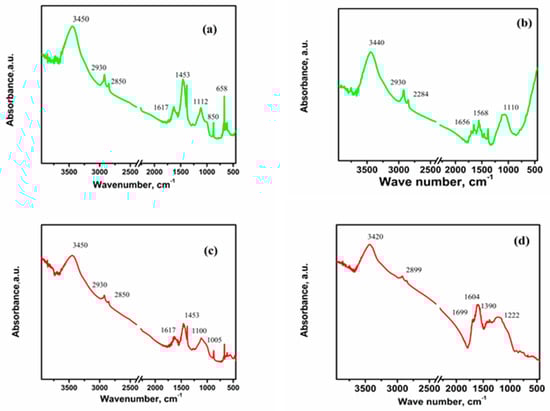
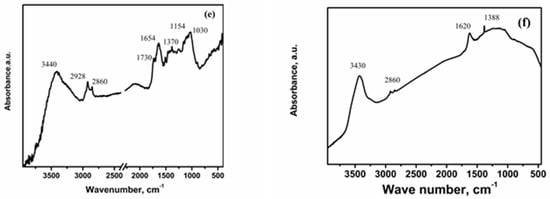
Figure 3.
FTIR spectra of the biochars before and after Ag adsorption: (a) ARHB; (b) ARHB/Ag; (c) RHB; (d) RHB/Ag; (e) CB; and (f) CB/Ag.
The FTIR spectra of RHB and ARHB (Figure 3a,c) are similar, with peaks at 1617 cm−1 (aromatic C=C or C=O stretching, possibly indicative of carbonyl groups in amides), 1453 cm−1 (C-H bending in aliphatic chains), 1112 cm−1 (C-O stretching or Si-O-Si bonds), 850 cm−1 (aromatic C-H bending or Si-O/Si-O-C bonds), and 658 cm−1 (Si-O-Si symmetric stretching). However, ARHB, exhibits additional oxygen-containing groups due to activation, as evidenced by stronger bands at 1100 cm−1 and 1005 cm−1, corresponding to C-O and Si-O stretching. This activation increases the availability of functional groups, enhancing ARHB’s reactivity compared to RHB. Residual SiO2 remains in both RHB and ARHB, indicating incomplete extraction during preparation.
The FTIR spectrum of CB (Figure 3e) shows distinct bands at 1730 cm−1 (carbonyl group stretching), 1654 cm−1 (C=C stretching in aromatic rings, or possibly C=O stretching in conjugated carbonyl groups, such as amides), 1370 cm−1 (aliphatic structures or oxygen-containing groups), 1154 cm−1 (C-O stretching), and 1030 cm−1 (cellulose derivatives and oxygen-containing groups).
After silver ion adsorption, all three biochars exhibit notable changes in their FTIR spectra, indicating interactions between silver ions and oxygen-containing functional groups on their surfaces. These changes include shifts in peak positions, the appearance of new peaks, and variations in peak intensities. Specifically, shifts are observed in peaks associated with O-H stretching, aliphatic C-H stretching, aromatic C=C and C=O groups, and C-O stretching (Figure 3b,d,f). For RHB and ARHB, the disappearance of peaks at 850 cm−1 and 658 cm−1 suggests strong interactions between Ag+ and Si-O/Si-O-Si groups, leading to structural rearrangements and bond modifications. These interactions may involve chemical bonding or electrostatic attraction, disrupting the vibrational modes associated with Si-O-Si symmetric stretching and Si-O/Si-O-C bonds, causing these peaks to vanish from the FTIR spectrum.
The observed spectral changes after silver ion adsorption suggest that the silver ions primarily interact with oxygen-containing functional groups, such as hydroxyl, carbonyl, and silicate sites, on the biochar surface. These interactions likely involve coordination bonds with oxygen-containing functional groups, electrostatic attractions, surface complexation, and possible chemical bonding, resulting in alterations to the biochar’s surface structure and functional group.
3.3. SEM Analysis and Textural Characterization
Scanning electron microscopy was employed to analyze the structural characteristics of the biochar samples (Figure 4).
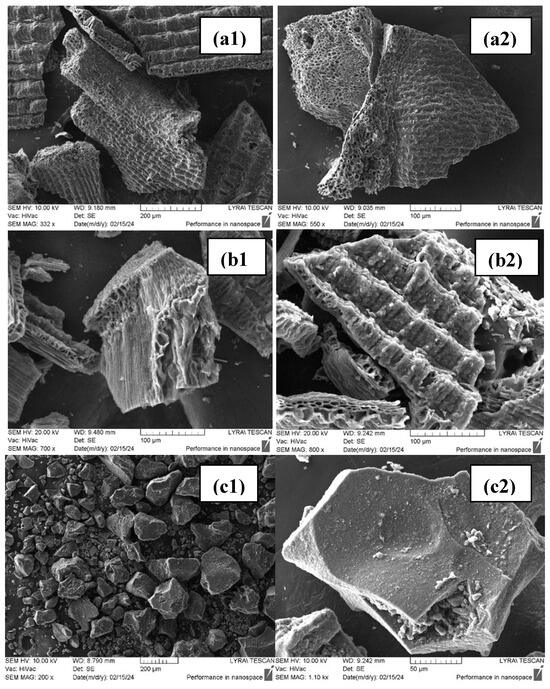
Figure 4.
SEM micrographs of (a1,a2) RHB; (b1,b2) ARHB; and (c1,c2) CB.
After the removal of silica and pyrolysis, the inner surface of rice husk biochar (RHB) reveals a well-organized, dense, and compact cellular structure with a homogeneous porous texture. Some areas are smooth, while others display a honeycomb-like pattern. The visible macropores may facilitate the effective transport of adsorbates. Despite the chemical and thermal treatment of the feedstock, the laminar structure of the raw rice husk is preserved, as shown in Figure 4a1,a2. Chemical activation of the RHB sample does not alter its external surface; however, it induces the development of a three-dimensional network of pores between the external and internal surfaces of the husk, as illustrated in Figure 4b1,b2. In contrast, the CB biochar consists of distinct, well-formed fragments with irregular shapes. This biochar exhibits a more compact and solid structure compared to the other samples, as depicted in Figure 4c1,c2.
The N2 adsorption isotherms of the three biochars exhibit behaviour without a clear plateau of maximum adsorption (see Figure 5). According to the International Union of Pure and Applied Chemistry (IUPAC) classification, these are Type IV isotherms. Adsorption and desorption curves do not coincide, describing isotherms with hysteresis regions that are characteristic of adsorbents with a wide range of pore size distributions.
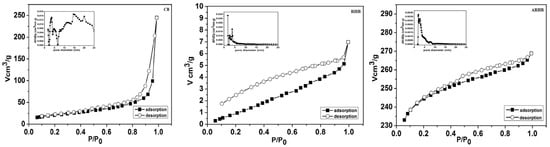
Figure 5.
Nitrogen adsorption–desorption isotherms and pore size distribution of the biochars: CB, RHB, and ARHB.
For the biochar CB, a Type H3 hysteresis loop, as per the IUPAC classification, is observed during the desorption of condensed gas from the mesopores of the adsorbent. The Type H3 loop is characteristic of materials with non-rigid aggregates of plate-like particles or slit-shaped pores. This loop appears in the hysteresis region of the isotherm, and is typically associated with mesoporous materials that have non-uniform sizes and shapes. Biochars RHB and ARHB exhibit H4 hysteresis in their nitrogen adsorption–desorption isotherms. H4 hysteresis loops are indicative of materials with narrow slit-like pores, which can be found in some mesoporous materials but are particularly characteristic of microporous materials (pores less than 2 nm in width). The microporous materials often display H4 hysteresis due to capillary condensation and adsorption–desorption mechanisms occurring within these very small pores [40].
The pore size distribution was calculated using the BJH method. It was observed that biochar CB exhibits a multimodal distribution in both the micropore and mesopore domains, whereas micropores are dominant in biochars RHB and ARHB.
The surface characteristics of the analyzed materials are presented in Table 1.

Table 1.
Texture characteristics.
where SBET is BET surface area; Smi is micropore surface area; V is total pore volume; Dav is average pore diameter; and Vmi is micropore volume.
As shown in the table, the ARHB biochar demonstrates the best textural parameters, including the highest specific surface area and the largest total pore volume, predominantly comprising micropores. These characteristics are expected to enhance the adsorption of silver ions through physisorption.
3.4. Adsorption Studies
3.4.1. Effect of Interaction Time on Adsorption
The graphs in Figure 6 illustrate the adsorption capacity (Qt, in mg/g) of three biochars (CB, RHB, and ARHB) over time (in minutes). Initially, all three samples show a rapid increase in adsorption capacity, eventually reaching a plateau. Biochar RHB demonstrates the fastest adsorption rate, achieving its maximum capacity within 10 min, while the ARHB sample attains the highest final adsorption capacity. Equilibrium is reached for all three materials within 30 min. The fast speed of the adsorption process is one of its most important advantages.
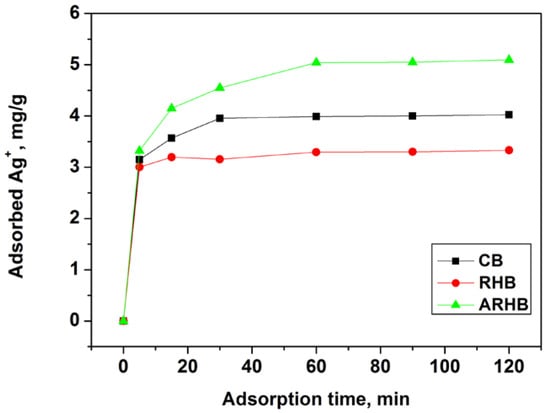
Figure 6.
Kinetics of Ag+ adsorption onto the biochars.
Adsorption mechanisms can be described and understood through various kinetic models, including pseudo-first-order and pseudo-second-order kinetics, as well as diffusion mechanisms. These models help elucidate the rate and pathways by which adsorbates are removed from solutions by adsorbents. The linear equations of these models are the follows:
where Qt represents the adsorbed amount of Ag+ at a certain time t; Qe is the equilibrium adsorption capacity; and k1, k2, and kid is the rate constant for pseudo-first-order adsorption, pseudo-second-order adsorption, and the intraparticle diffusion, respectively. The kinetic parameters and their statistics are presented in Table 2. In comparison to other kinetic models, the pseudo-second-order model demonstrates exceptional fit with the experimental data, achieving values of 0.9996 or higher and calculated adsorption capacities close to those obtained experimentally. This strong correlation suggests that the adsorption of silver ions is predominantly governed by chemisorption mechanisms, facilitated by the reactive functional groups and minerals present on the biochar surface [17]. It should be noted that the diffusion model graphs do not pass through the origin of the coordinate system, indicating that intraparticle diffusion is not the sole mechanism controlling the adsorption process.
log (Qe − Qt) = log (Qe) − (k1/2.303) t
(t/Qt) = (1/k2Qe) + (1/Qe) t
Qt = kid t1/2 + C
Table 2.
Calculated values of the kinetic parameters.
3.4.2. Effect of pH
Figure 7 illustrates the adsorption of Ag+ ions onto the studied biochars (CB, RHB, and ARHB) at varying pH levels. pH plays a critical role in the adsorption process of metal ions like Ag+, as it influences both the surface charge of the adsorbent and the availability of the ions for adsorption. From Figure 7, it is evident that the adsorption of Ag+ increases with pH up to a certain point, with the maximum adsorption occurring in the pH range of 3.5 to 5.5. At lower pH levels, the increased concentration of H+ ions causes competition between protons and Ag+ ions for adsorption sites on the surface of the biochars. This leads to a reduced uptake of Ag+ ions, as the presence of H+ ions can hinder the adsorption of Ag+ through competitive ion exchange mechanisms.
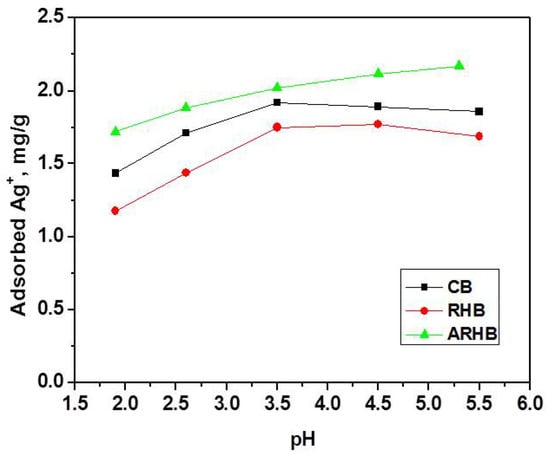
Figure 7.
Dependence between Ag+ ions uptake and the pH.
Interestingly, ARHB shows a more pronounced increase in Ag+ adsorption with pH, continuing to rise at higher pH values (above 5.5), which could be due to the greater deprotonation of surface functional groups, increasing the negative surface charge and enhancing electrostatic attraction to Ag+ ions. In contrast, RHB and CB show a plateau or slight decrease in Ag+ adsorption beyond pH 4. This suggests that the surface characteristics of these biochars limit their ability to further adsorb Ag+ ions at higher pH values.
3.4.3. Adsorption Isotherms
Adsorption isotherms describe the relationship between the amount of solute adsorbed onto a sorbent surface at equilibrium and the concentration of the solute in the solution (Figure 8). They provide insights into the adsorption capacity and mechanism of the sorbent. In this research, the adsorption equilibrium data for silver ions were evaluated using three commonly utilized isotherm models: Langmuir, Freundlich, and Dubinin–Radushkevich. The linear equations for these models are the follows:
where Ce is the concentration of metal ions in the equilibrium solution (mg L−1); Qe is the amount of Ag+ adsorbed (mg) per unit mass of adsorbent (g); Q0 and Qm are the maximum adsorption capacity (mg g−1); KL and kF are the Langmuir and Freundlich constants; β is the adsorption energy constant (mol2 J−2); and ε is the Polanyi potential, calculated by Equation (8):
R is the universal gas constant (J mol−1 K−1) and T is the temperature in K.
Langmuir isotherm: Ce/Qe = 1/KLQ0 + Ce/Q0
Freundlich isotherm: lnQe = lnkF + (1/n)lnCe
Dubinin–Radushkevich isotherm: ln Qe = ln Qm − βε2
ε = RTln(1 + 1/Ce)
The mean adsorption energy E (KJ mol−1) can be calculated using the parameter β by Equation (9):
E = 1/(−2β)1/2
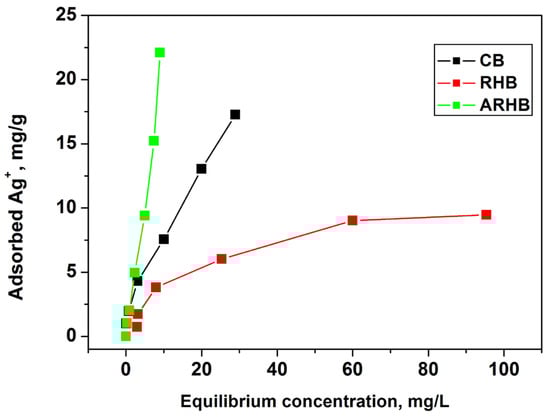
Figure 8.
Adsorption isotherms.
On the other hand, the Langmuir model assumes monolayer adsorption onto a surface with uniform adsorption sites, where adsorption is limited once the surface is fully covered. It predicts a linear relationship between the adsorbed amount and the equilibrium concentration of the solute. The Freundlich model is an empirical equation describing adsorption onto heterogeneous surfaces, suggesting multilayer adsorption with non-uniform energies on the surface. It describes a non-linear relationship between the adsorbed amount and the equilibrium concentration, reflecting the heterogeneous nature of the adsorbent surface. The Dubinin–Radushkevich model is used to characterize physical adsorption onto porous materials. It relates the logarithm of the equilibrium adsorption capacity to the square of the equilibrium concentration, indicating that the adsorption occurs due to the filling of micropores within the sorbent material.
The calculated isotherm constants and correlation coefficients for the Langmuir, Freundlich, and Dubinin–Radushkevich models are presented in Table 3. The data reveal that both the Langmuir and Freundlich models provide good correlations for the adsorption of silver ions on the three biochars. However, based on the correlation coefficient (r2) values, it is evident that the Freundlich model most accurately describes the adsorption process for materials CB (r2 = 0.9992) and ARHB (r2 = 0.9894), indicating multilayer adsorption on heterogeneous surfaces. In contrast, the Langmuir model shows the best fit for material RHB (r2 = 0.9949), which suggests monolayer adsorption on a homogenous surface.
Table 3.
Isotherm constants and correlation coefficients for silver adsorption.
The values of “n” derived from the Freundlich isotherm model for the investigated biochars range from 1.16 to 2.09, indicating that the adsorption process is favourable for all three materials. The Dubinin–Radushkevich (D-R) isotherm model provides further insights into the adsorption mechanisms through the calculated adsorption energy (E) values. For biochars CB (E = 0.86 kJ/mol) and RHB (E = 0.35 kJ/mol), the low energy values confirm that physical adsorption, driven by Van der Waals forces, is the predominant mechanism. In contrast, the higher energy value for biochar ARHB (E = 3.74 kJ/mol) suggests a stronger interaction, potentially involving a degree of chemical adsorption. These findings highlight the coexistence of physisorption and chemisorption in the adsorption of silver ions by biochars, underscoring the complex nature of the process. While physisorption, is characterized by weaker interactions between silver ions and the biochar surface, is dominant for most materials, the variation in adsorption energy reflects differences in surface properties and mechanisms across the biochars. This interplay of chemical and physical processes collectively determines the overall adsorption capacity.
The data also reveal that the ARHB material exhibits the highest adsorption capacity, which can be attributed to its superior textural properties, such as specific surface area and pore volume. The high pore volume enhances accessibility and provides increased sorption sites for Ag species. Furthermore, the presence of additional functional groups and structural defects in the carbon matrix, which act as active sites, contributes to the material’s enhanced affinity for Ag ions. This combination of a well-developed porous structure and surface functionalization makes ARHB a highly efficient adsorbent for Ag+.
ARHB demonstrates an impressive and competitive adsorption capacity for silver ions, positioning it as a highly promising biosorbent (see Table 4). Its performance suggests that ARHB could serve as an effective and sustainable alternative for silver ion removal in various applications.
Table 4.
Adsorption capacity of various biosorbents for silver ions.
3.4.4. Effect of Temperature
Silver adsorption experiments were performed at temperatures of 298 K, 313 K, and 333 K to investigate the effect of temperature (Figure 9). At higher temperatures, the amounts adsorbed for three biochars decreased, indicating that adsorption is exothermic and energy in the form of heat is liberated during the adsorption process. Adsorption thermodynamics and calculating the corresponding thermodynamic parameters (∆G0, ∆H0, and ∆S0) is an integral part of the study of adsorption and plays an important role in estimating the adsorption mechanism. The equilibrium distribution constant (K) characterizes the balance between silver (Ag) in the solid and liquid phases [46,47].
where Kd is the equilibrium constant, R is the gas constant (J mol−1 K−1), and T is the temperature (K). The enthalpy change, ΔH0, and the entropy change, ΔS0, are determined from the slope and intercept of the plot of lnKd versus 1/T, respectively (Figure 9). The values of ΔG0, ΔH0, and ΔS0 parameters are summarized in Table 5.
Kd = Qe/Ce
ΔG0 = −RT lnKd
lnKd = ΔS0/R − ΔH0/RT
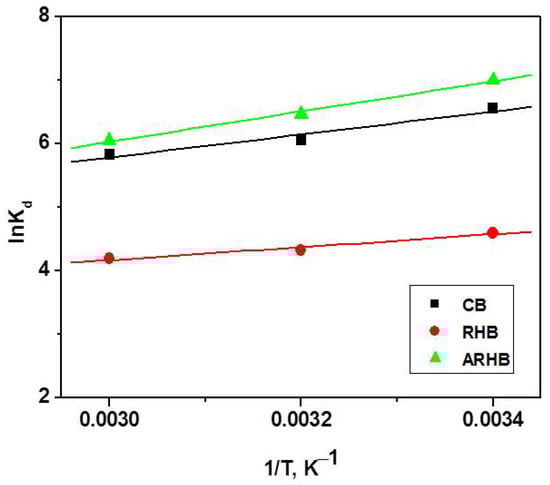
Figure 9.
Variation in the equilibrium constants as a function of temperature.
Table 5.
Values of ΔG0, ΔH0, and ΔS0 at different temperatures for Ag adsorption.
ΔG0 signifies the feasibility of the process, while ΔS0 reflects the disorderliness at the solid–liquid interface during adsorption. The negative ΔG0 values observed for the adsorption of silver ions indicate that the process occurs spontaneously in all studied biochars, underscoring its thermodynamic favourability and suggesting potential applications across various fields.
The dominance of physisorption is evident from the ΔG0 values, which fall within the range of 0 to 20 kJ mol−1, indicating that physical adsorption is the prevailing mechanism. The negative ΔH0 values confirm the exothermic nature of Ag+ adsorption, further supporting its physical character. As temperatures increase, the weakening of hydrogen bonds and van der Waals interactions diminish the physical affinity between the sorbent’s active sites and silver ions, resulting in a decrease in removal efficiency.
3.4.5. XPS Study of Ag Adsorption
The chemical composition of the biochars surface after Ag+ adsorption was analyzed using X-ray photoelectron spectroscopy (XPS). The XPS spectra confirmed the presence of C, N, O, and Ag in all the biochar samples, indicating that these elements are key components of the biochar surface. The elemental composition data reveal that the ARHB sample has a higher percentage of nitrogen and oxygen compared to the other biochars (see Table 6). This suggests a greater presence of functional groups, such as amines, hydroxyl, and carboxyl groups, which are known to play a critical role in adsorption processes. The increased number of these functional groups likely enhances ARHB’s ability to adsorb silver ions, resulting in its higher adsorption capacity. This is further supported by the fact that ARHB shows the highest amount of silver, reinforcing the idea that its surface functionalization contributes to a more efficient adsorption process compared to the other samples.
Table 6.
The atomic surface elemental content in the biochars.
The detection of the Ag 3d peak in the XPS spectra is a significant observation, as it confirms the successful adsorption of silver ions onto the biochar surfaces. The binding energies associated with the Ag 3d5/2 and Ag 3d3/2 orbitals, shown in Figure 10, serve as reliable indicators of silver’s presence [48,49].
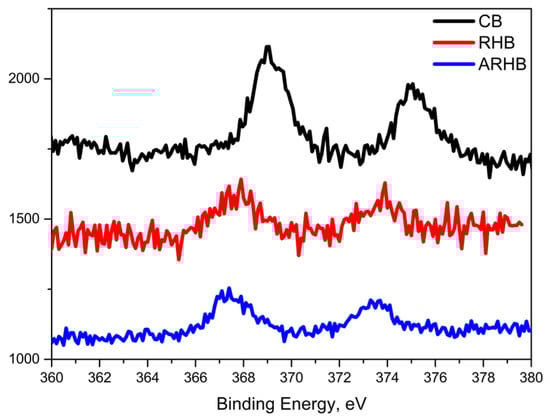
Figure 10.
Binding energy of the Ag 3d5/2 and Ag 3d3/2 orbitals.
However, accurately determining the oxidation state of silver can be challenging due to the minimal chemical shifts observed in XPS spectra. Differences in binding energy reflect changes in electron density due to the oxidation state, with Ag+ showing slightly higher binding energy due to the reduced electron density around the silver nucleus.
Specifically, the binding energies for the RHB and ARHB samples are observed at approximately 368.1 eV (Ag 3d5/2) and 374.0 eV (Ag 3d3/2). In contrast, the CB sample exhibits slightly shifted peaks, with binding energies near 368.8 eV (Ag 3d5/2) and 374.9 eV (Ag 3d3/2). This shift suggests a difference in the chemical environment of the adsorbed silver, likely due to the phenomenon of “charge transfer states”, as discussed in previous studies [50]. These values are more likely consistent with the presence of ionic silver (Ag+). For the RHB and ARHB samples, both the peak separation (6.0 eV) and the binding energy positions suggest the presence of metallic silver (Ag0) [51]. These observations highlight the complex nature of Ag+ ion adsorption on the biochars, affirming the formation of metallic Ag clusters on the surfaces of RHB and ARHB.
The findings establish a basis for further research into the antibacterial properties and effectiveness of the biochars. Preliminary studies focused on the ARHB material, which showed the highest adsorption capacity for silver ions.
3.5. Antibacterial Activity of Silver-Loaded Biochar
The ARHB sample, produced by the pyrolysis of rice husks and subsequent chemical activation, exhibited the best structural characteristics and adsorption capacity among the tested biochars. SEM analysis revealed its well-defined, porous structure (Figure 4b1,b2). Figure 11a demonstrates the distribution of silver on the surface of the ARHB sample, with elemental mapping (visible as magenta highlights) indicating a relatively uniform dispersion of silver nanoparticles across the biochar structure. This suggests effective adsorption and integration of silver ions, likely facilitated by the material’s surface functional groups and porosity. Additionally, the EDS spectrum in Figure 11b confirms the presence of silver (Ag) peaks, alongside other elements such as oxygen (O), carbon (C), and trace metals, indicating a complex surface chemistry. The prominent Ag peaks further support the conclusion that silver is effectively adsorbed onto the biochar surface. Consequently, ARHB was selected for antibacterial activity testing.
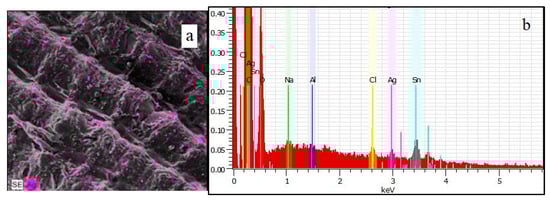
Figure 11.
SEM (a) and-EDX (b) of the ARHB sample after silver adsorption.
Table 7 presents the summarized results of testing the effect of the biochars with silver on E. coli in a suspension with a density of 106 cells mL−1 after different exposure intervals. It can be seen that after 30 and 60 min, there was a decrease in the number of colonies, but in this exposure time interval, a full bactericidal effect was not observed.
Table 7.
Investigation of the action of plant material with Ag+ on E. coli in a suspension with a concentration of 106 cells mL−1.
The summarized results reflecting the effect of the tested plant material with silver on the experimental strains, determined by the suspension method, are presented in Table 8. From the data, it can be seen that the diameters of the inhibitory zones during their application were an average of 13.25 + 1.3 mm, while the control antibiotic showed higher activity with zones 18.80 + 0.4 mm. This is an indicator of medium–high sensitivity in vitro of the studied strains of E. coli to the silver loaded biochar.
Table 8.
In vitro antimicrobial action of plant material with Ag+ on E. coli.
The results show that the rice husk biochar with Ag+ exhibits an inhibitory effect against the tested E. coli strains, although this was not strongly expressed. The differences in the results of the three products with Ag+ and the control antibiotic were significant (p < 0.01). The results are consistent with those of other authors, who have studied the effects of silver-loaded biochar products obtained from various plants and other materials by different methods [52,53,54].
4. Conclusions
This study evaluated the efficiency of biochars derived from plant biomass, specifically rice husks and cotton fabric, for silver ion removal. Among them, activated rice husk biochar (ARHB) exhibited the highest adsorption capacity (23.11 mg/g), attributed to its superior structural properties, including a high specific surface area (844 m2/g) and total pore volume (0.42 cm3/g).
The adsorption mechanism was a multi-step process involving physisorption, chemisorption, cation exchange, and reduction, as also confirmed by thermodynamic and XPS analyses. Physisorption played a dominant role, while metallic silver (Ag0) formation on RHB and ARHB indicated partial chemical transformation during adsorption.
Beyond adsorption, ARHB exhibited significant antibacterial properties, reducing E. coli colonies by 83% within 30 min, demonstrating its potential as a dual-function material for wastewater treatment.
These findings highlight the potential of biochars derived from renewable agricultural waste as sustainable and efficient adsorbents for silver ion removal and recovery, contributing to waste valorization, water purification, and circular economy principles.
Author Contributions
Conceptualization, I.U., P.V., T.P. and D.M.; methodology, I.U., P.V. and T.P.; formal analysis, I.U., D.V., T.P. and I.A.; investigation, I.U., P.V. and T.P.; data curation, I.U., P.V., T.P. and I.A.; writing—original draft preparation, I.U., P.V. and T.P.; writing—review and editing, I.U., P.V. and T.P.; visualization, I.U. and P.V.; project administration, P.V. All authors have read and agreed to the published version of the manuscript.
Funding
This research received no external funding.
Institutional Review Board Statement
Not applicable.
Informed Consent Statement
Not applicable.
Data Availability Statement
Data is contained within the article.
Acknowledgments
Research equipment of the Distributed Research Infrastructure INFRAMAT, part of the Bulgarian National Roadmap for Research Infrastructures, supported by the Bulgarian Ministry of Education and Science, was used in this investigation.
Conflicts of Interest
The authors declare no conflicts of interest.
References
- Tagliaferro, A.; Rosso, C.; Giorcelli, M. (Eds.) Biochar, Emerging Applications; IOP Publishing Ltd.: Bristol, UK, 2020; pp. 2053–2563. ISBN 978-0-7503-2658-2. [Google Scholar]
- Lehmann, J.; Joseph, S. (Eds.) Biochar for Environmental Management: Science and Technology; Earthscan: London, UK, 2009. [Google Scholar]
- International Biochar Initiative (IBI). Available online: https://biochar-international.org (accessed on 10 May 2024).
- Uzunov, I.; Uzunova, S.; Angelova, D.; Gigova, A. Effects of the pyrolysis process on the oil sorption capacity of rice husk. J. Anal. Appl. Pyrol. 2012, 98, 166–176. [Google Scholar] [CrossRef]
- Phounglamcheik, A. Bio-Coal for the Sustainable Industry a Scientific Approach to Optimizing Production, Storage, and Usage. Doctoral Thesis, Luleå University of Technology, Luleå, Sweden, 2021. [Google Scholar]
- Nanda, S.; Dalai, A.K.; Berruti, F.; Kozinski, J.A. Biochar as an Exceptional Bioresource for Energy, Agronomy, Carbon Sequestration, Activated Carbon and Specialty Materials. Waste Biomass Valorization 2016, 7, 201–235. [Google Scholar] [CrossRef]
- Wang, J.; Wang, S. Preparation, modification and environmental application of biochar: A review. J. Clean. Prod. 2019, 227, 1002–1022. [Google Scholar] [CrossRef]
- Khorram, M.; Zhang, G.; Fatemi, A.; Kiefer, R.; Mahmood, A.; Jafarnia, S.; Zakaria, M.; Li, G. Effect of walnut shell biochars on soil quality, crop yields, and weed dynamics in a 4-year field experiment. Environ. Sci. Pollut. Res. 2020, 27, 18510–18520. [Google Scholar] [CrossRef] [PubMed]
- Rajput, V.D.; Minkina, T.; Ahmed, B.; Singh, V.K.; Mandzhieva, S.; Sushkova, S.; Bauer, T.; Verma, K.K.; Shan, S.; van Hullebusch, E.D.; et al. Nano-biochar: A novel solution for sustainable agriculture and environmental remediation. Environ. Res. 2022, 210, 112891. [Google Scholar] [CrossRef]
- Rehman, H.; Razzaq, R. Benefits of Biochar on the Agriculture and Environment—A Review. J. Environ. Anal. Chem. 2017, 4, 1000207. [Google Scholar] [CrossRef]
- Alfattani, R.; Shah, M.A.; Siddiqui, M.I.H.; Ali, M.A.; Alnaser, I.A. Bio-Char Characterization Produced fromWalnut Shell Biomass through Slow Pyrolysis: Sustainable for Soil Amendment and an Alternate Bio-Fuel. Energies 2022, 15, 1. [Google Scholar] [CrossRef]
- Sheng, Y.; Zhu, L. Biochar alters microbial community and carbon sequestration potential across different soil pH. Sci. Total Environ. 2018, 622–623, 1391–1399. [Google Scholar] [CrossRef]
- Hao, Y.-X.; Qian, M.; Xu, J.-J.; Bi, H.; Huang, F.-Q. Porous Cotton-derived Carbon: Synthesis, Microstructure and Supercapacitive Performance. J. Inorg. Mater. 2018, 33, 93–99. [Google Scholar] [CrossRef]
- Rios, C.d.M.S.; Simone, V.; Simonin, L.; Martinet, S.; Dupont, C. Biochars from various biomass types as precursors for hard carbon anodes in sodium-ion batteries. Biomass Bioenergy 2018, 117, 32–37. [Google Scholar] [CrossRef]
- Andrade, T.; Vakros, J.; Mantzavinos, D.; Lianos, P. Biochar obtained by carbonization of spent coffee grounds and its application in the construction of an energy storage device. Chem. Eng. J. Adv. 2020, 4, 4100061. [Google Scholar] [CrossRef]
- Simone, V.; Boulineau, A.; de Geyer, A.; Rouchon, D.; Simonin, L.; Martinet, S. Hard carbon derived from cellulose as anode for sodium ion batteries: Dependence of electrochemical properties on structure. J. Energy Chem. 2016, 25, 761–768. [Google Scholar] [CrossRef]
- Islam, M.A.; Parvin, M.I.; Dada, T.K.; Kumar, R.; Antunes, E. Silver adsorption on biochar produced from spent coffee grounds: Validation by kinetic and isothermal modelling. Biomass Convers. Biorefinery 2024, 14, 28007–28021. [Google Scholar] [CrossRef]
- Pallewatta, S.; Samarasekara, S.; Rajapaksha, A.; Vithanage, M. Oil spill remediation by biochar derived from bio-energy industries with a pilot-scale approach during the X-Press Pearl maritime disaster. Mar. Pollut. Bull. 2023, 189, 114813. [Google Scholar] [CrossRef] [PubMed]
- Li, R.; Wu, Y.; Lou, X.; Li, H.; Cheng, J.; Shen, B.; Qin, L. Porous Biochar Materials for Sustainable Water Treatment: Synthesis, Modification, and Application. Water 2023, 15, 395. [Google Scholar] [CrossRef]
- Duwiejuah, A.; Cobbina, S.; Bakobie, N. Review of Eco-Friendly Biochar Used in the Removal of Trace Metals on Aqueous Phases. Int. J Environ. Bioremediation Biodegrad. 2017, 5, 27–40. [Google Scholar] [CrossRef]
- Daniel, C.W.; Sun, T. (Eds.) Biochar Applications for Wastewater Treatment, 1st ed.; John Wiley & Sons, Inc.: Hoboken, NJ, USA, 2023; pp. 81–110. ISBN 9781119764373. [Google Scholar]
- Fang, Z.; Gao, Y.; Bolan, N.; Shaheen, S.M.; Xu, S.; Wu, X.; Xu, X.; Hu, H.; Lin, J.; Zhang, F.; et al. Conversion of biological solid waste to graphene-containing biochar for water remediation: A critical review. Chem. Eng. J. 2020, 390, 124611. [Google Scholar] [CrossRef]
- Lian, W.; Yang, L.; Joseph, S.; Shi, W.; Bian, R.; Zheng, J.; Li, L.; Shan, S.; Pan, G. Utilization of biochar produced from invasive plant species to efficiently adsorb Cd (II) and Pb (II). Bioresour. Technol. 2020, 317, 124011. [Google Scholar] [CrossRef]
- Ogidi, C.; Emmanuel, O.; Daramola, O.; Bamigboye, M.; Malomo, O. Synthesis of Silver Nanoparticles using Cellulose and Starch Extracted from Brewer Spent Grain: Assessment of their Antimicrobial and Preservatives Activities. Turk. J. Agric. Food Sci. Technol. 2023, 11, 227–238. [Google Scholar] [CrossRef]
- Cesca, K.; Netto, M.S.; Ely, V.L.; Dotto, G.L.; Foletto, E.L.; Hotza, D. Synthesis of spherical bacterial nanocellulose as a potential silver adsorption agent for antimicrobial purposes. Cellul. Chem. Technol. 2020, 54, 285–290. [Google Scholar] [CrossRef]
- Rochlani, K.; Vadakkekara, R.; Chakraborty, M.; Dasgupta, S. Antibacterial activity of biostabilized silver nanoparticles. Indian J. Chem. Technol. 2016, 23, 520–526. [Google Scholar]
- Zafar, S.; Khalid, N.; Mirza, M. Potential of Rice Husk for the Decontamination of Silver Ions from Aqueous Media. Separ. Sci. Technol. 2012, 47, 1793–1801. [Google Scholar] [CrossRef]
- Asemave, K.; Thaddeus, L.; Tarhemba, P. Lignocellulosic-Based Sorbents: A Review. Sustain. Chem. 2021, 2, 271–285. [Google Scholar] [CrossRef]
- Soltani, N.; Bahrami, A.; Pech-Canul, M.; González, L. Review on the physicochemical treatments of rice husk for production of advanced materials. Chem. Eng. J. 2015, 264, 899–935. [Google Scholar] [CrossRef]
- Omri, A.; Benzina, M. Adsorption characteristics of silver ions onto activated carbon prepared from almond shell. Desalin. Water Treat. 2012, 51, 2317–2326. [Google Scholar] [CrossRef]
- Thach, N.K.; Krechetov, I.S.; Berestov, V.V.; Kan, O.; Maslochenko, I.A.; Lepkova, T.L.; Stakhanova, S.V. The role and effect of CO2 flow rate on the structure formation of ultrahigh porous activated carbon from H3PO4-impregnated waste cotton used as supercapacitor electrode material. Nanosyst. Phys. Chem. Math. 2023, 14, 489–497. [Google Scholar] [CrossRef]
- Li, Z.Z.; Yu, L.J.; Ma, H.D.; Chen, J.L.; Meng, J.G.; Wang, Y.; Liu, Y.; Song, Q.; Dong, Z.; Miao, M.; et al. An efficient interfacial solar evaporator featuring a hierarchical porous structure entirely derived from waste cotton. Sci. Total Environ. 2023, 903, 166212. [Google Scholar] [CrossRef]
- Akintelu, S.; Folorunso, A. Characterization and Antimicrobial Investigation of Synthesized Silver Nanoparticles from Annona muricata Leaf Extracts. J. Nanotechnol. Nanomed. Nanobiotechnol. 2019, 6, 022. [Google Scholar] [CrossRef]
- Toro, R.G.; Adel, A.M.; de Caro, T.; Federici, F.; Cerri, L.; Bolli, E.; Mezzi, A.; Barbalinardo, M.; Gentili, D.; Cavallini, M.; et al. Evaluation of Long–Lasting Antibacterial Properties and Cytotoxic Behavior of Functionalized Silver-Nanocellulose Composite. Materials 2021, 14, 4198. [Google Scholar] [CrossRef]
- Bauer, W.; Kirby, W.; Cherris, J.; Truck, M. Antibiotic susceptibility testing by a standardized single disk method. Am. J. Clin. Pathol. 1966, 45, 493–496. [Google Scholar] [CrossRef]
- NCCLS Document M2–A6; Performance Standards for Antimicrobial Disk Susceptibility Tests. NCCLS: Wayne, PA, USA, 1997; Volume 17, p. 1.
- NCCLS Document M100–S9; Performance Standards for Antimicrobial Susceptibility Testing: Ninths Informational Supplement. NCCLS: Wayne, PA, USA, 1999; Volume 18, p. 1.
- Yoo, S.; Kelley, S.; Tilotta, D.; Park, S. Structural Characterization of Loblolly Pine derived Biochar by X-ray Diffraction and Electron Energy Loss Spectroscopy. ACS Sustain. Chem. Eng. 2018, 6, 2621–2629. [Google Scholar] [CrossRef]
- Ishak, W.; Ahmad, I.; Ramli, S.; Gamma, M. Irradiation-Assisted Synthesis of Cellulose Nanocrystal-Reinforced Gelatin Hydrogels. Nanomaterials 2018, 8, 749. [Google Scholar] [CrossRef] [PubMed]
- Thommes, M.; Kaneko, K.; Neimark, A.; Olivier, J.; Rodriguez-Reinoso, F.; Rouquerol, J.; Sing, K. Physisorption of gases, with special reference to the evaluation of surface area and pore size distribution (IUPAC Technical Report). Pure Appl. Chem. 2015, 87, 1051–1069. [Google Scholar] [CrossRef]
- Antunes, E.; Jacob, M.V.; Brodie, G.; Schneider, P.A. Silver removal from aqueous solution by biochar produced from biosolids via microwave pyrolysis. J. Environ. Manag. 2017, 203, 264–272. [Google Scholar] [CrossRef] [PubMed]
- Tomczyk, A.; Sokołowska, Z.; Boguta, P.; Szewczuk-Karpisz, K. Comparison of monovalent and divalent ions removal from aqueous solutions using agricultural waste biochars prepared at different temperatures—Experimental and model study. Int. J. Mol. Sci. 2020, 21, 5851. [Google Scholar] [CrossRef]
- Liang, X.; Luo, X.; Lin, X.; Mei, Q. The Behaviors of Removing Silver Ions by Low-Cost Expanded Rice Husk, Nature Diatomiteand Nature Bentonite as Sorbents. Mater. Sci. Forum 2012, 724, 472–475. [Google Scholar] [CrossRef]
- Zafar, S.; Khan, M.I.; Shanableh, A.; Ahmad, S.; Manzoor, S.; Shahida, S.; Rehman, A. Adsorption of silver, thorium and nickel ions from aqueous solution onto rice husk. Desalin. Water Treat. 2021, 236, 108–122. [Google Scholar] [CrossRef]
- Vassileva, P.; Detcheva, A.; Radoykova, T.; Avramova, I.; Aleksieva, K.; Nenkova, S.; Valchev, I.; Mehandjiev, D. Studies on Ag adsorption using two new lignocellulosic materials based on Populus alba L. and Robinia pseudoacacia L. Cell. Chem. Technol. 2018, 52, 633–643. [Google Scholar]
- Kołodyńska, D.; Wnętrzak, R.; Leahy, J.; Hayes, M.; Kwapiński, W.; Hubicki, Z. Kinetic and adsorptive characterization of biochar in metal ions removal. Chem. Eng. J. 2012, 197, 295–305. [Google Scholar] [CrossRef]
- Barka, N.; Abdennouri, M.; El Makhfouk, M. Removal of methylene blue and eriochrome black T from aqueous solutions by biosorption on Scolymus hispanicus L: Kinetics, equilibriumand thermodynamics. J. Taiwan Inst. Chem. Eng. 2011, 42, 320–326. [Google Scholar] [CrossRef]
- Chook, S.W.; Chia, C.H.; Zakaria, S.; Ayob, M.K.; Chee, K.L.; Huang, N.M.; Neoh, H.M.; Lim, H.N.; Jamal, R.; Rahman, R. Antibacterial performance of Ag nanoparticles and AgGO nanocomposites prepared via rapid microwave-assisted synthesis method. Nanoscale Res. Lett. 2012, 7, 541. [Google Scholar] [CrossRef] [PubMed]
- Hsu, K.-C.; Chen, D.-H. Microwave-assisted green synthesis of Ag/reduced graphene oxide nanocomposite as a surface-enhanced Raman scattering substrate with high uniformity. Nanoscale Res. Lett. 2014, 9, 193. [Google Scholar] [CrossRef] [PubMed]
- Yang, X.; Tang, H.; Xu, J.; Antonietti, M.; Shalom, M. Silver phosphate/graphitic carbon nitride as an efficient photocatalytic tandem system for oxygen evolution. ChemSusChem 2015, 8, 1350–1358. [Google Scholar] [CrossRef] [PubMed]
- Tang, H.; Chang, S.; Tang, G.; Liang, W. AgBr and g-C3N4 co-modified Ag2CO3 photocatalyst: A novel multi-heterostructured photocatalyst with enhanced photocatalytic activity. Appl. Surf. Sci. 2017, 391, 440–448. [Google Scholar] [CrossRef]
- Gonçalves, C.; Strauss, M.; Martinez, D. The Positive Fate of Biochar Addition to Soil in the Degradation of PHBV-Silver Nanoparticle Composites. Environ. Sci. Technol. 2018, 52, 51–58. [Google Scholar] [CrossRef]
- Zhang, L.; Zheng, S.; Hu, Z.; Zhong, L.; Wang, Y.; Zhang, X.; Xue, J. Preparation of Polyvinyl Alcohol/Bacterial-Cellulose-Coated Biochar–Nanosilver Antibacterial Composite Membranes. Appl. Sci. 2020, 10, 752. [Google Scholar] [CrossRef]
- Feng, Q.; Fan, B.; He, Y.-C.; Ma, C. Antibacterial, antioxidant and fruit packaging ability of biochar-based silver nanoparticles-polyvinyl alcohol-chitosan composite film. Int. J. Biol. Macromol. 2024, 256, 128297. [Google Scholar] [CrossRef]
Disclaimer/Publisher’s Note: The statements, opinions and data contained in all publications are solely those of the individual author(s) and contributor(s) and not of MDPI and/or the editor(s). MDPI and/or the editor(s) disclaim responsibility for any injury to people or property resulting from any ideas, methods, instructions or products referred to in the content. |
© 2025 by the authors. Licensee MDPI, Basel, Switzerland. This article is an open access article distributed under the terms and conditions of the Creative Commons Attribution (CC BY) license (https://creativecommons.org/licenses/by/4.0/).