Article

Effect of Fissure Penetration Degrees on Spalling Process and Feature of Surrounding Rock in Rectangular Tunnel Under True Triaxial Loading

School of Resources and Safety Engineering, Central South University, Changsha 410083, China
*
Author to whom correspondence should be addressed.
Appl. Sci. 2025, 15(5), 2780; https://doi.org/10.3390/app15052780
Submission received: 10 January 2025 / Revised: 20 February 2025 / Accepted: 3 March 2025 / Published: 5 March 2025

Abstract

:
To investigate the effect of fissure penetration on the spalling process and features of rectangular tunnel sidewalls, true triaxial compression tests were conducted on cubic sandstone specimens with varying fissure penetration degrees. Acoustic emission monitoring and video equipment were used to record the failure process of the surrounding rock in real time. The experimental results show that the presence of fissures weakened the strength of the surrounding rock, and as fissure penetration increased, the initial failure stress first increased and then decreased, while the peak failure stress decreased with increasing penetration. This study demonstrates that increasing fissure penetration levels significantly escalate the extent and intensity of surrounding rock failure. At higher penetration levels, additional support and optimized excavation boundaries are recommended to reduce stress concentration and ensure tunnel stability.

1. Introduction

Spalling is a static phenomenon observed in deep surrounding rock, characterized by the accumulation and release of strain energy within the rock mass [1,2]. This process typically manifests as laminar or plate-like fractures, without the ejection of rock fragments, which distinguishes spalling failure from conventional rockbursts. As deep mineral extraction progresses, underground mining faces increasingly complex geological conditions, including high in situ stress, elevated geothermal gradients, and high karst water pressure [3,4,5,6,7]. Research has shown that, under certain conditions, spalling failure can escalate into rockburst disasters [8]. These failures adversely affect the support structures of tunnels and mining facilities, leading to significant resource loss and posing serious safety threats to construction personnel. Spalling is closely linked to mining conditions (e.g., engineering structure dimensions [9,10,11,12,13], excavation rates [14,15,16,17]) and environmental factors (e.g., geological structures [18,19,20,21], stress environment [22,23,24,25]). Geological structures and cavern shapes influence the initial stress distribution in surrounding rock, affecting the likelihood of spalling disasters. For example, the “11.28” rockburst (Figure 1) at the Jinping II Hydropower Station revealed a structural plane aligned with the tunnel axis, creating a V-shaped notch where it intersected with the pre-existing tunnel [26]. Thus, research on the “impact of structural planes on spalling failure or rockburst disasters in deep hard rock tunnels” is crucial. Based on their mechanisms [1,27], rockbursts are typically categorized into three types: strain-induced, fracture-related, and structural plane-associated rockbursts. Structural plane rockbursts can be further categorized into three types based on the action mechanisms of structural planes [28]: fault-slip bursts, shear rupture bursts, and tensile buckling bursts.
In fact, numerous scholars have investigated the mechanisms and characteristics of spalling in deep mine tunnels using in situ tests [28,29], laboratory experiments, and computational simulations. In terms of laboratory experiments, Li et al. [30] conducted uniaxial compression tests on rectangular prismatic granite specimens to explore how height-to-width ratios influence slab cracking. They found that in shorter specimens, cracks propagated parallel to the loading direction, forming slab cracks, whereas in longer specimens, failure occurred as shear cracks. Similarly, Zhu et al. [31] conducted biaxial compression tests on horseshoe-shaped tunnel models, proposed formulas for predicting cracking stress and critical strain and identified two main stages of spalling: instantaneous cracking and layer-by-layer spalling. In another set of experiments, Gong et al. [32,33,34] used a true triaxial test system on cubic red sandstone and granite specimens with prefabricated round holes to categorize the rockburst process in tunnel sidewalls. They identified four stages: the calm period, pellet ejection, rock fragment exfoliation, and rockburst. These findings, including the formation of a symmetrical V-shaped failure zone, were consistent with those of Si et al. [35,36,37,38], who observed similar rockburst patterns in cubic sandstone and granite samples. Further, Su et al. [16] used a unilateral void–true triaxial environment and studied how different loading rates affected slab failure in rectangular prismatic granite specimens. They found that as loading rates increased, failure shifted from static to dynamic, accompanied by an increase in the kinetic energy of ejected fragments. Si et al. [36] also examined the effect of loading rates on spalling in cubic red sandstone, concluding that lower rates increased failure likelihood, while higher rates intensified rockburst severity. Peng et al. [12,13] used true triaxial compression tests to explore the failure mechanisms of hard rock tunnel slabs with varying arch structures. They found that higher vertical stress occurred when the arch height/roadway width ratio was 1/3. As axial stress increased, the surrounding rock showed greater failure strength and more violent fragment ejection. Finally, Bai et al. [39] applied numerical simulations used numerical simulation software at the Mine-by Tunnel in Manitoba, Canada, compared acoustic emission events with on-site microseismic signals, and studied the role of the intermediate principal stress in rock damage development.
The previous analysis highlights that, while significant research has been conducted on deep, hard-rock rockbursts, several issues remain unaddressed:
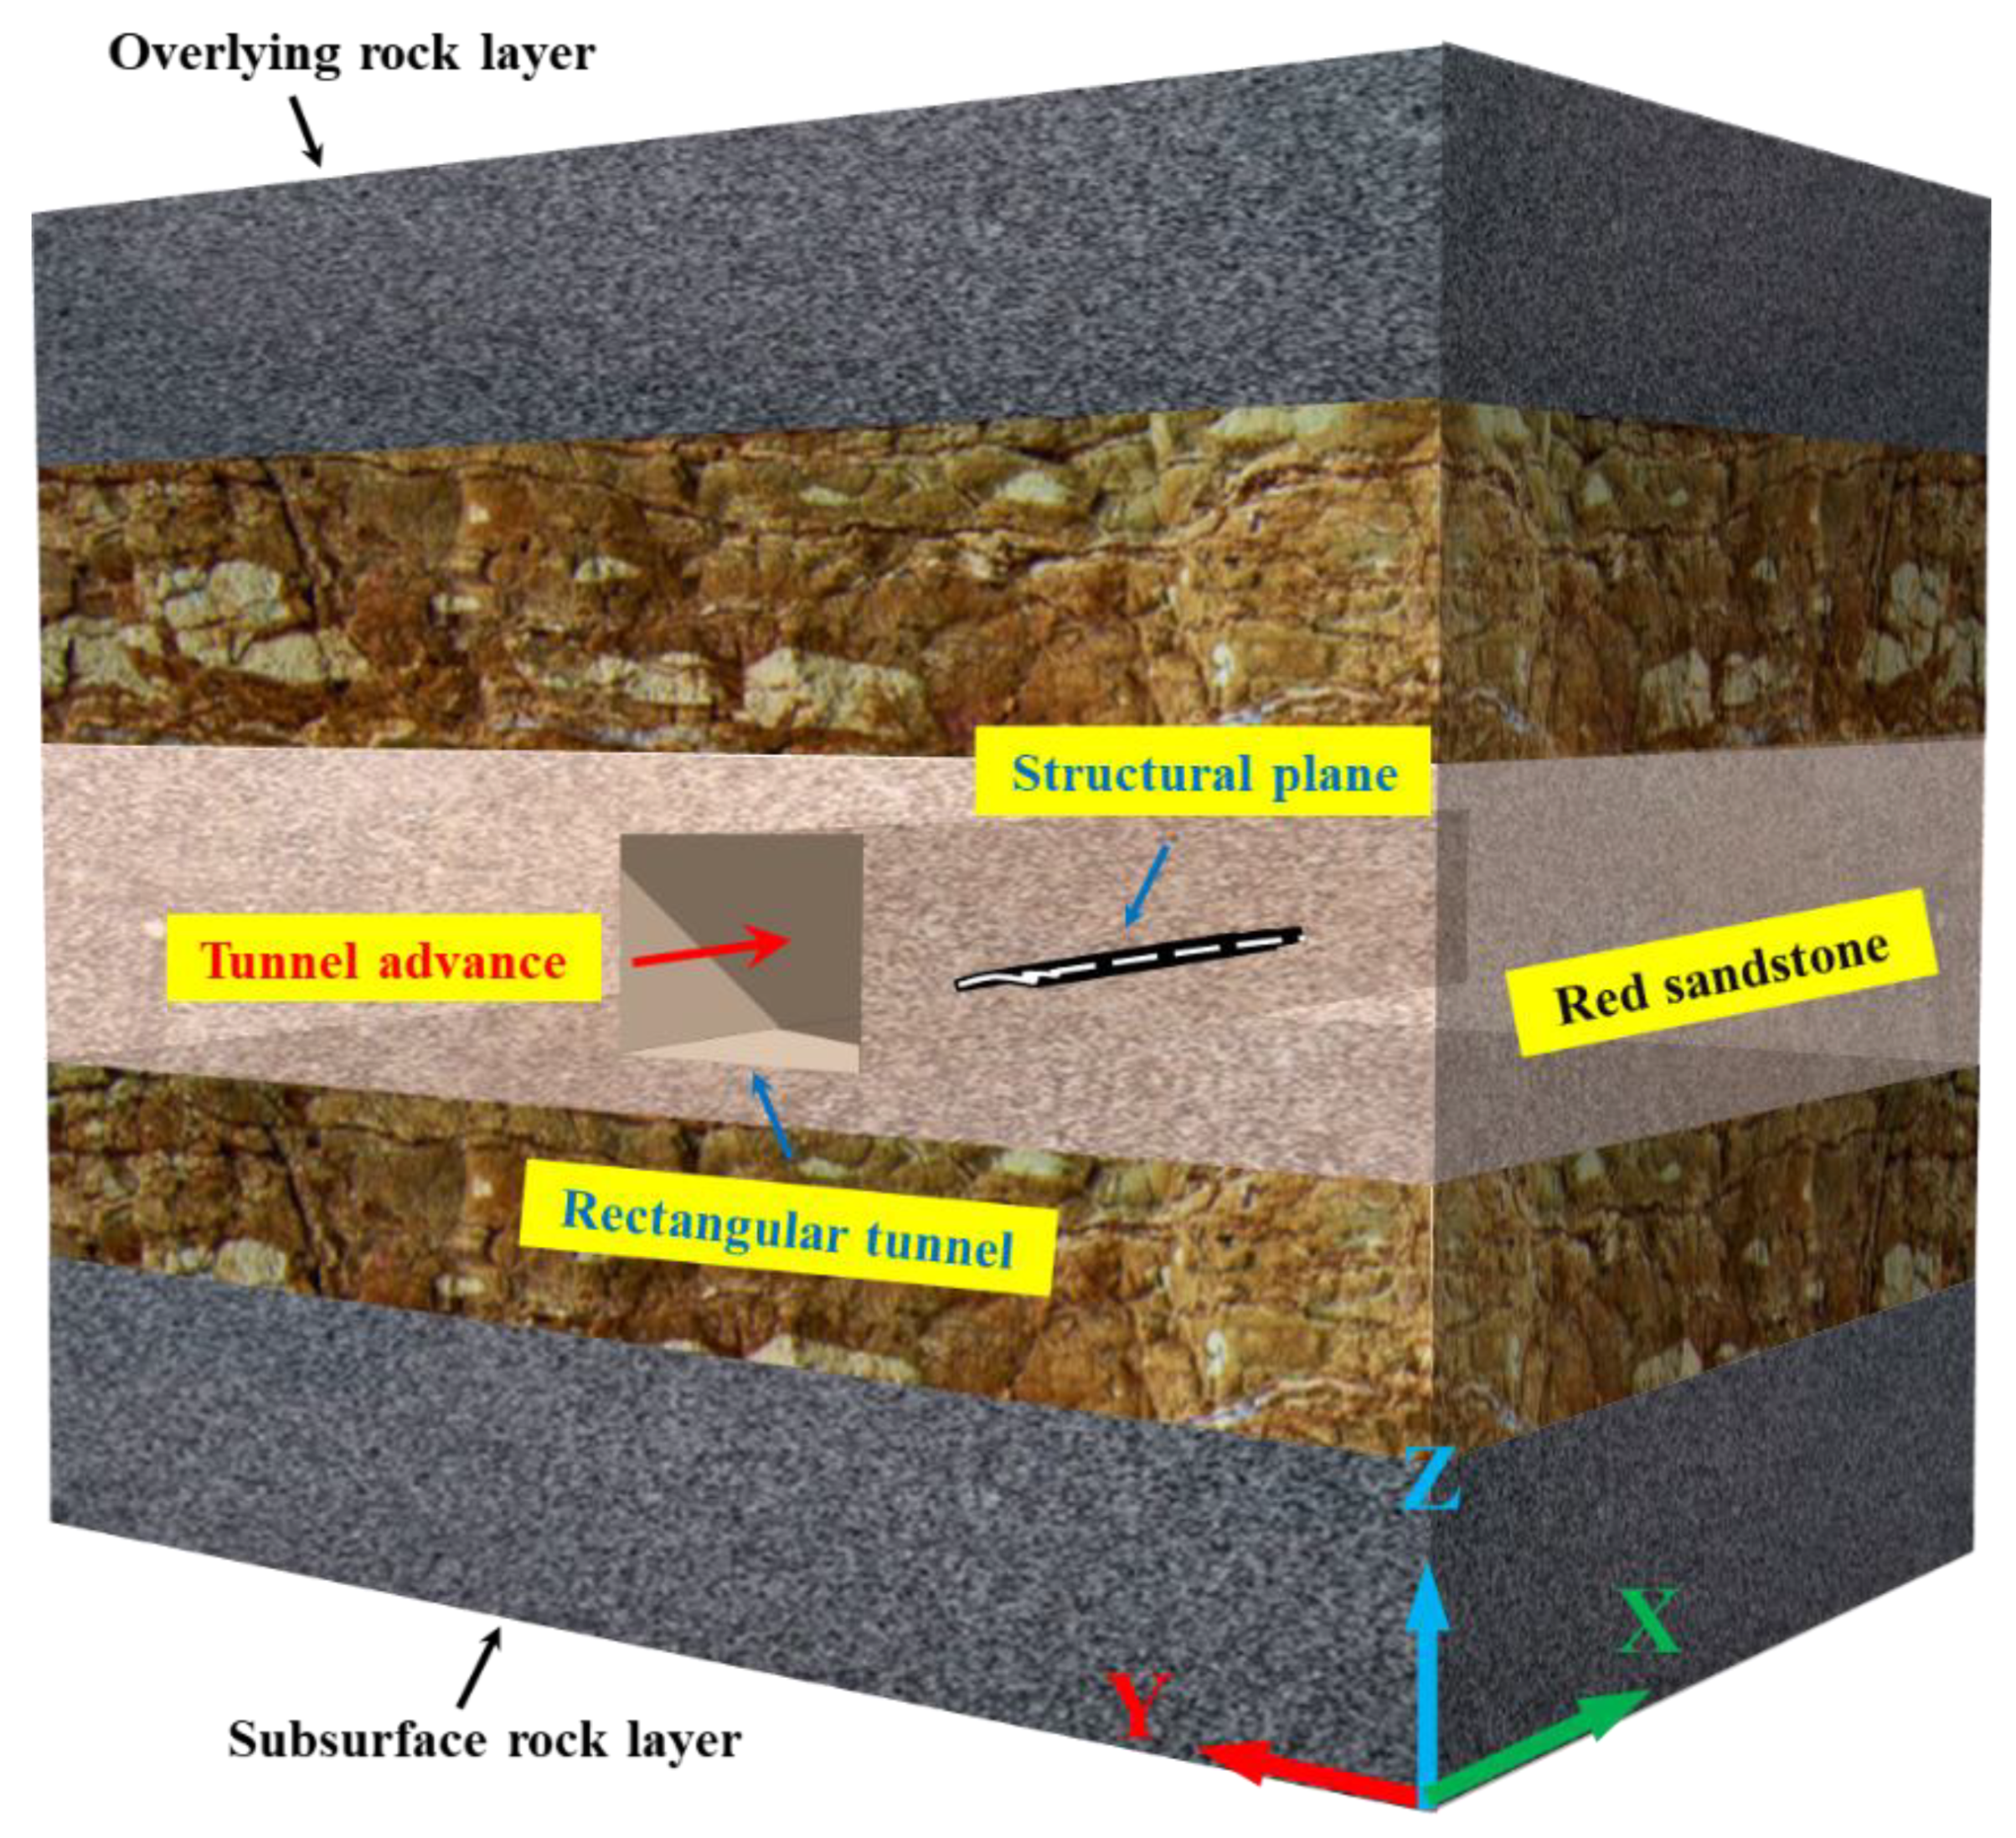
  • Based on previous studies, most research has used circular holes and cubic specimens to simulate the failure of circular tunnels, but there is limited research on rectangular tunnels. As the use of rectangular tunnels and shafts increases in mining and deep engineering projects, it is essential to investigate spalling in the surrounding rock of rectangular tunnels.
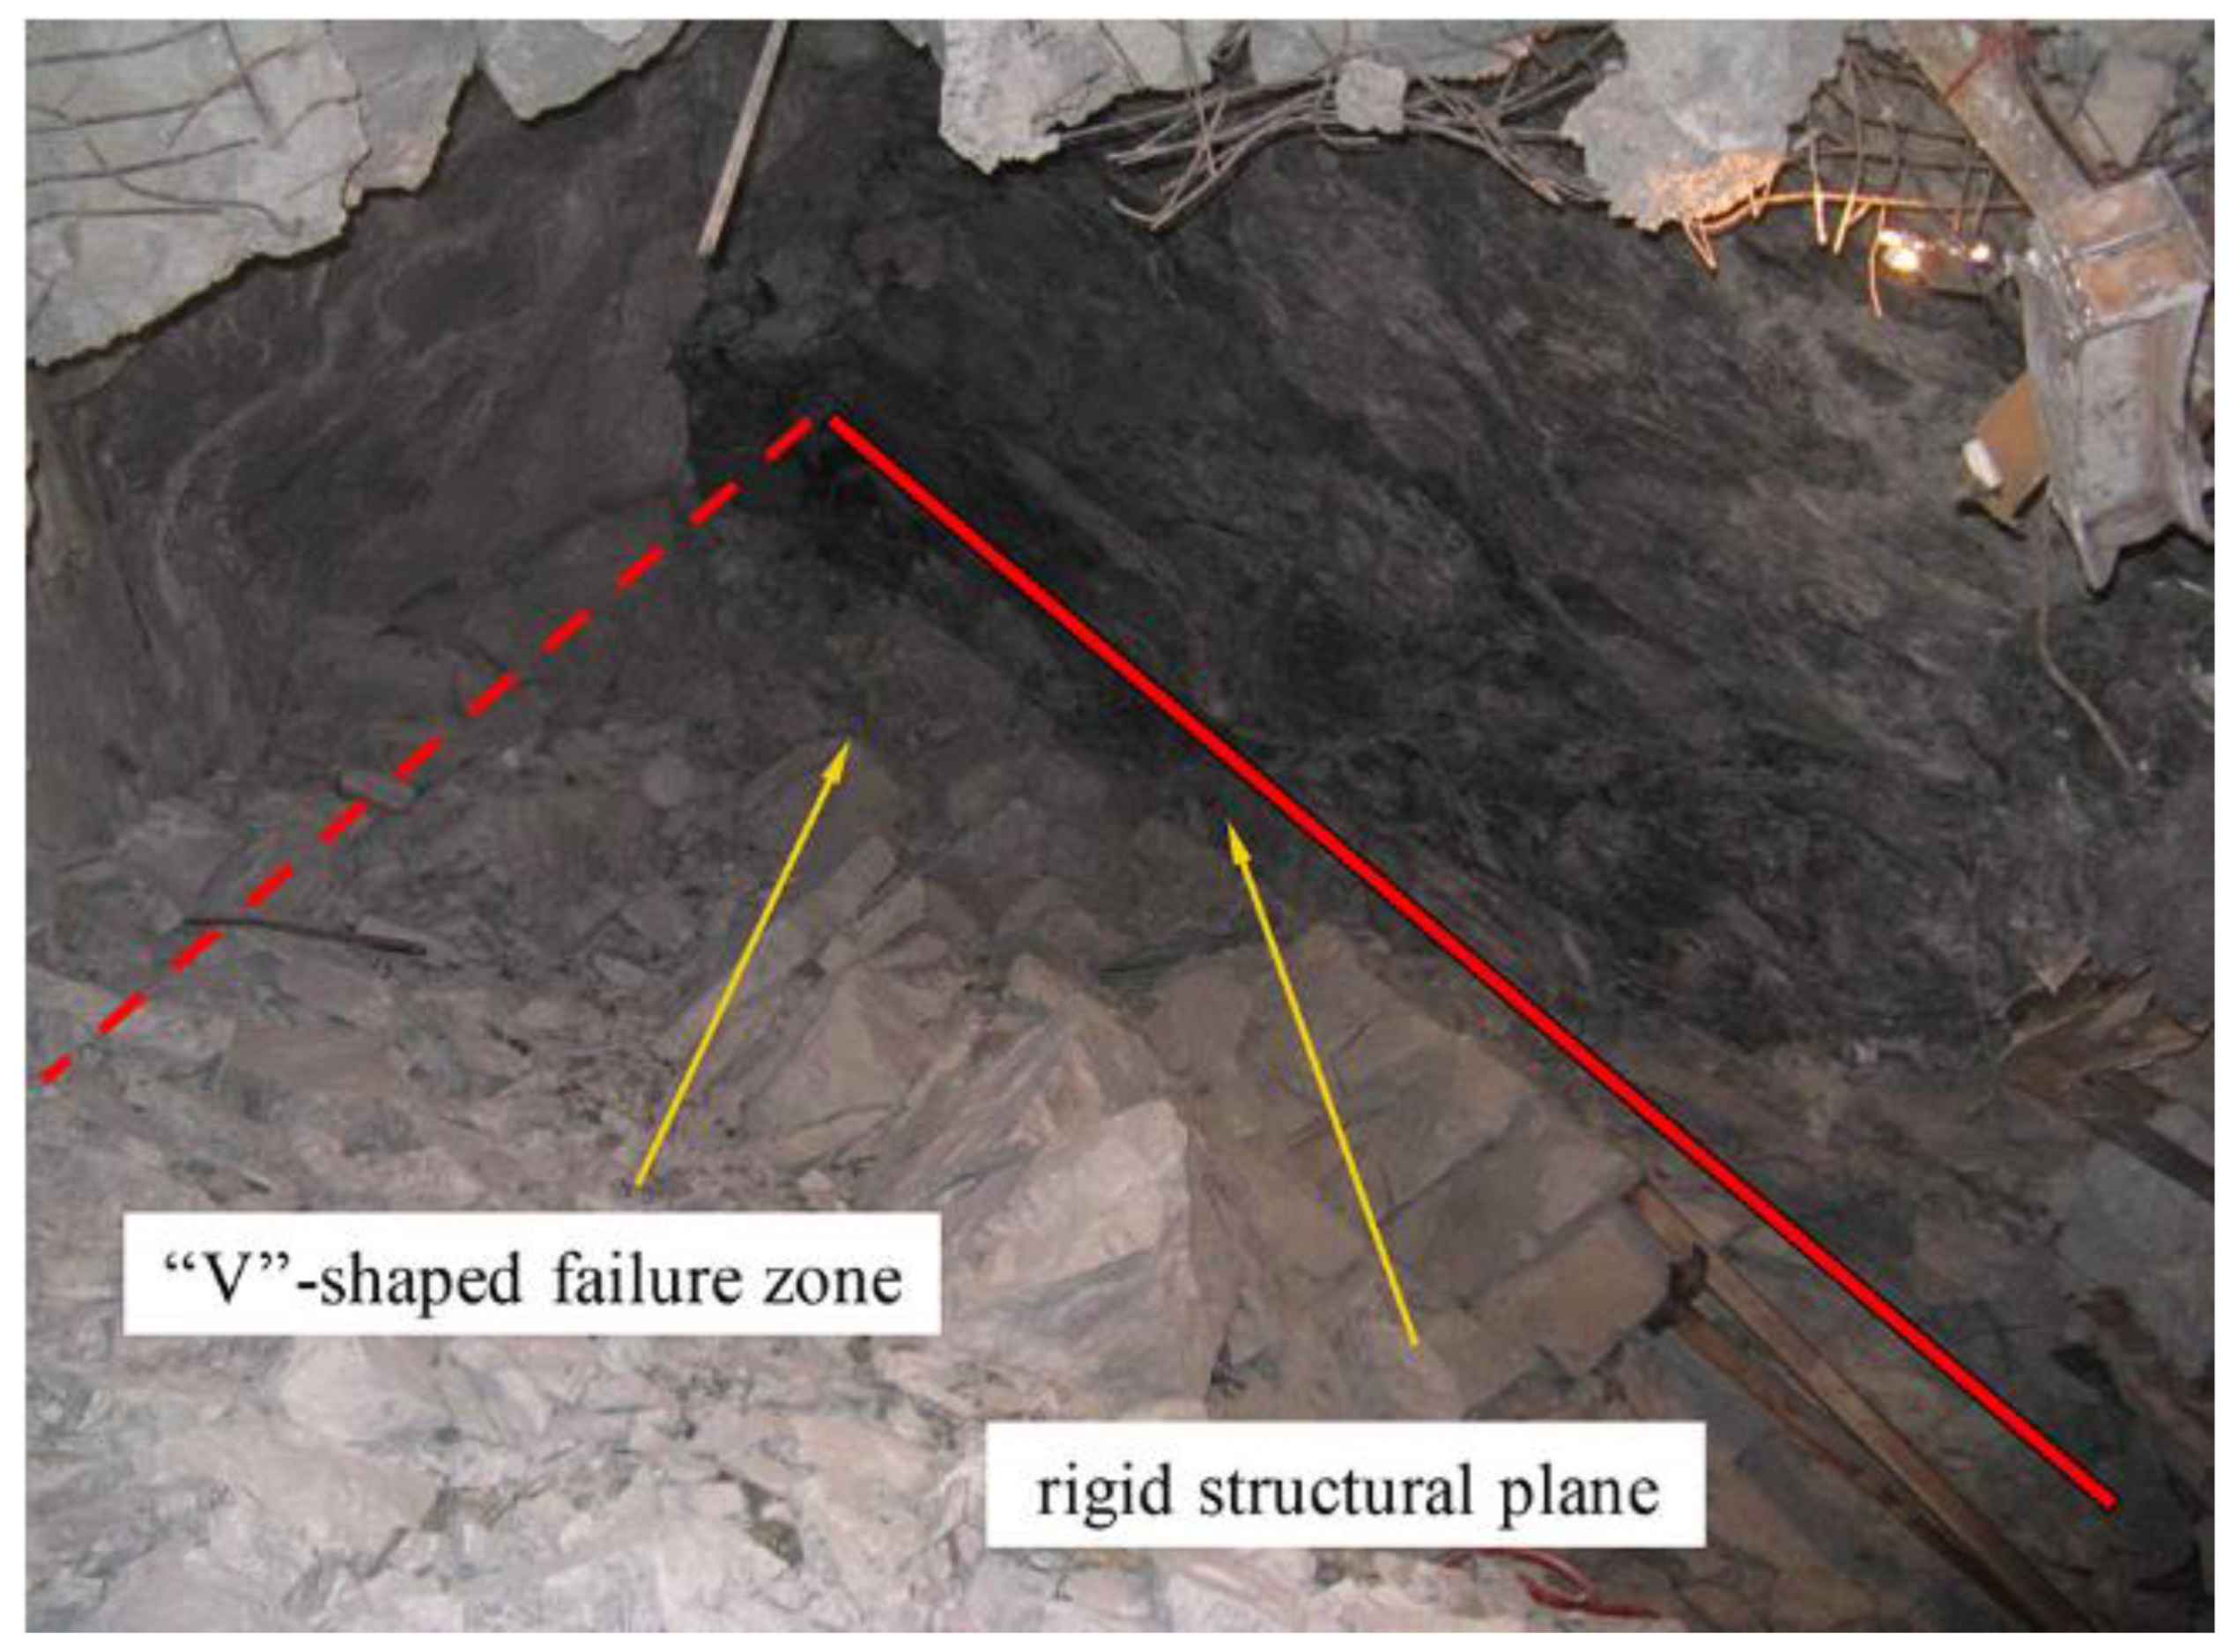
  • The spalling failure process in deep mine tunnels is inevitably influenced by complex geological conditions, including bedding, discontinuous joints, and faults. Many rock mass engineering disasters result from the expansion and interconnection of fractures in the rock mass [40,41,42,43]. While much research has focused on mining-related factors such as the stress state, stress path, and loading rate, and their influence on spalling failure and surrounding rock characteristics, the geological environment of deep tunnels has received less attention.
During deep mine tunnel excavation, encountering fault zones makes it difficult to detect their width and depth because of complex geological conditions. To minimize resource loss, engineers often adjust the tunnel’s excavation direction or fill the fault zone to maximize recovery. The fault zone is located along one side of the tunnel, with its length along the tunnel unknown (Figure 2). Ensuring the safety and stability of underground engineering necessitates a thorough study of how fissures at different depths impact the stability of rectangular tunnels.
In response to this, this study was conducted to examine the effects of radial fissures with 0%, 25%, 50%, and 100% penetration on the failure process and features of a rectangular tunnel. The experiments used a true triaxial servo testing system, simulating a stress state corresponding to a depth of 500 m. A micro-camera and acoustic emission monitoring equipment recorded the entire test in real time, capturing the failure process in the rectangular tunnel and the evolution of surrounding rock cracks due to fissure penetration. The test process and results were analyzed in detail, focusing on how varying fissure penetration levels impacted tunnel failure and stability.

2. Experimental Methods

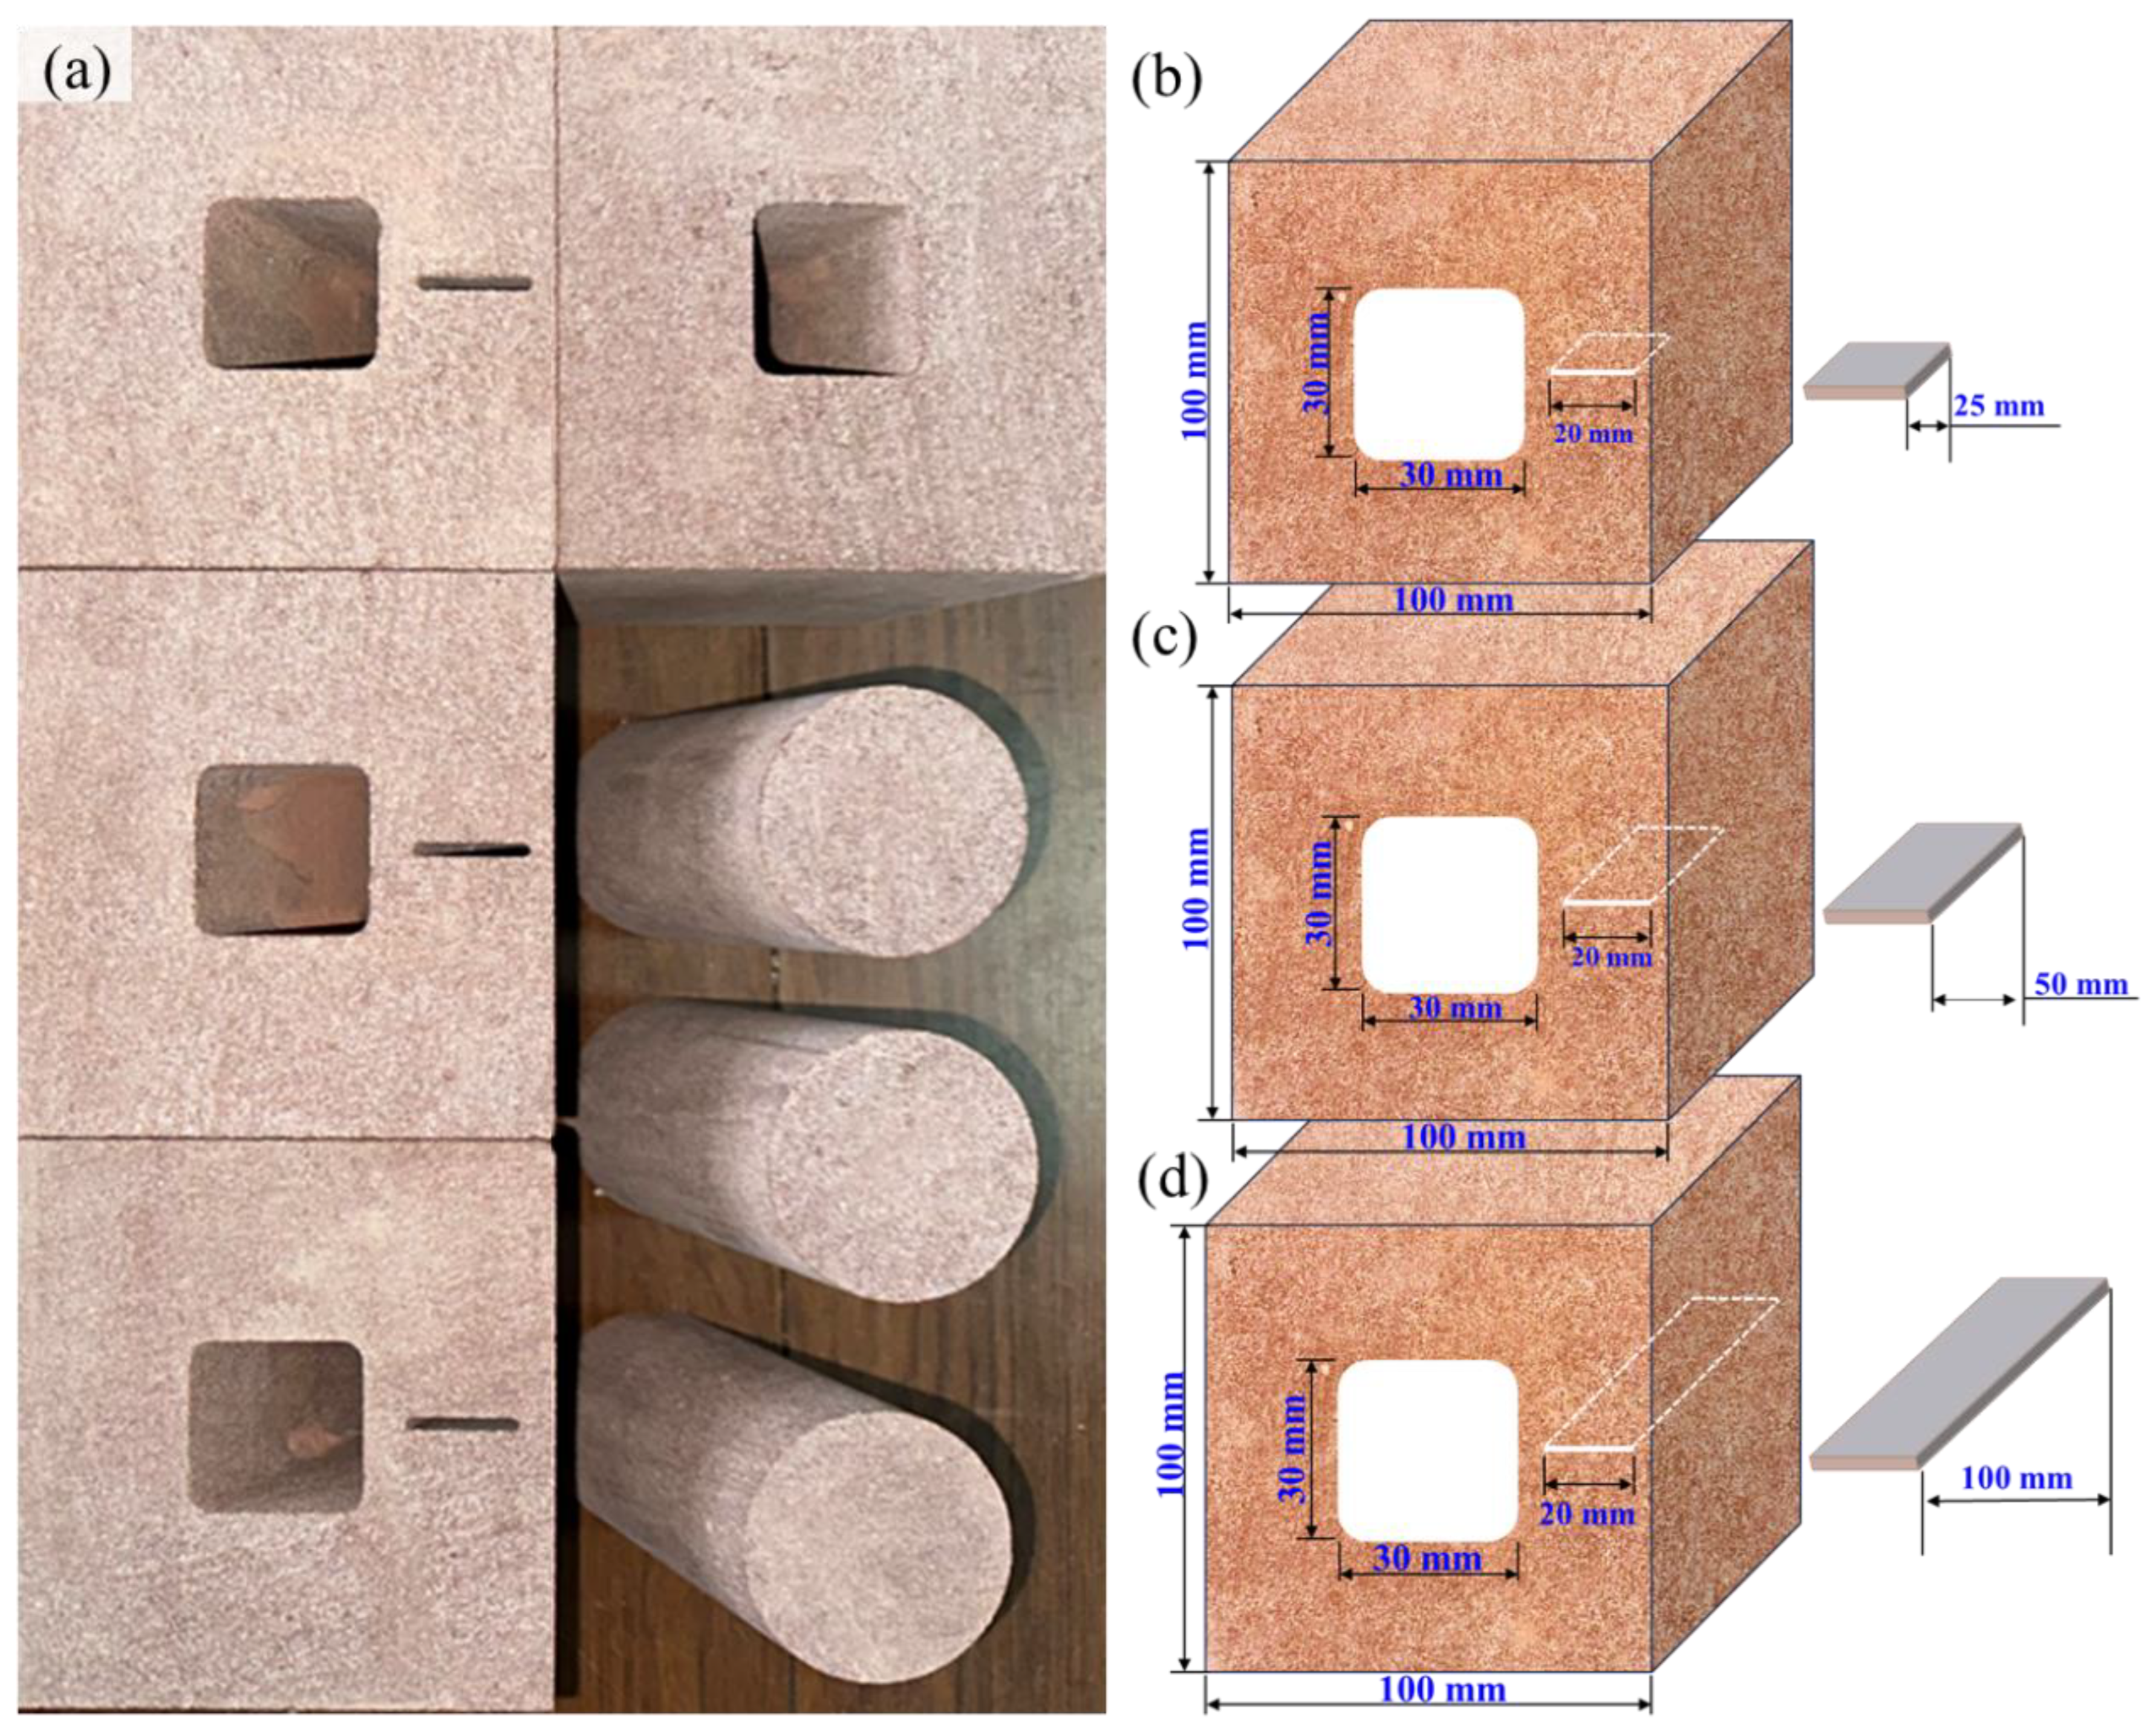
2.1. Specimen Design and Preparation

This investigation utilized sandstone specimens collected from the Mesozoic stratigraphic outcrops in Songjiahuan Tuangou Village, Junan County, Linyi City, Shandong Province, China. A multi-modal analytical approach was employed to characterize textural configurations and constituent mineral proportions, combining digital macrography with quantitative petrography. Detailed petrographic analysis through polarized light microscopy was conducted, with systematic comparison to macroscopic specimen documentation as visually documented in Figure 3a–c. The sandstone exhibited a mineral assemblage comprising 55% feldspar (Fsp), 42% quartz (Qz), 1% sericite, and 2% other minerals, classifying it as siliceous–cemented lithic feldspar sandstone (Figure 3d). To ensure test accuracy and minimize material variability, specimens were systematically obtained from a homogeneous sandstone block, which exhibited no visible cracks and had a uniform texture.
The sandstone specimens used in the simulation experiments were processed into cylindrical standard specimens (φ 50 × 100 mm), cubic (100 mm-edge) specimens with rectangular perforation and fissure, and cubic specimens with only rectangular perforation (Figure 4a). The rectangular perforations (30 mm edge dimension) were centrally located in the specimens. The pre-fabricated fissures were positioned 32.5 mm from the center of the rectangular hole, with angles, lengths, and widths of 0°, 20 mm, and 2 mm, respectively. The fissure penetration levels were 25%, 50%, and 100% (Figure 4b–d). For convenience, the specimens are labeled as “S-0-50”, where “S” represents the specimen, “0” indicates the angle between the fissure and the bottom edge of the rectangular perforation (Y-direction), and “50” represents the fissure penetration level in the Z-direction (i.e., 50% penetration). The specimen machining precision followed ISRM (International Society for Rock Mechanics) standards, [44] maintaining 0.0175 mm general and 0.025 mm perpendicularity tolerances. The physical and mechanical properties of the rock materials were measured during the experiment, as shown in Table 1.

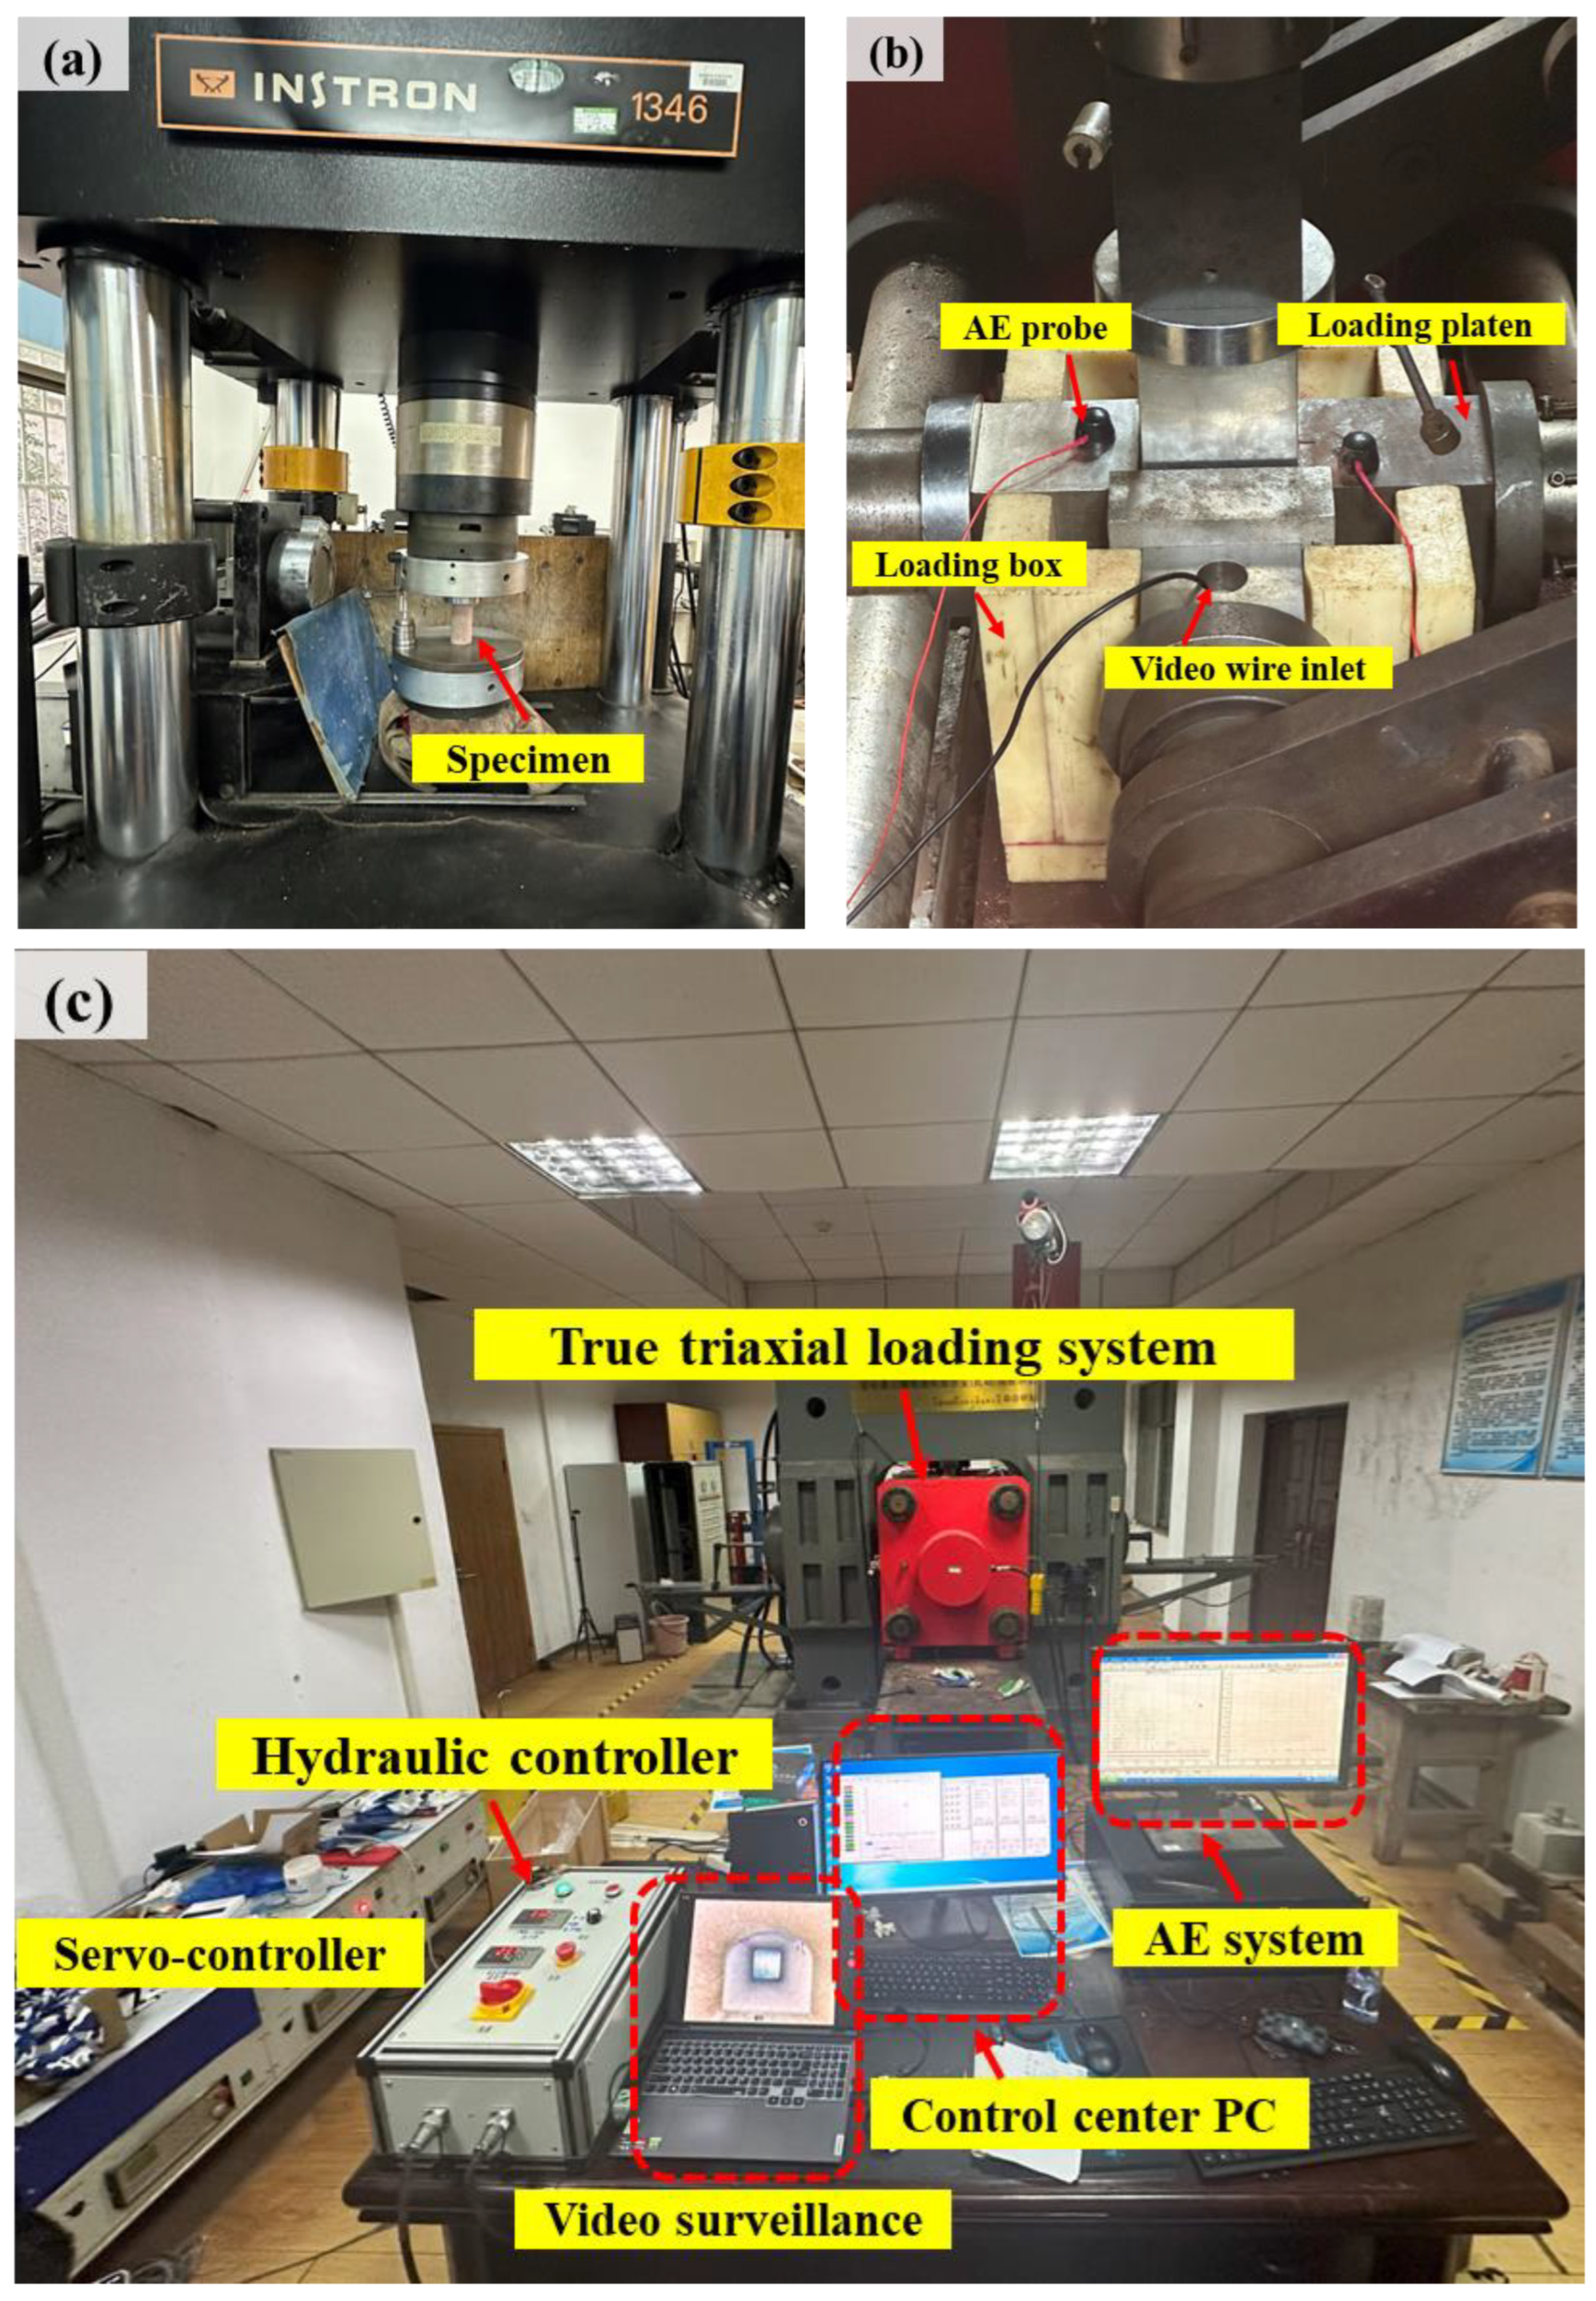
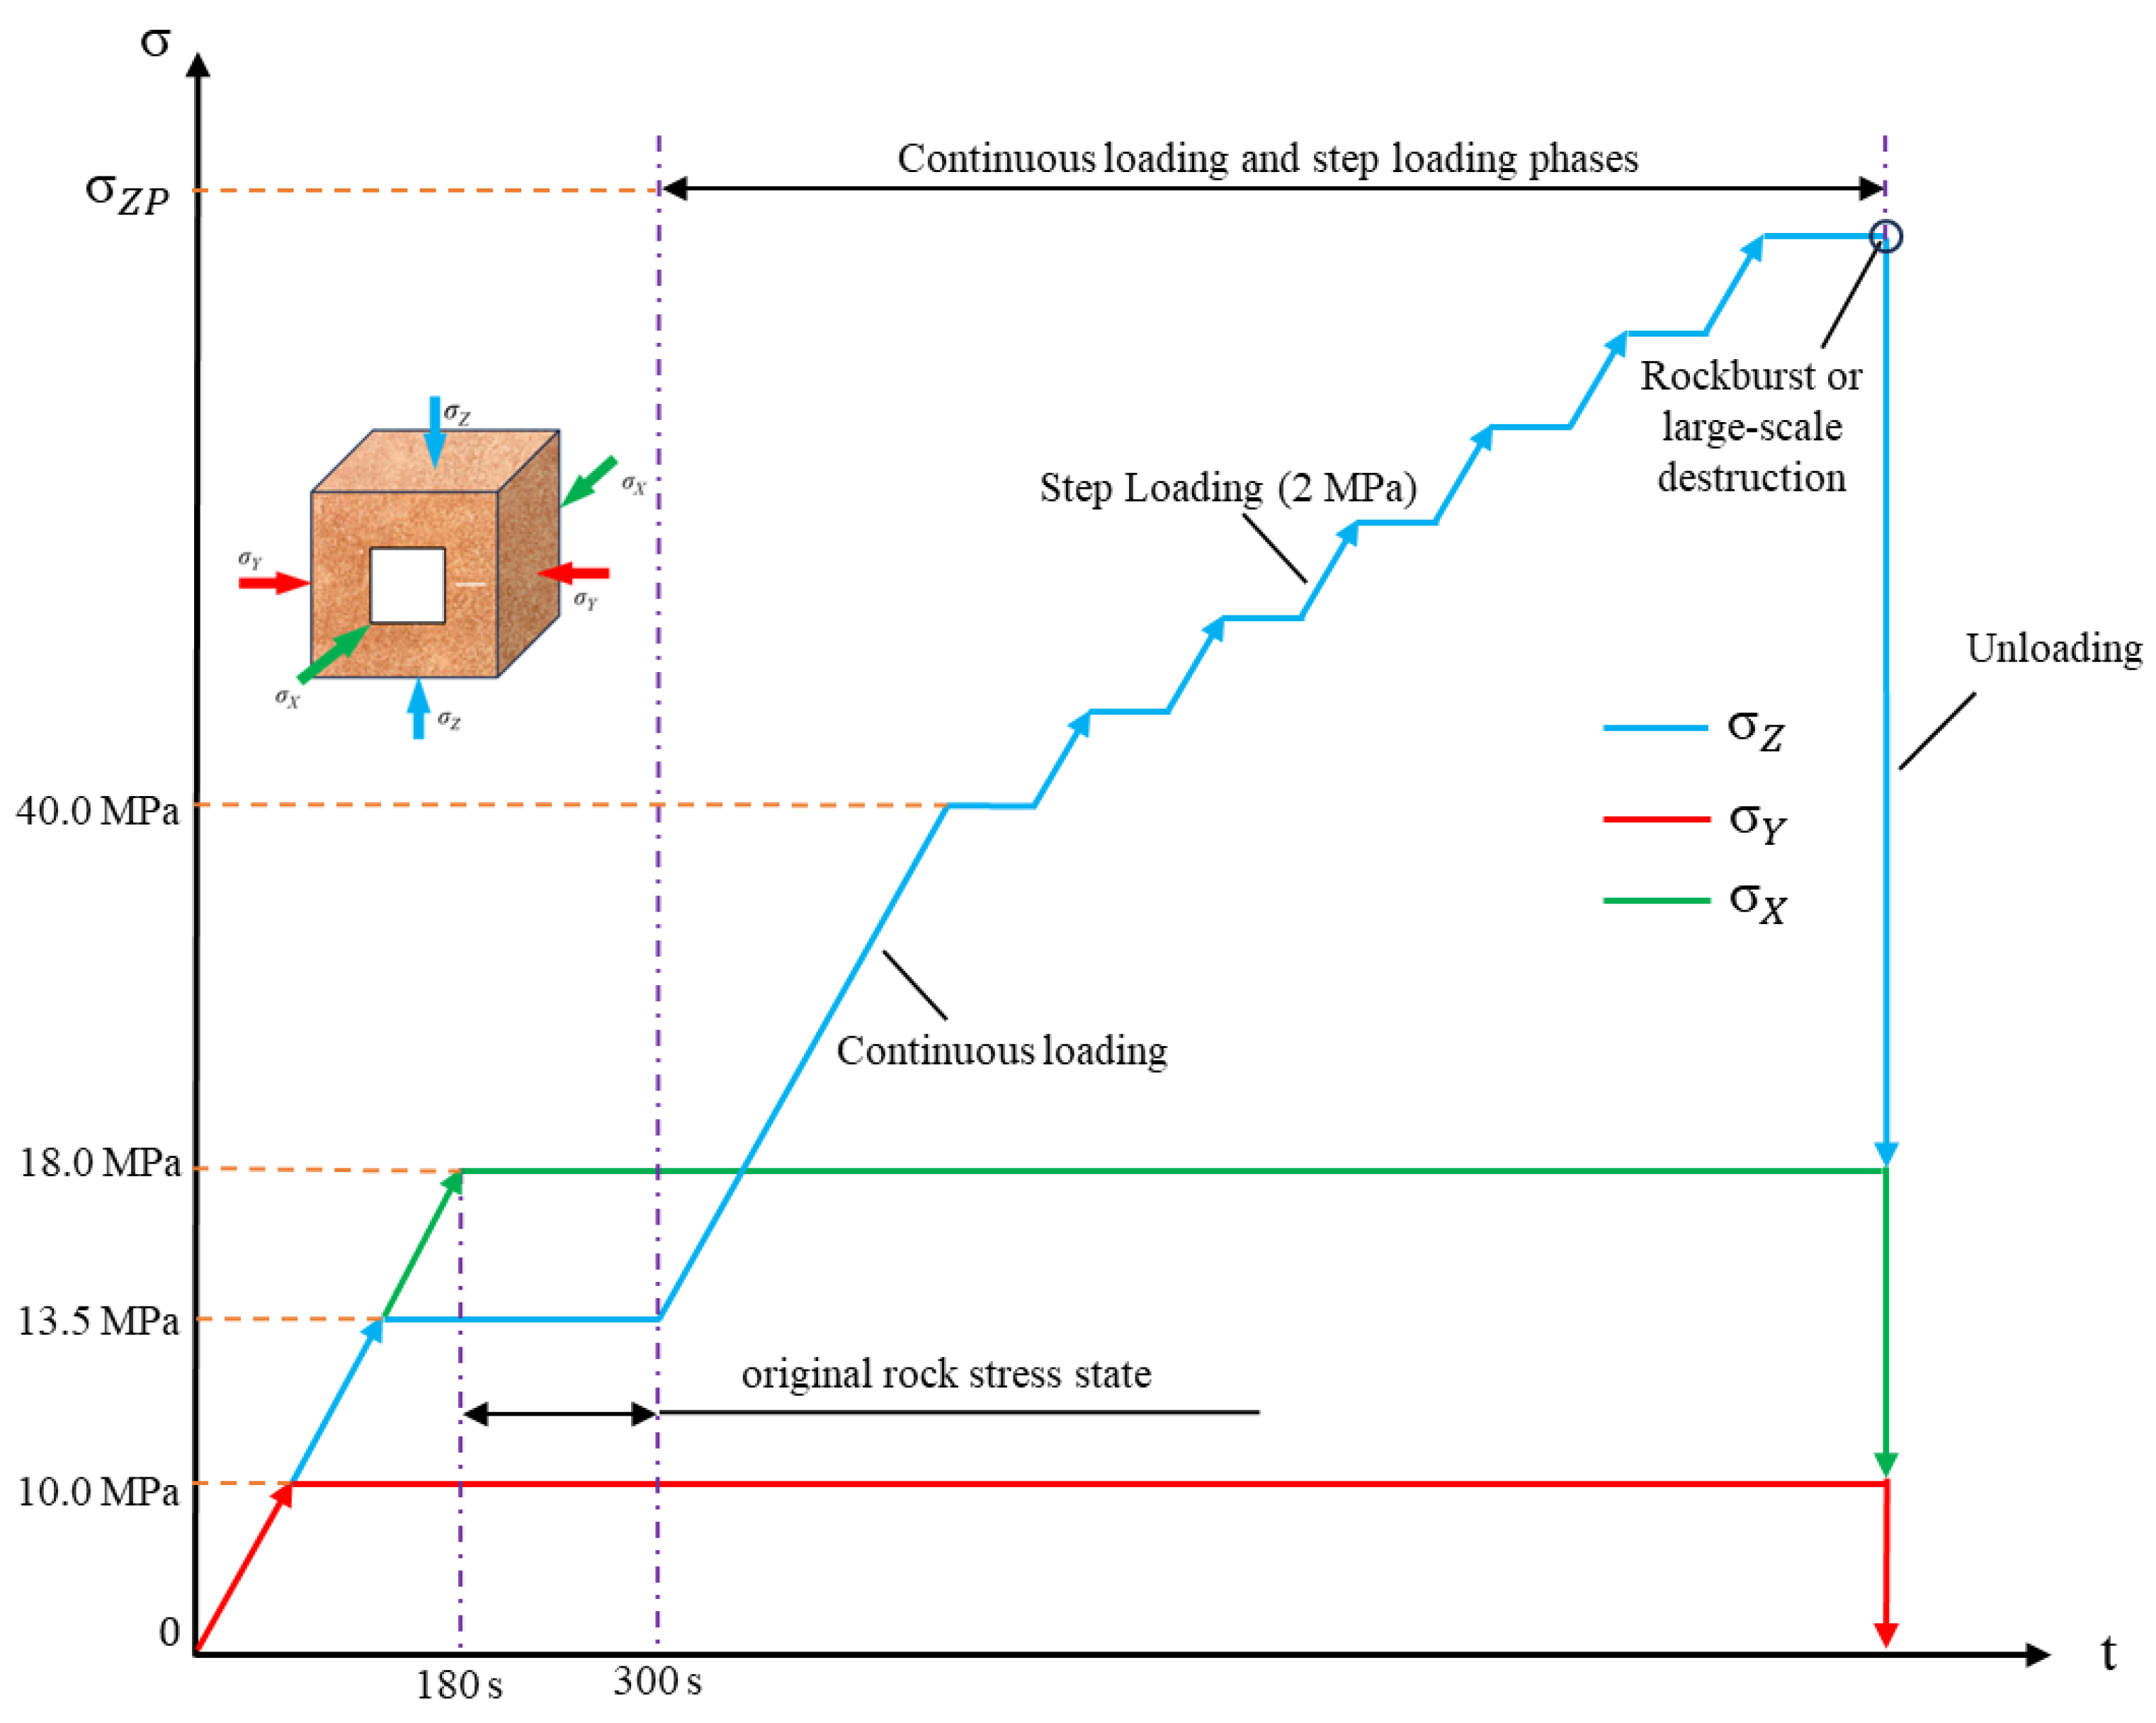
2.2. Testing Machines

Pre-test UCS evaluation was performed on cylindrical specimens using a INSTRON 1346 universal materials testing machine (Interstrand Company, Cardiff, UK) to establish baseline loading parameters (Figure 5a). The testing system features a 2000 kN load capacity and maintains ±0.5% force measurement precision across its full operational range. The results were used to determine the subsequent loading scheme.
To more accurately simulate deep mining stress paths, true triaxial testing was conducted on cubic specimens using the TRW 3000 Rock True Triaxial Current Servo Mutagenesis (Disturbance) Test System. The testing system demonstrates exceptional loading capacity (3000 kN axial, 1500 kN lateral) and measurement precision (±0.001 mm displacement, ±0.5% FS force), enabling comprehensive rock mechanics characterization under high-pressure conditions. Its hybrid actuation system combines electromechanical and hydraulic components to deliver independent triaxial loading with precise stress-state control. The integrated control platform supports multiple loading protocols (constant strain rate, step loading, etc.) through real-time monitoring and parameter adjustment capabilities (Figure 5b).
During testing, the PCI-2 Acoustic Emission (AE) system monitored the AE signals generated by crack formation and propagation around the rectangular hole. Additionally, the real-time visualization of the rock failure process was achieved through an industrial-grade HD camera integrated within the X-axis loading platen (Figure 5c).

2.3. Testing Method

In this simulation test, the initial in situ stress condition corresponded to rock buried at a depth of 500 m. Utilizing field-measured stress data from continental China’s geological formations [45], the initial stress state at a corresponding depth was determined using Equation (1):
σ v = 0.02532 H + 0.8177 σ hmax = 0.02989 H + 2.7984 σ hmin = 0.01766 H + 1.0583
where σv represents the vertical stress, H denotes the buried depth, σhmax and σhmin correspond to the maximum and minimum horizontal stresses, respectively.
Based on the calculation, the initial stress state at a depth of 500 m was determined as follows: σhmax = 17.74 MPa; σhmin = 9.89 MPa; and σv = 13.48 MPa. Since the excavation direction of underground tunnels in deep mines typically aligns with the direction of the maximum principal stress, the initial in situ stress for this test was optimized for the X-, Y-, and Z-directions to 18.0 MPa, 10.0 MPa, and 13.5 MPa, respectively.
A load/displacement control mode was employed in this simulation test, with a loading rate of 0.1 MPa/s. This loading rate was chosen based on previous research [14,16,17], which demonstrated that the loading rate significantly influences the failure mode and rock strength. Due to the presence of rectangular holes or transverse cracks in the samples, the contact area between the loading block and the specimen was smaller in the X-direction compared to the Y- and Z-directions. The contact areas in the Y- and Z-directions were 100 cm2, with a loading rate of 1000 N/s. Table 2 presents the contact areas and loading rates in the X-direction for the various sandstone specimens.
The process for this simulation test was as follows: At first, the processed cubic sandstone sample was positioned in the loading box, with the loading block centered to align the sample. Next, displacement control software was used to apply the initial stress levels at a preset loading rate in three directions (X, Y, and Z). After the sample reached the initial stress levels, it was held for 120 s to allow the sandstone to reach stress equilibrium. The initial stresses in the X- and Y-axes were then maintained, and the stress in the Z-direction was further applied at the same rate (1000 N/s) until it reached 40 MPa. To maintain sample integrity and allow stress adjustments in the surrounding material during the test, the vertical stress σz was held at 40 MPa for 60 s to simulate stress adjustment in real-world projects. Unloading started when video monitoring detected rockburst or significant damage. The loads in all three directions were reduced to 0 MPa at a displacement rate of 5 mm/min. Figure 6 shows the stress path for this simulation.

3. Test Results

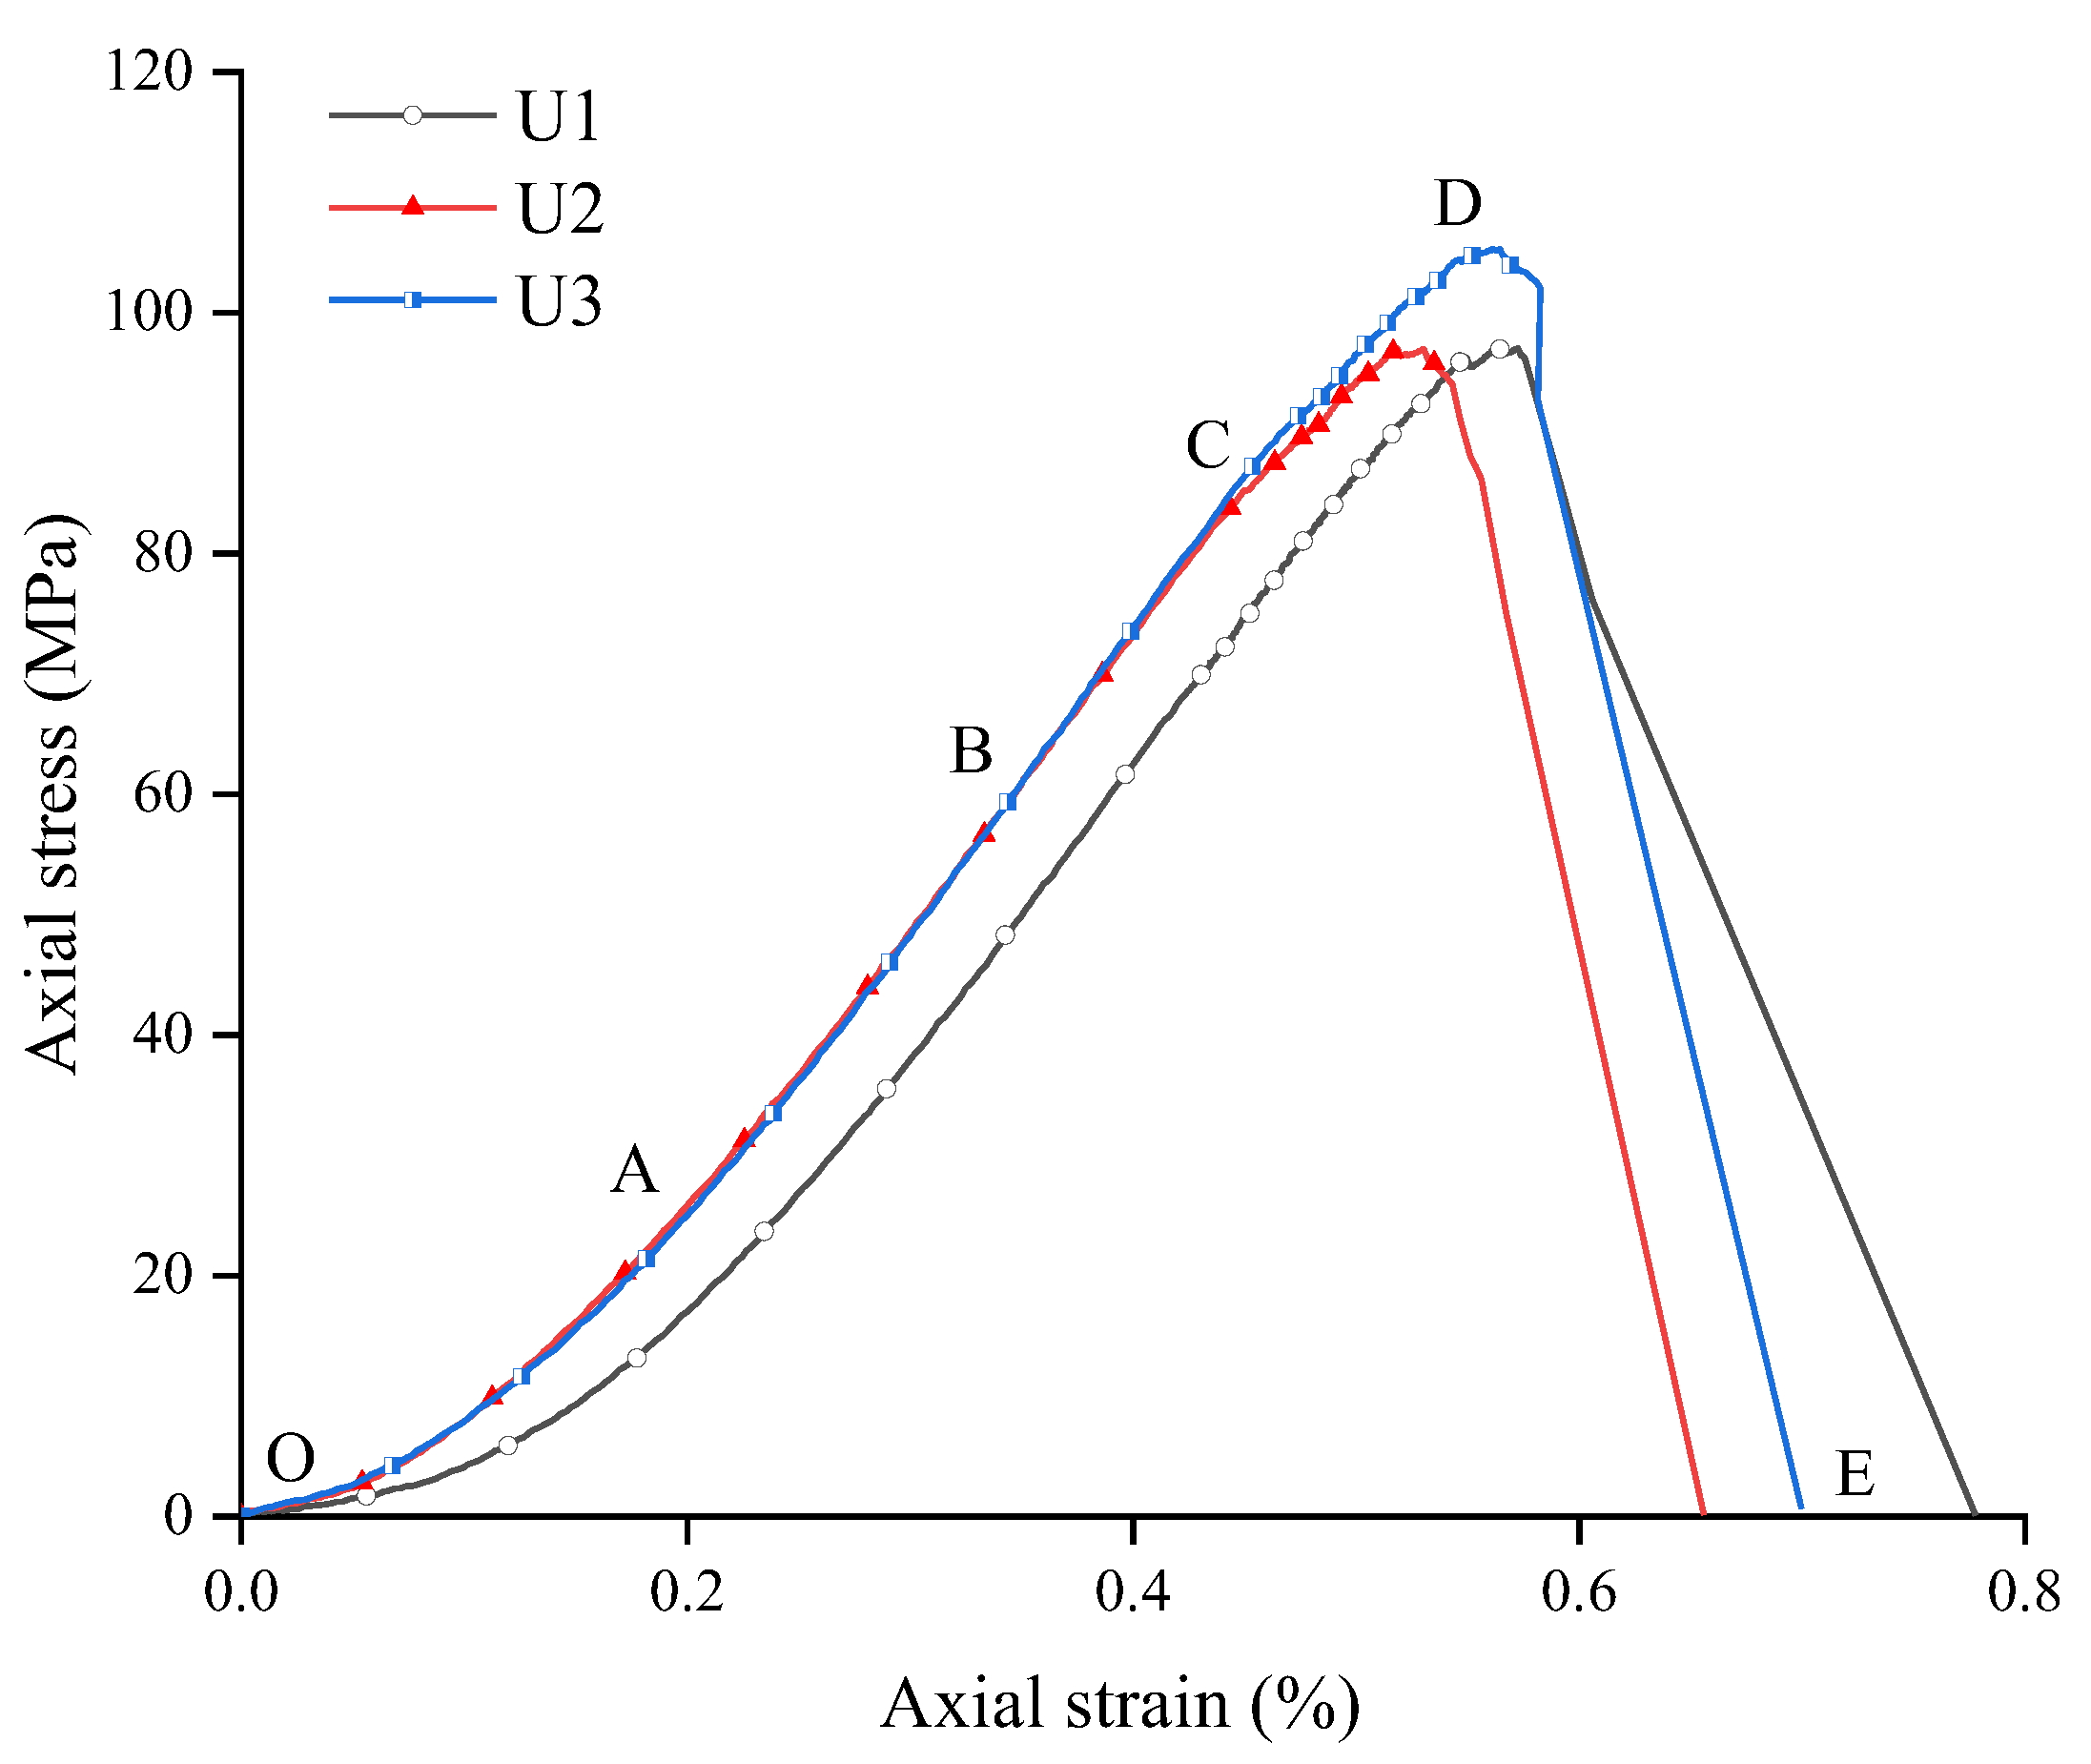
3.1. Results of Uniaxial Compression Tests

The stress–strain curves of the sandstone specimens are shown in Figure 7. The deformation process consisted of five main stages, identified from the curve characteristics. Micro-fissure compaction stage (OA): during this stage, the initial voids and micro-fissures within the cylindrical specimen gradually closed under external force. Elastic deformation stage (AB): here, strain increased linearly with the rise in axial stress. Micro-fissure branching and stable expansion stage (BC): although strain continued to grow, the growth rate stabilized in this phase. Micro-fissure instability propagation stage (CD): beginning at point C, internal damage accumulation and microcrack propagation caused the curve to convex upward, indicating unstable deformation. Failure stage (DE): The stress sharply dropped to zero as the specimen’s internal structure collapsed. This was accompanied by rock ejection and a sharp cracking sound, indicating the specimen’s loss of strength. Three sandstone specimens exhibited uniaxial compressive strengths of 97.08 MPa, 95.80 MPa, and 102.30 MPa, respectively, with an average of 98.39 MPa.

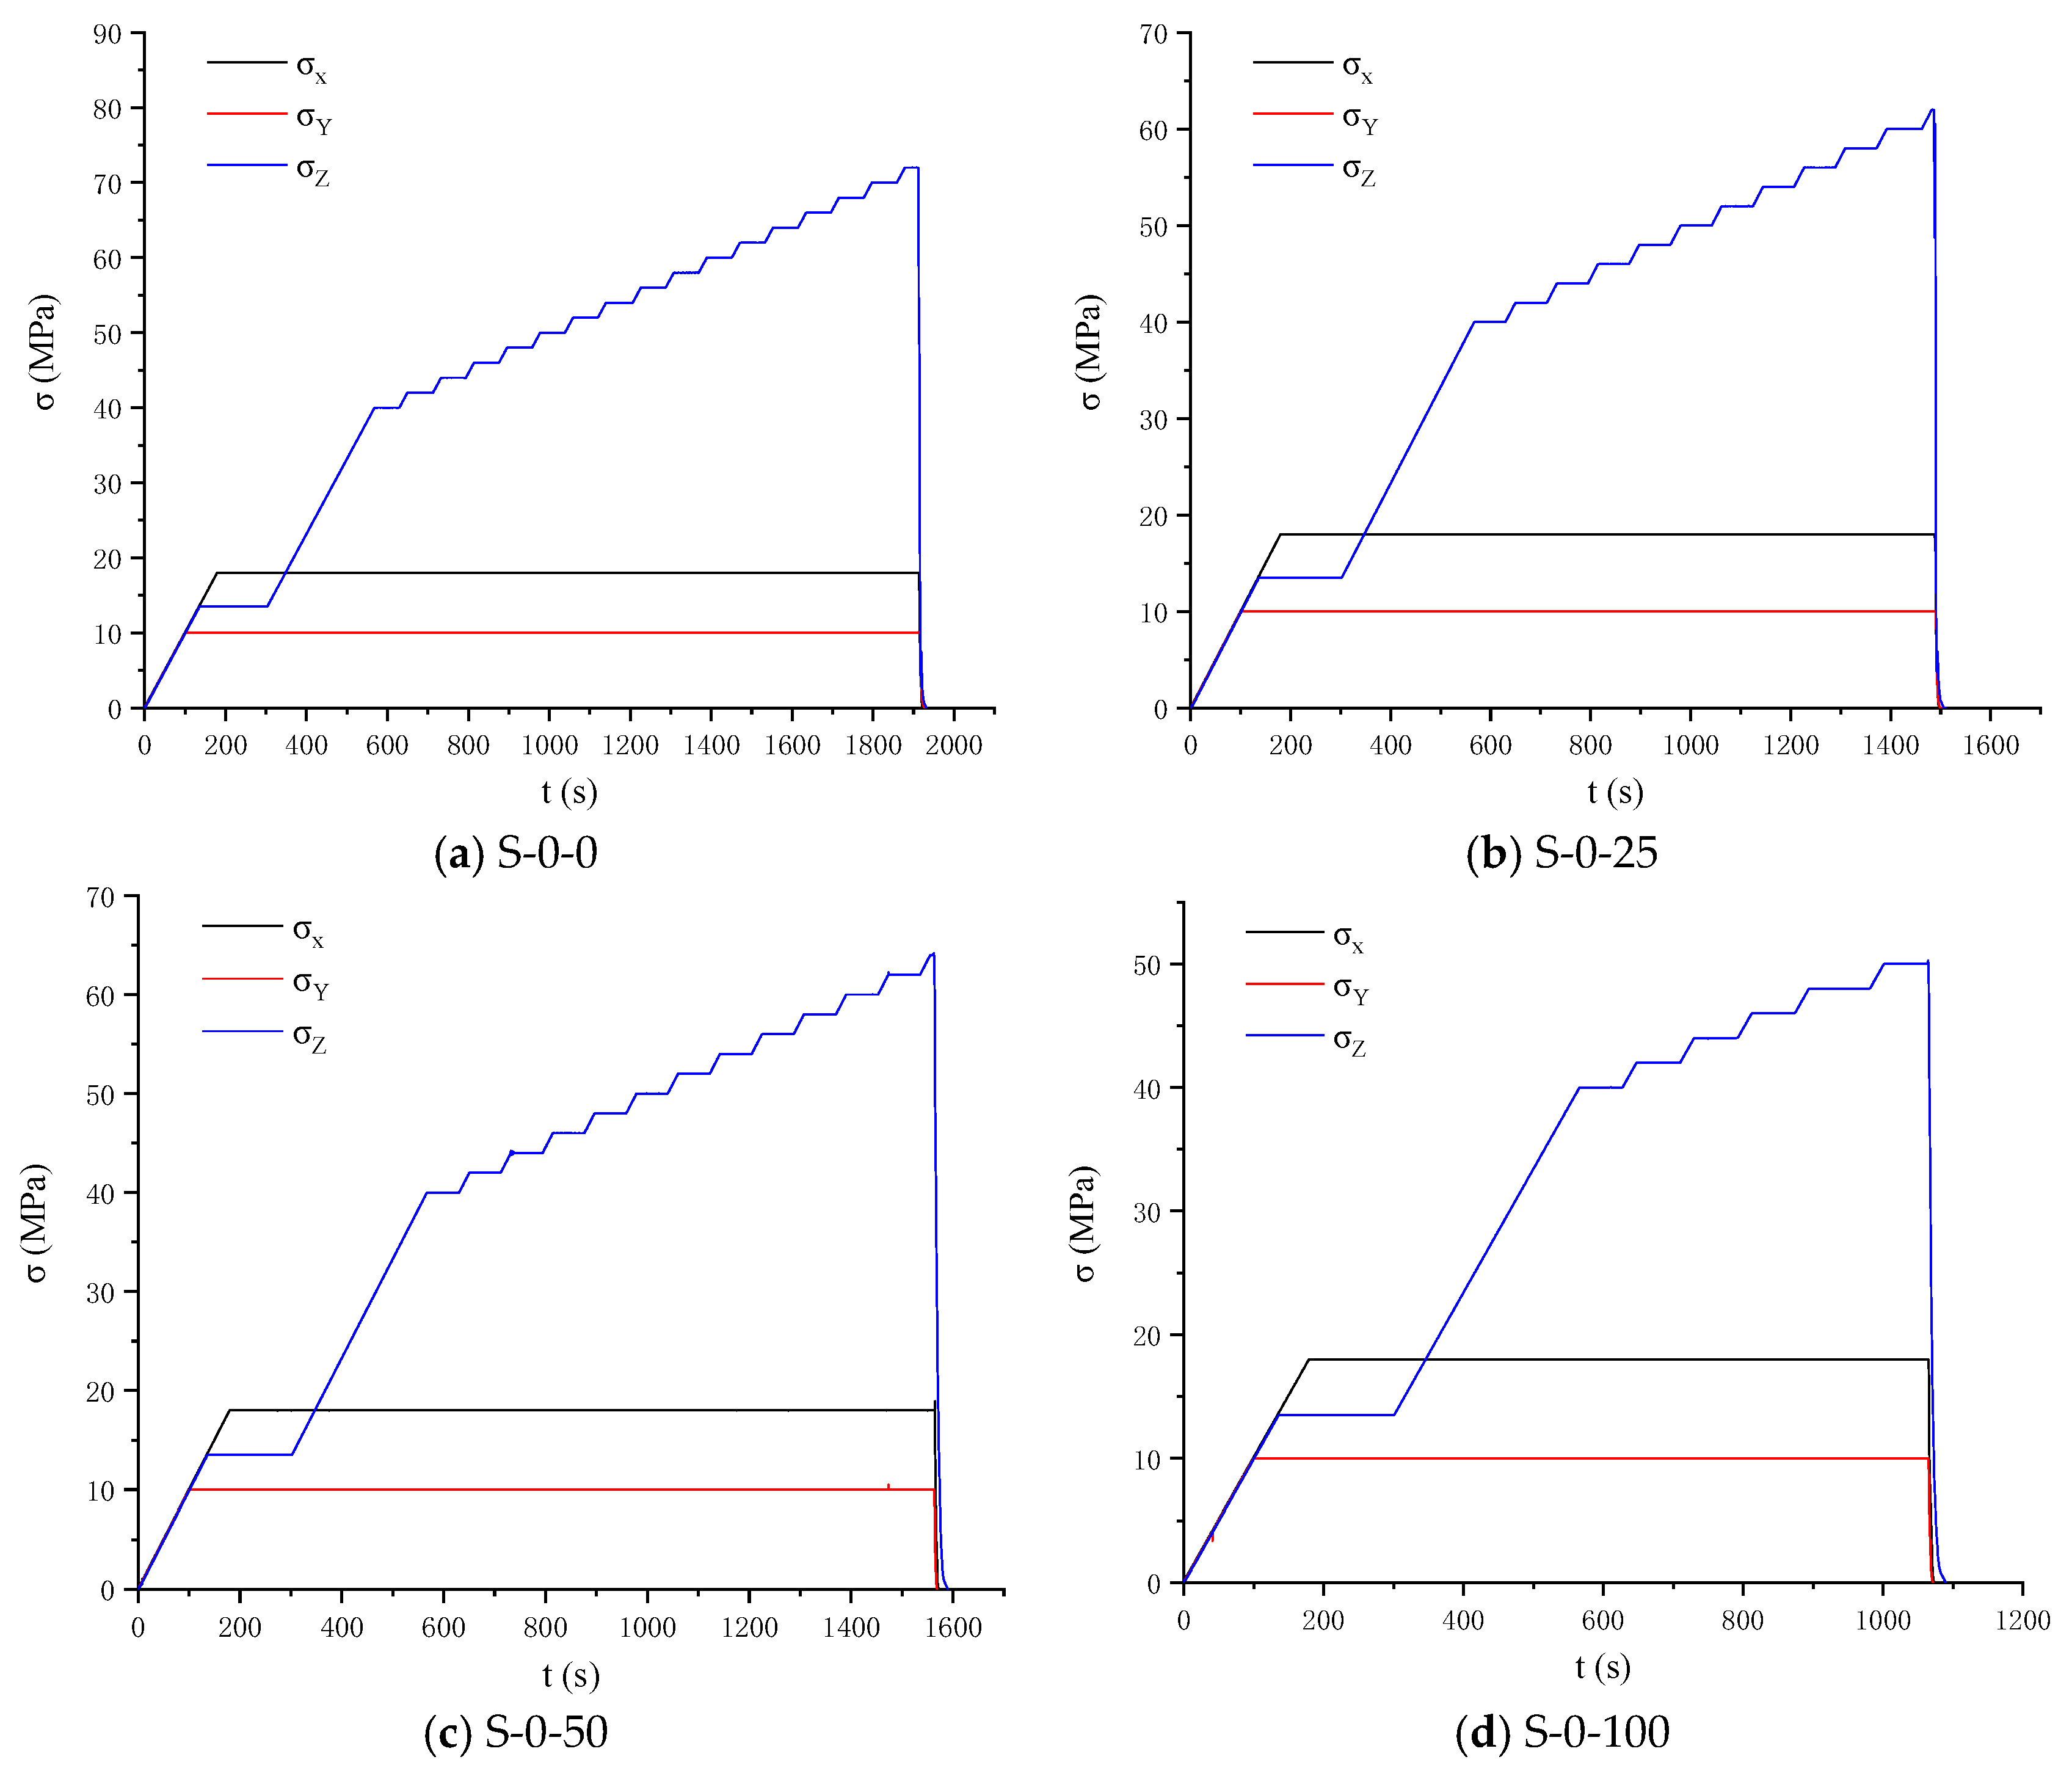
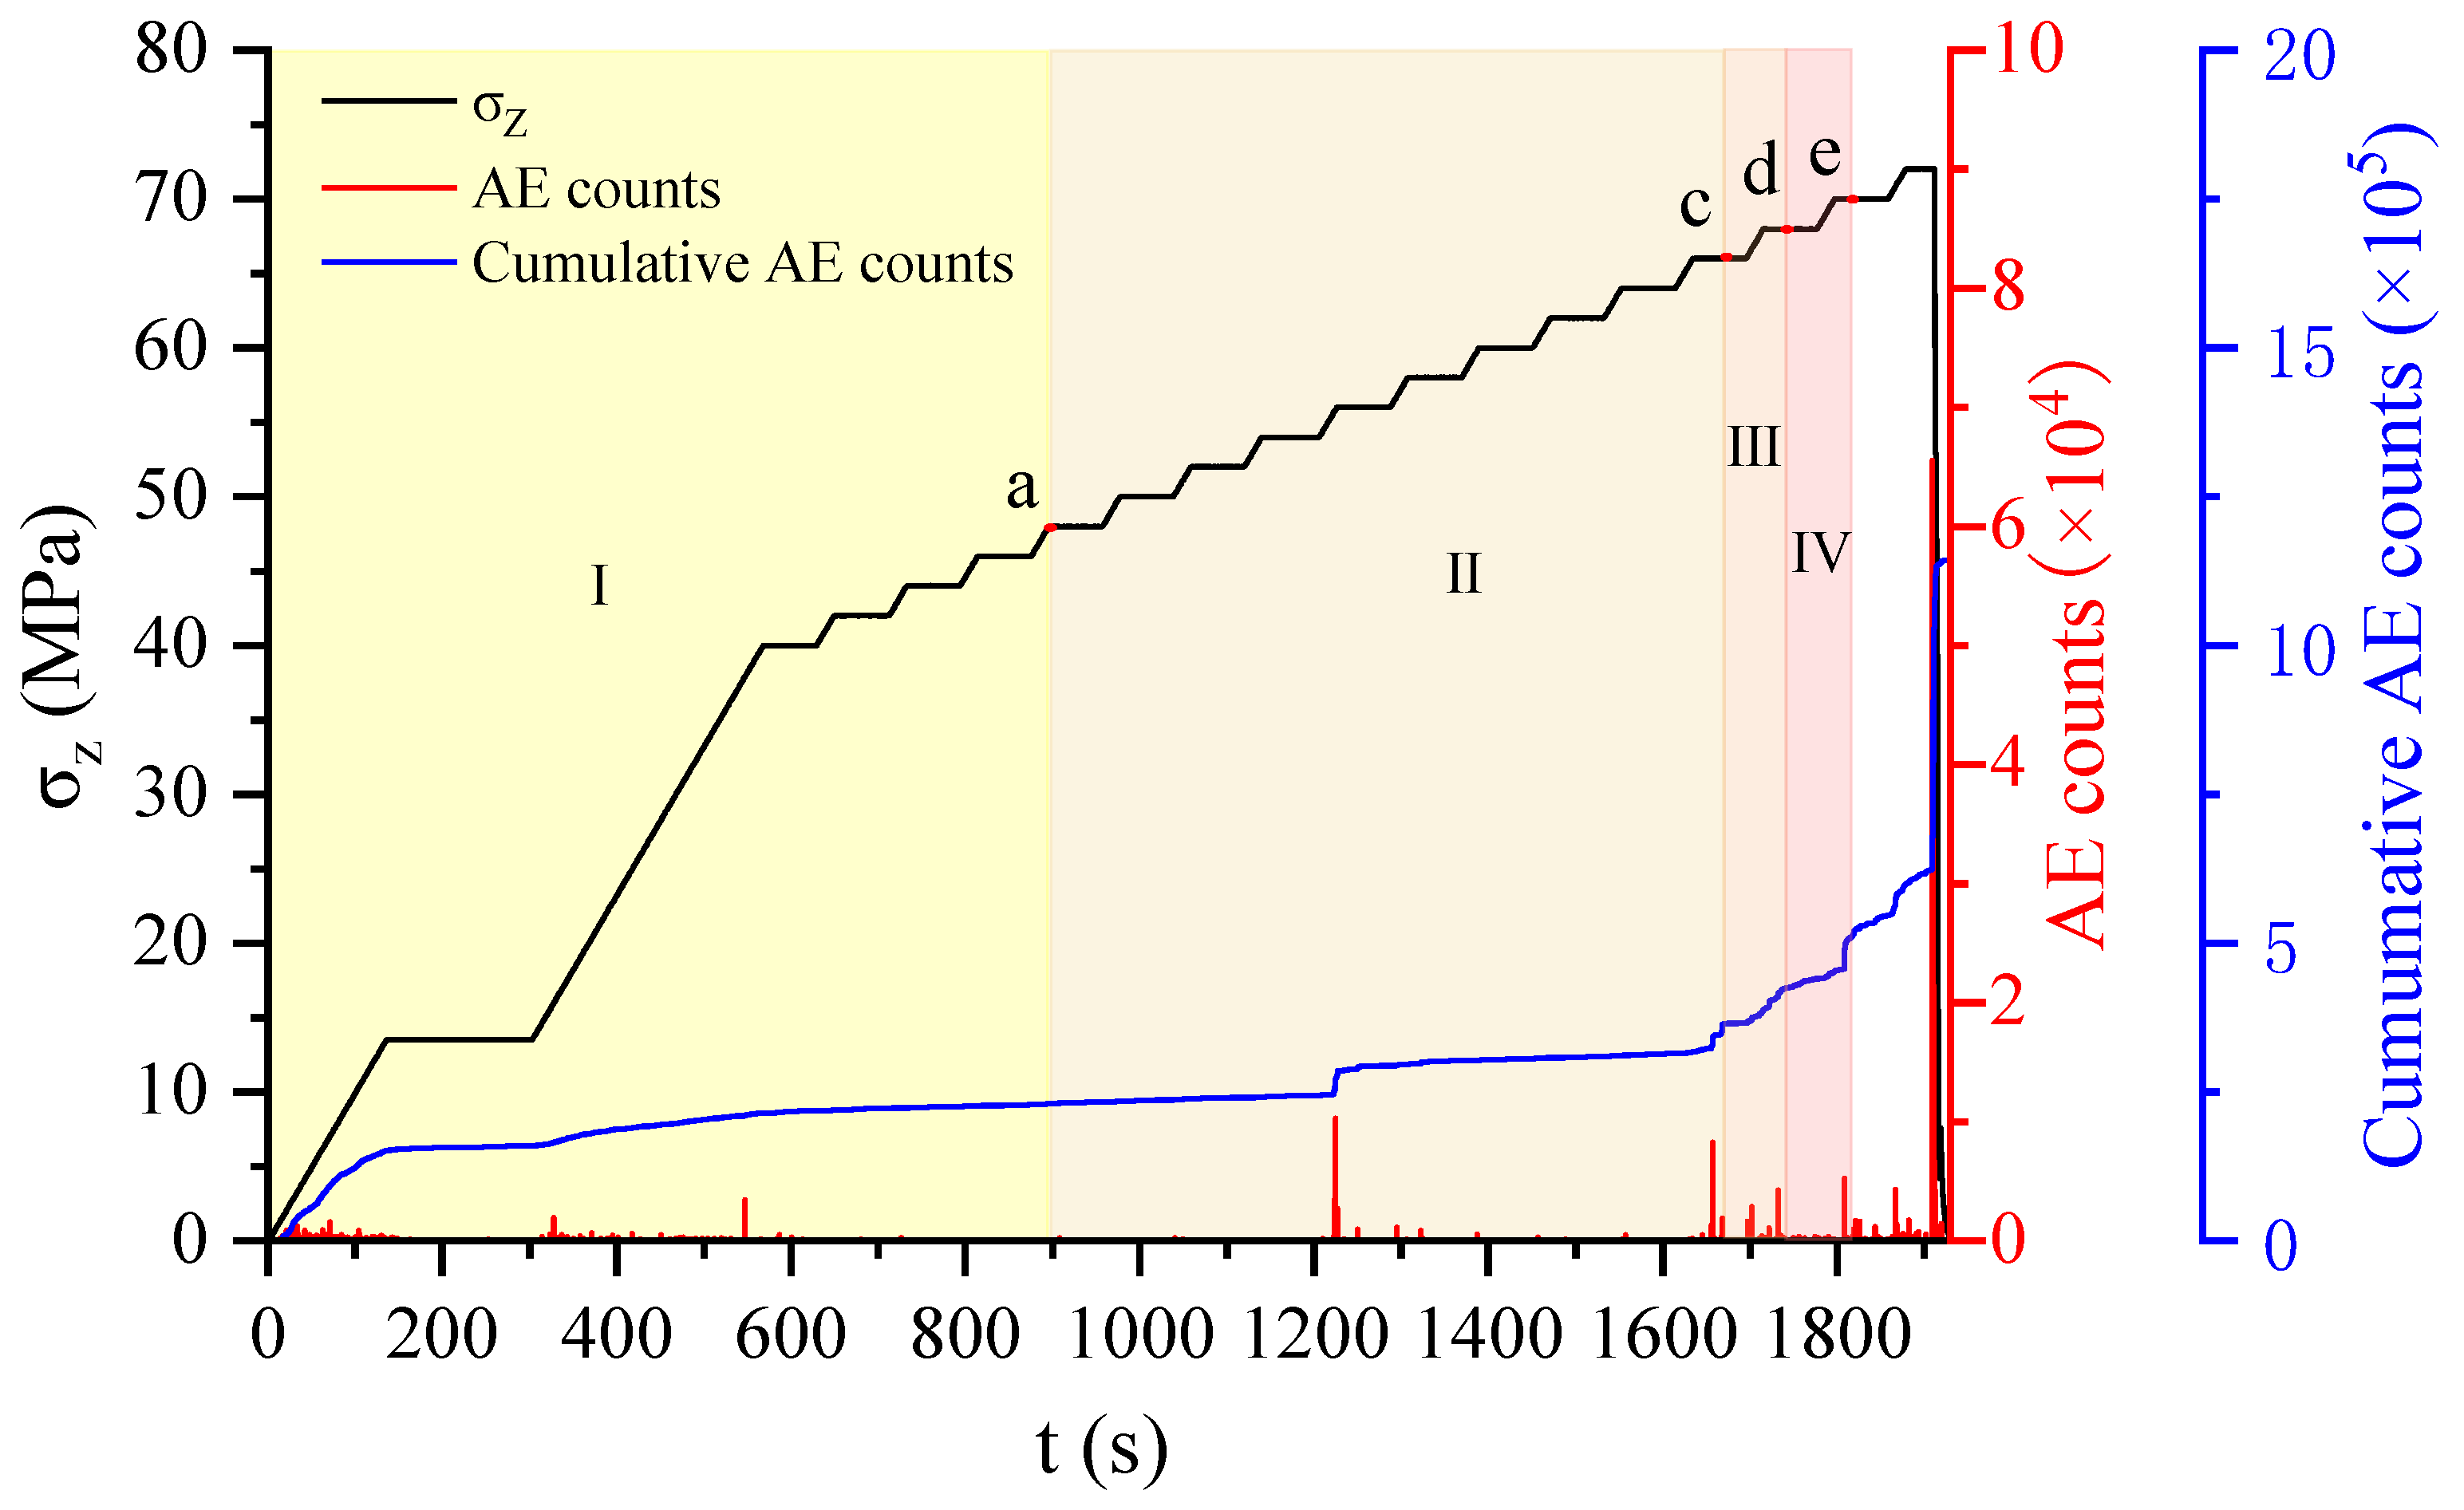
3.2. Stress-Time Curves

The loading paths for sandstone specimens under varying fissure penetration conditions are shown in Figure 8. In this simulation experiment, severe damage occurred during step loading for specimens “S-0-25” and “S-0-50”, leading to immediate unloading without maintaining the load. The Z-direction vertical stress σz reached 72 MPa for specimen “S-0-0”, 62 MPa for specimen “S-0-25”, 64 MPa for specimen “S-0-50”, and 50 MPa for specimen “S-0-100”.

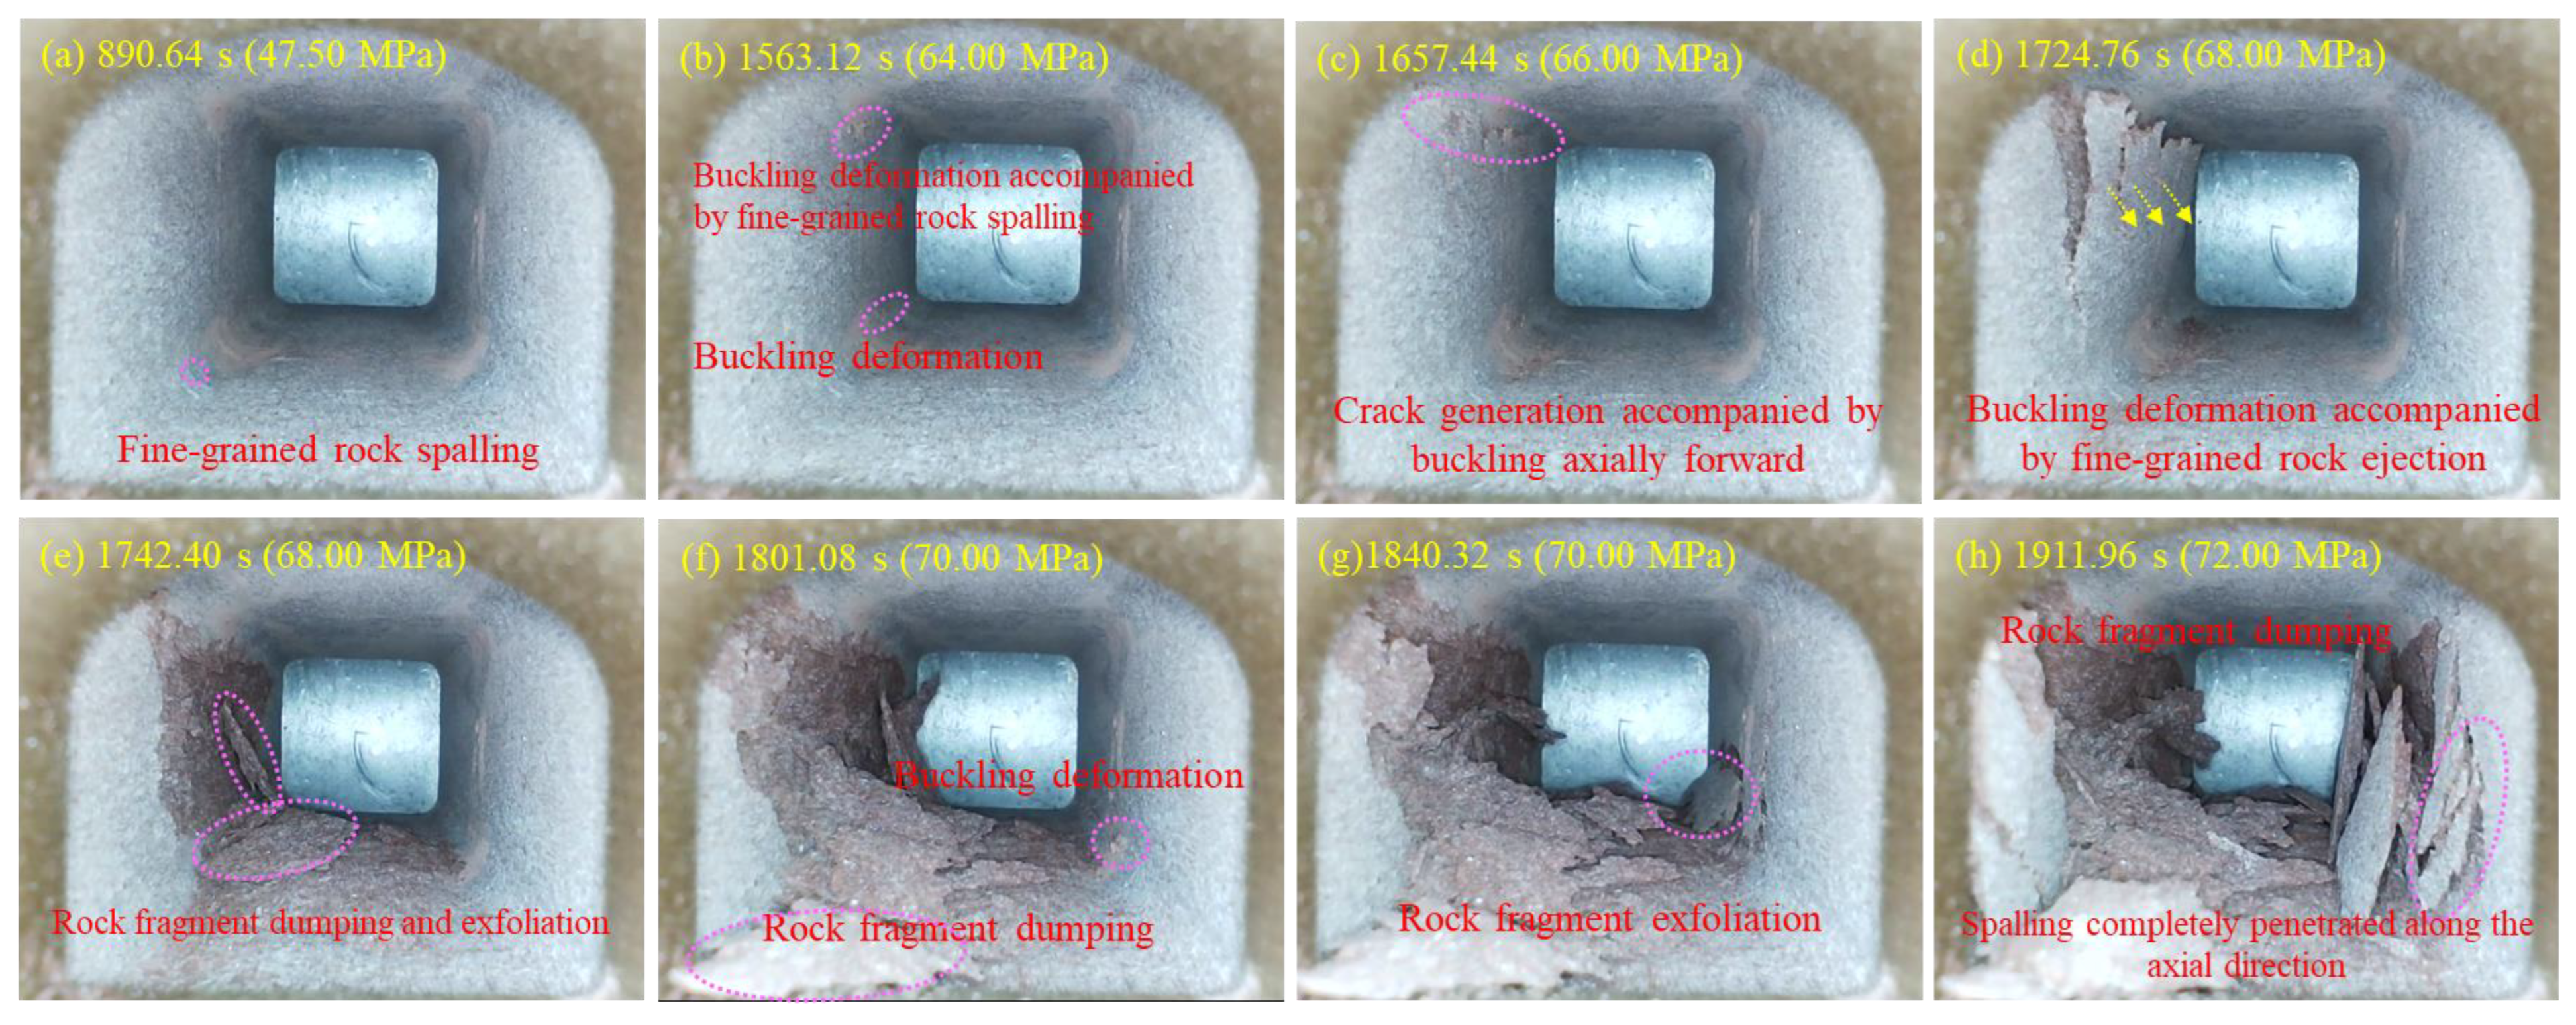
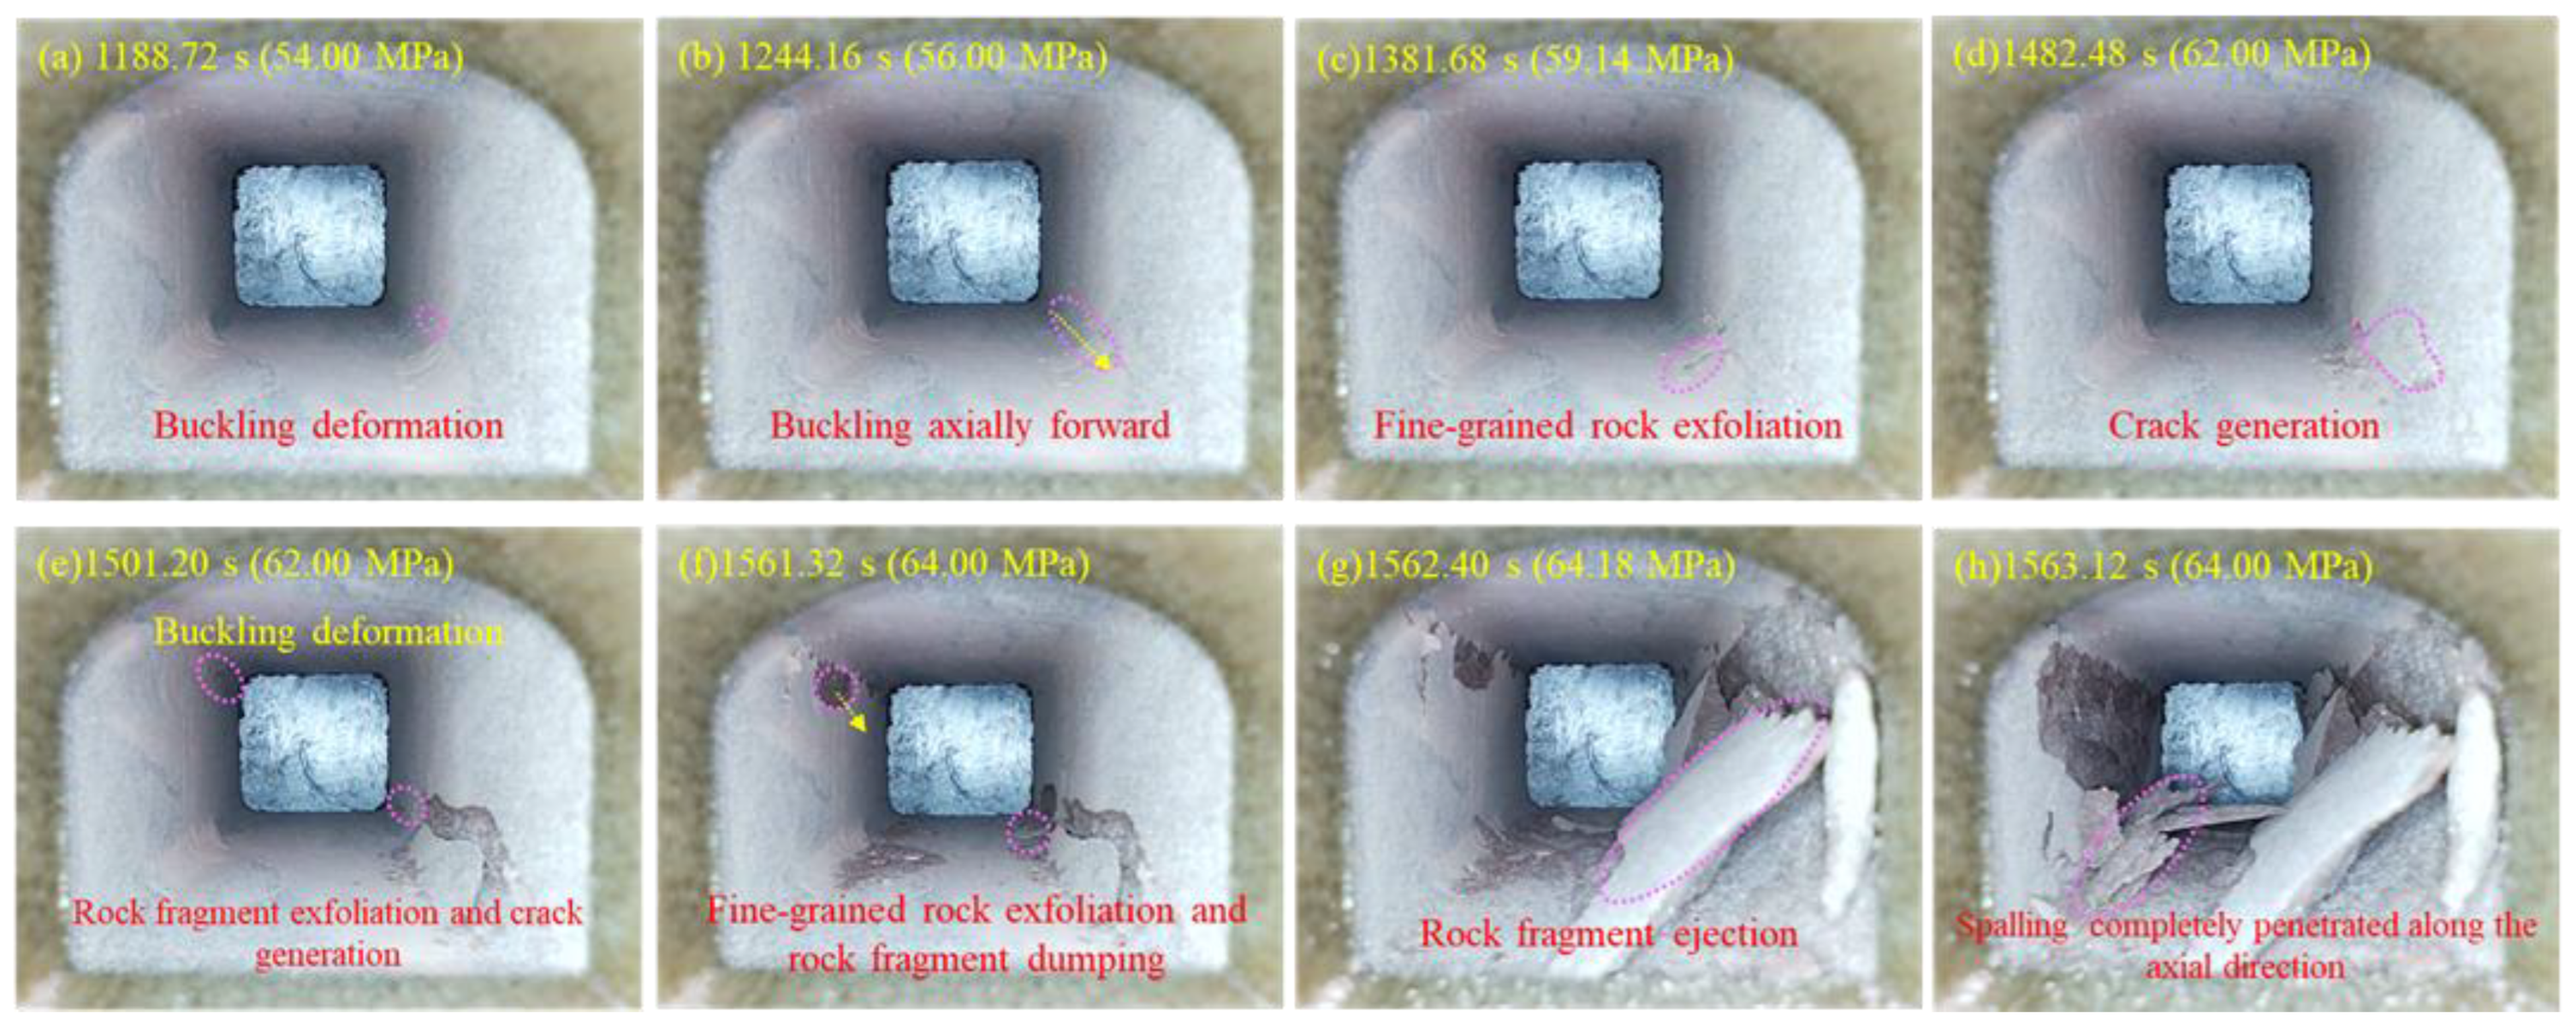
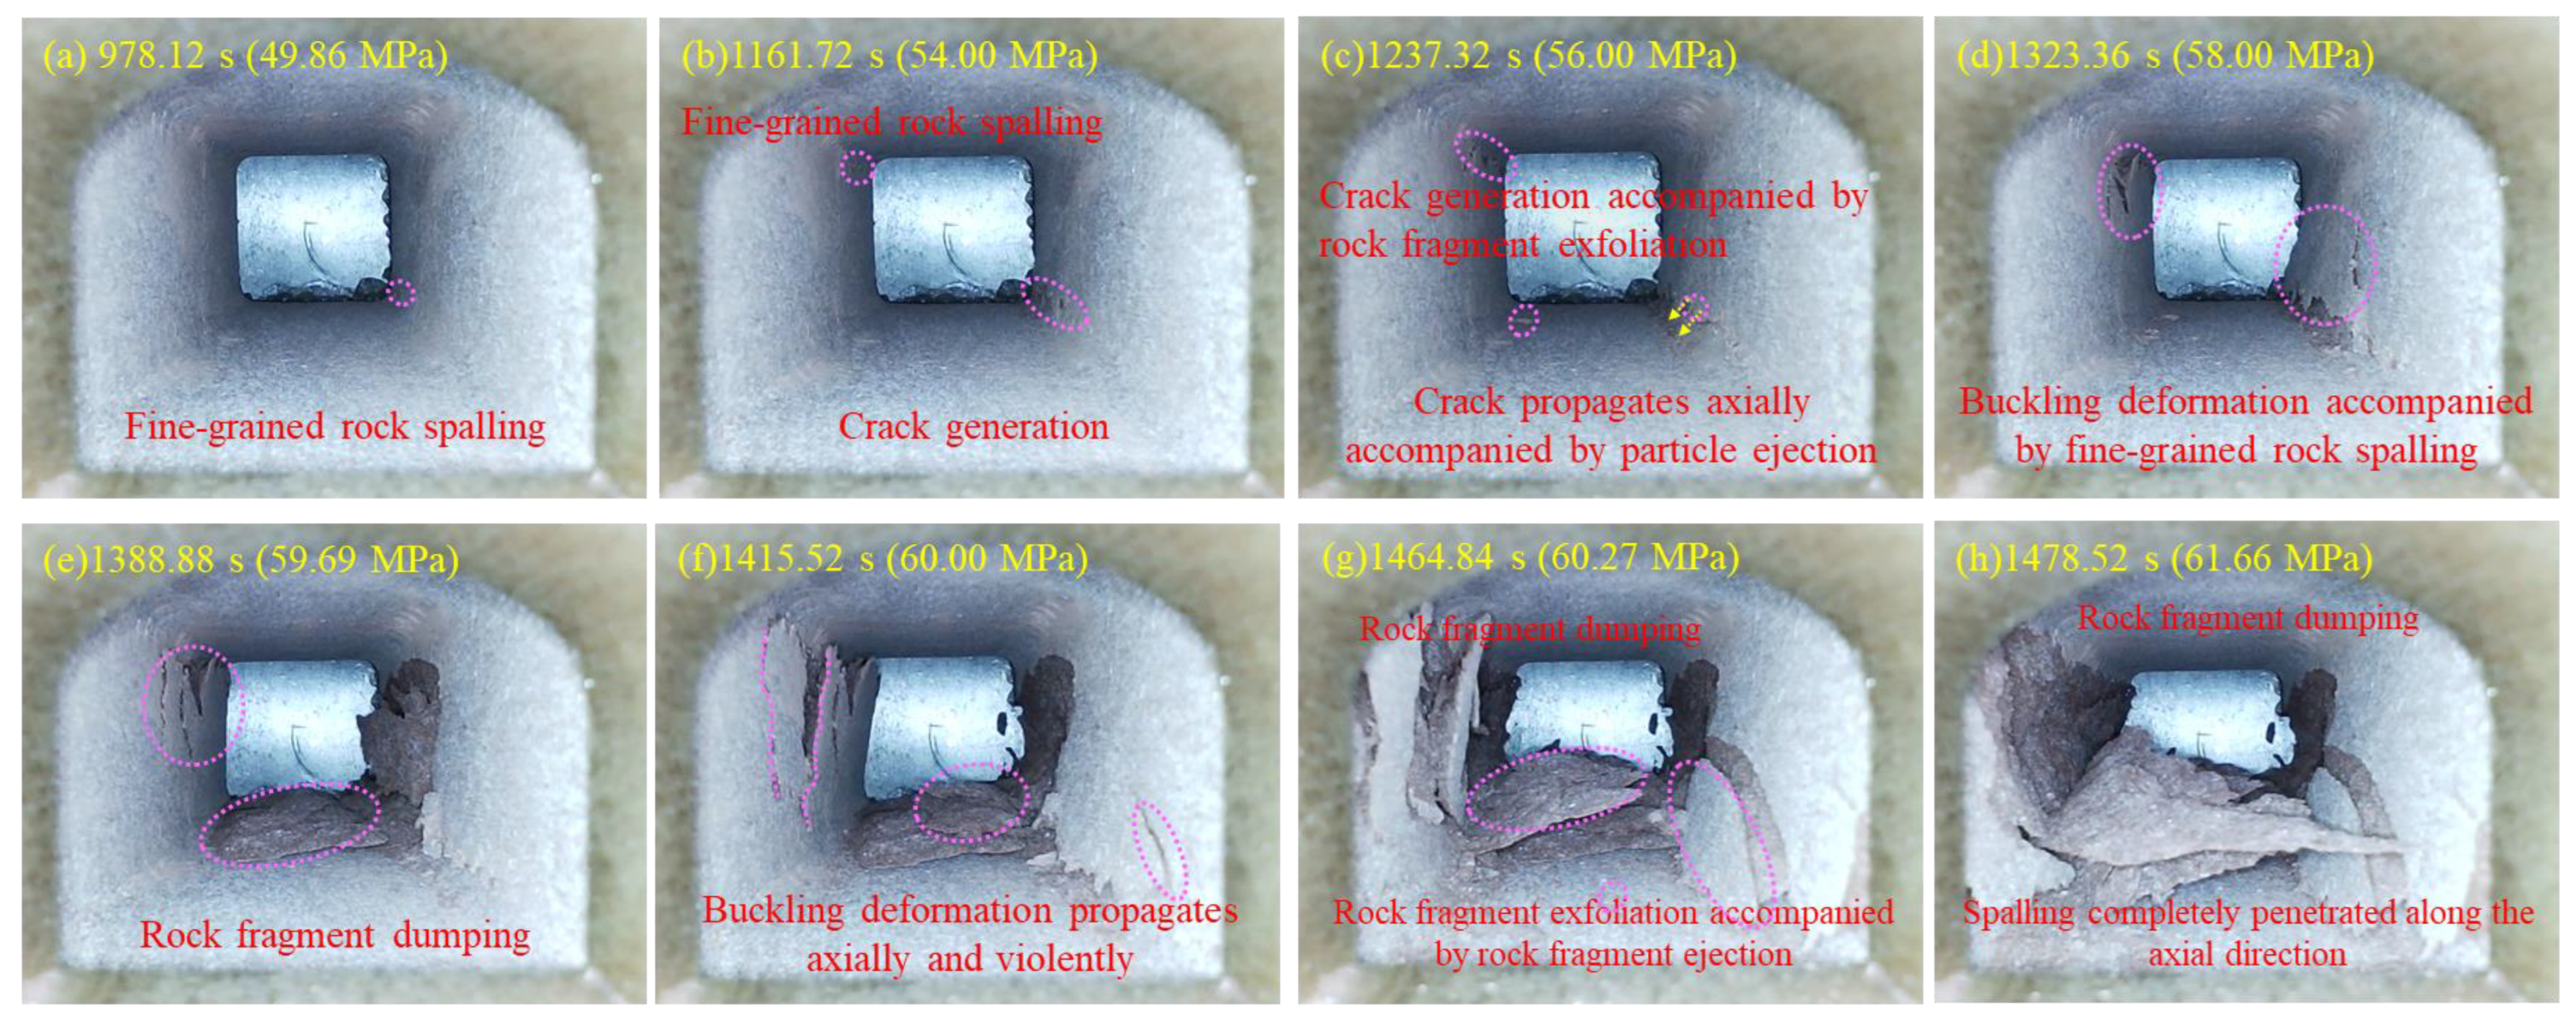
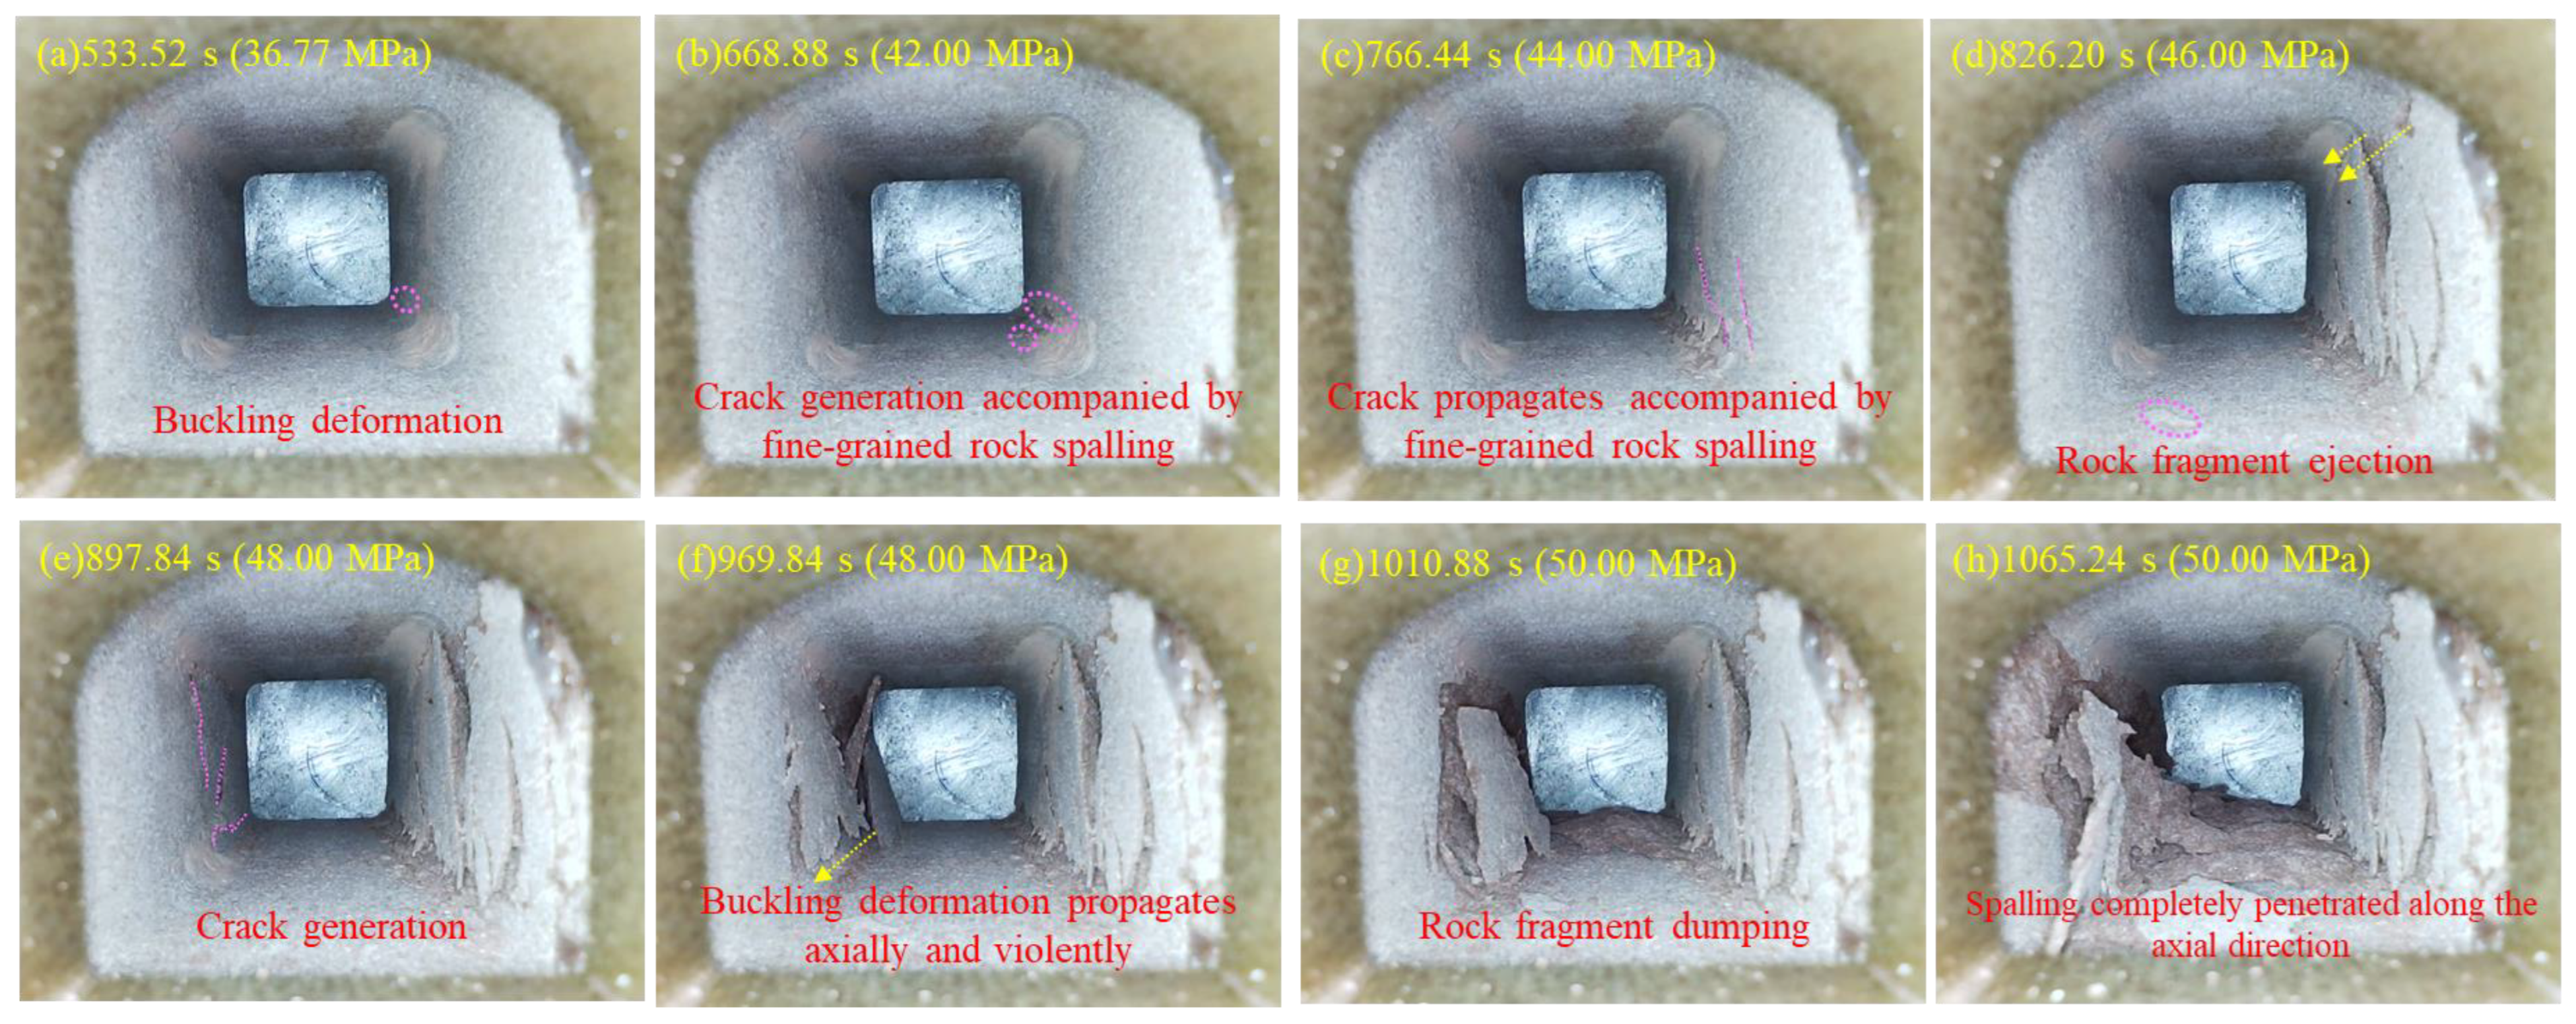
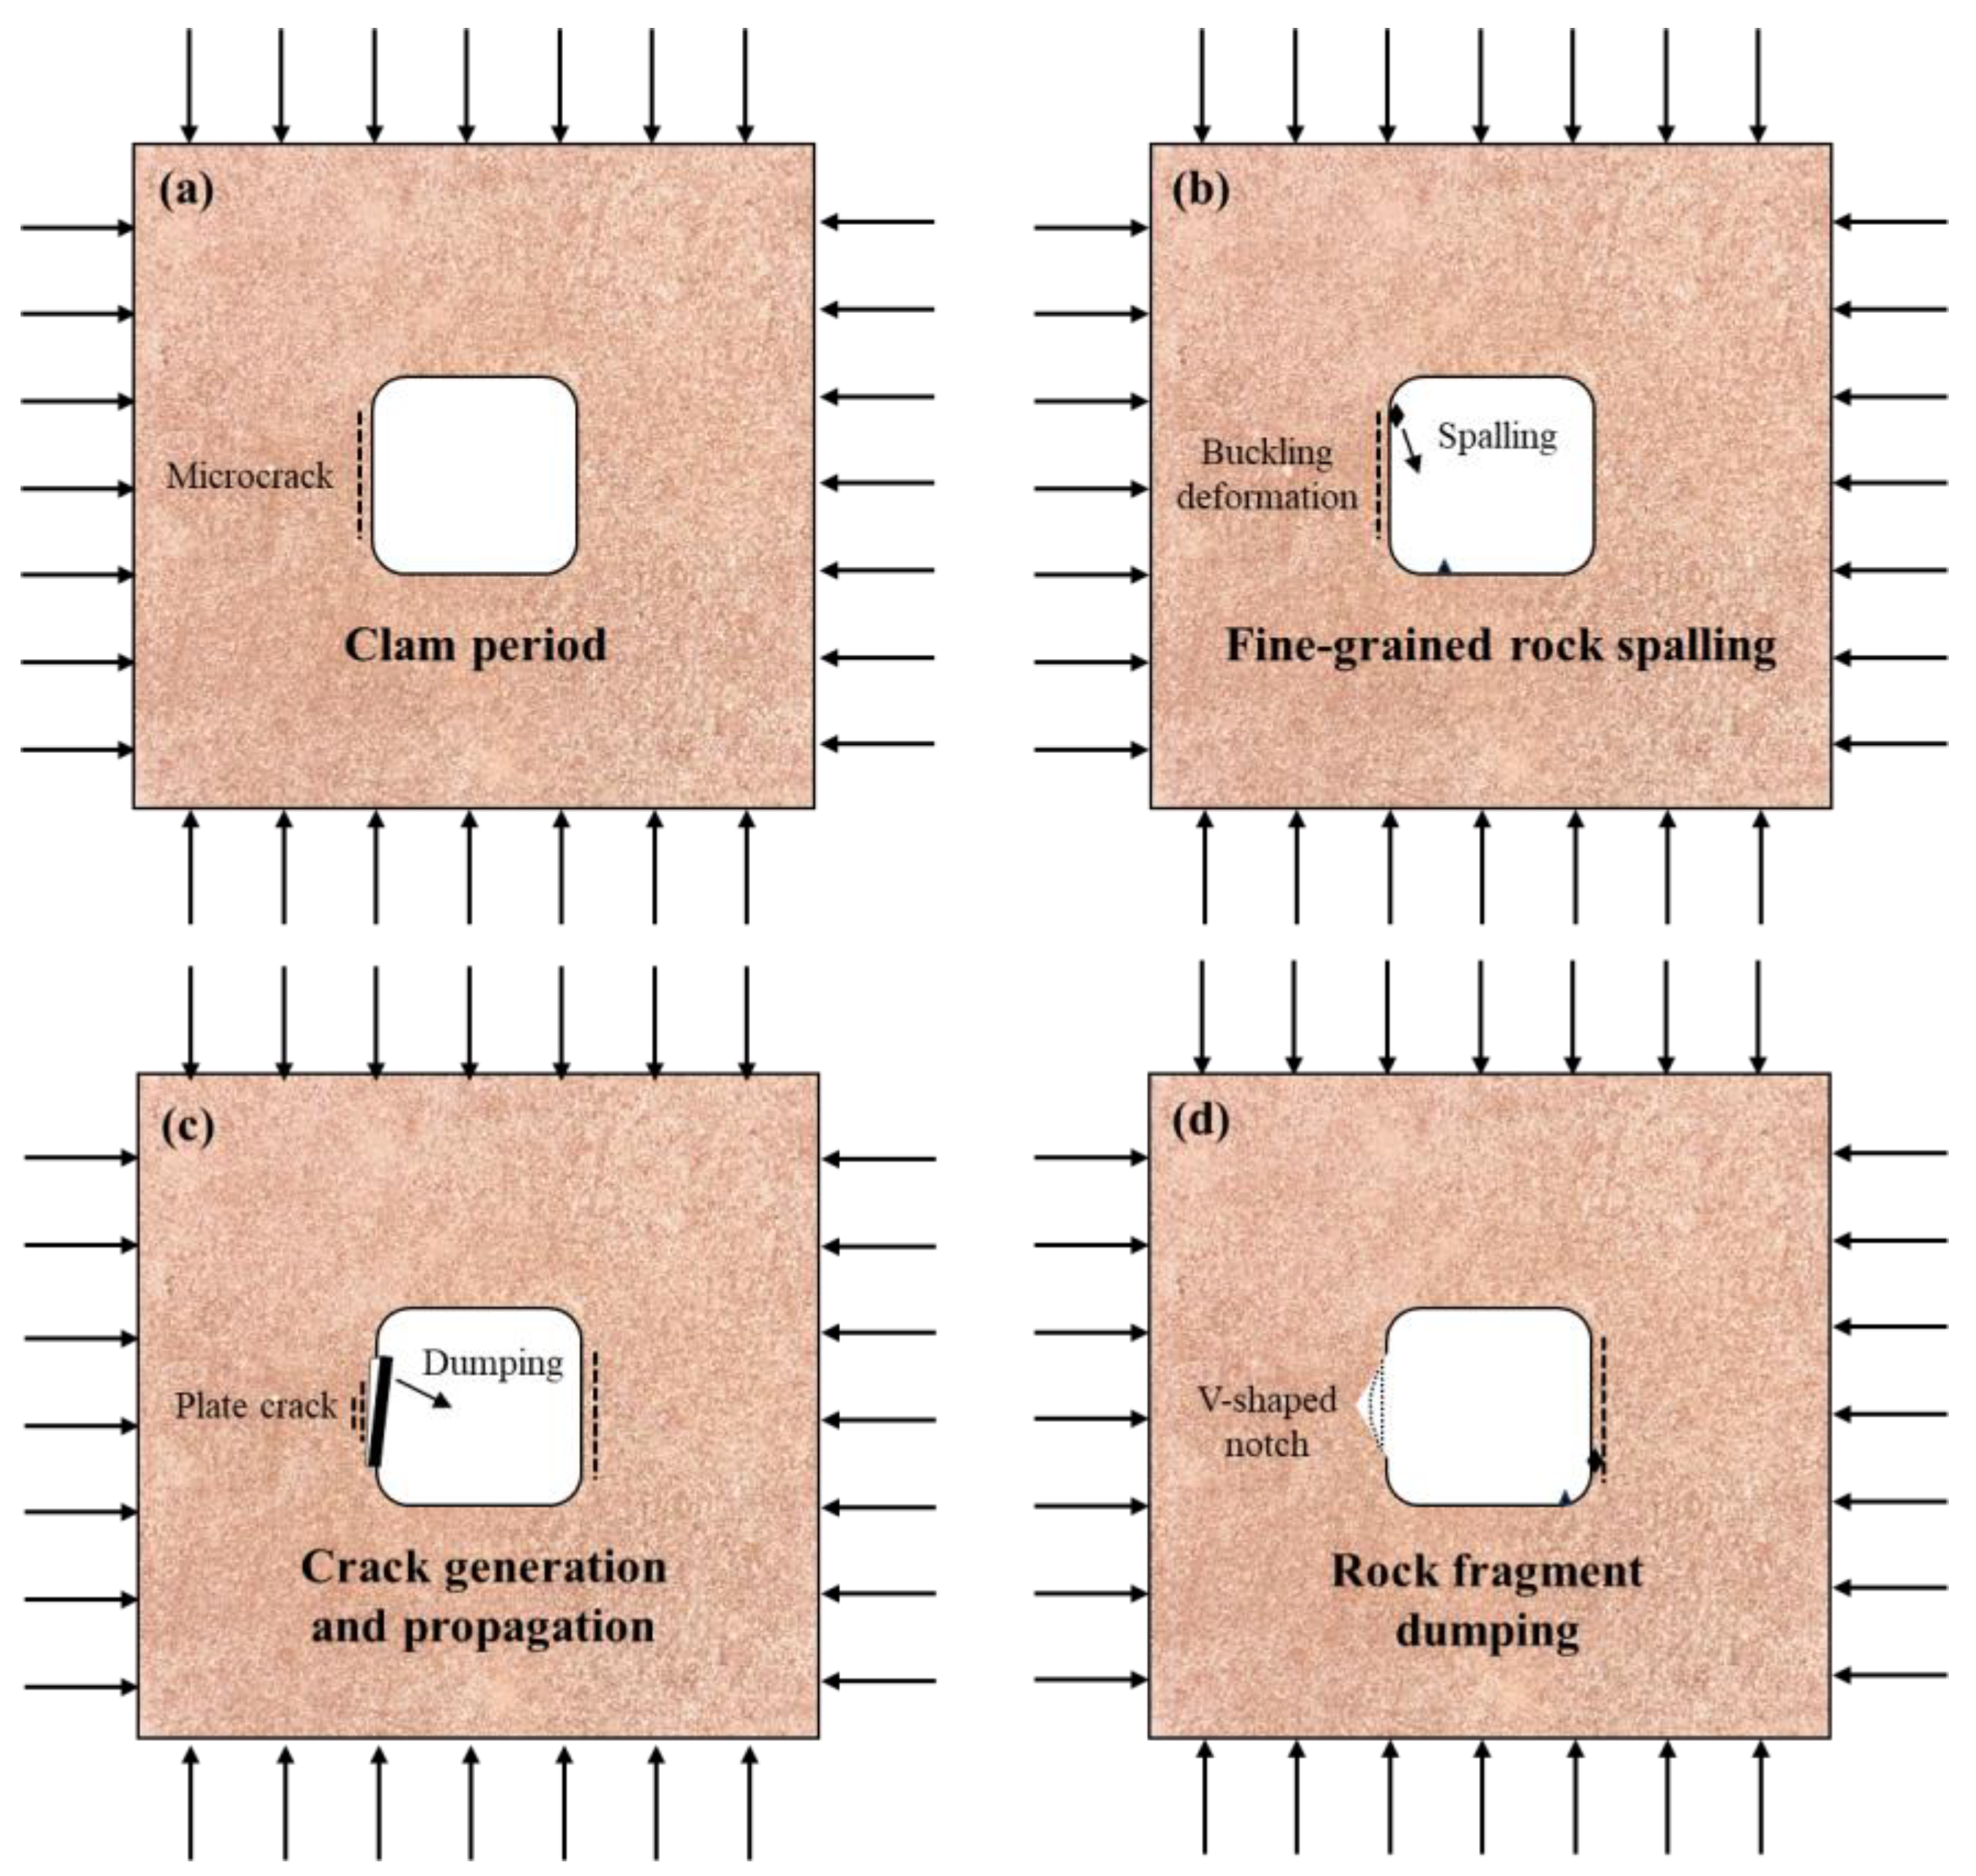
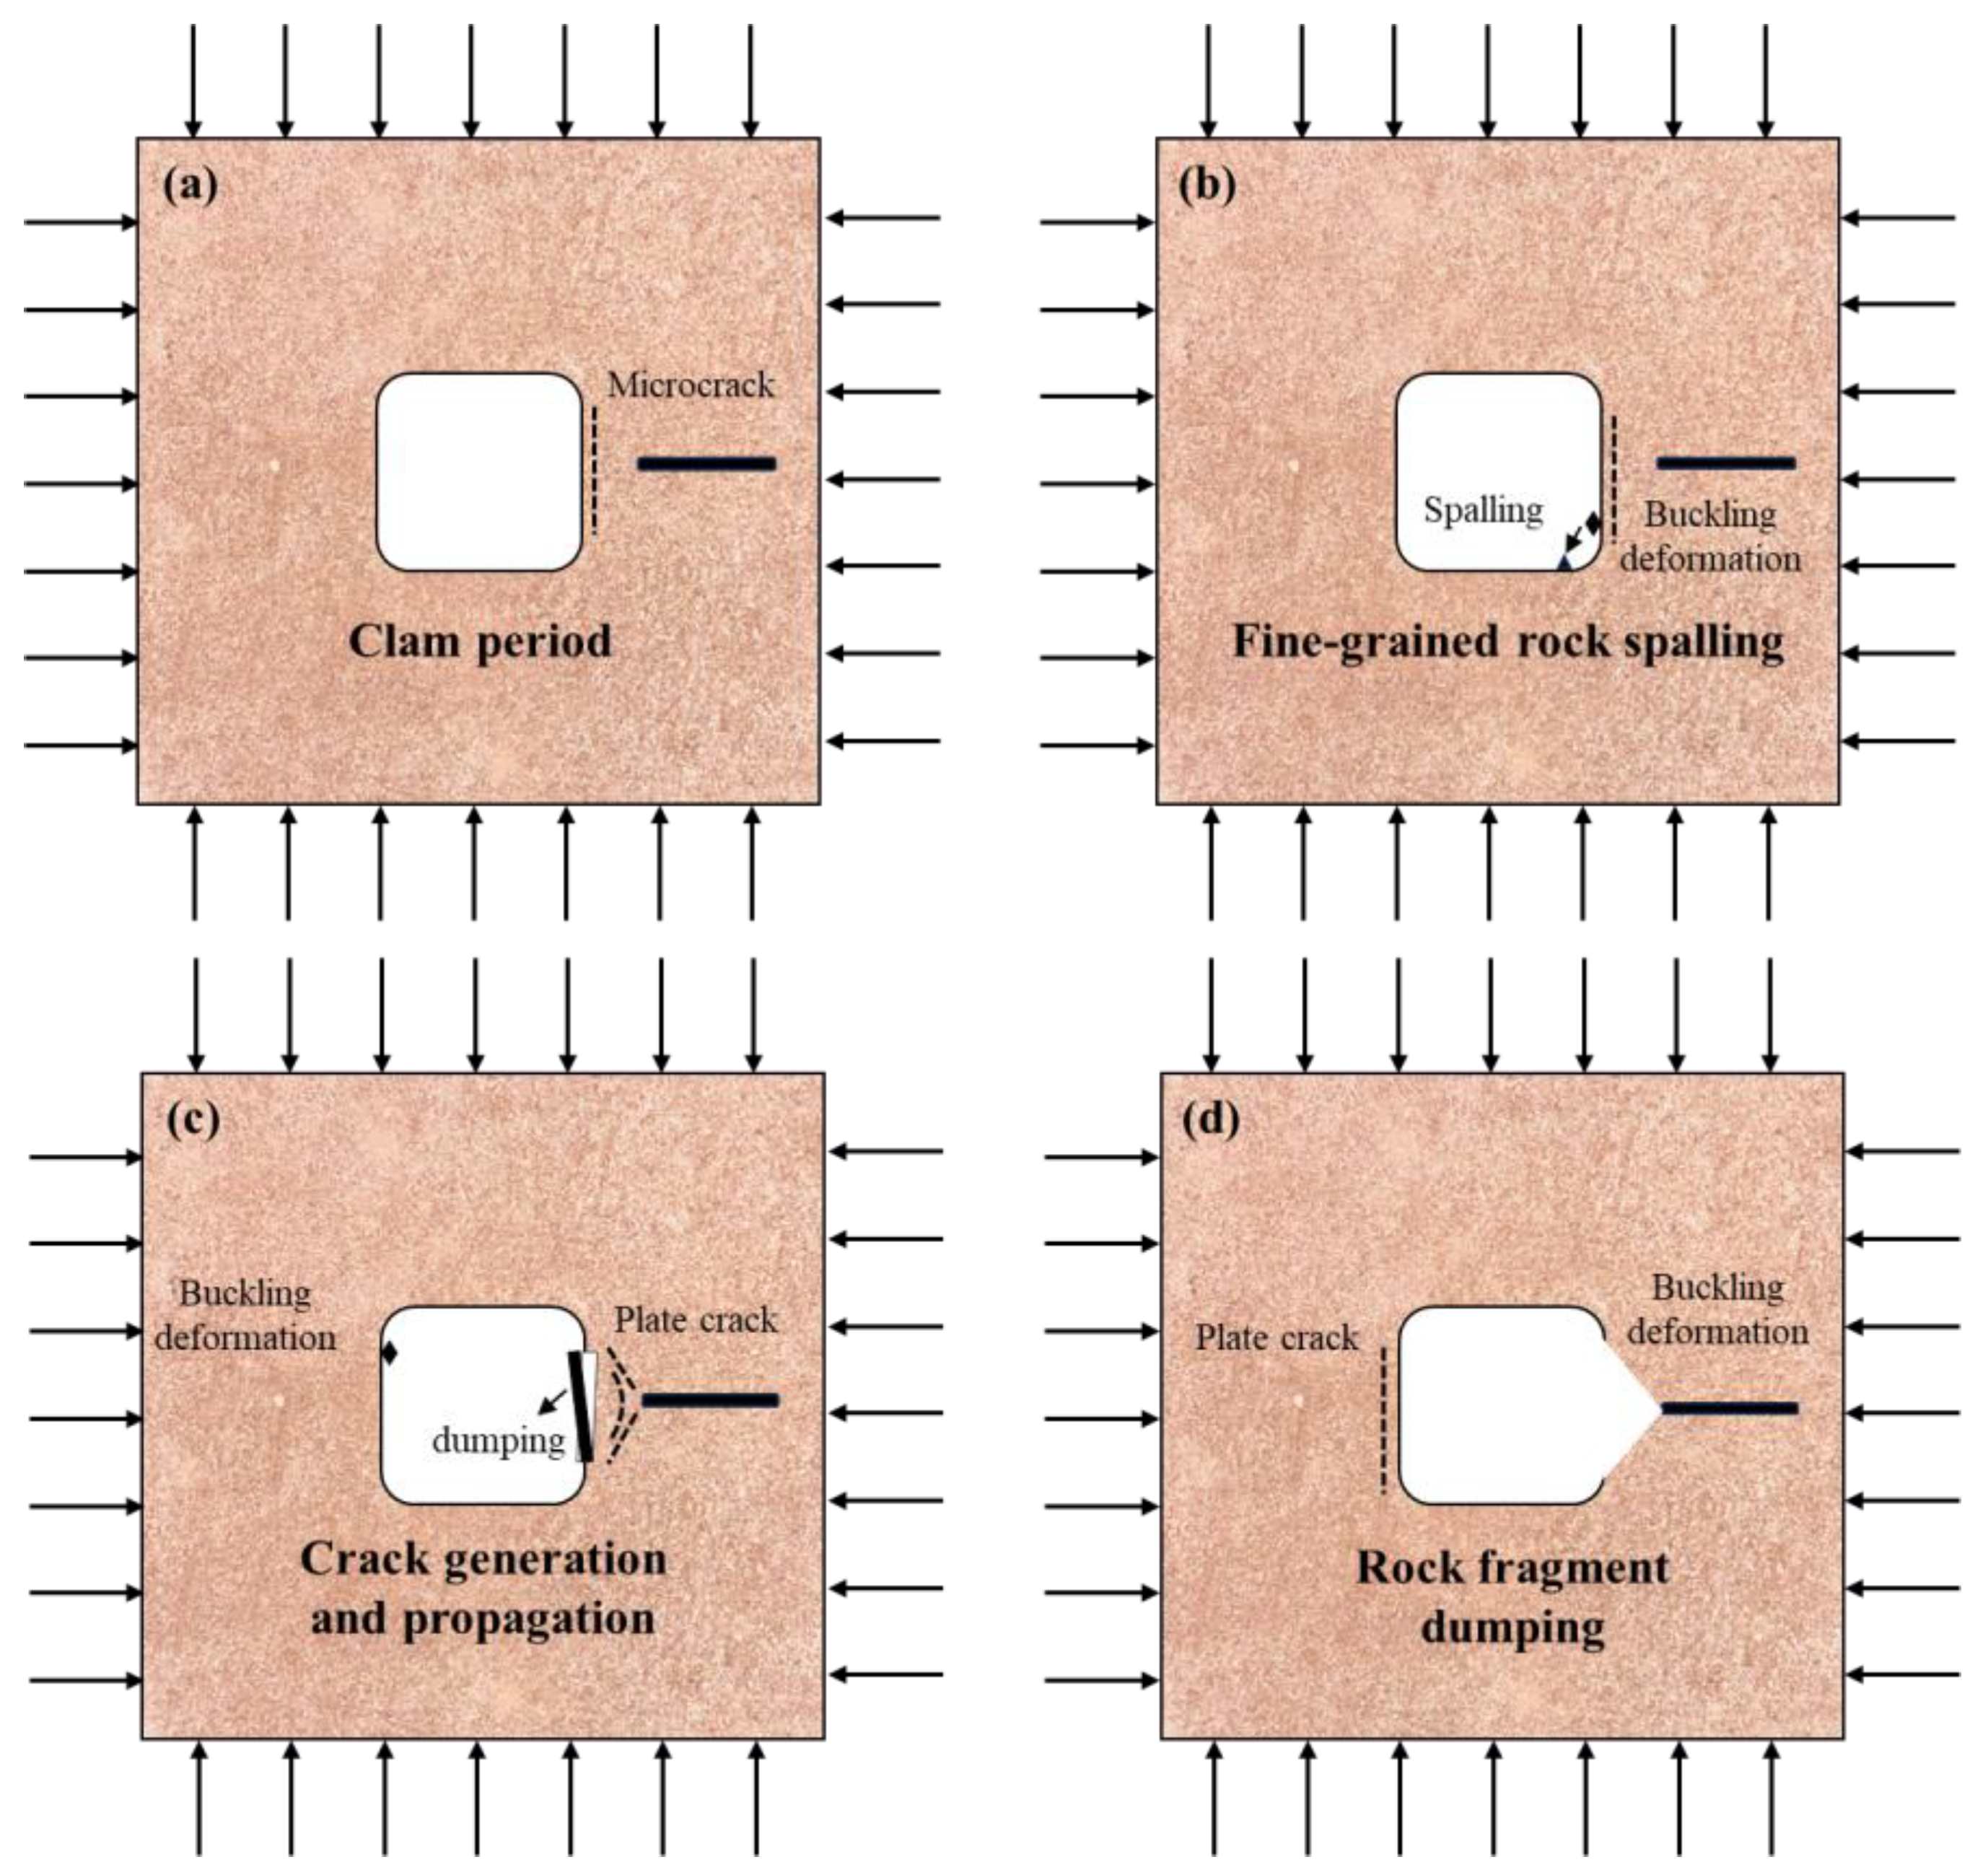
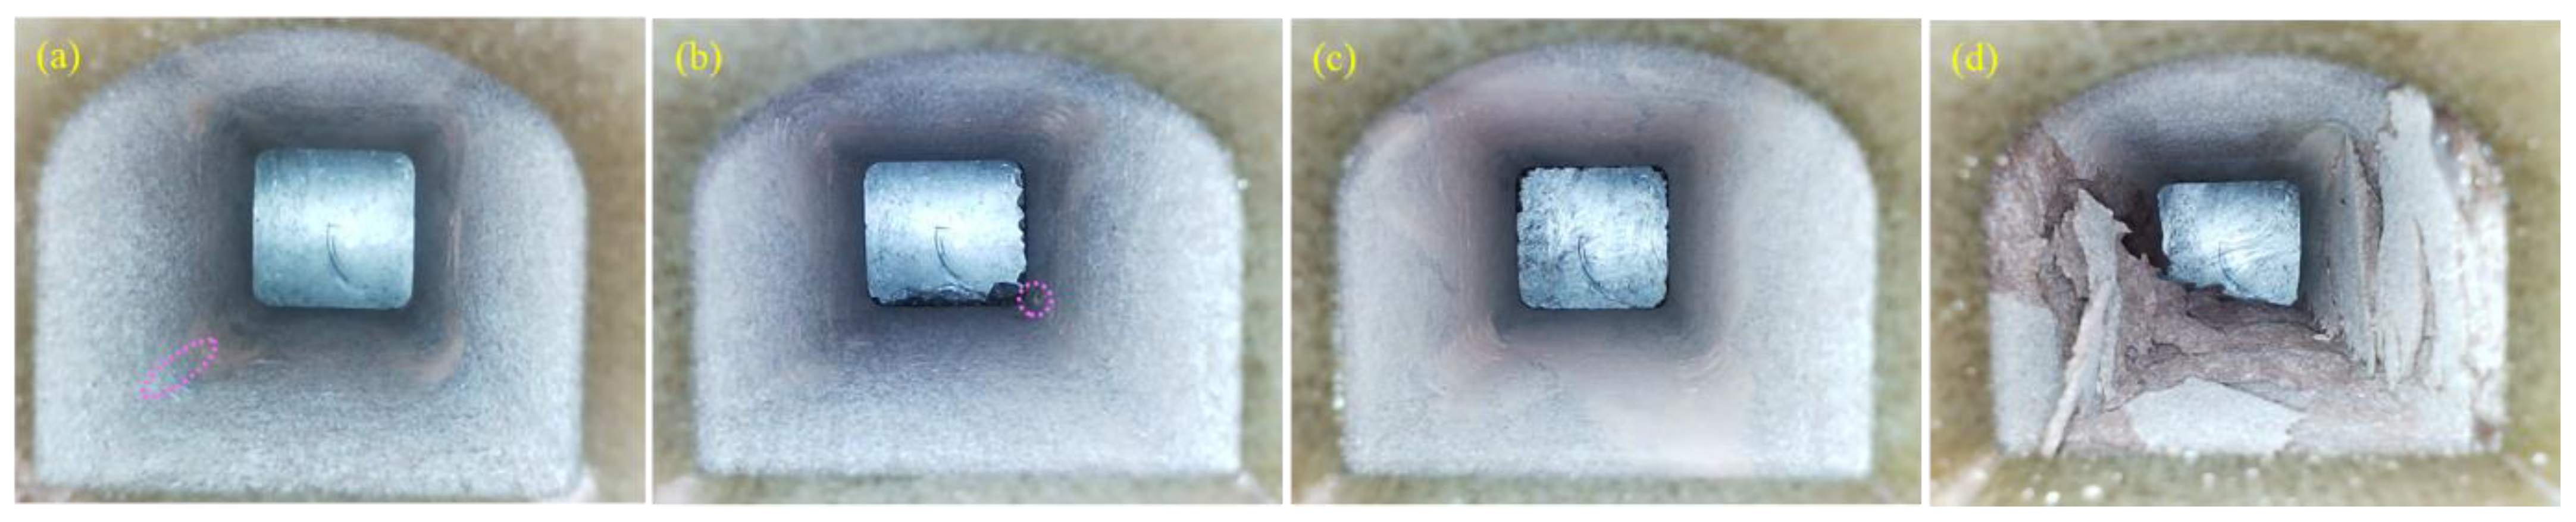
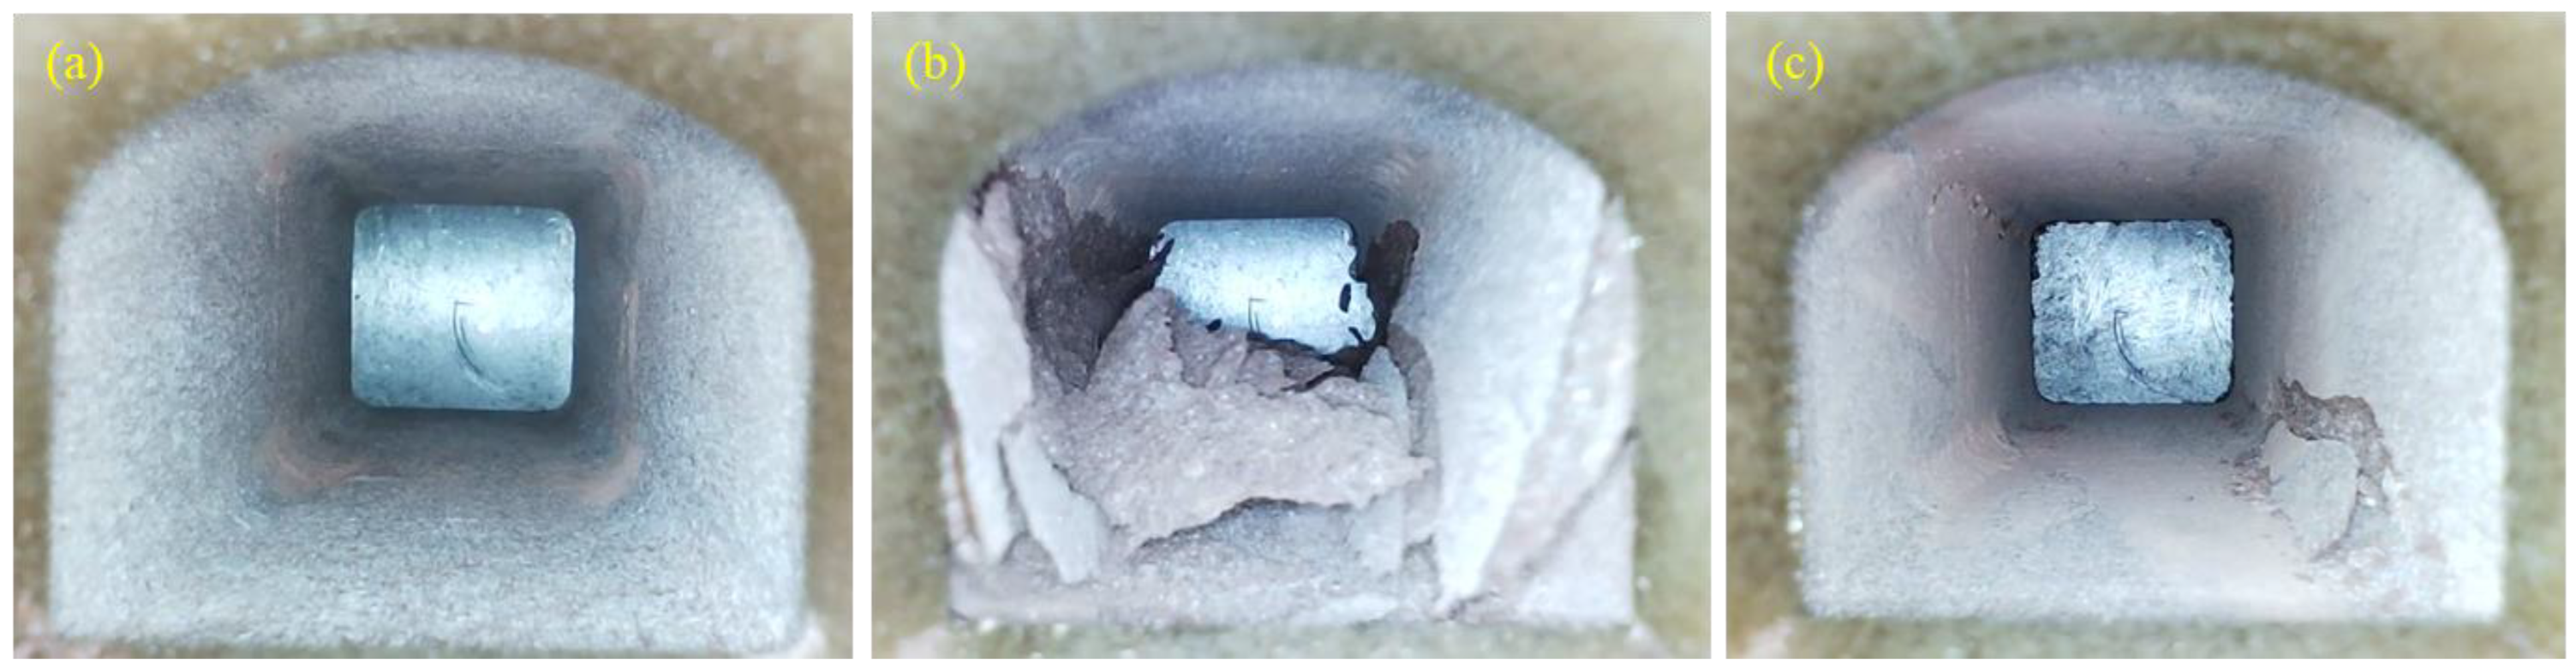
3.3. Spalling Failure Process

To facilitate the description of the internal failure phenomena within the rectangular tunnel, each part of the tunnel was named, as shown in Figure 9. Using the non-fissure sandstone specimen “S-0-0” and the sandstone specimen “S-0-50” as examples, the failure processes of the rectangular tunnels were analyzed. The complete failure process of specimen “S-0-0” is illustrated in Figure 9.
From 0 to 890.64 s, the specimen remained in a calm period with no significant damage to the sidewalls. At 890.64 s, σz = 47.50 MPa and fine particle spalling occurred in the lower-left-shoulder corner, as seen from the camera (Figure 10a). Between 890.64 s and 1563.12 s, σz increased to 64.00 MPa, causing the lower-left-shoulder corner to continue spalling along the positive X-axis. Buckling deformation occurred in the upper-left shoulder, accompanied by additional fine particle spalling (Figure 10b). After 94.32 s, σz rose further to 66.00 MPa, leading to buckling and the failure of the upper-left shoulder along the negative X-axis, forming a macroscopic axial crack (Figure 10c). From 1657.44 s to 1724.40 s, the vertical stress increased to 68.00 MPa. At 1669.32 s, the first macroscopic longitudinal crack formed from top to bottom, at one-fifth of the distance from the camera. At 1712.52 s, σz = 67.71 MPa and a second longitudinal crack formed at one-third of the distance from the camera, accompanied by substantial spalling (Figure 10d). From 1724.40 s to 1742.40 s, three layers of slab formed on the left sidewall. The first slab toppled at 1727.28 s, followed by the second slab at 1735.04 s. The third slab spalled at 1742.40 s (Figure 10e). From 1742.40 s to 1801.08 s, as σz continued to rise, the left arch rock near the camera experienced buckling and deformation, with additional slabs toppling. At 1801.08 s, the right sidewall began to fail as σz reached 70.00 MPa. Buckling occurred in the lower-right-shoulder conner (Figure 10f). The failure process in the lower-right shoulder mirrored that of the upper-left shoulder, with axial cracks forming along the positive X-axis, accompanied by fine particle spalling. A bottom–up longitudinal crack appeared at four-fifths of the way, and spalling between the crack and the loading block occurred at 1840.32 s (Figure 10g). From 1840.32 s to 1911.96 s, the axial crack in the lower-right shoulder continued to propagate along the negative X-axis, while longitudinal cracks formed bottom–up. As σz increased to 72.00 MPa, further spalling occurred between the cracks. At 1902.24 s, numerous cracks appeared on the right sidewall, and spalling completely penetrated along the sidewall (Figure 10h). At 1912.68 s, the specimen experienced violent failure, with a large number of particles ejected inside the rectangular hole, forming a “white mist” as the sandstone specimen completely failed.
The complete failure process of specimen “S-0-50” is illustrated in Figure 11. From 0 to 1188.72 s, the specimen remained in a calm state with no noticeable damage to sidewalls. At 1188.72 s, σz = 54.00 MPa, causing buckling and the deformation of rock particles at the center of the lower-right-shoulder corner (Figure 11a). It is important to note that this buckling occurred at the end of the unpenetrated fissure on the right side of the rectangular hole. Between 1188.72 s and 1244.16 s, σz increased to 56.00 MPa, and the buckling in the lower-right shoulder extended along the negative X-axis (Figure 11b). From 1244.16 s to 1381.68 s, the buckling deformation in the lower-right shoulder continued to expand in the negative X-direction. At 1381.68 s, with σz loaded to 59.14 MPa, fine particle spalling appeared at the center of the lower-right-shoulder corner (Figure 11c). From 1381.68 s to 1482.48 s, σz increased from 59.14 MPa to 62.00 MPa, causing more fine particle spalling in the lower-right shoulder. Two intersecting macroscopic axial cracks formed: one in the lower-right-shoulder corner and one at the right sidewall (Figure 11d). During the period from 1482.48 s to 1501.20 s, σz = 62.00 MPa, allowing for internal stress adjustment around the tunnel. At 1486.44 s, a rock slab from the right sidewall toppled. At 1501.20 s, the rock behind the upper-left-shoulder corner showed buckling and deformation (Figure 11e). Between 1501.20 s and 1563.12 s, σz was first loaded from 62.00 MPa to 64.00 MPa, causing buckling in the upper-left-shoulder corner along the negative X-axis, with a macroscopic axial crack forming at 1528.92 s. At 1561.32 s, σz = 64.00 MPa, and another rock slab toppled from behind the lower-right-shoulder corner, and a small section of rock from the upper-left-shoulder spalled in the form of fine particle ejection (Figure 11f). At 1562.40 s, violent failure occurred when the rock slab ejected from the right sidewall, resulting in significant damage. Notably, the spalling on the right sidewall occurred in two layers, with the first rock slab being relatively small (Figure 11g). At 1563.12 s, the rock slab toppled, and spalling penetrated axially, prompting the cessation of loading (Figure 11h).
Figure 12 and Figure 13 show the failure processes of specimens “S-0-25” and “S-0-100”, respectively. By comparing the failure processes of sandstone sidewalls under different fissure-penetration conditions, it was found that the failure progression was generally similar across varying conditions. The rectangular-hole sidewalls experienced a calm phase, followed by fine rock particle spalling, the generation and propagation of cracks, and ultimately sidewall spalling failure, during which an obvious V-shaped notch formed. However, with increasing fissure penetration, some differences were observed. As fissure penetration increased, the initial failure location moved from the left to the right sidewall. Additionally, the duration of each phase and the extent of final sidewall failure varied with the penetration degree. The time spent by sandstone specimens with different fissure penetration degrees in each stage is listed in Table 3.
It is evident that overall failure time decreased as fissure penetration increased, and the time spent in the calm stage initially increased and then decreased with increasing fissure penetration. This trend was also reflected in the time points of failure and initial failure stress, as the loading path was consistent in this experiment. During the fine particle spalling stage, the time spent in this stage first decreased and then increased as fissure penetration increased. Possible reasons include the following: A shorter calm period means less time for elastic strain energy to accumulate, so when the failure enters stage 2, energy is transferred in the surrounding rock due to fine particle spalling, preventing sufficient energy accumulation to cause new damage. This cycle repeats, causing specimens with shorter calm periods to spend more time in stage 2. Prefabricated fissures weaken the sandstone specimens. As fracture penetration increases, the overall failure time decreases, shortening the time in stage 2. Under identical stress conditions, rock strength is higher at low fissure penetration, the duration of sidewall damage is longer, and the overall degree of damage is lower. With fewer paths for strain energy transfer in the surrounding rock, initial sidewall failure occurs earlier, accumulating more strain energy. This results in more intense slab cracking, manifesting as rockburst phenomena.
In contrast, with high fissure penetration, the rock strength is lower, the sidewall failure occurs more quickly, and the V-shaped notch area formed during failure is larger. The surrounding rock has more paths for elastic strain energy transfer, causing the initial sidewall failure to occur later.

4. Discussion

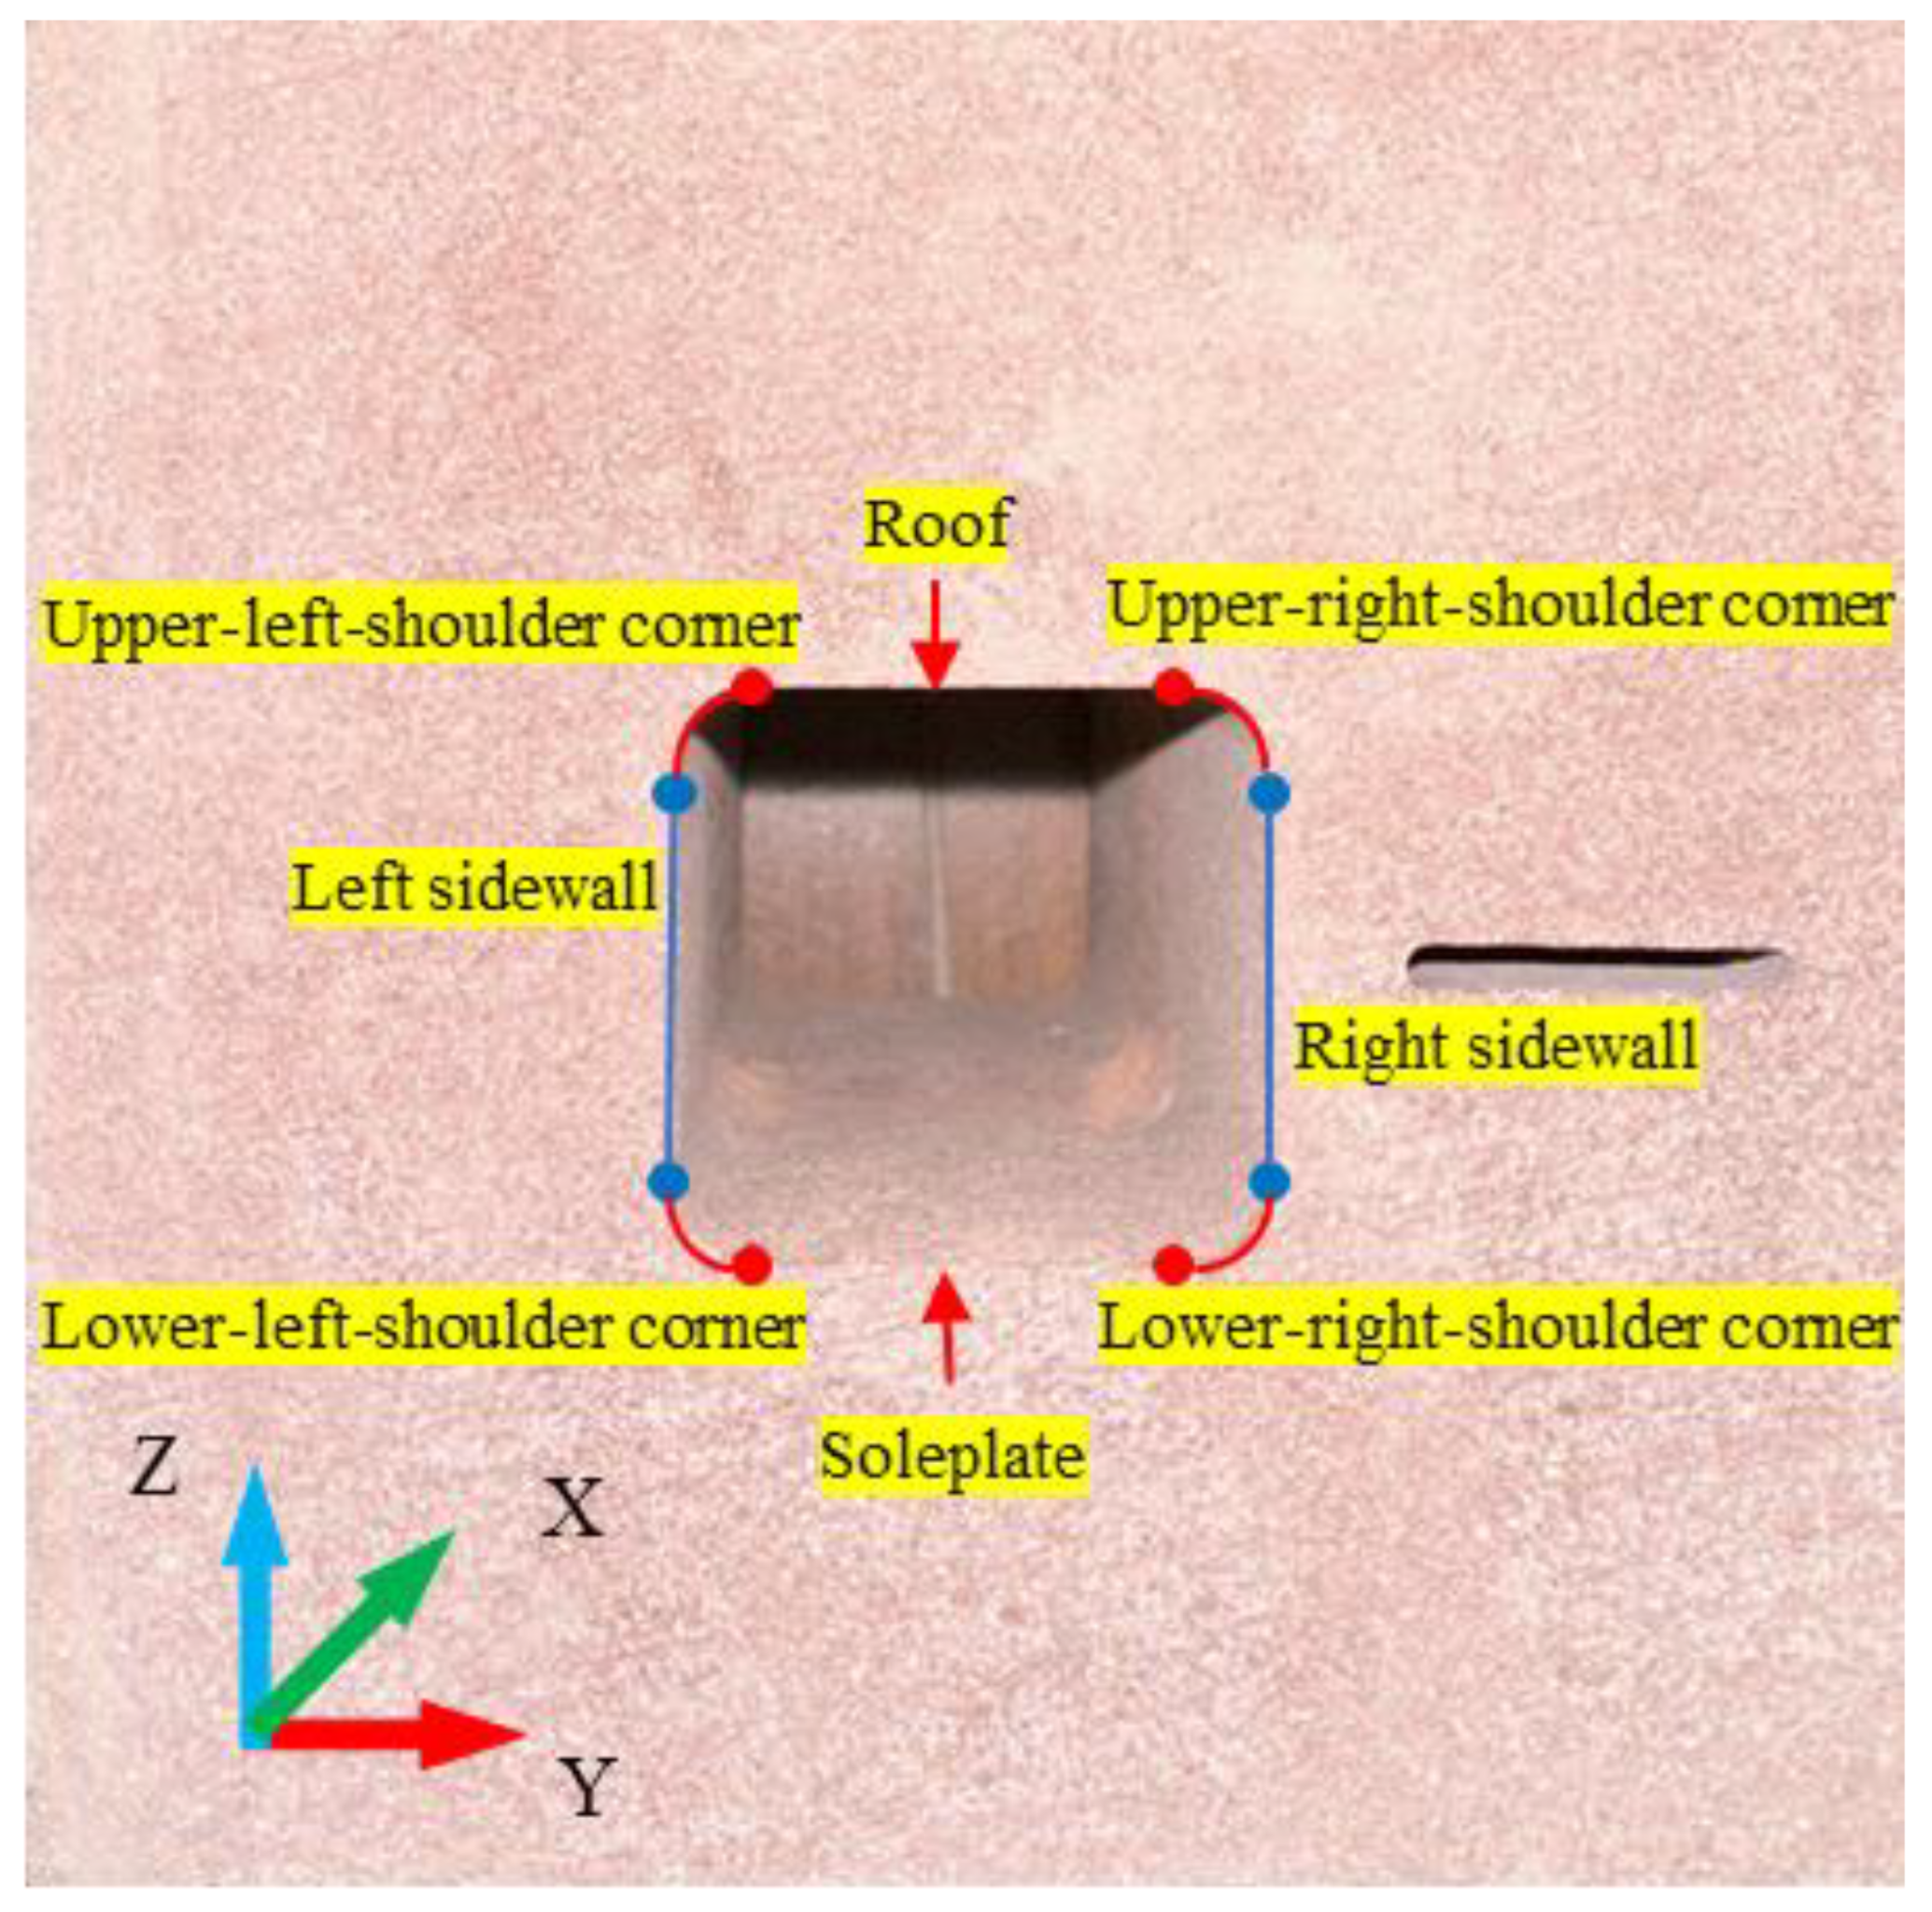
4.1. Effect of Fissure Penetration on Sidewall Failure

4.1.1. Sidewall Failure Process

In underground engineering, under three-dimensional stress conditions, tunnel sidewall failure processes can vary due to changing geological conditions. Using acoustic emission probes and video monitoring equipment, signals from the surrounding rock were observed for sandstone specimens with different fissure penetrations. Taking specimen “S-0-0” as an example, the sidewall failure of the surrounding rock occurred in four stages, as illustrated in Figure 14.
Calm Stage: In this initial phase, no visible changes occurred in the tunnel’s surrounding rock. As vertical stress rose, energy built up in the rock, causing microscopic cracks not visible to the naked eye. This occurred because the shallow tensile strain of the sidewall exceeded the deep tensile strain (Figure 15a).
Fine Particle Spalling Stage: In this stage, fine rock particles in the upper-left shoulder began to buckle and spall from the surrounding rock, either due to gravity or projectile ejection when stress exceeded a threshold. Microscopically, this phase was marked by the branching and unstable expansion of micro-fissures in the surrounding rock (Figure 15b).
Crack Generation and Propagation Stage: As vertical stress rose, spalling in the upper-left shoulder intensified, resulting in the development of macroscopic axial fissures. Internally, stress in the surrounding rock adjusted, and cracks extended along the axial direction. Simultaneously, longitudinal cracks formed, microscopically penetrating the surface and deeper layers of the sidewall, damaging the rock structure (Figure 15c).
Rock Slab Spalling and Failure Stage: In the final stage, longitudinal and axial cracks intersected, causing rock slabs to deform and fail under radial compression and gravity. This resulted in the toppling of rock slabs in a layered fashion, progressing from shallow to deeper layers. The rock slabs gradually narrowed, creating a distinct V-shaped notch (Figure 15d), which aligns with the findings in ref. [46]. At the conclusion of this stage, stress concentrations shifted to the right sidewall. Following these four stages, both sidewalls of the surrounding rock underwent axial penetration, indicating large-scale failure in the sandstone specimen.
When prefabricated fissures were introduced, they compromised the structural integrity of the right sidewall, increasing its susceptibility to damage. Consequently, during the first stage, the compaction and development of micro-fissures were primarily concentrated on the right sidewall (Figure 16a). In the second stage, initial buckling deformation moved from the upper-left to the lower-right shoulder, with rock particle ejection noticeably reduced relative to the non-fissure specimen “S-0-0” (Figure 16b). During the third stage, the prefabricated fissure tip quickly propagated towards the upper ends of the spalling rock slab on the right side of the rectangular hole, leading to slab fissure failure on the right sidewall (Figure 16c). This resulted in a larger failure area during the fourth stage, forming a more pronounced V-shaped notch (Figure 16d). Throughout the entire failure process, the addition of fissures reduced the overall strength of the sandstone specimen compared to non-fissure specimens. As a result, the failure of the left sidewall began earlier, at the end of the third stage (whereas in the non-fissure specimen “S-0-0”, this occurred at the end of the fourth stage). This shift in failure timing became more pronounced as the degree of fissure penetration increased.

4.1.2. Influence of Fissure Penetration on Tunnel Stability

Discontinuities such as fissures and joints significantly impact tunnel stability. Under specific in situ stress conditions, varying fissure penetrations cause significant differences in stress distribution, affecting the deformation and failure mechanisms of the tunnel walls. Table 4 presents the initial vertical failure stress (σzi) and peak vertical failure stress (σzp) for the sidewall of the rectangular tunnel at varying fissure penetration levels. The initial failure vertical stress (σzi) increased and then decreased with fissure penetration, reaching its peak at 50%. The reasons for this behavior are outlined below.
First, in the early stages of sidewall failure, while the presence of non-penetrating fissures reduced the overall strength of the specimen, the sandstone specimen with fissures (S-0-25, S-0-50) provided a new release path for elastic strain energy. This path was created by the non-penetrating fissures on one side of the rectangular hole. Consequently, when fissure penetration was low (0–50%), the vertical stress σzi increased as fissure penetration grew. The presence of non-penetrating fissures contributes to improving the initial failure point of rectangular tunnels, which helps suppress initial failure in rock mass engineering.
Second, the peak failure vertical stress (σzp) generally decreased as fissure penetration increased. Specimen “S-0-100” showed a significant drop in peak strength, indicating that when the fissure fully penetrated one side of the rectangular hole, the sandstone’s structural integrity was compromised. This resulted in a large reduction in the load-bearing capacity, significantly lowering the initial failure stress (σzi).
The trends in initial and peak failure vertical stress as a function of fissure penetration are shown in Figure 17. Detailed analysis reveals that the variation amplitude of both initial and peak failure vertical stress increased with fissure penetration. This indicates that the sensitivity of these stresses to fissure penetration grew progressively, which aligns with the findings of Chen et al. [46] and Yang et al. [40] regarding the relationship between crack length and failure degree. A similar conclusion can be drawn by comparing the failure times of sandstone specimens “S-0-25” and “S-0-50”.
Figure 18 compares the sidewall failure of all specimens at σz = 50 MPa, the highest stress level observed in specimen ‘S-0-100’, to analyze the effect of fissure penetration on tunnel stability. Figure 18d shows that at a vertical stress of 50 MPa, both the left and right sidewalls of specimen ‘S-0-100’ underwent complete axial failure. The left wall developed three distinct layers of rock slab, which spalled off sequentially from outer to inner layers. In contrast, the right sidewall formed only a single rock slab, which had not yet toppled following the failure. By comparison, the failures in the other specimens were less significant. Specimen “S-0-0” exhibited minor rock spalling in the lower-left shoulder (Figure 18a), while specimen “S-0-25” showed localized fine particle spalling in the lower-right shoulder (Figure 18b). Notably, specimen “S-0-50” showed no visible signs of failure at 50 MPa (Figure 16c).
At 62.00 MPa, the maximum stress level for specimen ‘S-0-25’, the sidewall failure in this specimen changed significantly. (Figure 19b). The left and right sidewalls, including their backs, showed lamination from outside to inside, while the rock slab near the crack on the right sidewall was thicker and remained partially intact. In contrast, the failure in specimen “S-0-0” showed no notable change compared to the previous stage (Figure 19a). However, in specimen “S-0-50”, spalling occurred under the right sidewall (Figure 19c), with cracks forming in the upper-left shoulder, indicating a marked difference in damage across the three rectangular holes. These observations demonstrate that the presence of fissures reduced the stability of the rectangular tunnels, with fully penetrated fissures resulting in the poorest stability. This conclusion is further supported by the reduction in peak failure stress in the sandstone specimens.

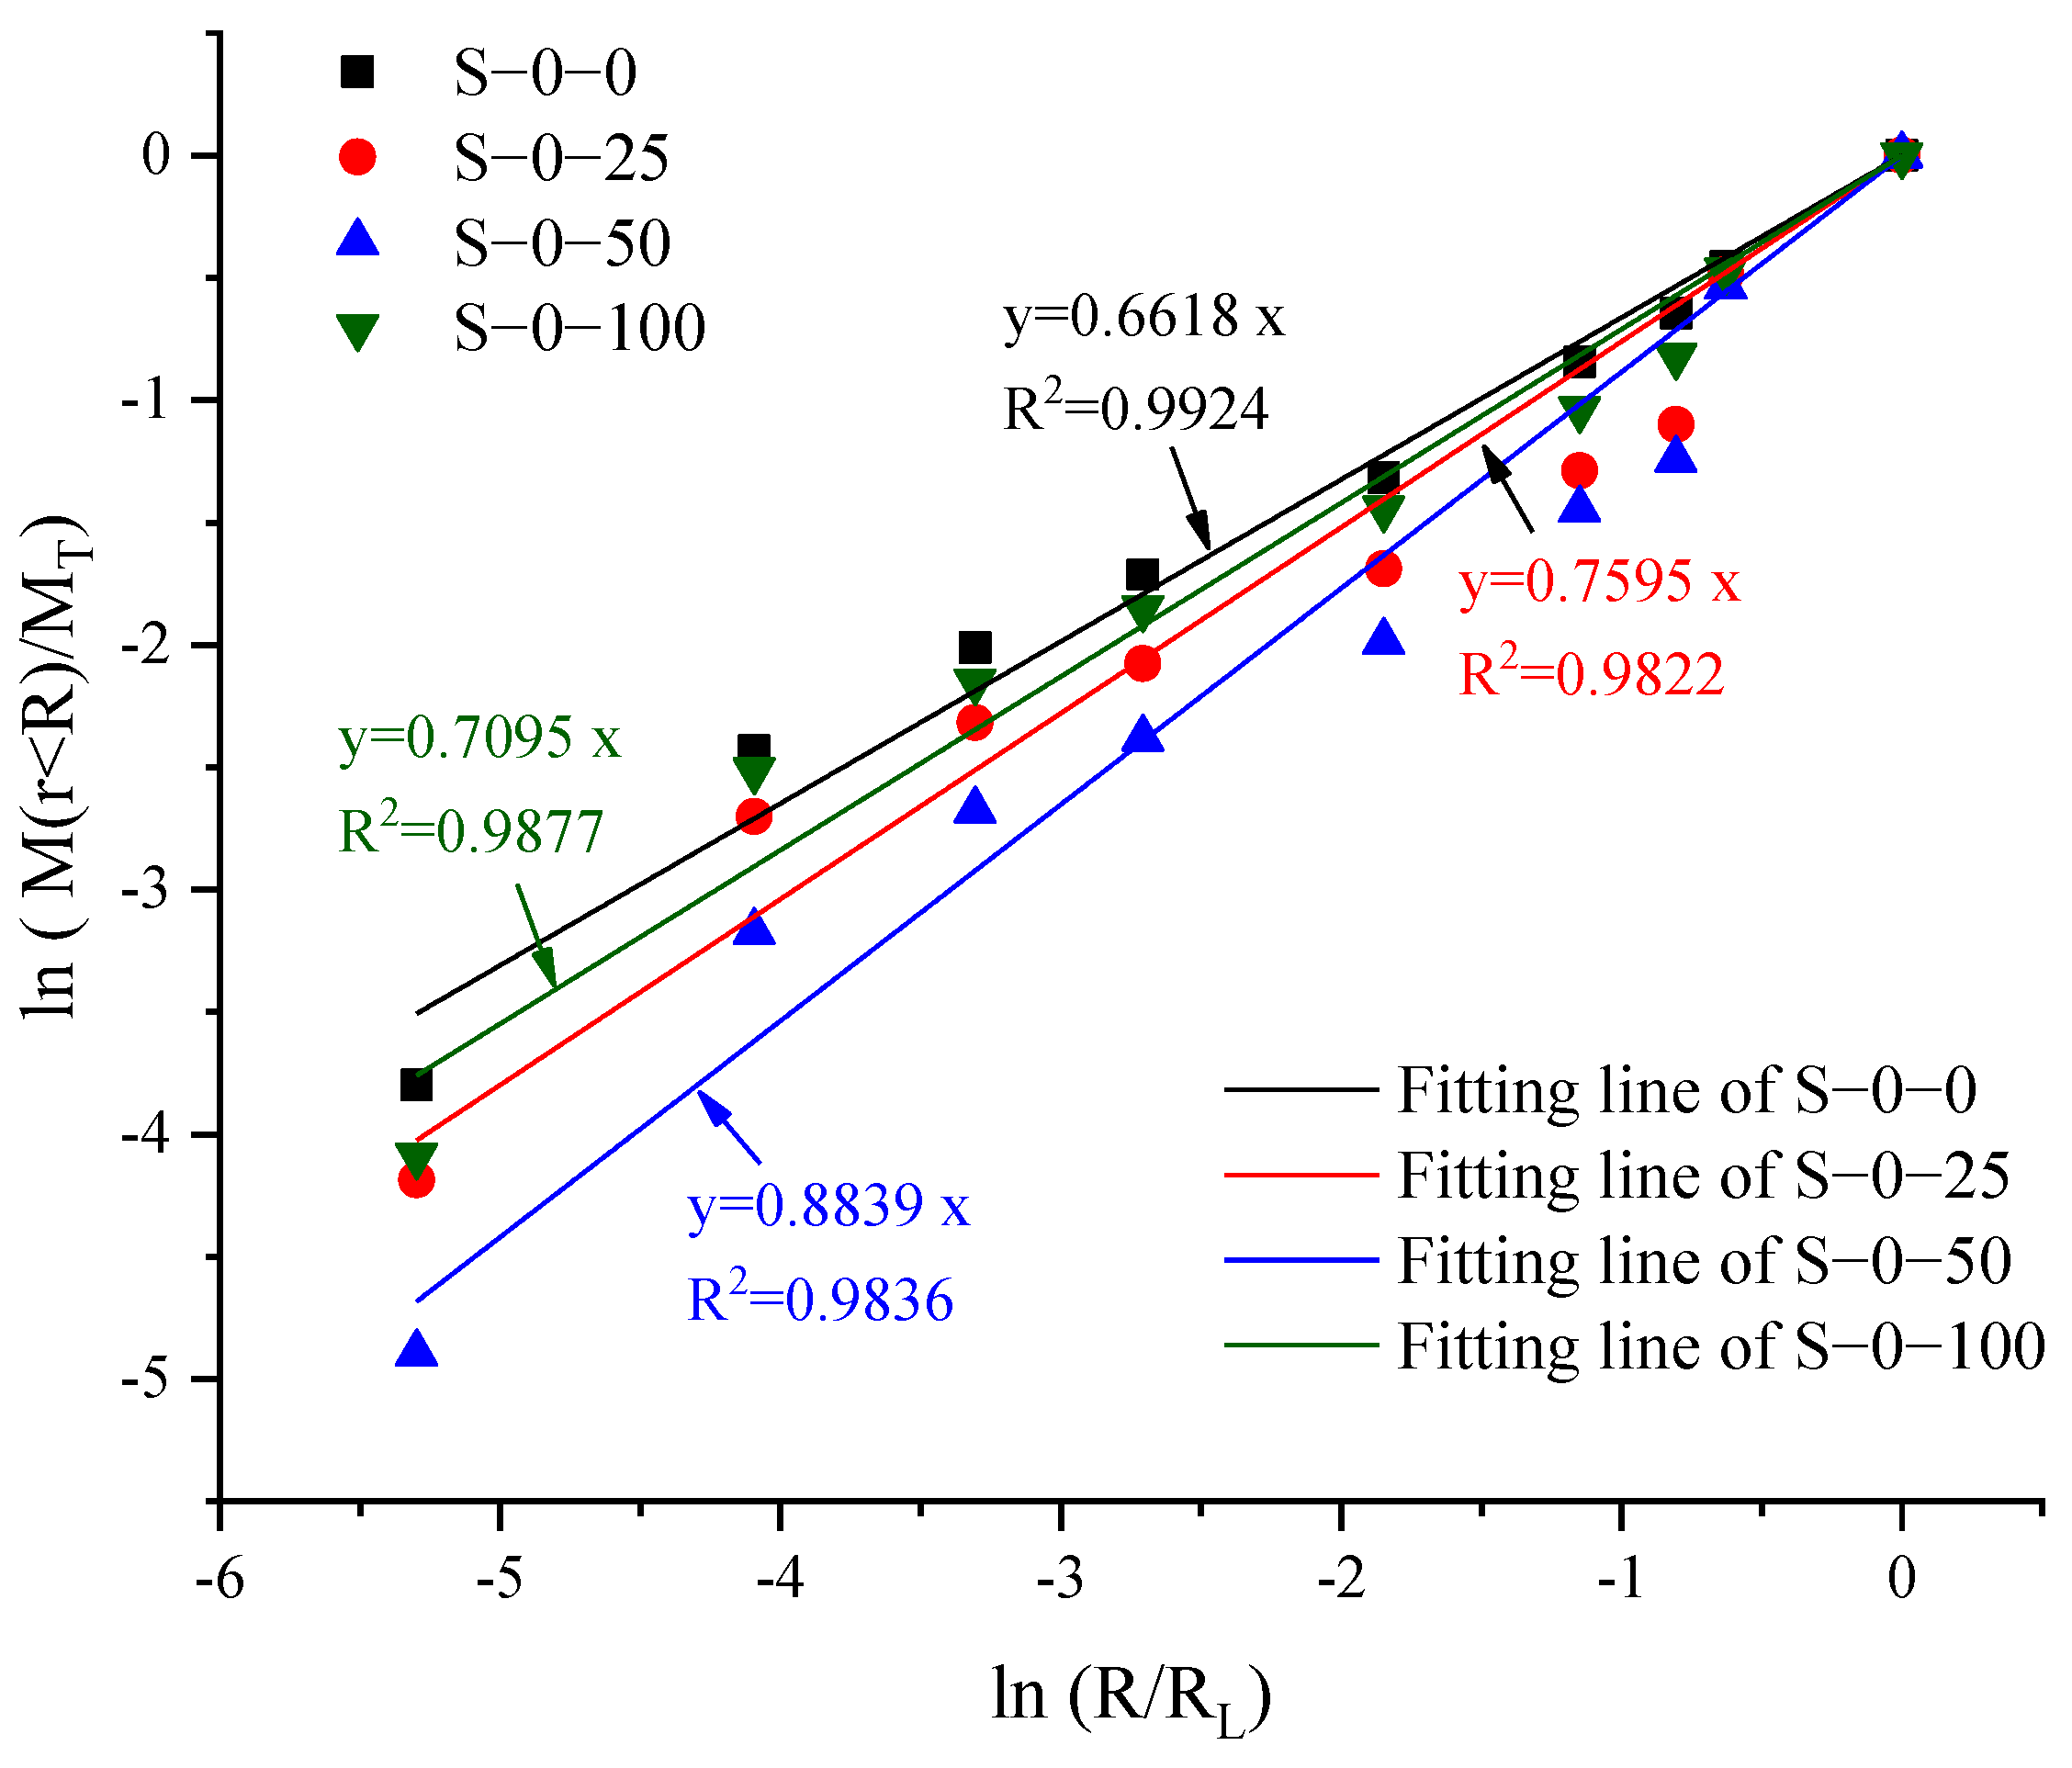
4.2. Effect of Fissure Penetration on Rock Fragment Characteristics

Fractal theory offers a fresh approach to studying crack propagation and damage evolution in rocks and is extensively applied in mining engineering. In this study, to examine the rock chips produced during the sidewall failure of rectangular tunnels under varying fissure penetration conditions, fractal theory was applied to investigate the fine particles and chips generated. Based on fractal theory [41], the mass ratio of cuttings with a diameter, r, smaller than R to the total mass generated during failure is given by Equation (2):
M ( r < R ) M T = ( R R L ) 3 D
Taking the natural logarithm of both sides of Equation (2) yields Equation (3):
ln ( M ( r < R ) M T ) = ( 3 D ) ln ( R R L )
where r represents the particle size of the rock particles, R denotes the selected sieve size, D is the fractal dimension, M is the mass of particles smaller than R, MT is the total mass of the cuttings, and RL is the diameter of the largest sieve. Initially, rock chips generated from sidewall failure in various specimens were passed through sieves of different sizes. The sieved chips are shown in Figure 20. The mass of chips in each size range was measured, and the results are provided in Table 5.
From the figure, it can be seen that as fissure penetration increased, rock slices with particle sizes greater than 8.00 mm changed from elongated strips to block-like shapes, with a decreasing length-to-width ratio. When the particle size was less than 8.00 mm, the rock chips were primarily block-like, with little difference in length and width. According to the video monitoring, larger rock blocks mainly originated from the surface of the sidewall during the first stage of plate fissure failure. As plate fissure failure progressed, the particle size of the rock chips decreased, with chips in the 4.75 mm-to-8.00 mm range coming from deeper rock layers. The smallest chips mainly originated from the deeper sections of the V-shaped trough.
Comparing the experimental results for various fissure penetration levels, the rectangular hole of specimen “S-0-0” exhibited the most severe failure, producing the largest quantity and mass of rock blocks. As fissure penetration increased, the failure degree and the quantity and quality of rock chips produced by the sidewalls gradually decreased.
By applying Equation (3) to the data in Table 5, the fractal dimension D was calculated for each fissure-penetration condition, with the fitting results shown in Figure 21. From Equation (3), the slope of the linear fit is 3−D and the intercept is 0. The fractal dimensions for specimens “S-0-0”, “S-0-25”, “S-0-50”, and “S-0-100” were 2.3382, 2.2405, 2.1161, and 2.2905, respectively. This indicates that fractal dimension D initially increased and then decreased with increasing fissure penetration.

4.3. Guidance for Deep Underground Engineering

In this study, the presence of fissures caused the intensity of rock spalling failure (rockburst) and the size of large fragments to initially decrease and then increase, offering a new approach for controlling deep surrounding rock slab cracking (rockburst). Yu et al. [42] conducted true triaxial compression tests on sandstone specimens with and without concrete support, showing that concrete helps restrain tunnel failure. Zhou et al. [43] performed uniaxial compression experiments on high-strength gypsum models using prestressed anchors made of aluminum rods. The results indicated that prestressed anchors improved the specimen’s internal stress, inhibited fissure propagation, and bonded split rock slabs, enhancing their bending stiffness and preventing buckling deformation. Similarly, Wang et al. [47] investigated the effect of bolt diameter on the failure behavior of intact brittle rock under uniaxial compression using laboratory model tests. Their findings showed that bolts changed the failure mode of brittle rock from splitting to shear by inhibiting internal crack propagation. Numerous engineering practices have also demonstrated that anchor support technologies—such as anchor spray, anchor net support, and anchor net spray—are effective in controlling deep rock mass instability and failure.
These findings suggest that excavating energy-release grooves on tunnel sides could reduce rock slab cracking failure (rockburst) intensity and improve the safety and stability of deep underground tunneling projects. Additionally, as fissure penetration increases, the failure strength of the surrounding rock in rectangular tunnels decreases. Fissures enlarge and deepen V-shaped notches on adjacent tunnel sidewalls, reducing plate fissure failure but significantly weakening the surrounding rock’s load-bearing capacity. Controlling the excavation boundary to mitigate stress concentration may be another effective strategy for ensuring the safety of deep mining operations.

5. Conclusions

(1)
The failure of the sidewall of the non-fissured sandstone test can be divided into four stages: the calm stage, the spalling stage of fine rock particles, the generation and expansion stage of the sidewall cracks, and the buckling deformation and failure stage of the sidewall rock chips. As fissure penetration increased, the initial failure location of the tunnel sidewall shifted toward the fissured side, and the number of rock slabs resulting from slab cracking decreased.
(2)
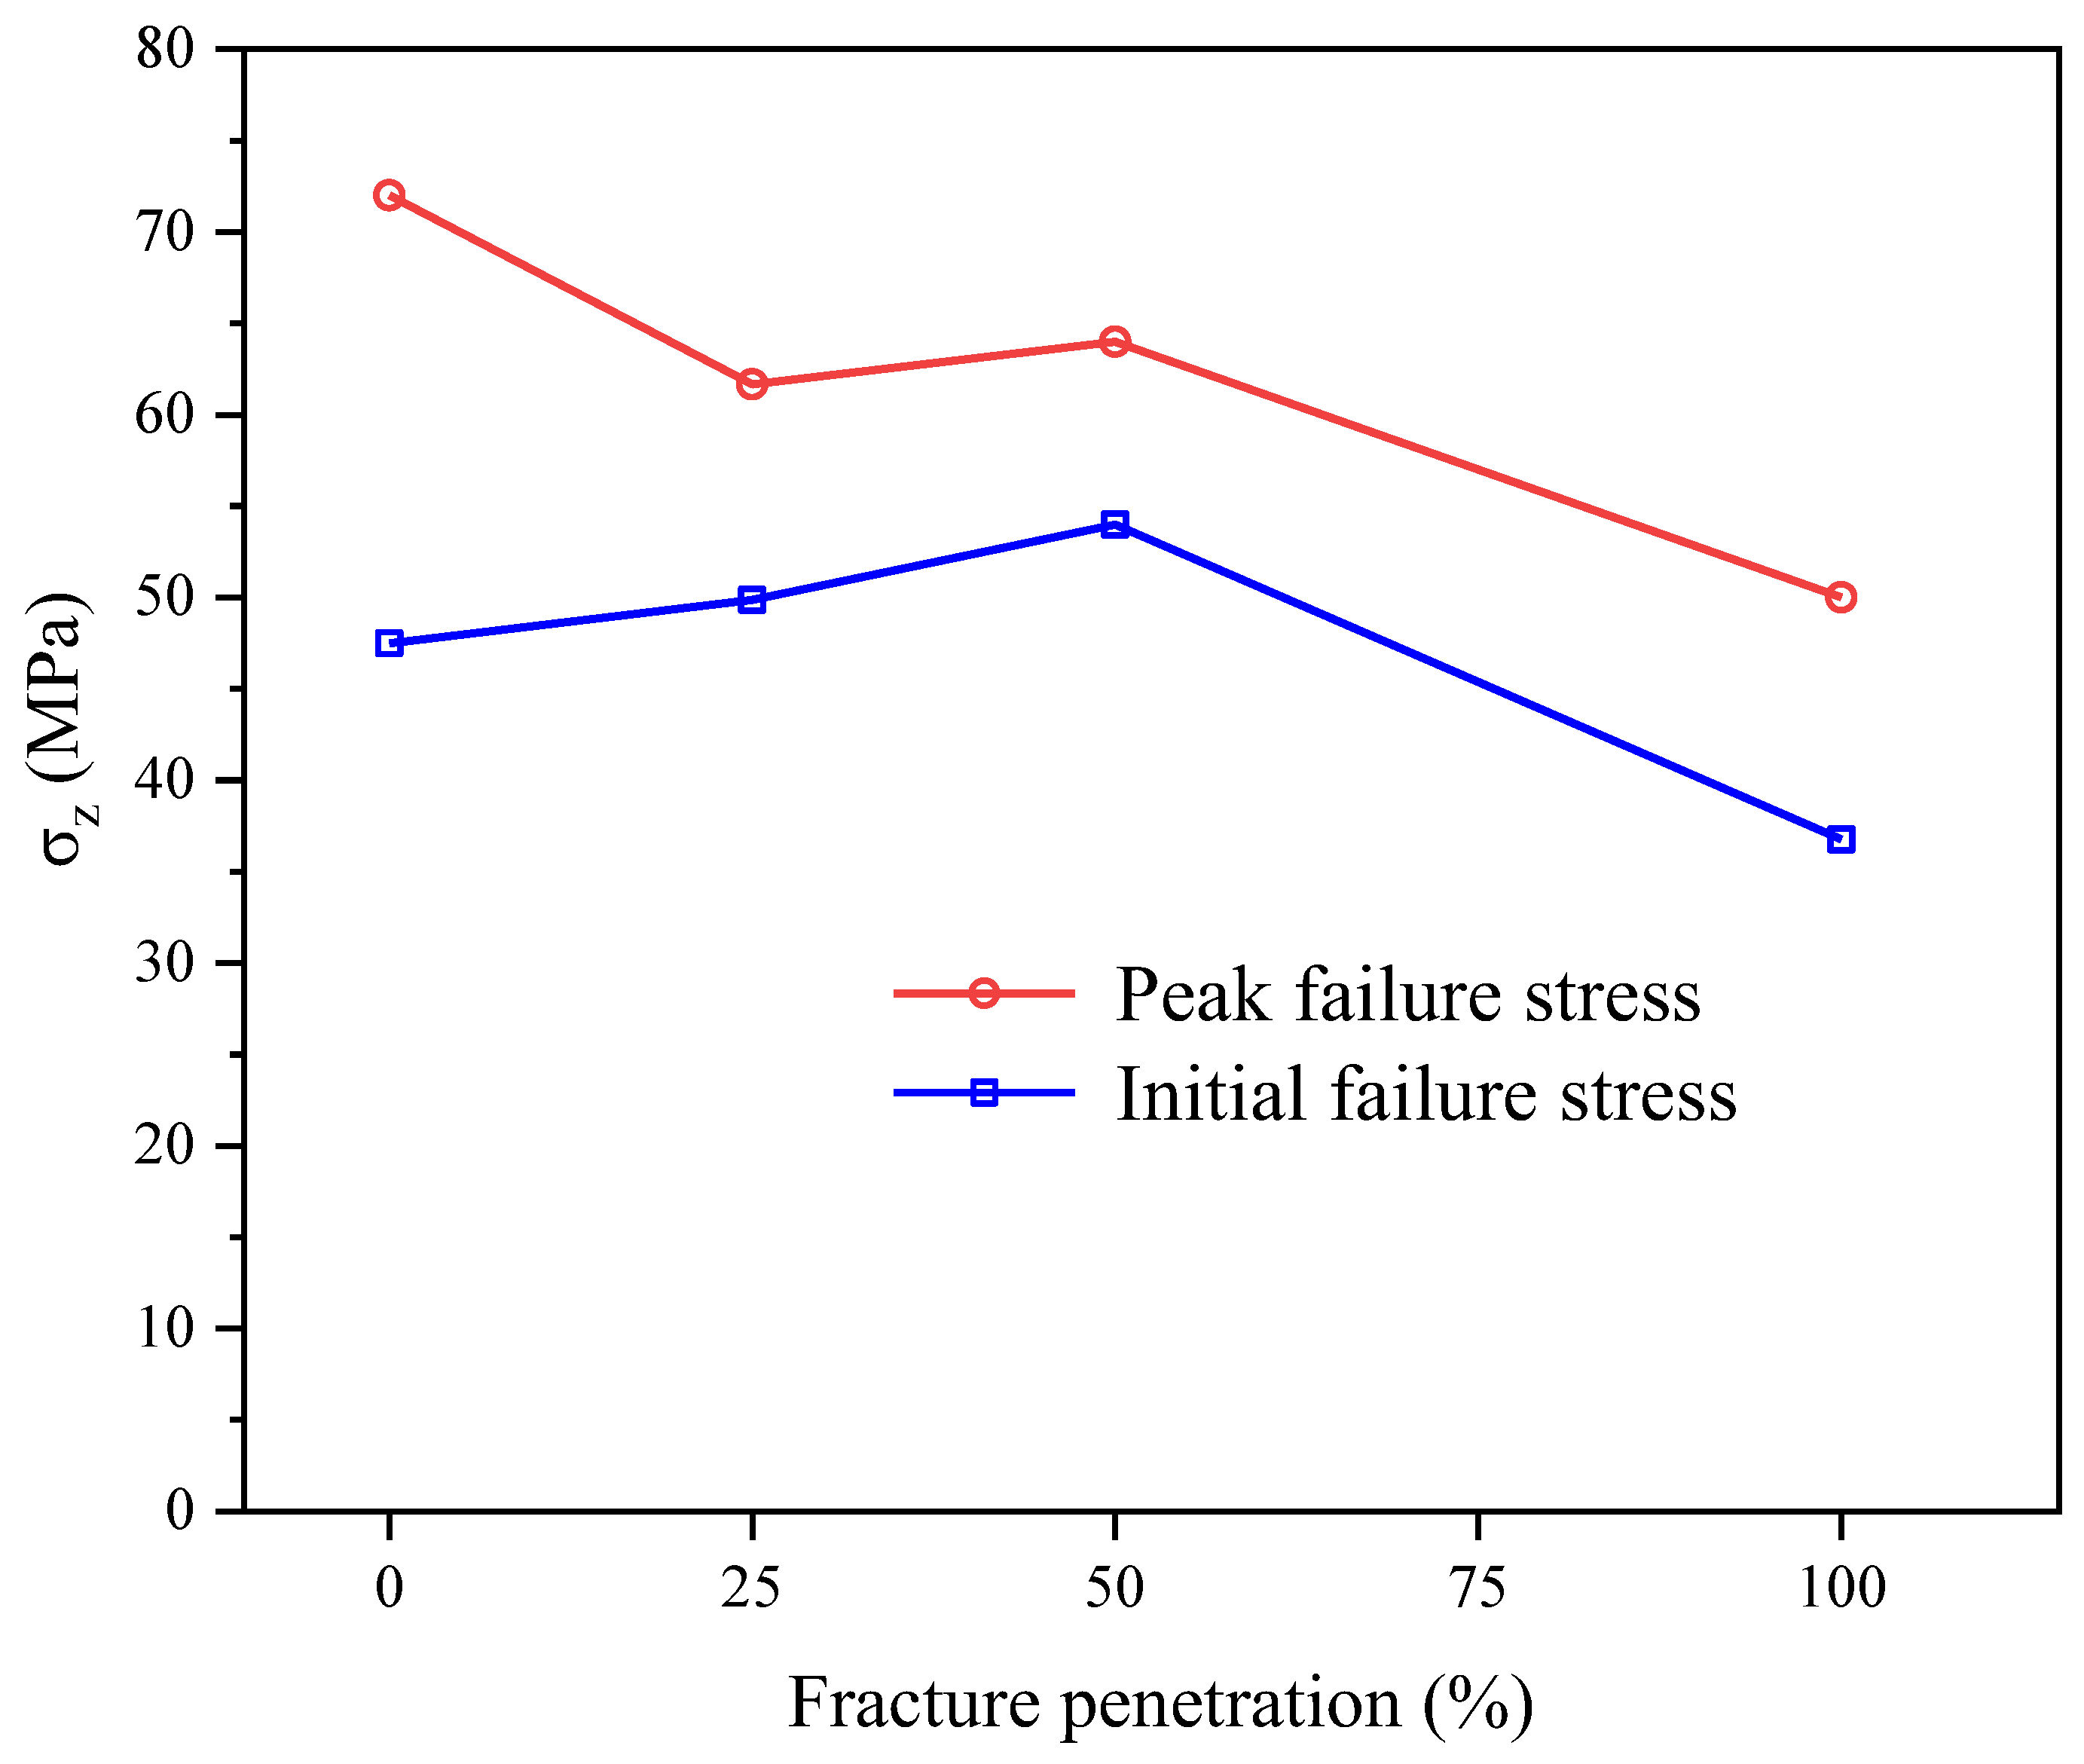
As fissure penetration increased, the initial failure stress σzi first rose and then decreased, while the peak failure stress σzp consistently decreased, indicating that fissures weakened the surrounding rock’s strength. This also made it more difficult for the surrounding rock to experience initial failure under medium fissure penetration.
(3)
The presence of fractures altered the particle size distribution of rock fragments. As fissure penetration increased, the number of larger rock blocks decreased, and the distribution became more block-like. Additionally, fracture penetration significantly impacted the fractal dimension of the rock, with lower penetration resulting in a higher fractal dimension in the rock fragments. When fissure penetration is high, it is necessary to reinforce support and control excavation boundaries to reduce stress concentration.

Author Contributions

Conceptualization, J.Z. and S.L.; methodology, J.Z.; software, M.J.; validation, M.J., S.L. and K.L.; formal analysis, J.Z.; investigation, J.Z.; resources, K.P.; data curation, J.Z.; writing—original draft preparation, J.Z.; writing—review and editing, K.P.; visualization, K.L.; supervision, K.P.; project administration, K.P.; funding acquisition, K.P. All authors have read and agreed to the published version of the manuscript.

Funding

This research was funded by the National Natural Science Foundation of China grant number No. 52474120, the National Key Research and Development Program of China—2023 Key Special Project grant number No. 2023YFC2907400, Science and Technology Innovation Program of Hunan Province grant number No. 2022RC1173. And the APC was funded by the National Natural Science Foundation of China.

Institutional Review Board Statement

Not applicable.

Informed Consent Statement

Not applicable.

Data Availability Statement

The raw data supporting the conclusions of this article will be made available by the authors on request.

Conflicts of Interest

The authors declare no conflict of interest.

References

  1. Ortlepp, W.D.; Stacey, T.R. Rockburst mechanisms in tunnels and shafts. Tunn. Undergr. Space Technol. 1994, 9, 59–65. [Google Scholar] [CrossRef]
  2. Fairhurst, C.; Cook, N.G.W. The phenomenon of rock splitting parallel to the direction of maximum compression in the neighborhood of a surface. In Proceedings of the First Congress on International Society of Rock Mechanics, Lisbon, Portugal, 25 September–1 October 1966; Volume 1, pp. 687–692. [Google Scholar]
  3. Peng, K.; Zhang, Y.; Wang, Y.; Luo, S. Static compression behavior and strength weakening mechanism of dynamically damaged granite after water soaking. Eng. Fail. Anal. 2024, 156, 107760. [Google Scholar] [CrossRef]
  4. Peng, K.; Ren, J.; Wang, Y.; Luo, S.; Long, K. Mechanical and damage evolution characteristics of granite after heating-cooling cycles. J. Cent. South Univ. 2023, 30, 4082–4096. [Google Scholar] [CrossRef]
  5. Shirani Faradonbeh, R.; Taheri, A.; Ribeiro ESousa, L.; Karakus, M. Rockburst assessment in deep geotechnical conditions using true-triaxial tests and data-driven approaches. Int. J. Rock Mech. Min. Sci. 2020, 128, 104279. [Google Scholar] [CrossRef]
  6. Luo, Y.; Gong, F.; Liu, D.; Wang, S.; Si, X. Experimental simulation analysis of the process and failure characteristics of spalling in D-shaped tunnels under true-triaxial loading conditions. Tunn. Undergr. Space Technol. 2019, 90, 42–61. [Google Scholar] [CrossRef]
  7. Dai, J.; Gong, F.; Qi, S.; Xu, L. Quantitative evaluation of rockburst proneness for surrounding rocks considering combined effects of the structural plane and excavation disturbance. Tunn. Undergr. Space Technol. 2023, 140, 105335. [Google Scholar] [CrossRef]
  8. Ortlepp, W.D. The behaviour of tunnels at great depth under large static and dynamic pressures. Tunn. Undergr. Space Technol. 2001, 16, 41–48. [Google Scholar] [CrossRef]
  9. Carter, B.J. Size and stress gradient effects on fracture around cavities. Rock Mech. Rock Eng. 1992, 25, 167–186. [Google Scholar] [CrossRef]
  10. Peng, K.; Ren, J.; Wu, T.; Yi, G.; Luo, S.; Luo, K. Influences of arch height and stress sate on tunnel failure: Insights from orthogonal true-triaxial experiment. Theor. Appl. Fract. Mech. 2025, 136, 104824. [Google Scholar] [CrossRef]
  11. Gong, F.; Wu, W.; Li, T. Simulation test of spalling failure of surrounding rock in rectangular tunnels with different height-to-width ratios. Bull. Eng. Geol. Environ. 2020, 79, 3207–3219. [Google Scholar] [CrossRef]
  12. Peng, K.; Yi, G.; Wang, Y.; Luo, S.; Wu, H. Experimental and theoretical analysis of spalling in deep hard rock tunnels with different arch structures. Theor. Appl. Fract. Mech. 2023, 127, 104054. [Google Scholar] [CrossRef]
  13. Kang, P.; Lai, R.Z.; Song, L.; Li, X.B. Influence of axial stress on failure characteristics of deep arch tunnel. Trans. Nonferrous Met. Soc. China 2024, 34, 4032–4048. [Google Scholar]
  14. Hao, X.; Yuan, L.; Sun, Z.; Zhao, Y.; Ren, B.; Zhao, D.; Xue, J.; Zhang, X.; Yu, G.; Zhang, Q. An integrated study of physical and numerical modelling on the stability of underground tunnel influenced by unloading rate. Tunn. Undergr. Space Technol. 2022, 129, 104602. [Google Scholar] [CrossRef]
  15. Feng, F.; Li, X.; Luo, L.; Zhao, X.; Chen, S.; Jiang, N.; Huang, W.; Wang, Y. Rockburst response in hard rock owing to excavation unloading of twin tunnels at great depth. Bull. Eng. Geol. Environ. 2021, 80, 7613–7631. [Google Scholar] [CrossRef]
  16. Su, G.; Jiang, J.; Feng, X.; Jiang, Q.; Chen, Z.; Mo, J. Influence of loading rate on strainburst: An experimental study. Bull. Eng. Geol. Environ. 2019, 78, 3559–3573. [Google Scholar] [CrossRef]
  17. Gong, F.; Ni, Y.; Ren, L. Effects of Loading Rate on Rockburst Proneness of Granite from Energy Storage and Surplus Perspectives. Rock. Mech. Rock Eng. 2022, 55, 6495–6516. [Google Scholar] [CrossRef]
  18. Xu, J.; Ma, L.; Xiao, X.; Wu, D. Experimental study of the formation process and behaviors of spalling in rock materials. Eng. Fail. Anal. 2023, 143, 106873. [Google Scholar] [CrossRef]
  19. Pan, P.-Z.; Miao, S.; Wu, Z.; Feng, X.-T.; Shao, C. Laboratory Observation of Spalling Process Induced by Tangential Stress Concentration in Hard Rock Tunnel. Int. J. Geomech. 2020, 20, 04020011. [Google Scholar] [CrossRef]
  20. Manouchehrian, A.; Cai, M. Numerical modeling of rockburst near fault zones in deep tunnels. Tunn. Undergr. Space Technol. 2018, 80, 164–180. [Google Scholar] [CrossRef]
  21. Feng, F.; Li, X.; Rostami, J.; Li, D. Modeling hard rock failure induced by structural planes around deep circular tunnels. Eng. Fract. Mech. 2019, 205, 152–174. [Google Scholar] [CrossRef]
  22. Fakhimi, A.; Hemami, B. Axial splitting of rocks under uniaxial compression. Int. J. Rock Mech. Min. Sci. 2015, 79, 124–134. [Google Scholar] [CrossRef]
  23. Huang, L.; Wang, J.; Momeni, A.; Wang, S. Spalling fracture mechanism of granite subjected to dynamic tensile loading. Trans. Nonferrous Met. Soc. China 2021, 31, 2116–2127. [Google Scholar] [CrossRef]
  24. Zhao, H.; Liu, C.; Huang, G.; Yu, B.; Liu, Y.; Song, Z. Experimental investigation on rockburst process and failure characteristics in trapezoidal tunnel under different lateral stresses. Constr. Build. Mater. 2020, 259, 119530. [Google Scholar] [CrossRef]
  25. Zhu, W.C.; Liu, J.; Tang, C.A.; Zhao, X.D.; Brady, B.H. Simulation of progressive fracturing processes around underground excavations under biaxial compression. Tunn. Undergr. Space Technol. 2005, 20, 231–247. [Google Scholar] [CrossRef]
  26. Cheng, T.; He, M.; Li, H.; Liu, D.; Qiao, Y.; Hu, J. Experimental investigation on the influence of a single structural plane on rockburst. Tunn. Undergr. Space Technol. 2023, 132, 104914. [Google Scholar] [CrossRef]
  27. Kaiser, P.K.; Cai, M. Design of rock support system under rockburst condition. J. Rock Mech. Geotech. Eng. 2012, 4, 215–227. [Google Scholar] [CrossRef]
  28. Jiang, Q.; Feng, X.; Fan, Y.; Fan, Q.; Liu, G.; Pei, S.; Duan, S. In situ experimental investigation of basalt spalling in a large underground powerhouse cavern. Tunn. Undergr. Space Technol. 2017, 68, 82–94. [Google Scholar] [CrossRef]
  29. Liu, G.; Feng, X.-T.; Jiang, Q.; Yao, Z.; Li, S. In situ observation of spalling process of intact rock mass at large cavern excavation. Eng. Geol. 2017, 226, 52–69. [Google Scholar] [CrossRef]
  30. Li, D.; Li, C.C.; Li, X. Influence of Sample Height-to-Width Ratios on Failure Mode for Rectangular Prism Samples of Hard Rock Loaded In Uniaxial Compression. Rock Mech. Rock Eng. 2011, 44, 253–267. [Google Scholar] [CrossRef]
  31. Zhu, G.-Q.; Feng, X.-T.; Zhou, Y.-Y.; Li, Z.-W.; Fu, L.-J.; Xiong, Y.-R. Physical Model Experimental Study on Spalling Failure Around a Tunnel in Synthetic Marble. Rock Mech. Rock Eng. 2020, 53, 909–926. [Google Scholar] [CrossRef]
  32. Gong, F.; Si, X.; Li, X.; Wang, S. Experimental Investigation of Strain Rockburst in Circular Caverns Under Deep Three-Dimensional High-Stress Conditions. Rock Mech. Rock Eng. 2019, 52, 1459–1474. [Google Scholar] [CrossRef]
  33. Gong, F.; Luo, Y.; Li, X.; Si, X.; Tao, M. Experimental simulation investigation on rockburst induced by spalling failure in deep circular tunnels. Tunn. Undergr. Space Technol. 2018, 81, 413–427. [Google Scholar] [CrossRef]
  34. Gong, F.Q.; Luo, Y.; Si, X.F.; Li, X.B. Experimental modelling on rockburst in deep hard rock circular tunnels. Chin. J. Rock Mech. Eng. 2017, 36, 1634–1648. [Google Scholar] [CrossRef]
  35. Si, X.; Li, X.; Gong, F.; Huang, L.; Liu, X. Experimental investigation of failure process and characteristics in circular tunnels under different stress states and internal unloading conditions. Int. J. Rock Mech. Min. Sci. 2022, 154, 105116. [Google Scholar] [CrossRef]
  36. Si, X.; Peng, K.; Luo, S. Experimental Investigation on the Influence of Depth on Rockburst Characteristics in Circular Tunnels. Sensors 2022, 22, 3679. [Google Scholar] [CrossRef]
  37. Si, X.; Huang, L.; Gong, F.; Li, X. Failure process and characteristics of three-dimensional high-stress circular tunnel under saturated water content. Trans. Nonferrous Met. Soc. China 2022, 32, 2696–2708. [Google Scholar] [CrossRef]
  38. Si, X.F.; Gong, F.Q. Rockburst simulation tests and strength-weakening effect of circular tunnels under deep high stresses and internal unloading conditions. Chin. J. Rock Mech. Eng. 2021, 40, 276–289. [Google Scholar] [CrossRef]
  39. Bai, Q.; Zhang, C.; Paul Young, R. Using true-triaxial stress path to simulate excavation-induced rock damage: A case study. Int J. Coal Sci. Technol. 2022, 9, 49. [Google Scholar] [CrossRef]
  40. Yang, S.Q.; Dai, Y.; Han, L.; He, Y.; Li, Y. Uniaxial Compression Experimental Research On Deformation And Failure Properties Of Brittle Marble Specimen With Pre-Existing Fissures. Chin. J. Rock Mech. Eng. 2009, 28, 2391–2404. [Google Scholar]
  41. Tyler, S.W.; Wheatcraft, S.W. Fractal Scaling of Soil Particle-Size Distributions: Analysis and Limitations. Soil Sci. Soc. Am. J. 1992, 56, 362–369. [Google Scholar] [CrossRef]
  42. Yu, L.; Peng, K.; Luo, S.; Wang, Y.; Luo, K. Failure process and characteristics of deep concrete-supported arch tunnel under true-triaxial stress. Theor. Appl. Fract. Mech. 2024, 130, 104295. [Google Scholar] [CrossRef]
  43. Zhou, H.; Xu, R.C.; Lu, J.J.; Zhang, C.Q.; Meng, F.Z.; Shen, Z. Experimental Investigations And Mechanism Analysis Of Anchoring Effect Of Pre-Stressed Bolts For Slabbing Surrounding Rock In Deep Tunnel. Chin. J. Rock Mech. Eng. 2015, 34, 1081–1090. [Google Scholar] [CrossRef]
  44. Culshaw, M.G.; Ulusay, R. (Eds.) The ISRM Suggested Methods for Rock Characterization, Testing and Monitoring: 2007–2014; Springer: Berlin/Heidelberg, Germany, 2015. [Google Scholar]
  45. Sun, Y.; Tan, C.X. An analysis of present-day regional tectonic stress field and crustal movement trend in China. J. Geom. 1995, 1, 1–12. [Google Scholar]
  46. Chen, L.; Guo, W.; Zhang, D.; Zhao, T. Experimental study on the influence of prefabricated fissure size on the directional propagation law of rock type-I crack. Int. J. Rock Mech. Min. Sci. 2022, 160, 105274. [Google Scholar] [CrossRef]
  47. Wang, B.; Ning, Y.; Feng, T.; Zneg, Z.M.; Guo, Z.Y. Meso-Mechanism Of Rock Failure Influenced By Bolt Anchorage Under Uniaxial Compression Loading. Chin. J. Geotech. Eng. 2018, 40, 1593–1600. [Google Scholar] [CrossRef]
Figure 1. “11.28” rockburst encountered in Jinping II Hydropower Station [26].
Applsci 15 02780 g001
Figure 2. Deep mine underground engineering encountering structural plane.
Applsci 15 02780 g002
Figure 3. Polarized microscope photographs and mineral composition of red sandstone: (a) naked eye view; (b) single polarization; (c) orthogonal polarization; (d) lithological makeup.
Applsci 15 02780 g003
Figure 4. Schematic diagram of sandstone specimens and penetration: (a) sandstone specimens; (b) “S-0-25”; (c) “S-0-50”; (d) “S-0-100”.
Applsci 15 02780 g004
Figure 5. Testing machines: (a) INSTRON 1346 Universal Materials Testing Machine; (b) true triaxial loading system; (c) TRW-3000 Rock True Triaxial Current Servo Mutagenesis (Disturbance) Test System.
Applsci 15 02780 g005
Figure 6. Schematic diagram of stress path.
Applsci 15 02780 g006
Figure 7. Stress–strain curves for sandstone specimens.
Applsci 15 02780 g007
Figure 8. Actual loading stress path of different specimens.
Applsci 15 02780 g008
Figure 9. The names of each part of the rectangular tunnel.
Applsci 15 02780 g009
Figure 10. Failure process of specimen “S-0-0”.
Applsci 15 02780 g010
Figure 11. Failure process of specimen “S-0-50”.
Applsci 15 02780 g011
Figure 12. Failure process of specimen “S-0-25”.
Applsci 15 02780 g012
Figure 13. Failure process of specimen “S-0-100”.
Applsci 15 02780 g013
Figure 14. Damage characteristic points and AE signals of “S-0-0”.
Applsci 15 02780 g014
Figure 15. Sidewall failure evolution of non-fissure sandstone specimen. (a) Calm Stage (b) Fine Particle Spalling Stage (c) Crack Generation and Propagation Stage (d) Rock Slab Spalling and Failure Stage.
Applsci 15 02780 g015
Figure 16. Sidewall failure evolution of sandstone specimen with fissure. (a) Calm Stage (b) Fine Particle Spalling Stage (c) Crack Generation and Propagation Stage (d) Rock Slab Spalling and Failure Stage.
Applsci 15 02780 g016
Figure 17. Influence of fissure penetration on hole failure.
Applsci 15 02780 g017
Figure 18. Failure of rectangular holes under 50 MPa vertical stress: (a) S-0-0, (b) S-0-25, (c) S-0-50, (d) S-0-100.
Applsci 15 02780 g018
Figure 19. Failure of rectangular holes under 62 MPa vertical stress: (a) S-0-0, (b) S-0-25, (c) S-0-50.
Applsci 15 02780 g019
Figure 20. Distribution of rock fragments: (a) S-0-0, (b) S-0-25, (c) S-0-50, (d) S-0-100.
Applsci 15 02780 g020
Figure 21. Fractal fitting curves for different specimens.
Applsci 15 02780 g021
Table 1. Material parameters of tested sandstone specimens.
Density (kg∙m−3)P-Wave Propagation Velocity (m/s)Uniaxial Compressive Strength (MPa)Poisson’s RatioYoung’s Modulus
(GPa)
Rockburst Tendency
2451303498.390.2118.60moderate
Table 2. The contact areas and loading rates in the X-direction for the various sandstone specimens.
Specimen NumberHole Area (cm2)Contact Area (cm2)Loading Rate (N/s)
S-0-0991910
S-0-25, S-0-50, S-0-1009.490.6906
Table 3. Duration of four failure stages.
Fissure Penetration/%02550100
Clam stage/s890.64978.121188.72533.52
Fine particle spalling stage/s766.8183.655.4496.84
Crack generation and propagation stage/s67.32161.64238.32178.92
Spalling and failure stage/s76.3292.1618.7231.32
Total/s910.44437.4312.48307.08
Table 4. Initial and peak failure stresses at varying fissure penetrations.
SpecimenInitial Failure Stress/MPaPeak Stress/MPa
S-0-047.5072.00
S-0-2549.8661.66
S-0-5054.0064.00
S-0-10036.7750.00
Table 5. The mass of rock fragments of different particle sizes.
R
(mm)
RL
(mm)
S-0-0S-0-25S-0-50S-0-100
M (r < R) (g)MT (g)M (r < R) (g)MT (g)M (r < R) (g)MT (g)M (r < R) (g)MT (g)
0.075150.8939.730.4831.570.1520.030.1710.12
0.25153.4939.732.1231.570.8420.030.8210.12
0.55155.3139.733.1131.571.3820.031.1810.12
1157.1739.733.9631.571.8520.031.5910.12
2.361510.6539.735.8331.572.7520.032.3910.12
4.751517.0739.738.7131.574.7220.033.5910.12
6.71520.8439.7310.5131.575.7820.034.4610.12
81525.2439.7319.3931.5711.7320.036.3210.12
151539.7339.7331.5731.5720.0320.0310.1210.12
Disclaimer/Publisher’s Note: The statements, opinions and data contained in all publications are solely those of the individual author(s) and contributor(s) and not of MDPI and/or the editor(s). MDPI and/or the editor(s) disclaim responsibility for any injury to people or property resulting from any ideas, methods, instructions or products referred to in the content.

