1. Introduction
Color is a key factor in product design, manufacturing, and quality control. In industries such as textiles, printing, coatings, and electronic displays, accurate control and evaluation of CDs are crucial for ensuring product quality and consumer satisfaction [
1]. The objective of this paper is to propose a high-precision method for image CD measurement that simulates the perceptual process of the human visual system. The color difference measurement method can be applied in medical imaging, video analysis, image transmission, quality control, automated inspection, and image analysis, and it is of great significance for improving photographic quality, optimizing image processing, and optimizing image display. However, due to the complexity of color perception, developing a formula that can accurately predict and quantify CD has been a long-standing challenge. Modern smartphones employ display technologies like LCD, OLED, and AMOLED, each with its own unique color rendition characteristics [
2]. With the continuous advancement of display technology, the color gamut and dynamic contrast ratio that screens can display have significantly improved, presenting new challenges and opportunities for CD measurement.
The history of CD measurement dates back to the early 20th century when scientists began to investigate quantitative methods for measuring color. Early work focused primarily on the physical measurement of color, such as using spectrophotometers to measure the reflective or transmittance properties of colors [
3]. With the introduction of the CIE XYZ color space by the International Commission on Illumination (CIE) in 1931, a foundation was laid for the scientific measurement of color. Since then, researchers have proposed various color spaces, and in 1976, the CIE recommended two CD formulas, CIELAB [
4] and CIELUV [
4], both of which are color spaces based on CIE color-matching functions, providing methods for quantifying CD, mainly used to assess small to medium-sized CDs. CIELAB is widely used due to its simplicity and versatility, while CIELUV is more suitable for specific applications that require a more uniform color space. However, both CIELAB and CIELUV have limitations, particularly when dealing with specific colors or in certain color regions where errors are larger. The CMC CD formula was proposed in 1984 [
5], which uses different weighting factors to adjust differences in brightness, chroma, and hue to meet different application needs. With the development of digital image processing and display technology, CD measurement has begun to be applied to digital environments. The development of the CIEDE2000 [
6] CD formula took into account the complexity of visual perception. Xue Mei Zhang proposed Spatial-CIELAB (S-CIELAB) [
7] by simulating the spatial blur of the human visual system to extend CIELAB color measurement and used it to assess the color reproduction errors of digital images. In 2001, Imai introduced a perceptual CD metric based on the Mahalanobis distance, utilizing covariance matrices to account for differences in color attributes [
8]. In 2003, Alexander Toet proposed expanding the grayscale image quality index into a new color space that is perceptually irrelevant, creating a novel metric for color image fidelity that was evaluated through observer experiments and found to be highly correlated with human perception [
9]. In 2005, Lee proposed a measurement model to predict the performance of human judgments in similarity metrics of different images, exploring the model’s performance across a broad range of color spaces and identifying the optimal quantification for the selected color space [
10]. In 2006, Guowei Hong proposed a new algorithm for CD measurement that took into account the importance of different regions in the image and the magnitude of CDs [
11]. In 2008, Sonia Ouni proposed a new full-reference image quality assessment metric based on the characteristics of the human visual system, which considers pixel neighborhood information and introduces neighborhood information through weighted differences for perceptual comparison [
12]. In 2009, Gabriele Simone proposed a new Euclidean CD formula for calculating image differences, particularly small to medium CDs in the logarithmically compressed OSA-UCS color space [
13]. In 2014, Dohyoung Lee introduced the CDICH, a circular chrominance-based CD index, which independently processes the brightness and chrominance components of image data, taking into account the periodicity of chrominance [
14]. In 2019, Ortiz-Jaramillo introduced a CD measurement method based on image segmentation and Local Binary Patterns for calculating CDs in natural scene color images [
15]. In 2012, Ingmar Lissner proposed an image difference prediction framework that emphasizes the use of color information to enhance the assessment of gamut-mapped images. The Image Difference Metric (IDM) integrates various image difference features and uses a factor combination model for overall image difference prediction [
16]. In 2017, Alakuijala introduced Guetzli, a new JPEG encoder designed to produce visually indistinguishable images at lower bit rates than other common JPEG encoders, utilizing a closed-loop optimizer to refine both the JPEG’s global quantization tables and the DCT coefficient values within each JPEG block [
17]. Since image quality assessment (IQA) methods can measure image distortion, they can also be used to measure and calculate CD. Classical IQA methods include algorithms such as SSIM [
18], VSI [
19], LIP [
20], PieAPP [
21], LPIPS [
22], and DISTS [
23], which can be divided into two categories: traditional image evaluation methods that use texture and gradient features, and image quality evaluation methods based on deep learning features.
The existing CD measurement algorithms extract only local features of the image, neglecting the global semantic features, and they do not use global features to guide the local features for feature fusion. As a result, these algorithms perform poorly in CD measurement for high-resolution photographic images.
The transformer was originally proposed by Vaswani in 2017, primarily for natural language processing (NLP) tasks [
24]. The core of the Transformer model is the self-attention mechanism, which allows the model to consider all other elements in the sequence while processing each element. This mechanism offers a powerful global modeling capability because it does not need to process the sequence step by step like RNN, but rather processes the entire sequence in parallel, increasing training efficiency [
25]. The Vision Transformer (ViT) is an innovation in the field of deep learning, extending the philosophy of the transformer architecture to computer vision tasks. The global feature extraction capability of ViT enables it to excel at understanding the overall structure and modeling of images, which is particularly important for tasks that require global semantic features [
26]. The introduction of ViT has brought a brand new solution to CD perception, which can utilize its global modeling capability to make CD measurement closer to human perception.
In this work, an algorithm for CD measurement that integrates local and global features is proposed. This method simulates the human perception process of images, extracting both global semantic features and features from key local areas, thus demonstrating good performance in image CD measurement tasks. This method is named CD-Attention. CD-Attention extracts features that include local detail features of CNN and global semantic features of ViT and uses deformable convolution to fuse global and local features. It uses global semantic features to guide local features, and the CD of the image is ultimately obtained through the weighted sum of high-frequency and low-frequency prediction branches. Our main contributions can be summarized as follows:
A hybrid network architecture for CD measurement based on attention mechanisms is proposed, which integrates the global semantic features of Vision Transformer (ViT) into the color measurement process and utilizes its attention mechanism to direct local features towards significant areas of the image.
Comparisons have been made with common classical algorithms on the SPCD dataset, proving that CD-Attention is a state-of-the-art method, and the effectiveness of the feature extraction and fusion approach has been verified through ablation experiments. The rest of this article is organized as follows.
Section 2 presents an overview of the CD formula, vision transformer, and deformable convolution.
Section 3 presents the architecture and implementation of CD-Attention. In
Section 4, we describe the specific implementation, training process, and main experiments of CD-Attention.
Section 5 provides a summary.
3. Methodology
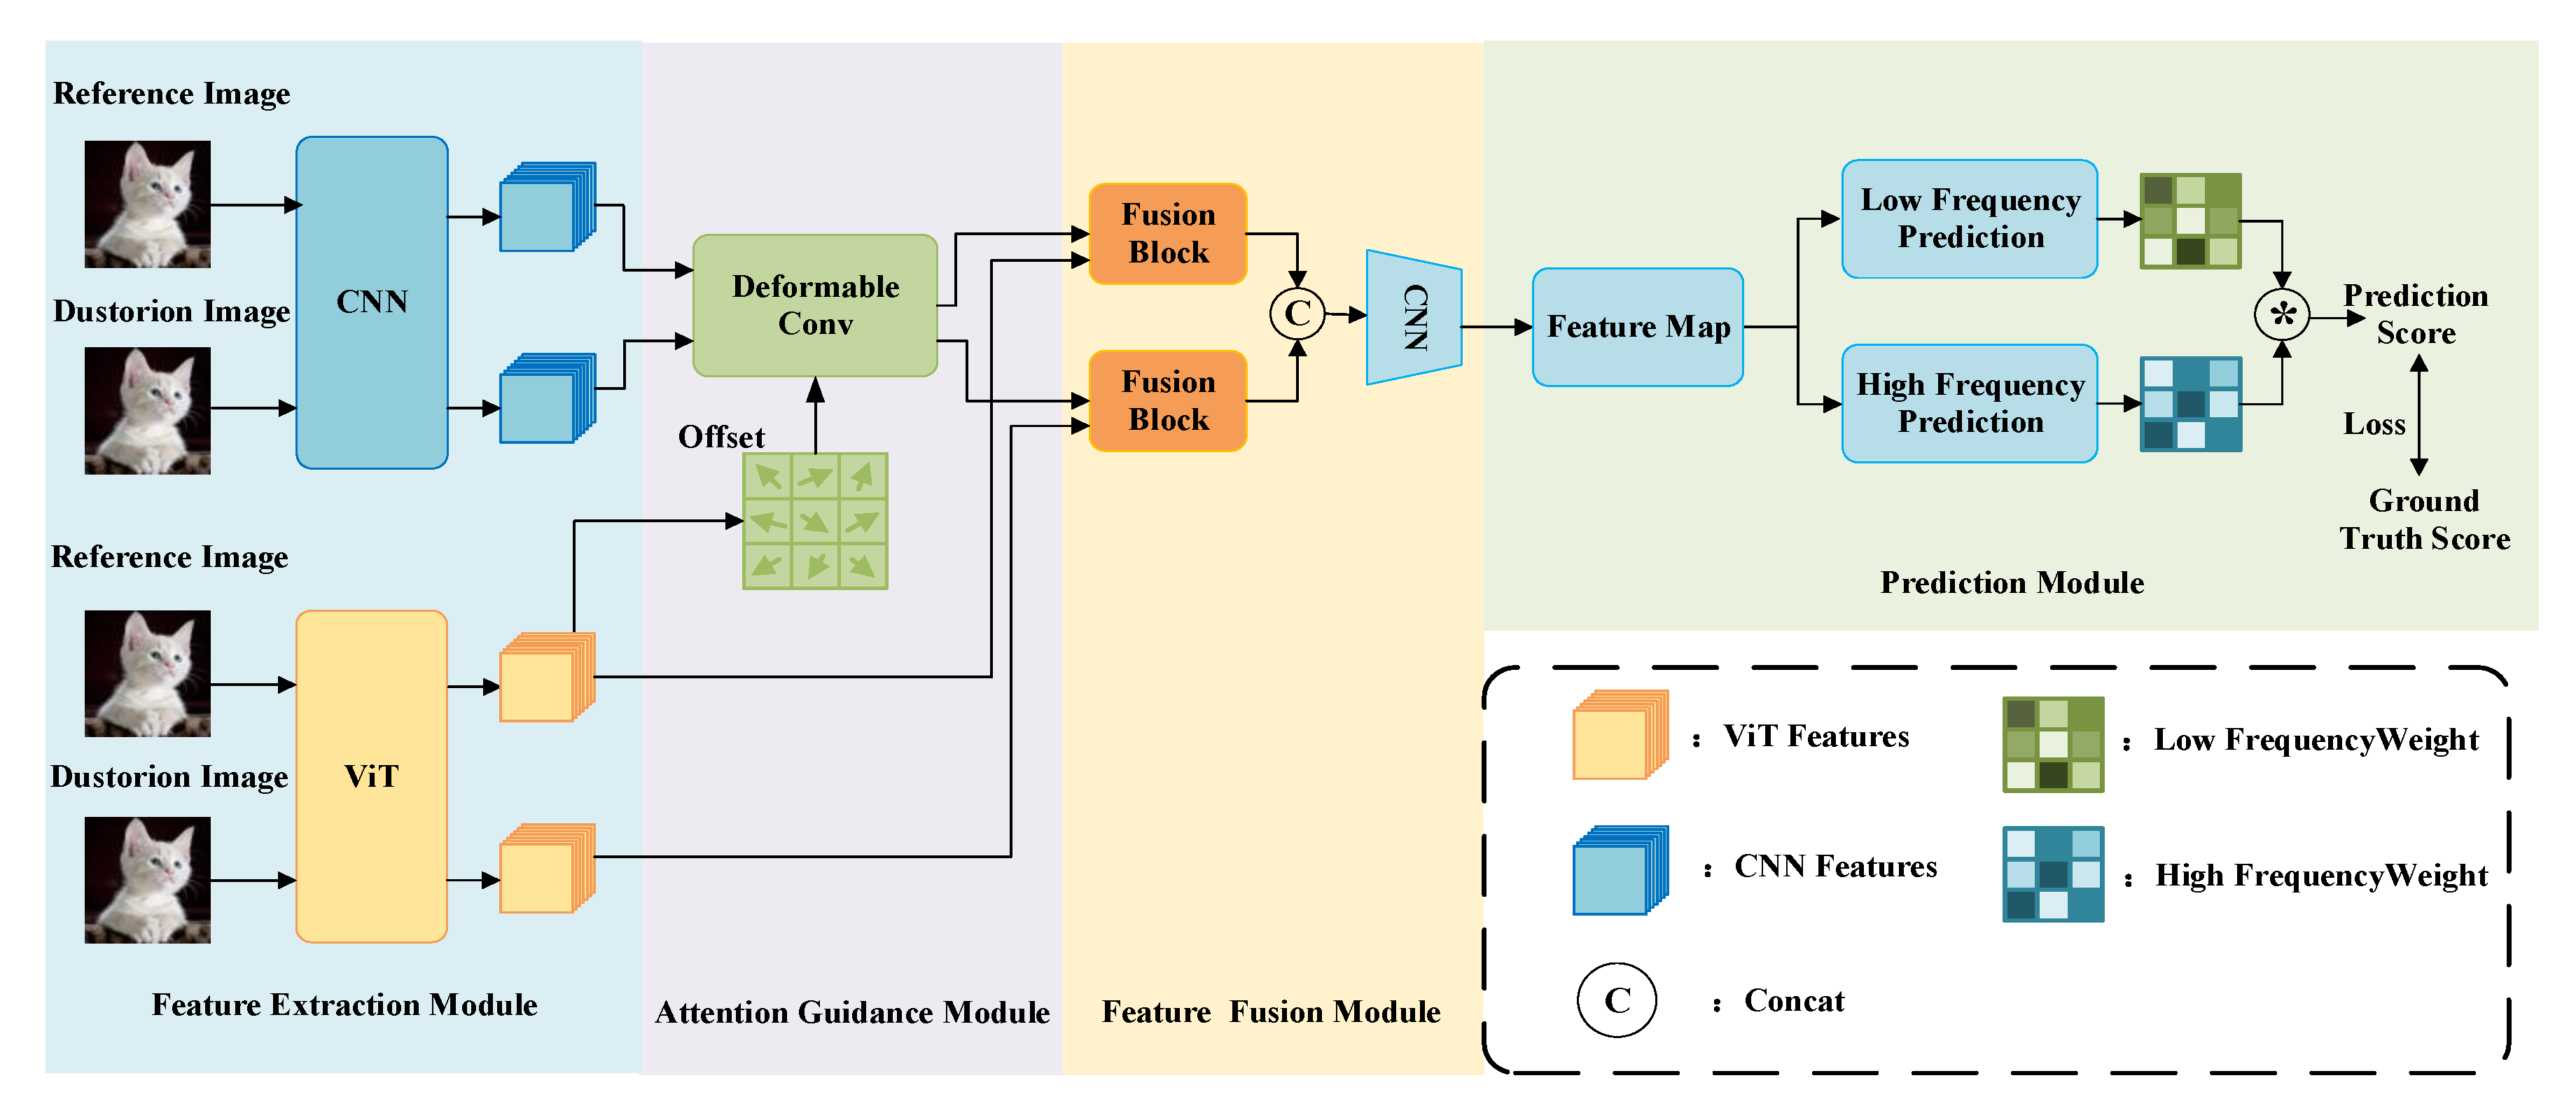
This section provides a detailed introduction to the network structure and design concept of the proposed CD-Attention. The CD-Attention structure consists of four parts: feature extraction, attention guidance, feature fusion, and a dual-branch prediction module, as shown in
Figure 1. It integrates the global semantic features extracted by the ViT with the local texture features extracted by CNN, uses deformable convolution to enhance the model’s ability to model transformations, and focuses local features on the key areas of the image. The prediction section introduces high-frequency and low-frequency predictions to determine the final score.
3.1. Feature Extraction Model
The focus of this paper is on the CD perception in photographic images, which are characterized by more complex content and larger image sizes. Human perception of CDs between two images typically uses global features as a reference to conduct a detailed analysis of local key areas. Inspired by this, the feature extraction module must be capable of extracting both local and global image features. Therefore, the designed feature extraction module includes two branches: the ViT feature extraction module and the CNN feature extraction module. CNN features are a classic convolution-based feature extraction method in deep learning, focusing on capturing local detail and texture features of the image but lacking global semantic features. The ViT, with its self-attention module, can establish long-distance dependency relationships between image regions, thereby extracting global semantic features of the image.
The self-attention module in the Transformer is used to model image features in the ViT structure, which is different from the way CNN extracts local image features through convolutional and pooling layers [
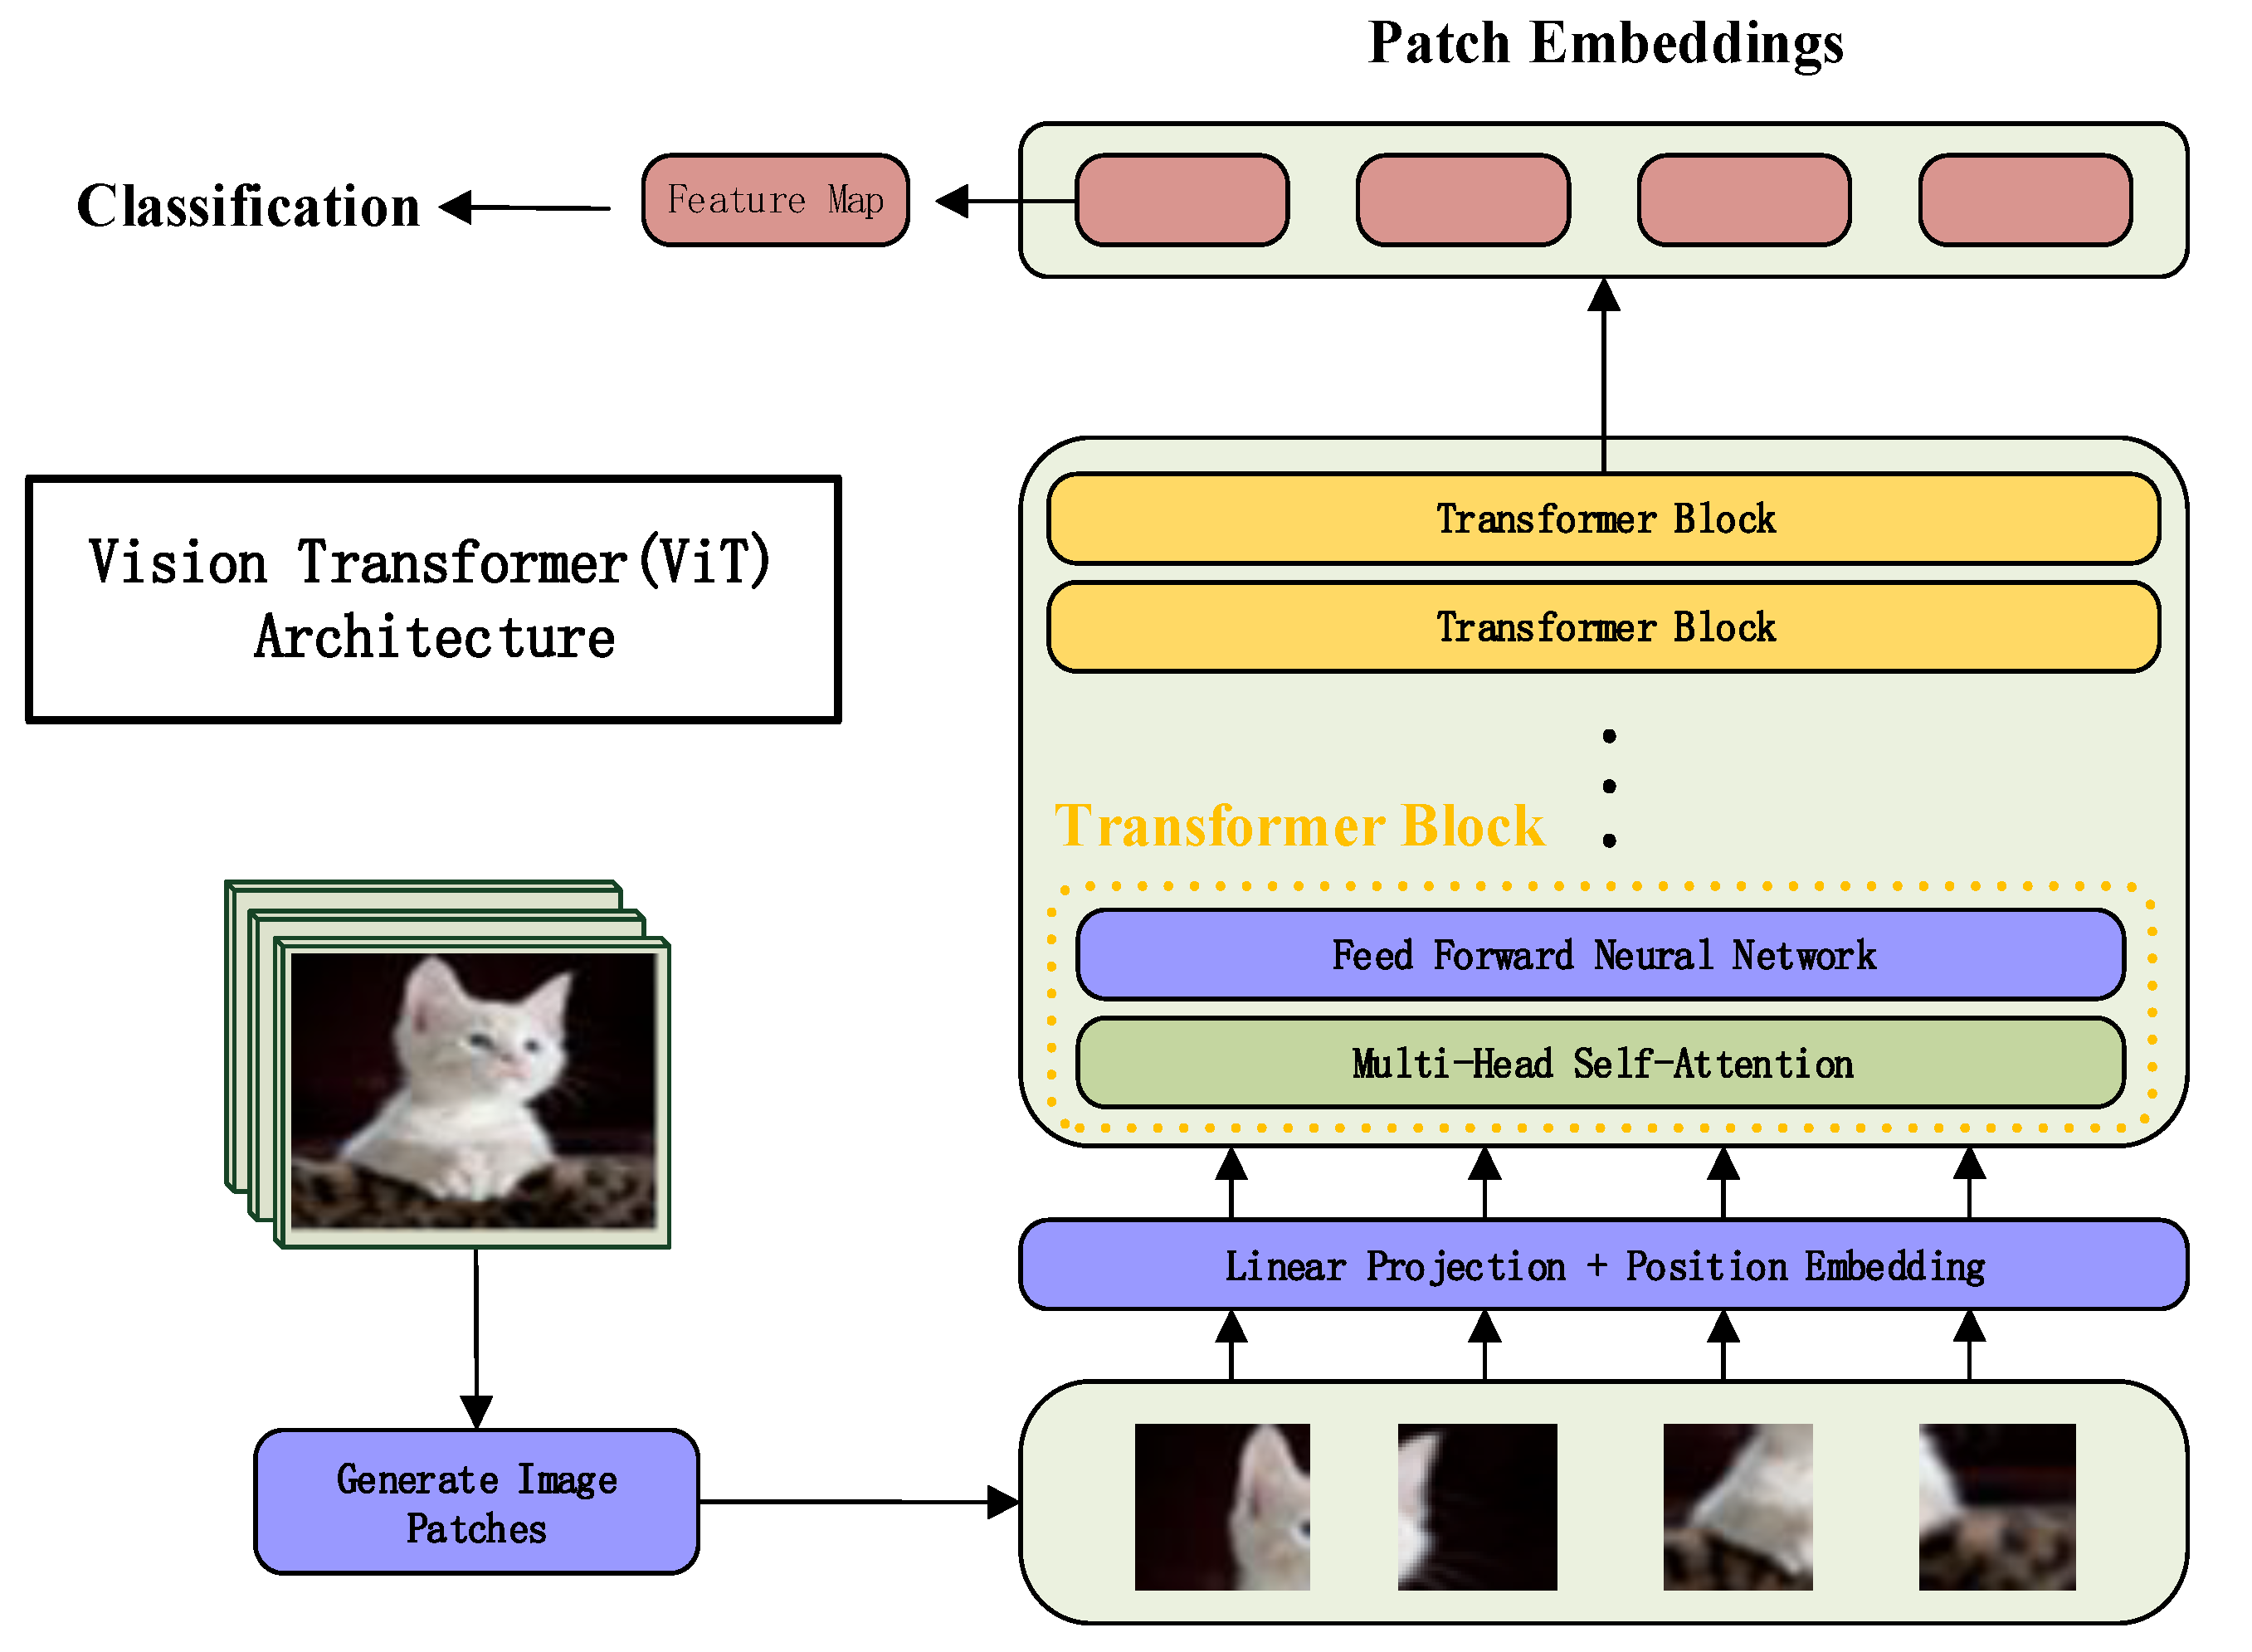
34]. The blocking of the ViT model is based on the encoder of the transformer, which includes multi-head attention and has shown good performance in fields such as panoramic segmentation, instance segmentation, semantic segmentation, and medical image segmentation. By dividing the image into a series of small patches and treating them as serialized tokens input into the transformer encoder, image feature extraction and classification are achieved. The process of feature extraction in ViT is shown in
Figure 2. Initially, the image is divided into fixed-size image patches, which are then converted into patch embeddings. Positional encoding information is added, and these embeddings are processed through a Transformer encoder that includes multi-head self-attention and feedforward neural networks. Finally, the features without position markers are taken as global features. During the forward-propagation process, the reference image and the distorted image are both input into the CNN and ViT to extract features. The features extracted from the reference image and the distorted image by the ViT are denoted as
and
, as shown in Equations (3) and (4), which represent the ViT feature extraction process, with
and
representing the input reference image and distorted image. As shown in Equations (5) and (6), ResNet is used to extract image features, with
and
representing the features extracted by the CNN for the reference image and distorted image.
3.2. Attention Guidance and Feature Fusion Module
The image features extracted by CNN contain noise and interference, and the sampling points of the convolutional kernels are fixed. Although the content of the input images to neural networks varies, the features of the images are sampled at the same locations by the convolutional kernels. To address this issue, inspired by the human perception of CDs and targeting the large size and variable content of photographic images, an attention guidance module is designed. The aim is to better integrate the global semantic features of the ViT with the local texture features of CNN, thereby enhancing the transformation modeling capability of CNN.
Deformable convolution, an enhancement of traditional convolutional neural networks, enables the convolution kernel to automatically adapt to the shape and size of the input features through learning. The performance of traditional CNNs in handling targets with complex shapes, textures, and large-scale variations is enhanced by deformable convolution [
35]. By introducing additional offsets, deformable convolution more accurately captures key features of objects, thereby enhancing the performance and robustness of the model. Deformable convolution adjusts the position of the convolution kernel by learning offsets on the input feature map, enabling the kernel to adapt to the geometric changes in objects, such as scale, pose, viewpoint, and part deformation. This offset is generated by an additional convolutional layer, which is not the same as the convolution kernel performing the convolution operation. As shown in
Figure 3, the features of the reference image extracted by the ViT, denoted as
, are first subjected to nearest-neighbor bilinear interpolation, which considers the values of the four closest points around the sampling point and calculates the value of the sampling point through linear interpolation. Since the offsets may result in sampling points falling on non-integer coordinates, bilinear interpolation is required to calculate the values at these non-integer coordinate points. Then, an additional convolutional layer is defined to generate offsets, with an input channel of 768 × 5 and an output channel of 2 × 3 × 3. The input to this convolutional layer is the feature map and the output is the offset field, which has the same shape as the input feature map but with a channel count of 2N, where N is the area size covered by the convolution kernel; for a 3 × 3 convolution kernel, N = 9. These 2N channels correspond to the offsets in the x and y directions for each sampling point. For the center point of each convolution kernel, its sampling grid position is adjusted according to the corresponding offset. These 2N channels correspond to the offsets in the x and y directions for each sampling point. For the center point of each convolution kernel, its sampling grid position is adjusted according to the corresponding offset. Specifically, if the coordinates of the convolution kernel’s center point are (p, q), the offset is (Δx, Δy), then the adjusted coordinates of the sampling point are (p + Δx, q + Δy). After adjusting the positions of the sampling points, standard convolution kernels are used to perform convolution operations at these adjusted locations to obtain the adjusted feature maps
and
for
and
. In summary, the features extracted by CNN, which are guided by the global semantic features of the reference image, focus more on the salient areas of the image, more closely resembling the human perception process of CDs in images. Through the aforementioned steps, the process of image feature extraction more closely resembles the human perception process of CDs.
3.3. Double-Branch Prediction Module
In the last section, four feature maps, , , , and , are obtained. By fusing features and , feature is obtained. By fusing features and , feature is obtained. Finally, features , , and (−) are fused to obtain the final feature .
A double-branch prediction approach is adopted to forecast the final score, as shown in
Figure 4. After feature fusion, a low-frequency prediction module is used to predict the score of global features, resulting in a low-frequency prediction score map. First, a convolution operation is used for feature smoothing, and then the Sigmoid activation function is utilized to obtain the global scores from the features. High-frequency prediction also uses convolution for feature smoothing, and then the high-frequency prediction score map is calculated through convolution operations. Finally, the low-frequency prediction score and the high-frequency prediction score are fused through a weighted average method to obtain the final score of the image CD, as shown in Formula (7). Since each feature in the feature map is a high-level feature obtained through feature fusion, using a weighted average approach can maximize the use of information from each characteristic. Moreover, by using the low-frequency score as the weight, the impact of global features on the result is learned by the model, allowing the model to focus on the most relevant parts of the input features. More precise feature representations are learned by the model, enhancing the model’s expressive and generalization capabilities. The chosen loss function for training is MES LOSS, and the difference between the predicted score and the ground true is used for back-propagation learning.
4. Experiment
4.1. Dataset
The large-scale dataset with human ratings is provided by Smartphone Photography Color Difference (SPCD), which is designed to foster further research on the measurement of perceptual CDs in photographic images and assist scholars in developing color measurement methods that are more in tune with human perception. The SPCD dataset comprises 30,000 image pairs, uniformly sampled from 1000 diverse natural scenes, encompassing a range of realistic photographic settings, Some representative images are shown in
Figure 5. The image size is 1024 × 1024 and they are stored in an uncompressed format. The SPCD encompasses four types of distortions: images of the same scene captured by different smartphones, the same image modified through Photoshop, the same image processed with iPhone filters, and the same image reproduced with incorrect ICC profile configurations. Among them, 10,005 image pairs are not perfectly aligned and are used to assess CD perception in the presence of geometric distortions such as translation or parallax. The remaining 19,995 image pairs are aligned and used for CD assessment without the influence of any geometric transformations. Each image pair has a ground truth of human-perceived CDs obtained through large-scale experiments. Utilizing SPCD can validate the stability of CD perception metrics when geometric distortions are introduced, effectively simulating the translation and parallax distortions introduced during the image capture process, which aids in the promotion and application of later algorithms. During the network training phase, 70% of the image pairs from the dataset are randomly allocated as the training set, 20% as the test set, and 10% as the validation set.
4.2. Implementation Details
Network Architecture. The proposed image CD measurement network CD-Attention, which combines the CNN and ViT, uses the ResNet50 and ViT_Base_Patch16 as feature extraction networks. Local texture features are extracted by ResNet50 while the global semantic features are extracted by the ViT, and both have been pre-trained using the trained networks for feature extraction. ResNet50 and the ViT are used to extract features from the reference image and the distorted image, respectively, with the resulting feature map sizes being (B, 768, 56, 56) and (B, 3840, 14, 14), where B represents the batch size set to 8. Subsequently, the nearest neighbor bilinear interpolation and convolution operations are used to process the ViT features of the reference image to obtain the offset for deformable convolution. The size of the offset is (8, 18, 56, 56), and this offset serves as the global receptive field for the current input image, which is used to guide the CNN features. The features extracted from the reference image and the distorted image by ResNet50 are input into the deformable convolution separately, using the offset from the reference image to guide the features. After being processed by the deformable convolution, the features from ResNet50 are transformed into the dimensions of (8, 768, 14, 14). The features of the reference and distorted images processed by deformable convolution are respectively fused with the features extracted from the reference and distorted images by the ViT, resulting in and with sizes of (8, 4608, 14, 14). Dimensionality reduction is applied to the feature maps, resulting in sizes of (8, 256, 14, 14). Feature fusion of , , and (−) results in the final feature map , with sizes of (8, 768, 14, 14). Finally, a dual-branch prediction model is utilized for score prediction. Convolutional operations are employed to obtain high-frequency global feature maps and low-frequency local feature maps, both with dimensions of (8, 1, 14, 14). The final image CD score is calculated using a weighted average.
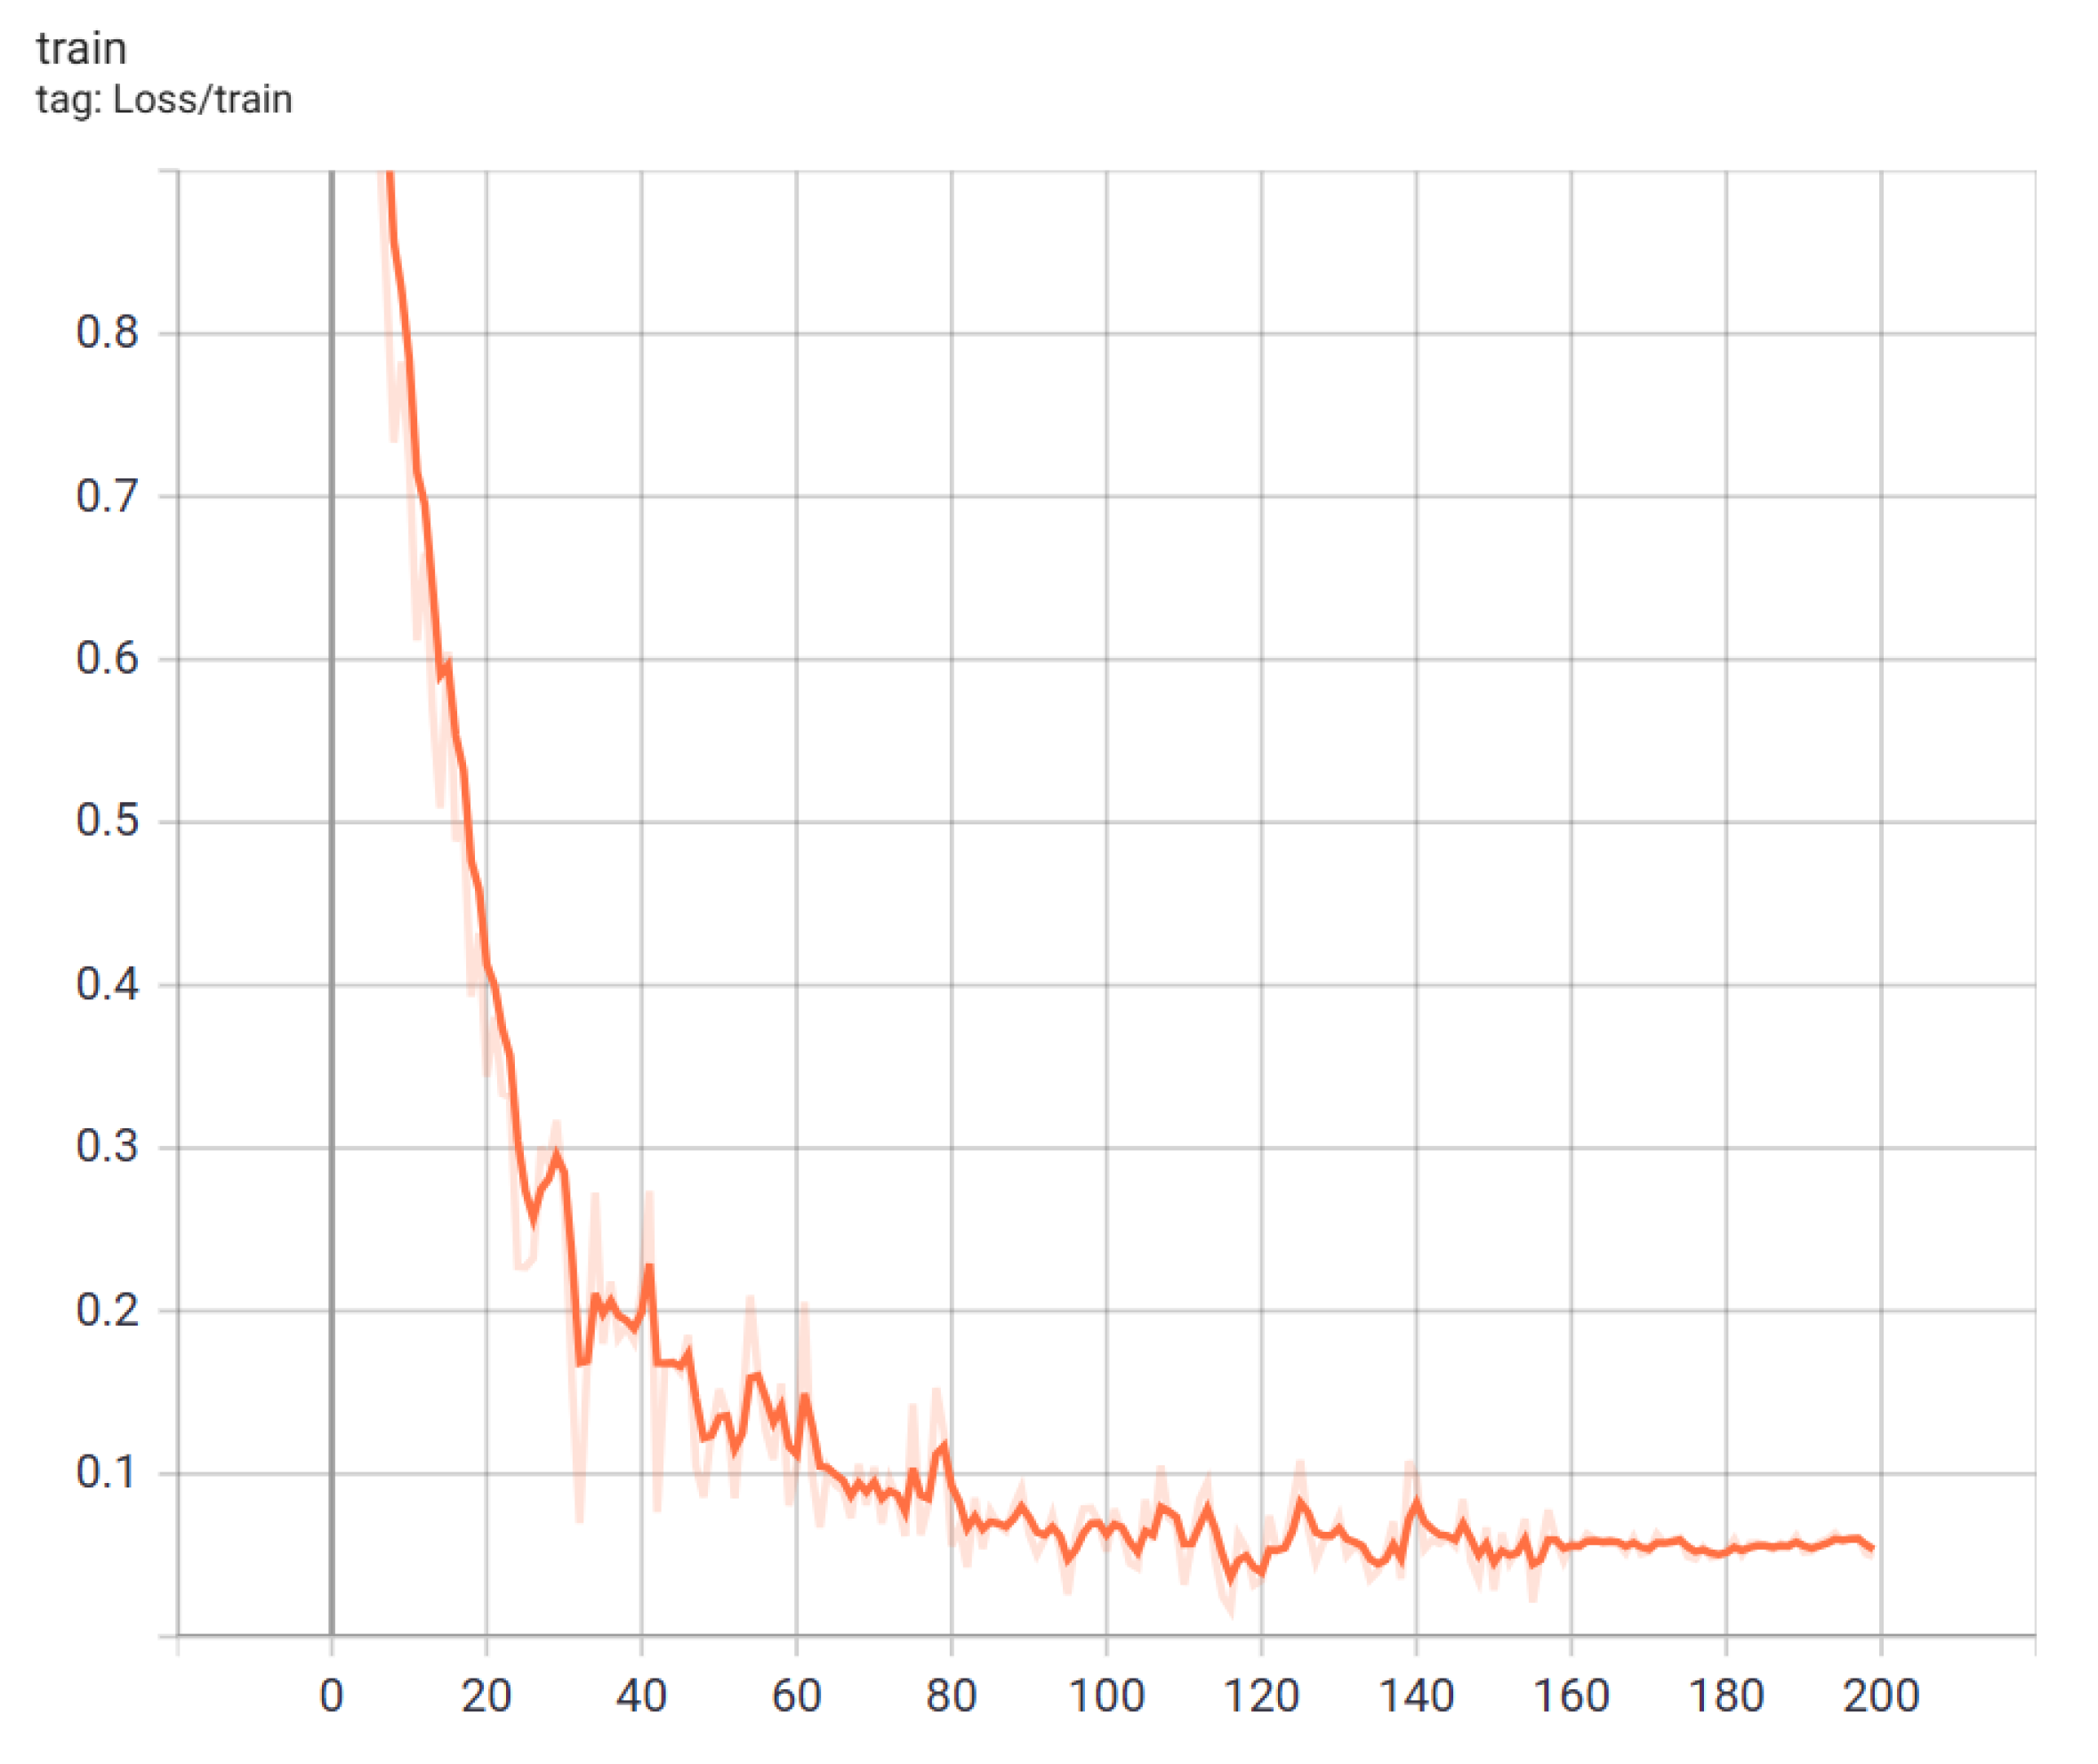
Training and Testing Details. CD-Attention is trained on a computer equipped with an A100 GPU, using the SPCD dataset for model training. The loss curve of model training is shown in
Figure 6, the learning rate is set to 10-4, and the time for one round of training is 16 min and 30 s. A total of 200 rounds of training are conducted, ultimately resulting in the best model loss of 0.05224.
Evaluation Criteria. The results are evaluated using three metrics: standardized residual sum of squares (STRESS), the Pearson linear correlation coefficient (PLCC), and Spearman’s rank correlation coefficient (SRCC). These formulas are used to validate the consistency and correlation of the CD-Attention with HSV. The calculation formula for
STRESS is as follows:
where
M is the number of test pairs and
F is the scale correction factor between ∆
E and ∆
V, defined as:
PLCC and
SRCC are used to measure the correlation and monotonicity of the CD evaluation network. The calculation formula for
PLCC is as follows:
where
are the mean predicted and perceptual CDs, respectively. A preprocessing step is added to linearize model predictions by fitting a four-parameter monotonic function before computing
PLCC The calculation formula for
SRCC is as follows:
where
is the difference between the i-th pair’s rank orders in ∆
E and ∆
V.
4.3. Main Results
Dataset validation results. As shown in
Table 1, CD-Attention is compared with 30 common CD measurement algorithms. These methods can be categorized into five groups based on their application scenarios and algorithmic characteristics. The first category mainly includes methods aimed at CD measurement for natural images: CIELAB [
4], CIE94 [
36], CMC [
5], CIEDE2000 [
6], CIECAM02 [
37], CIECAM16 [
38], S-CIELAB [
7], Imai01 [
8], Toet03 [
9], Lee05 [
10], Hong06 [
11], Ouni08 [
12], Simone09 [
13], and Pedersen12 [
39]. The second category consists of typical algorithms for image quality assessment: SSIM [
18], VSI [
19], LIP [
20], PieAPP [
21], LPIPS [
22], and DISTS [
23]. The third category includes just noticeable difference (JND) measures: Chou07 [
40], Lissner12 [
16], and Butteraugli [
17]. Additionally, classic CNN networks such as VGG [
41], ResNet-18 [
42], UNet [
43], and CAN [
44] are trained, and their performance in CD measurement is tested. CD-Attention is compared with the state-of-the-art methods CD-Net [
28] and CD-Flow [
29].
From the table, the following conclusions can be drawn: First, traditional CD calculation methods designed for natural images do not perform particularly well on images captured by smartphones. The reason is that the direct computation of image CDs does not align with the human perception of CDs, as subjective ratings tend to favor regions of interest within the image. Among these, CIELAB [
4], CIE94 [
36], CIEDE2000 [
6], CIECAM02 [
37], CIECAM16 [
38], S-CIELAB [
7], and Ouni08 [
12] perform relatively better because they all calculate CDs based on the CIELAB color space. Second, typical image quality assessment algorithms such as SSIM [
18], VSI [
19], LIP [
20], PieAPP [
21], LPIPS [
22], and DISTS [
23] have been proven effective in the field of image quality assessment, capable of identifying and detecting common image distortions. However, they do not perform well on CD image datasets because changes in image quality due to CDs are not necessarily perceived as image distortions, which also confirms the hypothesis proposed in the paper. Third, CD measurement algorithms based on JND can perceive the smallest changes detectable by humans, but they perform poorly on the SPCD dataset, with low correlation and STRESS metrics due to a poor perception of changes above the threshold in the dataset. Fourth, training models directly with classic CNN networks yields better results than traditional algorithms and image quality assessment algorithms as neural networks have strong generalization capabilities, and transfer learning through training on the SPCD dataset achieves more accurate CD perception results. This proves that using CNN networks for feature extraction in CD perception is feasible. Fifth, most algorithms perform well on aligned datasets but poorly on misaligned datasets due to insufficient adaptability to geometric changes in images. Sixth, compared with the state-of-the-art methods CD-Net and CD-Flow, the CD-Attention’s correlation metrics PLCC and SRCC are significantly higher than the current best algorithms. This is because CD-Net and CD-Flow are designed based on CNN networks, mainly extracting local texture features without combining global features. In summary, CD-Attention has achieved state-of-the-art performance, accurately perceiving the quality loss in images due to CDs and showing a high correlation with human ratings.
Generalization Analysis. To verify the generalization of the proposed CD-Attention model, the TID2013 dataset is used to train the model. The TID2013 dataset is used for image quality assessment and contains 25 reference images and 3000 distorted images. These distorted images are generated through 24 different distortion types, with 5 distortion levels for each type. Mean Opinion Score (MOS) values are obtained from 971 experimental observers from five countries. Distortion types related to CD in the dataset are selected for model training. The results are evaluated using STRESS, PLCC, and SROCC metrics, as shown in
Table 2. According to the data in the table, although CIEDE2000 [
6] is considered the best-performing CD formula in predicting experimental datasets currently, its performance is mediocre. Compared with the existing image quality assessment methods PieAPP [
21], LPIPS [
22], and DISTS [
23], the performance of CD-Attention has improved, proving its better generalization performance. When compared with the current best algorithms CD-Net [
28] and CD-Flow [
29], a higher correlation is shown by CD-Attention, demonstrating its superior generalization performance.
4.4. Ablation Study
To analyze the effectiveness of CD-Attention, ablation experiments are conducted on the key modules using the SPCD. This includes modules for feature extraction and attention guidance.
Feature Extraction Module. The feature extraction module is a crucial part of the network, and the quality of feature extraction directly affects the network’s predictions and outputs. Common feature extraction backbones were compared with the results shown in
Table 3. The compared backbones include Resnet50 [
42], Resnet101 [
42], Resnet152 [
42], HRnet [
45], InceptionResNetV2 [
46], and ViT-B/16 and ViT-B/8 [
31]. The feature extraction model combining Resnet50 [
42] and ViT-B/16 [
31] is found to be the most effective. There is a noted decrease in performance with the increase in depth of the CNN network. This is attributed to the fact that the deeper the CNN network, the more high-level features are captured. However, CD-Attention requires only the extraction of local features by the CNN network, with the ViT responsible for extracting global and deep features. When comparing the Transformer backbone networks ViT-B/8 [
31] and ViT-B/16 [
31], the performance of ViT-B/16 [
31] is superior.
Attention Guidance Module. An ablation study was conducted on the attention guidance module of CD-Attention to verify the effectiveness of introducing deformable convolution for attention guidance. As shown in
Table 4, the first method employs deformable convolution for attention guidance as used in CD-Attention, which combines CNN features with ViT global semantic features and then proceeds with feature fusion. The second method uses traditional feature concatenation to directly merge CNN features with ViT features. In CD measurement tasks, the first method significantly outperforms the second, demonstrating that the proposed approach of attention guidance before feature fusion effectively integrates local texture features with global semantic features. This further proves that the global semantic features extracted by the ViT can guide the local shallow features extracted by CNN, bringing the CD measurement results closer to human perception. This further proves that the approach of using global semantic features to guide the local shallow features extracted by CNN is correct. The third and fourth methods in the table utilize only Resnet50 and ViT-B/16 as the backbone for which the performance of their models drops significantly. This proves that the features from Resnet50 and ViT-B/16 significantly affect the performance of CD-Attention, demonstrating that both local texture features and global semantic features are essential in CD measurement tasks. It also further confirms that the design concept of the proposed CD-Attention model is correct.


