4.2. Regression and Correlation Analysis
When observing the influence of selected input variables (weight, impact from height, conveyor belt strength, conveyor belt type) on the output variables (impact force, relative absorption, tension force, degree of damage), we commence from the following model:
where
,
,
, and
.
The best regression model of dependence in all cases is the model of the following form:
where
,
,
are the parameters of the models;
is the weight of hammer (Weight, kg);
is the height from which the impactor falls (Height, m);
is the conveyor belt strength type and (Strength); and
is the type of conveyor (Type).
Due to the sensitivity of the least squares method to outliers, samples in which a puncture occurred (simultaneous complete damage to the upper covering layer, carcass, and lower covering layer, classed as Damage 3) causing the conveyor belt to be decommissioned were excluded from the experiment.
All the parameters of the regression model and the regression models themselves are statistically significant (
p-value < α). Point and interval estimates of the parameters of the regression model together with the statistical significance of the parameters (
p-value) for each model are in
Table 5.
The analysis of regression models shows that all input variables significantly influence the output variables observed. Using standardized coefficients (column Beta,
Table 5) we can compare the strength of the effect of each individual independent variable on the dependent variable, assuming that the other independent variables are constant. The higher the absolute value of the beta coefficient, the stronger the effect of the variable.
For example, the analysis of standardized coefficients shows the following:
The variable Height has the most significant influence on the variable Y1 (impact force), followed by the weight of the hammer.
The variable Weight has the most significant influence on the variable Y2 (increase in tension force), and this variable has a more significant influence than the height of the fall.
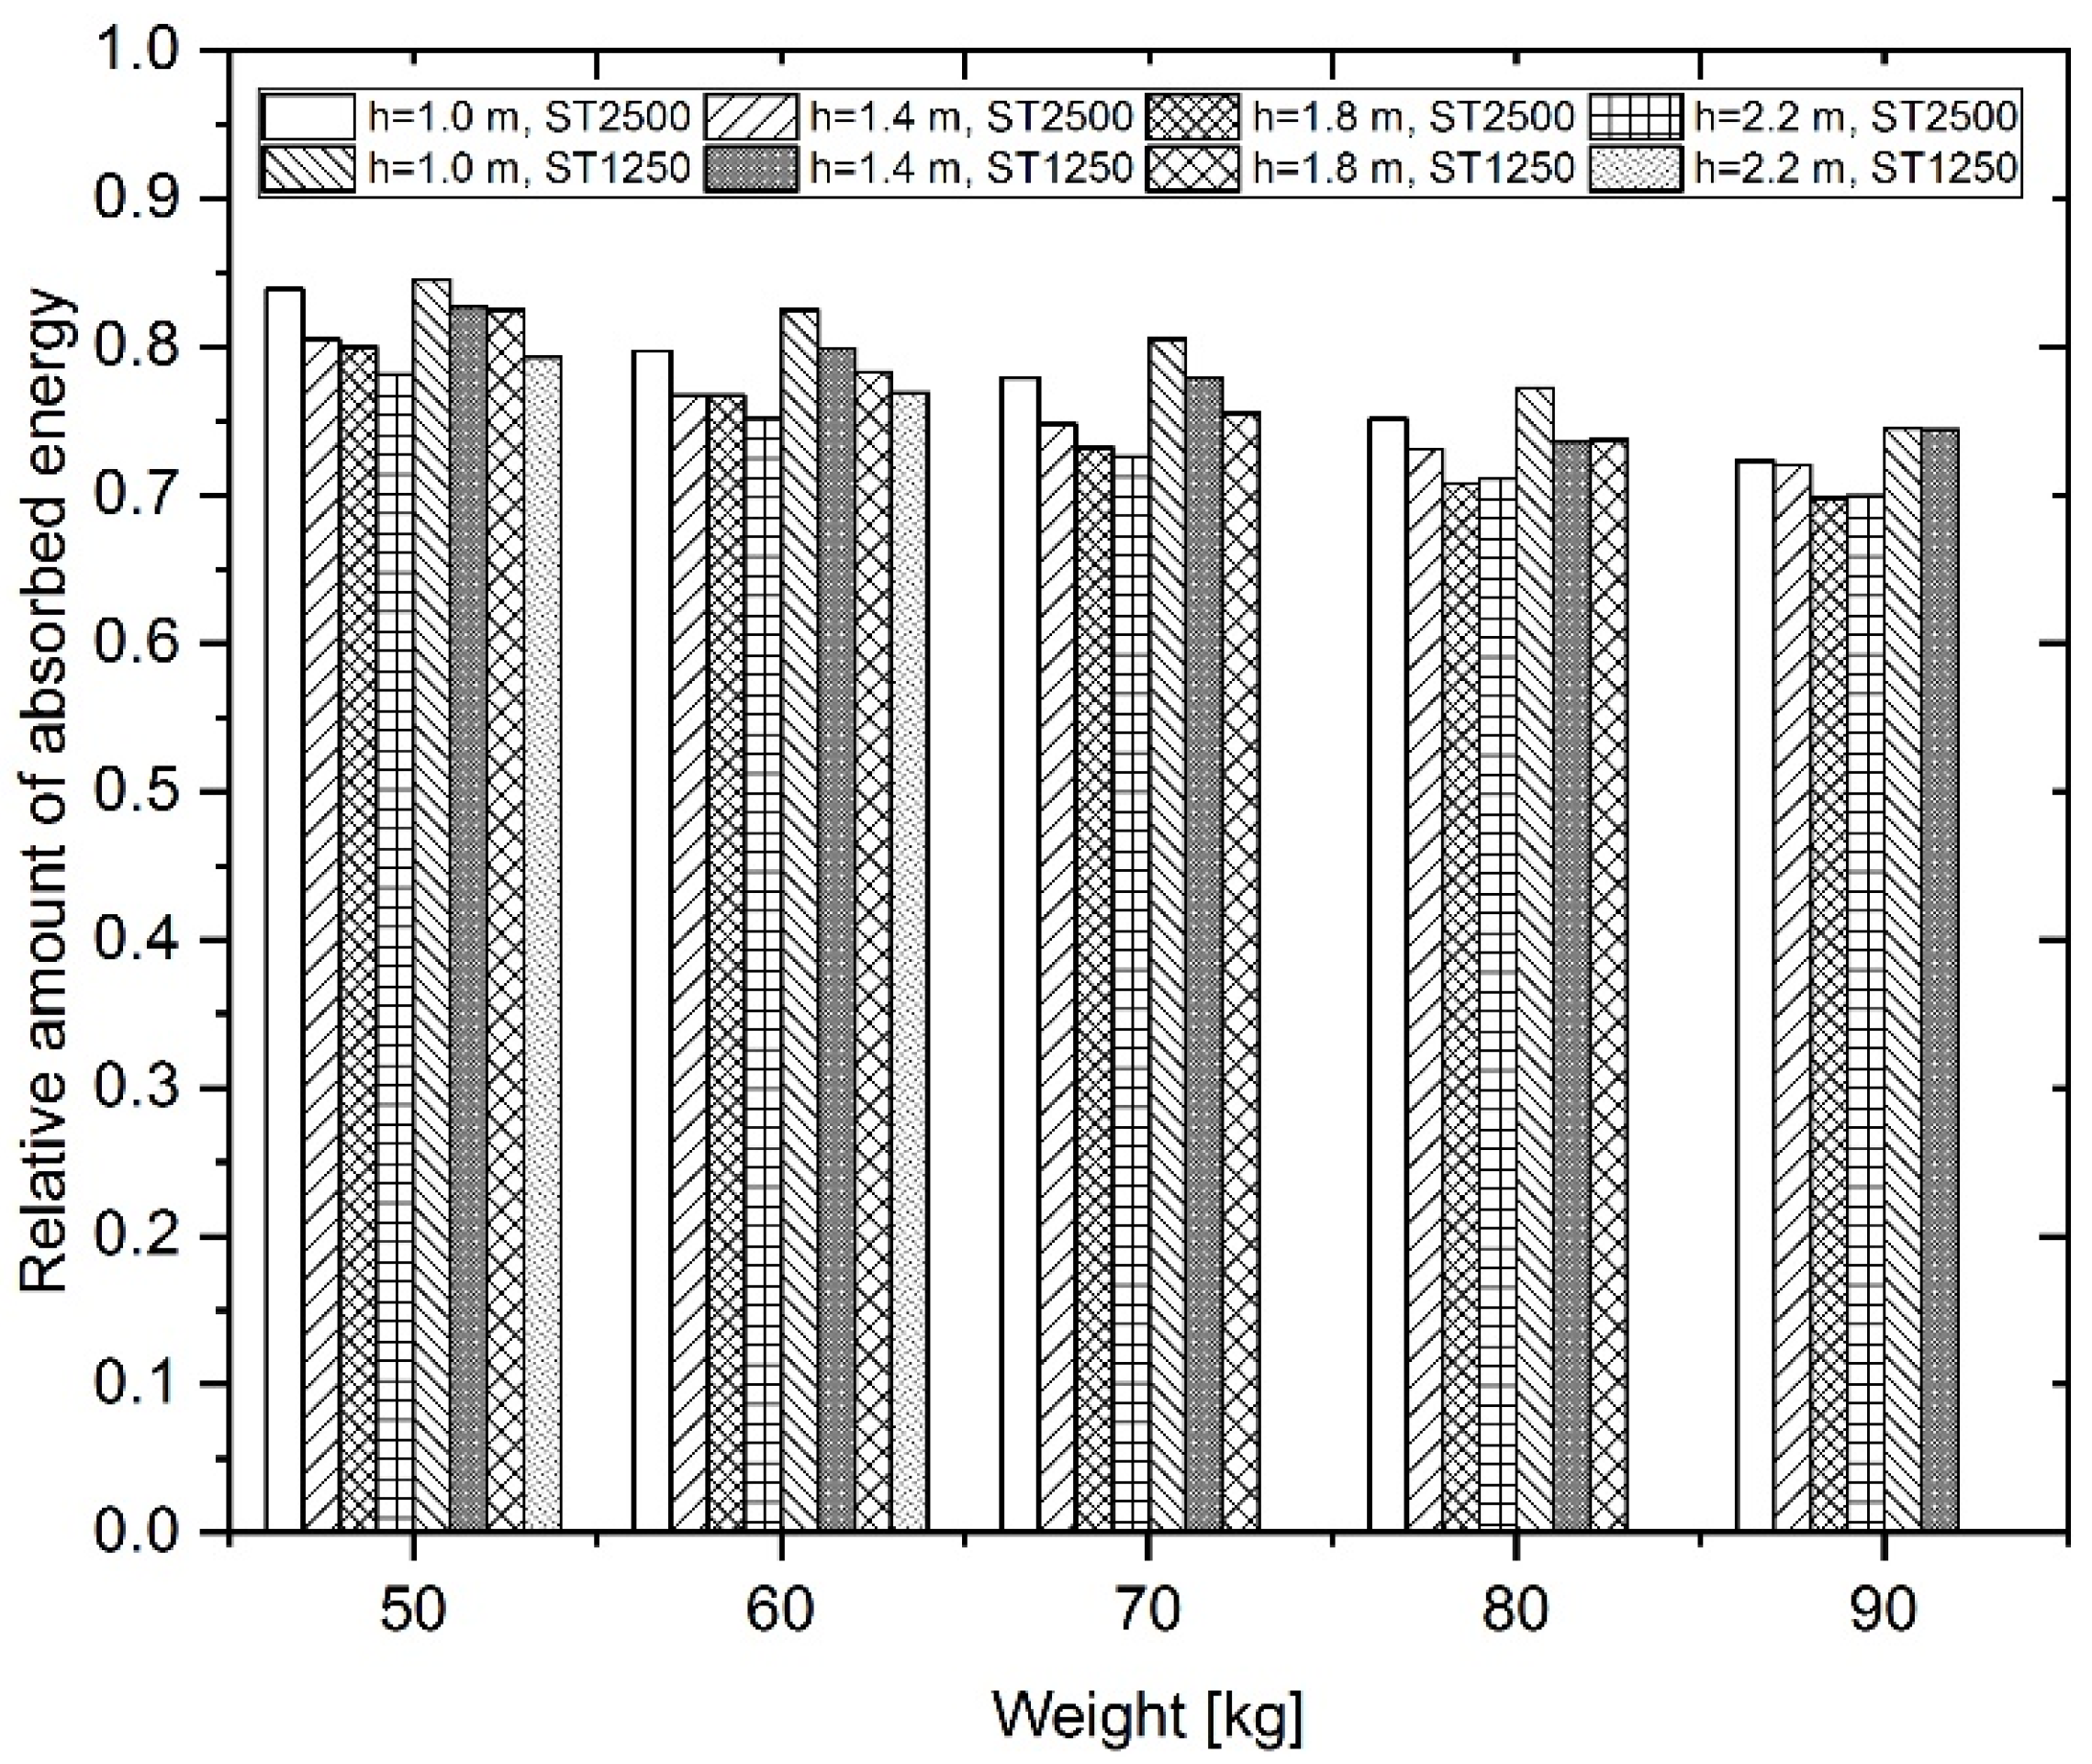
The variable Conveyor belt type has the most significant influence on variable Y3 (relative amount of absorbed energy) and also variable Y4 (degree of damage).
4.3. Canonical Correlation Analysis
First, let us see if there is any correlation between the original variables. Since the variables were measured in different units, the relationships between them were identified using a correlation matrix (
Table 6), where the relationship between the two variables was determined through the Pearson correlation coefficient
r.
We used a scale to determine the degree of dependence: no correlation (|r| < 0.29), moderate correlation (0.30 <|r| < 0.49), medium correlation (0.50 <|r| < 0.79), and strong correlation (S, 0.80 <|r| < 1). If the correlation coefficient r is positive (or negative), there is a positive (or inverse) linear dependence between the variables. The results of the correlation matrix show that there is a strong inverse correlation between the variables Erelat and Type (r = −0.787) and also Erelat and Fimpakt (r = −0.615). For the Type variable, the reference category was the steel cord conveyor belt. If the correlation coefficient is negative, the rubber textile conveyor belt acquires a value of the examined variable that is lower than that for the reference category, i.e., a steel cord conveyor belt (for example, in ΔFn, Erelat, Damage). On the other hand, if the correlation coefficient is positive, the rubber textile conveyor belt acquires a value of the examined variable (for example, Fimpakt) that is higher than that of the reference category. It turns out that there are moderate to medium correlations between many pairs of variables, which is enough for the data to be processed using the CCA method.
All the variables are divided into two groups. The first group of the original variables called Properties (Weight, Height, Strength, Type) describes the properties of the conveyor belt or the conditions of the experiment. The second group of variables called Result (impact force, increase in tension force, relative amount of absorbed energy, degree of damage) represent the variables describing the result of the conducted experiment. The first group represents the new canonical variable
U and the second group the new canonical variable V. Verification of the statistical significance of canonical correlation analysis is carried out by means of several approximations of F-tests based on multivariate statistics (
Table 7).
The tests confirmed that there is a statistically significant dependence (p-value < α) between the two groups of variables. That is, we reject the null hypothesis about the independence of the correlation coefficient.
In general, the number of canonical dimensions is equal to the number of variables in the smaller set. In our case, we have four pairs (roots) of canonical variables:
and
,
and
,
and
, and
and
. The number of significant pairs may be smaller. The next step is to verify the statistical significance of each pair of canonical variables by means of an approximative F-test and a Wilks’ lambda test (
Table 8). We test the null hypothesis that all pairs of canonical variables and uncorrelated, or
, where
is the canonical correlation coefficient for the
ith pair of canonical variables,
. The estimated canonical correlations
and the canonical coefficient of determination
for all pairs are sorted by size.
The first value of the F-test in Wilk’s lambda statistical significance test (row 1 to 4,
Table 8) tests the significance of all four canonical correlations. Since
p-value < α, we reject the null hypothesis and assume that the first pair of canonical variables is significantly correlated. The second value of the F-test (row 2 to 4,
Table 8) is used to test the significance of the second, third, and fourth canonical correlations, and the third value tests the significance of only the third and fourth canonical correlations. Finally, the last test is used to test whether the fourth canonical correlation is significant by itself (it is not, because
p-value > α). It follows that only the first three pairs of canonical variables are statistically significant. The value of Wilks’ lambda is interpreted in the opposite direction to the canonical coefficient of determination
. A value close to zero indicates a high correlation, and vice versa, a value close to 1 indicates a low correlation.
The largest paired correlation coefficient is for the first pair of canonical variables
and
(
.9865) and the second largest is for the pair
and
(
= 0.9206). The
value can be interpreted similarly to the
value in the regression analysis. We see that 97.31% of the variability of
can be explained by the variability of
, and 84.75% of the variability of
can be explained by the variability of
. Only 14.36% (or 0.07%) of the variability of
(or
) can be explained by the variability of
(or
). The first two pairs of canonical variables have a high canonical correlation and are the most important compared to the other pairs. Therefore, it is advisable to observe only the first two pairs of canonical variables. The canonical coefficients for canonical variable
U and for canonical variable
V for all canonical roots are in
Table 9 and
Table 10.
Since the original variables are not measured in the same units, it is recommended to use standardized canonical coefficients before raw canonical coefficients. These are standardized weightings that are chosen so that the condition of unit variances of canonical variables is satisfied. In practice, this means that the weightings are divided by the standard deviations of the corresponding canonical variables. In
Table 11, there are standardized canonical coefficients for the canonical variable
U and in
Table 12, there are standardized canonical coefficients for variable
V.
According to the absolute values of the standard canonical coefficients (
Table 11 and
Table 12), which we interpreted literally as weightings (increments) of canonical variables, we can conclude that the first canonical variable
is most influenced by the variables Type and Strength. Variable
is most strongly influenced by the variable
Erelat (relative amount of absorbed energy) and variable Δ
Ftension (increase in tension force). Variable
is comparatively influenced by the variables Weight and Height, and variable
is dominated by the variable
Fimpact (Impact force). It was discovered that in the first pair of canonical variables, the strength and type of conveyor belt are strongly inversely correlated with the increase in tension force and the relative amount of energy absorbed. In the second pair, the impact height and weight of the landing material are strongly positively correlated with the impact force.
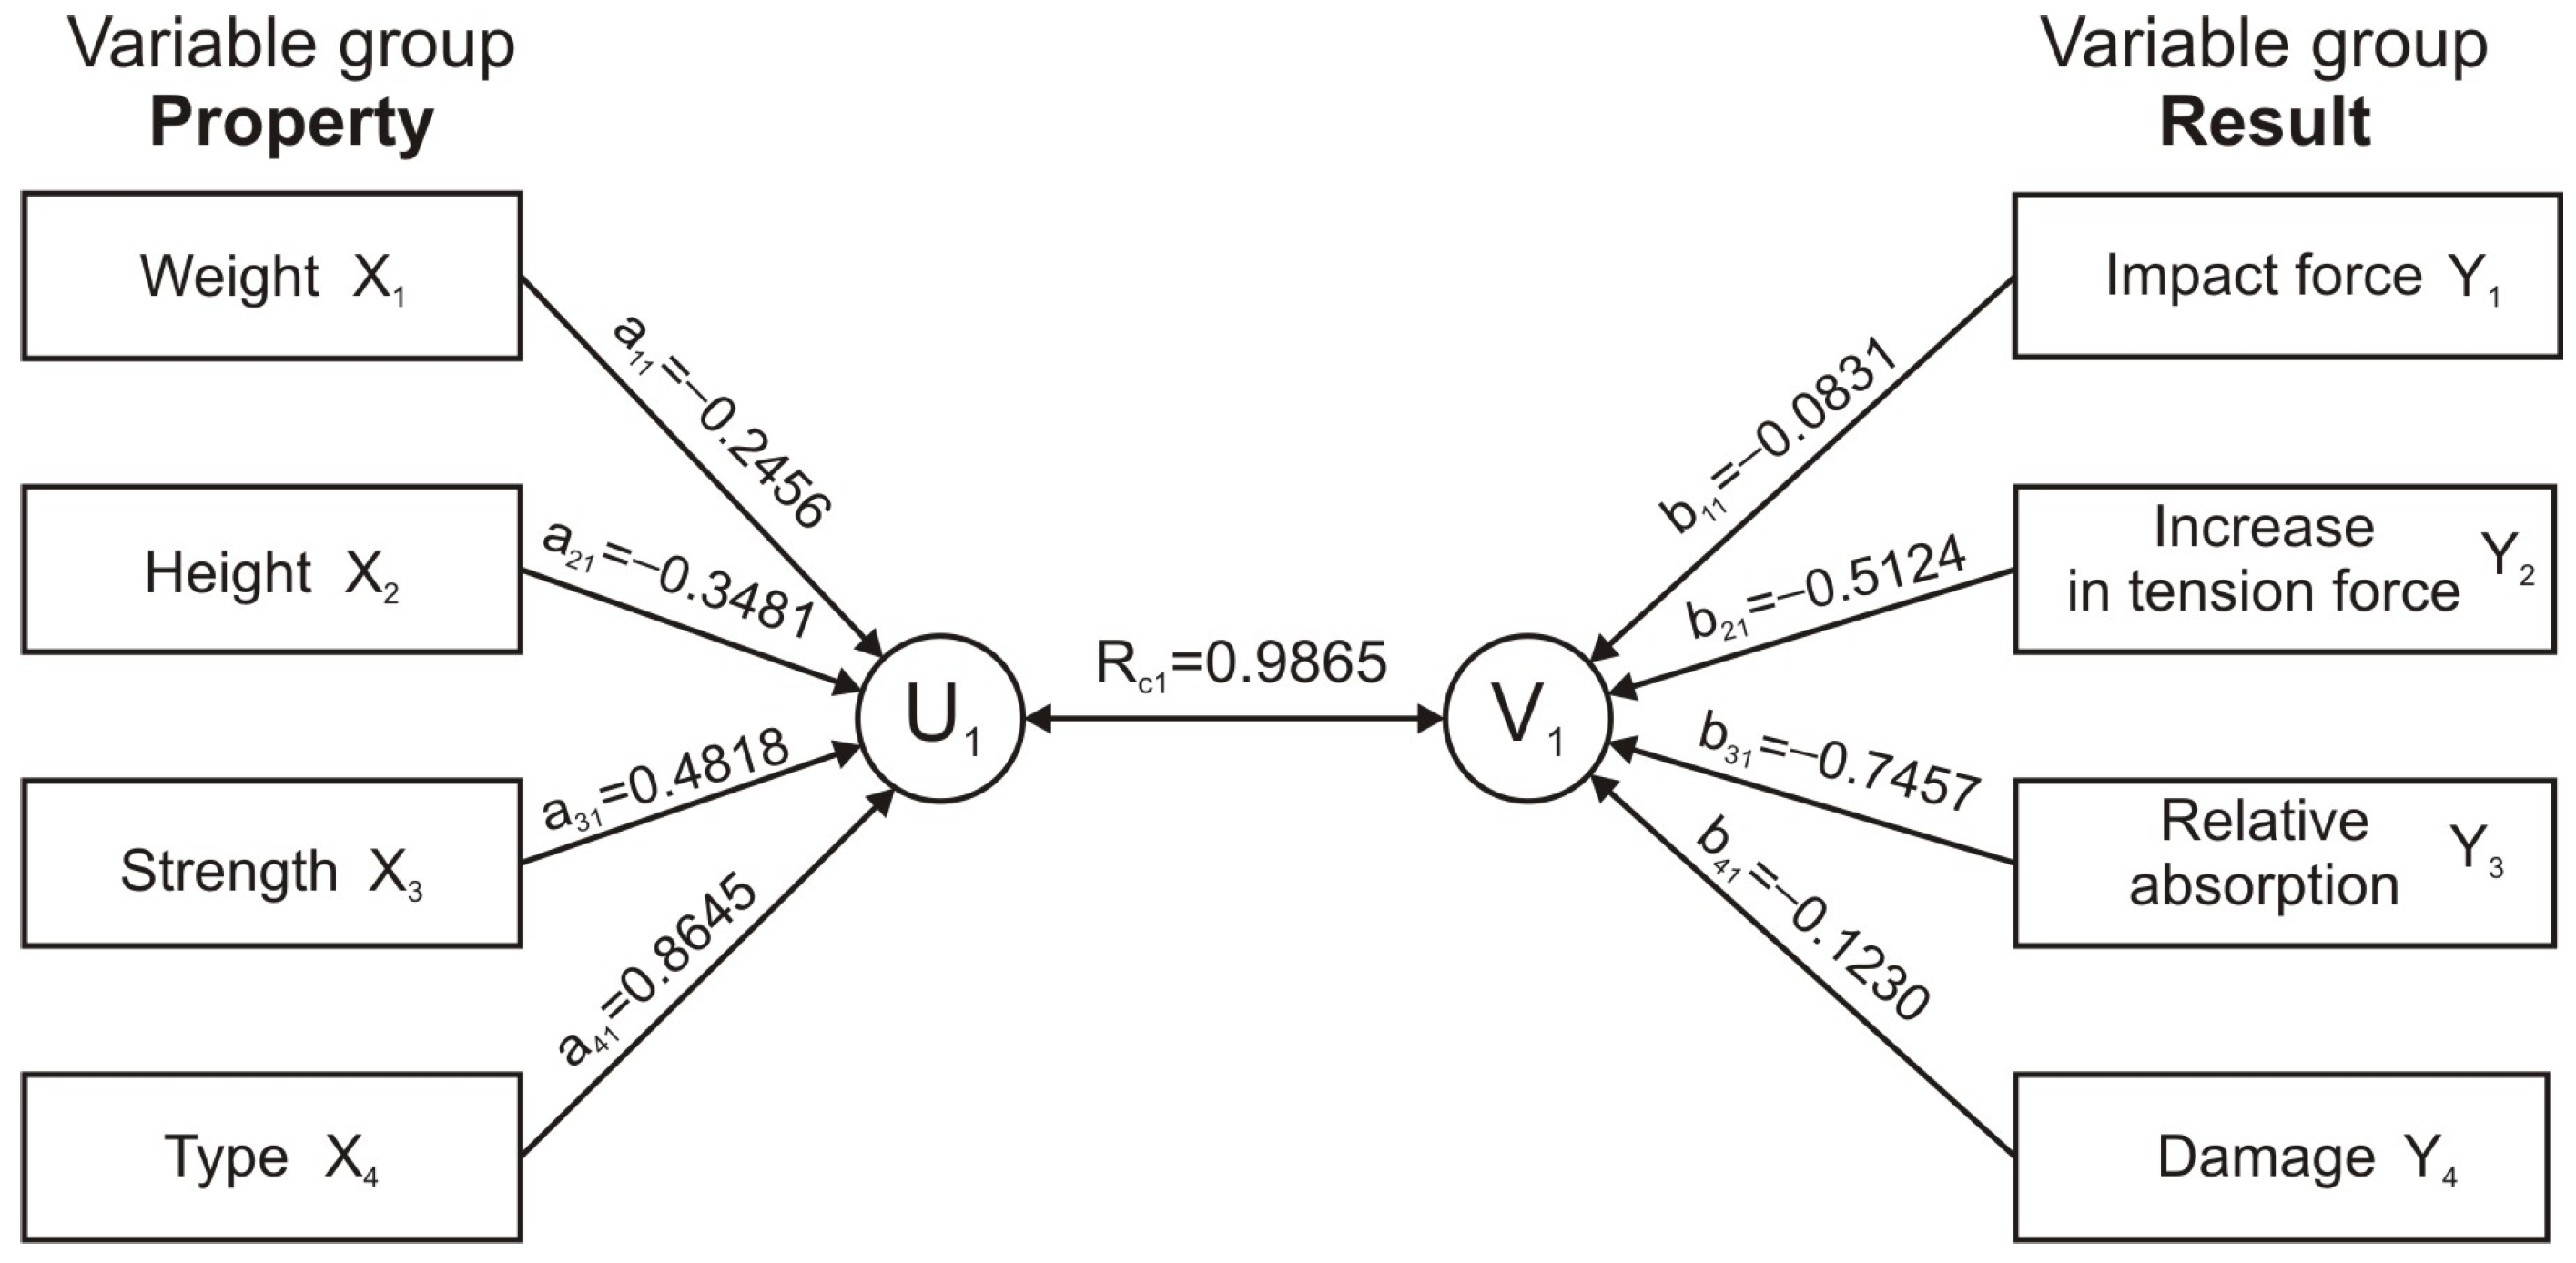
The first paired correlation coefficient has a value of 0.9865, which means that there is a strong relationship between properties (conditions) and the result of the experiment. Using the values of the standardized canonical coefficients in the first column of
Table 11, the first canonical variable
(or variable
from
Table 12) is determined using the following formula:
The graphical depiction of the canonical correlation analysis for the first canonical pair is shown in
Figure 13. On the left side, there are the original variables, which form the canonical variable
U, and on the right side, there are the variables forming the canonical variable
V. The pair
represents the first pair of canonical variables, the correlation of which is determined by the canonical correlation coefficient
.
In an analogous way, we can determine other pairs of canonical variables,
U and
V. Standardized canonical coefficients are shown in
Table 11 and
Table 12.
The values of the canonical variables
U and
V are calculated using canonical coefficients. A graphical representation of the course of dependence between individual pairs of canonical variables is shown in
Figure 14. The graphs confirm previous findings that the first two pairs of canonical variables have a high canonical correlation and are the most important compared to the other pairs.
A similar interpretation of variables is obtained by establishing a correlation between each variable and the corresponding canonical variable. In
Table 13, there are the correlations (Pearson coefficient of correlation
r) between the original variables determining the properties (or result) of the experiment and the canonical variables
U and
V.
For example, it follows (
Table 13) that the first canonical variable
is dominated by the variable Type (
r = 0.797). The canonical variable
is dominated by the variables Weight (
r = 0.655) and Height (
r = 0.661). The first canonical variable
is dominated by the variables
Erelat (
r = −0.769) and Δ
Ftension (
r = −0.780). The canonical variable
is dominated by the variable
Fimpact (
r = 0.996).
Table 13 is also supplemented by the correlation between the original input variables from the first group Property (or the second group Result) and the canonical variable
V (or the variable
U).
The explanation of canonical variables is complemented by the analysis of the variability and redundancy, the meaning of which lies in the expression of the proportion of the variability of variables of one group explained by the linear combination of the other group of variables (
Table 14).
The total variability of the canonical variable U is 0.4686. This means that the canonical variable U is explained with 46.86% variability. The first two canonical variables are most involved in the explanation, with explaining 21.19% of the variability and explaining 21.82% of the variability. The other two canonical variables and together explain only 3.85% of the variability.
The total variability of the canonical variable V is 0.7221. This means that the canonical variable V is explained at 72.21% of the variability. The first two canonical variables are most involved in the explanation, with explaining 33.96% of the variability and explaining 37.45% of the variability. The last two canonical variables and together explain only 0.80% of the variability.
The total redundancy for the first group of variables determining the properties of the experiment (Properties) is 0.4241. That is, the variables of the second group determining the result of the experiment (Result) explain 42.41% the variability of the variables in the first group, and thereby the information about the first group is 57.59% redundant. The first two canonical variables and are most involved in explaining this variability, explaining 20.90% and 20.07% of the variability of the variables in the first group, respectively.
The total redundancy for the second group of variables (Result) is slightly higher, namely 0.6560. That is, the variables of the first group (Properties) explain 65.60% of the variability of the variables in the second group, signalling that they contain 34.4% of the excess information about the second group. The first two canonical variables, and , are the most involved in explaining this variability, explaining 33.05% and 31.76%, respectively, of the variability of the variables in the second group.


