Abstract
In open-air explosion experiments, the measured blast pressure characteristics often show high Coefficients of Variation (COV), causing reproducibility issues. Shock tubes can address this problem. They consist of a driver section, where the shock is generated, and a driven section, where it is transmitted. The shock can be produced using either gas or high explosives (HEs). The intensity of gas-generated shocks are limited due to the driver section’s size, making HE-based shock tubes more suitable for replacing open-field detonation tests. This study derived experimental conditions for an HE-based shock tube to replicate the pressure characteristics from open-air experiments. Conditions include the sealed status of the driver section, TNT location and amount, expansion tube presence, and target location. When TNT was centered at the driver section and the driver section was sealed, reflections caused the peak pressure to occur twice, which is unsuitable for target loading. The COV values of reflected pressures at different locations of target were high without target contact but dropped significantly with contact, showing that target contact with the shock tube is necessary for uniform pressure generation. Additionally, it was confirmed that using the expansion section also resulted in low COV values for both reproducibility and uniform pressure.
1. Introduction
Accidental explosions or terrorist attacks can have a devastating impact on structures. The blast resistance of structures can be tested and verified through experiments [1,2,3], which can help mitigate the damage caused by explosions. Blast pressure is influenced by the mass of the explosive and the distance from the explosion, and it can be predicted using the scaled distance. Additionally, blast pressure reaches its peak in the initial phase and then rapidly decreases within a short duration [4]. However, explosion tests conducted in open spaces often exhibit high variability in shock characteristics, making it challenging to achieve the required shock load within a limited number of tests.
Twisdale et al. [5] analyzed the Coefficients of Variation (COV) of various blast characteristics based on 325 explosion data, finding that the peak reflected pressure had a COV of 0.30, and the reflected impulse had a COV of 0.25. Bogosian et al. [6] reported that COVs of the peak reflected pressure and the peak incident pressure were 0.23 and 0.28, respectively. In general, detonation tests exhibit a COV range of 0.23 to 0.30 in blast characteristics, which can pose reproducibility issues.
To address these reproducibility issues, shock tube tests can be applied [7]. A shock tube consists of a driver section, which generates the initial pressure, and a driven section, where the shock propagates. Since the driver section is subjected to higher pressure than the driven section, it is often thicker. This thickness is one of the factors that determine the pressure generation capacity of the shock tube. If the target is larger than the diameter of the driven section, an expansion section may be used at the end of the driven section to expand the shock wave application area. Shock tube tests can be classified into three types based on how the shock is generated: releasing compressed gas [8,9,10,11,12,13,14,15,16,17], detonating combustible gas [18,19,20], and detonating explosives [7,21,22].
In compressed gas shock tubes, there is a diaphragm between the driver and driven sections. Gas is continuously injected into the driver section. The diaphragm ruptures when an allowable pressure is exceeded, generating the shock wave. The University of Ottawa’s shock tube [8,9,10,11] has a cylindrical driver section with a diameter of 597 mm and the length can be adjusted from 305 mm to 5158 mm. An aluminum sheet was used for the diaphragm. The driven section was 6096 mm long and had an attached expansion section. The expansion section started with a circular cross-section of 597 mm in diameter and expanded to a square cross-section of 2032 mm. The maximum reflected pressure and maximum reflected impulse that could be generated were approximately up to 0.1 MPa and 2.2 MPa·ms [9]. Nian et al. [12] used a shock tube with a driver section length and an internal diameter of 1300 mm and 89 mm, respectively. A screw-driven piston was installed at the end of the driver section, allowing the adjustment of its length. The driver and driven sections were connected by a 200 mm nozzle, with a diaphragm located in front of the nozzle attached to the driver section. The diaphragm was made of 1.6 mm thick aluminum. The driven section had a length of 3300 mm and an internal diameter of 45 mm, and the generated peak reflected pressure ranged from 0.5 to 1.5 MPa. In the SIMLab shock tube [13,14,15], the driver section with an internal diameter of 331 mm and a length of 2020 mm can be modified in 250 mm increments. An aluminum sheet was used for the diaphragm. The driven section had a length of 16,120 mm and transitioned from a circular cross-section to a square cross-section of 300 mm. A window section allowed the capture of internal phenomena using high-speed cameras. And a tank was located at the end of the driven section. Skotak et al. [16] used a shock tube with a driven section length and a square cross-section of 6800 mm and 710 mm, respectively. Grafix, Cleveland, OH were used for the diaphragm. The maximum incident pressure recorded at 3.5 m was 210 kPa. Andreotti et al. [17] used a shock tube with a driver section length and diameter of 2350 mm and 481 mm, respectively. A 2 mm thick structural steel was used as the diaphragm. The driven section had a length of 10,500 mm and a diameter of 481 mm, and the generated peak incident pressure was 0.1 MPa.
The driver and driven sections were connected by a 200 mm nozzle, with a diaphragm located in front of the nozzle attached to the driver section. The diaphragm was made of 1.6 mm thick aluminum. The driven section had a length of 3300 mm and an internal diameter of 45 mm, and the generated peak reflected pressure ranged from 0.5 to 1.5 MPa.
In shock tubes using gas explosions, the driver section contained combustible gas. A specific amount of combustible gas can be accumulated and then ignited to create an explosion. In the Virginia Tech Shock Tube Research Facility [18,19,20], the shock tube generates shock waves in the driver section using up to 40 cubic feet of oxy-acetylene gas. A plastic membrane was used. For tests requiring a gas volume of less than 3.75 cubic feet, plastic bags can be used without a membrane. The driver section gradually increased in cross-sectional area, eventually reaching a cross-section of 2143 × 2440 mm. The maximum reflected pressure recorded was 0.2 MPa, and the maximum reflected impulse was 2 MPa·ms [20].
Rhouma et al. [21] conducted experiments using a shock tube with an internal diameter of 100 mm, a wall thickness of 10 mm, and a total length of 800 mm, without distinguishing between the driver and driven sections. The experiments used 10 g, 20 g, 30 g, and 50 g of C4 explosives, with peak reflected pressure and reflected impulse measurements taken only for 10 g and 20 g to avoid damage to the pressure sensors. The peak reflected pressure and reflected impulse were recorded as 15.3 MPa and 2.1 MPa·ms for 10 g, and 32.3 MPa and 3.8 MPa·ms for 20 g. Louar et al. [7] used a shock tube with an internal diameter of 168.2 mm and a length of 1200 mm. C4 explosives weighing 5, 10, 15, 20, 30, and 40 g were used. At 20 g, the peak reflected pressure was recorded as 13 MPa, while data for 30 g and 40 g were not provided due to sensor saturation. The COV values for the shock tube used were reported to be between 0.1 and 0.15. Mu et al. [22] used a shock tube with an internal diameter of 2500 mm and a length of 18,000 mm. TNT charges weighing up to 160 kg were used, and at this maximum charge, the peak incident pressure was recorded as 5.49 MPa.
Table 1 summarizes the shock tube tests. In shock tubes using compressed gas, the maximum peak reflected pressure was 1.5 MPa. For shock tubes using combustible gas, the maximum reflected pressure was 0.2 MPa. When HE was used for shock, the maximum peak reflected pressure was 32.3 MPa. Without considering that a measurement was conducted only for the cases using less than 20 g of C4, HE-based shock tubes show higher shock generating capacity than gas-based ones. The size of the shock is limited in gas-based shock tubes, which require a large volume of the driver section. In HSE-based shock tubes, an increased mass of HE can easily generate high pressure if the driver section can withstand the shock.

Table 1.
Summary of shock tubes.
In this paper, HE-based shock tube setup conditions were studied through experiments to replicate pressure characteristics from open-field detonations. Variables affecting the pressure characteristics in the shock tube include the position and mass of TNT in the driver section, the sealing condition of the driver section, the contact between the shock tube and the target, and the presence of an expansion section.
2. Shock Tube Experimental Setup
2.1. Shock Tube Description
In this experiment, the shock tube at the Agency for Defense Development (ADD) was used, and it is structured as shown in Figure 1. The shock tube is made of steel, with a diameter of 1 m and a length of 15 m. The close–open device is designed to seal the left side of the driver section and can be moved by pushing or pulling along a floor rail. The driver section, where the detonation occurs, is designed to be thicker than the driven section. Additionally, due to the possibility of driver section failure during detonation, it is encased in a concrete box with a length of 4 m to reduce surrounding damage. The driven section consists of two 4 m tubes and one 3 m tube, making a total length of 11 m. The pressure generated in the driver section propagates through the driven section, resulting in the generation of a one-dimensional pressure. An expansion section can be used to increase the test area and has a diameter of 2.5 m and a length of 3 m. The 3 m tube of the driven section is removed and then replaced with the expansion section.
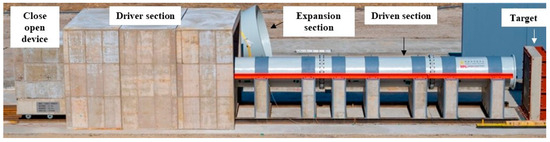
Figure 1.
Shock tube system.
2.2. Shock Tube Experimental Cases
The shock tube test was conducted in three different cases, considering factors such as the sealing of the left side of the driver section, the position and mass of the TNT, the contact between the target and the shock tube, and the presence of an expansion section.
In case 1, the driver section, TNT position and mass, and the contact status between the shock tube and the target were considered. In case 2, the left-side sealing of the driver section was examined without using an expansion section. In case 3, the sealing of the driver section was assessed when the expansion section was utilized. In the tests, both the incident pressure and the reflected pressure were measured. The incident pressure was measured on the inner sidewall of the shock tube, while the reflected pressure was measured on the target.
Figure 2 presents the experimental setup for case 1. In case 1, the study focused on examining the effect of TNT positioning within the driver section, differentiating between placements at the center and the left side. Additionally, the effect of target contact was examined. The left side of the driver section was sealed, and no expansion section was used. Pso shows the location of incident pressure sensors.
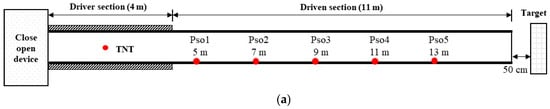
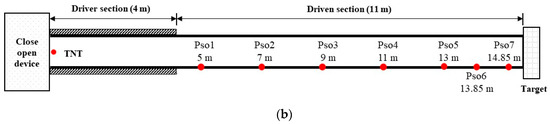
Figure 2.
Experimental setup for case 1: (a) case 1-1; (b) case 1-2.
Figure 2a shows the experimental setup for case 1-1, where the TNT is positioned at the center of the driver section, and the target is not in contact with the shock tube. Detonations were conducted eight times with varying TNT masses (4.5 kg three times, 9 kg three times, 13.5 kg once, and 18 kg once). Figure 2b displays the setup for case 1-2, where the TNT is positioned on the left side of the driver section, with the target in contact with the shock tube. Six detonations were performed with different TNT masses (4.4 kg three times, 8.8 kg two times, and 13.2 kg once).
Figure 3 presents the experimental setup for case 2. In case 2, the study focused on examining the effects of the driver section being sealed. The TNT was positioned on the left side of the driver section, with no expansion section used, and the target was in contact with the shock tube.
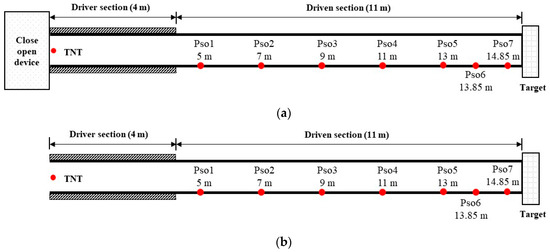
Figure 3.
Experimental setup for case 2: (a) case 2-1; (b) case 2-2.
Figure 3a shows the experimental setup for case 2-1, where the driver section is sealed. Detonations were conducted a total of 14 times, with varying TNT masses (0.45 kg six times, 0.9 kg five times, and 1.35 kg three times). Figure 3b shows the setup for case 2-2, where the driver section is not sealed. In this case, detonations were conducted 5 times, with varying TNT masses (0.45 kg two times and 0.9 kg three times).
Figure 4 presents the experimental setup for case 3. In case 3, the study focused on examining the effects of the driver section being sealed when an expansion section was used. The TNT was positioned on the left side of the driver section and the target was in contact with the shock tube.
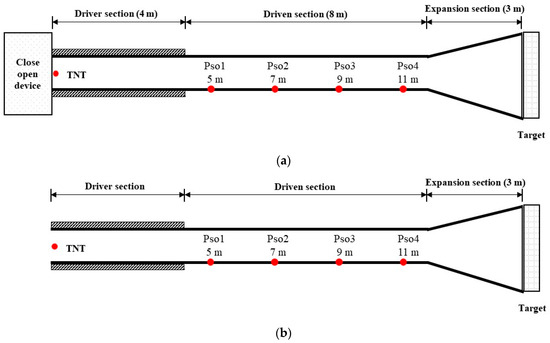
Figure 4.
Experimental setup for case 3: (a) case 3-1; (b) case 3-2.
Figure 4a shows the experimental setup for case 3-1, where the driver section is sealed. In case 3-1, detonations were conducted a total of 15 times, with varying TNT masses (1 kg eight times, 2 kg two times, 4.4 kg three times, 8.8 kg once, and 17.6 kg once). Figure 4b shows the experimental setup for case 3-2, where the driver section is left unsealed. In case 3-2, detonations were conducted a total of 5 times, with varying TNT masses (4.4 kg four times and 8.8 kg once).
A summary of the experimental setup for each case is shown in Table 2.
Table 2.
Summary of test conditions.
In the shock tube test, data were measured for both Pso (incident pressure) and Pr (reflected pressure). Table 3 shows the Pso measurement locations. Table 4 shows the locations of the Pr measurements taken at the target, with reference to the center of the shock tube.
Table 3.
Summary of Pso locations.
Table 4.
Summary of Pr locations.
3. Experiment Results
3.1. Experimental Results for Case 1
For case 1-1, the expansion section was not used, and the TNT was detonated at the center of the driver section with the driver section sealed. Additionally, the shock tube and the target were not in contact. Table 5, Table 6 and Table 7 show the peak incident pressure measured during the test. The COV values ranged from 0.024 to 0.17.
Table 5.
Measured peak incident pressures in case 1-1 (TNT of 4.5 kg).
Table 6.
Measured peak incident pressures in case 1-1 (TNT of 9 kg).
Table 7.
Measured peak incident pressures in case 1-1 (TNT of 13.5 kg and 18 kg).
Figure 5 shows the incident pressure histories measured at Pso 2, Pso 3, and Pso 5 during round 2, where two peaks were observed. Table 8 shows the arrival times of the first and second peak pressures. The farther the sensor is from the detonation point, the longer it takes for the first and second peak to arrive at it. This suggests that the shock generated at the center of the driver section resulted in a normal reflection shock wave due to the sealed condition of the driver section. This secondary peak pressure impacted the target. Therefore, since the pressure characteristics generated in open-field experiments are characterized by a single peak incident pressure measurement, the test conducted with TNT detonated at the center of the sealed driver section is not suitable.
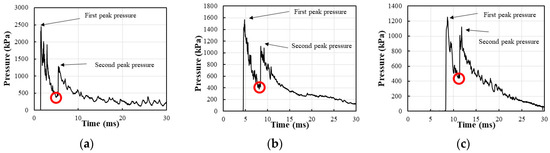
Figure 5.
Incident pressure histories of round 2: (a) Pso 2; (b) Pso 3; (c) Pso 5.
Table 8.
Arrival times of peak incident pressures in round 2.
Table 9, Table 10 and Table 11 present the peak reflected pressure for case 1-1. The peak reflected pressure observed on the target showed a significant difference between the minimum and maximum values depending on the measured locations, approximately doubling. This was due to the lack of contact between the shock tube and the target. The COV values were categorized into two groups: one for observing uniform pressure at the target and the other for assessing reproducibility. The COV values for the uniform pressure ranged from 0.20 to 0.29, while the COV values for reproducibility ranged from 0.0065 to 0.11. Thus, the measurement of a uniform pressure was unsuccessful, although reproducibility was high.
Table 9.
Measured peak reflected pressures in case 1-1 (TNT of 4.5 kg).
Table 10.
Measured peak reflected pressures in case 1-1 (TNT of 9 kg).
Table 11.
Measured peak reflected pressures in case 1-1 (TNT of 13.5 kg and 18 kg).
Figure 6 illustrates the reflected pressure history in round 2. The peak reflected pressure was recorded twice. This reaffirms that the second peak reflected pressure impacted the target due to the sealed condition of the shock tube.
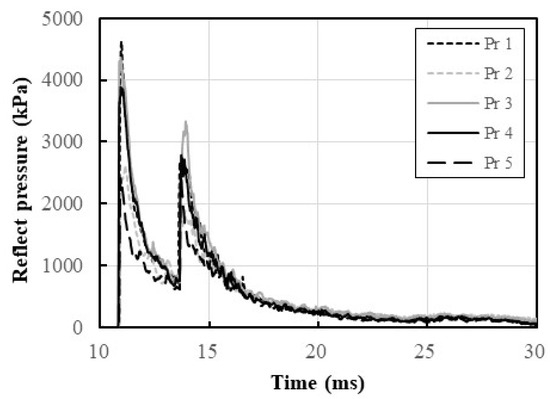
Figure 6.
Reflected pressure histories in round 2.
The experimental setup for case 1-2 involved detonating TNT on the left side of the driver section while the driver section was sealed, the expansion section was not used, and the target was in contact with the shock tube. Table 12, Table 13 and Table 14 show the peak incident pressure measured. The COV values ranged from 0.01 to 0.15.
Table 12.
Measured peak incident pressure in case 1-2 (TNT of 4.4 kg).
Table 13.
Measured peak incident pressure in case 1-2 (TNT of 8.8 kg).
Table 14.
Measured peak incident pressure in case 1-2 (TNT of 13.2 kg).
Figure 7 shows the incident pressure history at Pso 2, Pso 5, and Pso 7 during round 12, where two peaks were observed. Table 15 shows the arrival times of first and second peak pressures. The secondary peak arrival sequence was observed in the order of Pso 7, Pso 5, and Pso 2, which is likely due to the pressure reflected from the target. Therefore, when the TNT was positioned on the left side in a sealed driver section, two peak incident pressures were observed, but only one peak pressure affected the target. In this configuration, wave propagation occurred, while superposition also took place simultaneously, increasing the pressure and resulting in a single peak.
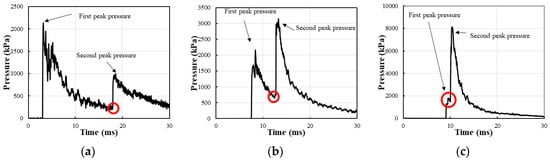
Figure 7.
Incident pressure histories of round 12: (a) Pso2; (b) Pso 5; (c) Pso 7.
Table 15.
Arrival times of peak incident pressure in round 12.
Table 16 and Table 17 present the peak reflected pressure for case 1-2. The COV values for the uniform pressure measurements ranged from 0.067 to 0.15. This was lower compared to the COV values of case 1-1 (0.2 to 0.29). Therefore, it can be concluded that case 1-2 exhibited a load profile that was more similar to a uniform pressure than case 1-1. The COV values for reproducibility in this experiment ranged from 0.068 to 0.14, indicating higher reproducibility compared to the results obtained in open-field experiments (COV 0.23 to 0.3).
Table 16.
Measured peak reflected pressure in case 1-2 (TNT of 4.4 kg).
Table 17.
Measured peak reflected pressure in case 1-2 (TNT of 8.8 kg).
Figure 8 illustrates the pressure history of the reflected pressure over time for round 9. The peak reflected pressure was observed only once, resembling the pressure generated in open-field experiments.
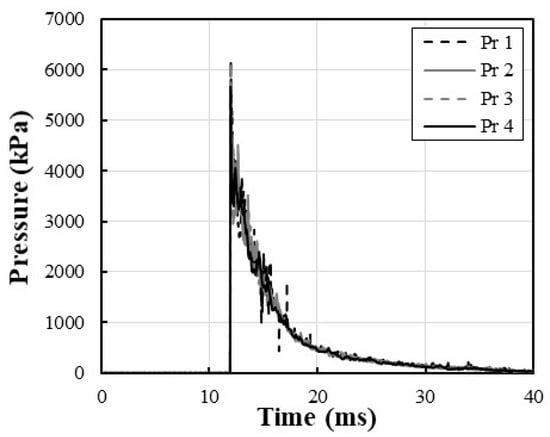
Figure 8.
Reflected pressure measurement results in round 9.
3.2. Experimental Results for Case 2
In case 2, experiments were conducted to examine the effects of sealing the left side of the shock tube driver section. The methodology for case 2-1 involved sealing the driver section, with the TNT placed on the left side. The expansion section was not used, and the target was in contact with the shock tube. Table 18, Table 19 and Table 20 show the peak incident pressure measured during the test. The COV for these measurements ranged from 0.01 to 0.18.
Table 18.
Measured peak incident pressure in case 2-1 (TNT of 0.45 kg).
Table 19.
Measured peak incident pressure in case 2-1 (TNT of 0.9 kg).
Table 20.
Measured peak incident pressure in case 2-1 (TNT of 1.35 kg).
In case 2-2, the driver section was not sealed, with the TNT placed at the left side of the driver section. Similarly to case 2-1, the expansion section was not used, and the target was in contact with the shock tube. Table 21 and Table 22 present the peak incident pressure for case 2-2. The COV for these measurements ranged from 0 to 0.14.
Table 21.
Measured peak incident pressure in case 2-2 (TNT of 0.45 kg).
Table 22.
Measured peak incident pressure in case 2-2 (TNT of 0.9 kg).
Table 23 represents the average peak incident pressures for case 2. The average peak incident pressures are observed experimental data using comparable TNT masses of 0.45 kg and 0.9 kg. The results show that the peak incident pressures are higher when the driver section is sealed. This is because in the opened state, energy is released through the unsealed portion.
Table 23.
Measured average peak incident pressure in case 2.
3.3. Experimental Results for Case 3
In case 3, experiments were conducted to assess the impact of sealing the driver section while using the expansion section. For case 3-1, the driver section was sealed, with the TNT positioned on the left side of the driver section. The expansion section was utilized, and the target was in contact with the shock tube. Table 24, Table 25, Table 26 and Table 27 present the peak incident pressure for case 3-1. The COV values ranged from 0.03 to 0.16.
Table 24.
Measured peak incident pressure in case 3-1 (TNT of 1 kg).
Table 25.
Measured peak incident pressure in case 3-1 (TNT of 2 kg).
Table 26.
Measured peak incident pressure in case 3-1 (TNT of 4.4 kg).
Table 27.
Measured peak incident pressure in case 3-1 (TNT of 8.8 kg and 17.6 kg).
Table 28, Table 29, Table 30 and Table 31 present the peak reflected pressure for case 3-1. The COV values for the peak reflected pressure observed on the target for uniform pressure assessment ranged from 0.024 to 0.11. This is similar to the results observed in case 1-2. The COV values for reproducibility in this experiment ranged from 0.023 to 0.15, indicating higher reproducibility compared to the results obtained in open-field experiments (COV of 0.23 to 0.3).
Table 28.
Measured peak reflected pressure in case 3-1 (TNT of 1 kg).
Table 29.
Measured peak reflected pressure in case 3-1 (TNT of 2 kg).
Table 30.
Measured peak reflected pressure in case 3-1 (TNT of 4.4 kg).
Table 31.
Measured peak reflected pressure in case 3-1 (TNT of 8.8 kg and 17.6 kg).
In case 3-2, the experimental setup involved leaving the driver section open, with the TNT positioned on the left side of the driver section. The expansion section was utilized, and the target was in contact with the shock tube. Table 32 and Table 33 present the peak incident pressure for case 3-2. The COV values ranged from 0.05 to 0.15.
Table 32.
Measured peak incident pressure in case 3-2 (TNT of 4.4 kg).
Table 33.
Measured peak incident pressure in case 3-2 (TNT of 8.8 kg).
Table 34 presents the peak reflected pressure for case 3-1. The COV values for the peak reflected pressure observed on the target for uniform pressure assessment ranged from 0.07 to 0.11. This is similar to the results observed in case 1-2.
Table 34.
Measured peak reflected pressure in case 3-2 (TNT of 4.4 kg and 8.8 kg).
Figure 9 illustrates the reflected pressure history measured in case 3. Figure 9a presents the results from round 45 of case 3-1. Figure 9b shows the results from round 50 of case 3-2. In both cases, the reflected pressure history indicates that at the moment that the first shock wave arrived at the measuring positions, similar pressure characteristics were observed across all locations. However, a notable difference appeared at later times: in Figure 9a, an additional pressure history was observed at approximately 15 ms, while in Figure 9b, a similar additional pressure history was observed at around 17 ms.
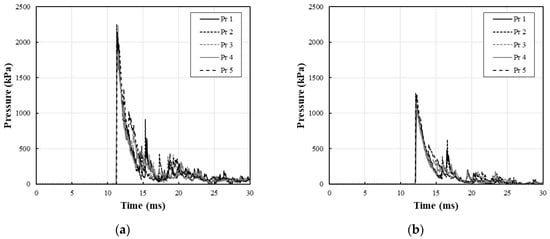
Figure 9.
Reflected pressure histories: (a) round 45; (b) round 50.
This additional pressure history observed in both figures is likely due to the reflection of the shock wave from the inclined section of the expansion section. The reflected pressure, when compared to the first measured pressure, was found to be smaller, suggesting that its impact on the target may be negligible.
3.4. Summary
The experiments conducted aimed to compare various factors, including the position of TNT detonation, the contact between the target and shock tube, the presence of the expansion section, and whether the left side of the driver section was sealed. In the shock tube experiments, the COV value ranged from 0 to 0.18, indicating better reproducibility compared to open-field experiments (0.23 to 0.3).
- Effect of TNT detonation position
The peak incident pressure was observed twice, when the detonation occurred at the center of the driver section, and the target and shock tube were not in contact. The second peak incident pressure was generated due to a reflection from the driver section. As a result, the peak reflected pressure was also observed twice. Although peak incident pressure was also observed twice when the detonation position was at the left of the driver section, it was the pressure reflected from the target. Consequently, the peak reflected pressure was measured only once. Thus, under sealed conditions, only when the TNT was positioned to the left of the driver section, the pressure characteristics resembled those typically observed in open-field experiments.
- 2.
- Effect of shock tube and target contact on uniform pressure
In case 1-1, where the shock tube and target were not in contact, the COV values of the peak reflected pressures at different locations of the target ranged from 0.2 to 0.29. On the other hand, in case 1-2, where the target was in contact with the shock tube, the COV values ranged from 0.067 to 0.15. And in case 3, when the expansion section was used, and the target was in contact with the shock tube, the COV values ranged from 0.024 to 0.11. Therefore, to obtain a more uniform distributed pressure, it is necessary for the shock tube and target to be in contact.
- 3.
- Effect of sealing the driver section
The effect of sealing the left side of the driver section can be compared in cases 2 and 3. Case 2 presents the differences when the expansion section is not used, while case 3 examines the differences with the expansion section in place. In both cases, sealing the driver section consistently resulted in higher peak incident and reflected pressures. This is because when the driver section was not sealed, the shock was released through the unsealed side.
- 4.
- Effect of expansion section
In the experiments using the expansion section, the reflected pressure was lower compared to those from the experiments without the expansion section. This is because the volume through which the shock was transmitted increased when the expansion section was used.
4. Conclusions
In this study, shock tube tests were conducted using TNT, with the amount ranging from 0.45 kg to 18 kg. The peak reflected pressure was the lowest at 0.39 MPa in round 35 and the highest at 18.09 MPa in round 8.
The COV values of incident and reflected pressures ranged from 0 to 0.18. Previous studies reported COV values ranging from 0.23 to 0.3 in open-field experiments. The shock tube experiments demonstrated more efficient reproducibility.
To check the uniformity of the reflected pressure, peak reflected pressures at various locations on the target were measured, and their COV values were derived. When the target was not in close contact with the shock tube, the COV values ranged from 0.2 to 0.29. The COV values ranged from 0.024 to 0.15 in the close-contact condition. It is recommended that the target should be in contact with the shock tube for uniformly distributed pressure. However, the current evaluation is based solely on whether the shock tube and the target were in contact, and the effects of distance between the tube and target are needed for further study.
When the driver section was sealed and the TNT was positioned at the center of the driver section, the pressure reflected from the driver section. This caused two reflected pressure peaks. Therefore, the TNT should be positioned on the left side of the driver section in sealed conditions. To ensure a more accurate representation of free-field experiments, additional experiments are needed to fine-tune the exact positioning of the TNT. Optimizing the detonation position could help minimize multiple peak pressures caused by reflections, thereby improving the reliability of the experimental results. Additionally, implementing more stringent sealing protocols for the driver section could enhance the reproducibility of the pressure characteristics by ensuring consistent internal conditions.
It is expected that the proposed experimental setup provides a practical alternative for shock wave research and development, enhancing the understanding of explosive behavior in controlled environments.
In this study, the analysis was based on peak pressure, which is a key variable influencing the open-field experiment. However, impulse also plays a significant role in the overall effects of an explosion. Therefore, further research is needed to investigate the impact of impulse and its relationship with peak pressure to provide a more comprehensive understanding of the explosive loading conditions. Furthermore, conducting experiments with a wider range of TNT amounts could help optimize the previously mentioned experimental conditions, leading to more precise and reliable results.
Author Contributions
Methodology, Y.K. (Yoonkeon Kim), J.P. and K.K.; Formal analysis, Y.K. (Youngbeom Kwon); Writing—original draft, Y.K. (Youngbeom Kwon) and J.P.; Writing—review & editing, J.P.; Project administration, Y.K. (Yoonkeon Kim), J.P. and K.K. All authors have read and agreed to the published version of the manuscript.
Funding
This work was funded by the Agency for Defense Development (Project: 9126864101/Contract: UE211138UD) by Korean Government.
Institutional Review Board Statement
Not applicable.
Informed Consent Statement
Not applicable.
Data Availability Statement
The original contributions presented in this study are included in the article. Further inquiries can be directed to the corresponding authors.
Conflicts of Interest
The authors declare no conflict of interest.
References
- Lee, S.J.; Park, J.Y.; Lee, Y.H.; Kim, H.S. Experimental analysis on the criteria of the explosion damage for one-way RC slabs. J. Korean Soc. Saf. 2017, 32, 68–74. [Google Scholar] [CrossRef]
- Schenker, A.; Anteby, I.; Gal, E.; Kivity, Y.; Nizri, E.; Sadot, O.; Michaelis, R.; Levintant, O.; Ben-Dor, G. Full-scale field tests of concrete slabs subjected to blast loads. Int. J. Impact Eng. 2008, 35, 184–198. [Google Scholar] [CrossRef]
- Morales-Alonso, G.; Cendon, D.A.; Galvez, F.; Erice, B.; Sanchez-Galvez, V. Blast response analysis of reinforced concrete slabs: Experimental procedure and numerical simulation. J. Appl. Mech. 2011, 78, 051010. [Google Scholar] [CrossRef]
- Army, U.S. Design of Structures to Resist the Effects of Accidental Explosions; Technical Manual TM5, 1300; United States Army: Arlington, VA, USA, 2008. [Google Scholar]
- Twisdale, L.A.; Sues, R.H.; Lavelle, F.M. Reliability-based design methods for protective structures. Struct. Saf. 1994, 15, 17–33. [Google Scholar] [CrossRef]
- Bogosian, D.; Ferritto, J.; Shi, Y. Measuring uncertainty and conservatism in simplified blast models. In Proceedings of the 30th Explosives Safety Seminar, Atlanta, GA, USA, 13–15 August 2002. [Google Scholar]
- Louar, M.A.; Belkassem, B.; Ousji, H.; Spranghers, K.; Kakogiannis, D.; Pyl, L.; Vantomme, J. Explosive driven shock tube loading of aluminium plates: Experimental study. Int. J. Impact Eng. 2015, 86, 111–123. [Google Scholar] [CrossRef]
- Li, Y.; Algassem, O.; Aoude, H. Response of high-strength reinforced concrete beams under shock-tube induced blast loading. Constr. Build. Mater. 2018, 189, 420–437. [Google Scholar] [CrossRef]
- Viau, C.; Doudak, G. Behavior and modeling of glulam beams with bolted connections subjected to shock tube-simulated blast loads. J. Struct. Eng. 2021, 147, 04020305. [Google Scholar] [CrossRef]
- Burrell, R.P.; Aoude, H.; Saatcioglu, M. Response of SFRC columns under blast loads. J. Struct. Eng. 2015, 141, 04014209. [Google Scholar] [CrossRef]
- Hammoud, A. Performance of High-Strength Reinforced Concrete Columns Under Shock-Tube Induced Blast Loading. Ph.D. Thesis, University of Ottawa, Ottawa, ON, Canada, 2017. [Google Scholar]
- Nian, W.; Subramaniam, K.V.; Andreopoulos, Y. Experimental investigation on blast response of cellular concrete. Int. J. Impact Eng. 2016, 96, 105–115. [Google Scholar] [CrossRef]
- Aune, V.; Fagerholt, E.; Langseth, M.; Børvik, T. A shock tube facility to generate blast loading on structures. Int. J. Prot. Struct. 2016, 7, 340–366. [Google Scholar] [CrossRef]
- Aune, V.; Casadei, F.; Valsamos, G.; Langseth, M.; Børvik, T. A shock tube used to study the dynamic response of blast-loaded plates. Proceedings 2018, 2, 503. [Google Scholar] [CrossRef]
- Kristoffersen, M.; Pettersen, J.E.; Aune, V.; Børvik, T. Experimental and numerical studies on the structural response of normal strength concrete slabs subjected to blast loading. Eng. Struct. 2018, 174, 242–255. [Google Scholar] [CrossRef]
- Skotak, M.; Alay, E.; Zheng, J.Q.; Halls, V.; Chandra, N. Effective testing of personal protective equipment in blast loading conditions in shock tube: Comparison of three different testing locations. PLoS ONE 2018, 13, e0198968.2018. [Google Scholar] [CrossRef] [PubMed]
- Andreotti, R.; Colombo, M.; Guardone, A.; Martinelli, P.; Riganti, G.; di Prisco, M. Performance of a shock tube facility for impact response of structures. Int. J. Non-Linear Mech. 2015, 72, 53–66. [Google Scholar] [CrossRef]
- Johnson, J.; Xu, M.; Jacques, E. Self-centering hybrid GFRP-steel reinforced concrete beams for blast resilience. J. Struct. Eng. 2021, 147, 04021099. [Google Scholar] [CrossRef]
- Phillips, E.E.; Murphy, R.; Connors, J.; McMullen, K.F.; Jacques, E.; Bruhl, J.C. Experimental evaluation of OSB-faced structural insulated panels subject to blast loads. Eng. Struct. 2021, 229, 111597. [Google Scholar] [CrossRef]
- Johnson, J.; Xu, M.; Jacques, E. Predicting the self-centering behavior of hybrid FRP-steel reinforced concrete beams under blast loading. Eng. Struct. 2021, 247, 113117. [Google Scholar] [CrossRef]
- Rhouma, M.B.; Maazoun, A.; Aminou, A.; Belkassem, B.; Vandenbruwane, I.; Tysmans, T.; Lecompte, D. Blast Loading of Small-Scale Circular RC Columns Using an Explosive-Driven Shock Tube. Buildings 2024, 14, 921. [Google Scholar] [CrossRef]
- Mu, Y.; Zhang, J.; Yang, M.; Huang, H.; Mao, Y.; Huang, H.; Zheng, X. Characterization of a large caliber explosively driven shock tube. Rev. Sci. Instrum. 2024, 95, 115103. [Google Scholar] [CrossRef]
Disclaimer/Publisher’s Note: The statements, opinions and data contained in all publications are solely those of the individual author(s) and contributor(s) and not of MDPI and/or the editor(s). MDPI and/or the editor(s) disclaim responsibility for any injury to people or property resulting from any ideas, methods, instructions or products referred to in the content. |
© 2025 by the authors. Licensee MDPI, Basel, Switzerland. This article is an open access article distributed under the terms and conditions of the Creative Commons Attribution (CC BY) license (https://creativecommons.org/licenses/by/4.0/).