Article

A Status Evaluation of Rock Instability in Metal Mines Based on the SPA–IAHP–PCN Model

School of Resources and Safety Engineering, Central South University, Changsha 410083, China
*
Author to whom correspondence should be addressed.
Appl. Sci. 2025, 15(5), 2614; https://doi.org/10.3390/app15052614
Submission received: 7 January 2025 / Revised: 19 February 2025 / Accepted: 26 February 2025 / Published: 28 February 2025
(This article belongs to the Special Issue Safety and Risk Analysis in Underground Engineering)

Abstract

:

Featured Application

This study proposes a novel model for dynamic risk assessment in metal mines, providing a new approach for evaluating rock instability risks and conducting risk assessments in metal mines.

Abstract

As one of the serious hazards in deep mining, rock instability will cause roof falls, rib spalling, rockburst, and other serious disasters. It will lead to significant casualties and property losses. Conducting risk assessments for rock instability is of significant importance. Firstly, an evaluation model called IAHP-SPA was proposed to address uncertainties in the weight determination process. Secondly, the Partial Connection Number (PCN) including the first-order PCN, the second-order PCN, the third-order PCN and the fourth-order PCN were introduced. Thus, a dynamic and comprehensive evaluation of rock instability in metal mines was obtained. Finally, the availability and reasonability of the proposed method were verified by comparing the results obtained with the number of microseismic events detected by the sensors in a metal mine. The proposed model provides a novel approach to dynamic risk assessment in mining, offering a reliable alternative for evaluating complex safety challenges. This method holds substantial potential for its practical application in the assessment and control of rock instability risks in deep metal mines, thereby improving safety and operational efficiency.

1. Introduction

Mineral resources including metal ore and non-metal ore are an important material basis for the development of society and the construction of national economic buildings in the whole world [1]. Globally, the depth of metal mining operations continues to increase, with South Africa and Canada standing out as prominent examples. In China, a significant number of mines have also transitioned to deep mining stages [2]. Many metal mines, therefore, have been put into production in the high-alpine and high-altitude areas in recent years, which makes a significant contribution to China’s economic development. However, with the continuous deepening of the mining process and the worsening of the mining environment, the risk of rock instability in metal mines is constantly increasing, making the safe production of metal mines increasingly complex and unpredictable, which in turn leads to rock instability [3]. Rock instability results in substantial harm and significant economic losses, establishing it as one of the primary hazards in metal mining [4]. The accurate evaluation and prediction of rock instability risks in metal mines are crucial for ensuring operational safety, minimizing economic losses, and preventing potential disasters. Such efforts play a pivotal role in enhancing the sustainability and efficiency of mining activities.
Conducting a status evaluation during the production process of enterprises is very important, as it allows for the timely detection of changes in production status. Therefore, many evaluation methods are employed to conduct a status evaluation. These include a Bayesian network [5,6], game theory [7], grey theory [8,9], fuzzy mathematic theory [10,11] evidential reasoning [12,13], and so on. Moreover, set pair analysis (SPA), put forward by Chinese scholar Zhao Keqin [14], is also an important analysis method. Because of the characteristics of dealing with certainty and uncertainty issues, SPA is widely employed in the field of status evaluation. Hu et al. [15] proposed a highly efficient deep-learning framework for evaluating wildfire events in the United States and predicting their potential causes and scale. Liao et al. [13] took advantage of SPA to analyze the inner insulation condition of power transformers to obtain the internal insulation state of the transformer. In view of evaluating the complexity and uncertainty of these parameters, the theory of fuzzy set pair analysis was adopted to make a systematic status evaluation of a power transformer by Yu et al. [16]. In a study by Zhou [17], the operating status of a wind turbine generator unit was evaluated by utilizing the SPA theory and evidential reasoning. Zuo et al. proposed a reliability-based inverse analysis method for determining the shear strength parameters of landslides, addressing the randomness, uncertainty, and nonlinearity inherent in the geotechnical materials, based on the nonlinear Mohr–Coulomb failure criterion [18]. In addition, SPA is not only used to assess the status of equipment but also the urban ecosystem health status [19], river ecosystem status [20,21] and land ecological security status [22]. So far, the SPA theory has been widely applied in the field of status evaluation. Moreover, this theory is utilized in other fields, for example, the hazard assessment of biomass gasification stations [23], the evaluation of surrounding rock stability [24], flood risk assessment [25], risk assessment of water pollution sources [26], risk assessment of water inrush in karst tunnels [27], and the occupational hazard of coal mining [28]. The IAHP method has further reduced the subjectivity inherent in expert judgment based on AHP; however, subjectivity remains a concern. To minimize this influence further and obtain more objective risk assessment results for metal ores, an IAHP–SPA model is proposed in this study to perform a comprehensive evaluation of rock instability in metal mines. Compared to previous methods, the IAHP–SPA model further mitigates the impact of expert judgment biases, enabling more reliable parameter weight values.
Due to the prolonged duration of metal mining operations, solely performing a static evaluation of the rock instability status in metal mines is inadequate. In view of that, the partial connection number, including the first PCN, the second PCN, the third PCN and the fourth PCN, is introduced to analyze the development trend. The partial connection number, an adjoint function of the connection number, was proposed by Zhao in 2005 [29]. Because of the superiority of analyzing the development trend of the evaluation system, the PCN has been widely used in various fields. Xie et al. [30] predicted the risk development trend of each factor of human factors by using the partial connection number. In the study of Su et al. [31], the development of dam seepage behavior was forecasted using the partial connection number. Based on the partial connection number, the risk of a developing trend and a type of metro tunnel crossing an underground pipeline was analyzed by Xie et al. [32]. Shi et al. [33] forecast the risk development trend of aviation maintenance by utilizing the partial connection number. In addition, the partial connection number is widely utilized in the subway construction field [34], the spread of internet public opinion [35], the student education field [36], and so on. Therefore, the dynamic evaluation of rock instability in metal mines can be performed using the PCN. In the end, the results of both static and dynamic evaluations for metal mines are obtained.
For the weight of the index, the Interval Analytic Hierarchy Process (IAHP) is used to calculate the weight interval [37,38]. However, if the interval number is not a specific weight value, then it is calculated by introducing the three-element connection number in the SPA theory. Then, the contributions of static and dynamic parameters are analyzed [39]. Following this, the model is validated using a real-world case study in Shaanxi. Meanwhile, we provide practical recommendations for mine safety. Lastly, we evaluate the effectiveness of the SPA–IAHP–PCN model in assessing rock instability risks in metal mines under dynamic conditions. The process of the SPA–IAHP–PCN model includes four parts: construction of the index evaluation system and calculation of index weights (Section 2.1), establishment of the five-element identical-discrepancy-contrary model (Section 2.2), conformation of PCN (Section 2.3), and constructing the SPA–IAHP–PCN model (Section 2.4).

2. Methodology

2.1. Calculation of Index Weight Value

Through a review of the relevant literature and consultation with engineers and professors specializing in the field of rock instability hazards in metal mines, an index evaluation system for metal mines is established based on the specific conditions of the assessed mines. The evaluation system is composed of the cumulative number of events, cumulative microseismic event energy, cumulative apparent stress, and cumulative logarithmic seismic moment. The evaluation index system for assessing the instability status of rock in metal mines, along with the definitions of its respective parameters, is shown in Figure 1.
For establishment of index system, the index weight is calculated in this section. IAHP is employed to confirm the weight interval. Considering that the weight interval is not a specific weight value, SPA is introduced to convert the weight interval into a specific weight value.
SPA is a connecting mathematical method proposed by Chinese scholar Zhao Keqin in 1989 [14]. SPA is superior to traditional analytical methods in the aspect of handling uncertain problems. Moreover, the uncertainty of two sets can be analyzed by the characteristics of set pair and construction of a connection degree to them [40]. The pair set H = (A, B) is made up of two sets A and B, and the total number of the characteristics in set H is N; then the amounts of identical characteristics is S; in addition, the number of discrepant characteristics is F; and the amount of contradictory characteristic is P. Then, the S, F, P and N satisfy N = S + F + P. At last, the connection degree (CD) represented by μ is calculated by Equation (1),
μ = S N + F N i + P N j = a + b i + c j
where μ denotes connection degree (CD), a denotes identity degree, b denotes discrepancy degree, c denotes contradistinction degree, i ∈ [−1, 1] denotes uncertainty coefficient of discrepancy degree, j = −1 denotes the contradictory coefficient and the relation of a, b and c should satisfy a + b + c = 1 [41,42].
In the evaluation system, each index has a different level of impact on the system. Therefore, IAHP-SPA proposed in this paper is used to determine the weights of the index. The detailed calculation process of IAHP-SPA is presented as follows:
Step 1: Establishment of the interval pairwise comparison matrix
Based on the 1~9 scaling rules proposed by Saaty [43], the relative importance of each influencing index is evaluated by the famous experts, scholars and engineers invited in the field of rock instability of metal mines. The interval pairwise comparison matrix A, therefore, is established as Equation (2).
A = 1 , 1 a 12 L , a 12 U a 1 n L , a 1 n U a 21 L , a 21 U 1 , 1 a 2 n L , a 2 n U a n 1 L , a n 1 U a n 2 L , a n 2 U 1 , 1
where aijL and aijU denote the relative importance of the i-th matrix over the j-th matrix and aijL and aijU are, respectively, the lower and upper boundary of interval number [aijL, aijU].
Additionally, the AL and AU can be obtained on the basis of the interval number theory [38].
A L = 1 a 12 L a 1 n L a 21 L 1 a 2 n L a n 1 L a n 2 L 1 ,   A U = 1 a 12 U a 1 n U a 21 U 1 a 2 n U a n 1 U a n 2 U 1
Step 2: Calculation of the maximum eigenvalues and maximum eigenvectors
The maximum eigenvalue γL and γU, corresponding to AL and AU, can be calculated using Matlab software (R2023b), respectively. What is more, the standardized eigenvectors βL and βU corresponding to AL and AU, respectively, are obtained.
Step 3: Determining the interval weights presented by Equations (4)–(6).
k = j = 1 n ( 1 i = 1 n a i j U )
h = j = 1 n ( 1 i = 1 n a i j L )
W i = [ w i L , w i U ] = [ k β L , h β U ]
Step 4: Consistency check
The consistency check, playing a significant role in the process of calculating weight, can be derived by Equation (7) [44].
z * = i = 1 n ( w i U w i L ) < ζ
where z* represents the consistency of the interval judgment matrix of status evaluation of rock instability in metal mines. Generally, the smaller the z*, the better the consistency of the judgment matrix of status evaluation of rock instability in metal mines; ζ is the correlation coefficient between z* and the conformance rate of AHP, and its value can be obtained in Table 1.
Step 5: Calculation of specific weight value
The interval weight of evaluation index of metal mine is structured according to step 1–4. However, the specific weight value of influencing factors cannot be obtained. In view of this, we make use of set pair analysis (SPA) [40], employed usually to solve the integration problem of certain and uncertain encountered in multi-objective decision making, to calculate the specific weight value, which determines the correctness of the assessment results of the metal mine. The relative relations of two sets are reflected by the connection degree (CD). In addition, the CD is employed to characterize the Fuzziness and randomness with respect to the uncertain [45]. The definition of algorithm for the CD can be obtained by Equation (1).
Moreover, Equation (1) can be expressed as Equation (8) considering the index weight wi ∈ [0, 1].
μ i = a i + b i i + c i j = w i L + ( w i U w i L ) i + ( 1 w i L ) j
where μi denotes the connection degree (CD), ai = wiL denotes the identity in the theory of SPA, bi = (wiUwiL) denotes the discrepancy degree in the theory of SPA, and ci = (1 − wiL) denotes the contradistinction degree in the theory of SPA.
Finally, the specific weight, w = (w1, w2, w3, … wn), can be obtained according to Equations (9)–(11).
p i = 1 + a i c i k = 1 n ( 1 + a k c k )
q i = 1 b k = 1 n ( 1 b k )
w i = p i q i k = 1 n p i q i

2.2. Establishment of Five-Element Identical-Discrepancy-Contrary Model

The three-element connection degree is the general connection degree and the multi-connection can be obtained after bi in Equation (1) is further expanded into bi = b1i1 + b2i2 + b3i3 + …+ bkik, when k = 3, the five-element connection degree can be obtained as Equation (12) [42], and the coefficient a, b1, b2, b3 and c represent the status of the metal mine corresponding to level I (the status is very good), level II (the status is good), level III (the status is medium), and level IV (the status is poor) and level V (the status is very poor), respectively. For example, suppose the b1 = max {a, b1, b2, b3, c}, the status of metal mine is judged as level II (the status is good).
μ = a + b 1 i 1 + b 2 i 2 + b 3 i 3 + c j
Based on the index weight matrix W, expert evaluation matrix R and Coefficient matrix E, the five-element identical-discrepancy-contrary model is constructed as Equation (13).
μ C N = W × R × E T = [ w 1 , w 2 , w 3 , , w n ] μ 11 μ 12 μ 13 μ 14 μ 15 μ 21 μ 22 μ 23 μ 24 μ 25 μ n 1 μ n 2 μ n 3 μ n 4 μ n 5 1 i 1 i 2 i 3 j = k = 1 n w k μ k 1 + k = 1 n w k μ k 2 i 1 + k = 1 n w k μ k 3 i 2 + k = 1 n w k μ k 4 i 3 + k = 1 n w k μ k 5 j
where wk, calculated by the SPA–IAHP in Section 2.1, denotes the weight of each index and k = 1 n w k = 1 , k = 1, 2, 3, 4, …, and n and k denote the number of index. E denotes coefficient matrix. In expert evaluation matrix R, μ = Nij/N, and N represents the total number of selected units, and Nij represents the total number of units where index i is at level j.

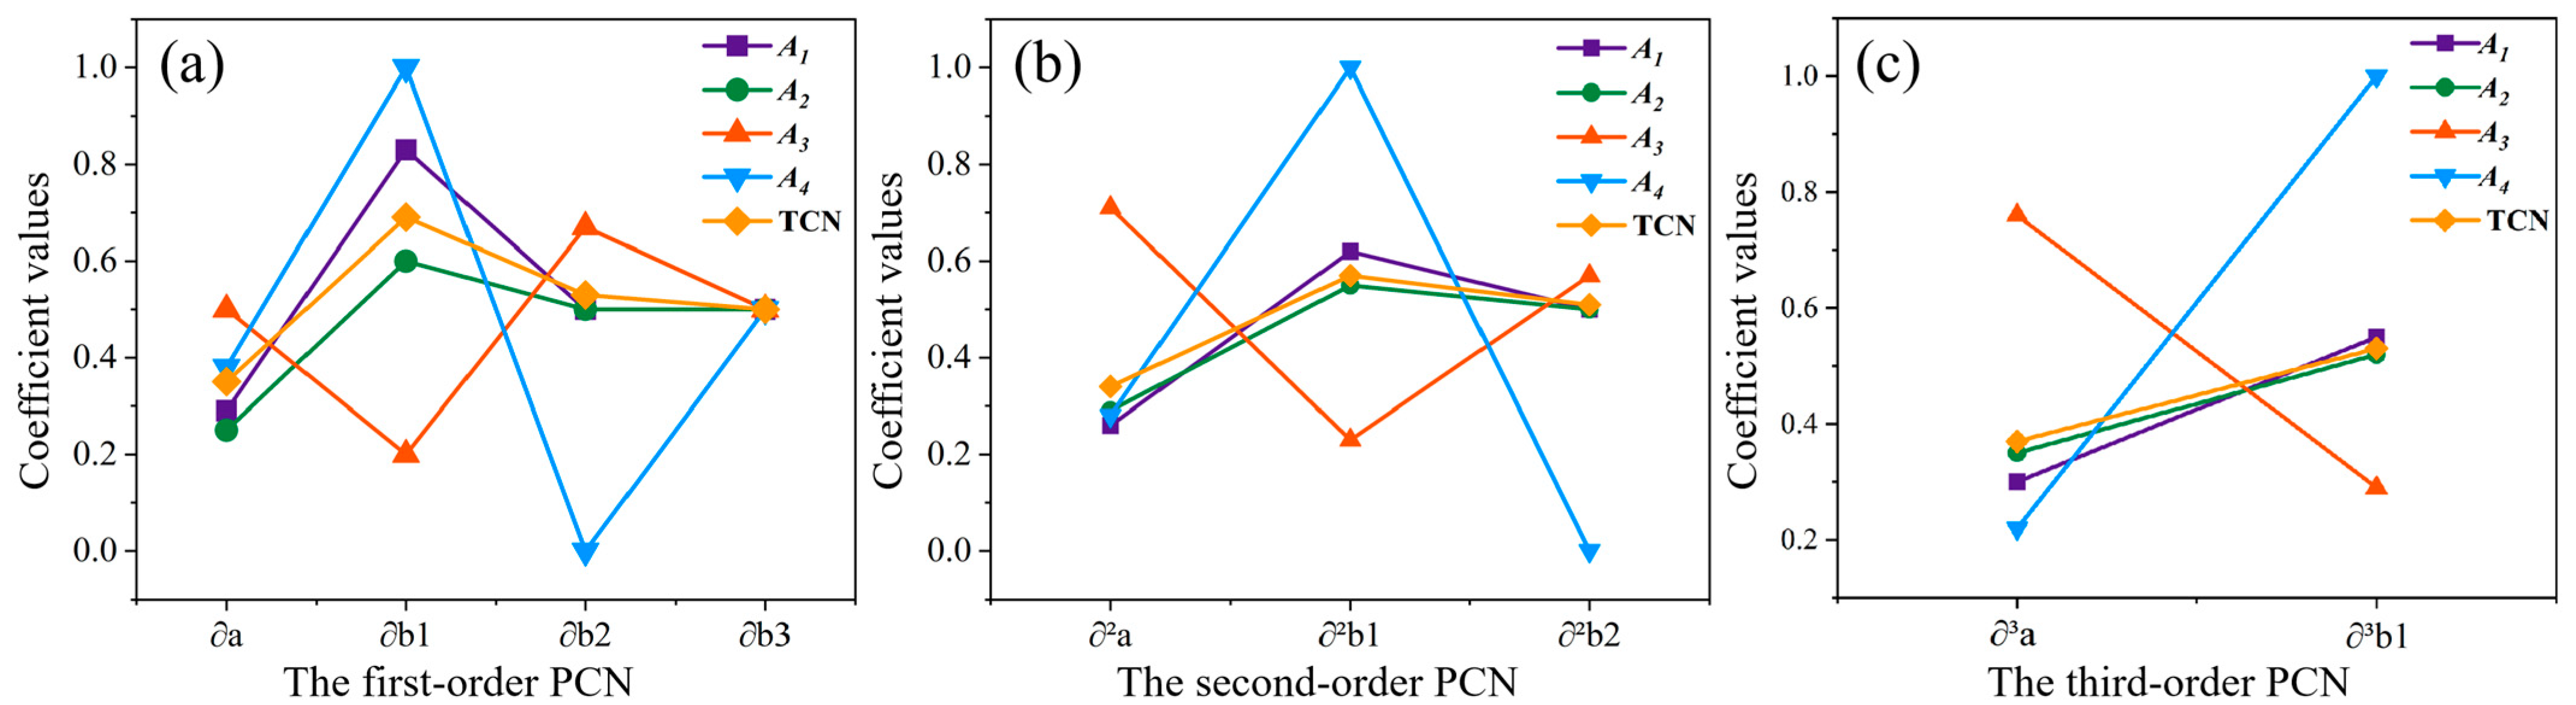
2.3. Conformation of PCN

Utilizing the PCN, the status development trend of evaluation system can be forecasted. Moreover, the development trend of characteristics, namely identity degree, discrepancy degree and contradistinction degree, can be accurately reflected by the partial connection number of total connection number (TCN) [36]. For five-element connection number, μ = a + b1i1 + b2i2 + b3i3 + cj, “a” represents that the status of rock instability in the metal mine is level I (very good), while “b1” represents that the status of rock instability in the metal mine is level II (good). Since the status level of rock instability in the metal mine changes over time, it can be considered that level I (very good) develops from level II (good). Therefore, the proportion of metal mine status developing from level II (good) to level I (very good) can be characterized by a/(a + b1) and ∂a= a/(a + b1). Similarly, the ∂b1, ∂b2 and ∂b3 are obtained. The ∂μ, the first partial connection number, is defined as Equation (17). At last, the second partial connection number, the third partial connection number and the fourth partial connection number can be calculated in a similar way (Equations (18)–(20)). The detailed calculation process of the PCN is below.
The first-order PCN can be obtained on the basis of Equation (12), and that is expressed by Equation (14).
μ = a + b 1 i 1 + b 2 i 2 + b 3 i 3
where ∂a = a/(a + b1), ∂b1 = b1/(b1 + b2), ∂b2 = b2/(b2 + b3), ∂b3 = b3/(b3 + c), i1 ∈ [0, 1], i2 ∈ [−1, 0], i3 = −1
The second partial connection number can be obtained on the basis of Equation (14), and that is expressed by Equation (15).
2 μ = μ = 2 a + 2 b 1 i 1 + 2 b 2 i 2
where 2a = ∂a/(∂a + ∂b1), 2b1 = ∂b1/(∂b1 + ∂b2), ∂2b2 = ∂b2/(∂b2 + ∂b3), i1 ∈ [−1, 1], i2 = −1.
The third partial connection number can be obtained on the basis of Equation (15), and that is expressed by Equation (16).
3 μ = 2 μ = 3 a + 3 b 1 i 1
where 3a = 2a/(2a + 2b1), 3b1 = 2b1/(2b1 + 2b2), i1 = −1.
The fourth partial connection number can be obtained on the basis of Equation (16), and that is expressed by Equation (17).
4 μ = 3 μ = 4 a
where 4a = 3a/(3a + 3b1).
It is particularly important to note that the PCN is a tool used to describe uncertainty, with its function focusing on the values of the connection coefficients. For example, in the ternary connection number a + bi + cj, the value of i ranges between [−1, 1] and is uncertain. However, when the connection number expands to quaternary, quinary, …, n-ary connection numbers, the value range of each connection coefficient narrows as the number of connection components increases, thereby weakening the impact of uncertainty. In this paper, to ensure the reliability of the calculation results, we adopt the “worst-case” approach for the values of the connection coefficients. Therefore, calculating the first partial connection number, i1 = 0, i2 = 0, i3 = −1 are defined; calculating the second partial connection number i1 = −1, i2 = −1, are defined; calculating the third partial connection number i1 = −1, is defined. When iμ > 0, the development trend of evaluation index is in ascending trend; and iμ < 0, is in descending trend; then iμ = 0, in a transitional state between ascending trend and descending trend. The process of the proposed method is illustrated in Figure 2 [43].

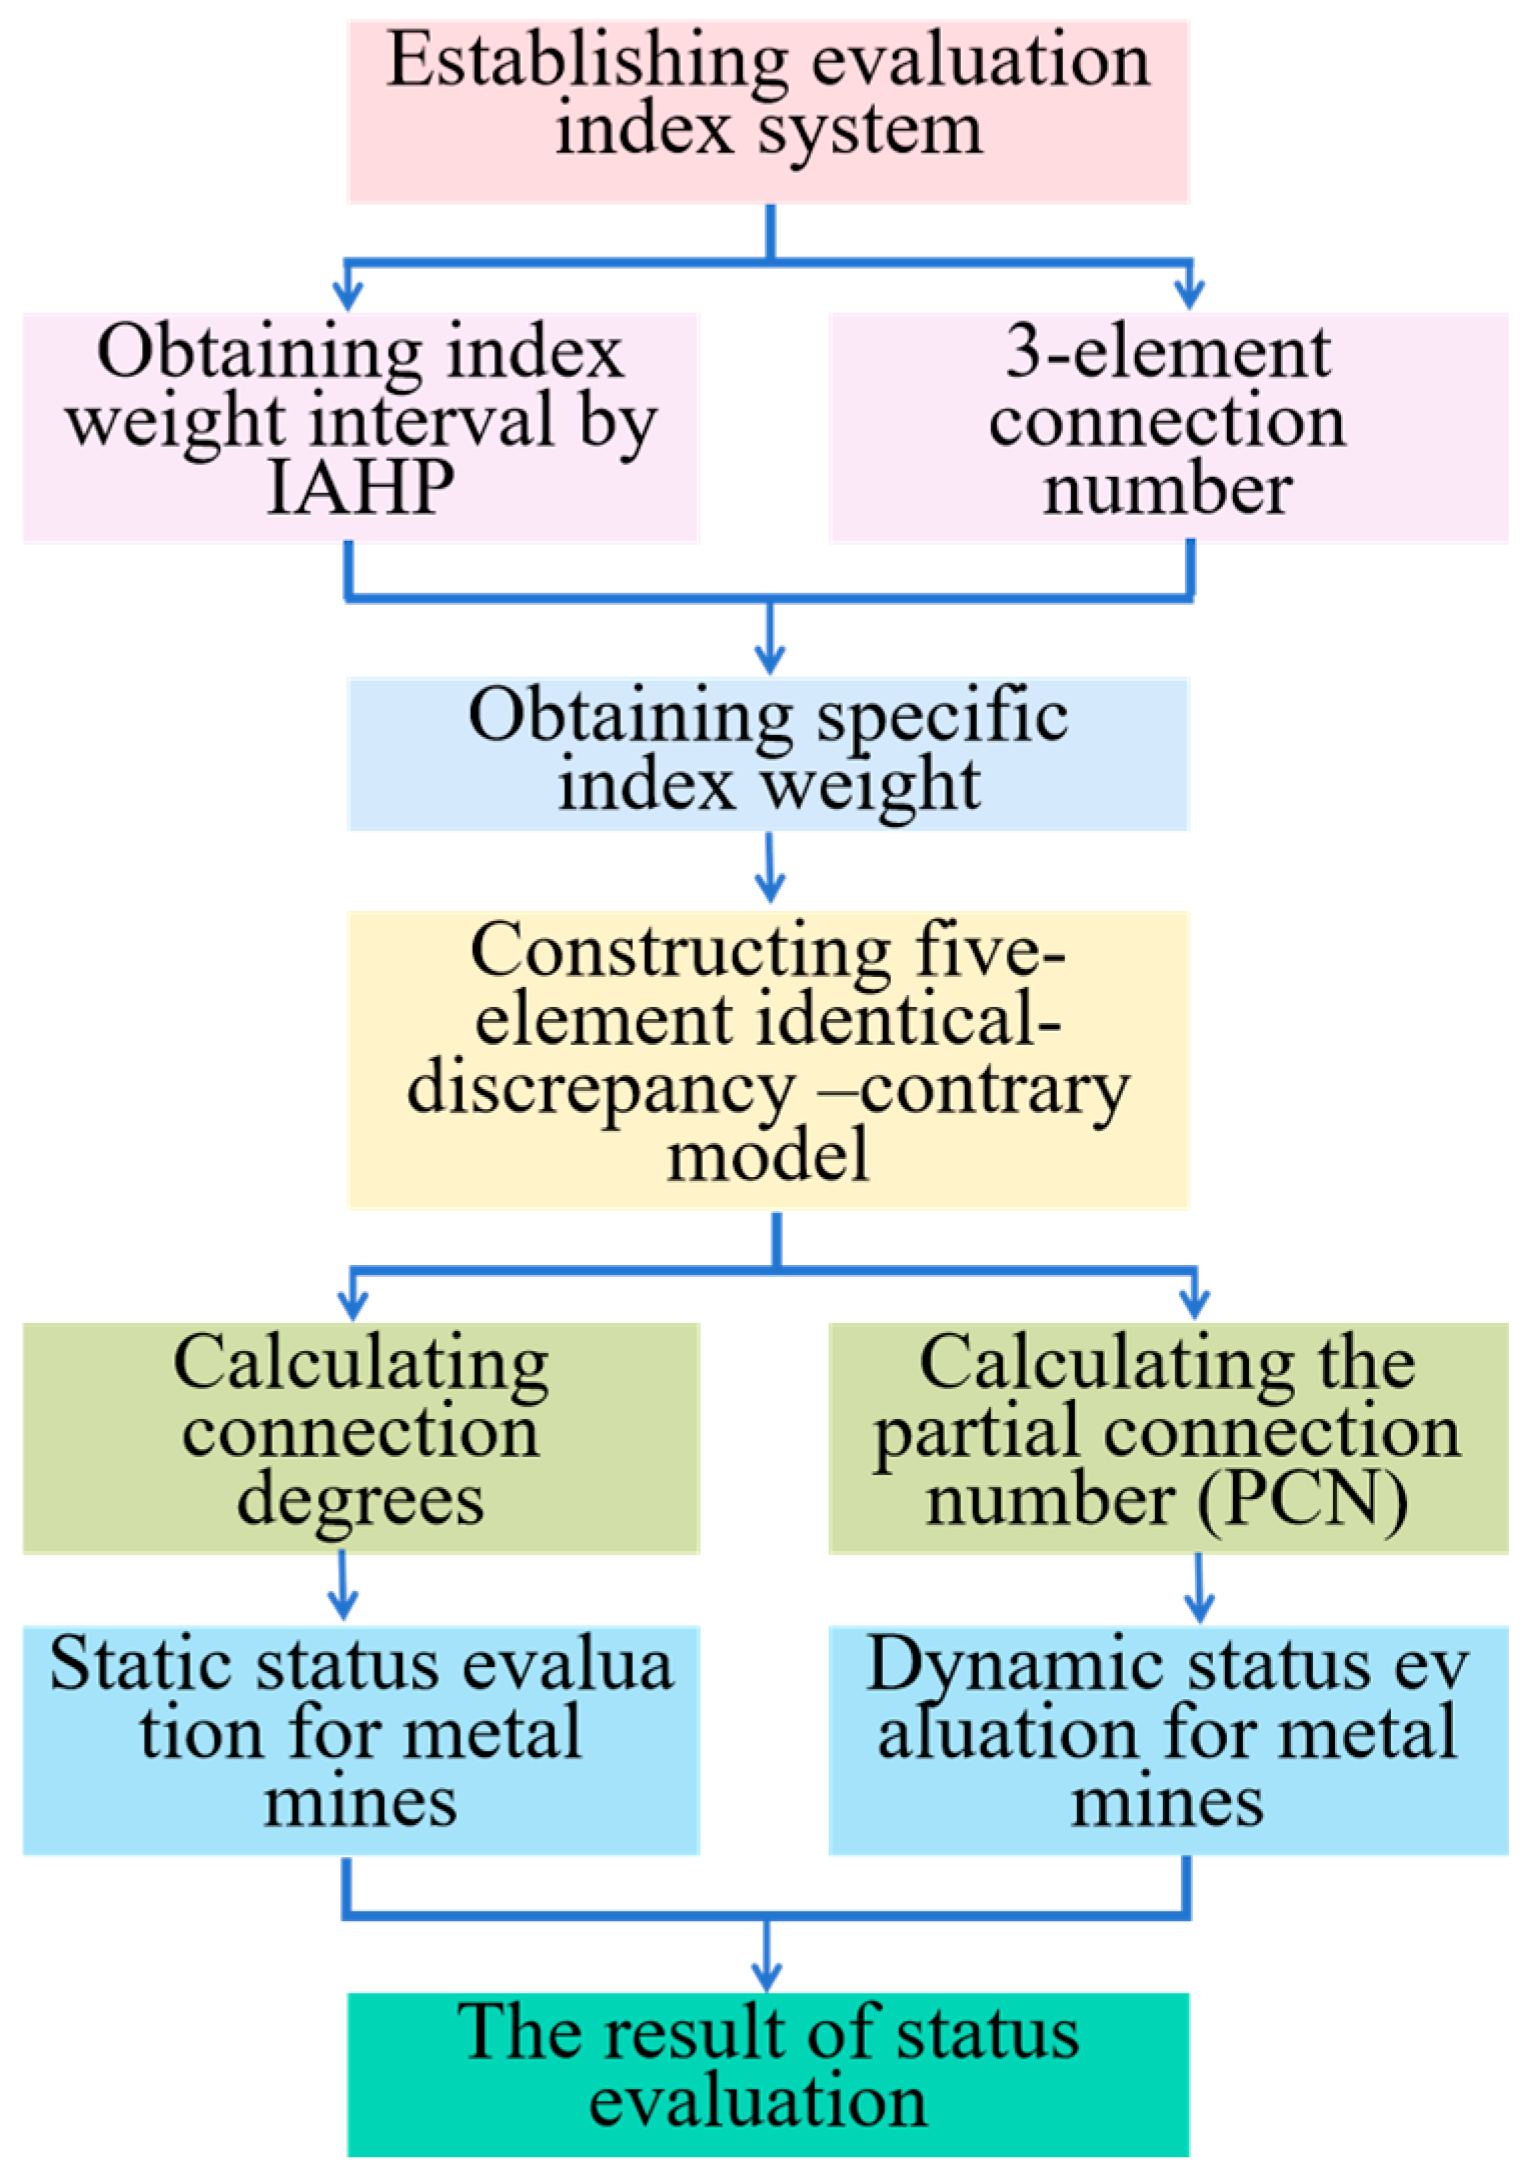
2.4. SPA–IAHP–PCN Model
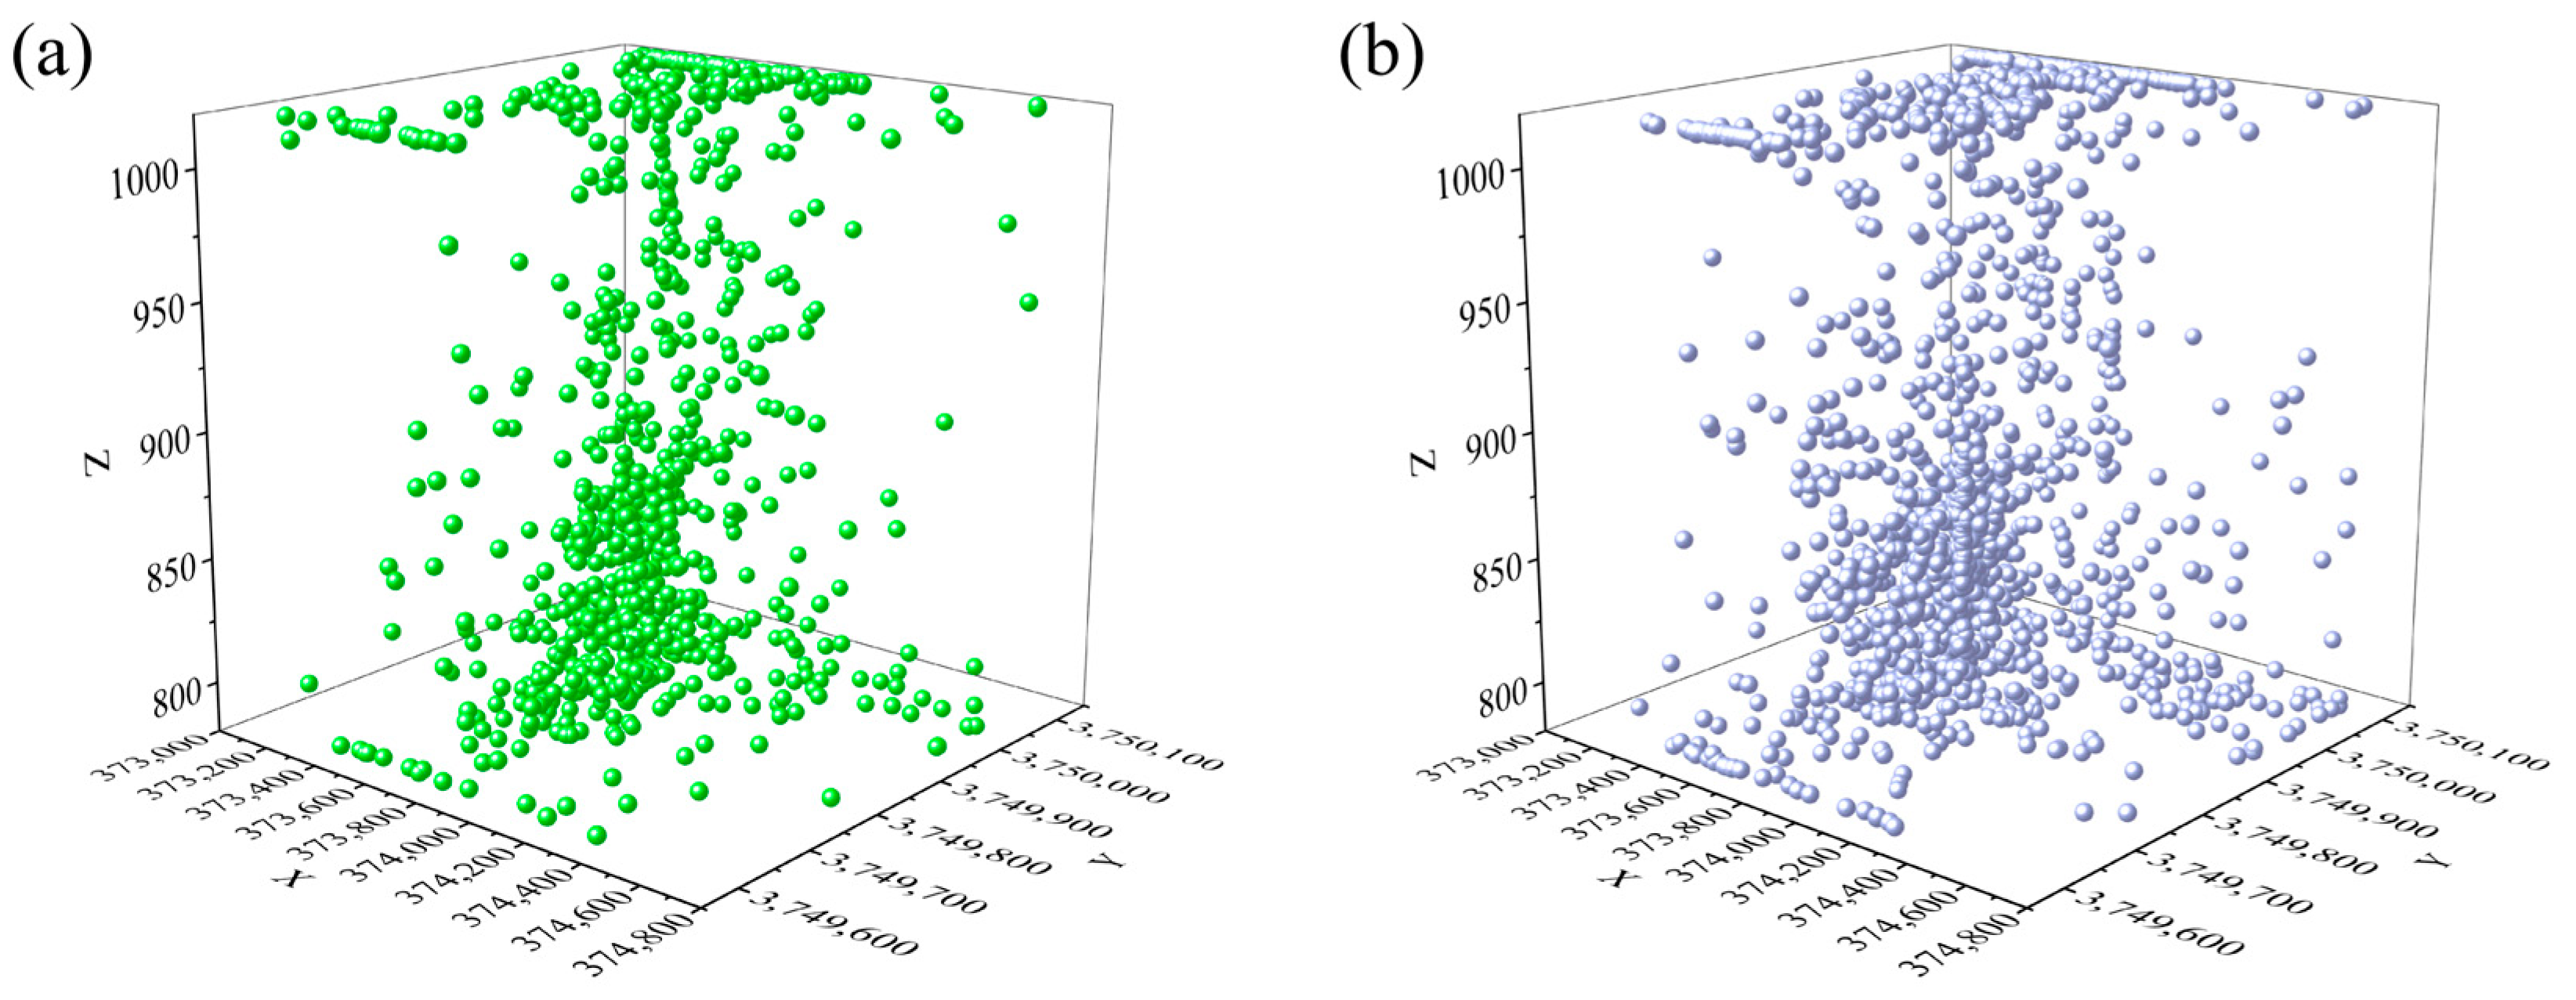
This paper extends a dynamic risk assessment method for rock mass instability in metal mines. Due to the continuously changing risk of rock mass instability during mining operations, effectively predicting the trend of risk development is crucial for determining the next steps in mining operations. Thus, a novel risk assessment method called the SPA–IAHP–PCN model is proposed. Given that a single parameter cannot directly reflect the changes in rock mass within the mine, four parameters were selected to predict the risk variation of rock instability in metal mines. These four parameters are the cumulative number of events, cumulative microseismic energy, cumulative apparent stress, and cumulative logarithmic seismic moment. The framework of the proposed method is illustrated in Figure 1, and the main steps of the SPA–IAHP–PCN model are outlined below.
Step 1: Construction of index evaluation system. Based on the actual conditions of the mine and the collected data, relevant parameters were selected to establish a risk assessment system for rock mass instability in metal mines. The selected parameters must effectively reflect the changes in the rock strata during the mining process.
Step 2: Calculation of index weight value. Based on the established risk assessment system for rock instability in mines, experts in the field were consulted to apply the SPA–IAHP method proposed in this paper. They scored each parameter according to its ability to reflect rock instability, thereby determining the weight of each parameter. The SPA–IAHP method effectively reduces the subjective influence of the experts.
Step 3: Establishment of five-element identical-discrepancy-contrary model. Based on the evaluation system established in this paper, the corresponding data were selected according to the parameters chosen in the evaluation system. The selected data were then normalized, and the normalized results were used to determine the grade values of each parameter for each time period according to Table 2. Once the grade values were determined, the R matrix was obtained using the method described in Section 2.2. Finally, using the approach detailed in Section 2.2, the weight values of each parameter obtained in step 2 were combined with the R matrix and the Coefficient matrix E. The five-element identical-discrepancy-contrary model is then constructed.
Step 4: Based on the results obtained in step 3, the static risk level of the metal mine can be determined. However, the risk level during the mining process is constantly changing, making a simple static assessment of rock instability risks in metal mines of very limited value. Therefore, this paper introduces the PCN method. Using the five-element identical-discrepancy-contrary model derived in step 3 and the approach outlined in Section 2.3, the risk variation of rock instability during the mining process is further analyzed. This allows for the prediction of changes in the risk level during mining operations, providing valuable insights for mining activities and future planning. The flowchart of the proposed method is shown in Figure 3.

3. Case Study

The method proposed in this paper effectively assesses the risk levels of rock instability caused by mining operations in metal mines and predicts the development trend of these risk levels, allowing for the implementation of appropriate measures to mitigate risks. In this study, a lead–zinc metal mine in Shaanxi Province is used as a case example to demonstrate and validate the practicality and feasibility of the proposed method. Data from all microseismic events recorded six hours after concentrated blasting from 16 September to 25 September 2022 were selected. The cumulative number of events, cumulative microseismic energy, cumulative apparent stress, and cumulative log seismic moment for each day were calculated.
The microseismic events from the selected ten days were summarized, with each day’s events treated as a separate unit. These events were then visualized in 3D within the underground model of the mine, allowing for a clearer view of the specific locations of the microseismic events and the number of events each day. Different sizes of spheres were used to represent events of varying energy levels, with larger spheres indicating events with higher energy. The red and green spheres indicate anomalous microseismic events, which should be removed in subsequent analysis to ensure data accuracy and reliability. The top-down view of the 3D visualization results is shown in Figure 4.

4. Results and Discussion

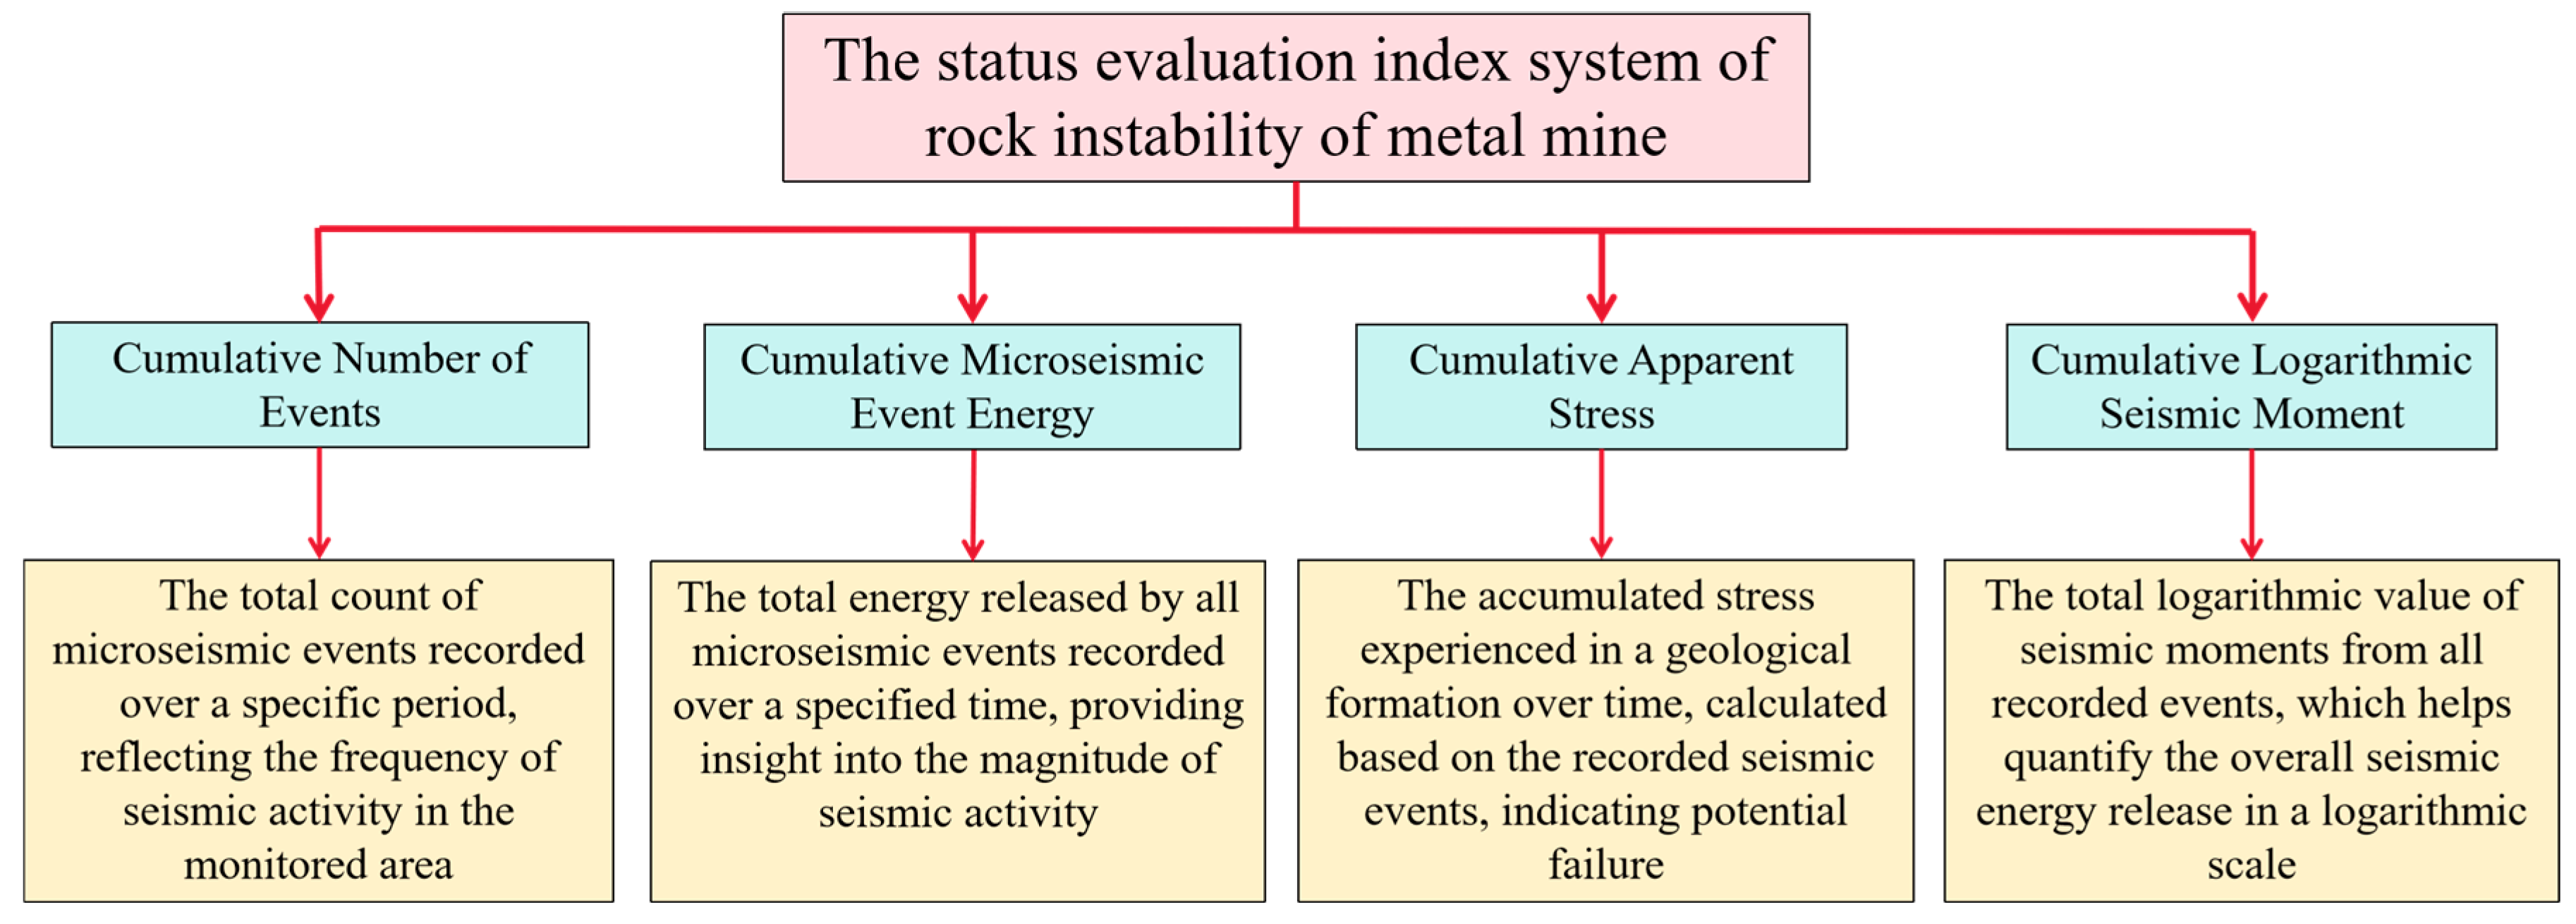
4.1. Establishment of the Status Evaluation Index

In this study, a lead–zinc metal mine in Shaanxi Province is used as a case example to demonstrate and validate the practicality and feasibility of the proposed method. Based on the data collected from microseismic monitoring, four parameters—cumulative number of events, cumulative microseismic energy, cumulative apparent stress, and cumulative Logarithmic seismic moment—were selected for the evaluation index system. The cumulative number of events (A1) reflects the frequency of microseismic activity, which is a direct indicator of rock mass fracturing and deformation. The cumulative microseismic event energy (A2) quantifies the energy release associated with these events, providing insights into the intensity of rock failure processes. The cumulative apparent stress (A3) is a critical parameter that links the released energy to the stress conditions within the rock mass, offering a measure of the stress state and its changes over time. Finally, the cumulative logarithmic seismic moment (A4) serves as a robust indicator of the overall deformation magnitude, integrating both the size and number of microseismic events. These parameters were chosen over others, such as rock mass properties or groundwater conditions, because they directly reflect the real-time dynamic response of the rock mass to mining-induced stress changes. While rock mass properties and groundwater conditions are important, they are often static or slow-changing factors that may not capture the immediate precursors to instability. By focusing on these four parameters, the study aims to provide a more dynamic and predictive assessment of rock instability, which is critical for early warning systems and risk mitigation in mining operations. The established evaluation system is shown in Table 3.

4.2. Calculation of the Weight

To ensure the scientific rigor and accuracy of the index weights, 10 experienced experts in the field were invited to evaluate the weights of the indices using the 1~9 scaling rules. Each judgment value based on the 1/9–9 scale required unanimous consensus among all participating experts; otherwise, it was subject to re-evaluation. The details of the 10 experts are provided in Table 4.
Based on the understanding and analysis of the selected parameters, and considering the specific conditions of the mine, experts evaluated the four parameters in the established evaluation index system: cumulative number of events (A1), cumulative microseismic event energy (A2), cumulative apparent stress (A3), and cumulative logarithmic seismic moment (A4). The interval pairwise comparison matrix for these parameters is shown below.
A = 1 1 , 1 1 2 3 , 3 4 5 6 , 7 9 1 2 , 2 3 4 3 , 3 2 1 1 , 1 1 3 4 , 5 6 1 3 , 1 2 9 7 , 6 5 6 5 , 4 3 1 1 , 1 1 1 2 , 2 3 3 2 , 2 2 , 3 3 2 , 2 1 1 , 1 1
And the AL and the AU can be obtained according to Equation (3).
A L = 1 2 3 5 6 1 2 4 3 1 3 4 1 3 9 7 6 5 1 1 2 3 2 2 3 2 1 , A U = 1 3 4 7 9 2 3 3 2 1 5 6 1 2 6 5 4 3 1 2 3 2 3 2 1
Next, the standardized eigenvectors βL and βU corresponding to AL and AU, respectively, are obtained by the calculation of Matlab software.
β L = 0.1870 , 0.1993 , 0.2398 , 0.3739
β U = 0.1757 , 0.1941 , 0.2209 , 0.4093
Then, the coefficients k = 0.9537 and h = 1.0365 are calculated according to Equations (4) and (5). Based on the above calculation, the Wi is obtained.
W i = w i L , w i U = k β L , k β U = 0.1784 0.1821 0.1901 0.2012 0.2287 0.2290 0.3566 0.4242
Subsequently, the coefficients are checked by Equation (6). Meanwhile, consistency is obtained by Equation (7). Comparing the consistency value (z* = 0.0827) with Table 1, it is clear that the consistency check result meets the requirement of the algorithm. After that, the μi is obtained based on Equation (8).
μ 1 = 0.1784 + 0.0038 i + 0.8216 j
μ 2 = 0.1901 + 0.0111 i + 0.8099 j
μ 3 = 0.2287 + 0.0003 i + 0.7713 j
μ 4 = 0.3566 + 0.0676 i + 0.6434 j
The result of the specific weight value of the cumulative number of events (A1), cumulative microseismic event energy (A2), cumulative apparent stress (A3), and cumulative logarithmic seismic moment (A4) are calculated by Equations (9)–(11).
W = 0.1918 , 0.2028 , 0.2467 , 0.3587
Consequently, based on the above calculation process, the specific weight value of all the indices of the evaluation system can be obtained and are listed in Table 5.

4.3. Construction Five-Element Connection Number Evaluation Model

This study selected all microseismic events, six hours after concentrated blasting, at a lead–zinc metal mine in Shaanxi Province from 16 September to 25 September 2022. Based on the parameters of the collected microseismic events, the cumulative values for each day were computed for the cumulative number of events, the cumulative microseismic event energy, the cumulative apparent stress, and the cumulative logarithmic seismic moment. The processed data are shown in Figure 5.
Due to the differences in magnitude between the processed data, normalization of each parameter was performed to facilitate a better comparison of the indicators. Subsequently, the normalized parameters were classified into different levels according to Table 2. The results of this classification are shown in Table 6.
According to the data in Table 6, matrix R was further processed. Taking the cumulative number of events as an example, among the ten days of statistical values, two days have a level classification of I; five days have a classification of II; one day has a classification of III; one day has a classification of IV; and one day has a classification of V. Thus, μ1 = (2/10, 5/10, 1/10, 1/10, 1/10) is defined. Similarly, the results for indices A2, A3, and A4 are obtained using the same method. Ultimately, matrix R is derived.
R = 2 10 5 10 1 10 1 10 1 10 1 10 3 10 2 10 2 10 2 10 1 10 1 10 4 10 2 10 2 10 3 10 5 10 0 10 1 10 1 10
Taking the weight (0.1918, 0.2028, 0.2467, 0.3587) into consideration, the connection number of the index can be calculated according to Equation (13) as follows:
μ C N = 0.19 + 0.36 i 1 + 0.16 i 2 + 0.14 i 3 + 0.14 j
Based on the above calculations, the static risk level of rock instability for the metal mine can be determined. According to the method described in Section 2.3, the evaluation levels for rock instability based on individual parameters are as follows: cumulative number of events indicates a risk level of II (the status is good); cumulative microseismic event energy also indicates a risk level of II (the status is good); cumulative apparent stress indicates a risk level of III (the status is medium); and cumulative logarithmic seismic moment indicates a risk level of II (the status is good). However, the reference value of individual parameters for assessing rock instability risk is limited. Therefore, the combined evaluation of all parameters provides a more meaningful assessment. Using the proposed method in this study, the combined risk level for rock instability at the metal mine is assessed as level II (the status is good). This is illustrated in Figure 6.

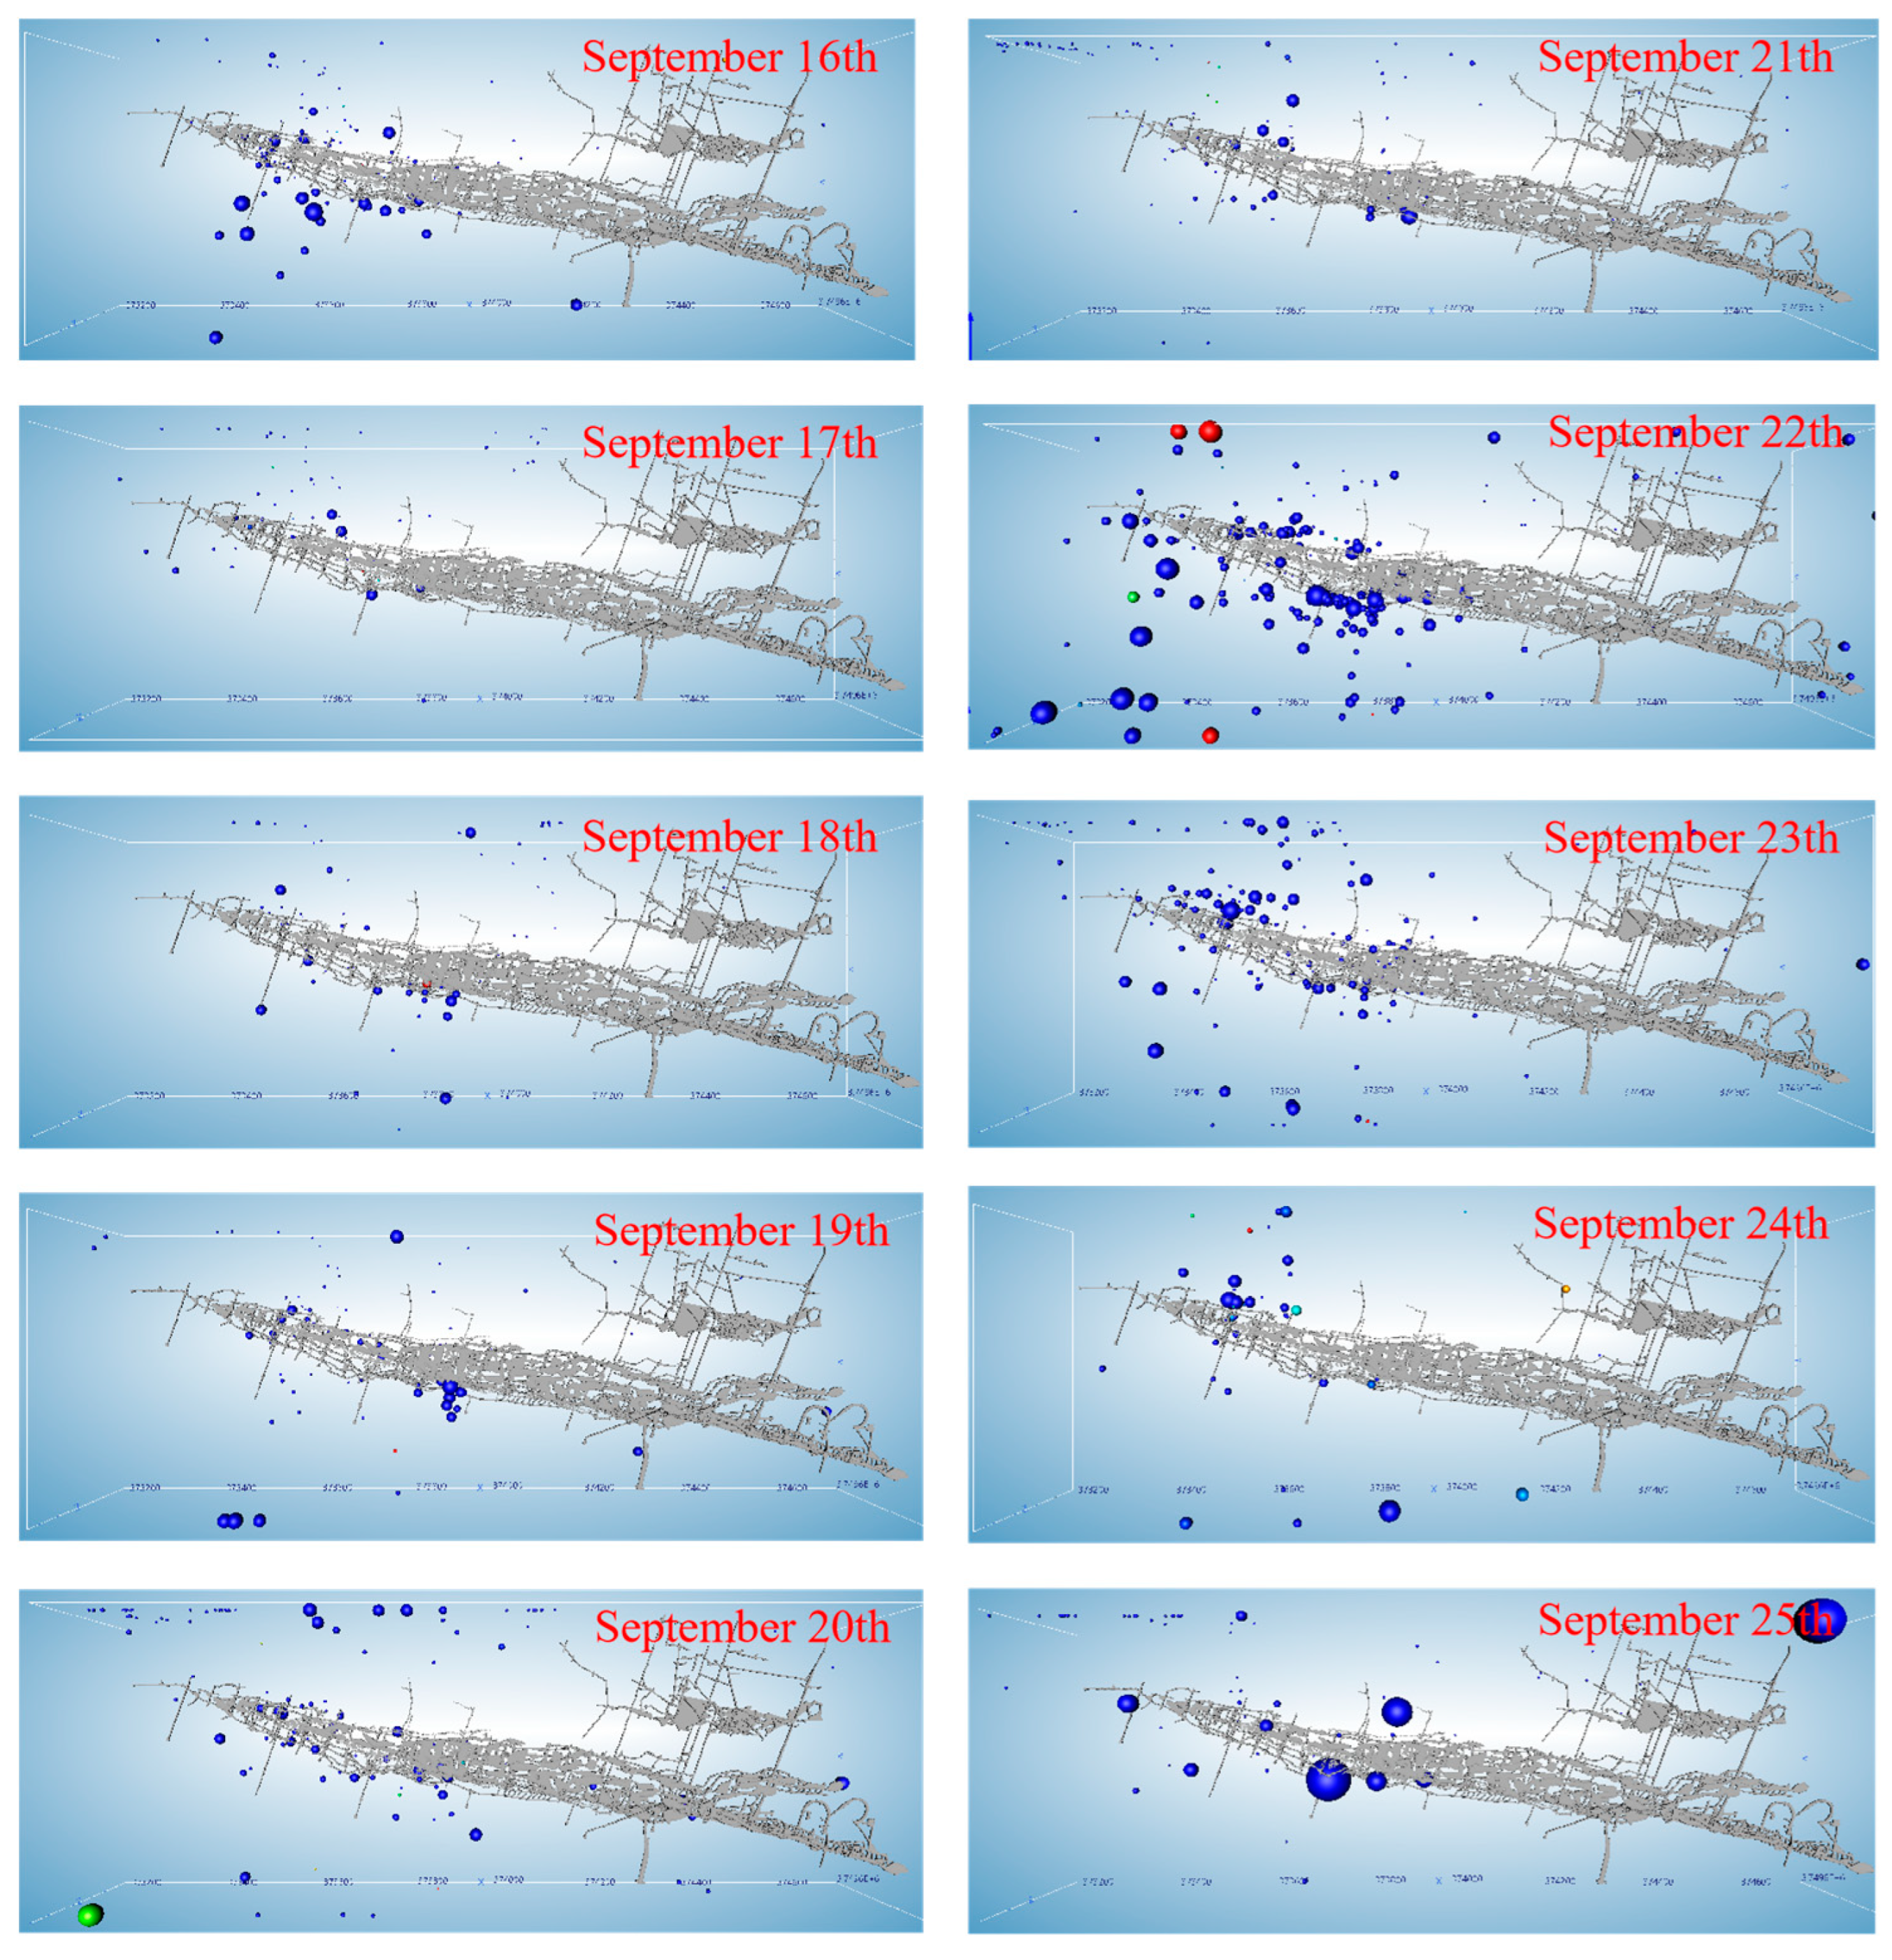
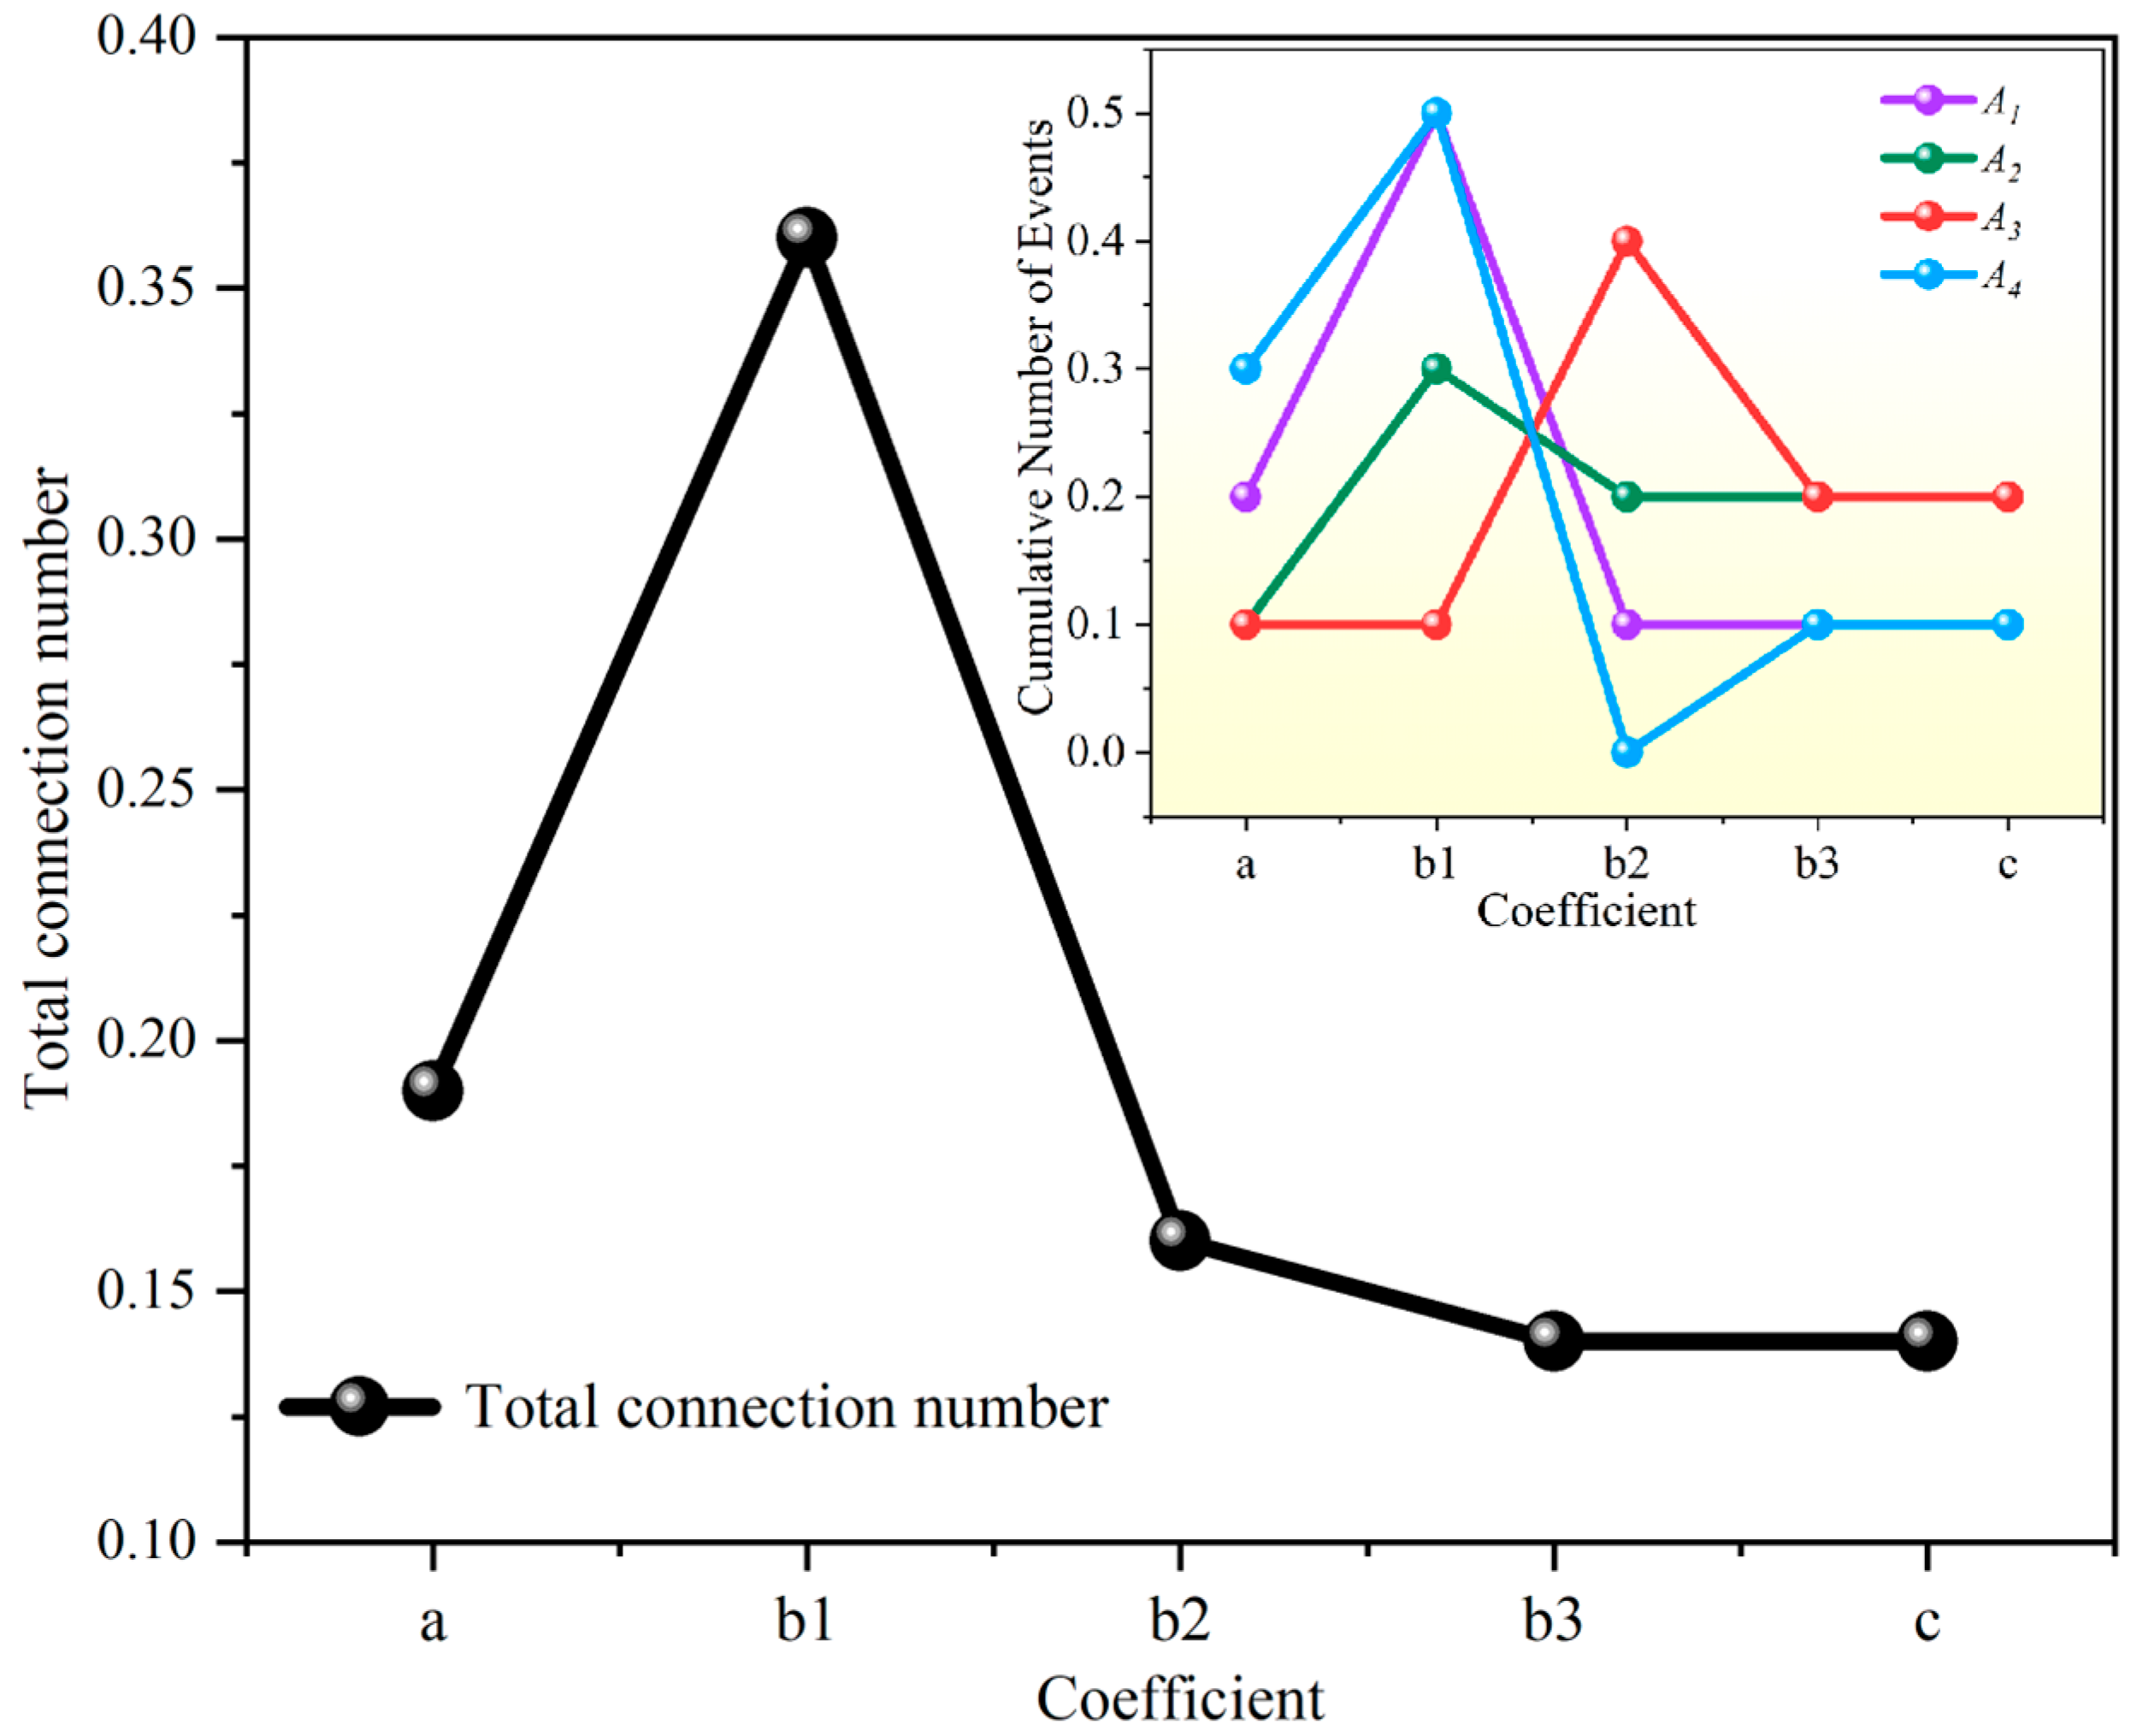
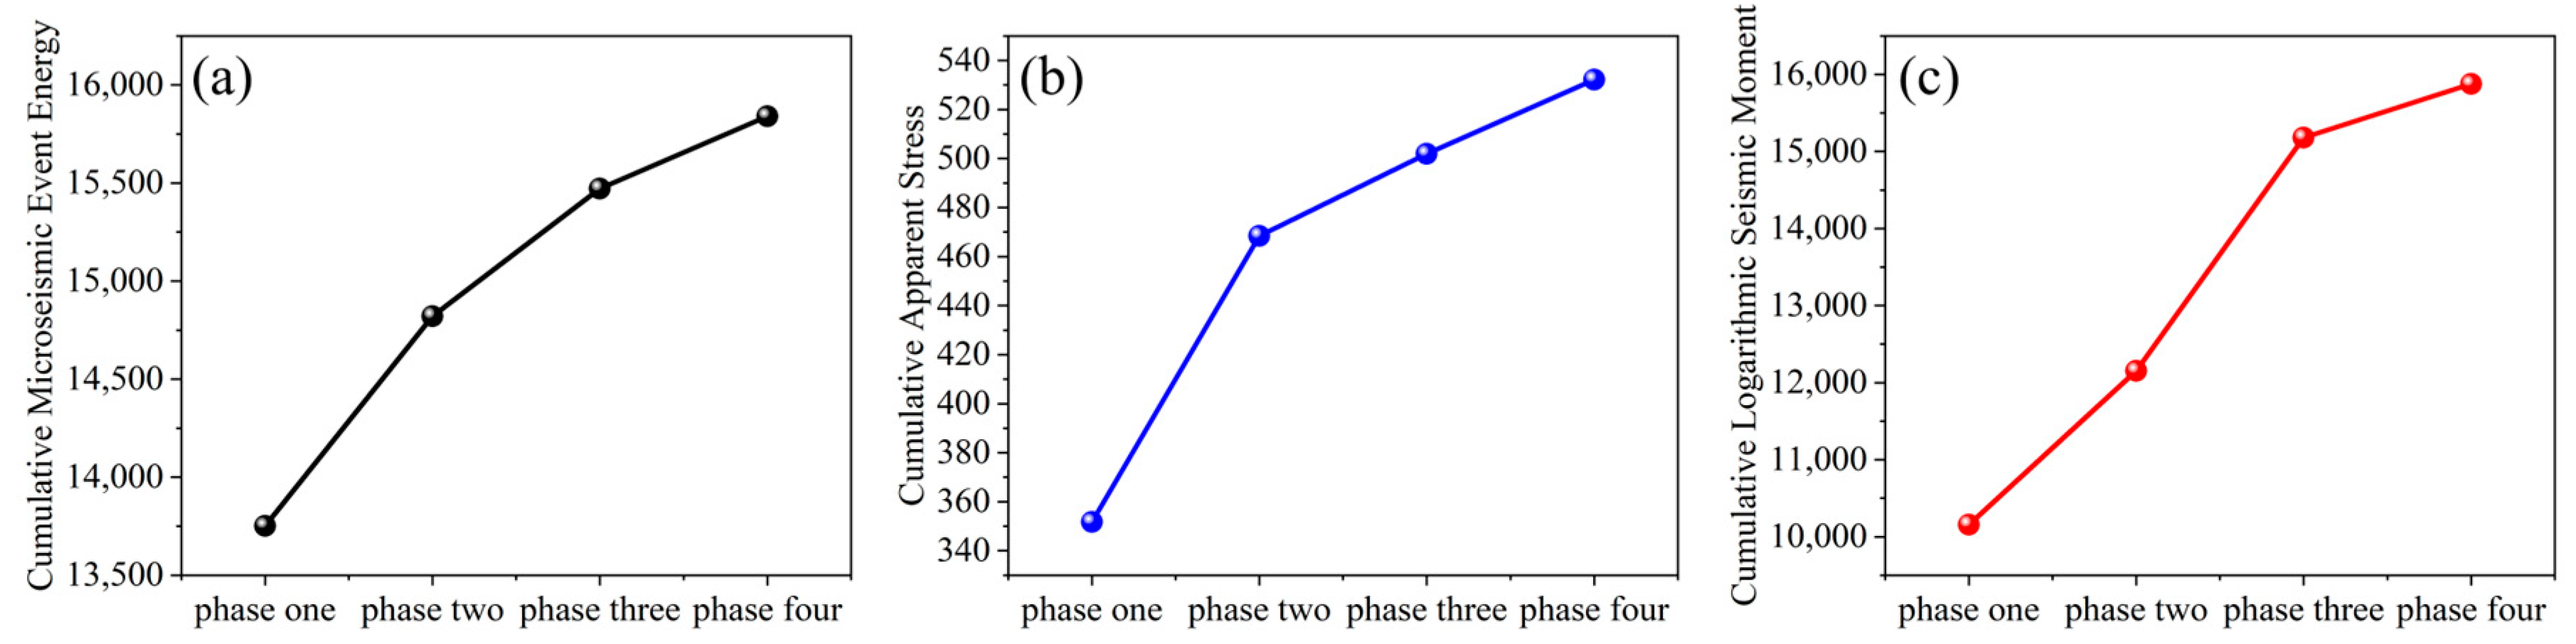
4.4. Risk Variation of Rock Instability

Since the risk of rock instability in metal mines evolves continuously during mining operations, static risk assessment alone is inadequate. Building on the findings in Section 4.3, the method described in Section 2.3 is employed to predict the trend of rock instability risk in the metal mine. Specifically, the partial connection number is calculated using the approach outlined in Section 2.3. From the calculation results, the first-order PCN is determined using Equation (14), as shown in Figure 7a. Subsequently, the second-order and third-order PCNs are computed based on Equations (15) and (16), with their respective results illustrated in Figure 7b,c. Figure 7 lists the coefficients of each PCN order. Appropriate values are selected based on the actual conditions of the mine and substituted into the equations for each PCN order. If the result is greater than 0, it indicates a decreasing trend in rock instability risk for the subsequent phase. A result equal to 0 signifies a transitional state between ascending and descending trends, while a result less than 0 indicates an increasing trend in rock instability risk for the next phase.
To ensure the scientific rigor and reliability of the results, the worst-case scenario was selected to calculate the PCN values for the mine, with parameters defined as i1 = i2 = 0 and i3 = −1 (Section 2.3). The calculated PCN values for each order are shown in Figure 8. As observed, in the first-order PCN, all parameters, except for Cumulative Apparent Stress, which is in a transitional state between an ascending and descending trend, indicate an increasing trend in rock instability risk for the next phase of the lead–zinc mine. Among these, the first-order PCN for cumulative microseismic event energy is the smallest, suggesting that this parameter requires the most attention in monitoring and prevention efforts. The TCN for the first-order PCN is less than zero, indicating an overall increase in rock instability risk, with a likely progression of the mine’s instability status from risk level II (good) to risk level III (medium). However, timely preventive measures based on collected microseismic data, including the cumulative number of events, cumulative microseismic event energy, and cumulative logarithmic seismic moment, could avert this outcome.
The second-order PCN values are all negative, indicating that without corresponding preventive measures, the likelihood of rock instability will further increase. Moreover, in the third-order PCN results, the cumulative number of events, cumulative microseismic event energy, cumulative logarithmic seismic moment, and TCN are all negative. This suggests that, from a comprehensive perspective of these four parameters, the rock instability hazard remains on a declining trajectory. During this phase, it is particularly crucial to consider the trends reflected by the cumulative number of events, cumulative microseismic event energy, and cumulative logarithmic seismic moment in devising prevention strategies.
In contrast, all results from the fourth-order PCN are positive, indicating that the parameters collectively reflect a stabilization trend in the mine’s rock instability hazards over time.

4.5. Verification of Risk Assessment Result

To verify the reliability and scientific foundation of the proposed method, additional microseismic data from subsequent phases were collected. A comparative analysis of the prediction results and the microseismic monitoring data was conducted. By comparing the prediction results with the microseismic monitoring data from the following phase, the reliability of this method can be effectively assessed [46]. Using a 10-day period as a phase, Figure 9a and Figure 9b illustrate the number of microseismic events recorded during the first and second phases, respectively. The data indicate that the number of microseismic events in the second phase is significantly higher than that in the first phase.
Figure 10 further depicts the variation observed during the second phase. In this phase, the cumulative microseismic event energy, cumulative apparent stress, and cumulative logarithmic seismic moment all show an increasing trend. These observations indicate that the risk of rock instability in the metal mine increased during the subsequent phase. This conclusion is consistent with the prediction in Figure 7, where the first-order PCN value of −0.15 indicates a negative trend. Therefore, the microseismic monitoring results validate the reliability and practicality of the proposed method.

4.6. Comparison of the Evaluation Result Utilizing FCEM

To validate the universal applicability of the proposed method, the fuzzy comprehensive evaluation method (FCEM) is employed to assess the status of the metal mine. For the FCEM, the factor set is first determined, which includes the cumulative number of events, the cumulative microseismic event energy, the cumulative apparent stress, and the cumulative logarithmic seismic moment. To ensure consistency and improve the validity of the evaluation, the weights corresponding to the factor set are derived as shown in Table 6, resulting in the weight set A. Based on the data in Table 6, the evaluation matrix T is established. The standardized evaluation results are as follows:
B = A T = ( 0.1918 , 0.2028 , 0.2467 , 0.3587 ) 0.2 0.5 0.1 0.1 0.1 0.1 0.5 0.2 0.2 0.2 0.1 0.1 0.4 0.2 0.2 0.3 0.5 0 0.1 0.1 = ( 0.19092 , 0.36076 , 0.15842 , 0.14495 , 0.14495 )
Then, the result of the status evaluation for the metal mine, using the FCEM, is level II (good), which is the same as the result of employing the SPA–IAHP–PCN model. Compared with the SPA–IAHP–PCN model, the status development trend cannot be forecasted by FCEM. To sum up, it is correct and scientific to make an evaluation of the metal mine using the SPA–IAHP–PCN model.

4.7. Prospects and Limitations

This study proposes a novel method for assessing the instability state of rock masses in metal mines using the SPA–IAHP–PCN model. By integrating multiple evaluation indicators, including cumulative number of events, cumulative microseismic event energy, cumulative apparent stress, and cumulative logarithmic seismic moment, the model effectively captures both static and dynamic risk of rock instability. The incorporation of SPA and PCN addresses the uncertainties in the assessment process, enabling dynamic predictions of instability trends and providing critical decision-making support for mine safety management. This approach facilitates proactive risk control measures, reduces the likelihood of instability incidents, and enhances the overall safety and economic efficiency of mining operations. Furthermore, the method demonstrates potential applicability in similar geological risk assessments, highlighting its value for broader adoption.
However, several limitations and methodological constraints must be critically discussed. While the evaluation indicator system has made significant progress by incorporating critical dynamic parameters such as cumulative number of events, cumulative microseismic event energy, cumulative apparent stress, and cumulative logarithmic seismic moment, there remains potential for further enhancement. For instance, future research could expand the system by integrating additional factors, such as the physical and mechanical properties of rocks, groundwater conditions, and mining techniques, to further improve assessment accuracy and comprehensiveness. These refinements would build upon the current foundation, which already provides a robust framework for evaluating rock mass instability under dynamic conditions.
Second, the reliance on expert judgment in the IAHP for weight determination introduces subjectivity, which may lead to methodological biases. While the IAHP–SPA approach reduces subjectivity to some extent, it does not eliminate it entirely. To address this limitation, future studies could explore alternative, more objective methods for weight determination, such as machine learning algorithms or statistical techniques that leverage historical microseismic data. These methods could provide a more robust and unbiased framework for parameter determination.
Third, the PCN method assumes a “worst-case scenario” for connection coefficients during calculations. While this ensures reliability in risk predictions, it may result in overly conservative estimates, potentially leading to unnecessary safety measures or resource allocation. Future research should investigate reasonable ranges for these coefficients to enhance prediction accuracy and practicality.
Lastly, the validation of the proposed model is limited to a single lead–zinc mine in Shaanxi, with a relatively small sample size. To ensure the generalizability and effectiveness of the model, broader application and validation across diverse mine types and geological conditions are necessary. This would also help identify potential variations in model performance under different mining environments.

5. Conclusions

The assessment of rock instability risks in metal mines requires a precise and comprehensive approach. In this study, a novel method based on the SPA–IAHP–PCN model was proposed to evaluate the instability state of rock masses, combining static and dynamic analyses for enhanced reliability. The method systematically integrates a multi-parameter risk assessment indicator system that incorporates cumulative event counts, microseismic energy, apparent stress, and seismic moments. These parameters provide complementary insights into the frequency, potential energy, and mechanical state of rock masses, forming a robust foundation for accurate risk quantification.
To address uncertainties in weight determination, the IAHP method was employed to establish the preliminary weight ranges through expert judgment, which were further refined into precise values using the SPA method. The PCN framework complements these efforts by enabling trend prediction and comprehensive evaluations. A case study conducted in a lead–zinc mine in Shaanxi Province demonstrated the method’s ability to identify risk levels and forecast trends effectively.
Validation using subsequent microseismic monitoring data revealed alignment between observed trends and model predictions, underscoring the method’s practicality and reliability. This approach supports proactive mine safety management by identifying instability risks early and enabling targeted interventions. The SPA–IAHP–PCN model has the potential for scalable application across diverse mining environments, contributing to enhanced safety governance and sustainable mining practices.

Author Contributions

Conceptualization, F.Y. and X.L.; methodology, X.L.; software, S.D.; validation, X.L., L.D. and H.W.; formal analysis, F.Y.; investigation, D.S.; resources, L.D.; data curation, S.D.; writing—original draft preparation, F.Y.; writing—review and editing, X.L.; visualization, S.D.; supervision, H.W.; project administration, F.Y.; funding acquisition, F.Y. and X.L. All authors have read and agreed to the published version of the manuscript.

Funding

The study was supported by the National Natural Science Foundation of China (52474280, 52104108), and the Fundamental Research Funds for the Central Universities of Central South University (NO. 1053320232623).

Institutional Review Board Statement

Not applicable.

Informed Consent Statement

Not applicable.

Data Availability Statement

Data will be made available upon request.

Conflicts of Interest

The authors declare that they have no known competing financial interests or personal relationships that could have appeared to influence the work reported in this paper.

References

  1. Prior, T.; Giurco, D.; Mudd, G.; Mason, L.; Behrisch, J. Resource depletion, peak minerals and the implications for sustainable resource management. Glob. Environ. Chang. 2012, 22, 577–587. [Google Scholar] [CrossRef]
  2. Biao, Y. Key design consideration for the mine engineering in the alpine and high-altitude regions. China Molybdenum Ind. 2018, 42, 11–16. [Google Scholar]
  3. Dong, L.J.; Yan, X.H.; Wang, J.; Tang, Z. Case study of microseismic tomography and multi-parameter characteristics under mining disturbances. J. Cent. South Univ. 2023, 30, 2252–2265. [Google Scholar] [CrossRef]
  4. Zuo, S.; Dai, Z.; Zhao, L.; Hu, S.; Huang, D.; Lv, G. Reliability Back Analysis of the Parameters of Rock Landslides with the Nonlinear Hoek-Brown Failure Criterion. Int. J. Geomech. 2024, 24, 06024005. [Google Scholar] [CrossRef]
  5. Yang, F.; Li, S.; Wu, X.; Ge, F. Accident causation analysis of metal processing plants based on questionnaire and Bayesian network. J. Saf. Sustain. 2024, 1, 247–256. [Google Scholar] [CrossRef]
  6. AN, S.; LONG, J. Model of Satellite System State Evaluation Based on Bayers Network. Trans. Beijing Inst. Technol. 2010, 5, 548–551. [Google Scholar]
  7. Sun, L.; Liu, Y.; Zhang, B.; Shang, Y.; Yuan, H.; Ma, Z. An integrated decision-making model for transformer condition assessment using game theory and modified evidence combination extended by D numbers. Energies 2016, 9, 697. [Google Scholar] [CrossRef]
  8. Liu, J.; Zheng, H.; Zhang, Y.; Wei, H.; Liao, R. Grey relational analysis for insulation condition assessment of power transformers based upon conventional dielectric response measurement. Energies 2017, 10, 1526. [Google Scholar] [CrossRef]
  9. Guo, L.; Li, K.; Liang, Y.; Sun, L. HV circuit breaker state assessment based on gray-fuzzy comprehensive evaluation. Electr. Power Autom. Equip. 2014, 34, 161–167. [Google Scholar]
  10. Yang, Y.; Zhang, M.; Dai, Y. A Fuzzy Comprehensive CS-SVR Model-based health status evaluation of radar. PLoS ONE 2019, 14, e0213833. [Google Scholar] [CrossRef] [PubMed]
  11. Gan, L.; Zuo, J.; Wang, Y.; Low, T.S.; Wang, K. Comprehensive health condition assessment on partial sewers in a southern Chinese city based on fuzzy mathematic methods. Front. Environ. Sci. Eng. 2014, 8, 144–150. [Google Scholar] [CrossRef]
  12. Tian, F.; Jing, Z.; Zhao, H.; Zhang, E.; Liu, J. A synthetic condition assessment model for power transformers using the fuzzy evidence fusion method. Energies 2019, 12, 857. [Google Scholar] [CrossRef]
  13. Liao, R.; Meng, F.; Zhou, N. Assessment Strategy for Inner Insulation Condition of Power Transformer Based on Set-pair Analysis and Evidential Reasoning Decision-making. High Volt. Eng. 2014, 40, 474–481. [Google Scholar]
  14. Zhao, K.Q. Set pair and set pair analysis-a new concept and systematic analysis method. In Proceedings of the State Forum on System Theory and Regional Planning in China, Baotou, China, 4 June 1989; p. 5. [Google Scholar]
  15. Hu, P.; Tanchak, R.; Wang, Q. Developing risk assessment framework for wildfire in the United States–A deep learning approach to safety and sustainability. J. Saf. Sustain. 2024, 1, 26–41. [Google Scholar] [CrossRef]
  16. Yu, Q.; Li, W. Application of fuzzy set pair analysis model to power transformer condition assessment. J. Cent. South Univ. (Sci. Technol.) 2013, 44, 598–603. [Google Scholar]
  17. Zhou, Q.; Xu, Q.; Jian, L. Wind turbine operating state assessment based on fusion set pair analysis and evidence theory. Electr. Power Autom. Equip. 2017, 37, 38–45. [Google Scholar]
  18. Zuo, S.; Zhao, L.; Deng, D.; Wang, Z.; Zhao, Z. Reliability back analysis of landslide shear strength parameters based on a general nonlinear failure criterion. Int. J. Rock Mech. Min. Sci. 2020, 126, 104189. [Google Scholar] [CrossRef]
  19. Su, M.; Yang, Z.; Chen, B. Relative urban ecosystem health assessment: A method integrating comprehensive evaluation and detailed analysis. Ecohealth 2010, 7, 459–472. [Google Scholar] [CrossRef]
  20. Jiang, X.; Xu, S.; Liu, Y.; Wang, X. River ecosystem assessment and application in ecological restorations: A mathematical approach based on evaluating its structure and function. Ecol. Eng. 2015, 76, 151–157. [Google Scholar] [CrossRef]
  21. Du, C.; Yu, J.; Zhong, H.; Wang, D. Operating mechanism and set pair analysis model of a sustainable water resources system. Front. Environ. Sci. Eng. 2015, 9, 288–297. [Google Scholar] [CrossRef]
  22. Su, S.; Chen, X.; DeGloria, S.D.; Wu, J. Integrative fuzzy set pair model for land ecological security assessment: A case study of Xiaolangdi Reservoir Region, China. Stoch. Environ. Res. Risk Assess. 2010, 24, 639–647. [Google Scholar] [CrossRef]
  23. Yan, F.; Xu, K.; Li, D.; Zhang, X. Hazard assessment for biomass gasification station using general set pair analysis. BioResources 2016, 11, 8307–8324. [Google Scholar] [CrossRef]
  24. Wang, M.; Xu, X.; Li, J.; Jin, J.; Shen, F. A novel model of set pair analysis coupled with extenics for evaluation of surrounding rock stability. Math. Probl. Eng. 2015, 2015, 892549. [Google Scholar] [CrossRef]
  25. Zou, Q.; Zhou, J.; Zhou, C.; Song, L.; Guo, J. Comprehensive flood risk assessment based on set pair analysis-variable fuzzy sets model and fuzzy AHP. Stoch. Environ. Res. Risk Assess. 2013, 27, 525–546. [Google Scholar] [CrossRef]
  26. Li, C.; Sun, L.; Jia, J.; Cai, Y.; Wang, X. Risk assessment of water pollution sources based on an integrated k-means clustering and set pair analysis method in the region of Shiyan, China. Sci. Total Environ. 2016, 557, 307–316. [Google Scholar] [CrossRef] [PubMed]
  27. Wang, Y.; Jing, H.; Yu, L.; Su, H.; Luo, N. Set pair analysis for risk assessment of water inrush in karst tunnels. Bull. Eng. Geol. Environ. 2017, 76, 1199–1207. [Google Scholar] [CrossRef]
  28. Chong, T.; Yi, S.; Heng, C. Application of set pair analysis method on occupational hazard of coal mining. Saf. Sci. 2017, 92, 10–16. [Google Scholar] [CrossRef]
  29. Zhao, K. Partial connection number. In Progress of Artificial Intelligence 2005; Beijing University of Posts and Telecommunications (BUPT) Publishing House: Beijing, China, 2005; pp. 882–885. [Google Scholar]
  30. Xie, X.; Guo, D. Human factors risk assessment and management: Process safety in engineering. Process Saf. Environ. Prot. 2018, 113, 467–482. [Google Scholar] [CrossRef]
  31. Su, H.; Wen, Z.; Sun, X.; Yan, X. Multisource information fusion-based approach diagnosing structural behavior of dam engineering. Struct. Control Health Monit. 2018, 25, e2073. [Google Scholar] [CrossRef]
  32. Xie, H.T.; Li, B.; Zhao, Y.S. Study on risk trend assessment of metro tunnel crossing underground pipeline based on partial connection number. Appl. Mech. Mater. 2014, 580, 1283–1287. [Google Scholar] [CrossRef]
  33. Shi, Z.J.; Wang, H.W.; Wang, X. Risk state evaluation of aviation maintenance based on multiple connection number set pair analysis. Syst. Eng. Electron. 2016, 38, 588–594. [Google Scholar]
  34. Li, C.; Chen, J.; Yang, S.; Zhou, H. Application of Five-element Connection Number to Comprehensive Evaluation of risks Involved with Subway Construction. China Saf. Sci. J. 2013, 23, 21–26. [Google Scholar]
  35. Zhao, J.; Gao, H.; Cheng, J. Research on Evolution of Participation Willingness in Network Public Opinion: Based on Three-element Connection Number. Inf. Sci. 2017, 35, 118–120. [Google Scholar]
  36. Wu, T. Application on the Analysis of Developmental Trend of the Student Mark with Five-Element Partial Connection Number. Math. Pract. Theory 2009, 39, 53–59. [Google Scholar]
  37. Ren, J. Sustainability prioritization of energy storage technologies for promoting the development of renewable energy: A novel intuitionistic fuzzy combinative distance-based assessment approach. Renew. Energy 2018, 121, 666–676. [Google Scholar] [CrossRef]
  38. Wu, Q.; Peng, C. Comprehensive benefit evaluation of the power distribution network planning project based on improved IAHP and multi-level extension assessment method. Sustainability 2016, 8, 796. [Google Scholar] [CrossRef]
  39. Shah, S.M.T.; Ullah, A. A System Dynamics Approach to plan Strategy for managing factors influencing safety hazards on construction sites in developing countries. J. Saf. Sustain. 2024, 1, 141–150. [Google Scholar] [CrossRef]
  40. Yang, Y.; Li, H. Evaluation on Cost Overrun Risks of Long-distance Water Diversion Project Based on SPA-IAHP Method. In Conference Series: Earth and Environmental Science; IOP Publishing: Bristol, UK, 2018; Volume 113, p. 012012. [Google Scholar]
  41. Su, M.R.; Yang, Z.F.; Chen, B.; Ulgiati, S. Urban ecosystem health assessment based on emergy and set pair analysis—A comparative study of typical Chinese cities. Ecol. Model. 2009, 220, 2341–2348. [Google Scholar] [CrossRef]
  42. Wang, W.; Jin, J.; Ding, J.; Li, Y. A new approach to water resources system assessment—Set pair analysis method. Sci. China Ser. E Technol. Sci. 2009, 52, 3017–3023. [Google Scholar] [CrossRef]
  43. Saaty, T.L. How to make a decision: The analytic hierarchy process. Eur. J. Oper. Res. 1990, 48, 9–26. [Google Scholar] [CrossRef]
  44. Zhou, H.; Yuan, Y.; Liu, C.; Wu, C.; Zhang, M. Extension model for safety appraisal of existing concrete members based on an improved comprehensive weighting method. Adv. Civ. Eng. 2018, 2018, 1217543. [Google Scholar] [CrossRef]
  45. Yan, F.; Xu, K.; Li, D.; Cui, Z. A novel hazard assessment method for biomass gasification stations based on extended set pair analysis. PLoS ONE 2017, 12, e0185006. [Google Scholar] [CrossRef]
  46. Zhu, S.; Feng, Y.; Jiang, F.; Liu, J. Mechanism and risk assessment of overall-instability-induced rockbursts in deep island longwall panels. Int. J. Rock Mech. Min. Sci. 2018, 106, 342–349. [Google Scholar] [CrossRef]
Figure 1. The status evaluation index system of rock instability of metal mine.
Applsci 15 02614 g001
Figure 2. Flowchart of proposed method.
Applsci 15 02614 g002
Figure 3. Flowchart of the research.
Applsci 15 02614 g003
Figure 4. Three-dimensional views results of microseismic events.
Applsci 15 02614 g004
Figure 5. The value of each parameter per day.
Applsci 15 02614 g005
Figure 6. The evaluation result of rock instability.
Applsci 15 02614 g006
Figure 7. The calculation results: (a) the calculation results of the first-order PCN; (b) the calculation results of the second-order PCN; (c) the calculation results of the third-order PCN.
Applsci 15 02614 g007
Figure 8. The “worst-case” of PCN value.
Applsci 15 02614 g008
Figure 9. The number of collected microseismic events: (a) from 16 September 2022 to 25 September 2022; (b) from 26 September 2022 to 5 October 2022.
Applsci 15 02614 g009
Figure 10. Microseismic monitoring data in each phase: (a) cumulative microseismic event energy; (b) cumulative apparent stress; (c) cumulative logarithmic seismic moment.
Applsci 15 02614 g010
Table 1. Correlation coefficient values [44].
n345678910
ζ0.93760.82660.76580.66600.62850.63810.62150.5876
Table 2. Classification of normalized result grade values.
IndexNormalized Result
0–0.20.2–0.40.4–0.60.6–0.80.8–1
Cumulative Number of EventsIIIIIIIVV
Cumulative Microseismic Event EnergyIIIIIIIVV
Cumulative Apparent StressIIIIIIIVV
Cumulative Logarithmic Seismic MomentIIIIIIIVV
Table 3. The status evaluation index system of rock instability of metal mine.
Status evaluation of rock instability of metal mineCumulative Number of Events A1
Cumulative Microseismic Event Energy A2
Cumulative Apparent Stress A3
Cumulative Logarithmic Seismic Moment A4
Table 4. The introduction of experts.
ExpertProfessional PositionEducation BackgroundWork Experience (Year)
Expert 1StudentMaster7
Expert 2WorkerBachelor16
Expert 3WorkerMaster14
Expert 4EngineerMaster26
Expert 5EngineerPhD31
Expert 6EngineerMaster37
Expert 7ProfessorPhD15
Expert 8ProfessorPhD20
Expert 9ProfessorPhD32
Expert 10ProfessorPhD44
Table 5. Calculated values of index weights.
IndexWeight
Cumulative Number of Events (A1)0.1918
Cumulative Microseismic Event Energy (A2)0.2028
Cumulative Apparent Stress (A3)0.2467
Cumulative Logarithmic Seismic Moment (A4)0.3587
Table 6. The results of grading.
IndexDate
16171819202122232425
Cumulative Number of EventsIIIIIIIIIIIIVIVIII
Cumulative Microseismic Event EnergyIIIIIIVVVIIIVIIIIII
Cumulative Apparent StressIVVVVIVIVIIIVV
Cumulative Logarithmic Seismic MomentIIIVIVIIIVIVIIIIIIIII
Disclaimer/Publisher’s Note: The statements, opinions and data contained in all publications are solely those of the individual author(s) and contributor(s) and not of MDPI and/or the editor(s). MDPI and/or the editor(s) disclaim responsibility for any injury to people or property resulting from any ideas, methods, instructions or products referred to in the content.

