Article

Growth and Rhamnolipid Production Performance of Pseudomonas aeruginosa on Crude Biomass Carbohydrates and Bioenhancer-Based Growth Media

Department of Food Science and Human Nutrition, Food Sciences Building, Iowa State University, Ames, IA 50010, USA
*
Author to whom correspondence should be addressed.
Appl. Sci. 2025, 15(5), 2531; https://doi.org/10.3390/app15052531
Submission received: 14 January 2025 / Revised: 17 February 2025 / Accepted: 19 February 2025 / Published: 26 February 2025

Abstract

:
Novel growth media formulations for improved rhamnolipid production from Pseudomonas aeruginosa PAO1 were evaluated on four carbohydrate sources: glucose, glycerol, soy hull hydrolysate (SHH), and mimicking soy hull hydrolysate (MSH) along with bioenhancers and other media components. This study is aimed at understanding the effect of different types of human neuroendocrine bioenhancers on growth performance and rhamnolipid titer generation of the Pseudomonas aeruginosa PAO1 in a growth media containing sustainable crude biomass carbohydrates. Optimization of the media factors for improved rhamnolipid titers with Pseudomonas aeruginosa PAO1 was performed through a high-throughput response surface study for the best growth rate for concentrations of carbohydrates; bioenhancers, norepinephrine (NE) and dopamine (DP); and iron (Fe). In the high-throughput study, the microbial growth rates for all sugar types ranged between 0.2 and 0.5 log numbers in OD (optical density, indicating the concentration of bacterial cells within a liquid culture, as determined by a spectrophotometer) h−1 at 600 nm, with glucose providing the highest growth rate in the best response surface media combination at 2.5% glucose concentration, 160 µM norepinephrine, 66 µM dopamine, 0.03% Fe concentration. The effect of this media on growth and rhamnolipid production was further verified in 100 mL shake flasks. The highest OD and rhamnolipid titers were achieved for glucose- and glycerol-based media at 2.78 g/L and 2.72 g/L, respectively, whereas significantly lower titers at 1.98 g/L and 1.72 g/L were observed for SHH- and MSH-based media, respectively. No significant growth enhancement effects by the bioenhancers norepinephrine and dopamine were observed at the concentrations evaluated.

1. Introduction

Surfactants are amphiphilic organic compounds containing hydrophobic (water insoluble or oil soluble) and hydrophilic (water soluble) groups. This unique composition imparts them with excellent emulsifying/dispersion capabilities, which makes them very useful in food emulsifiers, detergents, paints, and agricultural sprays (herbicides) and in the dispersion of crude oil spills. The global surfactant market was valued at USD 41.3 billion in 2019 and was projected to reach USD 58 billion with a compounded annual growth rate (CAGR) of 5.3% between 2020 and 2027 [1]. While synthetic surfactants from petroleum-based intermediates are relatively cheaper, they ultimately will become unsustainable [2]. Surfactants produced using biological feedstock, either via growing microorganisms on them or via enzyme esterification reactions, are bio-based surfactants and will be favored for their lower environmental and health risks, biodegradability, and lower toxicity [3], if they are economically viable. Although process optimization via the manipulation of growth media and fermentation process factors is possible, it is critical to evaluate specific carbohydrate feedstocks and their process economics. The utilization of agricultural resources for bacterial fermentation to produce biosurfactants, such as surfactin and rhamnolipids, through better pretreatment schemes, media manipulation, and enhancers use is expected to enhance the economic value of these resources [3].
Rhamnolipids are one of the most studied bio-based surfactants produced through bacterial expression [4]. These are glycolipids consisting of a rhamnose unit attached to a 3-(hydroxyalkanoyloxy) alkanoic acid (HAA) fatty acid tail (Figure 1), majorly produced through bacterial fermentation by Gram-negative Pseudomonas species [5]. Rhamnolipids have many applications across industries. These applications include (a) biomedical applications such as antimicrobial and antiviral agents, periodontal applications, ulcer treatments [6]; (b) environmental applications such as biodegradation agents, heavy metal absorption agents, disinfection agents, and cleaning formulation agents [7,8,9]; and (c) cosmetics and pharmaceutical applications such as shampoo formulation agents and ingredients in radiation and burn treatment formulations [10].
Rhamnolipids are the secondary metabolites of aerobic bacterial expression; they require carefully designed growth media formulations and culture process controls to ensure maximum product generation and efficient product recovery through sterile purification procedures. Reported rhamnolipid titers by different Pseudomonas aeruginosa strains have ranged from 0.5 g/L to 78 g/L depending on the amount of carbohydrate added to the media, the inoculation volume, the type of culture and fermentation, i.e., batch or fed-batch, with yields (YP/S) ranging between 0.058 and 0.62 (rhamnolipid g/substrate g) [11].
Rhamnolipids have been produced on various renewable substrates/carbohydrate sources, including olive oil, waste frying oil, waste fatty acids, corn oil, soybean oil, molasses, and spent wash from distillery waste [12]. One of the most studied substrates for rhamnolipids and biosurfactants in general is biomass sugars extracted through the pretreatment and enzymatic hydrolysis of cellulosic and lignocellulosic biomass sources. One of the aims of this study is to understand the impact of such biomass-extracted carbohydrate substrate (soy hulls) on rhamnolipid-generating bacterial growth performance and titers. The extraction of fermentable sugars from crude biomass sources’ enzymatic hydrolysis leads to the challenge of complexity due to composite sugar mixtures in crude biomass sugar hydrolysates and because of how microbes utilize the various hexose, pentose, and other oligosaccharides in the media. This complexity in the carbon sources’ formulation is increased with the role of other media growth factors for surfactant production [13,14].
Along with selecting and optimizing carbohydrate sources in bacterial growth media, trace metals, protein sources, and pH buffers are essential growth factors studied extensively for bacterial growth and value-added product generation. However, besides essential growth factors in the media, exogenous growth enhancers have also been studied for improvements in growth profile and product titer.
The potential of Pseudomonas aeruginosa to grow at extremely high growth rates in certain environmental conditions on laboratory-grade pure sugars such as glycerol has been described in studies by Li et al. 2009 and Lyte et al. 1992, but it has not been studied on renewable carbohydrate sources [15,16,17]. In these studies, it was show than, in P. aeruginosa, the oxidative stress created by the binding of iron with specific proteins is affected by norepinephrine (NE) and dopamine (DP) [15,16,17]. Norepinephrine and dopamine showed an increase in the growth of Pseudomonas aeruginosa by many log-folds, especially in media considered more difficult for the bacterium to grow in [16]. The ability of norepinephrine to induce rapid growth in Pseudomonas, as well as in other bacterial strains, has been shown because of a norepinephrine-induced autoinducer of growth factor (NEGF), in the presence of human transferrin protein [15,16,17]. This constitutes the second aim of the study, i.e., to understand the impact of norepinephrine and dopamine along with that of the iron concentration in growth media containing biomass-derived carbohydrates as the substrate.
In this study, the fermentable carbohydrates glucose, glycerol, and crude sugar hydrolysates from soy hulls along with norepinephrine, dopamine, and iron concentration as factors were studied for their effect on the Pseudomonas aeruginosa growth rate and rhamnolipid production. The working hypothesis of this study was that the QS (quorum-sensing) system of rhamnolipid generation would be enhanced with the inclusion of iron-starved conditions and the bioenhancers norepinephrine and dopamine because they serve as siderophores. The main objectives of this study were to (a) optimize the growth factors for some crude biomass sugar hydrolysates in a minimal mineral salt medium for the higher bacterial (Pseudomonas) growth rates in a high-throughput study, and (b) verify the best-performing-media growth and rhamnolipid titer performances from the high-throughput study at a larger benchtop scale. These studies were conducted with four carbohydrate types: (a) glucose, (b) glycerol, (c) soy hull hydrolysates (SHHs), and (d) mimicking soy-hull hydrolysates (MSHs). SHHs and their majority pure-sugar control MSHs were chosen based on our previous study Sharma et al. 2018 [14].

2. Materials and Methods

A high-throughput response surface optimization of growth enhancer concentrations (NE and DP), iron (FE), and carbohydrate type and concentration as four sugar blocks, (a) glucose, (b) glycerol, (c) SHHs, and (d) MSHs was designed using 108-well plates (500 μL) in a Bioscreen shaker incubator (Oy Growth Curves Ab Ltd., Helsinki, Finland). Optimized media factors and their levels from the Bioscreen study were then used for a 100 mL shake-flask verification study with the two media sets described below.

2.1. Materials

The enzymes NS22086, NS22083, and NS22119, whose activities were cellulase, hemicellulase, and pectinase/arabinase/xylanase, respectively, were obtained from Novozymes® (Bagsværd, Denmark). The potencies for these three enzymes were 1000 BHU/g (biomass hydrolysis unit, which is a measure of enzyme activity needed to hydrolyze cellulose based on the Novozymes standard), 2500 FXU-S/g (fungal xylanase unit, which is a measure of Endoxylanase activity based on the Novozymes standard), 13,700 PGU/g (polygalacturonase unit, which is a measure of polygalacturonase activity based on the Novozymes standard) (Novozymes® NS22086, NS22083, and NS22119). Pseudomonas aeruginosa PAO1 was donated by Dr. Larry Halverson, Iowa State University, Ames, IA, USA. The following bacterial growth media components: anthrone reagent, norepinephrine bitartrate, and dopamine hydrochloride were purchased from Sigma-Aldrich (St. Louis, MO, USA) and Thermo Fisher Scientific (Waltham, MA, USA). High-throughput culture studies were conducted in a Bi-screen C (Oy Growth Curves Ab Ltd., Helsinki, Finland) in a sterile honeycomb two microplate with cover. The 100 mL shake-flask experiments were performed in a Thermo Fisher Scientific shaking incubator at 150 rpm, and the OD was measured in a spectrophotometer at 600 nm.

2.2. Media Preparation

The bacterial growth media for the Bioscreen study (0.5 mL in each well) and the 100 mL shake-flask experiments were based on a minimal mineral salt medium (MSM) designed for efficient iron uptake according to a study conducted by Gunther et al. (2005), with growth enhancer, yeast extract amendments in four different carbohydrate blocks: glucose, glycerol, soy hull hydrolysates, and mimicking soy hull hydrolysates. The minimal mineral salt media contained, per liter, 0.7 g KH2PO4, 0.9 g Na2HPO4, 2 g NaNO3, 0.4 g MgSO4 · 7H2O, 0.1 g CaCl2 · 2H2O, 2 mL of trace elements [per liter, 2 g FeSO4 · 7H2O, 1.5 g MnSO4 · H2O, 0.6 g (NH4)6Mo7O24 · 4H2O] [18]. The soy hull hydrolysates were generated by treating ground dry soy hulls, at 5% enzyme loading without any chemical pretreatment. This was executed by treating 200 g dried ground soy hulls by a 1:1:1 combination of Novozymes® enzymes, NS22086, NS22083, and NS2211 at two 5% (v/v) enzyme loadings. A control without enzyme treatment was included. The pH was maintained at 5.0 with a 0.1 M sodium acetate buffer. The reactions were carried out in 500 mL Erlenmeyer flasks for 24 h in a shaker incubator at 50 °C, 150 rpm. The hydrolysates were collected by centrifuging at 15,000× g for 20 min in a centrifuge (Thermo-Fisher, model Sorvall legend XTR). The hydrolysates and the remaining solids were weighed and stored in Ziploc bags (SC Johnson & Son, Inc., Racine, WI, USA) at −20 °C. The carbohydrate yield was calculated as the conversion of biomass solids to soluble carbohydrate (CHO), based on the starting dry weight CHO content. This process, along with the hydrolysate recovery, was performed according to our previous studies, Sharma et al. (2016) and Sharma et al. (2018) [13,14].

2.3. Culture Conditions and Sampling Details

Seed cultures for the Bioscreen study and the 100 mL shake-flask experiments for Pseudomonas aeruginosa PAO1 were grown in LB media at 30 °C for 24 h with a 150 rpm shake speed in a shaking incubator. The Bioscreen cultures were inoculated at 0.1% v/v. For the Bioscreen study, the temperature of 37 °C, pH of 7.0, continuous shaking, and automated OD at 600 nm measurement for every 15 min was performed for a 48 h culture. For the 100 mL shake-flask study, 37 °C, pH of 7.0 was used for a 48 h culture with sampling for OD measurement and rhamnolipid titer analysis performed at 0, 3, 6, 24, and 48 h. Each sample was first tested for OD and then centrifuged at 5000 rpm for 10 min to separate the cells and clear liquid and tested for rhamnolipid concentration.

2.4. Design of Response Surface Experiment and Statistical Analyses for Bioscreen Study

After an initial assessment of the factors and media design, carbohydrate concentration (0–3% w/v), norepinephrine (0–150 µM), dopamine (0–150 µM), and Fe (0–0.03%) were selected as growth enhancement factors in the previously defined MSM. This MSM contained only a minimal amount (0.1 g/L) of protease peptone as a protein source. No other complex nutritional factors such as yeast extract or other undefined components were present in the media, as minimum interference of extraneous protein components was intended to observe the combination effects of the above-mentioned growth enhancement factors.
Central composite design (CCD) is a commonly used response surface methodology to optimize independent variables concerning the measured response. Typically, CCD design consists of 2p factorial runs with 2p axial runs and Pc center runs to optimize process parameters, where p is the number of factors or independent variables. In this study, four independent variables (p = 4), carbohydrate concentration for glycerol/glucose/SHH/MSH (X1), Fe concentration (X2), norepinephrine (X3) concentration, and dopamine (X4) concentration, were optimized, with growth rate as the response. Sixteen (24 = 16) factorial points, eight (2 × 4 = 8) axial points, and three replicates at the center points resulted in 27 experimental conditions. “Low” and “High” levels of the independent variables were coded as −1 and +1 and the axial points were located at (±α, 0, 0), (0, ±α, 0) and (0, 0, ±α), where α is the distance of the axial point, which was fixed at 1. The center points were used to determine the experimental error and the reproducibility of the data. The experimental sequence was randomized to minimize the effects of uncontrolled errors. The cell growth rates (log numbers in OD h−1 at 600 nm) for the fermentations were calculated by determining the slope of the logarithmic conversion of the optical density for each growth curve between 0 and 10 h (the log-phase) and were used as a response variable. The optical density (OD) was not used as a response variable due to the lack of dilution capability in the Bioscreen unit, as any OD value above 1.0 would not be an accurate numerical value; hence, the growth rate during the log phase (0–10 h) was selected as the response parameter. The effect of four independent variables was used to develop a second-degree polynomial model (Equation (1)) for the growth rate response variable (Y1).
Y ^ = β 0 + i n β i x i + i i n β i i x i 2 + i = 1 n 1 j = i + 1 n β i j x i x j
where Y ^ is the predicted response, β 0 the constant coefficient, β i the linear coefficients, β i j the interaction coefficients, β i i the quadratic coefficients, and   x i ,   x j are the assigned independent variables. The design matrix generation and model fitting were performed using JMP 15 (SAS Institute, Inc., Cary, NC, USA).

2.5. Experimental Design and Determination of Rhamnolipid Concentration in 100 mL Shake-Flask Experiments

The seed culture for Pseudomonas aeruginosa PAO1 for the 100 mL shake-flask study was also grown in LB media at 30 °C for 24 h with 150 rpm shake speed in a shaking incubator. A 0.1% v/v inoculation percentage was used for this study as well. Optimized media combinations from the Bioscreen study were grown for each sugar type (glucose, glycerol, SHH, and a mimic soy hull hydrolysate mix produced from pure sugars, MSH) with two variants: (a) mineral-salt-optimized media and (b) mineral-salt-optimized media with 1.5 g/L of yeast extract. MSH was a pure monomeric sugar mix control in the ratio of 3:2.5:0.6:2 for glucose, xylose, arabinose, and galactose, as found in soy hull hydrolysate (Chapter 3; Sharma et al. 2016) [13]. These experiments were conducted with two replicates for each fermentation medium, along with six controls, making a total of twenty-two 100 mL fermentations. The rhamnolipid concentrations were quantified using the anthrone–sulfuric acid method, which measures L-rhamnose concentrations in the culture media after hydrolysis or mono- and di-rhamnolipids as described by Zhao et al., 2016 [19].

3. Results and Discussion

3.1. Results

3.1.1. Results of Media Optimization with High-Throughput Bioscreen Study

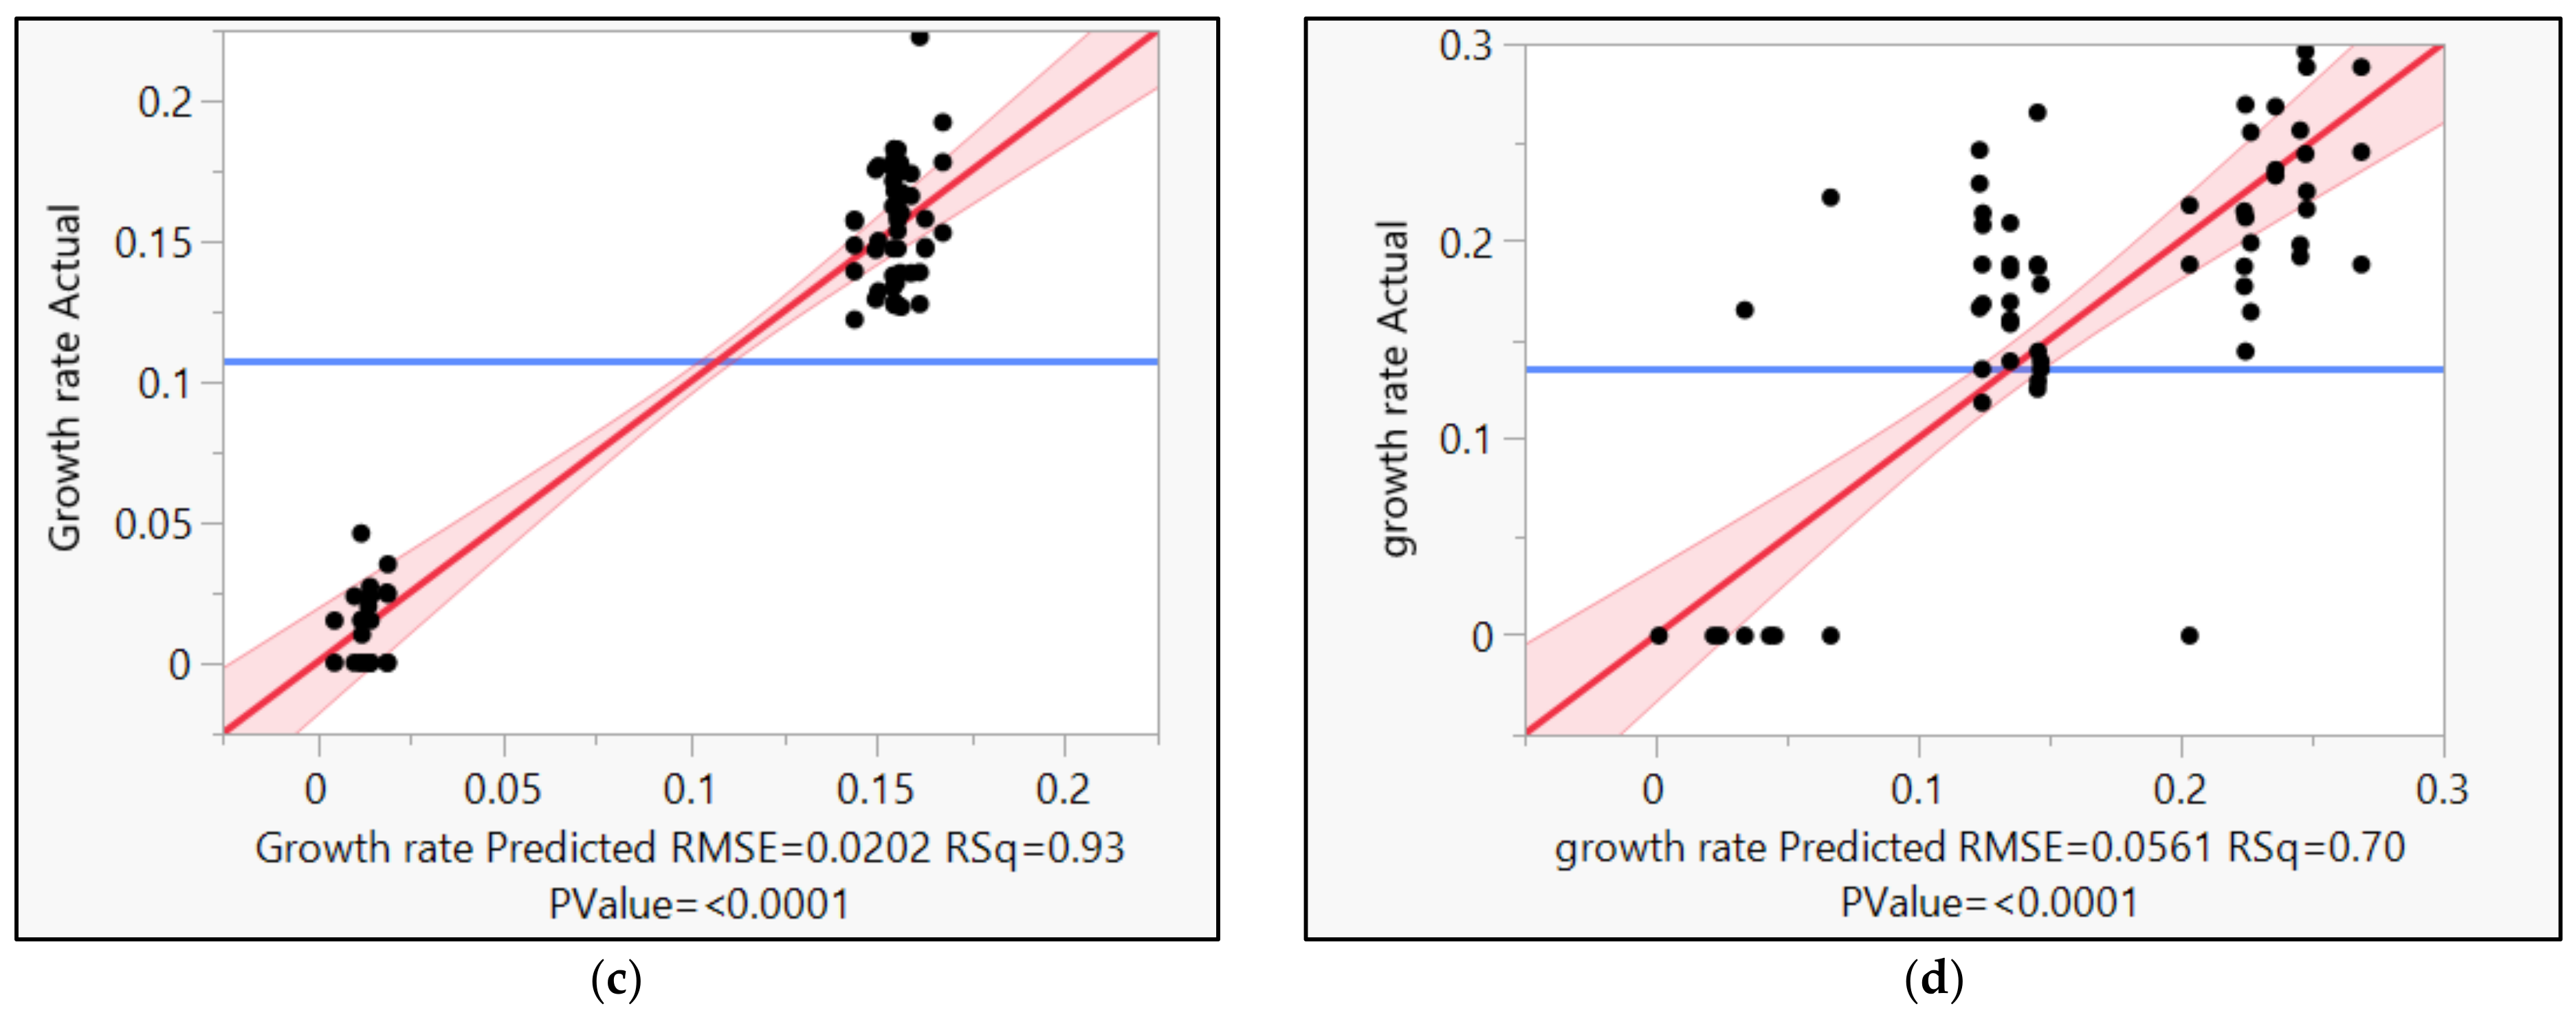
The results for the batch optimization and model fitting for growth rates on each control and supplemented carbohydrate media illustrated that the OD-based growth rates ranged between 0 and 0.5 (log numbers in OD h−1) for all the media combinations and carbohydrate types. Figure 2 shows the range of actual and predicted (Equation (1)) growth rates achieved for each media combination, where the highest growth rates were achieved for glucose (up to 0.5 log numbers in OD h−1); however, the data variability was higher with an R2 value of 0.83. Glycerol had a slightly lower (up to 0.35 log numbers in OD h−1) peak growth rate than glucose, with lower data variability as indicated with an R2 value of 0.96. The SHH and MSH sugar types showed smaller peak growth rates (0.25–0.3 log numbers in OD h−1) than the pure glucose and glycerol sugars. This phenomenon can be attributed to the metabolic preference of Pseudomonas aeruginosa to readily uptake six-carbon sugars and utilize them as building blocks for growth and the generation of the sugar backbone of rhamnolipid. Kim et al. (2016) reported some biofilm formation inhibition when Pseudomonas aeruginosa was grown on raffinose-rich media, although no significant growth-related inhibition was observed. The lower growth rates on SHH and MSH could be explained by the likely presence of raffinose in SHHs and MSHs, which is made up of galactose as one of its constituent sugars along with glucose and fructose. Galactose has been shown to inhibit biofilm formation in Pseudomonas strains in previous studies [20] and may have limited the production of rhamnolipids [20].

3.1.2. Results of Verification of Optimized Conditions in 100 mL Shake-Flask Study for Growth Performance and Rhamnolipid Titers

Hydrolysate sugars from the hydrolysis of soy hulls as carbohydrates in SHH-based media yielded 68.2% and 71.50% carbohydrate conversion, respectively, for the Bioscreen study and the 100 mL verification, which is consistent with the results that were achieved for the enzyme hydrolysis process for soy hulls in our previous study (Chapter 3; Sharma et al. 2016) [13]. As noted in the previous section, the only significant effect of any bioenhancer was observed for the norepinephrine concentration and the interaction effect of the carbohydrate concentration and the norepinephrine concentration of effect in the glucose sugar type. The best media combination for verification with the 100 mL study was selected from one of the solutions provided by the response surface model as, 2.5% sugar concentration, 160 µM NE concentration, 66 µM NE concentration, and 0.03% Fe concentration. This media combination (hitherto referred to as G, GL, SHH, and MSH for each sugar type at 2.5% concentration) was tested with the original MSM and with a variant with 1.5 g/L yeast extract added (hitherto referred to as G + Y, GL2 + Y, SHH2 + Y, and MSH2 + Y).
The addition of 1.5 g/L yeast extract as a media variant in addition to the MSM was implemented to mimic the interaction of norepinephrine with much more expensive human transferrin protein to induce a combined effect of NE and DP binding to larger peptides present in the yeast extract, considering the similarity of the peptidomes of humans and yeast extract [21]. However, no significant improvement in rhamnolipid titers was observed, although some improved optical density in the culture media containing the yeast extract was observed for all the different sugar types. This could be attributed to the presence of some undefined nutritional factors in yeast extract, such as vitamins, along with the higher total protein availability in yeast extract, which was not part of the minimal MSM.

3.2. Discussion

3.2.1. Analysis of Media Optimization with High-Throughput Bioscreen Study

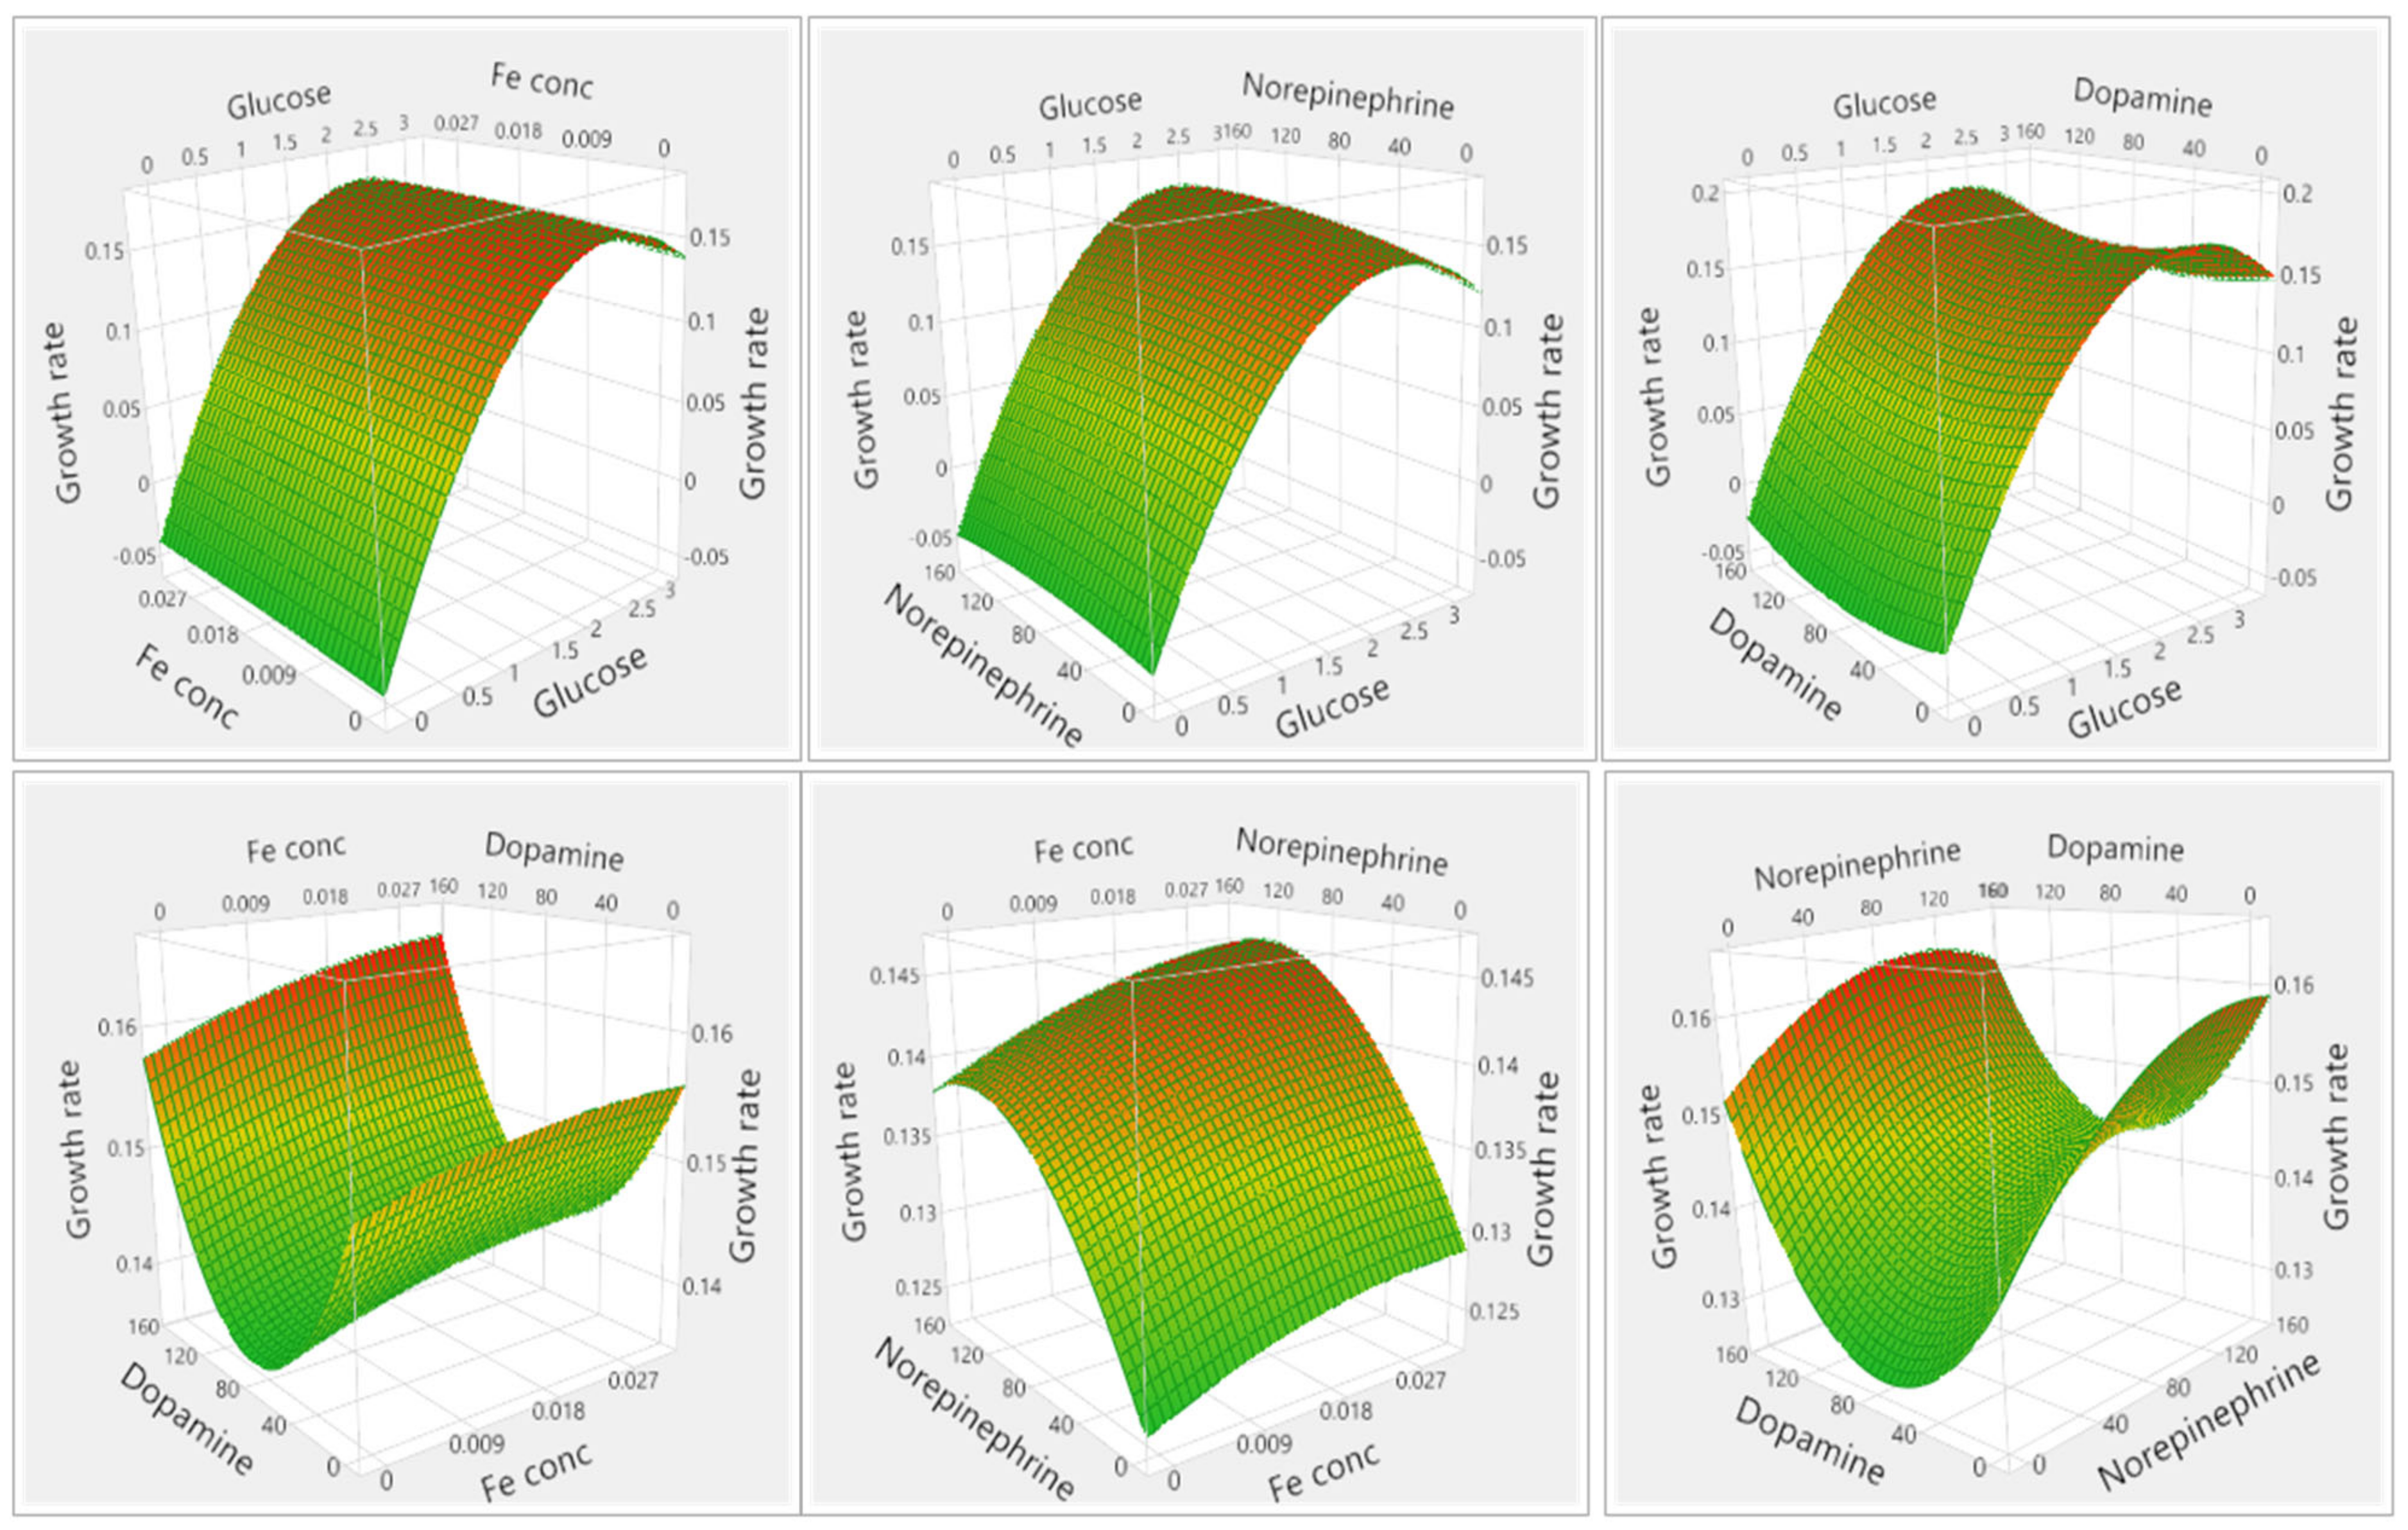
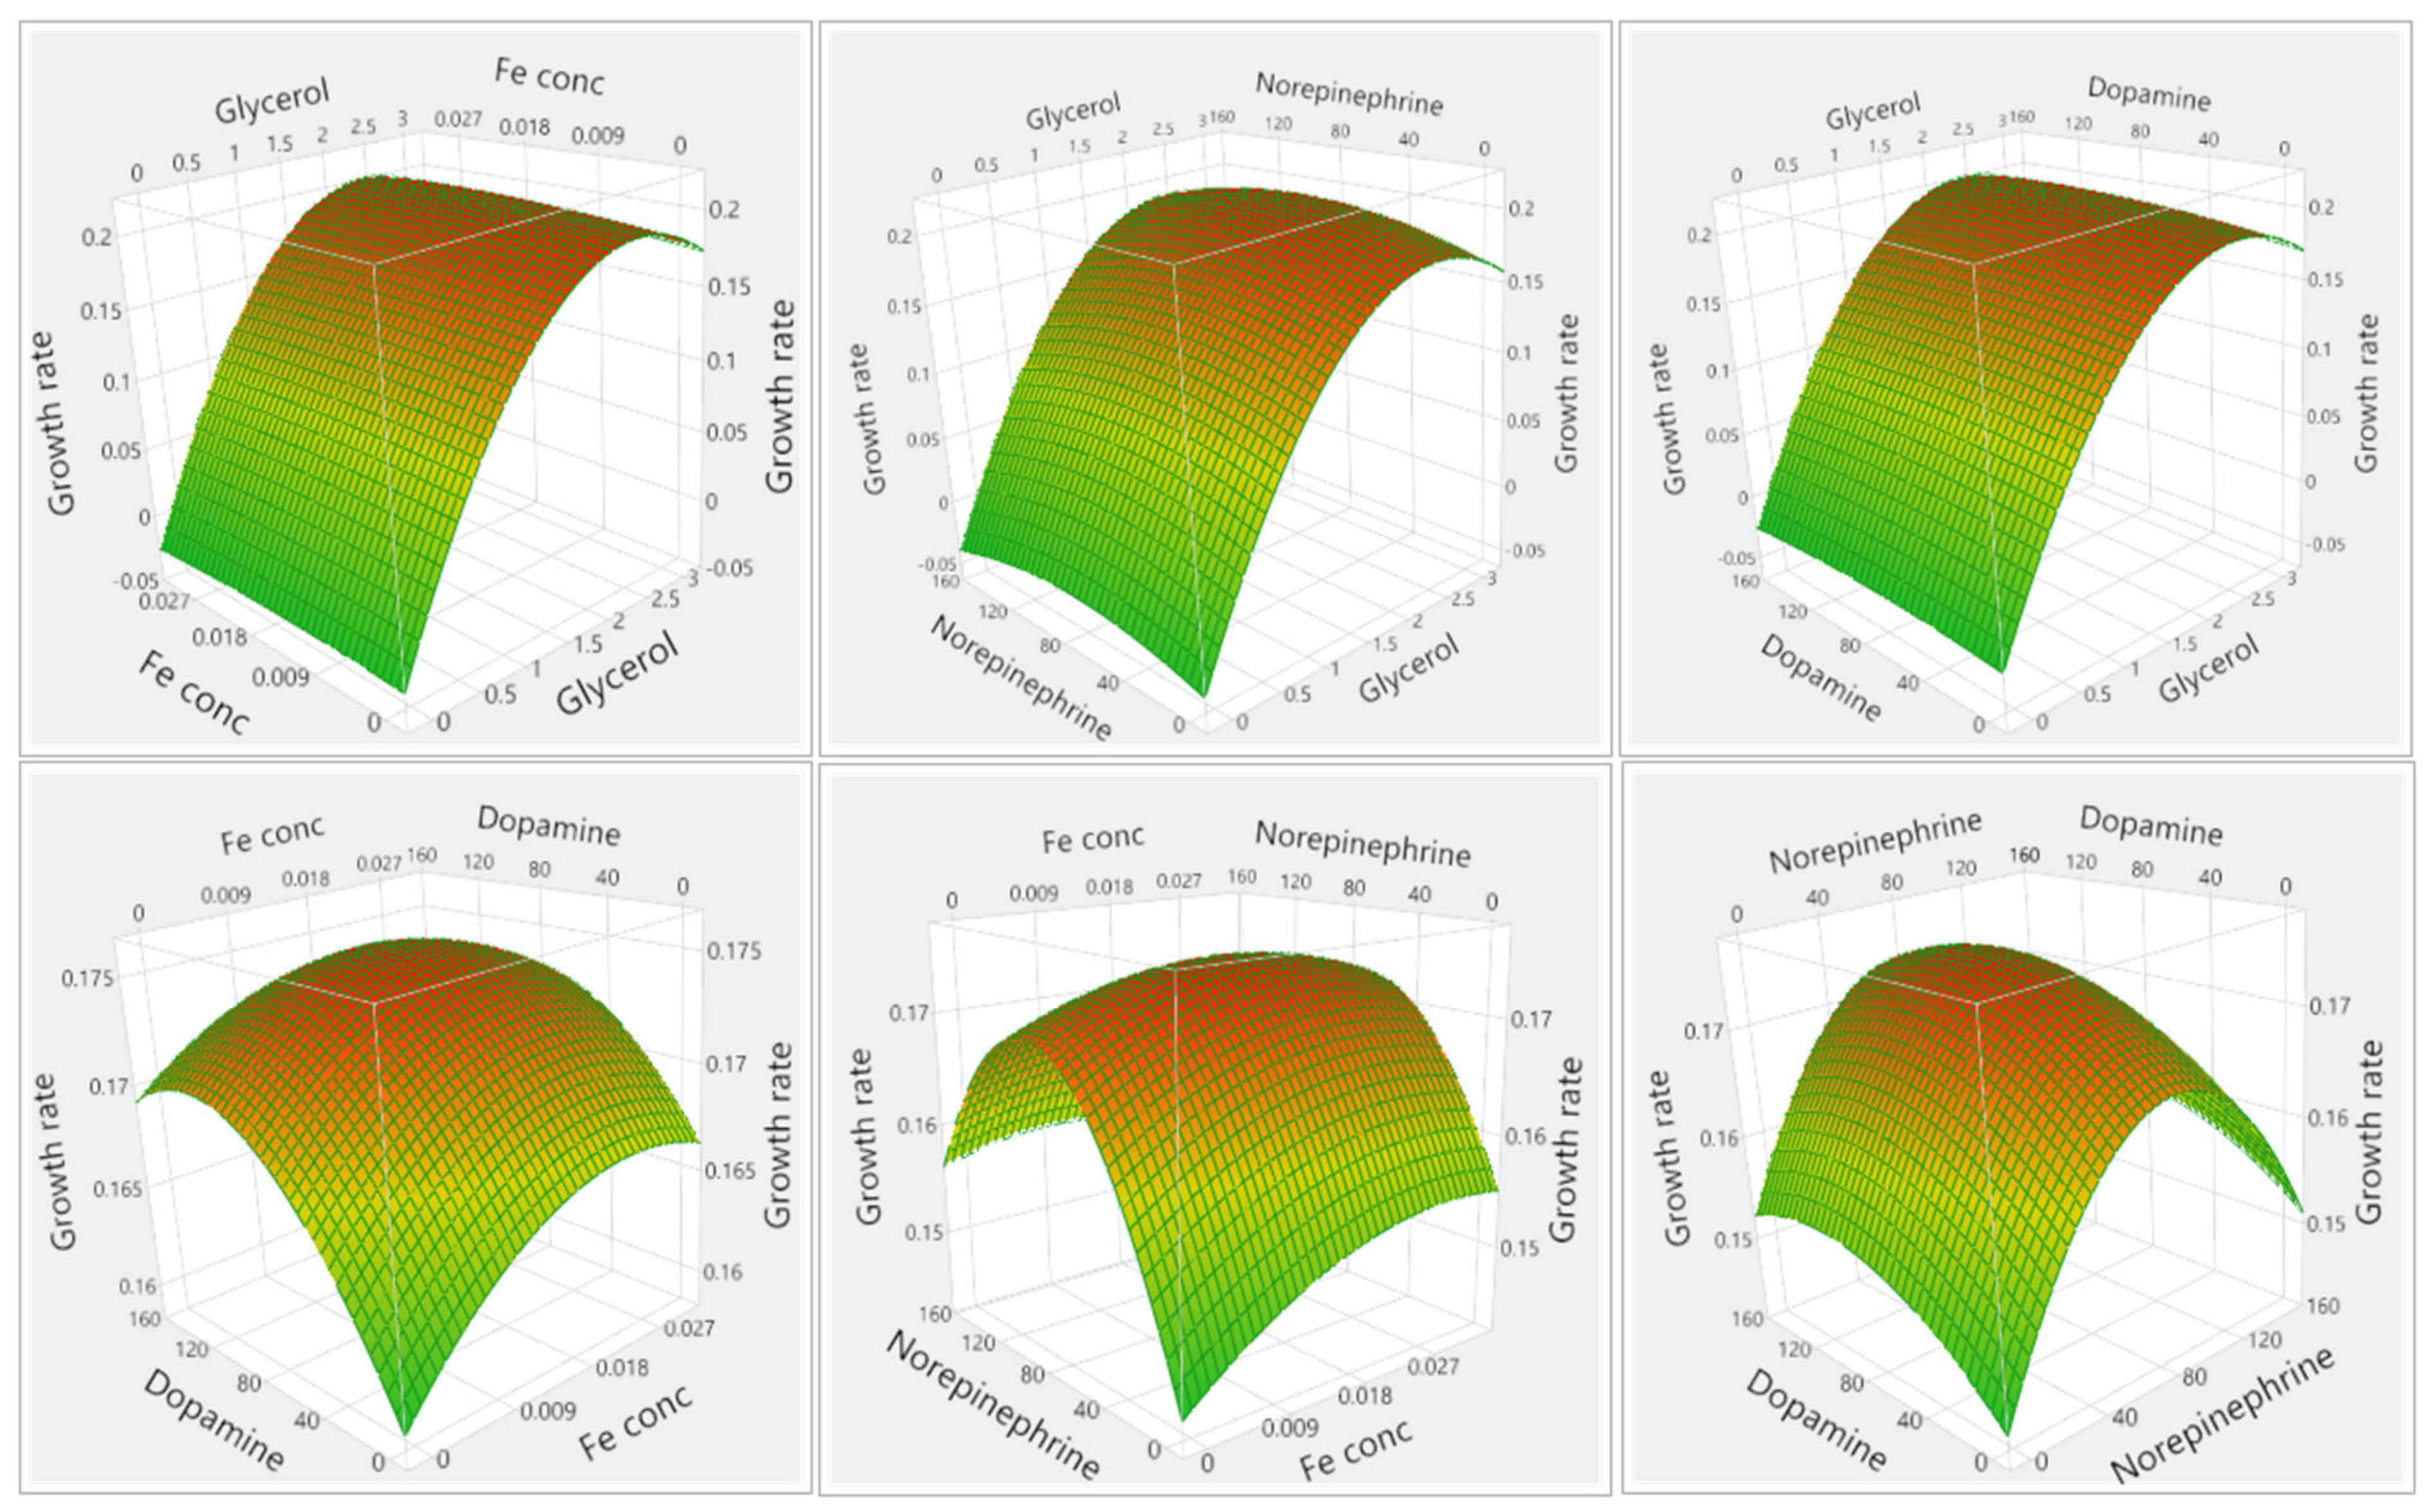
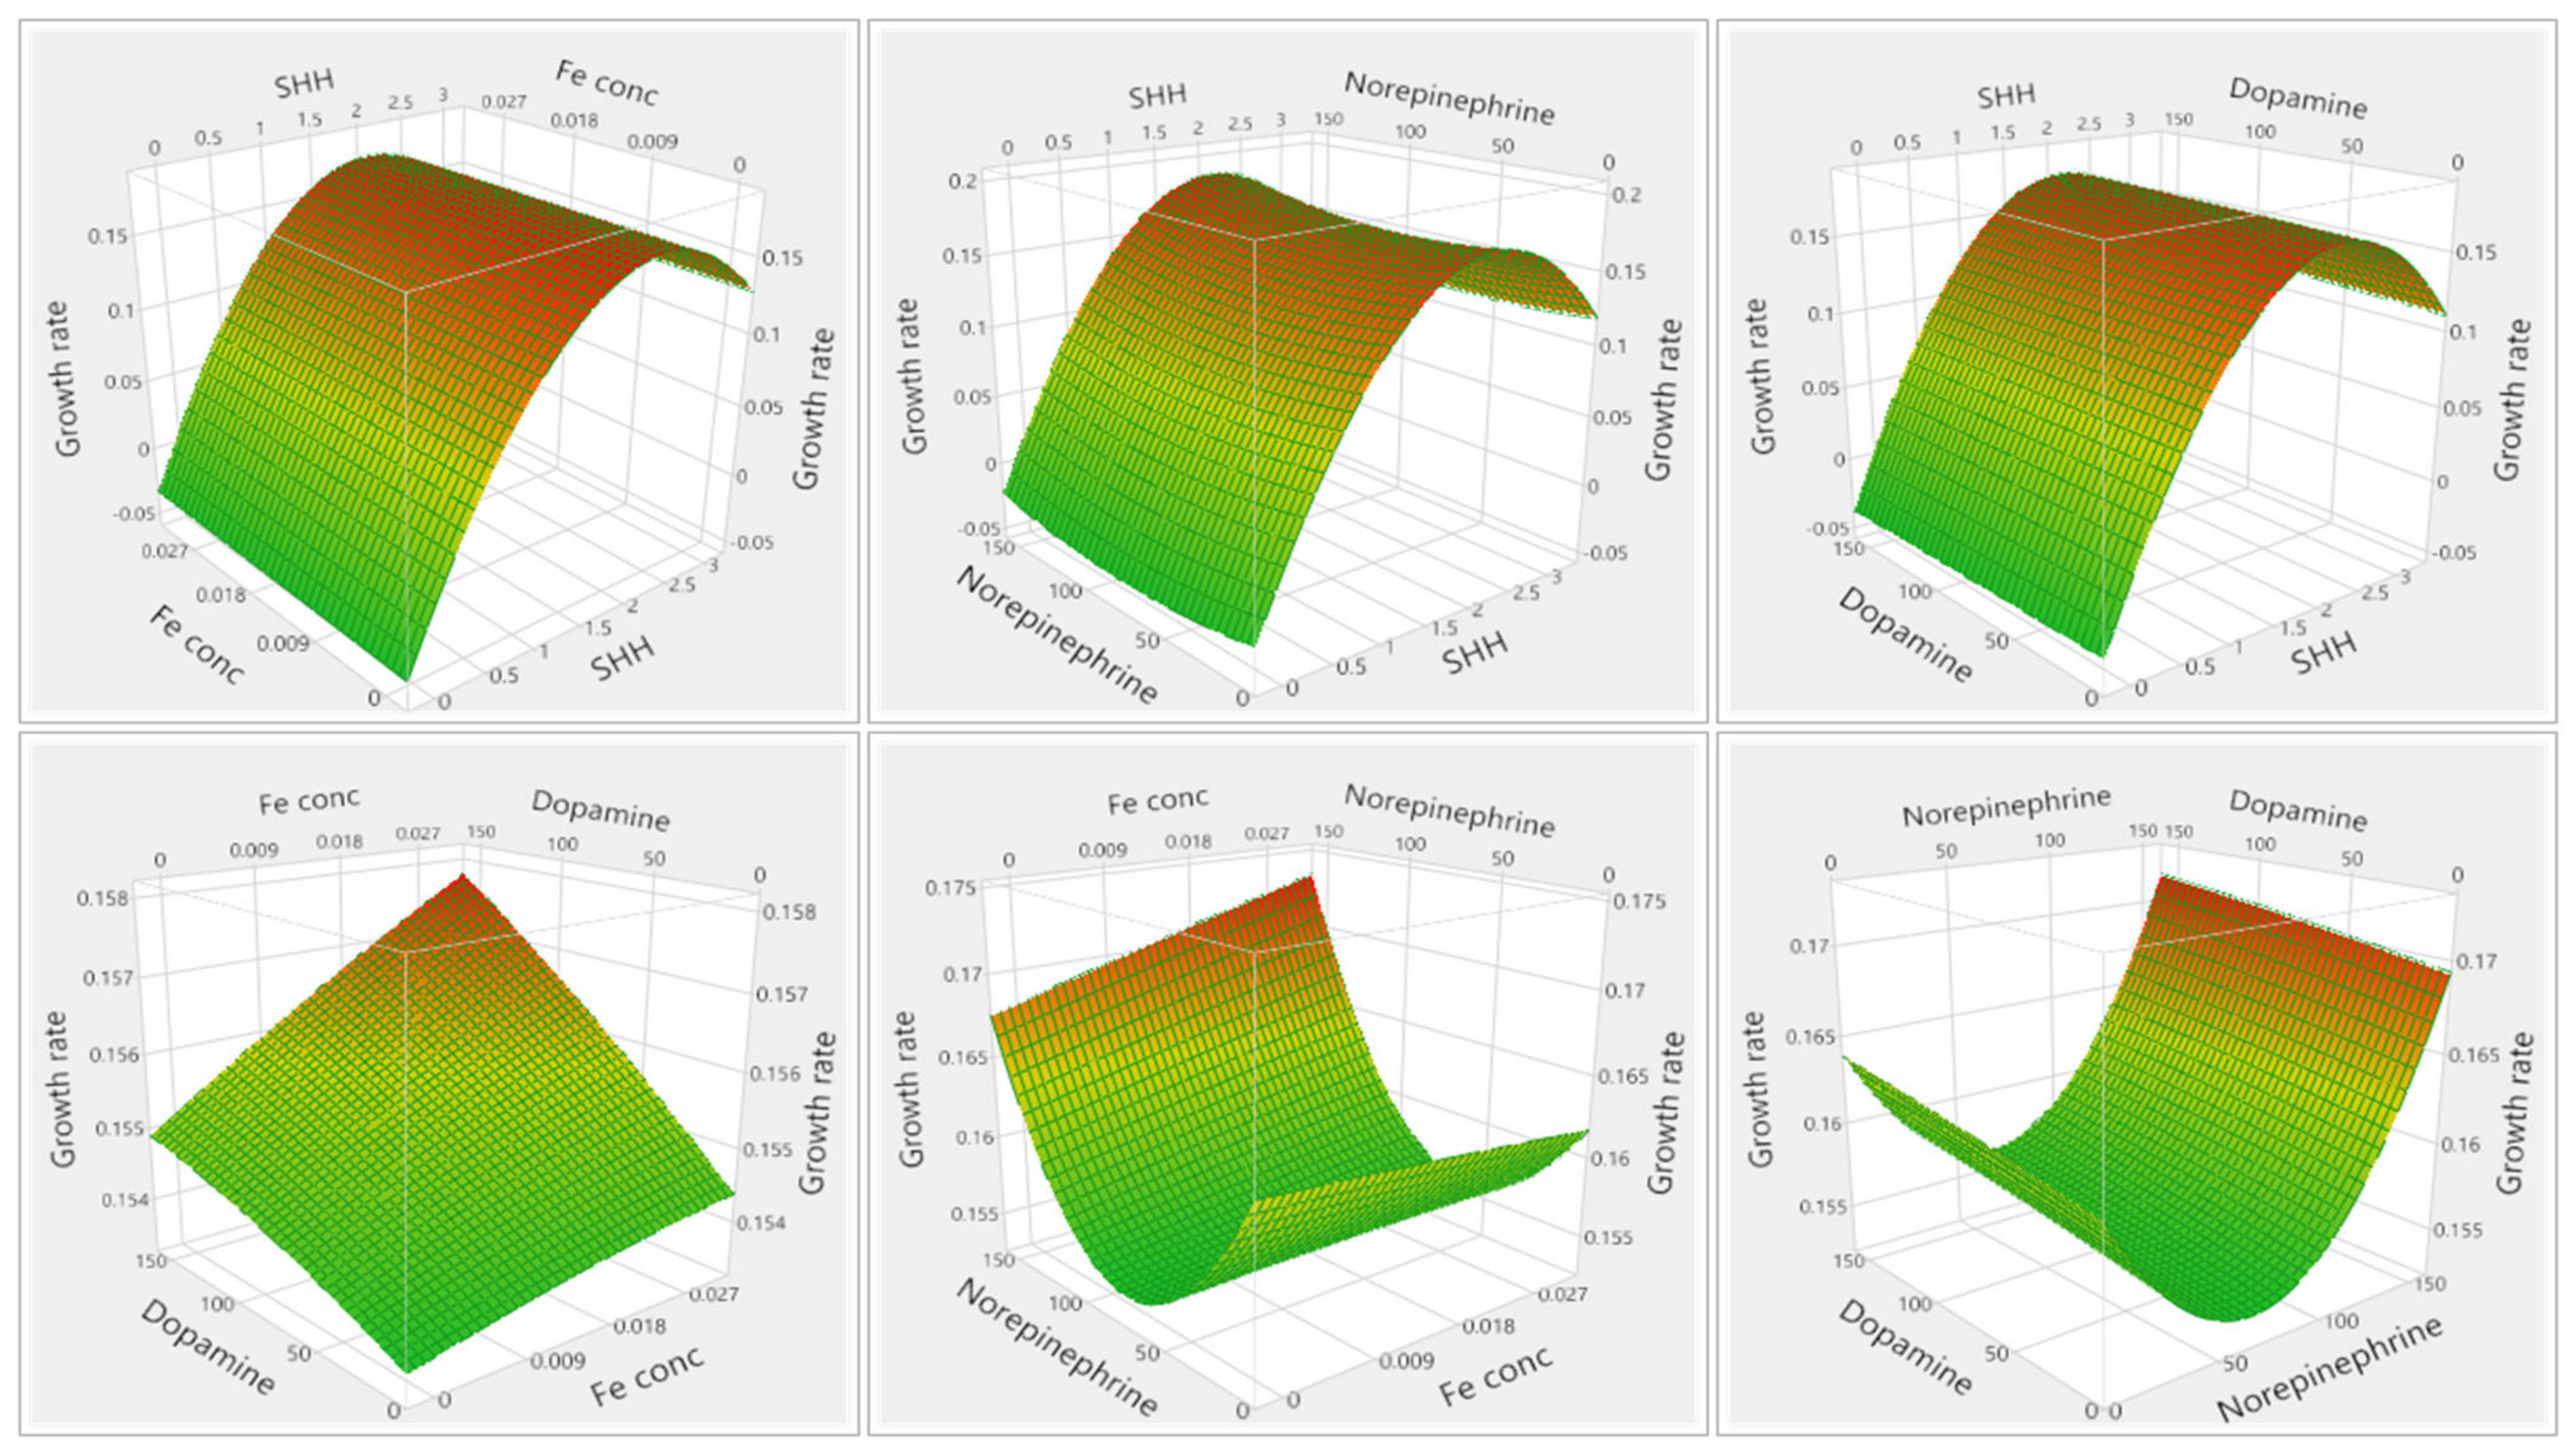
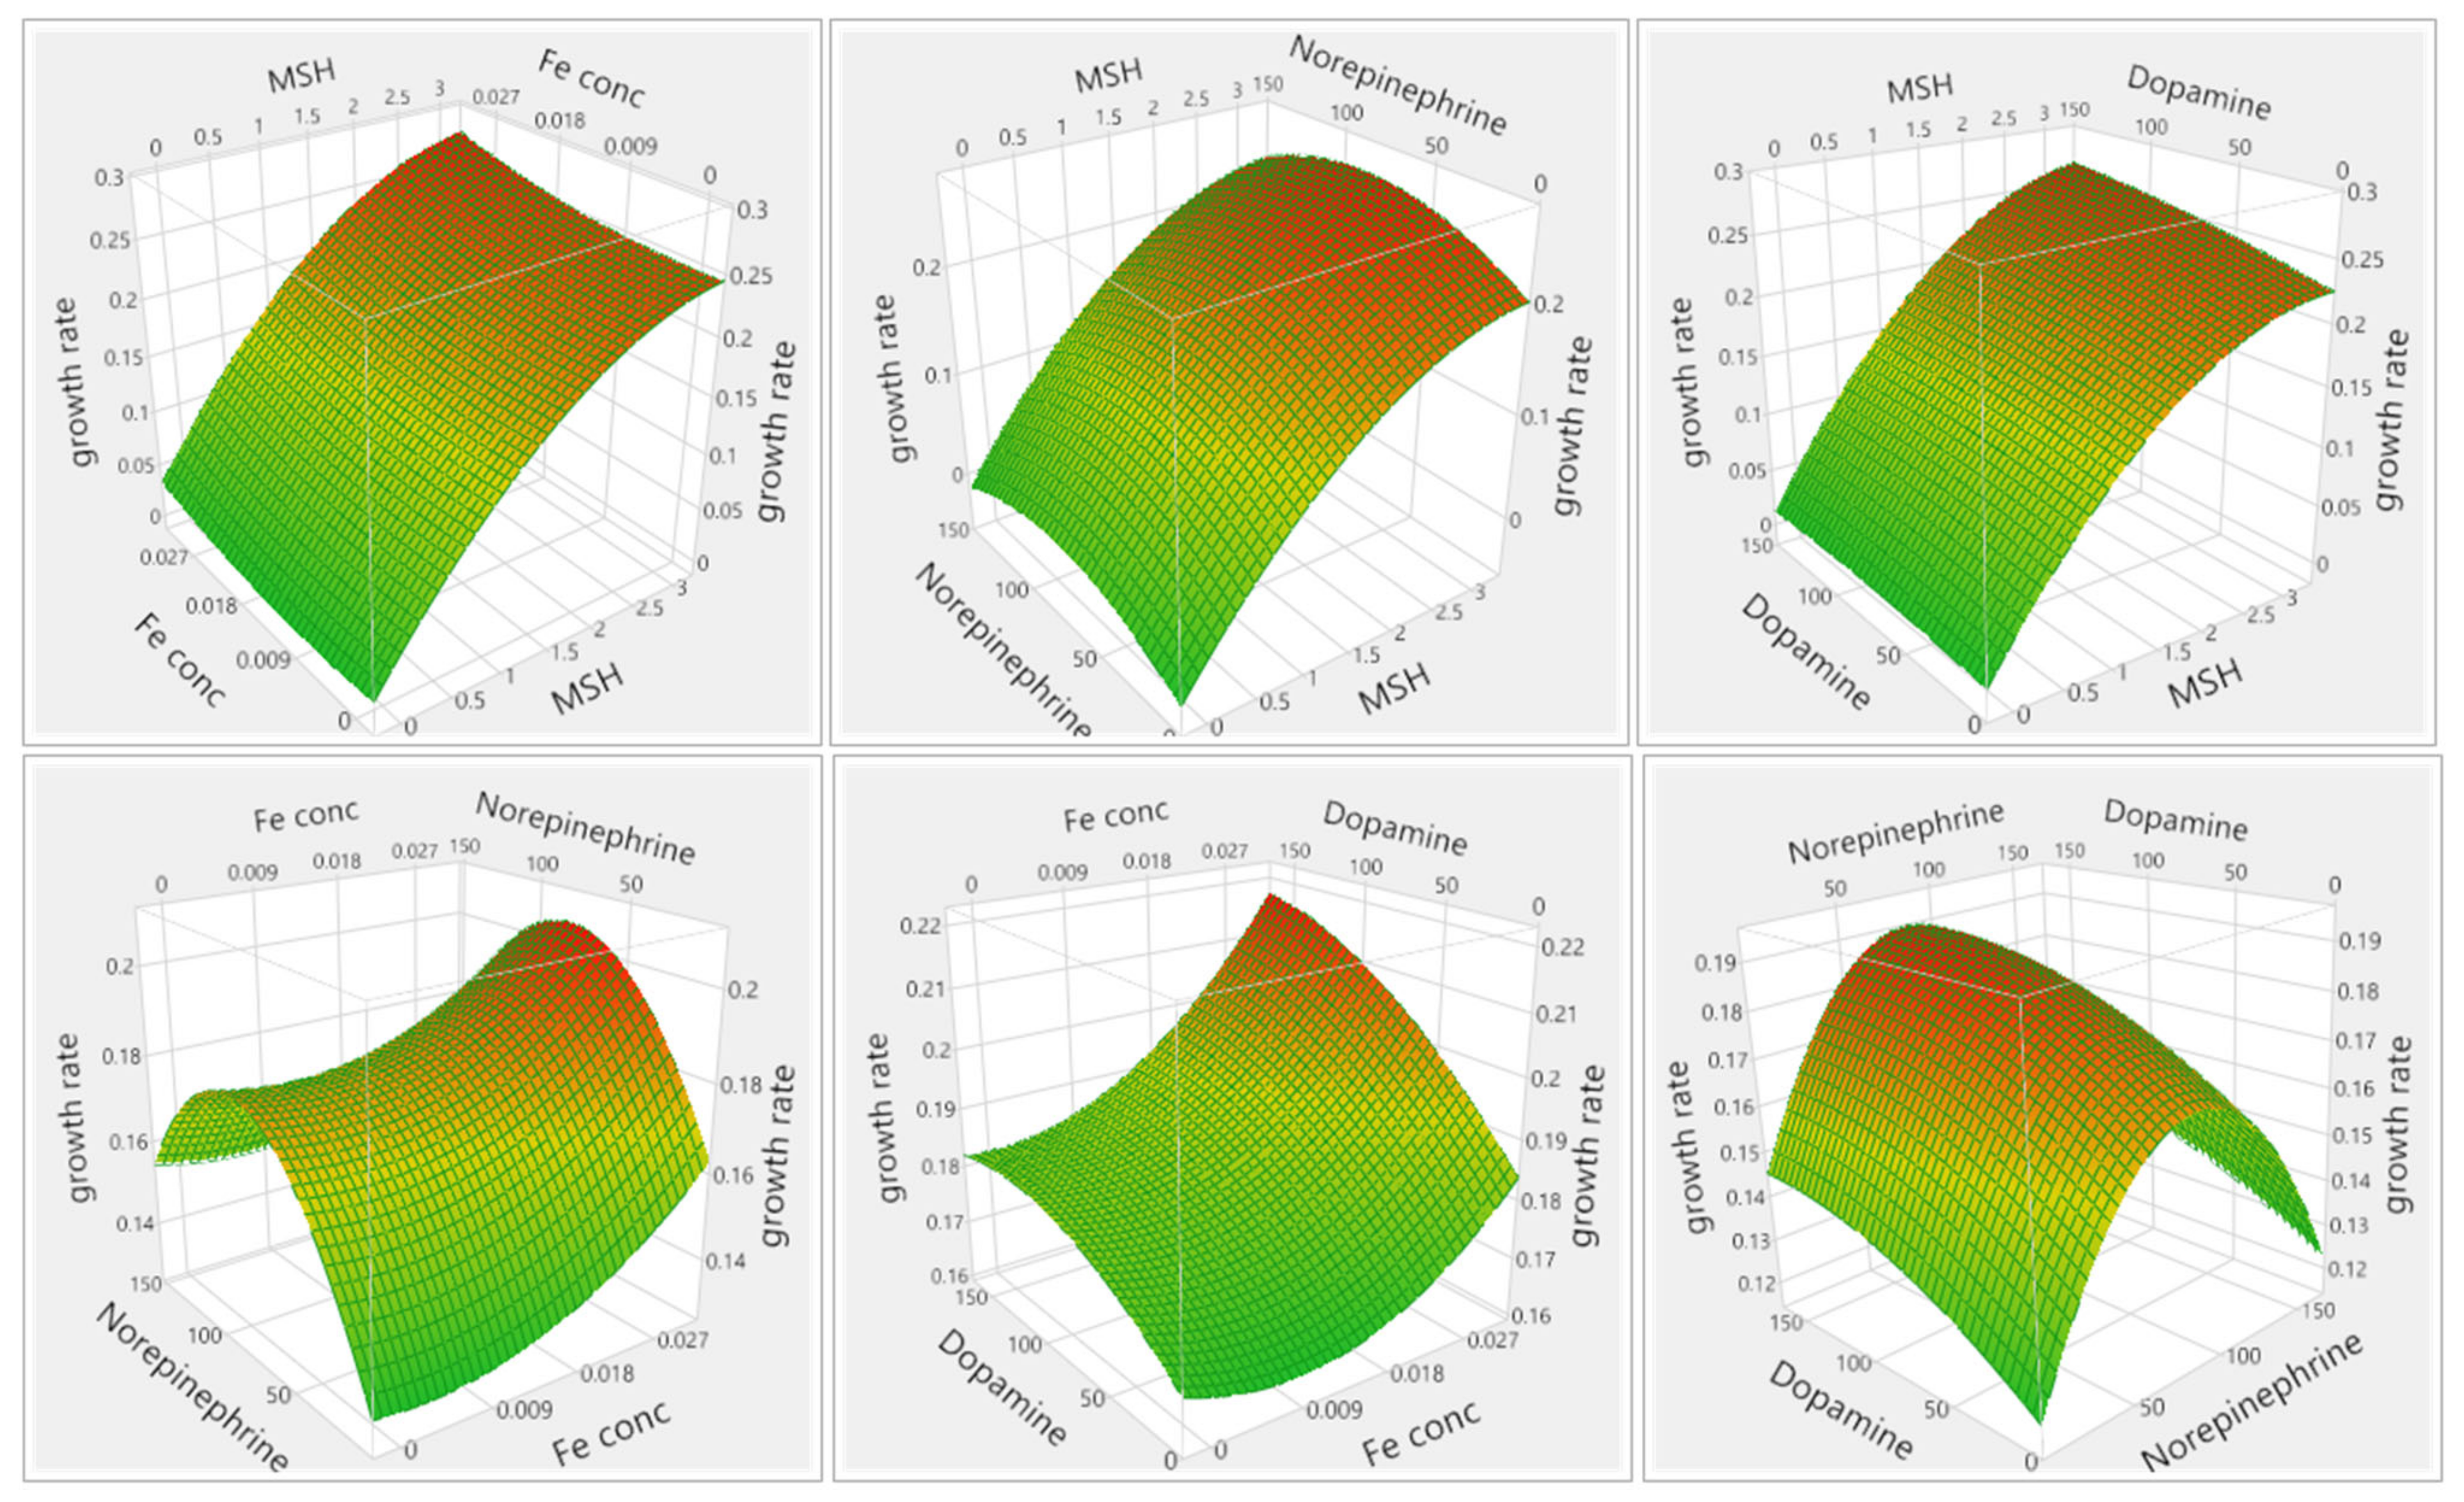
The effects of the four factors on the growth rates on each carbohydrate type are presented as response surface plots: glucose (Figure 3), glycerol (Figure 4), SHH (Figure 5), and MSH (Figure 6). For all four carbohydrate types, the carbohydrate concentration had a significant effect (p < 0.05) on the growth rate. In Figure 3, Figure 4, Figure 5 and Figure 6, the interaction plots involving carbohydrate concentration with other factors such as NE, DP, and Fe, show the same trend of a linear increase in the growth rate as carbohydrate concentration increased from 0 to 3% (w/v). The growth rates observed in this linear range, ranged from 0 to 0.2 for all sugar types; however, in the interaction plots not involving the sugar concentration, saddled curves were observed with the variance in growth rate being limited to the 0.15–0.2 log numbers in the OD h−1 range. This indicates that the growth rates did not increase in media combinations with a low sugar concentration and high bioenhancer (150 µM for NE and DP) and high Fe (0.03% w/v) concentrations. However, in all the response surface interaction plots, even at middle concentrations for carbohydrate for all sugar types (1.5–3% w/v), the growth rates increased linearly, regardless of the NE, DP, and Fe concentrations. The interaction effect between carbohydrate concentration and norepinephrine concentration and the singular effect of norepinephrine concentrations were the only two significant effects observed in the glucose sugar type. In all other sugar types in Figure 4, Figure 5 and Figure 6, none of the interaction effects between factors nor the singular effects were significant, and no maxima on any of the factors were achieved for the predicted model; hence, a saddle point prediction was seen.
Rhamnolipid synthesis is QS (quorum-sensing) regulated [15]. These systems are driven by regulatory pathways to build the backbone and chemical components of rhamnolipids. In human bodies, these QS systems are also associated with the opportunistic pathogenicity of Pseudomonas aeruginosa in iron- and oxygen-deprived conditions by sensing human neuro-endocrine hormones such as dopamine and norepinephrine, which are stress-triggered molecules [15]. Our study utilized this understanding to design a rhamnolipid-generating growth media for Pseudomonas aeruginosa; however, the expected significant improvements in the growth rates were not observed. The lack of an increase in bacterial growth rate in our study, compared to non-growth enhancer media controls for all media combinations except glucose sugar type, can be attributed to the lack of human transferrin protein in the growth media. The presence of the human transferrin protein has been identified as critical to the generation of NEGF, an intermediary molecule for the auto-induction of the quorum-sensing-directed bulk growth of the Pseudomonas strain, as described in the above-mentioned studies by Lyte et al. 1992 and Li et al. 2009 [16,17]. The critical difference in the media formulation in our study compared to that in previous studies was the exclusion of human transferrin protein, which seems to have played a critical role in supplying iron in the media, which is then coupled with the generation of norepinephrine-induced growth factor, leading to quorum-sensing-driven higher growth rates. This lack of enhanced bioenhancer effect (NE and DP) is also consistent with our results in which varying the Fe concentration in the media did not have any effect on the growth rate, due to lack of the iron-transferring activity of the transferrin protein.

3.2.2. Analysis of Verification of Optimized Conditions in 100 mL Shake-Flask Study for Growth Performance and Rhamnolipid Titers

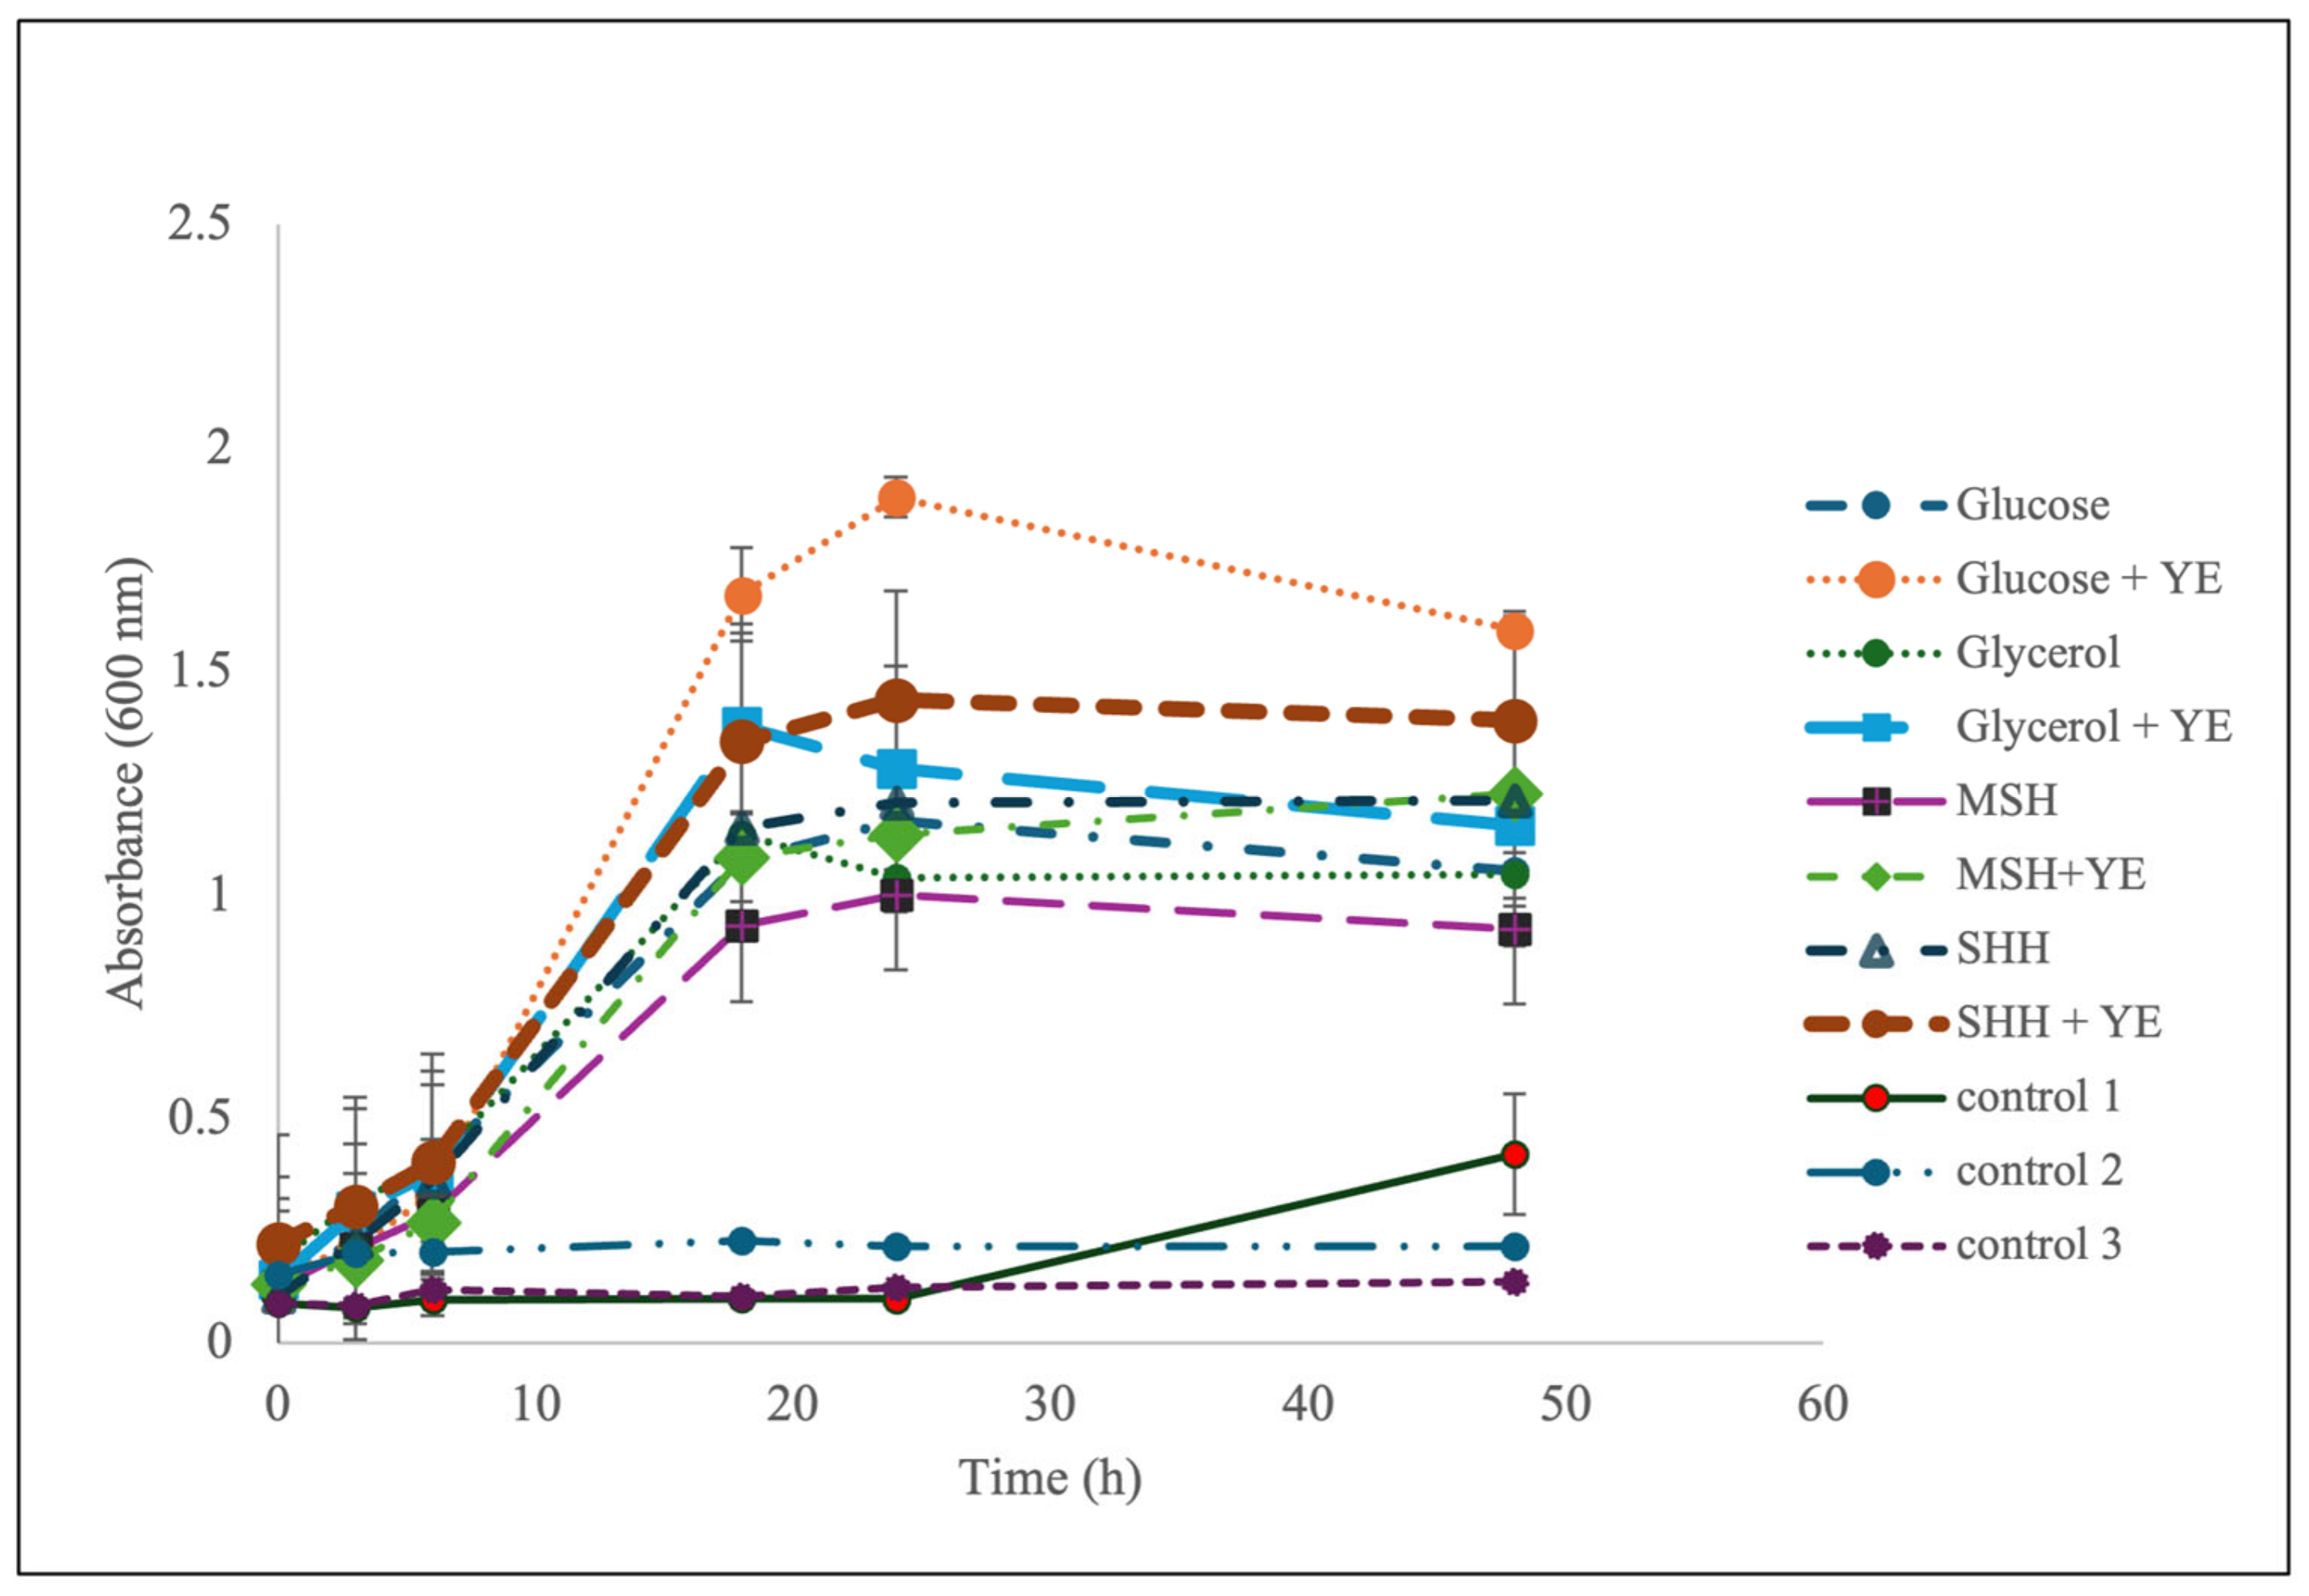
As shown in Figure 7, the highest ODs were observed for the glucose- and glycerol-based media, with higher ODs when yeast with extract was added to the media. In a pairwise comparison of the peak OD values, no significant differences (p > 0.05) were observed among the mean OD values of any of the sugar blocks except for the obvious significant differences between the sugar blocks and the “no sugar” controls.
This could be attributed to higher total protein availability in the media for the strain to grow; however, no significant slope deflections were observed during the log phase of all the cultures, as observed by Li et al. 2009, where norepinephrine-treated media combinations for Pseudomonas aeruginosa were on glycerol-based minimal media [16]. Figure 7 also shows that there was no significant difference (p > 0.05) between the peak OD values of the SHH and MSH combinations, with or without the addition of yeast extract, although the glucose-based media and the glycerol-based media had higher peak OD values with the yeast extract addition in the Bioscreen studies. The media utilized for rhamnolipid production in this study were optimized for minimal salt and protein requirements as the addition of a human transferrin protein to this media would not only make the process cost-ineffective due to the extremely high price of purified human transferrin protein, but it will also raise regulatory concerns when the process is scaled up to industrial production.
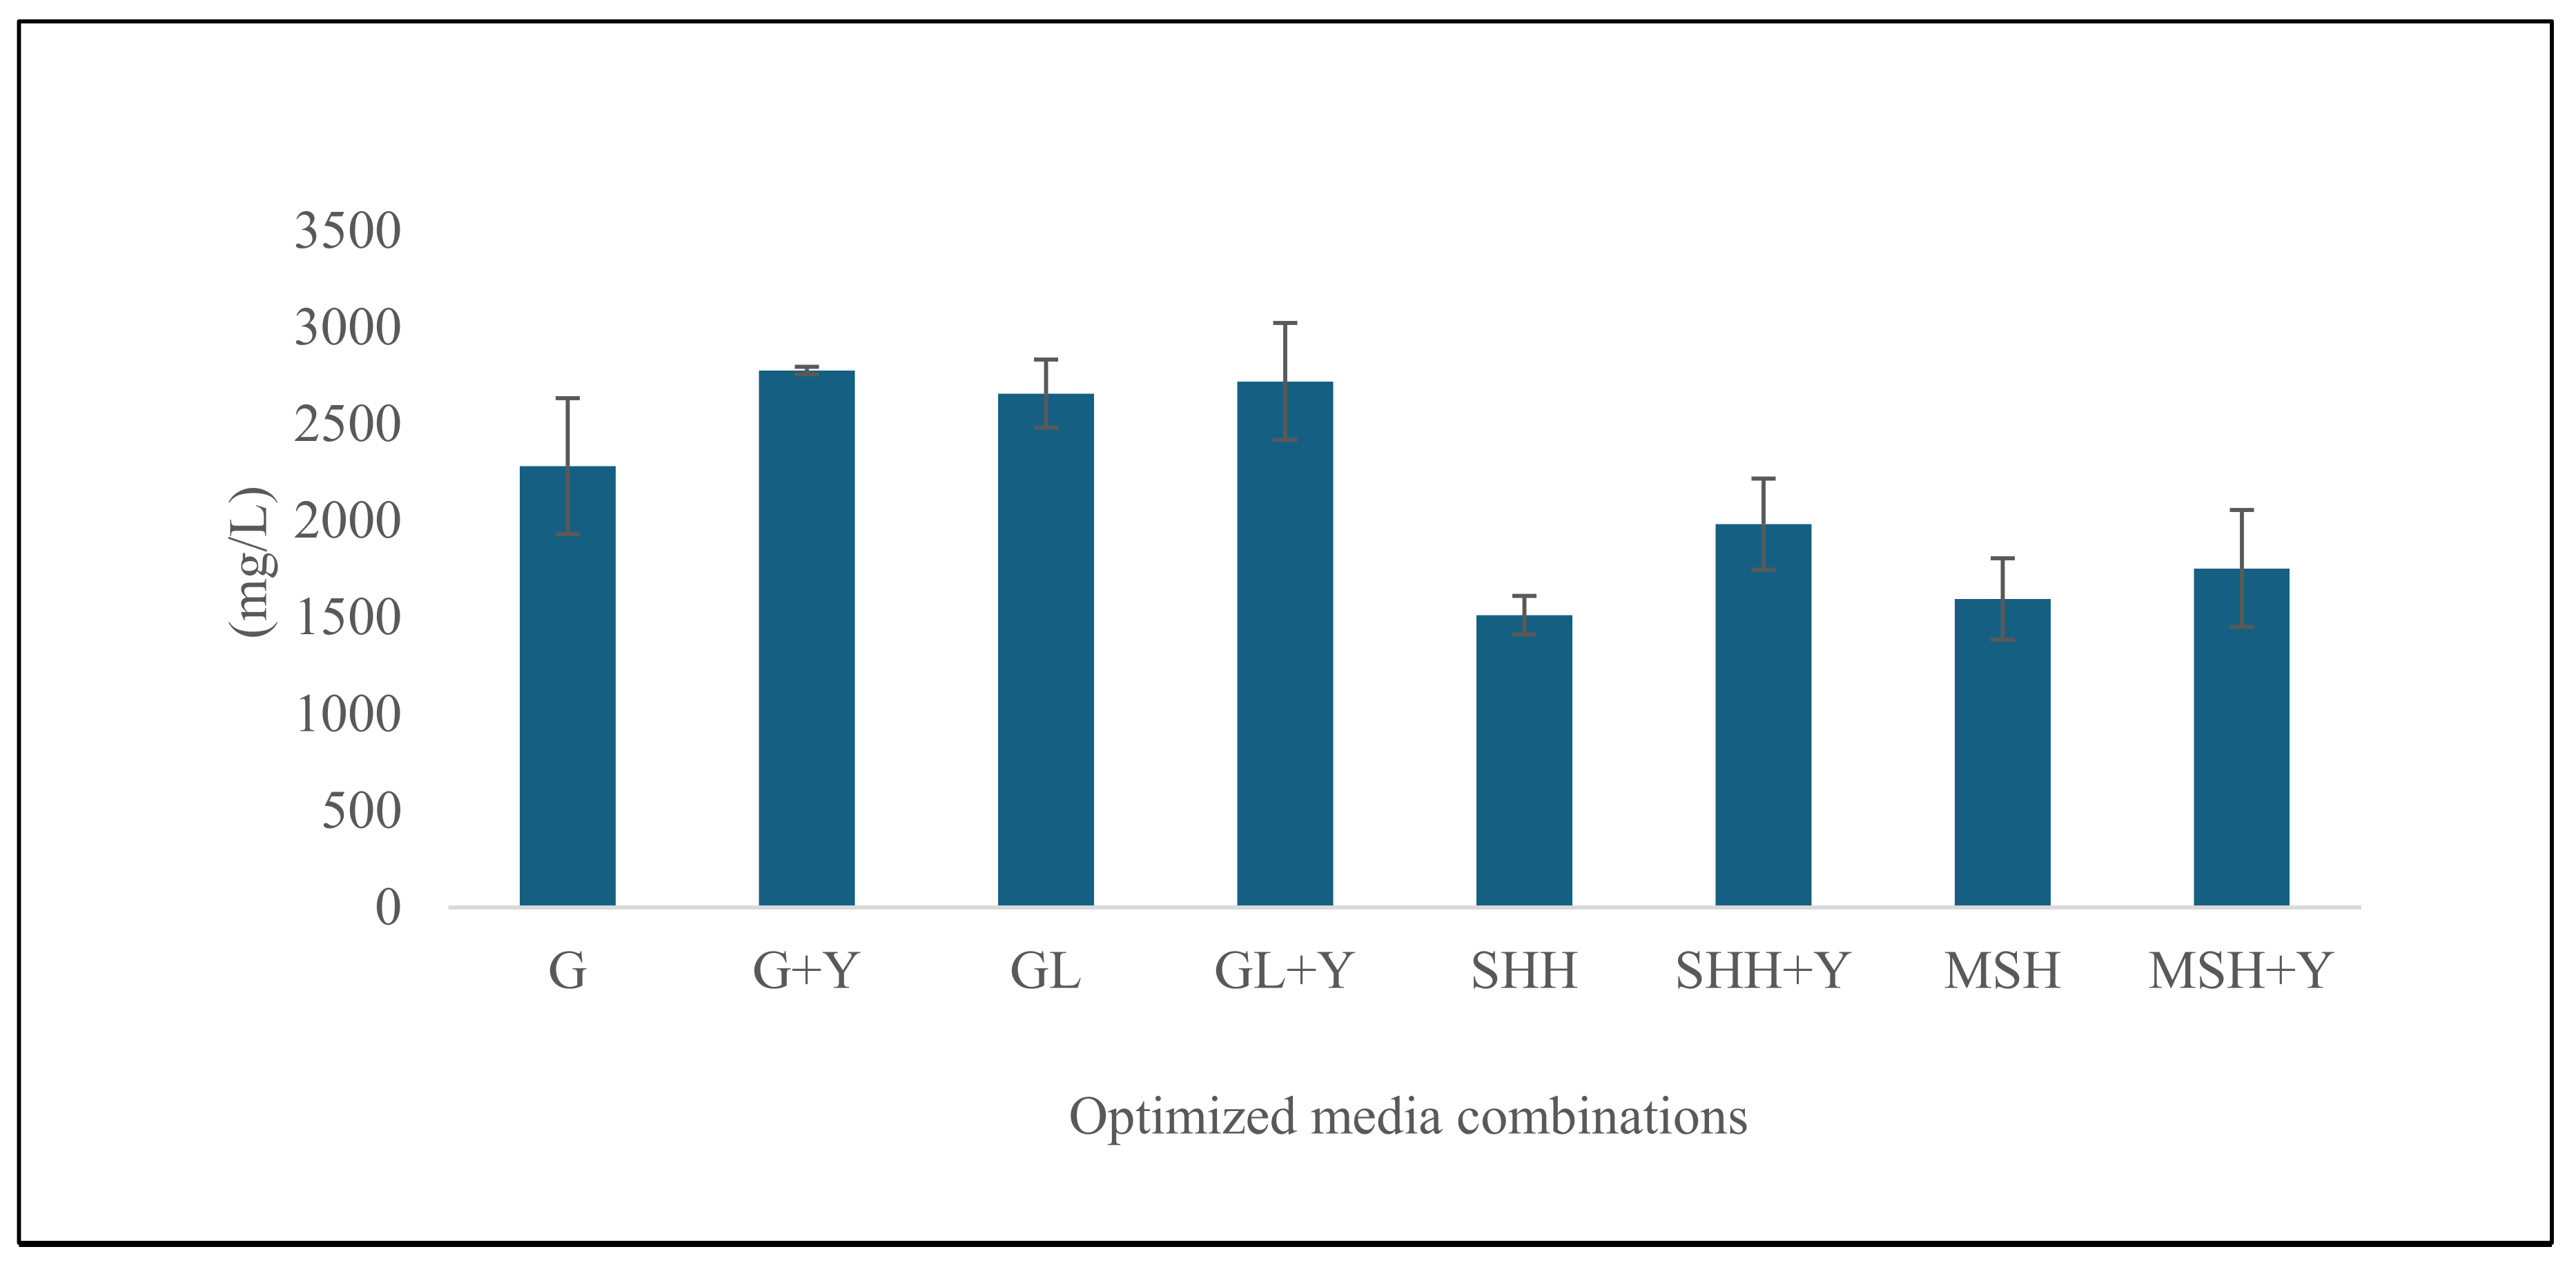
Figure 8 compares the rhamnolipid titers for each optimized media combination at the 100 mL volumes. The media combinations G + Y, GL + Y, and GL produced significantly higher rhamnolipid titers (2.78 g/L, 2.65 g/L, and 2.72 g/L, respectively) compared to other media combinations; however, the difference among these three combinations was statistically insignificant. This can be seen in the results from a significant pairwise comparison of the mean titers from each carbohydrate block: All of the following comparisons were statistically significant (p < 0.05): G vs. SH, G + Y vs. SHH, G vs SHH + Y, G + Y vs SHH + Y, G + Y vs. MSH + Y, GL vs. SHH, GL vs SHH + Y, GL + Y vs SHH + Y, GL vs. MSH + Y, GL + Y vs. SHH, and GL + Y vs. MSH + Y.
Glucose and glycerol as carbohydrate sources in rhamnolipid production have been extensively shown to produce rhamnolipids in titers ranging from 2 to 4.5 g/L [22,23,24], which are similar to the titers obtained in this study.
Soy hull hydrolysates, which have previously been shown to generate microbially produced biosurfactants, were less efficient in generating rhamnolipids as compared to pure glucose- and glycerol-based media (1.5–1.9 g/L). The novel indication of this study was the production of rhamnolipids on soy hull hydrolysates and their mimicking sugar control-based media, which could improve the techno-economic efficiency and environment feasibility of rhamnolipid production [13,14]. Well-defined metabolic pathways could explain these results by Pseudomonas aeruginosa’s pattern of glucose utilization for growth and production of the rhamnose sugar moieties that are eventually synthesized to mono- and di-rhamnolipids. The relatively inferior titer performances on SHH and MSH sugars compared to those on glucose and glycerol could be attributed to the defined metabolic path for the production of glucose-6 phosphate in the breakdown of glucose by Pseudomonas. This production of glucose-6-phosphate leads to the activation of rhlAB and rhlC operons, which is critical for producing rhamnose rings. This synthesis may not have been as effective in soy hull hydrolysate and MSH media, which, despite containing a similar percentage of xylose, galactose, and arabinose, might not have been utilized efficiently by Pseudomonas for activating genes for rhamnolipid synthesis [13,14].

4. Conclusions

Through this study, we have been able to show that rhamnolipids were successfully produced on crude biomass sugar hydrolysates, although at lower titer levels compared with pure carbohydrate sources. This highlights the practical and industrial significance of this study, as cheap and renewable biomass can be utilized successfully to produce extremely surface active rhamnolipids, which have been proven to be excellent alternatives to petro-based industrial surfactants, which are non-biodegradable and potentially toxic to the environment.
The utilization of human neuroendocrine hormones as growth enhancers for rhamnolipid production by Pseudomonas aeruginosa is a novel idea; however, the addition of expensive and controlled human serum proteins such as transferrin is critical to induce NEGF for enhanced bacterial growth. The addition of cheaper yeast extract did not induce the same iron-transferring effect, which shows the need to find a functionally similar alternative to human transferrin protein.

Author Contributions

Conceptualization, R.S.; Methodology, R.S.; Formal analysis, R.S.; Investigation, R.S.; Resources, B.P.L.; Writing—original draft, R.S.; Writing—review & editing, B.P.L.; Supervision, B.P.L.; Project administration, B.P.L.; Funding acquisition, B.P.L. All authors have read and agreed to the published version of the manuscript.

Funding

While this research received no external funding, it is a product of the Iowa Agriculture and Home Economics Experiment Station, Ames, Iowa, Project No. IOW05447 and was partially sponsored by Hatch Act and State of Iowa funds.

Institutional Review Board Statement

Not applicable.

Informed Consent Statement

Not applicable.

Data Availability Statement

The original contributions presented in this study are included in the article. Further inquiries can be directed to the corresponding author.

Acknowledgments

The authors would like to acknowledge the contribution of Larry Halverson, for providing the Pseudomonas aeruginosa PAO1 strain and providing laboratory access for 100 mL shake-flask experiments, and Aubrey Mendonca, for providing Bioscreen C access for high-throughput study.

Conflicts of Interest

The authors declare no conflict of interest.

References

  1. Allied Market Research. Available online: https://www.alliedmarketresearch.com/surfactant-market (accessed on 2 December 2023).
  2. Jimoh, A.A. Biosurfactant: A new frontier for greener technology and environmental sustainability. Ecotox Environ. Safe 2019, 184, 109607. [Google Scholar] [CrossRef] [PubMed]
  3. Markande, A.R.; Patel, D.; Varjani, S. A review on biosurfactants: Properties, applications, and current developments. Bioresource Technol. 2021, 330, 124963. [Google Scholar] [CrossRef] [PubMed]
  4. Paulino, B.N.; Pessoa, M.G.; Mano, M.C.R.; Molina, G.; Neri-Numa, I.A.; Pastore, G.M. Current status in biotechnological production and applications of glycolipid biosurfactants. Appl. Microbiol. Biotechnol. 2016, 100, 10265–10293. [Google Scholar] [CrossRef]
  5. Abdel-Mawgoud, A.M.; Lépine, F.; Déziel, E. Rhamnolipids: Diversity of structures, microbial origins and roles. Appl. Microbiol. and Biotechnol. 2010, 86, 1323–1336. [Google Scholar] [CrossRef]
  6. Cortés-Sánchez, A.J.; Hernández-Sánchez, H.; Jaramillo-Flores, M.E. Biological activity of glycolipids produced by microorganisms: New trends and possible therapeutic alternatives. Microbiol. Res. 2013, 168, 22–32. [Google Scholar] [CrossRef]
  7. Maier, R.M.; Soberón-Chávez, G. Pseudomonas aeruginosa rhamnolipids: Biosynthesis and potential applications. Appl. Microbiol. Biotechnol. 2000, 54, 625–633. [Google Scholar] [CrossRef]
  8. Fu, H.; Chai, T.; Huang, G.; Gao, P.; Liu, Z. Effects of rhamnolipid on the adsorption of Pb2+ onto compost humic acid. Desalin. Water Treat. 2015, 54, 3177–3183. [Google Scholar] [CrossRef]
  9. DeSanto, K. Rhamnolipid-Based Formulations. U.S. Patent 8,183,198 B2, 22 May 2012. [Google Scholar]
  10. Lourith, N.; Kanlayavattanakul, M. Natural surfactants used in cosmetics: Glycolipids. Int. J. Cosmet. 2009, 31, 255–261. [Google Scholar] [CrossRef]
  11. Henkel, M.; Muller, M.M.; Kugler, J.H.; Lovaglio, R.B.; Contiero, J.; Syldatk, C.; Hausman, R. Rhamnolipids as biosurfactants from renewable resources: Concepts for next-generation rhamnolipid production. Process Biochem. 2012, 47, 1207–1219. [Google Scholar] [CrossRef]
  12. Banat, I.M.; Satpute, S.K.; Cameotra, S.S.; Patil, R.; Nyayanit, N.V. Cost-effective technologies and renewable substrates for biosurfactants’ production. Front. Microbiol. 2012, 5, 697. [Google Scholar]
  13. Sharma, R.; Lamsal, B.P.; Colonna, W.J. Pretreatment of fibrous biomass and growth of biosurfactant-producing Bacillus subtilis on biomass-derived fermentable sugars. Bioproc. Biosyst. Eng. 2016, 15, 1494–1504. [Google Scholar] [CrossRef] [PubMed]
  14. Sharma, R.; Lamsal, B.P.; Mba-Wright, M. Performance of Bacillus subtilis on fibrous biomass sugar hydrolysates in producing biosurfactants and techno-economic comparison. Bioproc. Biosyst. Eng. 2018, 41, 1817–1826. [Google Scholar] [CrossRef] [PubMed]
  15. Hegde, M.; Wood, T.K.; Jayaraman, A. The neuroendocrine hormone norepinephrine increases Pseudomonas aeruginosa PA14 virulence through the las quorum-sensing pathway. Appl. Microbiol. Biotechnol. 2009, 84, 763–776. [Google Scholar] [CrossRef] [PubMed]
  16. Li, W.; Lyte, M.; Freestone, P.P.; Ajmal, A.; Colmer-Hamood, J.A.; Hamood, A.N. Norepinephrine represses the expression of toxA and the siderophore genes in Pseudomonas aeruginosa. FEMS Microbiol. Lett. 2009, 299, 100–109. [Google Scholar] [CrossRef] [PubMed]
  17. Lyte, M.; Ernst, S. Catecholamine induced growth of gram-negative bacteria. Life Sci. 1992, 50, 203–212. [Google Scholar] [CrossRef]
  18. Gunther, N.W.; Nunez, A.; Fett, W.; Solaiman, D.K. Production of rhamnolipids by Pseudomonas chlororaphis, a nonpathogenic bacterium. Appl. Environ. Microbiol. 2016, 71, 2288–2293. [Google Scholar] [CrossRef]
  19. Zhao, F.; Liang, X.; Ban, Y.; Han, S.; Zhang, J.; Zhang, Y.; Ma, F. Comparison of Methods to Quantify Rhamnolipid and Optimization of Oil Spreading Method. Tenside Surfact. Det. 2016, 53, 243–248. [Google Scholar] [CrossRef]
  20. Kim, S.K.; Lee, J.H. Biofilm dispersion in Pseudomonas aeruginosa. J. Microbiol. 2016, 54, 71–85. [Google Scholar] [CrossRef]
  21. Dasgupta, S.; Yang, C.; Castro, L.M.; Tashima, A.K.; Ferro, E.S.; Moir, R.; Willis, I.M.; Fricker, L.D. Analysis of the Yeast Peptidome and Comparison with the Human Peptidome. PLoS ONE 2016, 11, e163312. [Google Scholar] [CrossRef]
  22. Santa-Anna, L.; Sebastian, G.; Menezes, E.; Alves, T.; Santos, A.; Pereira, N., Jr.; Freire, D.M.G. Production of biosurfactants from Pseudomonas aeruginosa PA1 isolated in oil environments. Braz. J. Chem. Eng. 2002, 19, 159–166. [Google Scholar] [CrossRef]
  23. Chen, S.Y.; Lu, W.B.; Wie, Y.H.; Chen, W.M.; Chang, J.S. Improved production of biosurfactant with newly isolated Pseudomonas aeruginosa S2. Biotechnol. Prog. 2007, 23, 661–666. [Google Scholar] [CrossRef] [PubMed]
  24. Syldatk, C.; Lang, S.; Wagner, F.; Wray, V.; Witte, L. Chemical and physical characterization of four interfacial-active rhamnolipids from Pseudomonas spec. DSM 2874 grown on n-alkanes. Z. Naturforsch. 1985, 40, 51–60. [Google Scholar] [CrossRef] [PubMed]
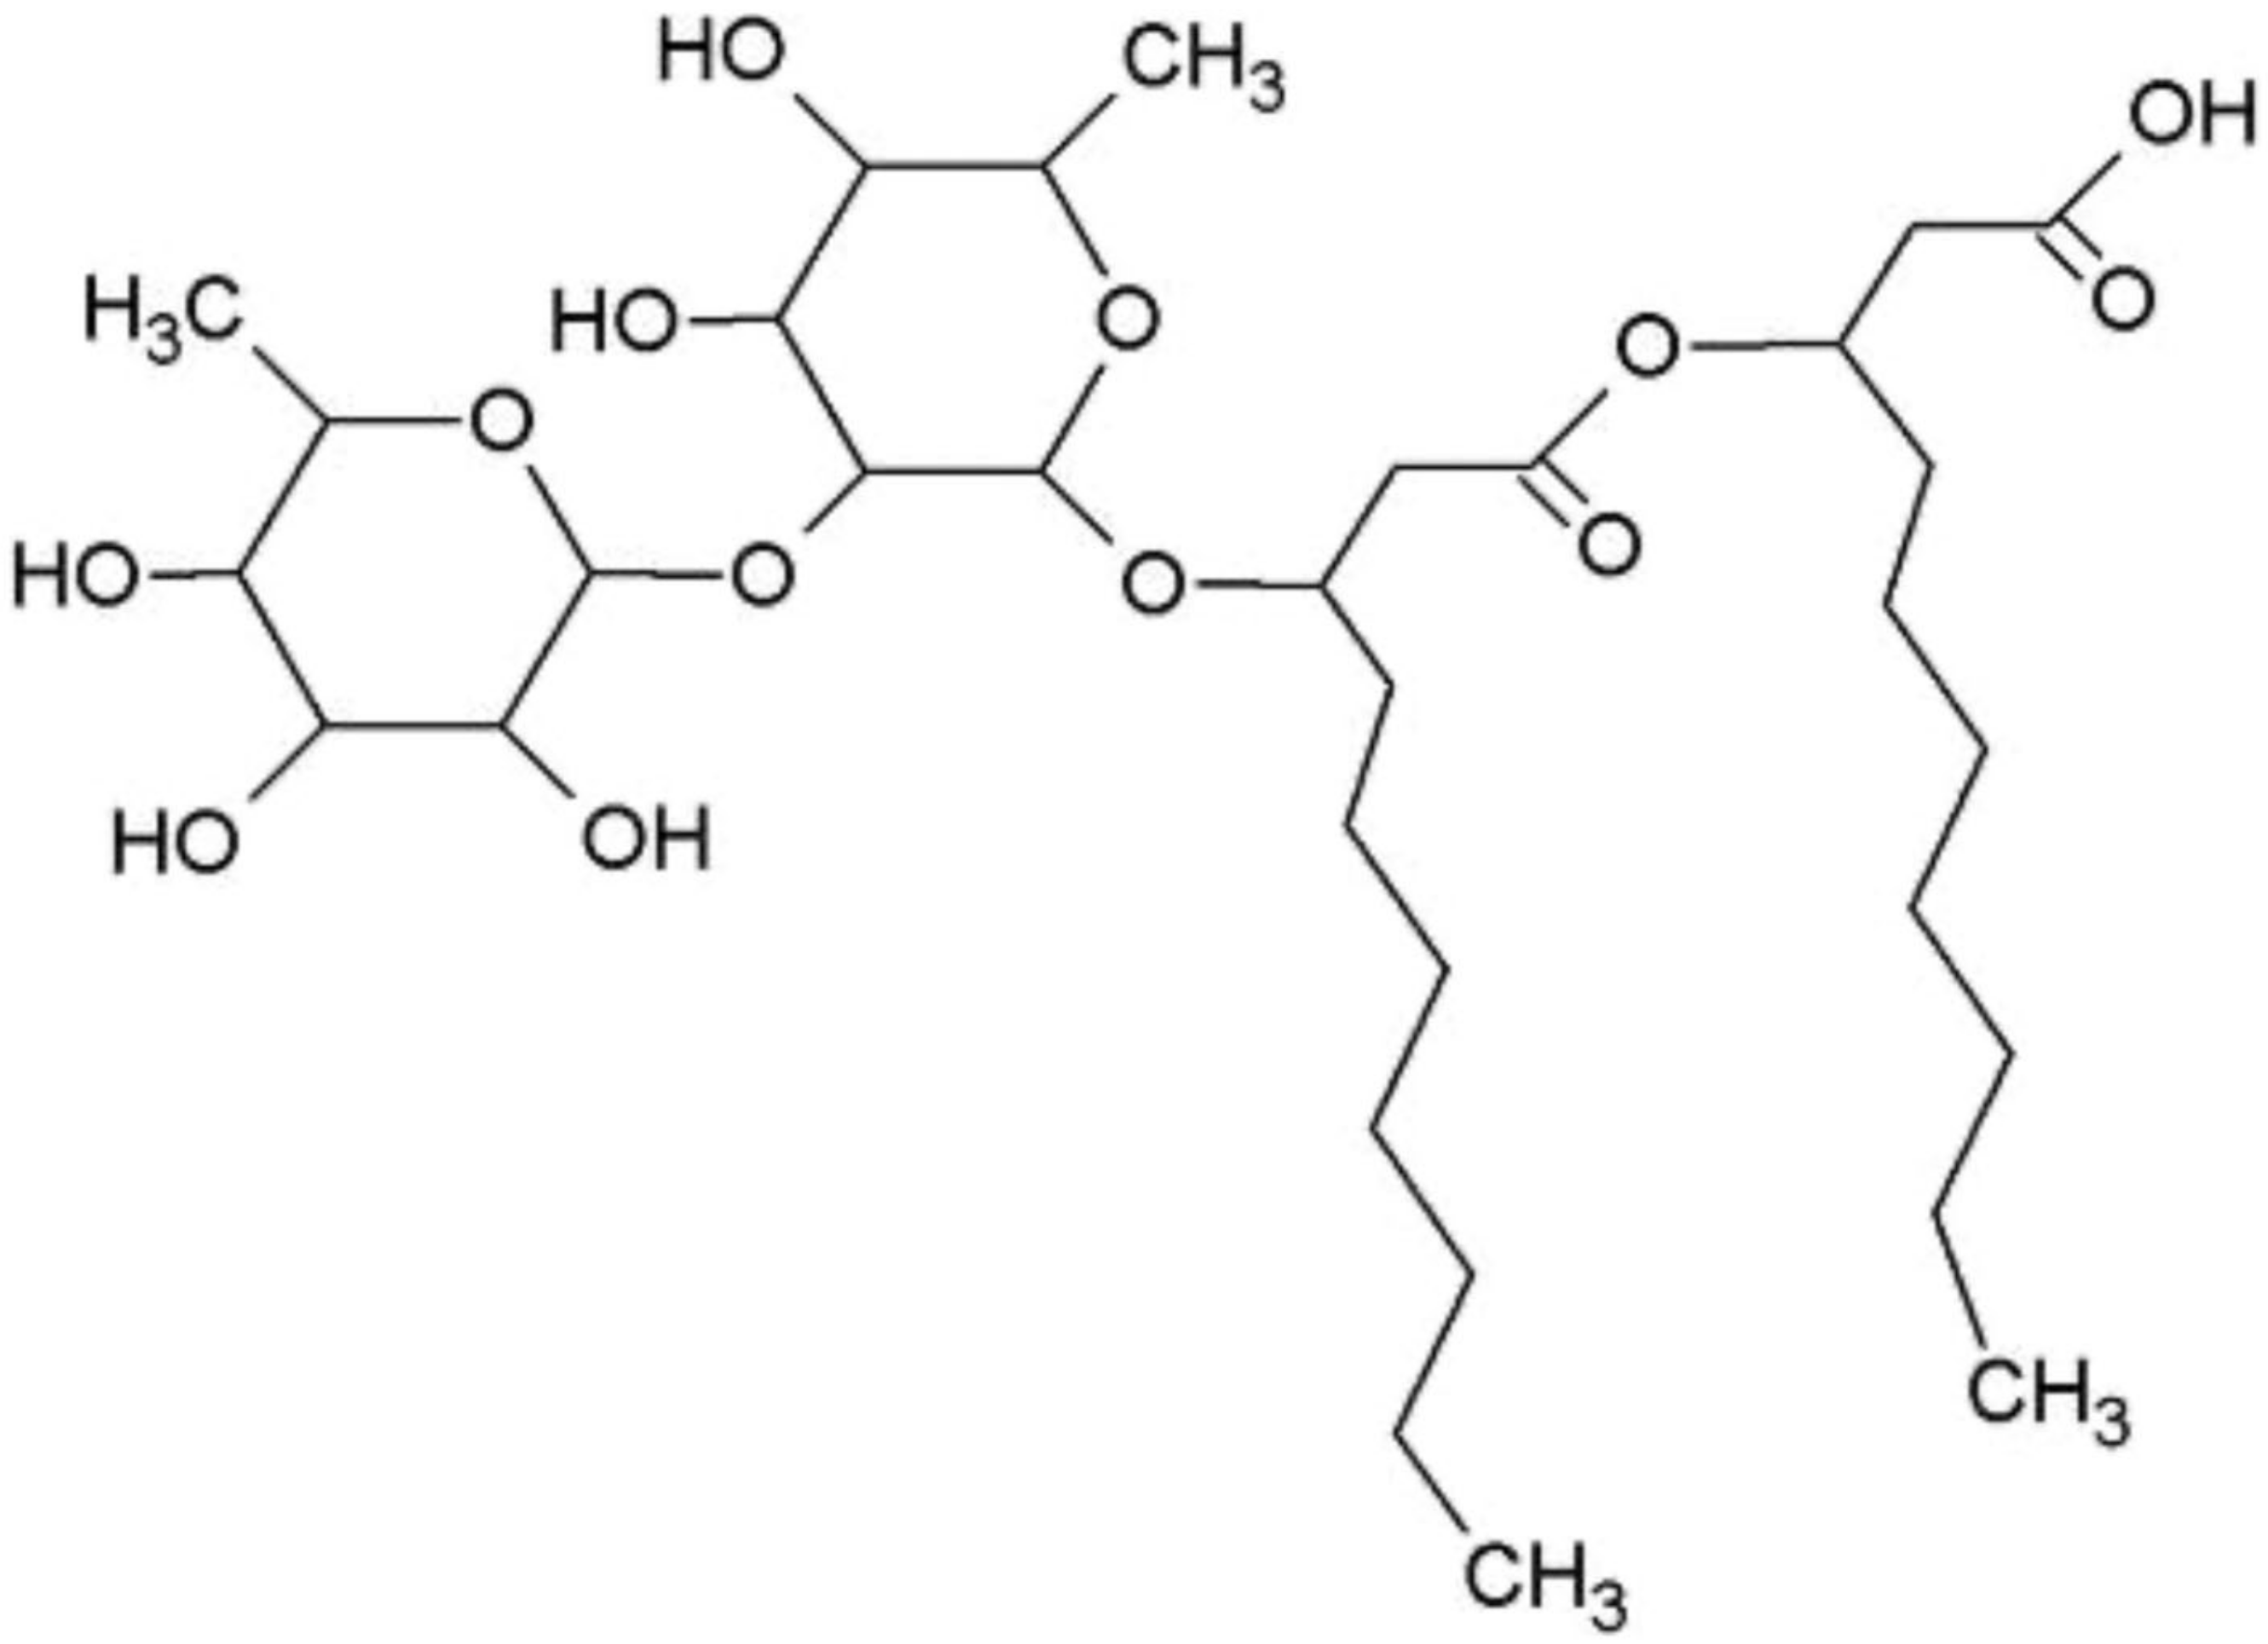
Figure 1. The structure of di-rhamnolipid with two rhamnose units attached to a fatty acid chain, constituting the surfactant molecule’s complete structure [6].
Applsci 15 02531 g001
Figure 2. Scatter plots for microbial growth rates (log numbers in OD h−1) on four carbohydrate media at 2.5% carbohydrate concentration: (a) glucose, (b) glycerol, (c) SHH, and (d) MSH. The plots show a scatter showing the range of the actual and predicted (Equation (1)) growth rates achieved for each media combination.
Applsci 15 02531 g002aApplsci 15 02531 g002b
Figure 3. Response surface plots showing the effects of varying carbohydrate, Fe, norepinephrine, and dopamine concentrations on growth rates in glucose-based media. Color legend: The green-to-orange color differential denotes increasing magnitude. Axes: glucose (0–3%), Fe concentration (0–0.05%), norepinephrine (0–150 µM), dopamine (0–150 µM).
Applsci 15 02531 g003
Figure 4. Response surface plots showing the effects of varying carbohydrate, Fe, norepinephrine, and dopamine concentrations on growth rates in glycerol-based media. Color legend: The green-to-orange color differential denotes increasing magnitude. Axes: glycerol (0–3%), Fe concentration (0–0.05%), norepinephrine (0–150 µM), dopamine (0–150 µM).
Applsci 15 02531 g004
Figure 5. Response surface plots showing the effects of varying carbohydrate, Fe, norepinephrine, and dopamine concentrations on growth rates in SHH-based media. Color legend: The green-to-orange color differential denotes increasing magnitude. Axes: SHH (0–3%), Fe concentration (0–0.05%), norepinephrine (0–150 µM), dopamine (0–150 µM).
Applsci 15 02531 g005
Figure 6. Response surface plots showing the effects of varying carbohydrate, Fe, norepinephrine, and dopamine concentrations on growth rates in MSH-based media. Color legend: The green-to-orange color differential denotes increasing magnitude. Axes: MSH (0–3%), Fe concentration (0–0.05%), norepinephrine (0–150 µM), dopamine (0–150 µM).
Applsci 15 02531 g006
Figure 7. Growth (optical density at 600 nm) performance of P. aeruginosa PAO1 on optimized media combinations in 100 mL shake-flask cultures for 48 h (composition of controls: 0% sugar, 160 µM Nor, 66 µM Dop, 0.03% Fe (n = 2 replicates each)). Experimental carbohydrate blocks: glucose (G), glucose + YE (G + YE), glycerol (GL), glycerol + YE (GL + YE), MSH, MSH + YE, SHH, SHH + YE.
Applsci 15 02531 g007
Figure 8. Forty-eight-hour rhamnolipid concentrations in 100 mL shake-flask cultures of each optimized medium at 2.5% total carbohydrate concentration (G = glucose, G + Y = glucose and yeast extract, GL = glycerol, GL + Y = glycerol and yeast extract, SHH = soy hull hydrolysate, SHH + Y = soy hull hydrolysate and yeast extract, MSH = mimic soy hull hydrolysate, MSH + Y = mimic soy hull hydrolysate and yeast extract (n = 2 replicates each)).
Applsci 15 02531 g008
Disclaimer/Publisher’s Note: The statements, opinions and data contained in all publications are solely those of the individual author(s) and contributor(s) and not of MDPI and/or the editor(s). MDPI and/or the editor(s) disclaim responsibility for any injury to people or property resulting from any ideas, methods, instructions or products referred to in the content.