Article

Research on Eco-Product Supply Chain Decision-Making and Coordination Under Different Subsidy Strategies with Ecological Cost-Sharing Contracts

1
School of Environment, Harbin Institute of Technology, Harbin 150090, China
2
China Energy Conservation and Environmental Protection Group (CECEP), Eco-Product Development Research Center Co., Ltd., Beijing 100082, China
*
Author to whom correspondence should be addressed.
Appl. Sci. 2025, 15(5), 2462; https://doi.org/10.3390/app15052462
Submission received: 17 December 2024 / Revised: 28 January 2025 / Accepted: 5 February 2025 / Published: 25 February 2025

Abstract

:
In order to solve the problem of poor market circulation in the process of realizing the value of ecological products, this paper studies a supply chain system composed of a single ecological product supplier, an ecological product distributor, and a consumer. Since government subsidies will greatly affect the operation of the supply chain system, the supply chain decision-making model under three scenarios, of no government subsidies, development and operation subsidies, and consumer subsidies, is constructed with an ecological cost-sharing contract coefficient between suppliers and dealers. Then, the Stackelberg game is used to solve the optimal strategy and maximum profit of all parties in the supply chain under different financial subsidy scenarios in order to form eco-product development suggestions in line with market rules.

1. Introduction

It is an innovative strategy, proposed by the General Office of the CPC Central Committee and the General Office of the State Council (2021), to establish a sustainable mechanism to determine ecological product value, which is led by the government [1], participated in by various circles of society, and operated by the market; this is regarded as the Chinese path to modernization, creating harmony between humans and nature [2]. The purpose of establishing the ecological product value realization (EPVR) mechanism is to explore the balance between ecological protection and economic development by developing and transforming potential ecological products into sustainable economic value by means of government purchase, inter-regional ecological value exchange, ecological premium, etc. [3,4]. Due to the fact that ecological products are considered to be a type of production factor participating in the process of distribution and redistribution, the EPVR mechanism is a complex system involving production, exchange, distribution, and consumption [5] that will be beneficial to the achievement of common prosperity in an eco-friendly way [6,7].
At present, the market EPVR mechanism in China is under development; the fundamental reason for this is the lack of a smooth transformation channel and a sophisticated market mechanism. Specifically, the supply of ecological products is strongly ecosystem-based, making its conservation and development time-consuming, systematic, and complex, which is not sustainable through the government-paid model [8,9,10,11]. Therefore, it is necessary to motivate multiple investors to create conditions for the expanded reproduction and high market liquidity of ecological products [12]. On the demand side, the customer’s awareness of ecological products is attributed to their uniform fair price, incomplete approval standards, and asymmetric information [13,14,15], leading to slack consumption demand. Although the government has played a leading role in actively promoting the EPVR mechanism, the role of market regulation is far from enough, particularly in relation to the insufficient participation by enterprises and all sectors of society, and is derived from the phenomenon of the production of eco-products becoming divorced from marketing, the low-value conversion efficiency, and an inconspicuous scale benefit [16,17]. In view of the naturally formed and complicated supply–demand relationship that consists of many elements and multiple subjects, the eco-product marketization mechanism can be characterized by supply chain theory to bring about a supply–demand equilibrium and market smoothing. Currently, international research related to ecological products mainly includes “ecosystem services” [18], “climate change and carbon emissions” [19], “biodiversity” [20], and “land use” [21,22]. Meanwhile, market-based practices of ecological protection and economic development have been carried out in many countries, such as Costa Rica [23], the United States [24,25], Brazil [26], and Sweden [27,28]. In China, studies also focus on policy targets and the EPVR mechanism [29], as well as eco-compensation [30,31] and the path of ecological product value [32,33,34]. In general, most studies and practices globally focus on the payment for ecosystem services led by governments; self-regulated markets for the products and services produced by the ecosystem have not yet been formed. On the other side of supply chain management, a growing amount of research has been conducted on the green, low-carbon, and sustainable development of the supply chain in relation to the background of humans actively responding to climate change [35,36,37]; however, there are very few cross-field discussions on the common market law coupled with ecological products and supply chain management.
Therefore, this paper generalizes the eco-product supply chain system participated in by governments, markets, and societies on the basis of general merchandise market discipline and value law, taking into account the equal emphasis on the conservation and development of eco-products. Then, three supply chain decision models with different government subsidies are used to explore the influence of supply chain members on decision-making, in order to develop a deep and comprehensive understanding of the market law of the EPVR mechanism, which will be used as a guide to establish a scientific and efficient path for the EPVR mechanism.

2. Materials and Methods

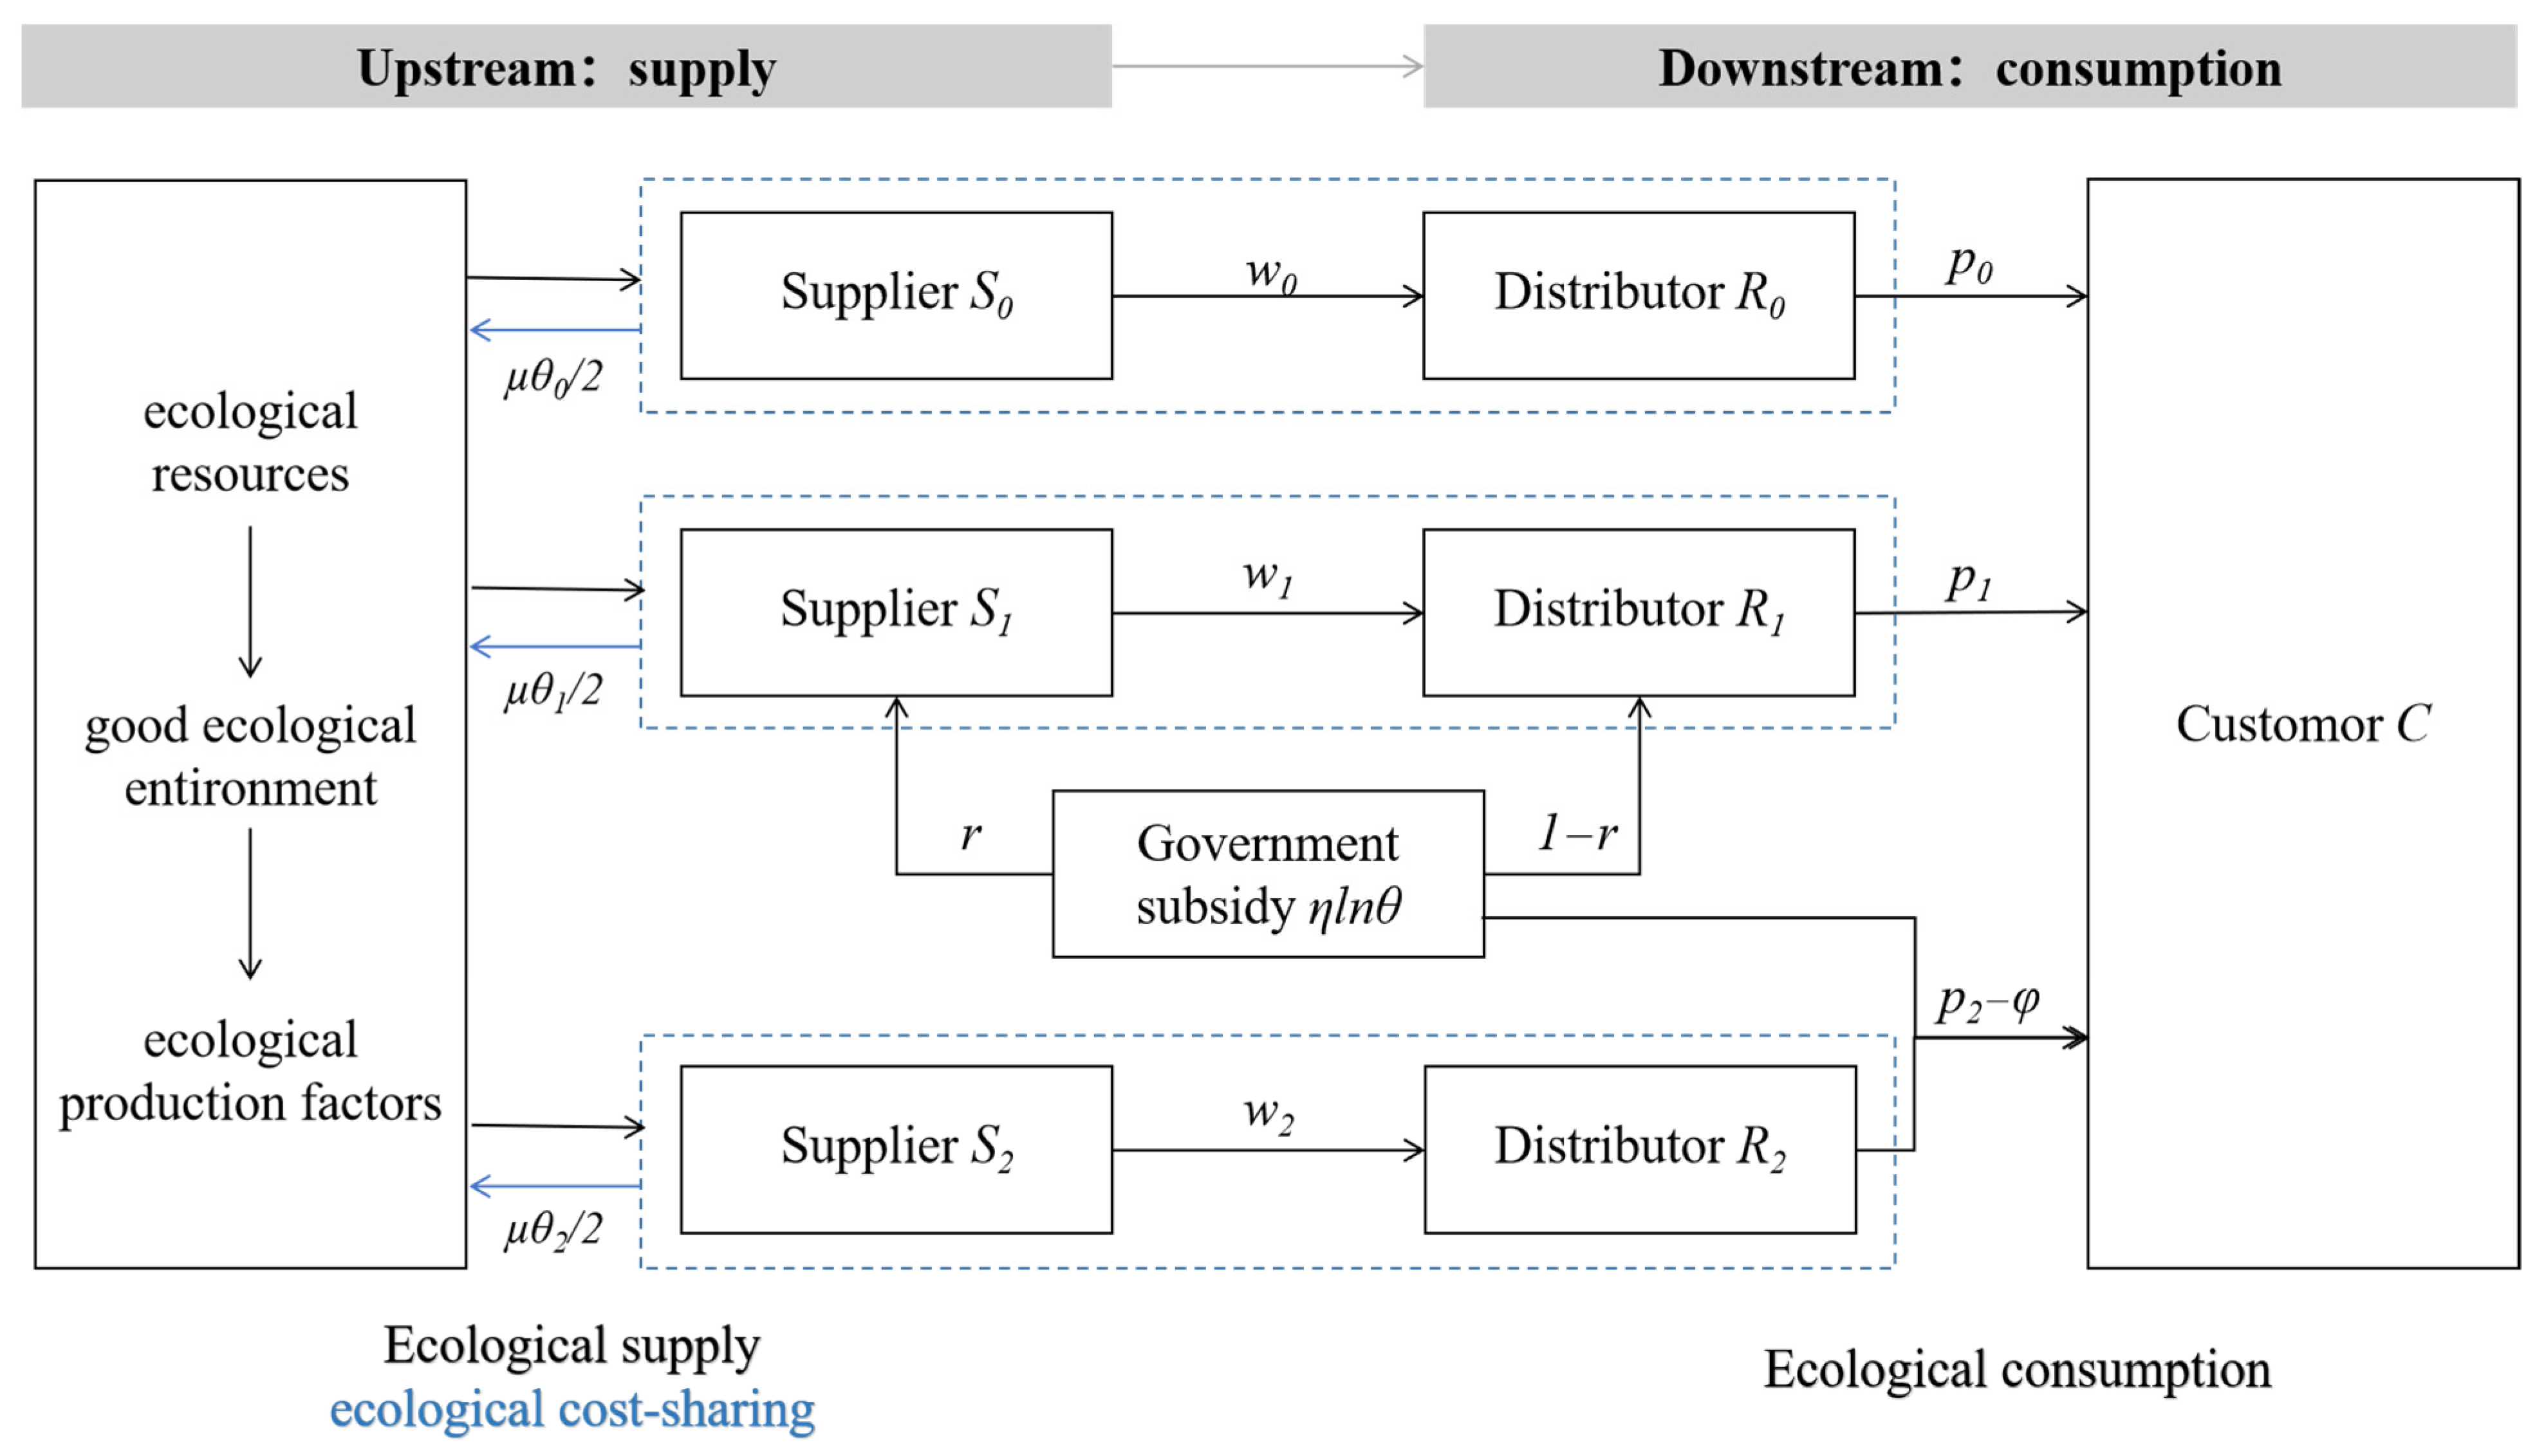
2.1. EPVR Supply Chain System

Eco-product market circulation is generalized into a two-level supply chain structure composed of a single supplier, a distributor, and a consumer, in which the ecological products are produced, processed, and packaged by the supplier, before finally being sold to the customer through the distributor. Figure 1 shows the EPVR supply chain system, taking into account government subsidies and profits returned into ecological protection, and contains three different scenarios in the system, including subsidy-free, operating subsidies, and consumption subsidies, to explore the optimal strategy and maximum profit of all in the supply chain, and to further analyze the influence on the supply chain of decision-making regarding EPVR. In consideration of the importance of policy support, the government provides some funds to incentivize suppliers, distributors, or consumers in the system, in the form of an operating subsidy or a consumption subsidy, as one of the most effective ways to support the eco-product industry in the initial stage of EPVR. In consideration of financial capacity, the operating subsidy and consumption subsidy cannot be implemented simultaneously. Furthermore, the supplier and distributor must reinvest part of their profits to preserve the ecological environment after benefiting from the market, ensuring the ecosystem is healthy enough to supply sustainable products and services to human beings. Therefore, ecological cost-sharing contracts should be established between the supplier and distributor, which ensure agreement on each ratio of the shared cost.

2.2. Model Hypothesis

Hypothesis 1: 
Both the supplier and distributor are rational and make great efforts to sustainably supply eco-products, while their objectives are maximizing profits. πS represents the supplier’s profit, πR represents the distributor’s profit.
Hypothesis 2: 
The market information obtained by the supplier and distributor is completely symmetrical; that is, a game of perfect information.
Hypothesis 3: 
The market demand for ecological products is influenced by price and consumer preferences, which can be calculated as q = abp + kθ. In the formula, a is the potential market size, b is the coefficient of sensitivity of price, k is the consumer preferences for eco-products, and θ is the ecological level of the supply chain reflecting the supply level of eco-products; a, b, k, and θ are all bigger than 0, and a is bigger than 0 bp.
Hypothesis 4: 
According to the beneficiary pays principle, the eco-product supplier and distributor are obliged to contribute back into the ecosystem for more and better eco-products as a “realization–feedback” path. The invested cost of ecological conservation and restoration is determined with reference to the supply chain’s ecological level, and calculated as  μ θ 2 2 , where µ is the cost coefficient of ecological conservation and restoration. The supplier and distributor bear the cost by a ratio of r and 1r, respectively. Then, the cost-sharing contract coefficient is defined as δ = r/1r.
Hypothesis 5: 
The wholesale price of the supplier is w, and the market price of the distributor is p. In this respect, the condition p ≥ w ≥ c is assumed to be at work to make it possible for the supply chain to achieve positive earnings.
Hypothesis 6: 
The operating subsidy is defined as E(f), which will subsidize the supplier and distributor by the coefficientsf and 1f, respectively (0 < f < 1). The consumption subsidy is defined as E(φ), and φ (φ > 0) is the subsidized price for lowering each eco-product’s price in the market.
The meaning of all parameters is listed in Table 1.

2.3. Models and Solutions

2.3.1. Subsidy-Free Model

The eco-product supply chain is a sequential game where the supplier has a pricing priority based on product costs, and the distributor can determine the selling price after referencing the wholesale price. The utility functions of the supplier, distributor, and supply chain are described as follows:
U 0 ( π S ) = ( w c ) ( a b p + k θ ) μ θ 2 2 r
U 0 ( π R ) = ( p w ) ( a b p + k θ ) μ θ 2 2 ( 1 r )
U 0 ( π T ) = ( p c ) ( a b p + k θ ) μ θ 2 2
The hysteronproteron method is used to solve the first derivative and the second derivative of the market price p according to Equation (2), and the reaction function of the distributor and the market price can be obtained. For 2 U 0 ( π R ) p 2 = 2 b < 0 , by equating U 0 ( π R ) p to zero, the optimal pricing of the market price can be obtained:
U 0 ( π R ) p = 0 p 0 * = a + b w + k θ 2 b
With simultaneous Equations (2) and (4), the revenue of the supplier can be calculated as:
U 0 ( π S ) = ( w c ) ( a b w + k θ ) 2 μ θ 2 2 r
Then, derivations of Equation (5) regarding w and θ are taken separately, and produce the following results:
U 0 ( π S ) w = a 2 b w + k θ + b c 2
U 0 ( π S ) θ = ( w c ) k 2 μ θ r
After setting 2 U 0 ( π S ) w 2 = b = A , 2 U 0 ( π S ) w θ = k 2 = B ,   2 U 0 ( π S ) θ 2 = μ r = C , it can obtain A < 0,   A C B 2 = b μ r k 2 4 , when b μ r > k 2 4 , the Hessian matrix of U 0 ( π S ) is negative, which means U 0 ( π S ) is a concave function, and it has unique optimal w and θ making the distributor receive the maximum benefit. Hence, let:
{ U 0 ( π S ) w = 0 U 0 ( π S ) θ = 0 { w * = c k 2 2 μ r ( a + b c ) k 2 4 b μ r θ * = k ( b c a ) k 2 4 b μ r
Substitute Equation (8) into Equation (4) to obtain the optimal market price p * = c k 2 b c μ r 3 a μ r k 2 4 b μ r , then the optimal profits of supplier, distributor, and supply chain can be calculated according to Equations (1)–(3):
U 0 * ( π S ) = 4 b [ ( b c a ) μ r ] 2 9 μ r k 2 ( b c a ) 2 2 ( k 2 4 b μ r ) 2
U 0 * ( π R ) = ( a b c ) μ ( k 2 4 b μ r ) 2 [ a r ( b μ r 2 k 2 ) + 1 2 k 2 ( 1 r ) ( b c a ) ]
U 0 * ( π T ) = ( b c a ) 2 μ ( k 2 4 b μ r ) 2 [ 3 b μ r 2 1 2 k 2 ( 12 r + 1 ) ]
Proposition 1. 
Under the subsidy-free condition, θ is inversely proportional to the invested cost of ecological conservation and restoration, and the utilities of the distributor and supply chain are proportionate to the invested cost of ecological conservation and restoration; while the cost-sharing contract coefficient is constant, w, p and the supplier’s utility will show a trend of decreasing first and then increasing.
Proof. 
Based on the given condition θ > 0 and b μ r > k 2 4 , it can be concluded that k 2 4 b μ r < 0; and from given θ * = k ( b c a ) k 2 4 b μ r > 0 , it can also be concluded that bca < 0, so θ r = 4 b μ k ( b c a ) ( k 2 4 b μ r ) 2 < 0 . □
Because p r = μ ( b c + 3 a ) k 2 4 b μ r + ( c k 2 b c μ r 3 a μ r ) ( 4 b μ ) ( k 2 4 b μ r ) 2 = μ [ ( b c + 3 a ) k 2 + 8 b μ r ( b c 3 a ) ] ( k 2 4 b μ r ) 2 , so when 0 < r < ( b c + 3 a ) k 2 8 b µ ( 3 a b c ) , it obtains (bc + 3a)k2 + 8bµr(bc − 3a) > 0 and p r < 0 , and when ( b c + 3 a ) k 2 8 b µ ( 3 a b c ) < r < 1 , it obtains (bc + 3a)k2 + 8bµr(bc − 3a) < 0 and p r > 0 . Similarly, when 0 < δ < ( b c + 3 a ) k 2 8 b µ ( 3 a b c ) ( b c + 3 a ) k 2 , p r < 0 , and when ( b c + 3 a ) k 2 8 b µ ( 3 a b c ) ( b c + 3 a ) k 2 < δ < 1 , p r > 0 .
Because w r = 2 μ [ ( a + 3 b c ) k 2 8 b μ r ( a + b c ) ] ( k 2 4 b μ r ) 2 , so when 0 < r < ( a + 3 b c ) k 2 8 b µ ( a + b c ) , it obtains (a + 3bc)k2 − 8bµr(a + bc) > 0 and w r < 0 , and when ( a + 3 b c ) k 2 8 b µ ( a + b c ) < r < 1 , it obtains (a + 3bc)k2 8bµr(a + bc) < 0 and w r > 0 . Similarly, when 0 < δ < ( a + 3 b c ) k 2 8 b µ ( a + b c ) ( a + 3 b c ) k 2 , w r < 0 ; and when ( a + 3 b c ) k 2 8 b µ ( a + b c ) ( a + 3 b c ) k 2 < δ < 1 , w r > 0 .
Because U 0 ( π S ) r = 2 ( b c a ) 2 μ k 2 [ 28 b μ r 9 k 2 ] ( k 2 4 b μ r ) 3 , so when k 2 4 b µ < r < 9 k 2 28 b µ , it obtains 28bµr − 9 k 2 < 0 and U 0 ( π S ) r < 0 , and when 9 k 2 28 b µ < r < 1, it obtains 28bµr − 9 k 2 > 0 and U 0 ( π S ) r > 0 .
Because U 0 ( π R ) r = 2 μ k 2 [ 2 a b r + b 2 c r + 2 b ( a b c ) ] ( k 2 4 b μ r ) 3 , so U 0 ( π R ) r > 0 . Similarly, U 0 ( π T ) r > 0 .

2.3.2. Operating Subsidy Model

To improve the supply capacity of ecological products, the financial subsidy is paid directly to the supplier and distributor in proportion to their ecosystem protection investment, which is an effective way to reduce the supply chain cost and encourage sustainable operations. The function of the operating subsidy is described as:
E ( f ) = f × μ θ 2 2
where f is the government subsidy coefficient, and the subsidy distribution proportion of the supplier and distributor is consistent with their payments r and 1 − r separately, and the utility functions of the supplier, distributor, and supply chain are described as follows:
U 1 ( π S ) = ( w c )   ( a b p + k θ ) r ( 1 f ) μ θ 2 2
U 1 ( π R ) = ( p w )   ( a b p + k θ ) ( 1 r ) ( 1 f ) μ θ 2 2
U 1 ( π T ) = ( p c ) ( a b p + k θ ) ( 1 f ) μ θ 2 2
As with the subside-free model solution, the optimal market price is solved by the derivative of Equation (14) as follows:
p * = a + b w + k θ 2 b
Let 2 U 1 ( π S ) w 2 = b = A , 2 U 1 ( π S ) w θ = k 2 = B , and 2 U 1 ( π S ) θ 2 = r ( 1 f ) μ = C , then A < 0 and A C B 2 = b r ( 1 f ) μ k 2 4 can be calculated. When b r ( 1 f ) μ > k 2 4 , the unique optimal w and θ for the distributor’s maximum benefit can be proposed as follows:
{ U 1 ( π S ) w = 0 U 1 ( π S ) θ = 0 { w * = c k 2 2 μ r ( 1 f ) ( a b c ) k 2 4 b r ( 1 f ) μ θ * = k ( b c a ) k 2 4 b r ( 1 f ) μ
So p * = c k 2 r μ ( 1 f ) ( 3 a b c ) k 2 4 b r ( 1 f ) μ is obtained by Equation (16), and the utility functions of the supplier, distributor, and supply chain are calculated as follows:
U 1 * ( π S ) = k 2 μ r ( 1 f ) ( a + b c ) 2 2 ( 4 b μ r ( 1 f ) + k 2 ) 2 + ( c + c k 2 2 μ r ( 1 f ) ( a b c ) 4 b μ r ( 1 f ) + k 2 ) ( a b c k 2 μ r ( 1 f ) ( 3 a b c ) 4 b μ r ( 1 f ) + k 2 + k 2 ( a + b c ) 4 b μ r ( 1 f ) + k 2 )
U 1 * ( π R ) = k 2 μ ( 1 f ) ( 1 r ) ( a + b c ) 2 2 ( 4 b μ r ( 1 f ) + k 2 ) 2 + ( c k 2 + 2 μ r ( 1 f ) ( a b c ) 4 b μ r ( 1 f ) + k 2 + c k 2 μ r ( 1 f ) ( 3 a b c ) 4 b μ r ( 1 f ) + k 2 ) ( a b c k 2 μ r ( 1 f ) ( 3 a b c ) 4 b μ r ( 1 f ) + k 2 + k 2 ( a + b c ) 4 b μ r ( 1 f ) + k 2 )
U 1 * ( π T ) = 4 b μ ( 1 f ) ( c k 2 μ r ( 1 f ) ( 3 a b c ) ) ( 4 b μ r ( 1 f ) + k 2 ) 2 k 2 μ ( 1 f ) ( a + b c ) 2 2 ( 4 b μ r ( 1 f ) + k 2 ) 2 μ ( 1 f ) ( 3 a b c ) 4 b μ r ( 1 f ) + k 2 + ( c + c k 2 μ r ( 1 f ) ( 3 a b c ) 4 b μ r ( 1 f ) + k 2 ) ( a b c k 2 μ r ( 1 f ) ( 3 a b c ) 4 b μ r ( 1 f ) + k 2 + k 2 ( a + b c ) 4 b μ r ( 1 f ) + k 2 )
Proposition 2. 
Under the operating subsidy, the θ, p, w, and the supplier’s utility are directly proportional to the government subsidy coefficient, but inversely proportional to the cost-sharing contract coefficient; under specified conditions, the utilities of the distributor, and supply chain are all in inverse proportion to the government subsidy coefficient, but in direct proportion to the cost-sharing contract coefficient.
Proof. 
According to the given condition θ > 0 and b r ( 1 f ) μ > k 2 4 , it can be inferred that θ * = k ( b c a ) k 2 4 b r ( 1 f ) μ > 0 , bc   a < 0, θ f = 4 b r k μ ( b c a ) ( k 2 4 b μ r ( 1 f ) ) 2 > 0 , and θ r = 4 b k μ ( b c a ) ( 1 f ) ( k 2 4 b μ r ( 1 f ) ) 2 < 0 . Evidenced by the same token, w f > 0 , p f > 0 , U 1 ( π S ) f > 0 , U 1 ( π R ) f < 0 , and U 1 ( π T ) f < 0 ; when f remains unchanged, w r < 0 , p r < 0 , U 1 ( π S ) r < 0 , U 1 ( π R ) r > 0 , U 1 ( π T ) r > 0 . □

2.3.3. Consumption Subsidy Model

To stimulate consumption and expand eco-product demand, the government provides purchase subsidies to consumers, reflected in the reduction inmarket price. The subsidized price becomes p − φ, and the utility functions also change accordingly as follows:
U 2 ( π S ) = ( w c ) [ a b × ( p φ ) + k θ ] μ θ 2 2 r
U 2 ( π R ) = ( p w ) [ a b × ( p φ ) + k θ ] μ θ 2 2 ( 1 r )
U 2 ( π T ) = ( p c ) ( a b × ( p φ ) + k θ ) μ θ 2 2
As with the subside-free model solution, the equations are solved by the hysteronproteron method as follows:
Similarly, let 2 U 2 ( π S ) w 2 = b = A , 2 U 2 ( π S ) w θ = k 2 = B , and 2 U 2 ( π S ) θ 2 = μ r = C , it can be calculated that A < 0 and A C B 2 = b μ r k 2 4 . When b μ r > k 2 4 , the results are as follows:
p * = a + b ( w + φ ) + k θ 2 b = ( b 2 4 b μ r ) ( 3 a + b c + 3 b φ ) 3 k 2 ( a b c + b φ ) 4 b ( b 2 4 b μ r )
w * = a + b ( c + φ ) + k θ 2 b = 2 b ( c k 2 2 b μ r ) 4 b μ r ( a + b φ ) 2 b ( k 2 4 b μ r )
θ * = k ( b c b φ a ) k 2 4 b μ r
U 2 * ( π S ) = k 2 μ r ( a + b c b ϕ ) 2 2 ( 4 b μ r + k 2 ) 2 + { a b [ 3 b k 2 ( b 2 4 b μ r ) ( a b c + b ϕ ) 4 ϕ + ( b 2 4 b μ r ) ( 3 a + b c + 3 b ϕ ) ] + k 2 ( a + b c b ϕ ) 4 b μ r + k 2 } [ 2 b 2 μ r ( a + b ϕ ) ( 4 b μ r + k 2 ) + 2 b ( 2 b μ r + c k 2 ) c ]
  U 2 * ( π R ) = k 2 μ ( 1 f ) ( 1 r ) ( a + b c b ϕ ) 2 2 ( 4 b μ r + k 2 ) 2 + { a b [ 3 b k 2 ( b 2 4 b μ r ) ( a b c + b ϕ ) 4 + ( b 2 4 b μ r ) ( 3 a + b c + 3 b ϕ ) ] + k 2 ( a + b c b ϕ ) 4 b μ r + k 2 } × [ 2 b 2 μ r ( a + b ϕ ) ( 4 b μ r + k 2 ) 3 b k 2 ( b 2 4 b μ r ) ( a b c + b ϕ ) 4 2 b ( 2 b μ r + c k 2 ) + ( b 2 4 b μ r ) ( 3 a + b c + 3 b ϕ ) ]
U 2 * ( π T ) = k 2 μ ( 1 f ) ( a + b c b ϕ ) 2 2 ( 4 b μ r + k 2 ) 2 & + { a b [ 3 b k 2 ( b 2 4 b μ r ) ( a b c + b ϕ ) 4 + ( b 2 4 b μ r ) ( 3 a + b c + 3 b ϕ ) ] + k 2 ( a + b c b ϕ ) 4 b μ r + k 2 } × [ 3 b k 2 ( b 2 4 b μ r ) ( a b c + b ϕ ) 4 c + ( b 2 4 b μ r ) ( 3 a + b c + 3 b ϕ ) ]
Proposition 3. 
Under the consumption subsidy, all the decision variables are proportionate to the increased amount of subsidy φ.
Proof. 
Due to θ > 0 and b μ r > k 2 4 , k 2 4 b μ r < 0, it can be inferred that θ * = k ( b c b φ a ) k 2 4 b μ r > 0 , b c b φ a     < 0, and θ r = 4 b k μ ( b c b φ a ) ( k 2 4 b μ r ) 2 > 0 ; furthermore, p r > 0 , w r > 0 , U 2 ( π S ) r > 0 , U 2 ( π R ) r > 0 and U 2 ( π T ) r > 0. □

3. Numerical Calculation and Simulation Analysis

In order to verify the validity of the model and observe the conclusion more intuitively, this paper uses Python 3.10 for numerical simulation analysis. Referring to the existing research results, specific indicators have been set as follows: a = 100, b = 1, c = 3, k = 1, µ = 10 [38,39].

3.1. Single-Model Simulation Analysis

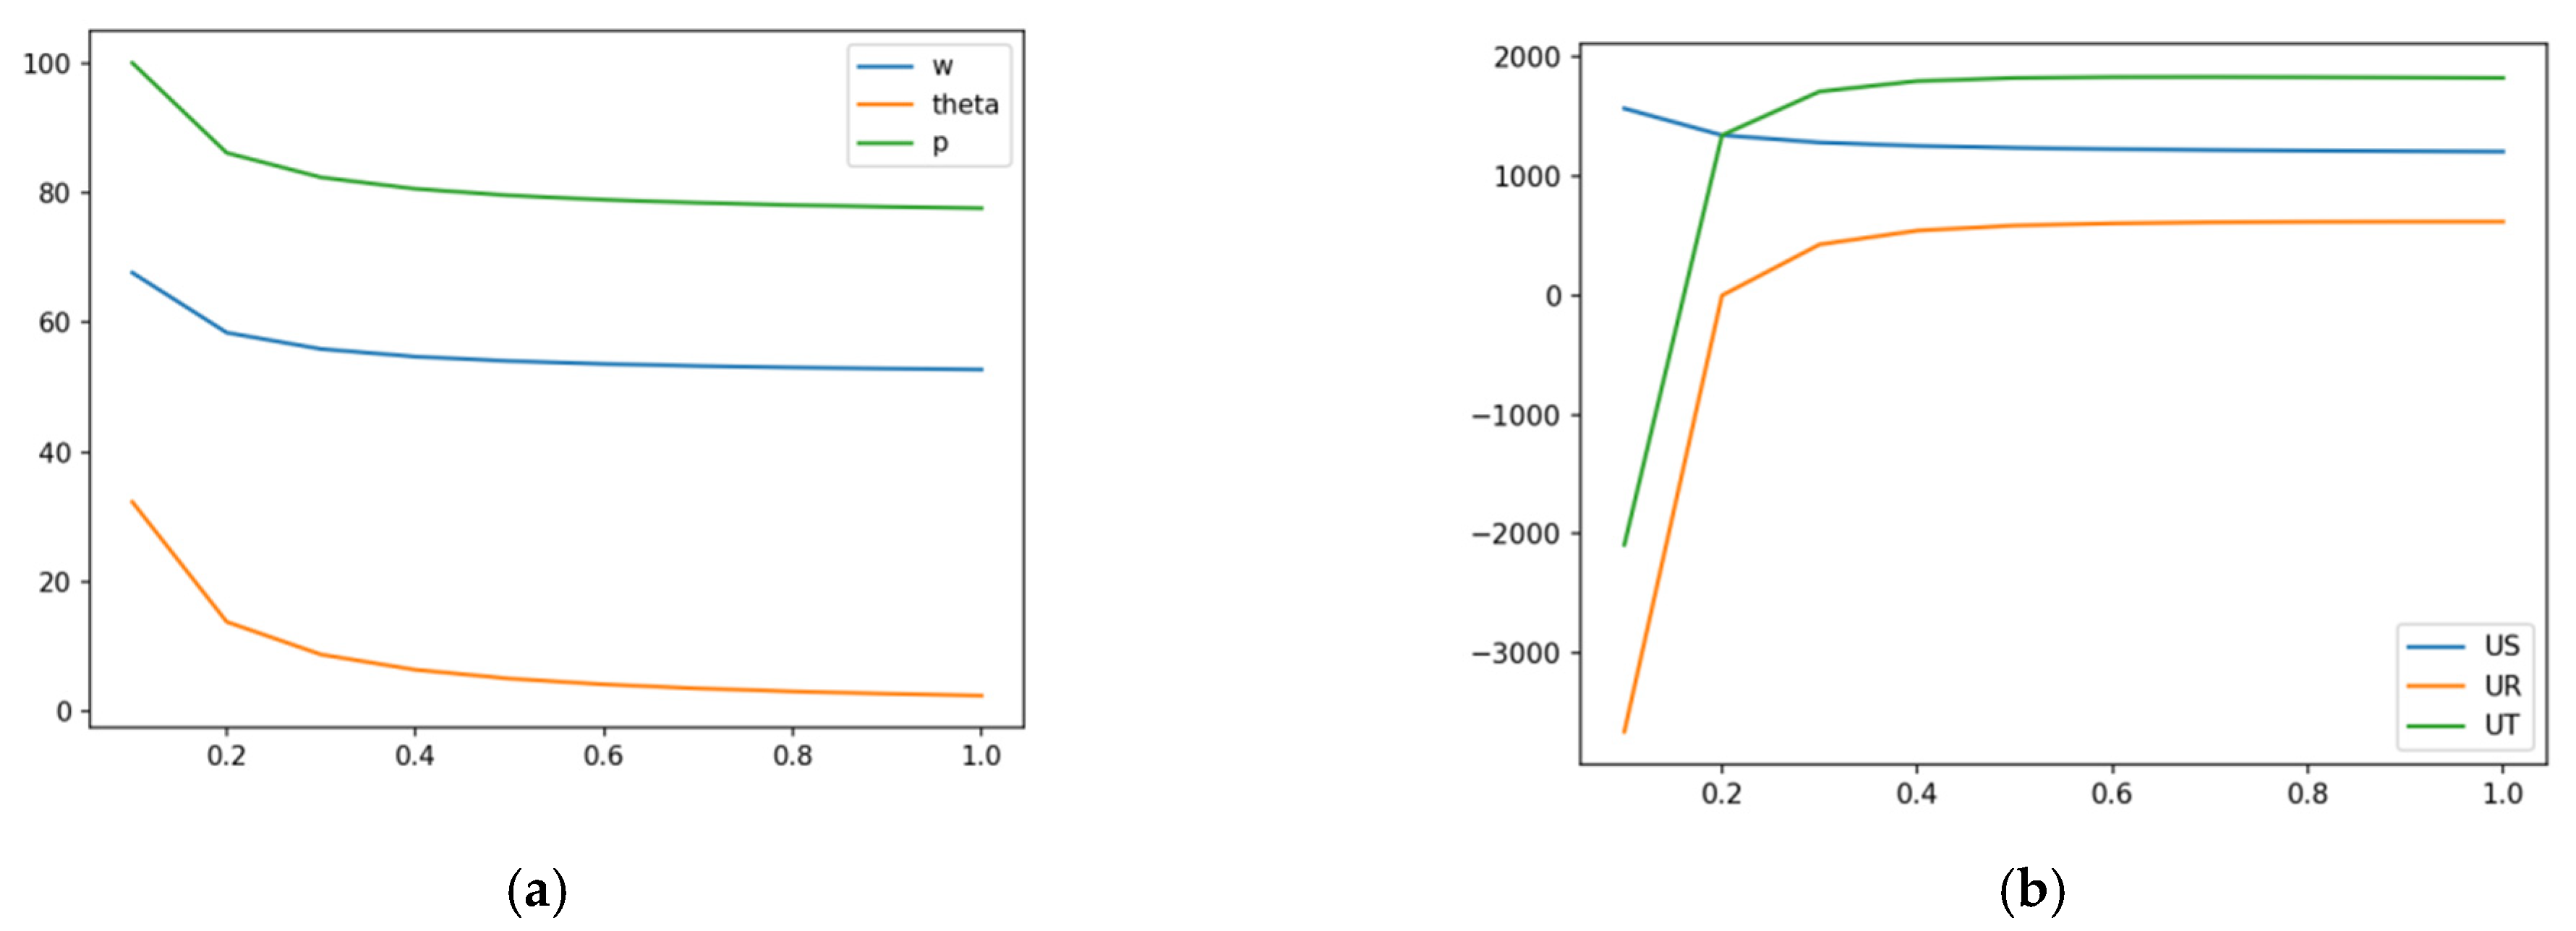
3.1.1. Subsidy-Free Model Simulation Analysis

Due to the proportionality between the cost-sharing contract coefficient δ and the supplier’s investment ratio r, r is used as the simulation variable instead of δ, which can be numerically simpler and more intuitive. Hence, the results of each decision variable can be calculated when r varies with a step size of 0.1 within the range of 0 to 1, reflecting the impact of δ on w, p, and θ and the utilities of the supply chain as in Figure 2.
The simulation results are consistent with Proposition 1, which shows that: (1) the fundamental motivation lies in both the supplier and distributor seeking the maximum benefits, thus they will generate risk aversion and fairness preference in consideration of sharing the ecological protection cost, and choose to invest less at the expense of the ecological level of the supply chain, making the wholesale price and market price drop accordingly; (2) there has been a small decrease in the supplier’s utility while the distributor’s utility is constantly on the rise with the increasing cost-sharing contract coefficient; (3) the impact of an increased sales volume is greater than that of lower prices, presented with a rising trend of the utility of the supply chain. Significantly, all the simulated curves change dramatically when r varies between 0 and 0.3; that is, with the distributor paying for most of the ecological protection cost. Consequently, the eco-products’ distributor dominates the supply chain in the subsidy-free situation.

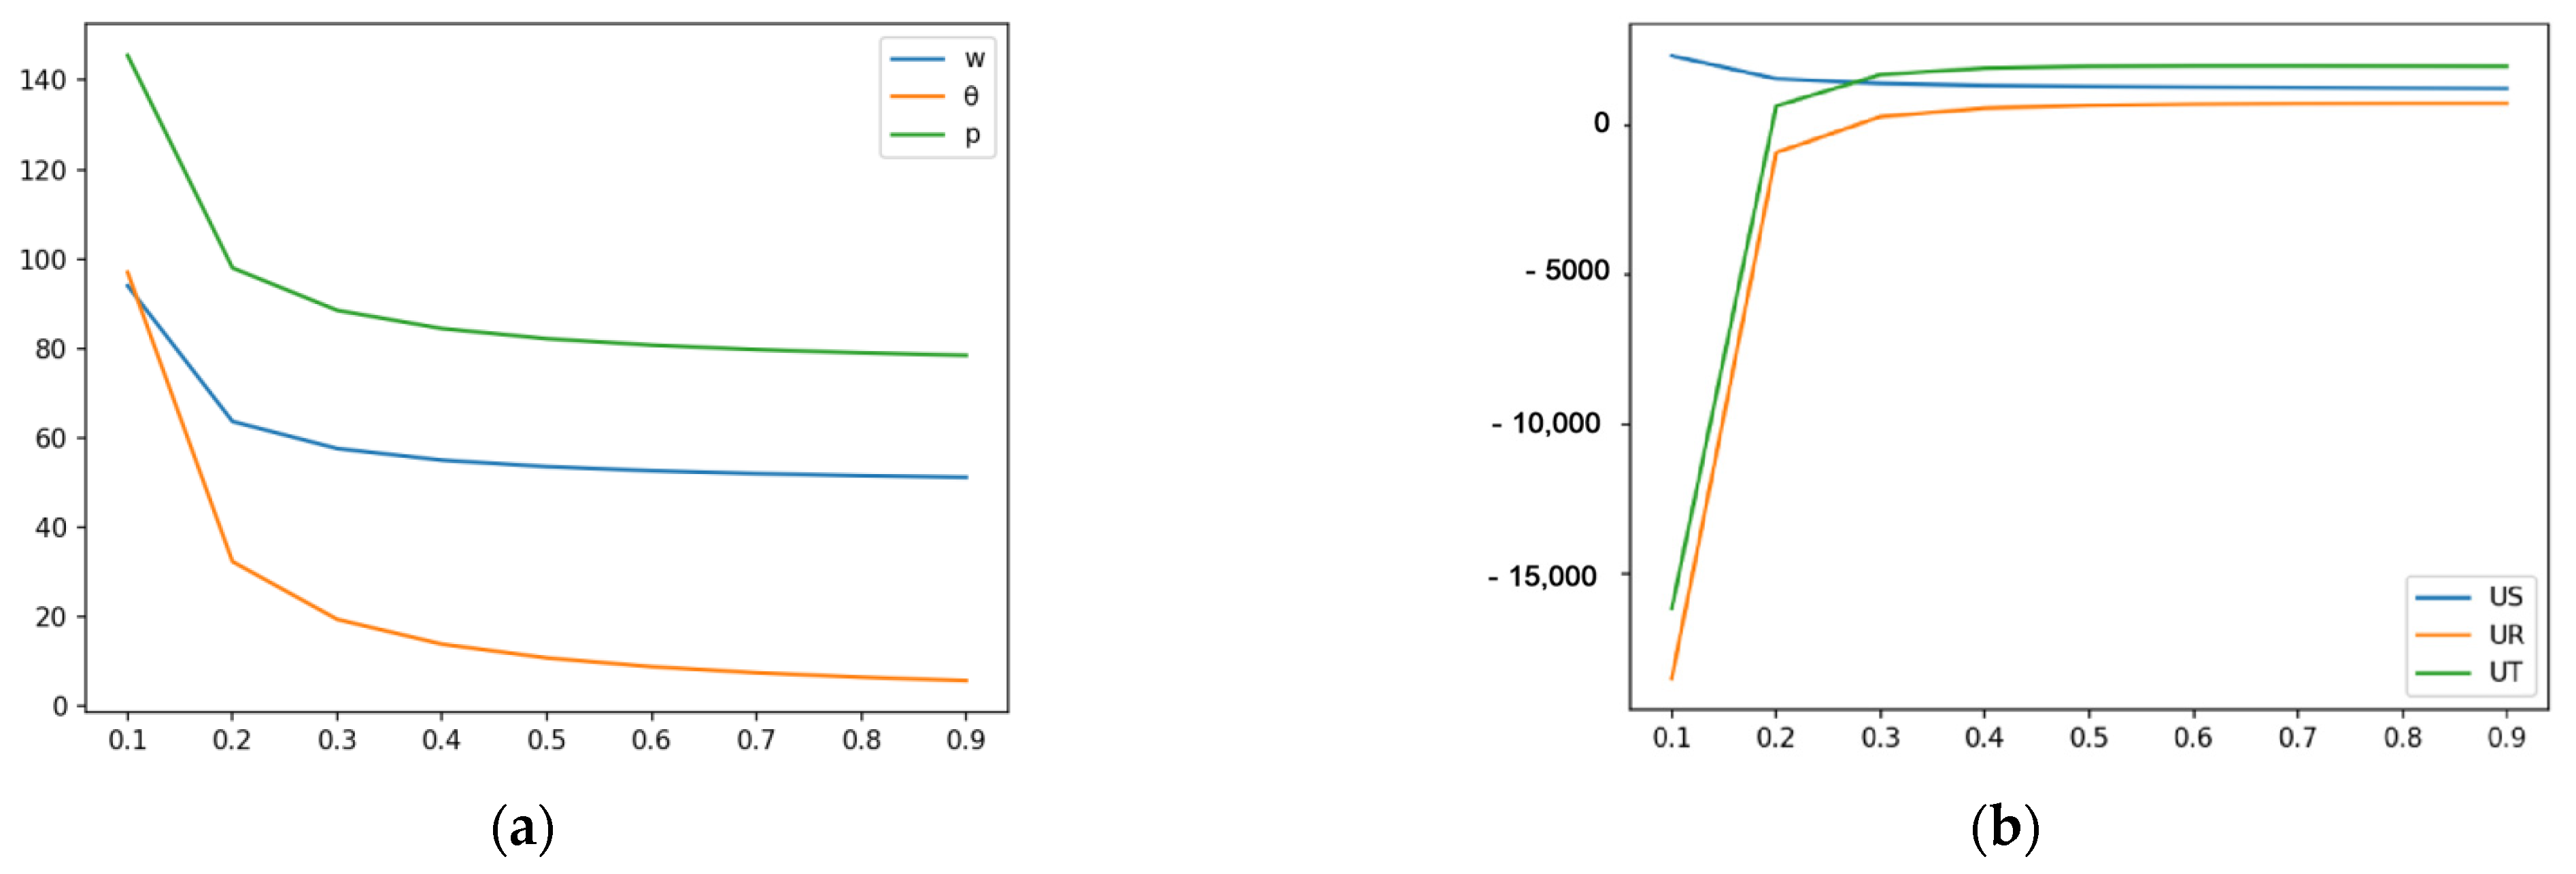
3.1.2. Operating Subsidy Model Simulation Analysis

Referring to the subsidy-free equilibrium outcomes, r is set to 0.3, the simulated results are calculated with f taking the values 0.1, 0.3, 0.5, and 0.8, respectively, as shown in Figure 3. Then, f is set to 0.3 to analyze the impact of the cost-sharing contract on supply chain performance, and the results are shown in Figure 4.
Consistent with Proposition 2, the results show that: (1) Under the assumption of a fixed contribution contract, the operating subsidy can directly improve the ecological level, ecological feedback investment, wholesale price, and market price, followed by decreasing sales; with the increase in the subsidy coefficient, the distributor’s utility decreases, mainly because of the greater change rate of the market price and the higher cost-sharing ratio; although the supplier’s utility has increased, the total utility of the supply chain drops. (2) Under the condition of a certain subsidy, the impact of the cost-sharing contract on supply chain pricing and utilities is in accordance with the subsidy-free mode. Therefore, the operating subsidy motivates the supplier more; meanwhile, the selection of a reasonable coefficient and cost-sharing contract is beneficial to the supply chain’s performance and EPVR.

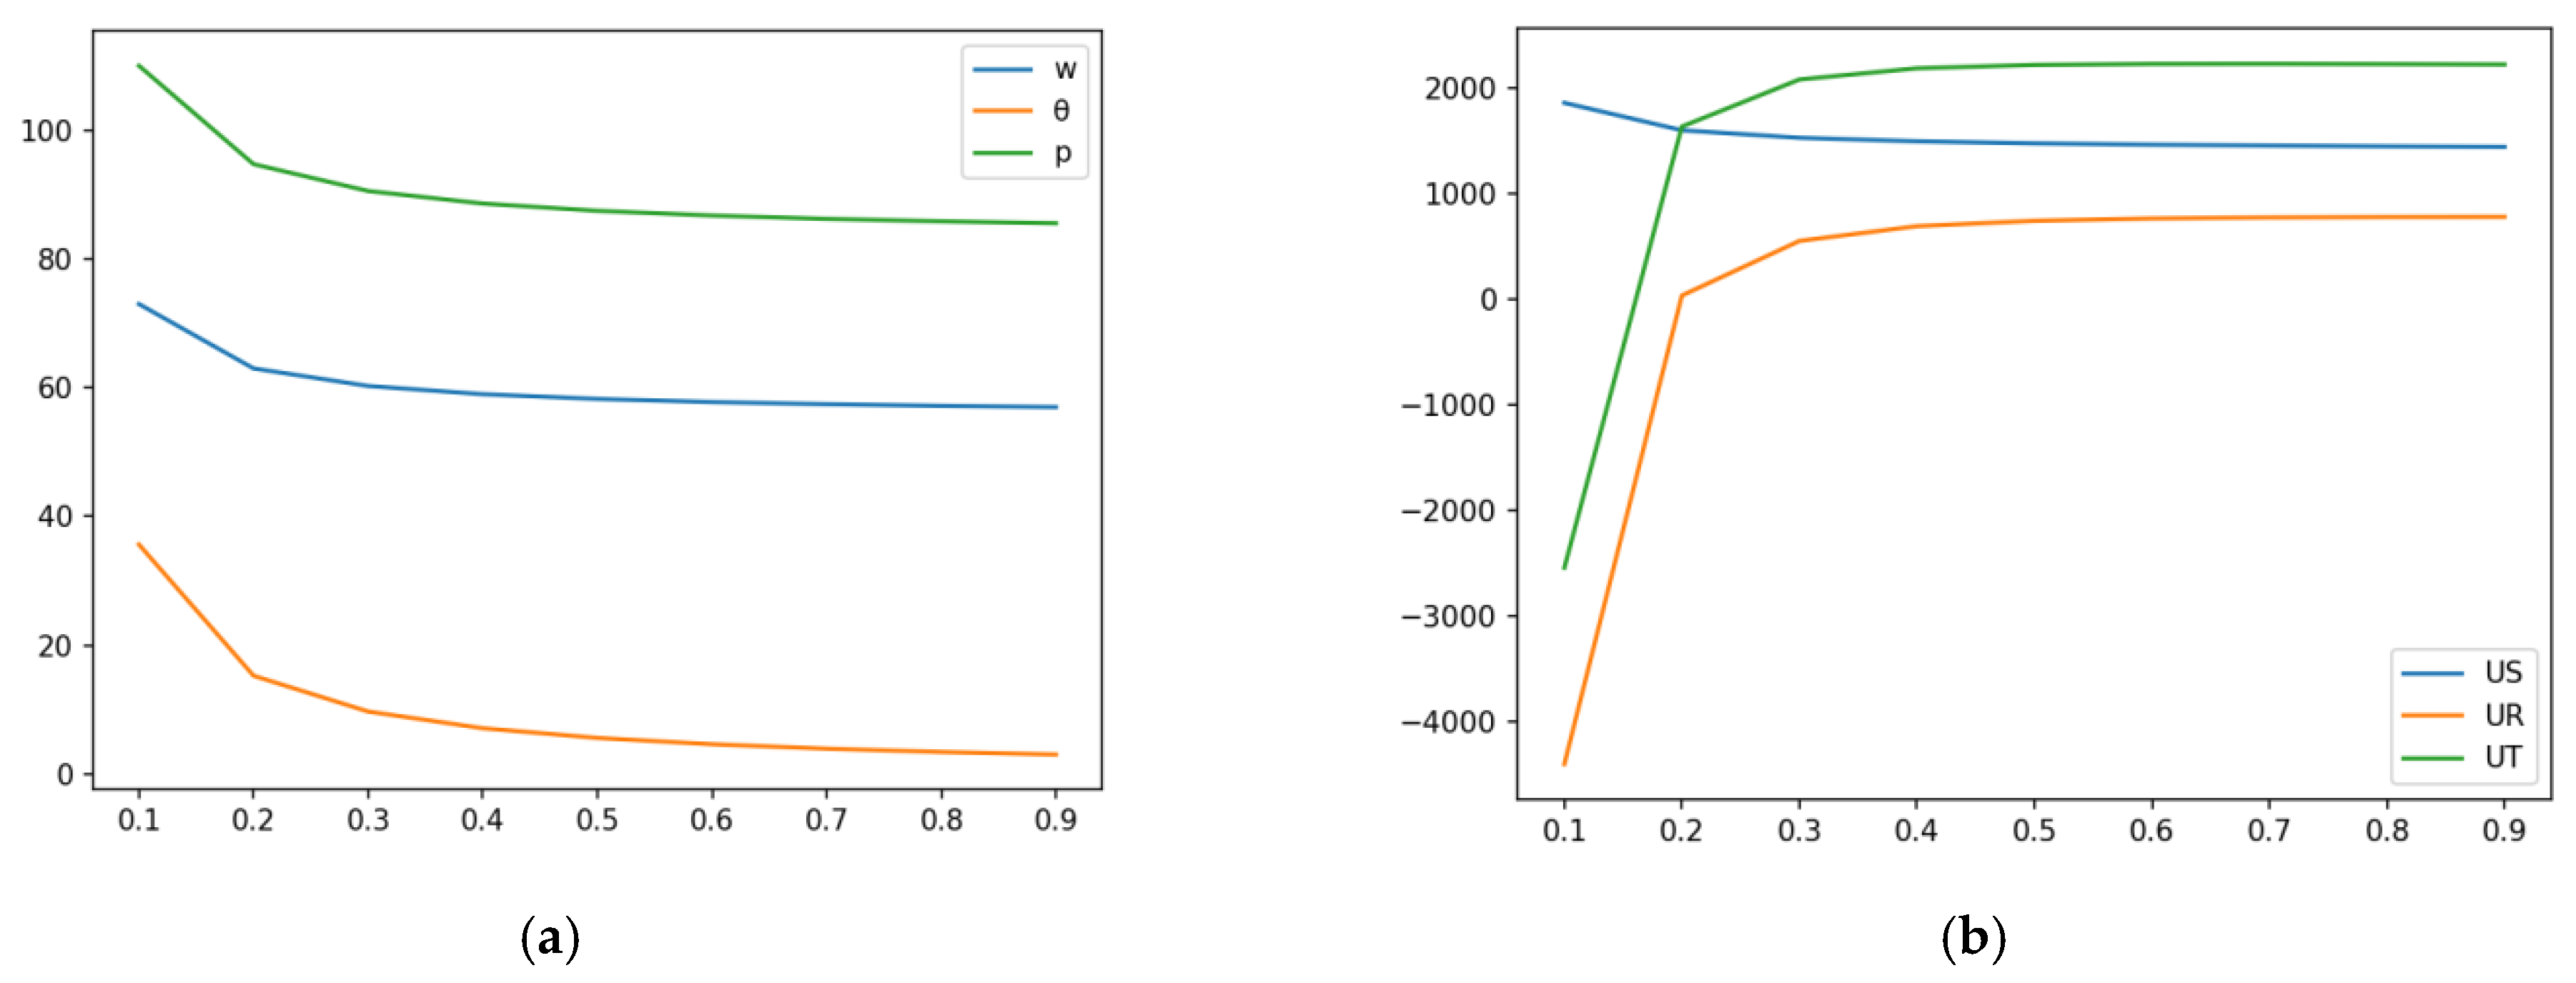
3.1.3. Consumption Subsidy Model Simulation Analysis

To keep the results comparable among models, r also values 0.3, and the simulations operate with φ taking the values 1, 5, and 10, respectively, as shown in Figure 5. Then, φ is set to 10 to analyze the impact of the cost-sharing contract on supply chain performance, and the results are shown in Figure 6.
The results also show a consistent pattern with Proposition 3, indicating that: (1) under the assumption of a fixed contribution contract, the consumption subsidy can increase all the decision variables of the whole supply chain, but at a slow pace; (2) under the condition of a certain subsidy, the impact of the cost-sharing contract on supply chain pricing and utilities is in accordance with the subsidy-free mode. Therefore, the consumption subsidy motivates the distributor more, so the distributor should pay more for ecological conservation and restoration to achieve a good effect for EPVR.

3.2. Multiple Model Comparative Analysis

From the single-model simulation results, subsidy strategies and cost-sharing contracts have different levels of influence on the performance of the ecological product supply chain. In order to make the effect of different subsidy policies more visually apparent, contrastive analysis of the ecological level and total supply chain utility under parameter combinations was carried out.

3.2.1. With or Without Subsidy Comparison

To verify whether subsidies have a positive effect, the operating subsidy was chosen as representative to compare with the subsidy-free scenario for convenient appraisal and analysis, as shown in Figure 7.
In the aspect of ecological level, the supply chain with the government subsidy is more ecological than without the subsidy, and the local optimal solution can be obtained through the optimization of the government subsidy coefficient and the cost-sharing contract coefficient, as shown in Figure 7a. In addition, the government subsidy can increase the total revenue of the supply chain in most instances, as shown in Figure 7b, and is regarded as a positive incentive to improve the eco-product stakeholders’ enthusiasm.

3.2.2. Direct or Indirect Subsidy Comparison

Depending on the allowance object, the operation subsidy can be regarded as a direct subsidy to business entities, while the consumption subsidy is indirect. To keep the effects comparable among these two subsidies, the level of subsidies is set to be equal, that is E ( f ) = E ( φ ) , then the curve of f and φ ( f ) can be drawn by ensuring r is equal to 0.3, as shown in Figure 8. Based on the functional relationship, the operating subsidy coefficient, and the consumption subsidy price can be converted to one another to check which is more beneficial for the supply chain, and the results are shown in Figure 9.
The results show that: (1) the operating subsidy coefficient is proportionate to the consumption subsidy price; (2) in the vast majority of cases, the ecological leveland the utility of the supply chain with the consumption subsidy are higher than that of the operating subsidy. Therefore, the concept of cultivating ecological consumption is more conducive to expanding demand in the ecological products market, and further arouses the enthusiasm of the main market players to promote the transformation of ecological product value and the growth of the ecological economy.

4. Conclusions and Suggestions

On the premise of the invested cost of ecological conservation and restoration, whether the government supports EPVR and how to support EPVR will have a greater impact on the sustainable transformation of eco-products’ value. Hence, following the law of the market, this paper first constructs and generalizes a two-level ecological products supply chain system under different government subsidies. Secondly, the supply chain models of subsidy-free, operating subsidy, and consumption subsidy are proposed under a cooperative game to optimize the pricing decision and attain the win–win goal, for further research on the impact of different subsidy policies and ecological cost-sharing contract on EPVR. Finally, numerical simulations were used to demonstrate the effectiveness of the models and were applied to analyze the effect of EPVR. Based on the results of this study, the following conclusions can be drawn:
(1) The ecological cost-sharing contrast can affect the behavior of eco-product stakeholders regardless of whether there is government support or not. To maximize the scale of the EPVR benefits, the ecological products’ supplier and distributor should collaborate and negotiate an agreement on sharing the ecological protection cost. In addition, the government can give appropriate guidance to promote cooperation between the supplier and distributor, improving the information transparency and the contract of the supply chain.
(2) Although the proceeds from subsidy-free eco-products relying on market regulation have increased, the ecological level of the supply process constantly decreases, which means EPVR comes at the expense of good ecological resources. Hence, the marketization mechanism of EPVR in China is not mature, and remains an artificial market under government regulation. It is essential for the government to establish a standard for ecological cost-sharing, which should specify the lower limits of sharing the ecological cost under different conditions, such as for material goods, regulating services, and cultural services.
(3) The primary purpose of government subsidies is to incentivize all operation parties of ecological products in the market to improve the marketization level and the scale benefit. Based on this, this study finds which form of subsidies is beneficial to increase the utility of the eco-product supply chain, which will guide operating entities to take a more active part in ecological protection and utilization, laying a solid foundation for sustainable eco-product supply. Therefore, the government should establish a long-term mechanism to give more financial support for the development of ecological products at the current stage.
(4) Although direct and indirect subsidies can both influence the coordination and pricing decisions of the supply chain, the effects of these two approaches show an apparent difference by the same amount. Accordingly, the government should judge the situation and make a decision on which subsidy is more suitable.
(5) By increasing the ecological level rapidly, the direct subsidy has proven to be good for the ecosystem’s ability to supply eco-products, which is applicable at the EPVR’s embryonic phase; although with a slower increase of the ecological level, the indirect subsidy can create a virtuous circle of people willing to pay for ecological products, naturally forming eco-product marketization, which is suitable in the mid- to late stages of EPVR market cultivation. Additionally, in view of the increased demand on the consumer side, it is more of a benefit for the ecological products’ long-term development, and the government can strengthen publicity and education to accelerate people’s identification with ecological products.
Based on the research results, suggestions for the path exploration of EPVR can be proposed as follows:
(1) The interest-related subjects of eco-products should have the overall situation and built trust during the process from producer to consumer, to realize information sharing, resource integration, efficiency, and benefit maximization.
(2) The distributor is always dominated in the supply chain for having consumption information superiority. It is necessary to design a collaborative mechanism to encourage enterprises in the supply chain upstream and downstream to work together. Moreover, it is necessary for the central government or provincial government to intervene in negotiating reasonable rules for a cost-sharing contract in view of ‘an artificial market under government regulation’, to form a quasi-market mechanism for EPVR gradually.
(3) This paper assumes that the supply chain runs with perfect information, which is highly idealized and cannot exist in the real world, so further research is needed to quell concerns about the fairness and preference for information of the supply chain system in order to match actual circumstances. But it is certain that stakeholders should have full-court vision for the sustainable development of the ecological environment during the market circulation process of eco-products, and should enhance their communication and trust to realize information sharing, resource integration, efficiency, and benefit maximization.
(4) Furthermore, this study has considered only an incentive mechanism relying on government subsidies, but the restraint and supervision of the government are also vital to EPVR. Therefore, further research is needed to take both award and punishment into consideration, in order to establish a more efficient EPVR marketization mechanism.

Author Contributions

Y.C.: materials and method, conclusions and suggestions, writing—original draft, and writing—review and editing. Z.S.: numerical calculation and simulation analysis, and writing—original draft. Q.W.: introduction, writing—original draft, and writing—review. All authors have read and agreed to the published version of the manuscript.

Funding

This research was funded by the Special Project of China Energy Conservation and Environmental Protection Group, grant number 23027-ZT-Y; and the State Key Laboratory of Urban Water Resource and Environment (Harbin Institute of Technology), grant number 2023DX06.

Institutional Review Board Statement

Not applicable.

Informed Consent Statement

Not applicable.

Data Availability Statement

The datasets obtained and analyzed in this study are available from the corresponding authors upon reasonable request.

Conflicts of Interest

Author Yuanhua Chen was also employed by the company China Energy Conservation and Environmental Protection Group (CECEP), Eco-Product Development Research Center Co., Ltd. The remaining authors declare that the research was conducted in the absence of any commercial or financial relationships that could be construed as potential conflicts of interest. The authors declare that this study received funding from the company the company China Energy Conservation and Environmental Protection Group (CECEP), Eco-Product Development Research Center Co., Ltd. The funder was not involved in the study design, collection, analysis, interpretation of data, the writing of this article or the decision to submit it for publication.

References

  1. General Office of the CPC Central Committee and General Office of the State Council Opinions on Establishing and Improving the Value Realization Mechanism of Ecological Products. 2021. Available online: https://www.gov.cn/zhengce/2021-04/26/content_5602763.htm (accessed on 26 April 2021).
  2. Xu, Y.; Zhao, W.; Zhang, Z. The practice of naturebased solutions in China: Ecosystem product value realization. Curr. Opin. Environ. Sci. Heal. 2023, 36, 100514. [Google Scholar] [CrossRef]
  3. Wang, Q.; Jiang, M.; Huang, Y. Realization Ways and Mechanism Innovation of Internalization of Ecological Positive Externalities. Chin. J. Environ. Manag. 2020, 12, 21–28. (In Chinese) [Google Scholar]
  4. Xu, Z.; Wei, H.; Fan, W.; Dong, X. Energy modeling simulation of changes in ecosystem services before and after the implementation of a Grain-for-Green program on the Loess Plateau-A case study of the Zhifanggou valley in Ansai County, Shanxi Province, China. Ecosyst. Serv. 2018, 31, 32–43. [Google Scholar] [CrossRef]
  5. Hojnik, J.; Ruzzier, M.; Ruzzier, M.K. Transition towards sustainability: Adoption of eco-products among consumers. Sustainability 2019, 11, 4308. [Google Scholar] [CrossRef]
  6. Warchold, A.; Pradhan, P.; Kropp, J. Variations in sustainable development goal interactions: Population, regional, and income disaggregation. Sustain. Dev. 2020, 29, 285–299. [Google Scholar] [CrossRef]
  7. Xia, H.; Yuan, S.; Prishchepov, A.V. Spatial-temporal heterogeneity of ecosystem service interactions and their social-ecological drivers: Implications for spatial planning and management. Resour. Conserv. Recycl. 2023, 189, 106767. [Google Scholar] [CrossRef]
  8. Du, W.; Yan, H.; Feng, Z.; Yang, Z.; Yang, Y. The external dependence of ecological products: Spatial-temporal features and future predictions. J. Environ. Manag. 2022, 304, 114190. [Google Scholar] [CrossRef]
  9. Groot, R.; Wilson, M.A.; Boumans, R. A typology for the classification, description and valuation of ecosystem functions, goods and services. Ecol. Econ. 2002, 41, 393–408. [Google Scholar] [CrossRef]
  10. Kroeger, T.; Casey, F. An assessment of market-based approaches to providing ecosystem services on agricultural lands. Ecol. Econ. 2008, 64, 321–332. [Google Scholar] [CrossRef]
  11. Nie, X.; Li, X.; Lyu, C.; Su, Y.; Wang, H. Can ecological compensation based on the transfer of development rights (TDR) improve ecosystem service value? A multi-scenario simulation. Land Use Policy 2024, 138, 107024. [Google Scholar] [CrossRef]
  12. Chen, Y.; Dou, S.; Xu, D. The effectiveness of eco-compensation in environmental protection-a hybrid of the government and market. J. Environ. Manag. 2021, 280, 111840. [Google Scholar] [CrossRef] [PubMed]
  13. Du, H.; Zhao, L.; Zhang, P.; Li, J.; Yu, S. Ecological compensation in the Beijing-Tianjin-Hebei region based on ecosystem services flow. J. Environ. Manag. 2023, 331, 117230. [Google Scholar] [CrossRef] [PubMed]
  14. Gao, X.; Shen, J.; He, W.; Zhao, X.; Li, Z.; Hu, W.; Wang, J.; Ren, Y.; Zhang, X. An evolutionary game analysis of governments’ decision-making behaviors and factors influencing watershed ecological compensation in China. J. Clean. Prod. 2021, 317. [Google Scholar] [CrossRef]
  15. Wang, J.; Yu, F.; Ma, G.; Peng, F.; Zhou, X.; Wu, C.; Yang, W.; Wang, C.; Cao, D.; Jiang, H. Gross economic-ecological product as an integrated measure for ecological service and economic products. Resour Conserv. Recycl. 2021, 171, 105566. [Google Scholar] [CrossRef]
  16. Liang, X.; Yuan, Q.; Tan, X.; Chen, S. The conservation of collective-owned farmland via the transfer of development rights (TDR) in China–the case of Ecological Fruit Park in Guangzhou. J. Rural Stud. 2020, 78, 399–410. [Google Scholar] [CrossRef]
  17. Lin, B.; Huang, C. Analysis of emission reduction effects of carbon trading: Market mechanism or government intervention? Sustain. Prod. Consum. 2022, 33, 28–37. [Google Scholar] [CrossRef]
  18. Costanza, R.; D’Arge, R.; Groot, R.D.; Farber, S.; Grasso, M.; Hannon, B.; Limburg, K.; Naeem, S.; O’Neill, R.V.; Paruelo, J.; et al. The value of the world’s ecosystem services and natural capital. Nature 1997, 387, 253–260. [Google Scholar] [CrossRef]
  19. Shao, H. Agricultural greenhouse gas emissions, fertilizer consumption, and technological innovation: A comprehensive quantile analysis. Sci. Total. Environ. 2024, 926, 171979. [Google Scholar] [CrossRef]
  20. Mantymaa, E.; Juutinen, A.; Monkkonen, M.; Svento, R. Participation and compensation claims in voluntary forest conservation: A case of privately owned forests in Finland. For. Policy Econ. 2009, 11, 498–507. [Google Scholar] [CrossRef]
  21. Hasan, S.S.; Zhen, L.; Miah, M.G.; Ahamed, T.; Samie, A. Impact of land use change on ecosystem services: A review. Environ. Dev. 2020, 34, 100527. [Google Scholar] [CrossRef]
  22. Zarandian, A.; Badamfirouz, J.; Musazadeh, R.; Rahmati, A.; Azimi, S.B. Scenario modeling for spatial-temporal change detection of carbon storage and sequestration in a forested landscape in Northern Iran. Environ. Monit. Assess. 2018, 190, 474. [Google Scholar] [CrossRef] [PubMed]
  23. Pagiola, S.; Rios, A.R. The Impact of Payments for Environmental Services on Land Use Change in Quindío, Colombia; World Bank: Washington, DC, USA, 2008. [Google Scholar]
  24. Claassen, R.; Cattaneo, A.; Johansson, R. Cost-effective design of agri-environmental payment programs: US experience in theory and practice. Ecol. Econ. 2008, 65, 737–752. [Google Scholar] [CrossRef]
  25. NYCDEP. Watershed Protection Program Summary and Assessment; New York City Department of Environmental Protection: New York, NY, USA, 2006. [Google Scholar]
  26. Selva, G.V.; Pauli, N.; Kim, M.K.; Clifton, J. Opportunity for change or reinforcing inequality: Power, governance and equity implications of government payments for conservation in Brazil. Environ. Sci. Policy 2020, 105, 102–112. [Google Scholar] [CrossRef]
  27. Eriksson, L.A.; Sallnas, O.; Stahl, G. Forest certification and Swedish wood supply. For. Policy Econ. 2007, 9, 452–463. [Google Scholar] [CrossRef]
  28. Johansson, J. Participation and deliberation in Swedish forest governance: The process of initiating a National Forest Program. For. Policy Econ. 2016, 70, 137–146. [Google Scholar] [CrossRef]
  29. Liu, J.M.; Su, X.J.; Liu, Y.M.; Shui, W. A review of research on progress in the theory and practice of eco-product value realization. Land 2024, 13, 316. [Google Scholar] [CrossRef]
  30. Jiang, K.; You, D.; Li, Z.; Shi, S. A differential game approach to dynamic optimal control strategies for watershed pollution across regional boundaries under eco-compensation criterion. Ecol. Indic. 2019, 105, 229–241. [Google Scholar] [CrossRef]
  31. Liu, M.; Guo, J. Comparisons and improvements of ecocompensation standards for water resource protection in the Middle Route of the South-to-North Water Diversion Project. Water Sci. Tech-W Sup. 2020, 20, 2988–2999. [Google Scholar] [CrossRef]
  32. Wang, K.; Liu, P.; Sun, F.; Wang, S.; Zhang, G.; Zhang, T.; Chen, G.; Liu, J.; Wang, G.; Cao, S. Progress in realizing the value of ecological products in China and its practice in Shandong Province. Sustainability 2023, 15, 9480. [Google Scholar] [CrossRef]
  33. Yu, H.; Shao, C.; Wang, X.; Hao, C. Transformation path of ecological product value and efficiency evaluation: The case of the qilihai wetland in Tianjin. Int. J. Environ. Res. Public Heal. 2022, 19, 14575. [Google Scholar] [CrossRef]
  34. Wang, H.; Luo, J.; Tian, L.; Liu, J.; Gan, Y.; Han, T. “Realization-feedback” path of ecological product value in rural areas from the perspective of capital recycling theory: A case study of Zhengjiabang Village in Changyang County, China. Sustainability 2023, 15, 13905. [Google Scholar] [CrossRef]
  35. Basiri, Z.; Heydari, J. A mathematical model for green supply chain coordination with substitutable products. J. Clean. Prod. 2017, 145, 232–249. [Google Scholar] [CrossRef]
  36. Jamali, M.; Rasti-Barzoki, M. A game theoretic approach for green and non-green product pricing in chain-to-chain competitive sustainable and regular dual-channel supply chains. J. Clean. Prod. 2018, 170, 1029–1043. [Google Scholar] [CrossRef]
  37. de Oliveira, U.R.; Espindola, L.S.; da Silva, I.R.; da Silva, I.N.; Rocha, H.M. A systematic literature review on green supply chain management: Research implications and future perspectives. J. Clean. Prod. 2018, 187, 537–561. [Google Scholar] [CrossRef]
  38. Chen, Z. Coordination Mechanisms for South-to-North Water Diversion: Economic Benefit and Social Responsibility. Resour. Sci. 2013, 35, 1245–1253. (In Chinese) [Google Scholar]
  39. Liu, J.; Zhou, Y.; Zheng, Y.; Wang, C. Optimal decision-making for green supply chain considering retailer’s fairness concern and risk aversion. J. Shandong Univ. (Nat. Sci.) 2018, 53, 12–29. (In Chinese) [Google Scholar]
Figure 1. Ecological product supply chain system.
Applsci 15 02462 g001
Figure 2. The impact of the cost-sharing contract coefficient on supply chain pricing and utility. (a)The wholesale price, market price, and ecological level. (b) The profit of the supplier, distributor, and supply chain.
Applsci 15 02462 g002
Figure 3. The influence of the development and operation subsidy coefficient on supply chain pricing and utility. (a) The wholesale price, market price, and ecological level. (b) The profit of the supplier, distributor and supply chain.
Applsci 15 02462 g003
Figure 4. The influence of suppliers’ eco-feeding apportionment coefficient on supply chain pricing and utility under the development and operation subsidy.(a) The wholesale price, market price, and ecological level. (b) The profit of the supplier, distributor, and supply chain.
Applsci 15 02462 g004
Figure 5. The influence of consumption subsidy price on supply chain pricing and utility. (a) The wholesale price, market price, and ecological level. (b) The profit of the supplier, distributor, and supply chain.
Applsci 15 02462 g005
Figure 6. The influence of the suppliers’ eco-feeding apportionment coefficient on supply chain pricing and utility under the consumption subsidy. (a) The wholesale price, market price, and ecological level. (b) The profit of the supplier, distributor, and supply chain.
Applsci 15 02462 g006
Figure 7. The impact of government subsidies on supply chain pricing. (a) The ecological level. (b) The total utility.
Applsci 15 02462 g007
Figure 8. The relationship between the subsidy price and the subsidy coefficient.
Applsci 15 02462 g008
Figure 9. The effect on the supply chain under the condition of a consistent subsidy amount. (a) The ecological level. (b) The utility of the supply chain.
Applsci 15 02462 g009
Table 1. Variable declaration of the model.
SymbolNameSymbolName
πSsupplier’s profitU(πS) supplier utility
πRdistributor’s profitU(πR) distributor utility
πTtotal profit of supply chainU(πT) supply chain utility
qmarket demand for ecological productsµcost coefficient of ecological conservation and restoration
apotential market size, a > 0rratio of suppliers sharing the ecological conservation and restoration cost
bcoefficient of sensitivity of price, b > 01 − rratio of distributors sharing the ecological conservation and restoration cost
kconsumer preferences of eco-products, k > 0δthe cost-sharing contract coefficient between supplier and distributor
θecological level of supply chain, θ > 0E(f) the total amount of operating subsidy for both supplier and distributor
wwholesale price of supplierfrate of subsidization based on ecological conservation and restoration cost of supplier and distributor, f ∈ (0,1)
pmarket price of distributorE(φ) the total amount of the consumption subsidy
ccost of eco-product production, pwcφsubsidized price for lowering each eco-product price in the market, φ > 0
Disclaimer/Publisher’s Note: The statements, opinions and data contained in all publications are solely those of the individual author(s) and contributor(s) and not of MDPI and/or the editor(s). MDPI and/or the editor(s) disclaim responsibility for any injury to people or property resulting from any ideas, methods, instructions or products referred to in the content.

