Abstract
Perishable goods have a limited shelf life, and inventory should be discarded once it exceeds its shelf life. Finding optimal inventory management policies is essential since inefficient policies can lead to increased waste and higher costs. While many previous studies assume the perishable inventory is processed following the First In, First Out rule, it does not reflect customer purchasing behavior. In practice, customers’ preferences are influenced by the shelf life and price of products. This study optimizes inventory and pricing policies for a perishable inventory management problem considering age-dependent probabilistic demand. However, introducing dynamic pricing significantly increases the complexity of the problem. To tackle this challenge, we propose eliminating irrational actions in dynamic programming without sacrificing optimality. To solve this problem more efficiently, we also implement a deep reinforcement learning algorithm, proximal policy optimization, to solve this problem. The results show that dynamic programming with action reduction achieved an average of 63.1% reduction in computation time compared to vanilla dynamic programming. In most cases, proximal policy optimization achieved an optimality gap of less than 10%. Sensitivity analysis of the demand model revealed a negative correlation between customer sensitivity to shelf lives or prices and total profits.
1. Introduction
The food and supermarket industry is one of the largest markets in the world. Fresh produce such as vegetables, fruits, meat, and dairy comprise a significant portion of the market. One of the main features of fresh foods is that they have a limited shelf life and can spoil quickly if not consumed within a certain period. The quality and freshness of these products decrease with time. They can no longer be sold once they expire, leading to financial losses for businesses and potential adverse environmental impacts. The Food and Agriculture Organization (FAO) estimates that about one-third of the food produced for human consumption is lost or wasted globally, amounting to approximately 1.3 billion tons per year [1]. In developed countries, 40% of fresh food is discarded before it is consumed [2]. A previous study [3] suggests that nearly one-quarter of the produced food supply is lost within the food supply chain. The production of wasted and lost food crops accounts for 24% of the freshwater resources used in food crop production, 23% of the world’s total agricultural land area, and 23% of the world’s total fertilizer usage. Food waste imposes a significant burden on the environment and leads to the waste of limited resources. Improving inventory management of perishable goods is a promising approach to reducing environmental impacts and food waste in food supply chains.
Inventory management aims to determine the optimal order quantity and timing to minimize costs and maximize profits [4]. Many previous studies assume that the First In, First Out (FIFO) or Last In, First Out (LIFO) rules are inventory rules in their inventory problems. The FIFO rule assumes that the oldest inventory items are sold first, while LIFO assumes that the newest items are sold first. However, these assumptions do not reflect customer purchasing behavior. Customers often choose products in retail stores based on products’ shelf life and price. When prices are the same, customers prefer to purchase products with a longer shelf life, as they can be consumed over a longer period. However, a discount on shorter-shelf-life products can stimulate demand. In this case, customers may choose to purchase products with a shorter shelf life as they are cheaper. Since good pricing policies can stimulate demand and reduce waste and opportunity loss, it is essential to consider the shelf life and prices of the products when determining inventory and pricing policies.
The pricing and inventory management problem for perishable products can be formulated as a Markov Decision Process (MDP). The actions involve determining the pricing and order quantity, the states represent the inventory status, and the reward signal is the total profit. The inventory status represents the quantity of perishable goods by their shelf life. For example, if the expiration period is three days and the lead time is one day, it can be represented as a four-dimensional vector. Consequently, the state space increases exponentially with the growth of the expiration period. This phenomenon is known as the “curse of dimensionality”, which significantly increases the computational time of exact methods, such as dynamic programming (DP), making them impractical. In recent years, various approximation methods have been proposed to address this issue, with reinforcement learning gaining particular attention as a promising solution.
This study addresses the dynamic pricing and inventory management problem using DP and Proximal Policy Optimization (PPO), a deep reinforcement learning (DRL) algorithm. We develop an inventory model considering customer purchasing behavior and positive lead time. The state in the inventory management problem refers to the inventory status, while the actions involve ordering quantities and pricing. The goal is to determine actions at each step to maximize total profit. The total costs include ordering, holding, opportunity loss, and waste. Furthermore, this study proposes an improved DP method. DP methods typically require calculating all state and action values within a defined action–state space, making it a near-exhaustive approach. To reduce this computational burden, the study proposes a method for eliminating irrational actions without losing optimality. In the numerical experiments, we compared the DP, DP with action reduction, and PPO algorithms. From the performance and computation time perspective, DP with action reduction achieved an average reduction of 63.1% in computation time. Also, PPO achieved an average reduction of 75.6% in computation time compared to DP, with an optimality gap of 10% or less in all cases except for one. The sensitivity analysis revealed that when customers are sensitive to shelf lives and prices, costs tend to be higher and sales lower. On the other hand, when price sensitivity is low, sales generally increase, leading to higher total profits.
The objective of this study is to develop efficient pricing and inventory management policies for perishable inventory considering customer purchasing behavior. This study makes several contributions to the current literature. First, it contributes to perishable inventory management by developing an inventory model considering customer purchasing behavior. Second, it introduces action reduction techniques in dynamic programming to reduce the computational time without sacrificing optimality. Finally, a deep reinforcement learning algorithm is implemented to solve the inventory management problem. We illustrate that the deep reinforcement learning algorithm can be a powerful tool for solving complex inventory management problems.
2. Related Works
2.1. Heuristic and Approximate Approaches
This subsection introduces studies using heuristic, approximation, or simulation-based approaches. Research focusing on pricing or inventory management problems for perishable goods often emphasizes customer demand models. For instance, Solari et al. [5] use a simulation-based approach to analyze an inventory management problem where the policy dynamically switches between FIFO and LIFO depending on the presence of discount strategies. Furthermore, Chen et al. [6] propose an adaptive approximation approach for an inventory management problem that incorporates a demand model dependent on the age of products. Similarly, Ding and Peng [7] introduce a mixed FIFO-LIFO demand model and design heuristics tailored for inventory management problems utilizing this model. Lu et al. [8] focus on developing optimal pricing strategies for perishable goods with age-dependent demand. Beyond demand models, other studies address critical factors such as lead time. For example, Chao et al. [9] propose an approximation approach for inventory management problems that explicitly account for lead time. Considering the diversity of demand patterns, as reflected in these studies, is crucial because customer preferences often render the assumption of FIFO consumption unrealistic in retail environments.
Moreover, while many studies assume zero lead time for simplicity, lead time is a significant factor that complicates inventory management problems and should be incorporated into the analysis. Next, studies addressing joint pricing and inventory management for perishable goods are introduced. Kaya and Ghahroodi [10] model and analyze pricing and inventory management problems for perishable goods with age- and price-dependent demand using DP. Fan et al. [11] employ DP to develop dynamic pricing strategies for multi-batch perishable goods and propose four heuristics. Vahdani and Sazvar [12] develop a mathematical model for pricing and inventory management of perishable goods that considers social learning, analyzing its structural properties.
Additionally, Zhang et al. [13] apply optimal control theory to derive optimal dynamic pricing and shipment consolidation policies across multiple stores. Rios and Vera [14] focus on developing optimal dynamic pricing and inventory management strategies for non-perishable goods, while Azadi et al. [15] address pricing and inventory replenishment policies specifically for perishable goods. Finally, Shi and You [16] construct a stochastic optimization model to devise optimal dynamic pricing and production control strategies for perishable goods. These studies collectively underscore the importance of accounting for diverse demand behaviors and operational constraints, such as lead time and product perishability, to develop robust and efficient inventory and pricing strategies.
2.2. Reinforcement Learning and Deep Reinforcement Learning Approaches
This part introduces studies that employ reinforcement learning (RL) and DRL approaches. Kastius and Schlosser [17] compare the performance of DQN and Soft Actor–Critic (SAC) in dynamic pricing problems within competitive environments. Alamdar and Seifi [18] propose a Deep Q-Learning (DQL)-based strategy for simultaneously determining pricing and order quantities for multiple substitute products. Similarly, Mohamadi et al. [19] present an Advantage Actor–Critic (A2C) algorithm for tackling inventory allocation problems in a two-echelon supply chain. Zheng et al. [20] propose a Q-learning algorithm for jointly determining pricing and inventory management strategies for perishable goods. Qiao et al. [21] apply Multi-Agent Reinforcement Learning (MARL) to pricing problems involving multiple products. Nomura et al. [22] use DQN and PPO to solve a perishable inventory management problem and compare their performance with the base stock policy. They show that DRL methods outperform the base stock policy and that PPO achieves the best performance. They also indicate that there might be a difficulty in applying DQN to problems with a large number of actions. These studies show that RL and DRL can handle more complex problems, making them suitable for addressing pricing and inventory management problems with realistic features added to traditional settings.
Research has also been conducted to improve the performance of DRL methods in inventory management problems. For instance, Selukar et al. [23] apply DRL to inventory management problems for perishable goods considering lead times. De Moor et al. [24] utilize DQN with reward shaping for perishable goods inventory management problems with lead times. Their approach achieves reductions in computation time. Yavuz and Kaya [25] propose a multinomial logit model for demand in pricing and inventory management problems for perishable goods and apply improved DQL and SAC to these settings. These studies employ various methods to solve pricing and inventory management problems. However, research applying DRL to pricing and inventory management problems for perishable goods is limited. However, only a few studies have focused on reducing the number of actions in exact solution methods. Also, these studies commonly assume zero lead time, which is unrealistic. Lead time increases the system’s state space, making it an essential factor. In this study, we apply DP, which reduces unreasonable actions, and PPO, a type of DRL algorithm, to the pricing and inventory management problem for perishable goods while considering lead time.
Overall, this literature review shows that many studies have addressed inventory management problems for perishable goods. The objective of inventory management is to minimize costs while maintaining service levels. Developing efficient inventory policies for perishable inventory systems can also contribute to reducing food waste and environmental impacts, which are significant issues in the food industry. Table 1 summarizes the studies on pricing and inventory management problems for perishable goods, organized by key elements.

Table 1.
Literature review summary.
3. Problem Description and Model Formulation
This section introduces the problem description, demand model, and model formulation of the inventory management problem. The perishable inventory management problem is formulated as a Markov Decision Process (MDP) problem. Table 2 presents the notation used in the inventory management problem.

Table 2.
Notation of inventory management problem.
3.1. Problem Description
This study focuses on perishable fresh products, such as fish and meat. Figure 1 illustrates the inventory status at time t. Using inventory age as an indicator to represent the number of days elapsed since stocking, denotes the inventory quantity with age j at time t. As shown in this figure, it is assumed that perishable products i with different shelf lives are displayed on the shelf simultaneously. represents a perishable product with an inventory age of days. Thus, perishable products with an inventory age of m or more are discarded, while other products with expiration periods of can be sold in the next period.
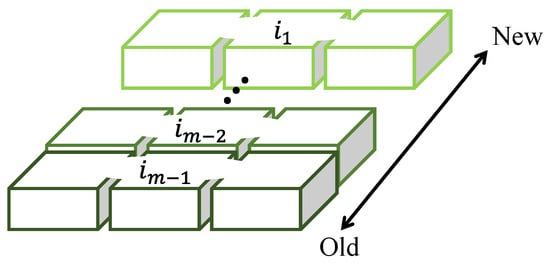
Figure 1.
A sales system for fresh products with different shelf lives.
This study considers a periodic reviewed, single-item, single-echelon inventory system with a positive lead time, perishable products, dynamic pricing, and uncertain and age-dependent demand. Order quantity and pricing for fresh items with each shelf life are determined based on the number of fresh items at each shelf life at the start of the period. The goal is to obtain an optimal policy for ordering and pricing that maximizes total profit across potential inventory states.
3.2. Demand Model
In the real world, demand fluctuations may be influenced by various factors, such as seasonal trends and brand preferences. This study examines how the trade-off between price and freshness influences customer purchasing behavior and its implications for optimal pricing and inventory policies. To keep the model simple and tractable, this study uses a multinomial logit model for demand. The multinomial logit (MNL) model [26] is a popular choice for demand modeling in the literature. In the model shown in Equation (1), the demand ratio for product with price relative to all fresh products on the shelf is obtained.
The parameter represents price sensitivity, indicating how responsive customers are to price changes. A higher results in larger changes in the demand ratio with price fluctuations, while a lower leads to smaller changes in the demand ratio with price fluctuations. Next, the total demand is distributed probabilistically to each product using Equation (2).
The inventory state is updated at the next time following Equation (3).
where represents .
As shown in Equation (4), unmet demand is determined.
As shown in Equation (5), sales are determined.
One of the key challenges in perishable inventory management is to make decisions under the uncertainty of demand. Demand forecasting is a well-known method to predict future demand based on historical data. While accurate forecasts can enhance inventory management, this study takes a different approach. Instead of focusing on forecasting, we model the decision problem under demand uncertainty as an MDP. By computing the state values within the MDP, we derive the optimal policy for perishable inventory management without explicitly forecasting demand.
3.3. Markov Decision Process (MDP)
This inventory management problem is a sequential decision-making problem with uncertainty. We can formulate the problem as an MDP. The state at any time t is defined as shown in Equation (6).
which includes the inventory levels for each shelf life and the inventory in transit . In other words, the state is represented as an -dimensional vector. Furthermore, the state at the next time step is represented in Equation (7).
The action at any time t is defined as shown in Equation (8).
which includes the order quantity and the prices for each shelf life. This study defines a pricing strategy as a discount choice, an m-dimensional discrete vector. The ordering incurs a unit ordering cost , the inventory carried over to the next time step incurs a unit holding cost , unmet demand incurs a unit lost sales penalty , and inventory that is discarded incurs a unit disposal cost . The total cost is expressed as the sum of these, as shown in Equation (9).
4. Approach to Perishable Inventory Management Problem
In this study, two algorithms are employed: DP and DRL. DP is an exact solution method. However, it suffers the issue of computational time increasing exponentially as the state space expands. On the other hand, DRL approximates the value function or policy in the problem using a neural network and performs computations by updating the network’s weights. Since the number of the units is significantly smaller than the state space, DRL enables the application of the algorithm to large-scale problems [27].
In recent years, various DRL algorithms, such as DQN, A2C, and PPO, have been proposed. Rather than conducting a comprehensive comparison of these methods, this study focuses on implementing PPO to address a novel perishable inventory management problem and contrasts its performance with our proposed exact solution method. Many studies have shown the effectiveness of PPO in solving inventory management problems [22,28,29].
4.1. Application of Proximal Policy Optimization
Reinforcement learning (RL) is a type of machine learning in which an agent learns a policy of actions by interacting with its environment. The objective of RL is to maximize the cumulative expected reward. The learning process typically follows the steps below:
- The agent observes the current state of the environment.
- Based on the policy , the agent selects an action .
- The environment provides a reward for the agent’s action and transitions to the next state .
- The agent uses the reward and state transition to update the policy or the value function , improving its policy over time.
DRL is a method that combines reinforcement learning with deep learning. Using neural networks to approximate policies and value functions enables DRL’s handling of complex and large-scale problems. PPO is one of the DRL methods proposed by Schulman et al. [30]. In PPO, the policy and value functions are approximated using neural networks. The goal of PPO is to maximize the objective function expressed as shown in Equation (11).
Here, and are coefficients, is the clipped surrogate objective function, represents the squared error loss , and S denotes the exploration entropy.
The surrogate objective function is defined as shown in Equation (12).
Here, is a hyper-parameter, is the advantage function, and is the importance sampling ratio, which is defined as shown in Equation (13). Additionally, is a function that clips x to the range .
Here, is the policy parameter before the update.
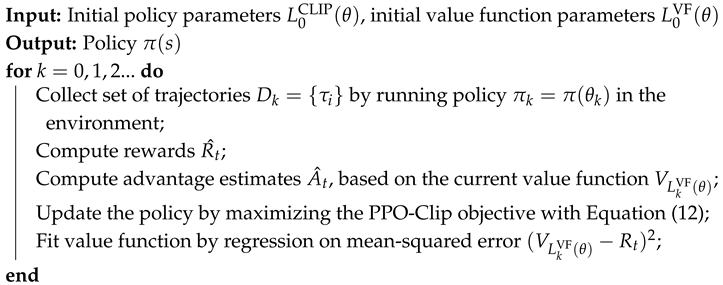
The algorithm for PPO is shown in Algorithm 1. The policy and value functions are updated iteratively by collecting trajectories, computing rewards, and estimating advantages. The policy is updated by maximizing the clipped surrogate objective function, and the value function is updated by regression on the mean-squared error.
| Algorithm 1: Proximal Policy Optimization |
 |
4.2. Action Reduction for Value Iteration
In this study, we use value iteration, a classic DP method, to solve MDP problems. Value iteration defines the value function for all states, representing the expected value of the state when following a given policy. First, the value function is updated for all states, as shown in Equation (14).
Here, represents the reward obtained when taking action in state , is the discount factor, and denotes the probability of transitioning to the next state when taking action in state . As shown in Equation (15), the update process continues until the difference between the old value function and the new value function becomes less than .
Once the updates are complete, the value function is used to update the policy , as shown in Equation (16), to obtain the optimal policy.
In the value iteration method of DP, computation time increases as the size of the state–action space grows because each action’s value should be evaluated. Therefore, this study reduces computation time by eliminating irrational actions. Irrational actions refer to pricing strategies where fresher items with longer shelf lives are priced lower than older items with shorter shelf lives. In other words, actions where the discount for items with longer shelf lives is larger, as shown in Equation (17), are targeted for reduction.
Let A be the set of all actions and be the set of actions available in state s. An action is an element of A. We define as the set of irrational actions to be eliminated, where .
The algorithm for value iteration with action reduction is presented in Algorithm 2.
| Algorithm 2: Value Iteration with Action Reduction |
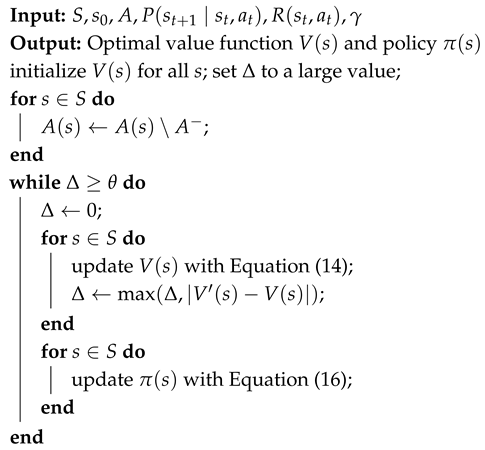 |
This study refers to this method as ar-DP. As shown in Algorithm 2, when the action space is given, irrational actions within the action space are reduced using Equation (17). The actions that are eliminated, as mentioned earlier, are those where products with longer shelf lives are given a larger discount than those with shorter shelf lives. When such actions are selected, demand is heavily skewed toward the longer-shelf-life products, leading to an increase in unsold shorter-shelf-life products and a rise in waste. Thus, the optimal actions exclude these, as they result in a decrease in sales due to price reductions on fresh products that are easier to sell due to their longer shelf lives, along with the increased waste costs. As a result, this method is expected to reduce computation time while maintaining the optimality of the solution.
5. Numerical Experiments
The experiments include case studies using three algorithms: DP, DP with action reduction (ar-DP), and PPO. They aim to compare the algorithms’ performances. In addition, a sensitivity analysis of the problem using DP was conducted.
These experiments aim to address the following questions:
- How does action reduction affect computation time?
- How does PPO perform compared to DP in terms of computation time and total profit?
- How does a change in price sensitivity impact costs?
For the experiments addressing questions 1 and 2, we compared the performance of DP, ar-DP, and PPO in terms of computation time and total profit. Different parameters of the inventory management problem were used to evaluate the algorithms. For the experiment addressing question 3, we conducted a sensitivity analysis using DP. Case studies were conducted using varying price sensitivity, and comparisons were made in terms of total profit and the breakdown of various costs.
5.1. Experimental Conditions
The experiments were conducted using Python 3.8.10 on a computer with an Intel Core i7-11390H CPU and 16 GB of RAM. The algorithms were implemented using the Stable-Baselines3 library for PPO and custom code for DP and ar-DP.
5.2. Experimental Settings
We conducted case studies in this study using varying price sensitivity and costs. The lead time , expiration period , maximum order quantity , and the regular price of the product remain consistent across all cases. Additionally, based on study [24], the demand follows a gamma distribution with a mean and a coefficient of variation . The holding cost , ordering cost , lost sales penalty , and perishable cost were also set. Price setting is determined by selecting one of the discount rates . For example, selecting 30 changes the product price from 10 to 7. Price sensitivity is defined for each remaining shelf life, and since the expiration period is three days, it is represented as a three-dimensional vector. Table 3 presents the baseline parameter settings.

Table 3.
Basic parameter settings.
Table 4 shows the parameter settings with varying price sensitivity and costs. Case 1 is the baseline case, and Cases 2 to 4 vary the price sensitivity. Cases 5 to 7 vary the costs.

Table 4.
Case study parameter settings.
In this experiment, 365 steps constitute one episode, and performance is evaluated based on the total profit of an episode. The total profit is defined as the total revenue minus the total cost. Additionally, the optimality gap is calculated using the results from DP as the optimal solution and the values obtained solely from PPO. It is computed using Equation (18).
The parameter settings for PPO used in this experiment are shown in Table 5. Since PPO demonstrates stable performance with minimal impact from parameter settings, all experiments were conducted using the same parameter configuration.

Table 5.
Parameter settings for PPO.
5.3. Analysis of Performance of DP, ar-DP, and PPO
5.3.1. Comparison Based on Computation Time
We compare the computation times of PPO, DP, and ar-DP. Table 6 shows the computation times for Cases 1 to 7.

Table 6.
Comparison of computation times for DP, ar-DP, and PPO in seconds.
In Cases 1 to 4, where price sensitivity was varied, ar-DP achieved an average computation time reduction of 558 s compared to DP. Additionally, PPO achieved an average reduction of 89 s compared to ar-DP. In Cases 1 and 5 to 7, where costs were varied, ar-DP achieved an average computation time reduction of 397 s compared to PPO. Moreover, PPO achieved an average reduction of 74 s compared to ar-DP.
5.3.2. Optimality Gap Analysis
We analyze the optimality gap of the three algorithms. Table 7 shows the optimality gap for Cases 1 to 7. The optimality gap of DP and ar-DP is 0% in all cases. The optimality gap of PPO is below 10% in all cases except Case 4. In Cases 1, 2, and 3, the optimality gap is less than 1%.

Table 7.
Comparison of the performance for DP and PPO.
5.3.3. Evaluation of PPO Algorithm
To comprehensively evaluate the PPO algorithm, we analyze the learning curves of PPO for Cases 1 to 7. The optimal results obtained by DP are also shown for comparison. Figure 2a,b show the learning curves for Cases 1 to 4, and Figure 3a–c show the learning curves for Cases 5 to 7. The vertical axis represents the reward value, which corresponds to the total profit, and the horizontal axis represents the number of episodes. The blue line indicates the average value achieved by PPO, and the red dashed line represents the optimal value obtained by DP.
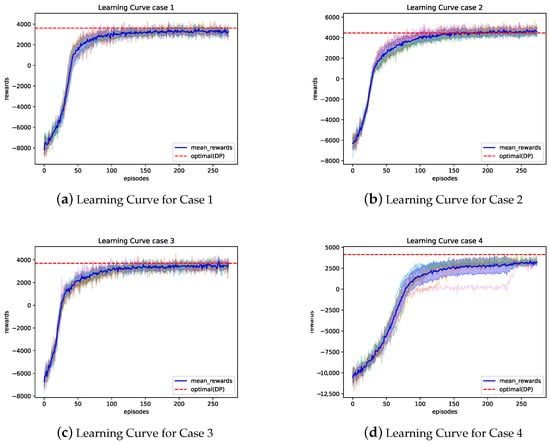
Figure 2.
Learning curves for Cases 1 to 4.
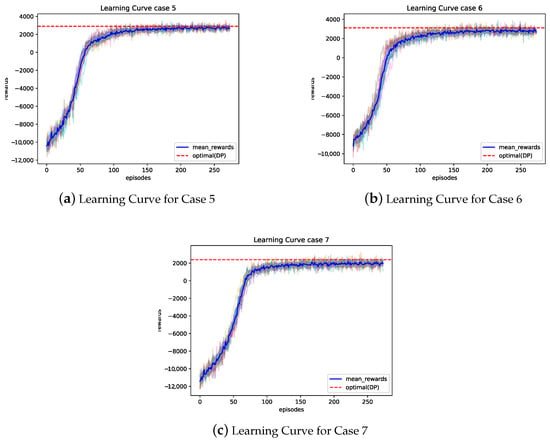
Figure 3.
Learning curves for Cases 5 to 7.
Figure 2a–d show the learning curves of PPO for Cases 1 to 4. The vertical axis of the figure represents the reward value, which corresponds to the total profit, while the horizontal axis represents the number of episodes. The blue line indicates the average value achieved by PPO, and the red dashed line represents the optimal value obtained by DP. Convergence was observed in all cases between 100 and 150 episodes. Cases 1 to 3 showed values close to the optimal, whereas Case 4 converged to a local solution.
Figure 3a–c show the learning curves of PPO for Cases 5 to 7. In these cases, convergence was also observed between 100 and 150 episodes. It is noted that when the optimal solution is poorer, as in Case 7 compared to other cases, the optimality gap of PPO tends to increase slightly.
Based on the results, the following observations can be made:
- In cases such as Case 4, where price sensitivity is generally high, demand tends to concentrate on products at specific price points. This leads to a monotonic pattern in state transitions, limiting the information available for PPO to learn effectively and increasing the likelihood of converging to a local solution.
- In cases such as Case 7, where costs are high, even slight policy differences result in significant cost variations. This makes the optimality gap larger.
To further evaluate the PPO algorithm, we investigated the computation time for problems with different dimensions. Figure 4 shows the computation time of PPO for problems with a lead time of 1 day and shelf lives of 3, 4, and 5 days, corresponding to 4-, 5-, and 6-dimensional problems.
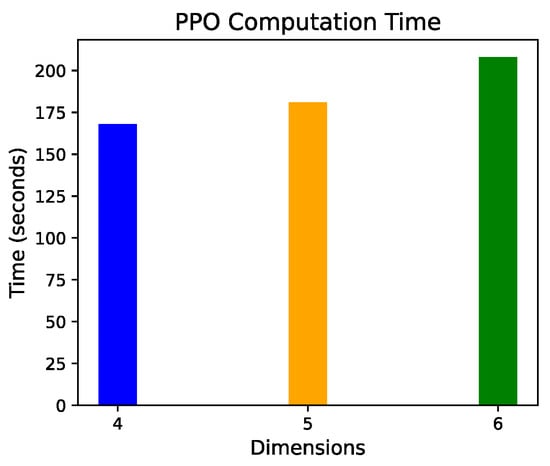
Figure 4.
Computation time of PPO for each dimension.
It was observed that the computation time increased as the dimension increased. The reason for this is that with an increase in the number of dimensions, the state space expands, leading to an increase in the computation time for simulation and learning. However, the computation time for PPO remained within a reasonable range, even for problems with a higher dimension. This indicates that PPO is suitable for solving large-scale problems.
5.4. Sensitivity Analysis
In Cases 1 to 4, where price sensitivity was varied, the breakdown of the four types of costs for the optimal solution obtained using DP is shown in Figure 5a–d.
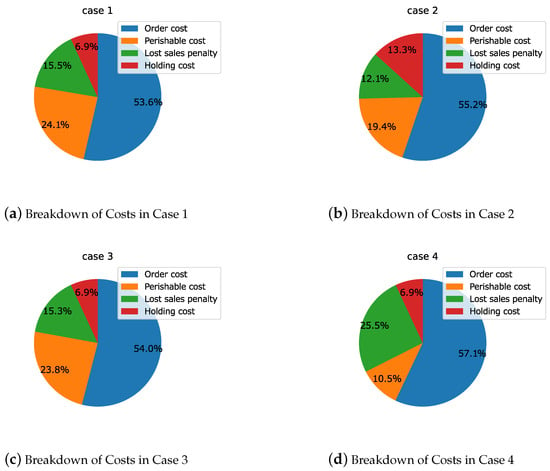
Figure 5.
Breakdown of costs in Cases 1 to 4.
A sensitivity analysis of the model was conducted based on the results of Case 1. In Case 2, where price sensitivity is low, customer demand is less influenced by price, making it easier to sell at the standard price across all periods. As a result, inventory levels increase, and the proportion of holding costs rises by an average of 6.4%. In Case 3, where price sensitivity is high and the differences between periods are large, the results were almost the same as those in Case 1. In Case 4, where price sensitivity is high and the differences between periods are small, customer demand for all inventory is highly sensitive to price. Consequently, adjusting sales volume through pricing becomes easier, leading to a reduction in the proportion of waste, with an average decrease of 11.9%.
In the numerical experiments with varying price sensitivity, when price sensitivity is low, customer demand is less affected by price and time periods, suggesting that sales can remain stable even without discounts. The breakdown of costs in this case indicates that, in a stable selling environment conducive to generating profits, order quantities increase, and the proportion of ordering and holding costs becomes relatively large. On the other hand, when price sensitivity is high and there are significant differences between time periods, changes in customer demand vary greatly from period to period, making pricing more difficult and leading to an increase in costs. Additionally, when price sensitivity is high but the differences between time periods are small, inventory sales for specific periods become easier through price setting, which can lead to cost reductions. From the cost breakdown in this case, it is evident that a reduction in unsold inventory is possible, which decreases the amount of stock that is spoiled.
The insights from the sensitivity analysis conducted by varying price sensitivity are summarized below. When customers’ price sensitivity is low, stable sales can be achieved even at the standard price. In such cases, it becomes easier to increase profits, leading to a tendency for order quantities to rise. However, this also increases ordering and holding costs. On the other hand, when price sensitivity is high and there are significant differences between periods, pricing becomes more challenging, which contributes to an overall increase in costs. Conversely, if price sensitivity is high but the differences between periods are small, it becomes possible to sell inventory for specific periods through strategic price setting. This can lead to cost reduction by minimizing waste.
6. Conclusions
This study proposed DP with action reduction and PPO to an inventory management model that considers dynamic pricing and ordering policies. First, we formulated the perishable inventory management problem with price-sensitive demand as an MDP problem. Then, we implemented PPO and DP with action reduction to solve the problem. The proposed DP method can find the optimal policy for this problem without loss of optimality. In addition, the PPO algorithm uses neural networks to approximate the value function and policy. We conducted numerical experiments to compare the performance of DP, ar-DP, and PPO. The experiments revealed that ar-DP reduced computation time by 63.1% on average compared to DP. Additionally, PPO achieved an optimality gap of less than 10% in all cases except one, with an average computation time reduction of 75.6% compared to DP. The sensitivity analysis through numerical experiments, where price sensitivity was varied, shows that when customers are sensitive to shelf lives and prices, costs tend to be higher and sales lower. On the other hand, when price sensitivity is low, sales tend to increase on average, and total profit tends to be higher.
Several limitations and future research directions of the present study should be noted. First, the demand model used in this study focused on how price sensitivity and shelf life affect customer demand. Future research should explore more complex non-stationary demand models that consider other factors, such as seasonality, promotions, and brand preferences. Also, examining the stability of the proposed method under various demand models is an important research direction. Second, this study focused on stationary costs. Future research should consider time-varying costs, such as holding costs that change with the season or ordering costs that vary with the number of orders. This will allow for a more accurate representation of real-world inventory management problems. Third, this study only uses PPO as a reinforcement learning algorithm. Future research should investigate the performance of other advanced DRL algorithms in solving perishable inventory management problems.
Author Contributions
Conceptualization, Y.N., Z.L. and T.N.; methodology, Y.N., Z.L. and T.N.; software, Y.N.; validation, Y.N., Z.L. and T.N.; formal analysis, Y.N., Z.L. and T.N.; investigation, Y.N., Z.L. and T.N.; resources, Y.N., Z.L. and T.N.; data curation, Y.N. and Z.L.; writing—original draft preparation, Y.N.; writing—review and editing, Y.N., Z.L. and T.N.; visualization, Y.N. and Z.L.; supervision, Z.L. and T.N.; project administration, Z.L. and T.N.; funding acquisition, Z.L. and T.N. All authors have read and agreed to the published version of the manuscript.
Funding
This work was supported by JSPS KAKENHI Grant Numbers JP22H01714, JP23K13514.
Institutional Review Board Statement
Not applicable.
Informed Consent Statement
Not applicable.
Data Availability Statement
The raw data supporting the conclusions of this article will be made available by the authors on request.
Conflicts of Interest
The authors declare no conflicts of interest.
References
- FAO. Global food losses and food waste—Extent, causes and prevention. In SAVE FOOD: An Initiative on Food Loss and Waste Reduction; FAO: Rome, Italy, 2011; Volume 9. [Google Scholar]
- Kayikci, Y.; Demir, S.; Mangla, S.K.; Subramanian, N.; Koc, B. Data-driven optimal dynamic pricing strategy for reducing perishable food waste at retailers. J. Clean. Prod. 2022, 344, 131068. [Google Scholar] [CrossRef]
- Kummu, M.; de Moel, H.; Porkka, M.; Siebert, S.; Varis, O.; Ward, P. Lost food, wasted resources: Global food supply chain losses and their impacts on freshwater, cropland, and fertiliser use. Sci. Total. Environ. 2012, 438, 477–489. [Google Scholar] [CrossRef] [PubMed]
- You, F.; Grossmann, I.E. Mixed-integer nonlinear programming models and algorithms for large-scale supply chain design with stochastic inventory management. Ind. Eng. Chem. Res. 2008, 47, 7802–7817. [Google Scholar] [CrossRef]
- Solari, F.; Lysova, N.; Bocelli, M.; Volpi, A.; Montanari, R. Perishable Product Inventory Management In The Case Of Discount Policies And Price-Sensitive Demand: Discrete Time Simulation And Sensitivity Analysis. Procedia Comput. Sci. 2024, 232, 1233–1241. [Google Scholar] [CrossRef]
- Chen, S.; Li, Y.; Yang, Y.; Zhou, W. Managing perishable inventory systems with age-differentiated demand. Prod. Oper. Manag. 2021, 30, 3784–3799. [Google Scholar] [CrossRef]
- Ding, J.; Peng, Z. Heuristics for perishable inventory systems under mixture issuance policies. Omega 2024, 126, 103078. [Google Scholar] [CrossRef]
- Lu, J.; Zhang, J.; Lu, F.; Tang, W. Optimal pricing on an age-specific inventory system for perishable items. Oper. Res. 2020, 20, 605–625. [Google Scholar] [CrossRef]
- Chao, X.; Gong, X.; Shi, C.; Yang, C.; Zhang, H.; Zhou, S.X. Approximation algorithms for capacitated perishable inventory systems with positive lead times. Manag. Sci. 2018, 64, 5038–5061. [Google Scholar] [CrossRef]
- Kaya, O.; Ghahroodi, S.R. Inventory control and pricing for perishable products under age and price dependent stochastic demand. Math. Methods Oper. Res. 2018, 88, 1–35. [Google Scholar] [CrossRef]
- Fan, T.; Xu, C.; Tao, F. Dynamic pricing and replenishment policy for fresh produce. Comput. Ind. Eng. 2020, 139, 106127. [Google Scholar] [CrossRef]
- Vahdani, M.; Sazvar, Z. Coordinated inventory control and pricing policies for online retailers with perishable products in the presence of social learning. Comput. Ind. Eng. 2022, 168, 108093. [Google Scholar] [CrossRef]
- Zhang, J.; Lu, J.; Zhu, G. Optimal shipment consolidation and dynamic pricing policies for perishable items. J. Oper. Res. Soc. 2023, 74, 719–735. [Google Scholar] [CrossRef]
- Rios, J.H.; Vera, J.R. Dynamic pricing and inventory control for multiple products in a retail chain. Comput. Ind. Eng. 2023, 177, 109065. [Google Scholar] [CrossRef]
- Azadi, Z.; Eksioglu, S.D.; Eksioglu, B.; Palak, G. Stochastic optimization models for joint pricing and inventory replenishment of perishable products. Comput. Ind. Eng. 2019, 127, 625–642. [Google Scholar] [CrossRef]
- Shi, R.; You, C. Dynamic pricing and production control for perishable products under uncertain environment. Fuzzy Optim. Decis. Mak. 2022, 22, 359–386. [Google Scholar] [CrossRef]
- Kastius, A.; Schlosser, R. Dynamic pricing under competition using reinforcement learning. J. Revenue Pricing Manag. 2021, 21, 50–63. [Google Scholar] [CrossRef]
- Alamdar, P.F.; Seifi, A. A deep Q-learning approach to optimize ordering and dynamic pricing decisions in the presence of strategic customers. Int. J. Prod. Econ. 2024, 269, 109154. [Google Scholar] [CrossRef]
- Mohamadi, N.; Niaki, S.T.A.; Taher, M.; Shavandi, A. An application of deep reinforcement learning and vendor-managed inventory in perishable supply chain management. Eng. Appl. Artif. Intell. 2024, 127, 107403. [Google Scholar] [CrossRef]
- Zheng, J.; Gan, Y.; Liang, Y.; Jiang, Q.; Chang, J. Joint Strategy of Dynamic Ordering and Pricing for Competing Perishables with Q-Learning Algorithm. Wirel. Commun. Mob. Comput. 2021, 2021, 6643195. [Google Scholar] [CrossRef]
- Qiao, W.; Huang, M.; Gao, Z.; Wang, X. Distributed dynamic pricing of multiple perishable products using multi-agent reinforcement learning. Expert Syst. Appl. 2024, 237, 121252. [Google Scholar] [CrossRef]
- Nomura, Y.; Liu, Z.; Nishi, T. Deep reinforcement learning for perishable inventory optimization problem. In Proceedings of the 2023 IEEE International Conference on Industrial Engineering and Engineering Management (IEEM), Singapore, 18–21 December 2023; pp. 0370–0374. [Google Scholar]
- Selukar, M.; Jain, P.; Kumar, T. Inventory control of multiple perishable goods using deep reinforcement learning for sustainable environment. Sustain. Energy Technol. Assessments 2022, 52, 102038. [Google Scholar] [CrossRef]
- De Moor, B.J.; Gijsbrechts, J.; Boute, R.N. Reward shaping to improve the performance of deep reinforcement learning in perishable inventory management. Eur. J. Oper. Res. 2022, 301, 535–545. [Google Scholar] [CrossRef]
- Yavuz, T.; Kaya, O. Deep Reinforcement Learning Algorithms for Dynamic Pricing and Inventory Management of Perishable Products. Appl. Soft Comput. 2024, 163, 111864. [Google Scholar] [CrossRef]
- Phillips, R.L. Pricing and Revenue Optimization; Stanford University Press: Redwood City, CA, USA, 2021. [Google Scholar]
- Sutton, R.S.; Barto, A.G. Reinforcement Learning: An Introduction; A Bradford Book: Cambridge, MA, USA, 2018. [Google Scholar]
- Vanvuchelen, N.; Gijsbrechts, J.; Boute, R. Use of proximal policy optimization for the joint replenishment problem. Comput. Ind. 2020, 119, 103239. [Google Scholar] [CrossRef]
- Liu, Z.; Nishi, T. Inventory control with lateral transshipment using proximal policy optimization. In Proceedings of the 2023 5th International Conference on Data-driven Optimization of Complex Systems (DOCS), Tianjin, China, 22–24 September 2023; pp. 1–6. [Google Scholar]
- Schulman, J.; Wolski, F.; Dhariwal, P.; Radford, A.; Klimov, O. Proximal policy optimization algorithms. arXiv 2017, arXiv:1707.06347. [Google Scholar]
Disclaimer/Publisher’s Note: The statements, opinions and data contained in all publications are solely those of the individual author(s) and contributor(s) and not of MDPI and/or the editor(s). MDPI and/or the editor(s) disclaim responsibility for any injury to people or property resulting from any ideas, methods, instructions or products referred to in the content. |
© 2025 by the authors. Licensee MDPI, Basel, Switzerland. This article is an open access article distributed under the terms and conditions of the Creative Commons Attribution (CC BY) license (https://creativecommons.org/licenses/by/4.0/).