Article

Predicting the Unsaturated Hydraulic Conductivity of Compacted Polyurethane–Clay Using the Filter Paper Method

Department of Civil Engineering, De La Salle University, Manila 1004, Philippines
*
Author to whom correspondence should be addressed.
Appl. Sci. 2025, 15(5), 2411; https://doi.org/10.3390/app15052411
Submission received: 8 January 2025 / Revised: 10 February 2025 / Accepted: 20 February 2025 / Published: 24 February 2025

Abstract

:

Featured Application

The findings of this study establish the behavior of sanitary landfill cover materials, such as compacted clay and compacted polyurethane–clay, in unsaturated conditions under several wet–dry cycles, which would aid in predicting the performance of the material under varying environmental conditions. By predicting the unsaturated hydraulic conductivity and understanding the effects of environmental stresses, the findings can aid in the design and implementation of more durable and efficient landfill liners and covers.

Abstract

Sanitary landfill covers are exposed to varying environmental conditions; hence, the state of the clay layer also changes from saturated to unsaturated. The study aimed to predict the unsaturated hydraulic conductivity of the locally available compacted clay and clay with polyurethane to determine their behavior as they change from wet to dry using matric suction and empirical models proposed through other studies. The specimens underwent three wet–dry cycles wherein the matric suction was determined for several moisture content levels as the specimen dried using the filter paper method or ASTM D5298. The results showed that the factors affecting the soil structure, such as grain size difference between clay and polyurethane–clay, varying initial void ratios, and degradation of the soil structure due to the wet–dry cycles, did not affect the matric suction at the higher suction range; however, these factors had an effect at the lower suction range. The matric suction obtained was then used to establish the best fit water retention curve (WRC) or the relationship between the matric suction and moisture content. The WRC was used to predict the unsaturated hydraulic conductivity and observe the soil–water interaction. The study also observed that the predicted unsaturated hydraulic conductivity decreases as the compacted specimen moves to a drier state.

1. Introduction

Sanitary landfills (SLFs) are designed, constructed, operated, and maintained disposal facilities with control over the potential environmental impacts of their development and operation [1]. Landfilling was practiced for centuries, and initially, it was believed that the soil purified the leachate from the waste; however, several studies have shown that unregulated SLFs contaminate the groundwater [1]. Thus, SLFs are lined with impermeable layers to prevent the infiltration of harmful substances that come from the degradation of solid wastes into the surrounding soil. Furthermore, impermeable SLF covers prevent the increase in leachate volume due to the inflow of surrounding water into the SLF. Hence, proper design of a SLF cover is imperative to avoid large-scale environmental pollution due to improper practices, such as improper management of secondary leachate, which would lead to leachate leakage [2].
The low-permeability cover system may be composed of compacted clay, geomembranes, geotextiles, geosynthetic clay, geonets, or a combination of these materials. Among these materials, clay is the most abundant and most accessible. The effectiveness of these cover layers depends heavily on their hydraulic conductivity, which governs the movement of water and contaminants through the soil. The required hydraulic conductivity of a final cover in the United States is less than or equal to the hydraulic conductivity of the bottom liner or not greater than 10−5 cm/s, whichever is lower [3]. Despite advancements in technologies, there remain challenges in ensuring the durability of clay covers and functionality over time, particularly under varying environmental conditions, such as wet–dry cycles. Hence, to establish complete flow models for unsaturated soils, it is imperative to analyze the water retention behavior together with the unsaturated hydraulic conductivity [4,5].
In unsaturated soil, water is subjected to matric suction due to the physical affinity between the soil particle surfaces, capillary pores, and water [6]. In addition, uniform matric suction indicates that the soil is at equilibrium; hence, no moving force acts on the soil. However, if the matric suction is not uniform, water will flow spontaneously to where the matric suction is higher to equilibrate the potential. The pores of saturated soils are filled with water; thus, the water phase in this state is continuous, and the conductivity is at its maximum [6]. On the other hand, pores are filled with air in unsaturated soils; hence, the conductive portion of the soil’s cross-sectional area diminishes [
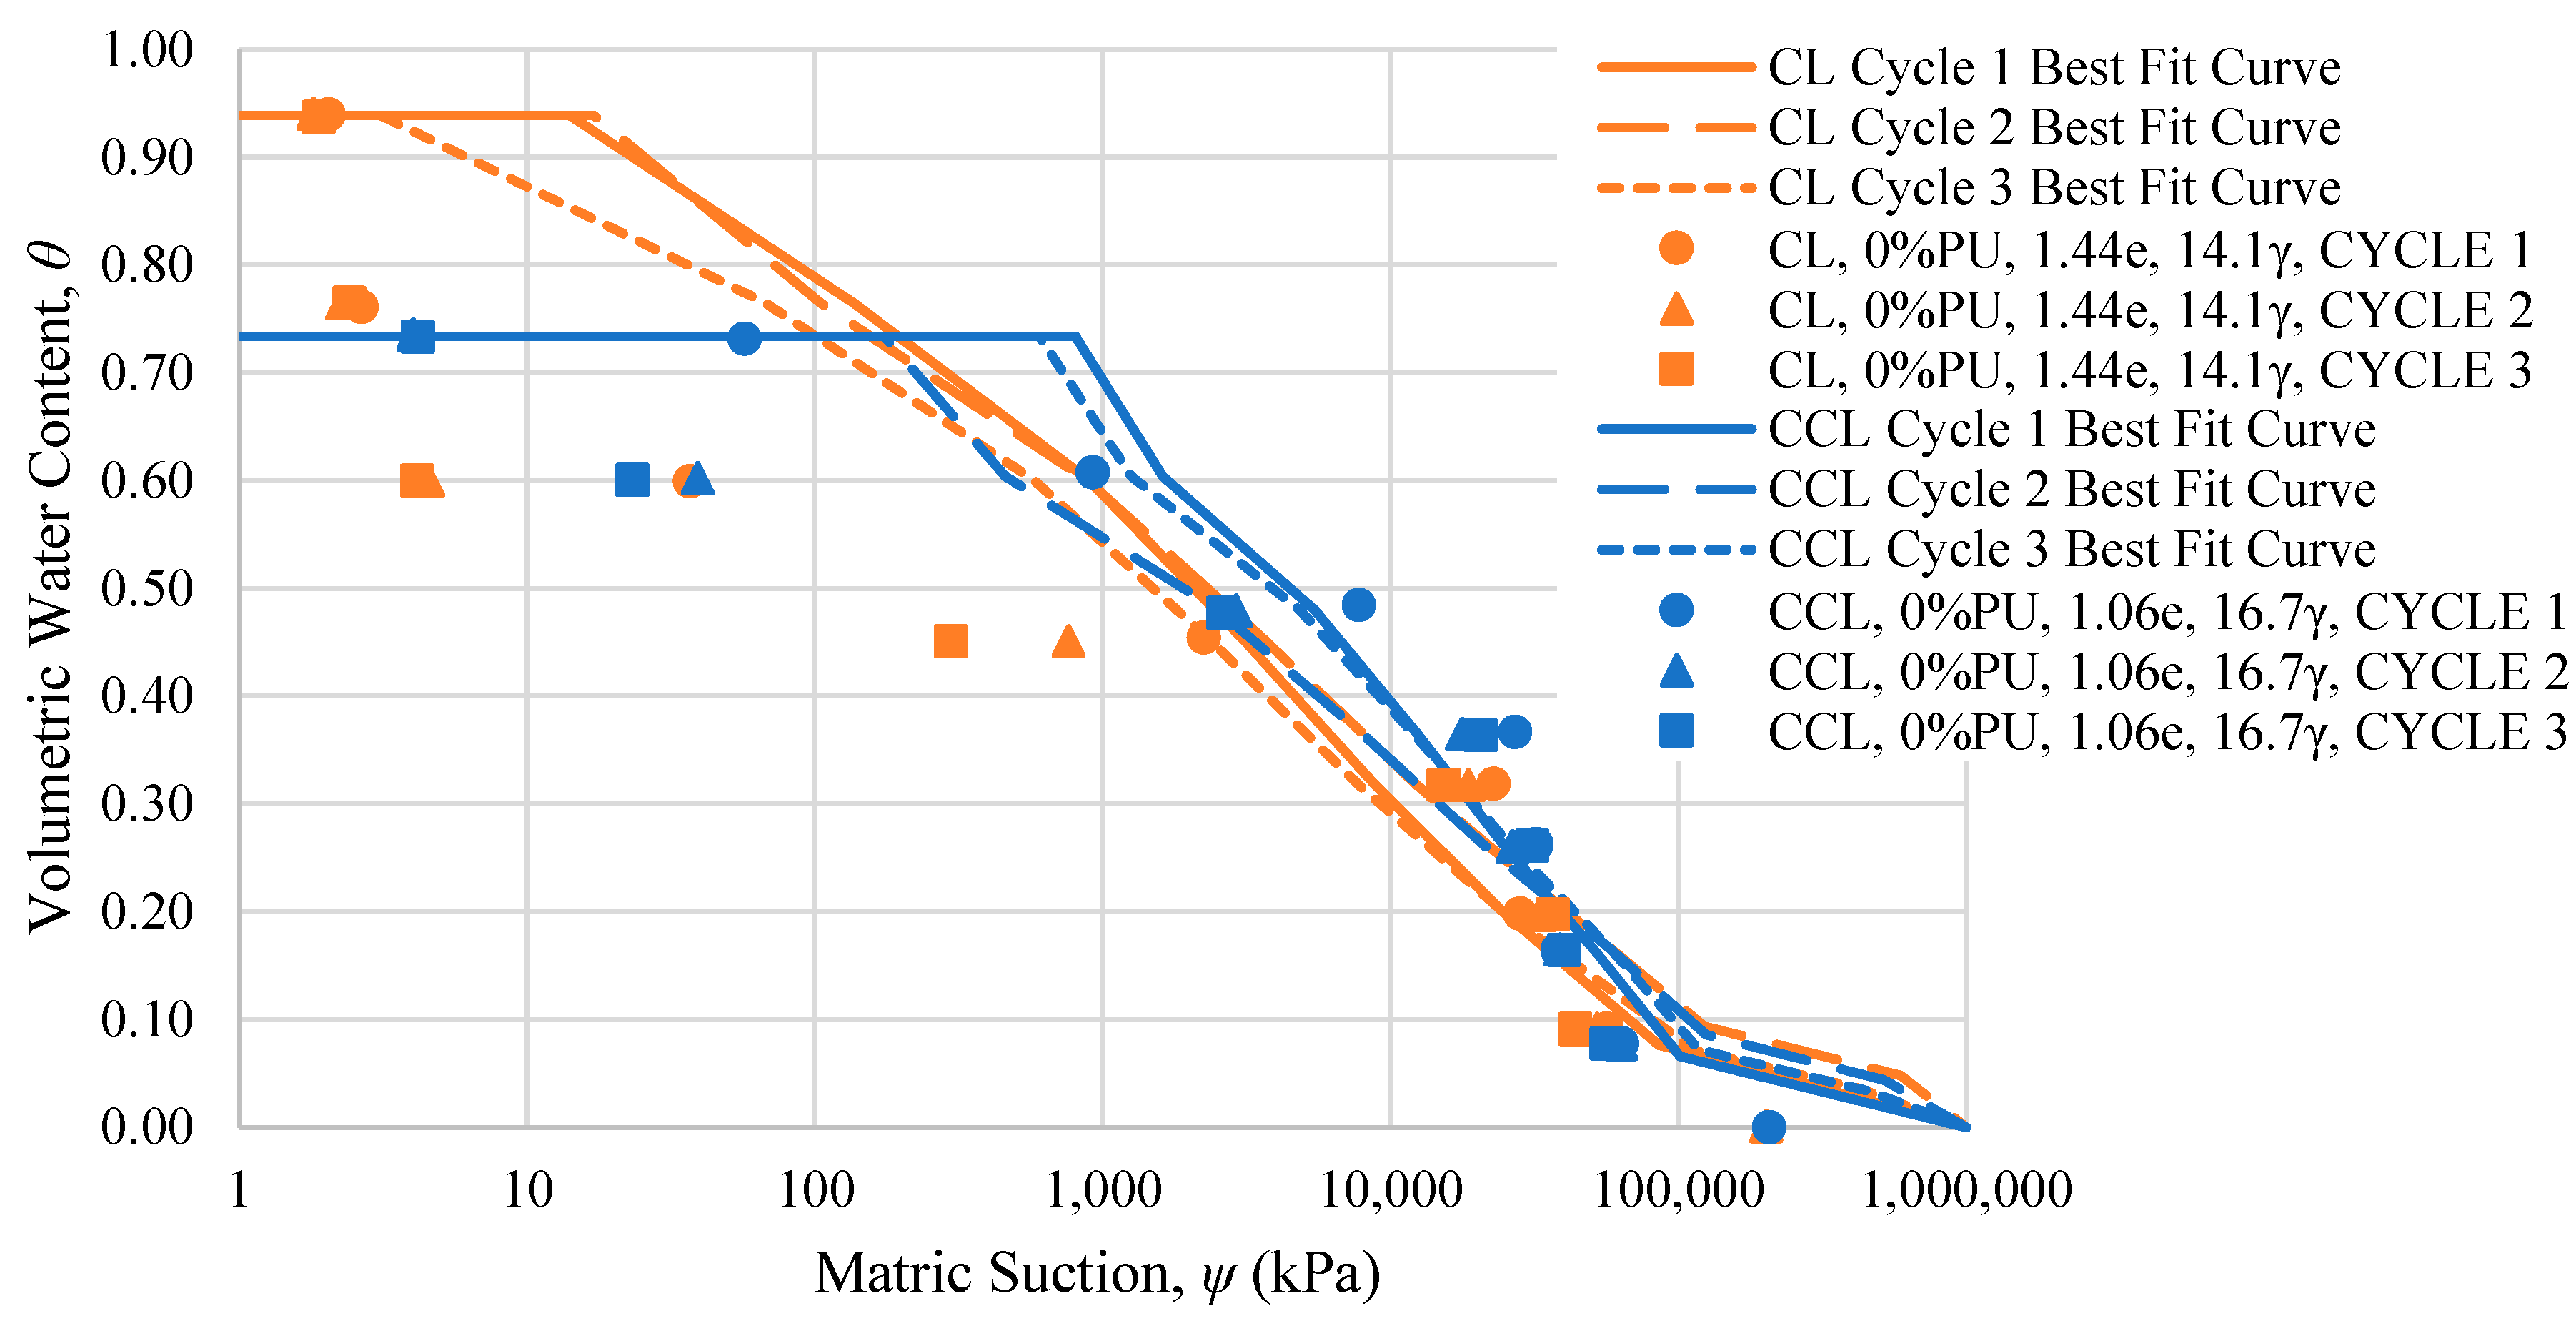
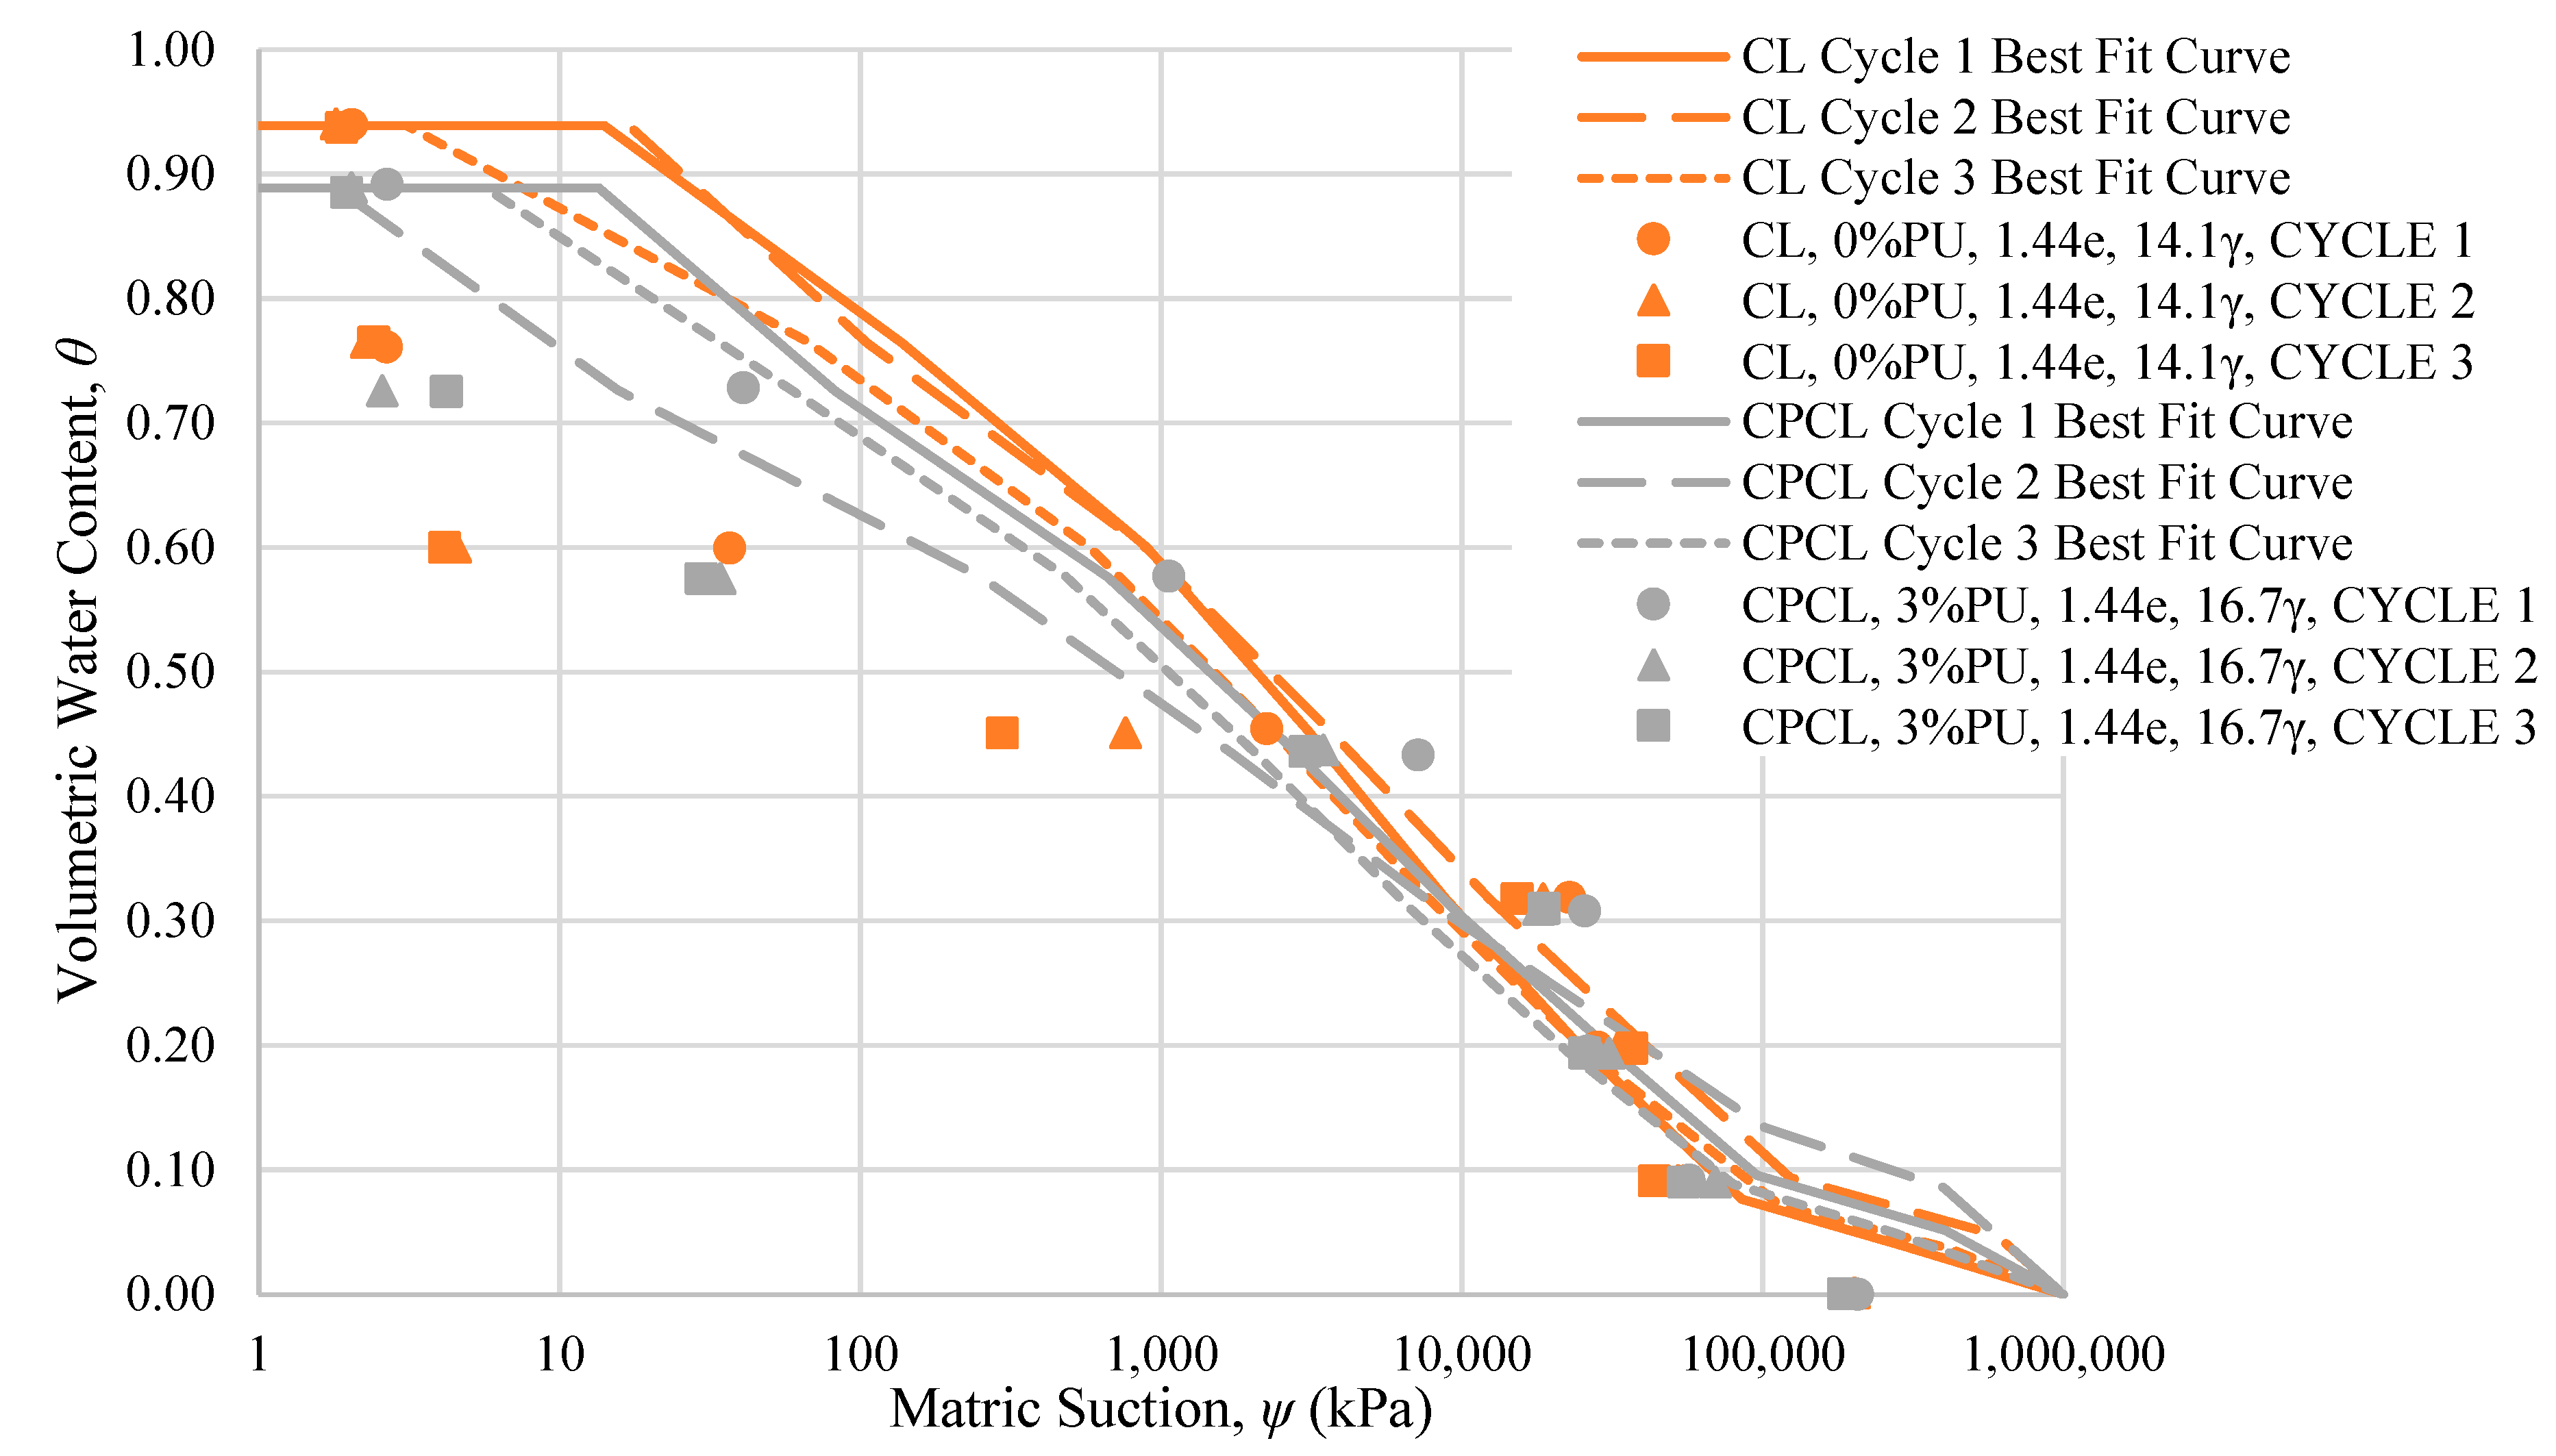
4]. Thus, the matric suction may be analyzed using the corresponding moisture content of the soil specimens. This analysis determines the water retention curve (WRC) or the relationship between matric suction and moisture content. The WRC shows the ability of the soil to maintain its stability relative to the change in matric suction [7]. It is also a measure of the amount of water stored in the pores of the soil at a given suction, and it describes the mechanical behavior of unsaturated soil [7,
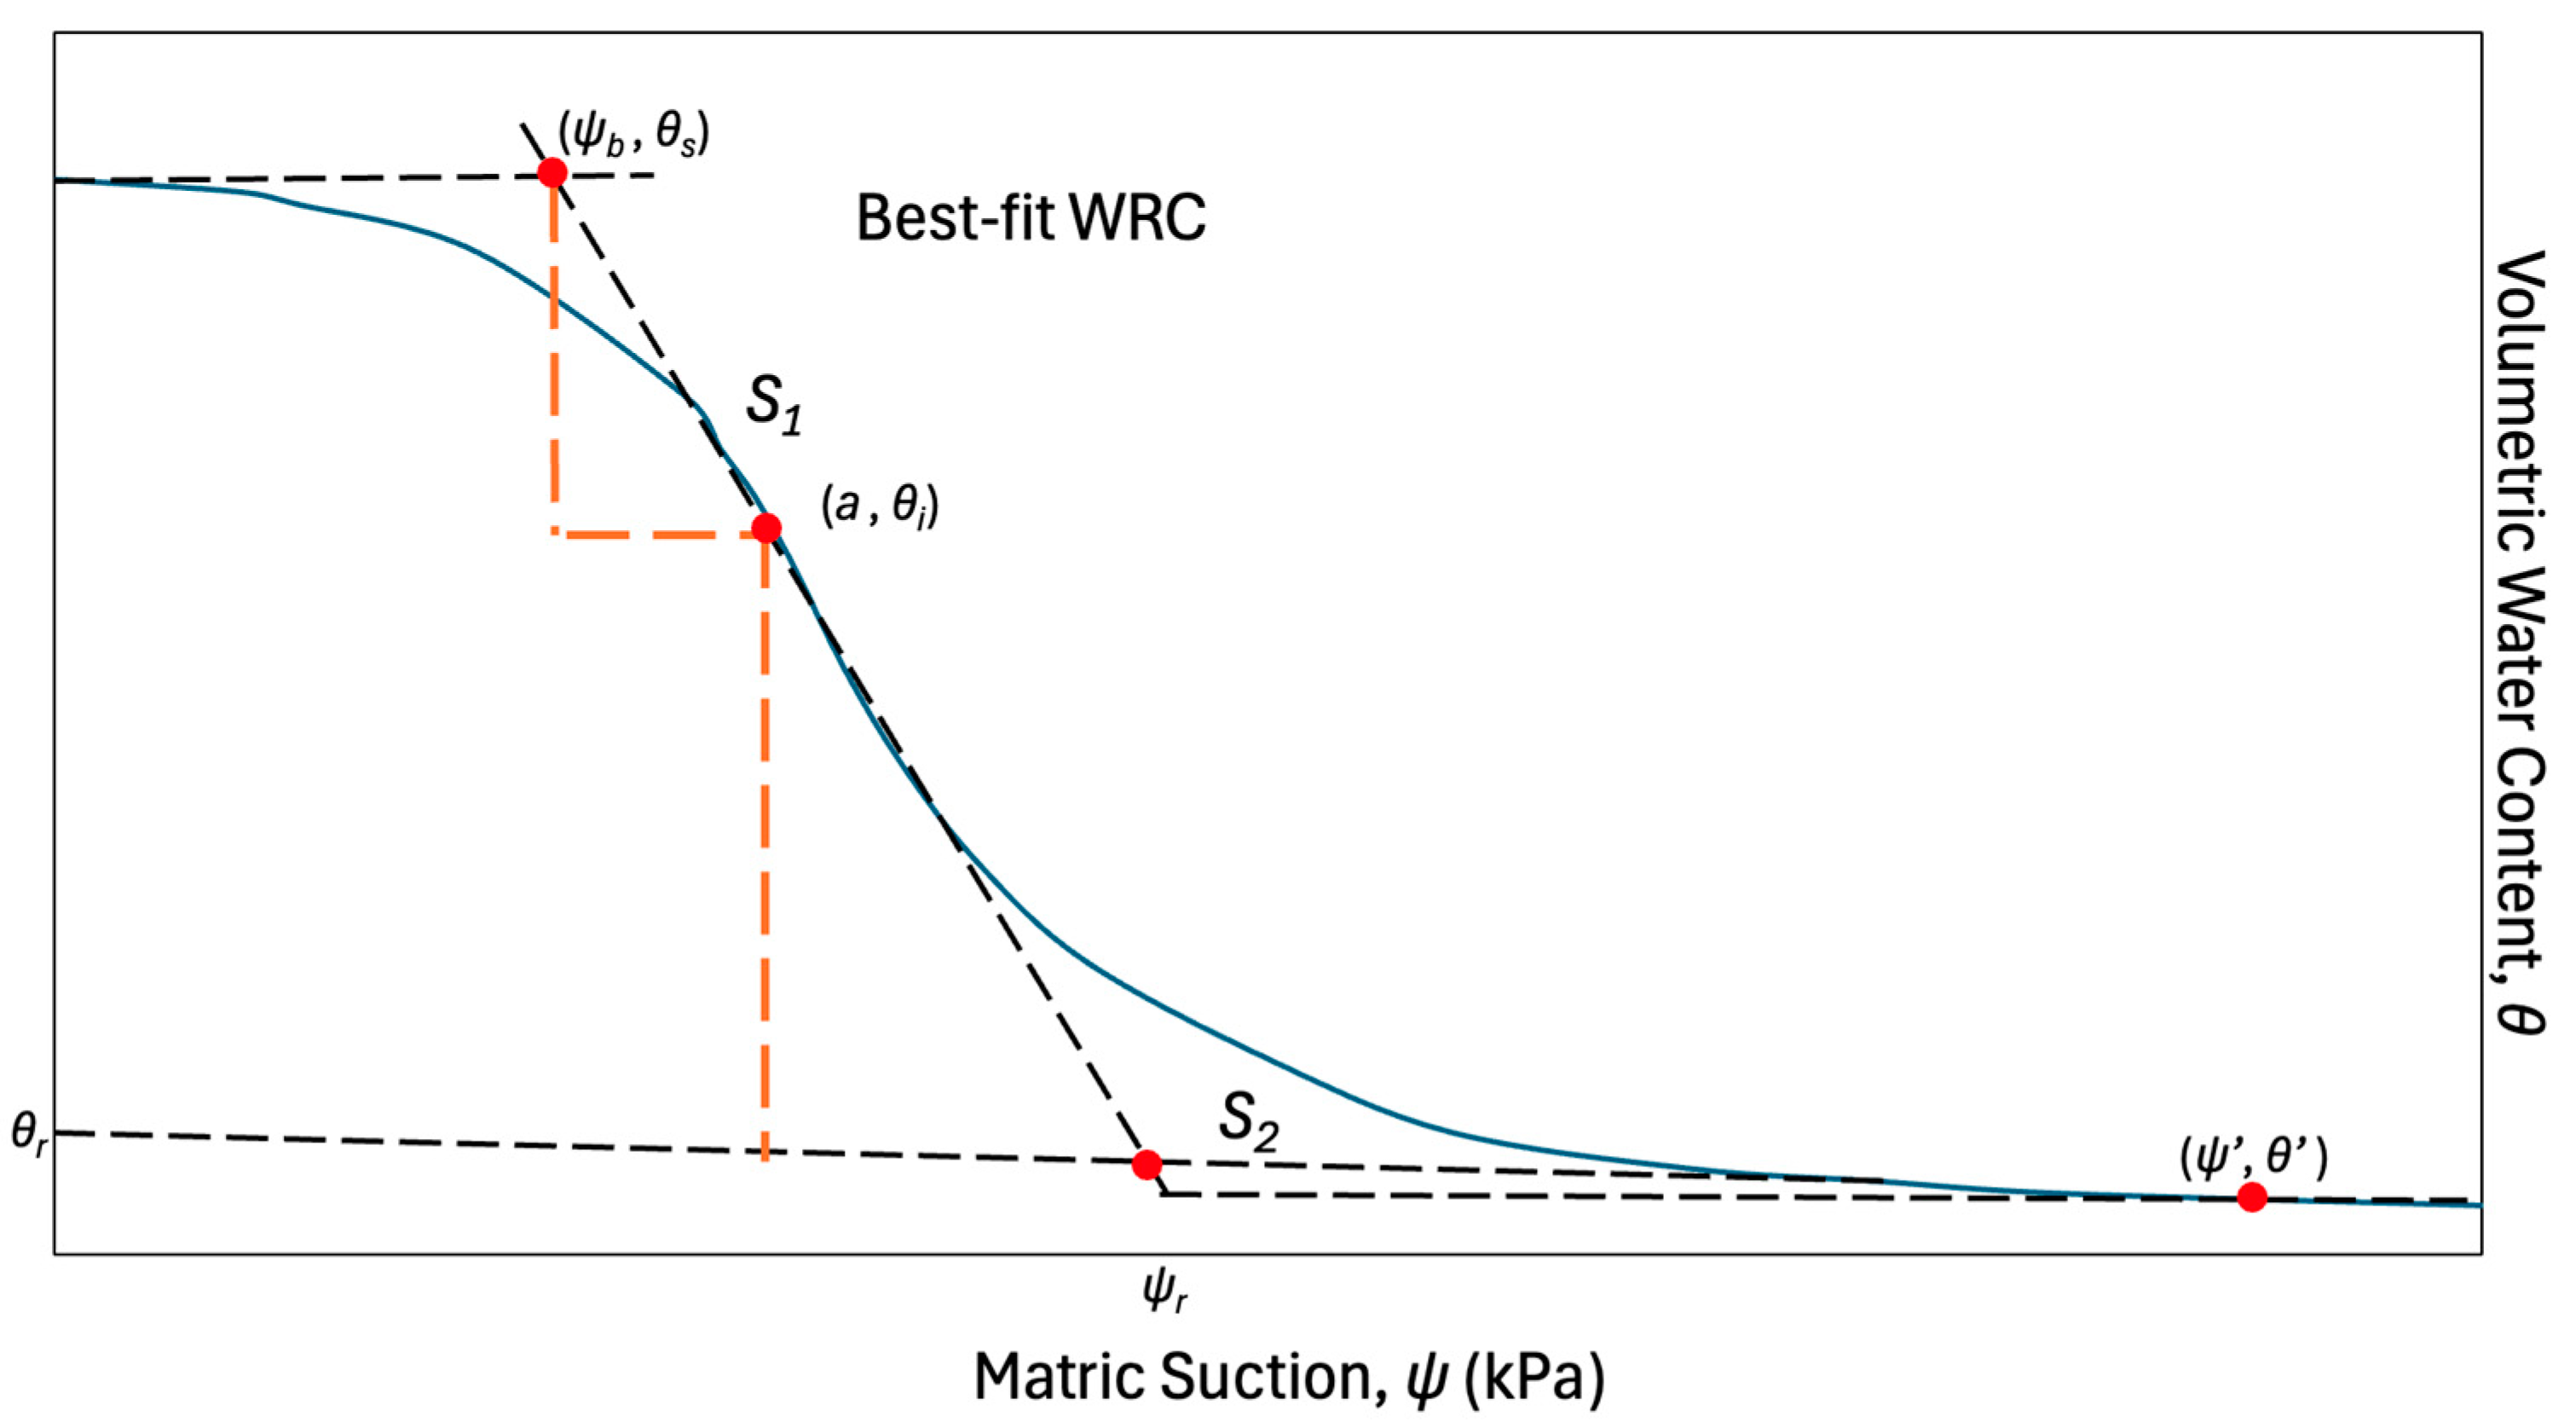
8]. The WRC consists of a nearly horizontal line up to the air entry value (AEV), a rapid decrease in moisture content from AEV to the residual suction value (RSV), and a decrease from RSV to completely dry soil [9]. Stage I evaporation or the boundary effect zone is the stage wherein the soil pores are nearly saturated, and the change in moisture content is independent of soil suction up to the AEV [9]. AEV is the start of Stage II evaporation, wherein air enters the largest pores of the soil; on the other hand, the transition zone, or Stage III evaporation, is the stage when water migrates through the capillary network of soil [9]. RSV is the start of Stage IV evaporation, wherein the water phase in the soil becomes discontinuous and the pores begin to disconnect due to occluded air, while the residual zone or Stage V evaporation occurs under large suction values required to remove adsorbed water [9].
The transition of the soil condition from saturated to unsaturated induces a decrease in hydraulic conductivity as the suction increases, which heavily affects the soil–water dynamics. This indicates that water flow through a saturated soil column is inherently faster than a desaturated soil column [6]. Hence, infiltration through a saturated soil specimen is much more rapid than evaporation, wherein water is transferred from the soil to the atmosphere through a drying surface zone [6]. Some of the methods to determine the unsaturated hydraulic conductivity include approaches based on stationary flow approximations, transient flow analysis, mini-disk infiltrometer, horizontal infiltration, outflow, evaporation, and instantaneous profile [4,5]. However, directly measuring the unsaturated hydraulic conductivity is time-consuming and costly [5,10]. Direct measurement may also pose a challenge, since it changes as the soil suction changes, even if the void ratio remains the same [11]. In addition, the soil suction changes as the degree of saturation changes, which is a result of the flow of water that occurs within the specimen [11]. Hence, empirical, semi-empirical, and analytical mathematical models mainly were used for predicting the mechanical behavior of unsaturated soils [10].
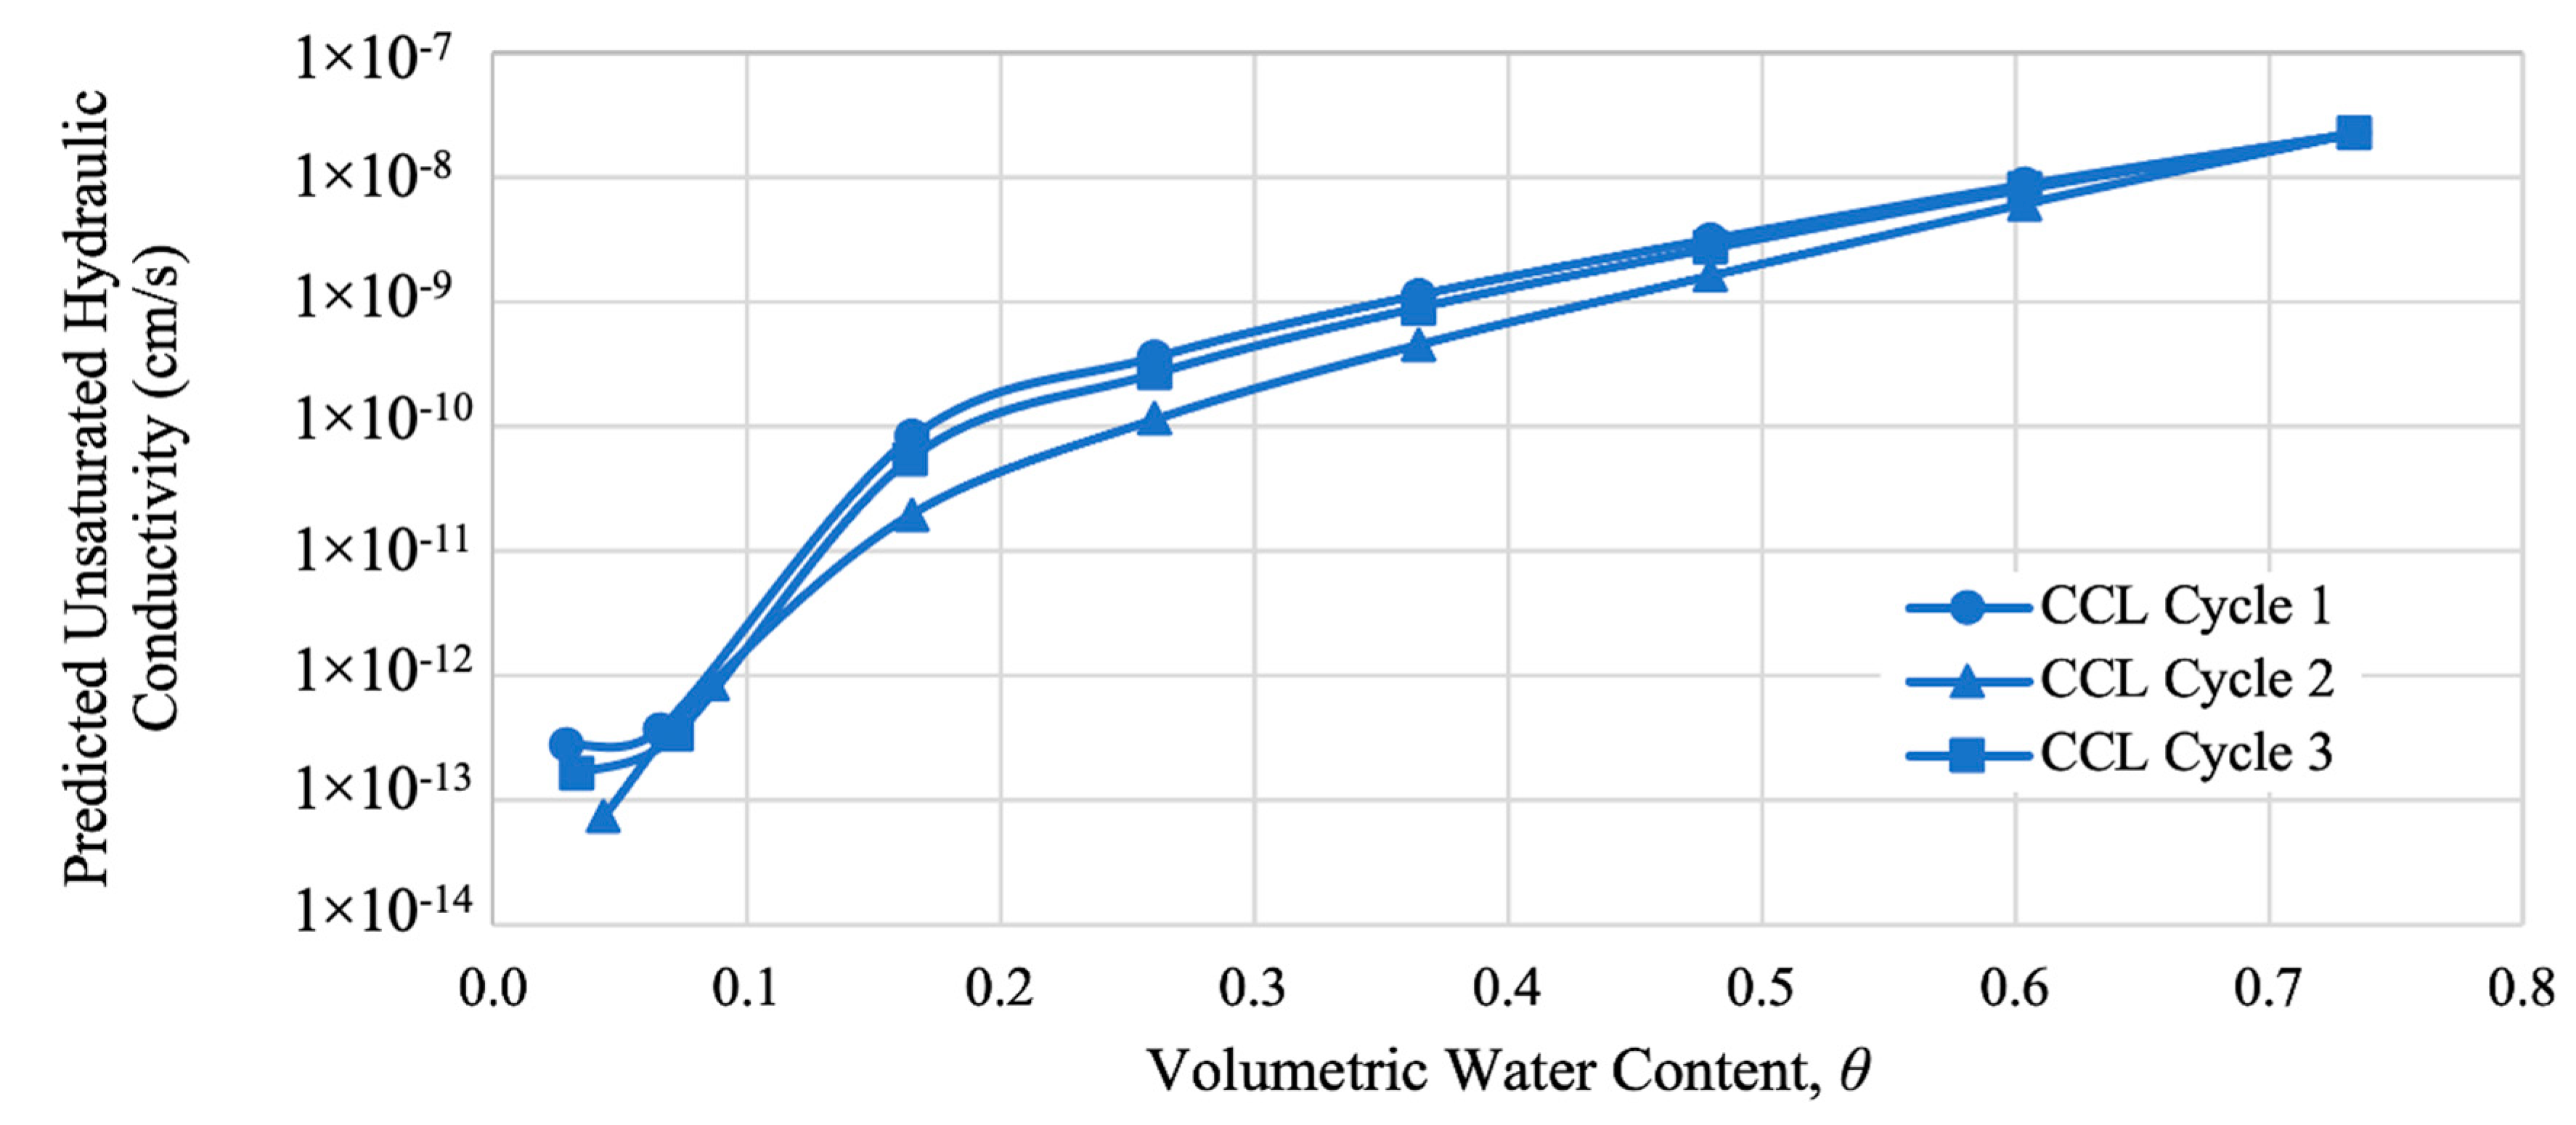
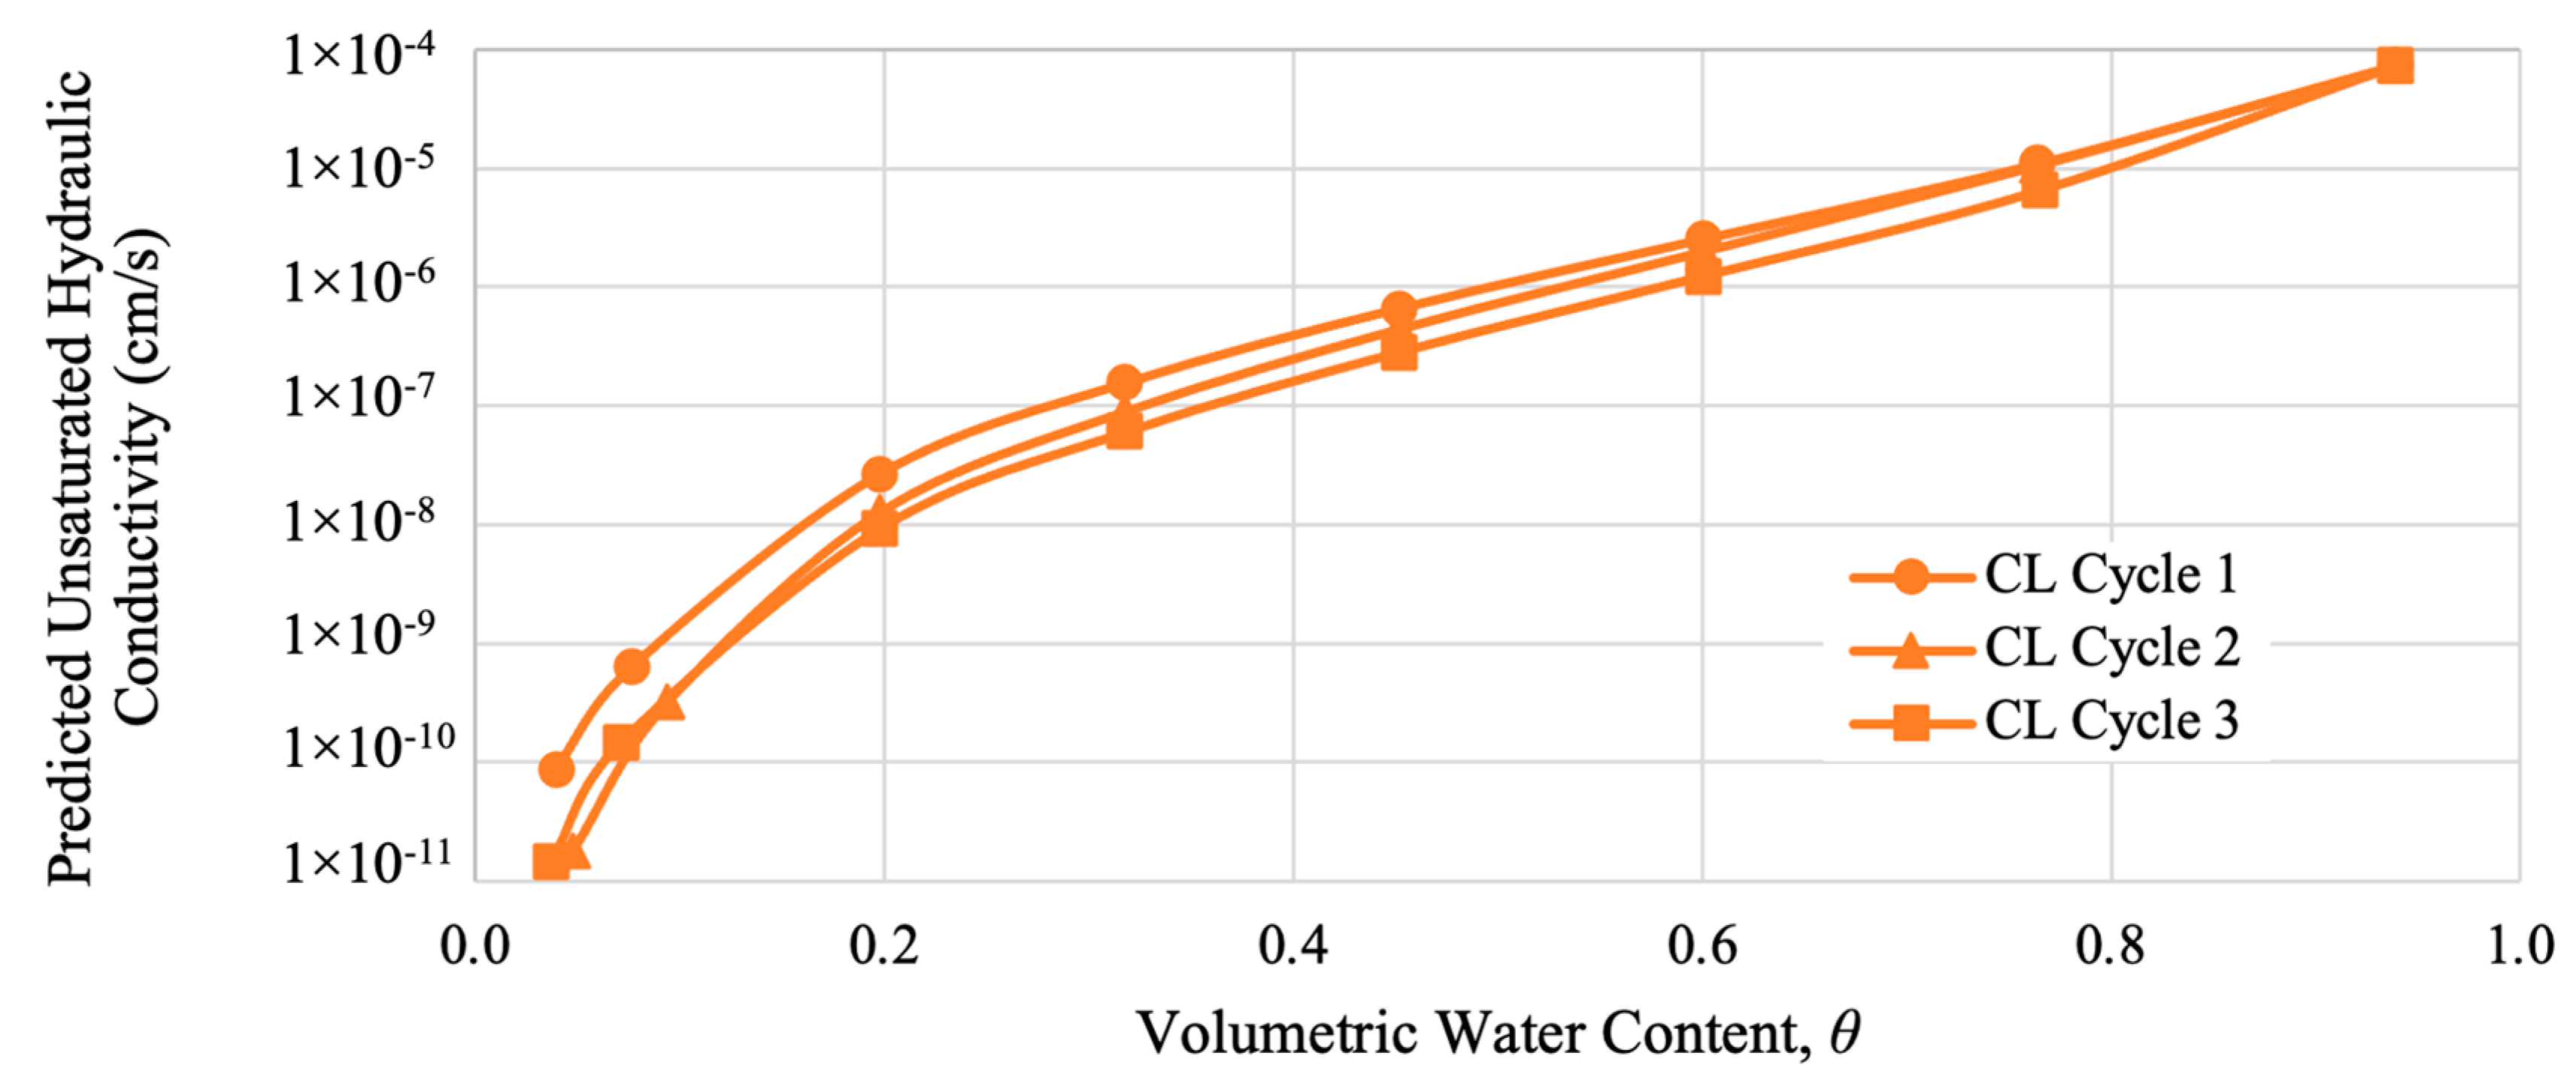
Several studies have also proposed models for estimating the unsaturated hydraulic conductivity by bridging the WRC with the hydraulic conductivity curve. Unsaturated hydraulic conductivity may also be predicted using the WRC together with the constant saturated hydraulic conductivity of the specimen [12]. The filter paper method (ASTM D5298) is a practical and efficient technique of determining the soil matric suction, which can then be used to establish the WRC to indirectly estimate the unsaturated hydraulic conductivity. Compared to other direct measurement methods of determining the unsaturated hydraulic conductivity, it is cost-effective, requires minimal specialized equipment, and provides reliable results for various soil types.
The changes in the soil–water interactions under unsaturated conditions due to cyclic wet–dry conditions also make the clay cover susceptible to volume changes and desiccation cracks that would increase the permeability. Previous studies have explored various approaches to improving the performance of clay layers, such as incorporating polymers or natural fibers to reduce cracking due to wet–dry cycles and to lower their permeability. Some studies have explored the addition of straw fiber in soils, which showed that there was a decrease in the amount of cracks as the amount of fiber increased [13,14,15]. Polymers are also often used in soil stabilization by reducing the rate of water invasion into the soil mass [16,17]. According to Theng [18], polymers strengthen structures for particles in proximity, and they can also stabilize particles far from each other through flocculation. Furthermore, polymers are also capable of penetrating pore spaces to achieve adequate stability of the soil mass [18].
Polyurethane is a polymer widely used in construction, particularly in ground improvement of expansive soils like clay. Polyurethane is formed from the chemical reaction between polyol and diisocyanate that produces urethane, a repeating unit in the polymer [19]. Saleh et al. [19] stated that polyurethane grout in soil nailing decreases settlement, while polyurethane grout as micro piles improves the response of the ground to dynamic forces. In addition, injecting polyurethane foam into the ground improves its strength, stiffness, and bearing resistance [19]. A study by Buzzi et al. [20] explored the effects of polyurethane resin injection in a dry and desiccated expansive soil mass. The study concluded that the veins of the injected polyurethane resin in the clay acted as a barrier to moisture better than the intact clay. Furthermore, the injected polyurethane resin into the cracked, expansive soil did not increase its swelling potential. In a study by Saleh et al. [19], marine clay, characterized by excessive swelling and shrinkage, was stabilized by mixing it with polyurethane. The polyurethane mixture had 1%, 2%, 3%, 4%, and 5% of the bulk mass of the specimen. Saleh et al. [19] inferred that adding polyurethane increased the shear strength of the marine clay. Several studies also used techniques to reduce compacted clay’s hydraulic conductivity, including incorporating polymer materials to stabilize the soil matrix and prevent volumetric changes as the soil moves to a drier state. The study of Frianeza and Adajar [21] incorporated a polyurethane polymer into an expansive soil matrix, which reduced the permeability and improved the water-holding capacity of the compacted specimen due to the increase in carbon content. In the study, the compacted clay mixed with polyurethane in a saturated state had an average hydraulic conductivity of 2.9 × 10⁻⁸ cm/s, which makes the compacted specimen a suitable landfill liner [21].
Studies on clay stabilization using polymers have demonstrated potential in enhancing soil properties, yet the long-term impacts on unsaturated hydraulic conductivity remain underexplored. Thus, this study contributes to the advancement of sustainable landfill engineering by providing insights into the behavior of polyurethane–clay covers under unsaturated conditions. In addition, the influence of wet–dry cycles on the polyurethane–clay’s deterioration, microstructure, and corresponding hydraulic behavior has not been comprehensively addressed in the existing literature. The simplified data acquisition of using the filter paper method enables the establishment of water retention curves during the drying process in several wet–dry cycles, which are essential for modeling the unsaturated hydraulic conductivity. By adopting this method, the study aims to provide a robust and accessible tool for advancing landfill liner and cover evaluations. The insights gained in this study could assist engineers in optimizing cover configurations to minimize leachate leakage, thereby enhancing environmental protection and reducing maintenance costs. The findings offer critical data for predicting the unsaturated hydraulic conductivity of landfill covers, improving the understanding of soil–water dynamics under environmental stresses. This research also supports the development of durable and efficient landfill covers, promoting better waste management practices. Beyond landfill applications, the study holds broader implications for soil stabilization techniques and the engineering of resilient geotechnical materials. These contributions align with global efforts toward sustainable development and environmental protection.

2. Materials and Methods

2.1. Mix Proportion

The clay used in the study was excavated 2 m below the ground level at Kauswagan, Lanao del Norte, from a proposed sanitary landfill site. On the other hand, the polymer used to mix with the clay was a mixture of 1 part polyol and 1 part isocyanate. This rigid polyurethane foam polymer was synthesized using the one-shot method of directly mixing the components. The specimen created for the study was a mixture of 3% polyurethane (PU) by weight and clay. Table 1 shows the sample mix proportion of the control specimen, clay, and the experimental specimen: polyurethane–clay. The same mix proportion was utilized in the study of Frianeza and Adajar [21]. To ensure that the amount of water in the specimen was controlled, the clay was oven-dried and stored in an airtight container. At the same time, polyol and isocyanate were mixed to produce polyurethane. The dried clay was mixed with polyurethane within the cream time, 19 s to 27 s, to ensure the mixture was performed before the polymer hardened. The mixed specimen was then stored in an airtight container for 20 min to allow further reaction before adding water to reach a moisture content of 46.5%. The specimens, with a 46.5% moisture content, were placed in an airtight container and insulated box for 24 h to ensure that water was mixed within the small void spaces of the clay matrix and polyurethane–clay matrix. The two loose specimens, clay and polyurethane–clay, were tested to determine the soil index properties.

2.2. Compacted Specimen Preparation

The compaction moisture content, 46.5%, was determined by Frianeza and Adajar [21] through trial tests based on the relative compaction of the clay. The clay with no polyurethane was compacted with an initial void ratio of 1.06, while the polyurethane–clay was compacted with the same effort and had an initial void ratio of 1.44. Hence, a third compacted clay specimen was molded with an initial void ratio of 1.44. The difference in the initial void ratio of the first compacted clay with compacted polyurethane–clay was attributed to the difference in specific gravity of the two loose specimens, clay and polyurethane–clay. Table 2 shows the soil index property of the two loose specimens. It can also be observed that the grain size of polyurethane–clay is larger than that of clay. The difference in grain size between polyurethane–clay and clay also affect its resistance to volume changes, such as shrinkage, as inferred by Frianeza and Adajar [22].
The compaction efforts applied to both compacted clay specimens can be linked to a study by Tiongson and Adajar [29], which predicted the hydraulic conductivity of compacted clay based on the applied compaction effort. This connection is relevant, since the study used the same type and origin of clay specimens. Similarly, Frianeza and Adajar [21] found that the hydraulic conductivity of a compacted clay specimen with an initial void ratio of 1.06 matched the hydraulic conductivity estimated in the study of Tiongson and Adajar [29]. Consequently, the estimated compaction effort for the compacted clay specimen with an initial void ratio of 1.06 and for the compacted polyurethane–clay was determined to be 600 kN-m/m3, corresponding to the standard Proctor compaction effort.
To differentiate the three compacted specimens, the following designations were adopted: the compacted clay with an initial void ratio of 1.06 is referred to as the compacted clay layer (CCL), while the compacted clay with an initial void ratio of 1.44 is termed the clay layer (CL). The polyurethane–clay specimen compacted with the same effort as CCL but having the same initial void ratio as CL is referred to as the compacted polyurethane–clay layer (CPCL). Table 3 summarizes the compaction efforts applied to the specimens, all molded within cylindrical acrylic molds with an inner diameter of 66 mm and a height of 20 mm. The three specimen types—CCL, CL, and CPCL—were also utilized in the study of Frianeza and Adajar [22]. Their findings revealed that incorporating polyurethane into the loose specimen increased the grain size, which improved resistance to shrinkage compared to specimens without polyurethane, regardless of the initial void ratio. Among the three specimen types, CPCL exhibited the greatest shrinkage resistance, as inferred by Frianeza and Adajar [22].

2.3. Wet–Dry Cycles

The compacted specimens were cured for 24 h inside a sealed insulated box to prevent loss of moisture, as shown in Figure 1, before subjecting them to three wet–dry cycles. The wet–dry cycle was initiated by ensuring that the compacted specimens were saturated at the start of the cycle. The saturation state of the specimens was quantified by directly measuring the weight of the compacted specimen. Table 4 shows the target moisture content of the compacted specimens for each moisture content level. Level 1 of the moisture content levels in Table 4 pertains to the saturation level of 100%, while Level 8 pertains to the saturation level of 0%.
The process for the wet–dry cycles was adopted from the study of Frianeza and Adajar [22]. Air drying was the method used to move the compacted specimen’s saturation into a drier state that lasted for a week, similar to the study of Frianeza and Adajar [22]. In addition, the compacted specimens were oven-dried to reach a dry state of 0% moisture content. To restart the cycle, specimens were re-saturated inside the mold by gradually adding water every 2 min until the target weight corresponding to a fully saturated sample was achieved, as shown in Figure 2. The re-saturated compacted specimens were then placed again in a sealed insulated box for 24 h to ensure that the water that re-entered the compacted soil matrix was properly distributed before air drying the specimen to undergo the 2nd drying cycle. Figure 3 shows the wet–dry cycle of the compacted specimens.

2.4. Filter Paper Method to Determine the Matric Suction

To predict the unsaturated hydraulic conductivity of the compacted specimen, the water retention curve (WRC) was formulated. The WRC is the relationship of the moisture content with the matric suction. Hence, in this study, the matric suction at a specific moisture content level was quantified using ASTM D5298 [31] or the standard test method for the measurement of soil potential, or suction, using filter paper, commonly referred to as the filter paper method. The Whatman No. 42 filter paper and ashless quantitative filter paper were oven-dried for at least 16 h to ensure that water was not present or absorbed by the filter papers. The oven-dried filter papers were placed in a desiccant jar to prevent moisture accumulation before being used in the experiment. The two cylindrical compacted specimens were repeatedly weighed separately until the desired weights corresponding to the target moisture content level were achieved. Once the compacted specimens undergoing the drying process achieved the target moisture content, a set of filter papers was placed in between the two compacted specimens with the same target moisture content. The set of filter papers was initially weighed before being put in between said compacted specimens to ensure an accurate data collection of the filter paper moisture content after the period of experimentation. The set of filter papers consisted of a single 55-mm diameter Whatman No. 42 filter paper in between two 60-mm ashless quantitative filter papers, shown in Figure 4, to ensure that no debris adhered to the Whatman No. 42 filter paper. The two compacted specimens with the set of filter papers in between them were wrapped in plastic to maintain their shape as they were placed into the glass container. The glass container was sealed with vinyl tape, as shown in Figure 5. The glass container containing the specimen was then placed inside an insulated chest for 7 days to regulate the temperature of the containers as the water within the void spaces of the desaturated compacted specimens equilibrated with the set of filter papers in between. According to ASTM D5298 [31], the 7-day period for the equilibration of the moisture content is already sufficient for normal conditions in soil mechanics, and in many conditions, the equilibration is completed earlier than 7 days. Moreover, instead of a prolonged testing, it was also opted to use the 7-day testing period to refrain from using formaldehyde to prevent the growth of organisms in the moist environment and the decomposition of the filter paper. After 7 days, the moisture content of the Whatman No. 42 filter paper in between the compacted specimens was determined, which was used to obtain the matric suction together with the calibration curve from ASTM D5298 [31]. Since the compacted specimens were allowed to equilibrate for 7 days inside the glass containers, a new set of compacted specimens that underwent the necessary number of wet–dry cycles was used for every experimental run. In the experiment, the matric suction of the compacted specimen was determined as the specimen dried after re-saturation; hence, the WRC obtained was for the drying cycle, which was different from the WRC for the wetting cycle.
The matric suction of the soil specimens in the study was determined using Equation (1), as stipulated in ASTM D5298 [31]. ASTM D5298 [31] also provided the typical calibration curves for determining the suction using different types of filter paper, such as Whatman No. 42 and Schleicher and Schuell No. 589. The upper portion of the calibration curves, above the filter paper water content break point, represented the moisture retained as the water films were absorbed into the soil particle surfaces. On the other hand, the lower portion of the curves represented the moisture retained by capillary or surface tension forces between soil particles. Furthermore, the filter paper water content break point for Whatman No. 42 was 45.3% and 54% for Schleicher and Schuell No. 589 [31]. Between the two types of filter paper, Whatman No. 42 was utilized in the study, because it is more consistent and it is the most suitable for a wide range of suction, which has a bilinear calibration curve [32,33]. Based on the paper calibration curve in ASTM D5298 [31], the slope of Equation (1) is −0.0779 when the filter paper water content is greater than 45.3%, while the slope is −0.0102 when the filter paper water content is less than 45.3%. Moreover, the intercept is 5.327 when the filter paper water content is greater than 45.3%, while the intercept is 1.882 when the filter paper water content is less than 45.3%.
h = m w f + b
where h is the matric suction in log10 kPa, m is the slope of the paper calibration curve in log10 kPa/%, wf is the water content of the filter paper in percentage, and b is the intercept of the filter paper calibration in log10 kPa.

2.5. Predicting the Unsaturated Hydraulic Conductivity Using Empirical Models and the Best Fit Water Retention Curve

Using the obtained matric suction through the filter paper method, the unsaturated hydraulic conductivity may be predicted using empirical models and the best fit WRC. A way to establish the best fit WRC, or the soil water characteristic curve (SWCC), was proposed by Fredlund et al. [34]. According to Leong and Rahardjo [35], the proposed equation by Fredlund et al. [34] may be used for a wide range of soils. Moreover, Leong and Rahardjo [35] suggested that the correction factor may be equal to 1 to simplify the equation of Fredlund et al. [34].
In this study, the volumetric water content was obtained by using Equation (2), which was proposed by Fredlund et al. [34] with a correction factor equal to 1. Equations (3)–(6) were formulated by Zhai and Rahardjo [36] to determine the fitting parameters and variables shown in Figure 6. Moreover, the equations were in accordance with the relationship between the volumetric water content and suction proposed by Fredlund et al. [34] plotted in a semi-log graph. Figure 6 shows the different zones in the WRC, wherein the transition zone is from the air entry value to the residual point, and the residual zone is beyond the residual point.
θ = θ s ln e + ψ a n m
n = 1.31 m + 1 θ s × m 3.72 × s 1 × ψ i
θ i = θ s 1.313 m
S 1 = θ s θ i log a / ψ b = θ i θ r log ψ r / a
S 2 = θ r θ log ψ / ψ r
where θ is the volumetric water content, θs is the saturated volumetric water content, ψ is the soil suction in kPa, a is the matric suction at the inflection point in kPa, n and m are fitting parameters, S1 is the slope at the transition zone, θi is the volumetric water content at the inflection point, ψb is the air entry value in kPa, θr is the residual volumetric water content, ψr is the suction corresponding to the residual water content in kPa, S2 is the slope at the residual zone, θ′ is the volumetric water content at the point where the curve starts to drop linearly, and ψ′ is the matric suction at the point where the curve starts to drop linearly in kPa.
Once the best fit WRC was established, the volumetric water content and corresponding matric suction was obtained to determine the unsaturated hydraulic conductivity using an empirical model. The model used to predict the unsaturated hydraulic conductivity was formulated by Fredlund et al. [34] and is shown in Equation (7). Moreover, the saturated hydraulic conductivity utilized in the computation using Equation (7) was obtained from the study of Frianeza and Adajar [21], which was 2.27 × 10⁻⁸ cm/s for CCL, while the saturated hydraulic conductivity utilized in the computation for CL and CPCL was the average value of the hydraulic conductivity of CCL and CPCL in the study of Frianeza and Adajar [21], which was 7.28 × 10⁻⁵ cm/s and 2.90 × 10⁻⁸ cm/s, respectively.
k u n s a t = k ln ψ ln 10 6 θ e y θ ( ψ ) e y θ ( e y ) d y ln ψ b ln 10 6 θ e y θ s e y θ ( e y ) d y
where kunsat is the unsaturated hydraulic conductivity in cm/s, k is the hydraulic conductivity in cm/s, ψ is the matric suction in kPa, θ(ey) is the volumetric water content as a function of ey related to the matric suction, θ(ψ) is the volumetric water content as a function of the matric suction, θ′(ey) is the derivative of the volumetric water content as a function of ey related to the matric suction, ψb is the air entry value in kPa, θs is the saturated volumetric water content, e is the natural number, and y is a dummy variable related to the matric suction.

2.6. Scanning Electron Microscopy Analysis

The scanning electron microscopy (SEM) analysis was done by examining the SEM images of the loose and compacted specimens in this study. The SEM images had a magnification of ×1000 to analyze the differences in the microstructure caused by the cyclic wetting and drying or the incorporation of polyurethane into the clay matrix. In this study, the SEM images were examined by noting the changes in the intergranular and intragranular voids, as well as the shape of the particles, whether it was plate-like or spherical. The contact form between the particles was also examined to determine if there was a face-to-face contact or point contact. By quantifying the changes on the microstructure, the behavior of the specimen may be further explained.

3. Results and Discussion

The results and discussion are divided into three parts, which are the matric suction, establishing the best fit water retention curve, and predicting the unsaturated hydraulic conductivity of all the compacted specimen types.

3.1. Matric Suction Determined Using the Filter Paper Method

3.1.1. Matric Suction of Compacted Clay with Varying Initial Void Ratios

To determine the effect of the initial void ratio on the matric suction, the test results of CCL and CL were compared. Both CCL and CL specimens are clay with no polyurethane and have the same initial characteristics, such as compaction water content, liquid limit, and grain size distribution. Figure 7 shows the WRC of CCL and CL, in which the logarithm of the matric suction was plotted against the moisture content. It can be observed in Figure 7 that the matric suction, regardless of the number of wet–dry cycles and initial void ratio, increases as the gravimetric water content decreases. Thus, the capability of the soil to hold water against gravity increases as the specimen moves to a drier state, which agrees with the usual behavior of soil as it dries. Similar behavior was observed by Birle et al. [37], in which the relationship between the gravimetric water content and soil suction investigated in their study was unaffected by the initial conditions, such as the void ratio.
It can be observed from Figure 7 that varying the initial void ratio did not have an effect at the higher suction range of around 30,000 to 200,000 kPa or 4.48 log kPa to 5.3 log kPa. The behavior of CCL and CL at the higher suction range agrees with the findings of Chi et al. [38], Birle et al. [37], and Zhou and Yu [39]. According to their findings, the matric suction at a higher range is not influenced by the initial conditions such as compaction effort, initial void ratio, and compaction moisture content, because water films at these high suction ranges are widely influenced by osmotic and adsorptive fields more than the soil structure. Thus, it was inferred by previous studies that the soil structure, which is affected by said initial conditions, has a negligible influence on the soil–water behavior at a higher suction range. Data from previous studies agree with the data obtained that captured the negligible effect of the initial void ratio and the wet–dry cycle at the higher suction range.
However, it can be observed in Figure 7 that there is a difference in the matric suction of CCL and CL at the lower suction range or below 30,000 kPa or 4.48 log kPa. CCL, which has a lower initial void ratio than CL, has a higher matric suction at the lower suction range. This indicates that varying the initial void ratio influences the matric suction at the lower suction range. As stated by Birle et al. [37], the compaction condition significantly affects the pore structure and, subsequently, the matric suction, since specimens with smaller pores, i.e., a smaller void ratio, desaturate slower.
It can also be observed in Figure 7 that the number of wet–dry cycles affected the matric suction at the lower suction range. The area of the curve between the first and second wet–dry cycles is bigger compared to the area between the second and third wet–dry cycles for both CCL and CL specimens. Furthermore, increasing the number of wet–dry cycles from two to three did not affect the suction significantly, since it was already stable. The decrease in matric suction as the number of wet–dry cycles increased agrees with the findings of Zeng et al. [40], in which the study inferred that the wet–dry cycle reduced the suction and water-holding capacity of the soil. Table 5 shows the three-way analysis of variance conducted, which inferred that varying the factors, such as moisture content and number of cycles, has a significant effect on the matric suction.
There was no considerable cracking observed at the end of the first wet–dry cycle after the specimens were oven-dried, as shown in Figure 8. However, cracks immediately started to form during the first specimen re-saturation after oven drying. The deterioration of CCL and CL at crucial stages in the three wet–dry cycles are shown in Figure 9, Figure 10, Figure 11 and Figure 12. The cracks that formed were due to the sudden re-saturation of the compacted soil, wherein the top portion of the specimen expanded while the bottom layers were still at a smaller dimension compared to the re-saturated portion, which created friction between the layers that produced the cracks [41].
The SEM images, with a magnification of ×1000, of the loose clay, compacted specimen before the wet–dry cycle, and compacted specimen after exposure to three wet–dry cycles are shown in Figure 13 and Figure 14. It can be observed that compaction reduces intergranular voids present in the uncompacted condition. Moreover, after the specimens were subjected to wet–dry cycles, the intergranular voids increased compared to the compacted specimen before the wet–dry cycles. More aggregates that were uniform in size were also observed after the specimen underwent wet–dry cycles. Moreover, the edges of the particles were more defined after undergoing wet–dry cycles. Thus, the cyclic wetting and drying deteriorated the microstructure of the specimen and increased the number of pores, which was a significant factor that affected the decrease in matric suction. The wet–dry cycles ruptured the plate structure of the compacted specimen, which resulted in an increase in the amount of aggregate, a decrease in the aggregate size of the specimen, an increase in specific areas of the soil particles, and, in turn, a looser, more porous compacted specimen [7,42]. Moreover, aggregate contours and increased porosity were more apparent. Reduction in connectivity and a change from face-to-face contact to point contact that was observed in SEM images of the specimen that underwent wet–dry cycles were also effects of the deterioration caused by the cyclic wetting and drying [7]. The change in microstructure indicates that the water dissolved the cementing matters during the wet–dry cycle, which caused small- and medium-sized pores to develop into macropores [42]. In addition, according to Sun et al. [43], the expansion of kaolinite leads to an increase in pores where water enters the soil, resulting in disintegration.
Quadratic regression models were developed to predict the matric suction. The quadratic models of the responses and the factors are shown in Figure 15. The quadratic regression models for a range of moisture content and initial void ratio are expressed in Equations (8)–(10). The high coefficient of determination, R2, which has a value of 0.9232, indicates that 92.32% of the actual data indicates a good fit for the model. Moreover, the predicted and actual values are plotted in Figure 16, which shows an adequate linear relationship between the predicted and actual values, denoting that the regression model is adequate.
log ψ L C , C 1 = 55.62 6.72 × 10 2 w 81.55 e + 3.34 × 10 2 w e 1.12 × 10 3 w 2 + 32.25 e 2
log ψ L C , C 2 = 54.32 8.18 × 10 2 w 80.45 e + 3.34 × 10 2 w e 1.12 × 10 3 w 2 + 32.25 e 2
log ψ L C , C 3 = 54.17 8.30 × 10 2 w 80.36 e + 3.34 × 10 2 w e 1.12 × 10 3 w 2 + 32.25 e 2
where ψLC,C1 is the matric suction of compacted clay at the 1st wet–dry cycle in kPa, ψLC,C2 is the matric suction of compacted clay at the 2nd wet–dry cycle in kPa, ψLC,C3 is the matric suction of compacted clay at the 3rd wet–dry cycle in kPa, w is the moisture content in percentage, and e is the initial void ratio.

3.1.2. Matric Suction of Different Compacted Specimen Types with a Constant Initial Void Ratio

The initial void ratio was proven to be a significant factor that affects the suction in previous studies for other kinds of soils. Moreover, it was observed that the initial void ratio affects the matric suction of the compacted clay in the study at the lower suction range. In the previous analysis, it was also discussed that pore structure significantly affects the matric suction considering the varying number of cycles, which was supported by the study of Nie et al. [42]. Thus, to analyze the effect of including polyurethane in the soil mixture with clay in terms of the matric suction, the initial void ratio was held constant. The matric suctions of CPCL and CL were compared and plotted in Figure 17. Both specimens have the same compaction moisture content, which is wet, of the optimum moisture content; however, other properties, such as specific gravity, liquid limit, and grain size distributions, are different.
It can be observed in Figure 17 that the matric suction increases as the moisture content decreases regardless of the number of wet–dry cycles and if polyurethane is included in the soil mixture. Moreover, it can be observed that the matric suction of CPCL has a lower value at the lower suction range below 20,000 kPa or 4.3 log kPa. According to Zhao et al. [44], the particle size affects the matric suction, wherein the matric suction is less for specimens with larger particles. Thus, the reduction in the matric suction at the lower range due to the inclusion of polyurethane in the soil mixture may be attributed to the difference in particle size of the soil with and without polyurethane. From the analysis of the soil properties, it was observed that the particle size of the clay is smaller compared to the particle size of the polyurethane–clay. On the other hand, the inclusion of polyurethane in the soil mixture did not affect the matric suction at the higher suction range of around 20,000 kPa to 200,000 kPa or 4.3 log kPa to 5.3 log kPa, since the increased grain size of the loose specimen induced by the inclusion of polyurethane had no effect at the higher suction range. This behavior at the higher suction range was also evident in the specimen comparison of CCL and CL in the previous discussion, wherein the suction at the higher range was not influenced by the soil structure because the water films were influenced by the osmotic and adsorptive fields at that suction range.
The deterioration of the soil structure caused by the wet–dry cycle, as shown in Figure 18, also affected the obtained matric suction at the lower suction range. It can be observed in Figure 17 that the matric suction decreases as the number of cycles increases at the lower suction range. This indicates that cyclic wetting and drying induced an increase in intergranular pores. The SEM image, with a magnification of ×1000, of polyurethane–clay, CPCL before the wet–dry cycles, and CPCL that underwent three wet–dry cycles is shown in Figure 19. It can be observed that compaction reduced the intergranular voids compared to the SEM image of the loose specimen. It can also be observed that the microstructure of CPCL deteriorated after three wet–dry cycles, in which the number of aggregates increased and the aggregate sizes decreased. Furthermore, the change in contact form from the face-to-face to point contact form indicates that the cementing particles were dissolved by the water, which was also the case for CCL and CL in the previous analysis. Thus, the increase in intergranular voids from the deterioration of CPCL caused the matric suction to decrease as the number of cycles increased and further deterioration was experienced.
The three-way analysis of variance conducted, shown in Table 6, determined that varying the different factors, such as moisture content, polyurethane content, and number of wet–dry cycles, had a significant effect on the obtained matric suction.
The quadratic regression model, which can be used to predict the suction of CPCL for three wet–dry cycles and a wide range of moisture contents is expressed in Equations (14)–(16). The high coefficient of determination, R2, which has a value of 0.9383, indicates that 93.83% of the actual data fits the model. Figure 20 shows the plot of the predicted and actual values of the matric suction, which shows a linear relationship indicating the regression model obtained is a good model to predict the matric suction at a large variety of moisture contents.
log ψ C L , C 1 = 5.21665 2.994 × 10 2 w 9.921 × 10 4 w 2
log ψ C L , C 2 = 5.36433 4.141 × 10 2 w 9.921 × 10 4 w 2
log ψ C L , C 3 = 5.26486 4.051 × 10 2 w 9.921 × 10 4 w 2
log ψ C P C L , C 1 = 5.53189 4.520 × 10 2 w 9.921 × 10 4 w 2
log ψ C P C L , C 2 = 5.42783 5.667 × 10 2 w 9.921 × 10 4 w 2
log ψ C P C L , C 3 = 5.37784 5.577 × 10 2 w 9.921 × 10 4 w 2
where ψCL,C1 is the matric suction of CL at the first wet–dry cycle in kPa, ψCL,C2 is the matric suction of CL at the second wet–dry cycle in kPa, ψCL,C3 is the matric suction of CL at the third wet–dry cycle in kPa, ψCPCL,C1 is the matric suction of CPCL at the first wet–dry cycle in kPa, ψCPCL,C2 is the matric suction of CPCL at the second wet–dry cycle in kPa, ψCPCL,C3 is the matric suction of CPCL at the third wet–dry cycle in kPa, and w is the moisture content in percentage.

3.1.3. Accuracy of the Filter Paper Method in Measuring the Matric Suction

Several studies, which includes the studies of Yang et al. [45] and Lim et al. [46], have also utilized the filter paper method in determining the relationship of the moisture content of a compacted soil with a wide range of matric suctions, since the method is easy and accessible. However, there are some limitations in utilizing the filter paper method. This includes the precision in conducting the experiment due to the sensitivity of the filter paper to air when being weighed to determine its moisture content and the limited accuracy of the filter paper method in the high suction range. According to Fredlund et al. [47] and Leong et al. [32], the contact filter paper method wherein the set of filter papers is in between two compacted specimens may be inaccurate in the high suction range, because water transport in that range is mostly due to vapor transport rather than capillary transfer. Leong et al. [32] also inferred that, beyond the low suction range, even if the set of filter paper is in contact or non-contact with the specimen, the filter paper method measures only the total suction, or the sum of the matric suction and osmotic suction, due to the water transport, which is mostly vapor transport. Osmotic suction is due to the variation in salt content in the soil pore water [32], which has a minimal contribution on the total suction of the compacted specimen in the study, since distilled water is utilized in the soil preparation and re-saturation; furthermore, the clay mineral present in the specimen is kaolinite, which has a low osmotic suction. It was also inferred that the osmotic suction, which is the difference between the total and matric suction, is almost constant [32]. However, the matric suction must still be verified using other methods that may directly measure it. Thus, in the study of Zhang et al. [48], the matric suction in the high suction range was measured using the vapor equilibrium technique, in which the experimentation period is 1 to 2 months, while, for the lower matric suction range, the filter paper method was utilized.
The limitations of the filter paper method in accurately measuring the matric suction of the specimen as it dries may result in errors in predicting the water retention curve and the corresponding unsaturated hydraulic conductivity. To quantitatively assess the accuracy of the filter paper method in this study, a sensitivity analysis of measurement errors could be conducted in future work. Comparing results with direct measurement methods, such as tensiometers or the pressure plate apparatus, would provide a more comprehensive evaluation of its reliability in various suction ranges.

3.2. Water Retention Best Fit Curve

Several methods and empirical models are available to predict the unsaturated hydraulic conductivity; however, the method of Fredlund et al. [34], expressed in Equation (7), was best suited for clay. In order to utilize Equation (7), the WRC of the specimen must be fitted in accordance with the relationship of the volumetric water content and matric suction proposed by Fredlund et al. [34], expressed in Equation (2). The fitting parameters and WRC variables, such as air entry value and residual matric suction, are often obtained using the graphical method in which tangent lines are drawn at certain portions of the curve. However, in this study, the fitting parameters were obtained using the equations proposed by Zhai and Rahardjo [36]. The slope at the transition zone and the residual zone was obtained through logarithm regression of the semi-log plot of the volumetric water content and obtained matric suction. The matric suction at the inflection point, or the fitting parameter a, and the corresponding volumetric water content were also obtained from the semi-log plot of the volumetric water content and matric suction established in the study. The other WRC variables and fitting parameters were computed using Equations (2)–(6) proposed by Zhai and Rahardjo [36].

3.2.1. Best Fit Curve of the Water Retention Curve for CCL and CL

The computed fitting parameters and points in the WRC of CCL and CL at each wet–dry cycle are tabulated in Table 7. Using the fitting parameters, the best fit curve of the CCL and CL WRCs for each wet–dry cycle was plotted as shown in Figure 21.
It can be observed in Figure 21 that the air entry value of CL is lower than the value for CCL. Thus, as the initial void ratio of the specimen increases, the air entry value increases. The air entry value is the matric suction that keeps the soil in a saturated state. Hence, an increase in suction beyond the air entry value results in a decrease in water in the pore structure, which is replaced by air. Therefore, a higher air entry value denotes that the soil can retain water better than specimens with a lower air entry value. According to Gallage and Uchimura [49], as the pores in the soil structure decrease, the radius of curvature of the meniscus decreases. As a result, the suction required for air to enter the soil fabric increases. Hence, CCL has a better water-holding capacity than CL.
Generally, the decrease in the initial void ratio results in an increase in the matric suction due to the reduction in the radius of the curvature of the meniscus. Thus, residual matric suction is also greater for specimens with a lower initial void ratio, such as CCL, compared to specimens with a higher initial void ratio, CL. The findings from the study of Gallage and Uchimura [49] and Zhou and Yu [39] corroborate the behavior of the air entry value and residual matric suction for specimens that vary in the initial void ratio, in which a lower initial void ratio yields a higher matric suction across the WRC.
When the wet–dry cycle is considered, it can be observed that the air entry value decreases due to the intergranular pores produced through cyclic wetting and drying. According to Nie et al. [42], the specimens with a higher initial void ratio had fewer changes in WRC morphology before and after the wet–dry cycles. The obtained WRC agrees with the findings of Nie et al. [42] regarding the effect of the wet–dry cycle on the morphology of the WRC. In the study, CL had less changes in its WRC morphology for each wet–dry cycle compared to CCL. This denotes that the wet–dry cycles had less impact on the porosity of CL, the specimen with a higher initial void ratio.

3.2.2. Best Fit Curve of the Water Retention Curves for CL and CPCL

The parameters and crucial points in the best fit curve of the CPCL and CL WRCs are tabulated in Table 8. Using the tabulated fitting parameters, the best fit curve was plotted as shown in Figure 22.
It can be observed in Figure 22 that there are differences in the matric suction of CL and CPCL at the lower suction range and at the higher volumetric water content. However, at some point, the matric suction of the two specimen types for a given cycle is equal, which can be located at the intersection of the curves with said conditions. Moreover, there are less noticeable differences between the matric suction of CL and CPCL at the higher suction range. The behavior of the plotted actual WRC and best-fit curve of the WRC agrees with the expected behavior from previous studies that the soil structure will not significantly affect the water-holding capacity at the higher suction range. However, factors that affect the soil structure, such as polyurethane content and the number of wet–dry cycles, significantly affect the matric suction at the lower suction range.

3.3. Predicted Unsaturated Hydraulic Conductivity

The unsaturated hydraulic conductivity was predicted by utilizing the established best fit curve of the WRC for the compacted specimens and the empirical model of Fredlund et al. [34], shown in Equation (7). The predicted unsaturated hydraulic conductivity of CCL, CL, and CPCL are tabulated in Table 9, Table 10 and Table 11, respectively. Furthermore, the semi-log plots of the predicted unsaturated hydraulic conductivity and volumetric water content of CCL, CL, and CPCL are shown in Figure 23, Figure 24 and Figure 25, respectively.
From the plotted relationship of the predicted unsaturated hydraulic conductivity and volumetric water content, it can be observed that the unsaturated hydraulic conductivity decreases as the water content decreases. Thus, as the soil moves to a drier state, the permeability of the specimen decreases, which is attributed to the increased water-holding capacity of the soil at high suction values [50].

Accuracy of the Predicted Unsaturated Hydraulic Conductivity

While the WRC-based method provides a practical approach to predicting the unsaturated hydraulic conductivity, its applicability is most reliable for well-compacted soils. The accuracy of the predicted unsaturated hydraulic conductivity in the study depends on the accuracy of the WRC established using the filter paper method. Although other studies, such as the study of Mabrouk et al. [51], utilized the filter paper method in establishing the WRC of well-compacted and cracked specimens, there are still some parameters that may be established to accurately predict the unsaturated hydraulic conductivity of cracked soils and the soil–water interaction of unsaturated soils.
The approach used in this study represents a simplified model of the complex WRC and unsaturated hydraulic conductivity function, which did not account for the stress-induced volume changes; suction variations, such as total suction and osmotic suction; and the effect of hydraulic hysteresis, since determining the hysteresis of fine-grained soils is often difficult, as discussed by other studies, which includes the studies of Onyelowe et al. [52] and Sadeghi et al. [53]. Onyelowe et al. [52] discussed a study that showcased the importance of establishing the hysteresis of the WRC for eight different fine-grained soil samples, which inferred that soil mineralogy and particle size distribution have a large impact on the hysteresis of the WRC [52,54]. Furthermore, according to Onyelowe et al. [52], the moisture content of cracked soils can rapidly change at very low suctions, which makes it difficult to establish the WRC. Li et al. [52,55] also formulated a method to predict the WRC and unsaturated hydraulic conductivity of a cracked soil based on calculating the changes in the crack volume during the wetting and drying process, accounting for the increase in permeability due to the crack network, since the preferential flow path is an important factor to accurately quantify the amount of liquid that will pass through a cracked unsaturated soil layer.
The primary advantage of the method used in the study is its accessibility and reduced cost compared to direct experimental techniques. By using empirical relationships derived from the WRC data, it enables engineers to make initial estimates of unsaturated hydraulic conductivity without requiring extensive laboratory equipment. While the simplifications mentioned make the model practical for initial estimations, it is important to recognize that a more rigorous approach incorporating these additional factors would improve the accuracy. Future research should explore advanced numerical modeling or laboratory validation to address these complexities. To improve its reliability, future works should incorporate direct experimental validation, particularly for soils subjected to environmental stresses, such as wet–dry cycles. Future research may also explore a bimodal WRC, which may offer a practical approach for predicting the soil–water interaction in cracked soil [52]. Changes in the pore size distribution as the specimen develops crack networks due to undergoing wet–dry cycles may also be considered to improve the model. According to Hu et al. [56], to improve the WRC model, the deformation may be considered by relating the air entry value and/or the pore size distribution index to the void ratio, dry density, or volumetric strain of the specimen. Additionally, a more refined approach should consider the effects of stress-induced volume changes and hydraulic hysteresis, as highlighted in recent studies. This would enhance the accuracy of predictions and broaden the applicability of the method in geotechnical and landfill engineering applications.

4. Conclusions

The challenges in determining the unsaturated hydraulic conductivity gave way for simpler data acquisition, wherein the data acquired also illustrated the soil–water interaction across a wide range of saturation levels and several wet–dry cycles. The changes in the soil structure induced by incorporating polyurethane into the soil mixture had an evident effect on the matric suction. Moreover, the degradation of the soil structure due to the wet–dry cycles was evident based on the findings of the study. The unsaturated hydraulic conductivity predicted using the acquired data also showed that the unsaturated hydraulic conductivity generally decreases as the soil moves to a drier state and as the matric suction increases, inducing a better water-holding capacity of the soil matrix. The findings and relationships established for the clay excavated from a proposed SLF site in Kauswagan, Lanao del Norte, and the polyurethane–clay mixture composed of said clay could be a substantial reference for future studies establishing the progression of desiccation cracks of clay in each wet–dry cycle and how it can be related to the suction as the specimen moves to a drier state. This study provides a simplified approach for estimating unsaturated hydraulic conductivity in compacted polyurethane–clay mixtures using WRC-based models. While direct measurement remains ideal, the proposed method offers a practical alternative for preliminary assessments due to its ease of data acquisition and cost-effectiveness. However, its applicability is less reliable for loose or cracked soils, particularly after repeated wet–dry cycles. Future works should integrate experimental validation to refine predictions and improve modeling accuracy for real-world applications.
It is recommended that future studies consider the presence of cracks in predicting the unsaturated hydraulic conductivity of a compacted layer through several wet–dry cycles, since cracks increase the hydraulic conductivity or permeability of a material. Thus, the volume change may be analyzed by determining the shrinkage and swelling potential in every wet–dry cycle for a more comprehensive study of the effect of saturation and desaturation on the volume change of the compacted clay specimen and how it affects the development of cracks. Moreover, the study did not determine the water retention curve of the wetting process; thus, it is also recommended for future studies to analyze the hysteresis of the water retention curve by conducting experiments that would determine the matric suction during the wetting process. Thus, the developed models in the study are applicable in determining the matric suction during the drying process of a specimen with a similar soil property for a whole range of saturation levels. It is also recommended to increase the number of specimens and directly measure the matric suction and unsaturated hydraulic conductivity of the compacted polyurethane–clay to compare the results obtained in the study from the filter paper method, which determined the matric suction, and the use of the best fit water retention curve with the empirical model to estimate the unsaturated hydraulic conductivity.

Author Contributions

Experimentation and data analysis were the responsibilities of C.F. for her master’s thesis under the supervision of M.A.A. as thesis adviser. Conceptualization, checking of the analyses, review, writing, and editing of the paper for journal submission were the responsibilities of M.A.A. and C.F. All authors have read and agreed to the published version of the manuscript.

Funding

This research was partially funded by the Department of Science and Technology (the Philippines) under the Engineering Research and Development for Technology (ERDT) grant.

Institutional Review Board Statement

Not applicable.

Informed Consent Statement

Not applicable.

Data Availability Statement

The data presented in this study are available on request from the corresponding author. The data are not publicly available due to privacy.

Conflicts of Interest

The authors declare no conflicts of interest.

References

  1. National Solid Waste Management Commission; Japan International Cooperation Agency. Technical Guidebook on Solid Wastes Disposal Design, Operation and Management, 2nd ed.; National Solid Waste Management Commission Office of the Secretariat: Quezon City, Philippines, 2010.
  2. Nikbakht, M.; Sarand, F.B.; Dabiri, R.; Hajialilue Bonab, M. Investigation of the Leachate Effect on Permeability and Geotechnical Characteristics of Fine-Grained Soil Modified Using Nanoclay–Nanofiber Composites. Water 2023, 15, 294. [Google Scholar] [CrossRef]
  3. 40 CFR Part 258—Criteria for Municipal Solid Waste Landfills, n.d. Available online: https://www.ecfr.gov/current/title-40/chapter-I/subchapter-I/part-258 (accessed on 8 February 2025).
  4. Rojas, J.P.; Ruge, J.C.; Carrillo, G.A. Unsaturated Hydraulic Conductivity in Composite Porous Media. Appl. Sci. 2022, 12, 9058. [Google Scholar] [CrossRef]
  5. Zhang, Z.; Zhang, M. A Simple Model for Estimating the Hydraulic Conductivity of Unsaturated Soil. Appl. Sci. 2024, 14, 1254. [Google Scholar] [CrossRef]
  6. Hillel, D. 8—Water Flow in Unsaturated Soil. In Introduction to Environmental Soil Physics; Academic Press: Cambridge, MA, USA, 2003; pp. 149–166. [Google Scholar] [CrossRef]
  7. Luan, X.; Han, L. Variation Mechanism and Prediction of Soil–Water Characteristic Curve Parameters of Low-Liquid-Limit Silty Clay under Freeze–Thaw Cycles. Appl. Sci. 2022, 12, 10713. [Google Scholar] [CrossRef]
  8. Al-Mahbashi, A.M.; Elkady, T.; Al-Shamrani, M. The Role of Stress States on the Hysteric Behavior of Expansive Soil under Multiple Drying-Wetting Cycles. Buildings 2023, 13, 1619. [Google Scholar] [CrossRef]
  9. Suchan, J.; Azam, S. Influence of Desaturation and Shrinkage on Evaporative Flux from Soils. Geotechnics 2022, 2, 412–426. [Google Scholar] [CrossRef]
  10. Santos, D.B.; Sousa, P.F.D.; Cavalcante, A.L.B. Analytical Modeling of Unsaturated Soil Shear Strength during Water Infiltration for Different Initial Void Ratios. Sustainability 2024, 16, 1394. [Google Scholar] [CrossRef]
  11. Karim, M.R.; Hughes, D.; Rahman, M.M. Unsaturated Hydraulic Conductivity Estimation—A Case Study Modelling the Soil-Atmospheric Boundary Interaction. Processes 2022, 10, 1306. [Google Scholar] [CrossRef]
  12. Wang, J.; Zhuang, P.; Luan, J.; Liu, T.; Tan, Y.; Zhang, J. Estimation of Unsaturated Hydraulic Conductivity of Granular Soils from Particle Size Parameters. Water 2019, 11, 1826. [Google Scholar] [CrossRef]
  13. Thankam, N.S.; Rekha, V.; Shankar, U. A comprehensive review of different materials as liners in landfills. Int. J. Civ. Eng. Technol. 2017, 8, 756–773. [Google Scholar]
  14. Qiang, X.; Hai-jin, L.; Zhen-ze, L.; Lei, L. Cracking, water permeability and deformation of compacted clay liners improved by straw fiber. Eng. Geol. 2014, 178, 82–90. [Google Scholar] [CrossRef]
  15. Liu, S.; Wang, Y.; Tian, H.; Sun, S.; Zhang, L.; Zhou, R.; Han, C. Mechanical properties and toughening effect of rice straw fiber-reinforced soil. Case Stud. Constr. Mater. 2024, 21, e03511. [Google Scholar] [CrossRef]
  16. Fink, J. (Ed.) Chapter 8—Clay stabilization. In Hydraulic Fracturing Chemicals and Fluids Technology, 2nd ed.; Gulf Professional Publishing: Houston, TX, USA, 2020; pp. 119–139. [Google Scholar] [CrossRef]
  17. Sethi, D.; Mohanty, S.; Mohapatra, K.K.; Dash, P.K.; Sahoo, S.K.; Padhan, K.; Kusumavathi, K.; Majhi, R.; Panda, N.; Pattanayak, S.K. Exploring the influence of polymers on soil ecosystems: Prospective from agricultural contexts. Front. Chem. Eng. 2024, 6. [Google Scholar] [CrossRef]
  18. Theng, B.K.G. (Ed.) Chapter 6—Some Practical Applications of the Clay–Polymer Interaction. In Developments in Clay Science; Elsevier: Amsterdam, The Netherlands, 2012; pp. 153–199. [Google Scholar] [CrossRef]
  19. Saleh, S.; Yunus, N.M.; Ahmad, K.; Ali, N. Stabilization of marine clay soil using polyurethane. In MATEC Web of Conferences; EDP Sciences: Les Ulis, France, 2018; p. 01004. [Google Scholar]
  20. Buzzi, O.; Fityus, S.; Sloan, S.W. Use of expanding polyurethane resin to remediate expansive soil foundations. Can. Geotech. J. 2010, 47, 623–634. [Google Scholar] [CrossRef]
  21. Frianeza, C.D.; Adajar, M.A.Q. Effectiveness of compacted polyurethane-clay as a sanitary landfill liner. Int. J. GEOMATE 2022, 23, 142–148. [Google Scholar] [CrossRef]
  22. Frianeza, C.D.; Adajar, M.A.Q. Lateral shrinkage of compacted polyurethane-clay subjected to a single wet-dry cycle. Int. J. GEOMATE 2024, 26, 1–8. [Google Scholar] [CrossRef]
  23. ASTM D698; Standard Test Methods for Laboratory Compaction Characteristics of Soil Using Standard Effort. ASTM International: West Conshohocken, PA, USA, 2021.
  24. ASTM D854; Standard Test Methods for Specific Gravity of Soil Solids by Water Pycnometer. ASTM International: West Conshohocken, PA, USA, 2023.
  25. ASTM D4318; Standard Test Methods for Liquid Limit, Plastic Limit, and Plasticity Index of Soils. ASTM International: West Conshohocken, PA, USA, 2017.
  26. ASTM D4943; Standard Test Method for Shrinkage Factors of Soils by the Wax Method. ASTM International: West Conshohocken, PA, USA, 2008.
  27. ASTM D2487; Standard Practice for Classification of Soils for Engineering Purposes (Unified Soil Classification System). ASTM International: West Conshohocken, PA, USA, 2017.
  28. ASTM D7928; Standard Test Method for Particle-Size Distribution (Gradation) of Fine-Grained Soils Using the Sedimentation (Hydrometer) Analysis. ASTM International: West Conshohocken, PA, USA, 2021.
  29. Tiongson, J.M.; Adajar, M.A.Q. Compaction characteristics of a fine-grained soil potential for landfill liner application. GEOMATE J. 2020, 19, 211–218. [Google Scholar] [CrossRef]
  30. Frianeza, C.D.; Adajar, M.A.Q. The effect of the matric suction of compacted Polyurethane-Clay liner on the development of desiccation cracks. Proc. Int. Exch. Innov. Conf. Eng. Sci. (IEICES) 2024, 10, 305–311. [Google Scholar] [CrossRef]
  31. ASTM D 5298-16; Standard Test Methods for Measurement of Soil Potential (Suction) Using Filter Paper. ASTM International: Conshohocken, PA, USA, 2016.
  32. Leong, E.; He, L.; Rahardjo, H. Factors affecting the filter paper method for total and matric suction measurements. Geotech. Test. J. 2002, 25, 322–333. [Google Scholar] [CrossRef]
  33. Kim, H.; Prezzi, M.; Salgado, R. Calibration of Whatman Grade 42 Filter Paper for Soil Suction Measurement. Can. J. Soil Sci. 2016, 97, 93–98. [Google Scholar] [CrossRef]
  34. Fredlund, D.G.; Xing, A.; Huang, S. Predicting the permeability function for unsaturated soils using the soil-water characteristic curve. Can. Geotech. J. 1994, 31, 533–546. [Google Scholar] [CrossRef]
  35. Leong, E.C.; Rahardjo, H. Review of Water Characteristic Curve Functions. Geotech. Geo-Environ. Eng. 1997, 123, 1106–1117. [Google Scholar] [CrossRef]
  36. Zhai, Q.; Rahardjo, H. Determination of soil–water characteristic curve variables. Comput. Geotech. 2012, 42, 37–43. [Google Scholar] [CrossRef]
  37. Birle, E.; Heyer, D.; Vogt, N. Influence of the initial water content and dry density on the soil–water retention curve and the shrinkage behavior of a compacted clay. Acta Geotech. 2008, 3, 191–200. [Google Scholar] [CrossRef]
  38. Chi, Z.; Zeng, G.; Meng, Z.; Wu, S.; Zhang, W.; Tian, R. Experimental study on influence of dry density on soil-water characteristic curve of Hefei expansive soil. IOP Conf. Ser. Earth Environ. Sci. 2019, 384, 012149. [Google Scholar] [CrossRef]
  39. Zhou, J.; Yu, J. Influences affecting the soil-water characteristic curve. J. Zhejiang Univ. Sci. A 2005, 6, 797–804. [Google Scholar] [CrossRef]
  40. Zeng, L.; Li, F.; Liu, J.; Gao, Q.; Bian, H. Effect of initial gravimetric water content and cyclic wetting-drying on soil-water characteristic curves of disintegrated carbonaceous mudstone. Transp. Saf. Environ. 2019, 1, 230–240. [Google Scholar] [CrossRef]
  41. Hajjat, J.; Al-Jeznawi, D.; Sanchez, M.; Avila, G. Effects of Drying and Soil-Base Interface on the Behavior of an Expansive Soil Mixture. Geotech. Geol. Eng. 2020, 38, 4637–4649. [Google Scholar] [CrossRef]
  42. Nie, Y.; Ni, W.; Li, X.; Wang, H.; Yuan, K.; Guo, Y.; Tuo, W. The influence of drying-wetting cycles on the suction stress of compacted loess and the associated microscopic mechanism. Water 2021, 13, 1809. [Google Scholar] [CrossRef]
  43. Sun, Y.; Tang, L.; Xie, J. Relationship between Disintegration Characteristics and Intergranular Suction in Red Soil. Sustainability 2022, 14, 14234. [Google Scholar] [CrossRef]
  44. Zhao, Y.; Cui, Y.; Zhou, H.; Feng, X.; Huang, Z. Effects of void ratio and grain size distribution on water retention properties of compacted infilled joint soils. Soils Found. 2017, 57, 50–59. [Google Scholar] [CrossRef]
  45. Yang, Y.; Yang, L.; Zhao, D.; Guo, Y.; Lin, J.; Jiang, F.; Huang, Y.; Zhang, Y. Thermal effects on the soil water retention curves and hydraulic properties of benggang soil in southern China. Water 2024, 16, 238. [Google Scholar] [CrossRef]
  46. Lim, S.; Indraratna, B.; Heitor, A.; Yao, K.; Jin, D.; Albadri, W.M.; Liu, X. Influence of matric suction on resilient modulus and CBR of compacted Ballina clay. Constr. Build. Mater. 2022, 359, 129482. [Google Scholar] [CrossRef]
  47. Fredlund, D.G.; Rahardjo, H. Soil Mechanics for Unsaturated Soils; Wiley & Sons: Hoboken, NJ, USA, 1993. [Google Scholar] [CrossRef]
  48. Zhang, Z.; Bao, W.; Tian, L.; Huang, Z.; Chen, R. Study on the effect of pore structure changes induced by freeze-thaw-wetting-drying cycles on water retention characteristics of compacted loess. Constr. Build. Mater. 2024, 455, 139213. [Google Scholar] [CrossRef]
  49. Gallage, C.P.; Uchimura, T. Effects of dry density and grain size distribution on soil-water characteristic curves of sandy soils. Soils Found. 2010, 50, 161–172. [Google Scholar] [CrossRef]
  50. Bhatnagar, D.; Nagarajarao, Y.; Gupta, R.P. Influence of water content and soil properties on unsaturated hydraulic conductivity of some red and black soils. Z. Pflanzenernährung Bodenkd. 1979, 142, 99–108. [Google Scholar] [CrossRef]
  51. Mabrouk, A.; Jamei, M.; Ahmed, A. Measured and predicted unsaturated permeability of cracked compacted fine soil. Eng. Technol. Appl. Sci. Res. 2024, 14, 13953–13958. [Google Scholar] [CrossRef]
  52. Onyelowe, K.C.; Mojtahedi, F.F.; Azizi, S.; Mahdi, H.A.; Sujatha, E.R.; Ebid, A.M.; Darzi, A.G.; Aneke, F.I. Innovative overview of SWRC application in modeling Geotechnical Engineering Problems. Designs 2022, 6, 69. [Google Scholar] [CrossRef]
  53. Sadeghi, H.; Heydari, A.; Zhou, C. Insights into the fluid retention and shrinkage of a lean clay under the combined influence of microstructure, solute concentration and salt species. Acta Geotech. 2024, 19, 4855–4872. [Google Scholar] [CrossRef]
  54. Iyer, K.K.R.; Joseph, J.; Lopes, B.C.F.L.; Singh, D.N.; Tarantino, A. Water retention characteristics of swelling clays in different compaction states. Geomech. Geoengin. 2017, 13, 88–103. [Google Scholar] [CrossRef]
  55. Li, J.; Lu, Z.; Guo, L.; Zhang, L. Experimental study on soil-water characteristic curve for silty clay with desiccation cracks. Eng. Geol. 2017, 218, 70–76. [Google Scholar] [CrossRef]
  56. Hu, R.; Chen, Y.; Liu, H.; Zhou, C. A water retention curve and unsaturated hydraulic conductivity model for deformable soils: Consideration of the change in pore-size distribution. Géotechnique 2013, 63, 1389–1405. [Google Scholar] [CrossRef]
Figure 1. Specimens curing inside an insulated chest.
Applsci 15 02411 g001
Figure 2. Saturation of the compacted specimens.
Applsci 15 02411 g002
Figure 3. Wet–dry cycle of the compacted specimens.
Applsci 15 02411 g003
Figure 4. Set of filter papers: (a) Whatman No. 42 and (b) ashless quantitative filter paper.
Applsci 15 02411 g004
Figure 5. Experimental setup of the filter paper method.
Applsci 15 02411 g005
Figure 6. Illustration of the best fit WRC adopted from [36].
Applsci 15 02411 g006
Figure 7. Matric suction of compacted clay with varying initial void ratios.
Applsci 15 02411 g007
Figure 8. Oven-dried (a) CCL and (b) CL at the end of the 1st wet–dry cycle.
Applsci 15 02411 g008
Figure 9. Saturated (a) CCL and (b) CL at the start of the 2nd wet–dry cycle.
Applsci 15 02411 g009
Figure 10. Oven-dried (a) CCL and (b) CL at the end of the 2nd wet–dry cycle.
Applsci 15 02411 g010
Figure 11. Saturated (a) CCL and (b) CL at the start of the 3rd wet–dry cycle.
Applsci 15 02411 g011
Figure 12. Air-dried (a) CCL and (b) CL at the level 7 moisture content of the 3rd wet–dry cycle.
Applsci 15 02411 g012
Figure 13. SEM image of (a) loose clay [21], (b) CCL before the wet–dry cycles, and (c) CCL after three wet–dry cycles.
Applsci 15 02411 g013
Figure 14. SEM image of (a) loose clay [21], (b) CL before the wet–dry cycles, and (c) CL after three wet–dry cycles.
Applsci 15 02411 g014
Figure 15. A 3D model of CCL and CL WRC for the (a) 1st, (b) 2nd, and (c) 3rd wet–dry cycles.
Applsci 15 02411 g015
Figure 16. Predicted vs. actual matric suction of CCL and CL.
Applsci 15 02411 g016
Figure 17. Matric suction of CL and CPCL with the same initial void ratio.
Applsci 15 02411 g017
Figure 18. Changes in CPCL at different stages in the three wet–dry cycles.
Applsci 15 02411 g018
Figure 19. SEM image of (a) loose polyurethane–clay, (b) CPCL before the wet–dry cycles, and (c) CPCL after three wet–dry cycles.
Applsci 15 02411 g019
Figure 20. Predicted vs. actual matric suction of CPCL and CL.
Applsci 15 02411 g020
Figure 21. Best fit curves of the WRCs for CCL and CL.
Applsci 15 02411 g021
Figure 22. Best fit curves of the WRCs for CL and CPCL.
Applsci 15 02411 g022
Figure 23. Predicted unsaturated hydraulic conductivity of CCL.
Applsci 15 02411 g023
Figure 24. Predicted unsaturated hydraulic conductivity of CL.
Applsci 15 02411 g024
Figure 25. Predicted unsaturated hydraulic conductivity of CPCL.
Applsci 15 02411 g025
Table 1. Sample mix proportions [21].
PU ContentDried ClayPUDried Clay and PUWater
0%68.26 kg0.00 kg68.26 kg31.74 kg
3%66.22 kg2.04 kg68.26 kg31.74 kg
Table 2. Soil index properties [21].
ASTMSoil PropertyClayPolyurethane–Clay
D698 [23]Optimum moisture content (%)31.15---
D854 [24]Specific gravity2.412.86
D4318 [25]Liquid limit (%)7368
D4318Plastic limit (%)4748
D4318Plasticity index (%)2620
D4943 [26]Shrinkage limit (%)2829
D2487 [27]Soil classificationMHMH with Sand
D7928 [28]D60 (mm)0.004800.02025
Table 3. Compaction efforts [21].
SpecimenPU ContentInitial Void RatioCompaction Effort
CCL0%1.06Standard proctor (600 kN-m/m3)
CPCL3%1.44Standard proctor (600 kN-m/m3)
CL0%1.44Less than the standard proctor
Table 4. Target moisture contents of the compacted specimens [30].
Moisture Content LevelTarget Moisture Content (%)
CCLCLCPCL
Level 143.9859.7550.35
Level 237.6951.2143.15
Level 331.4542.7236.00
Level 425.1634.1828.80
Level 518.8725.6321.60
Level 612.5817.0914.40
Level 76.298.547.20
Level 80.000.000.00
Table 5. Analysis of variance of CCL and CL matric suction.
SourceSum of SquaresDegrees of FreedomMean SquareF-Valuep-Value
Model418.171138.02144.32<0.0001Significant
Moisture content371.461371.461410.20<0.0001Significant
Void ratio0.1910.190.720.3990Insignificant
Cycle3.7421.877.110.0012Significant
Table 6. Analysis of variance of CPCL and CL matric suction.
SourceSum of SquaresDegrees of FreedomMean SquareF-Valuep-Value
Model480.091048.01202.12<0.0001Significant
Moisture content459.971459.971936.52<0.0001Significant
Polyurethane content1.9511.958.230.0048Significant
Cycle3.3221.667.000.0013Significant
Table 7. Fitting parameters of the best fit curve of the WRC for CCL and CL.
Specimen Type and Number of CyclesCCL-1CCL-2CCL-3CL-1CL-2CL-3
Slope at transition zone, S10.3180.2270.2890.2280.2190.190
Slope at residual zone, S20.0660.0680.0650.0700.0670.061
Fitting parameter, m4.4754.4254.3266.0665.1986.499
Fitting parameter, n0.6860.4890.6200.4360.3870.381
Fitting parameter, a (kPa)34,00032,00034,50030,00030,00039,000
Volumetric water content at inflection point, θi0.2170.2200.2260.1800.2280.160
Saturated volumetric water content, θs0.7340.7340.7340.9390.9390.939
Air entry value, ψb (kPa)804.81174.11602.6114.0717.003.10
Residual volumetric water content, θr0.0660.0860.0720.0760.0940.071
Residual matric suction, ψr (kPa)101,601124,573117,65185,388123,299114,608
Table 8. Fitting parameters of the best fit curve of the WRCs for CL and CPCL.
Specimen Type and Number of CyclesCL-1CL-2CL-3CPCL-1CPCL-2CPCL-3
Slope at the transition zone, S10.2280.2190.1900.2060.1590.193
Slope at residual zone, S20.0700.0670.0610.0710.0810.073
Fitting parameter, m6.0665.1986.4995.2304.9975.845
Fitting parameter, n0.4360.3870.3810.3850.2920.381
Fitting parameter, a (kPa)30,00030,00039,00025,50026,00026,500
Volumetric water content at inflection point, θi0.1800.2280.1600.2140.2280.181
Saturated volumetric water content, θs0.9390.9390.9390.8890.8890.889
Air entry value, ψb (kPa)14.0717.003.1013.491.815.69
Residual volumetric water content, θr0.0760.0940.0710.0960.1340.088
Residual matric suction, ψr (kPa)85,388123,29911,46089571610,184979,979
Table 9. Predicted unsaturated hydraulic conductivity of CCL.
Degree of Saturation (%)Volumetric Water ContentUnsaturated Hydraulic Conductivity (cm/s)
1st Cycle2nd Cycle3rd Cycle
98.960.7342.27 × 10−82.27 × 10−82.27 × 10−8
81.440.6048.77 × 10−96.16 × 10−98.08 × 10−9
64.720.4803.19 × 10−91.62 × 10−92.70 × 10−9
49.210.3651.14 × 10−94.53 × 10−109.01 × 10⁻¹⁰
35.190.2613.60 × 10−101.14 × 10−102.66 × 10⁻¹⁰
22.250.1658.15 × 10−111.96 × 10−115.43 × 10⁻¹¹
8.870.0663.72 × 10−138.45 × 10−133.34 × 10⁻¹³
3.970.0292.76 × 10−137.30 × 10−141.62 × 10⁻¹³
Table 10. Predicted unsaturated hydraulic conductivity of CL.
Degree of Saturation (%)Volumetric Water ContentUnsaturated Hydraulic Conductivity (cm/s)
1st Cycle2nd Cycle3rd Cycle
100.000.9397.28 × 10−57.28 × 10−57.28 × 10−5
88.960.7641.09 × 10−51.05 × 10−56.49 × 10−6
69.860.6002.53 × 10−61.98 × 10−61.23 × 10−6
52.630.4526.63 × 10−74.44 × 10−72.84 × 10−7
37.030.3181.57 × 10−79.00 × 10−86.05 × 10−8
23.060.1982.71 × 10−81.28 × 10−89.35 × 10−9
8.900.0766.46 × 10−103.18 × 10−101.48 × 10⁻¹⁰
4.540.0398.84 × 10−111.84 × 10−111.48 × 10⁻¹¹
Table 11. Predicted unsaturated hydraulic conductivity of CPCL.
Degree of Saturation (%)Volumetric Water ContentUnsaturated Hydraulic Conductivity (cm/s)
1st Cycle2nd Cycle3rd Cycle
100.000.8892.90 × 10−82.90 × 10−82.90 × 10−8
84.000.7254.21 × 10−92.30 × 10−93.33 × 10−9
66.740.5768.37 × 10−102.58 × 10−106.82 × 10⁻¹⁰
50.400.4351.86 × 10−103.85 × 10−111.52 × 10⁻¹⁰
35.800.3093.89 × 10−115.65 × 10−123.25 × 10⁻¹¹
22.480.1945.68 × 10−125.50 × 10−134.94 × 10⁻¹²
11.080.0962.48 × 10−138.22 × 10−142.03 × 10⁻¹³
5.930.0512.03 × 10−146.76 × 10−152.46 × 10⁻¹⁴
Disclaimer/Publisher’s Note: The statements, opinions and data contained in all publications are solely those of the individual author(s) and contributor(s) and not of MDPI and/or the editor(s). MDPI and/or the editor(s) disclaim responsibility for any injury to people or property resulting from any ideas, methods, instructions or products referred to in the content.

