Article

A Novel Pseudo-Siamese Fusion Network for Enhancing Semantic Segmentation of Building Areas in Synthetic Aperture Radar Images

1
Sanya Institute of Hunan University of Science and Technology, Sanya 572024, China
2
School of Earth Sciences and Spatial Information Engineering, Hunan University of Science and Technology, Xiangtan 411201, China
*
Author to whom correspondence should be addressed.
Appl. Sci. 2025, 15(5), 2339; https://doi.org/10.3390/app15052339
Submission received: 19 January 2025 / Revised: 19 February 2025 / Accepted: 20 February 2025 / Published: 21 February 2025
(This article belongs to the Special Issue Advances in Computer Vision and Semantic Segmentation, 2nd Edition)

Abstract

:
Segmenting building areas from synthetic aperture radar (SAR) images holds significant research value and practical application potential. However, the complexity of the environment, the diversity of building shapes, and the interference from speckle noise have made building area segmentation from SAR images a challenging research topic. Compared to traditional methods, deep learning-driven approaches exhibit superiority in the aspect of stability and efficiency. Currently, most segmentation methods use a single neural network to encode SAR images, then decode them through interpolation or transpose convolution operations, and finally obtain the segmented building area images using a loss function. Although effective, the methods result in the loss of detailed information and do not fully extract the deep-level features of building areas. Therefore, we propose an innovative network named PSANet. First, two sets of deep-level features of building areas were extracted using ResNet-18 and ResNet-34, with five encoded features of varying scales obtained through a fusion algorithm. Meanwhile, information on the deepest-level encoded features was enriched utilizing an atrous spatial pyramid pooling module. Next, the encoded features were reconstructed through skip connections and transposed convolution operations to obtain discriminative features of the building areas. Finally, the model was optimized using the combined CE-Dice loss function to achieve superior performance. The experimental results of the SAR images from regions with different geographical characteristics demonstrate that the proposed PSANet outperforms several recent State-of-the-Art methods.

1. Introduction

Buildings, as fundamental components of urban structure, embody the core attributes and functions of a city. Building segmentation refers to the use of image segmentation algorithms to distinguish building areas from non-building areas in remote sensing images [1]. This not only aids in the precise analysis of urban layout but also provides valuable data support for fields such as urban construction [2,3], disaster analysis [4,5], and ecological monitoring [6,7].
SAR is an active remote sensing system that collects surface information by emitting microwave pulses and receiving the corresponding echo signals. The microwave band’s characteristics allow SAR to operate independently of factors like lighting conditions and cloud cover, ensuring functionality in all weather conditions. This capability makes SAR an essential tool in remote sensing applications. However, SAR images differ significantly from optical images in terms of their imaging mechanism, geometric characteristics [8], radiometric properties, and so on. These differences make information extraction from SAR images more complex, thereby making semantic segmentation on SAR images more challenging than on optical images.
To achieve precise building area segmentation, numerous studies have been conducted. Prior to the widespread adoption of deep learning technologies, researchers mainly utilized four traditional methods for this task. The first method, based on threshold segmentation [9], distinguishes between building areas and the background by setting an appropriate intensity threshold. This method is simple and computationally efficient, but it is only suitable for situations with a significant contrast between building areas and the background and performs poorly in extracting complex background images. The second method uses edge detection [10] to extract edge information from building areas, thereby obtaining their contours. However, the extraction process is susceptible to noise interference, which can result in unclear contours of building areas. The third method employs the region-growing method [11], starting from one or more seed pixels in the images and gradually adding neighboring pixels with similar characteristics until all pixels are classified into the corresponding regions. While this method can effectively handle clear and uniform building areas, inappropriate seed points may lead to inaccurate region growth, which affects the final result. The fourth method is feature extraction [12], which involves extracting key features from images using manually designed algorithms and then classifying these features with traditional machine learning methods, such as support vector machines [13] and random forest [14]. Although this method performs well in terms of accuracy and interpretability, feature design is highly dependent on the researcher’s experience, and different scenarios may require different feature designs, which demand considerable time and effort. As artificial intelligence evolves, deep learning-based building area segmentation methods have significantly reduced the need for manual intervention and improved segmentation efficiency. As a result, an increasing number of researchers are dedicated to designing deep learning-based architectures for building area segmentation. However, due to the impact of geometric distortions and speckle noise in SAR images, most building area segmentation methods are primarily optimized for optical images, while methods for SAR images are relatively scarce. So far, building area segmentation from SAR images mainly relies on encoder–decoder architecture. The main idea behind this architecture is to gradually extract deep-level features of building areas using the encoder, subsequently using the decoder to transform the features into pixel-level segmentation results. Emek et al. applied the classic encoder–decoder U-Net architecture to segment building areas in SAR images, achieving decent segmentation results [15]. Jing et al. used an encoder with a selective spatial pyramid dilation structure and a dual-stage decoder, effectively showcasing details of large-scale building areas [16]. Peng et al. designed an encoder–decoder architecture combined with attention mechanisms to enhance the distinction between building areas and background, effectively locating building areas in SAR images [17]. Although these algorithms have good segmentation performance, there are also some limitations. On the one hand, these algorithms use a single convolutional neural network (CNN) for encoding SAR images during the encoding stage. However, owing to the interference of speckle noise and geometric distortions in SAR images, the single CNN struggles to effectively extract deep-level features of building areas. On the other hand, a single CNN typically uses continuous convolution and pooling operations to extract features, which can easily result in the loss of small-scale building area information.
To address the shortcomings of current building area segmentation networks for SAR images, we propose an innovative encoder–decoder network. Specifically, we replaced a single neural network with an improved Pseudo-Siamese network during the encoding phase to address the limitations of the single network in feature extraction. Meanwhile, we used an atrous spatial pyramid pooling module to enrich the multi-scale information of the deepest encoded features, reducing the loss of small-scale building area information. Next, we designed a hierarchical decoder that combines the merits of transposed convolutions and skip connections to fuse the decoding features with the encoded features of the corresponding spatial size for decoding, effectively reconstructing the details of the building areas. This study makes the following main contributions:
  • We designed an innovative network for the segmentation of building areas in SAR images, named PSANet, which extends the existing encoder–decoder architecture. Additionally, extensive experiments were conducted across regions with diverse geographical characteristics, and the outcomes indicate the advanced performance of PSANet in building area segmentation;
  • We constructed a new encoding network based on a Pseudo-Siamese structure to extract building area features from SAR images, achieving efficient feature encoding;
  • We combined the advantages of skip connections and transposed convolutions to design a hierarchical decoder. Meanwhile, to reduce noise interference, we constructed feature refinement modules in the skip connections, thereby achieving more accurate feature reconstruction.

2. Related Work

2.1. Advances in Encoder Research for Building Area Segmentation

Building area segmentation faces numerous challenges, such as variations in building scale and noise interference. As the core modules of segmentation models, the encoder’s primary function is to extract deep-level features of building areas from raw images, playing a crucial role in building area segmentation tasks. Currently, encoders commonly used for building area segmentation can be broadly classified into two types. The first type is based on CNNs [18], which extract features of building areas from images through convolution operations, excelling at capturing detailed information about building areas. However, owing to the inherent restriction of the receptive field in convolutions, CNNs are relatively weak at extracting global features of building areas. The second type is based on a transformer [19], which uses the self-attention mechanism to model the dependencies between input sequences. Compared to CNNs, transformers can more effectively extract global features of building areas. However, transformers have some drawbacks, including high computational costs, susceptibility to overfitting, and dependence on large-scale labeled datasets. Thus, we designed a CNN-based improved Pseudo-Siamese network, aiming to improve computational efficiency and enhance the ability to extract building area features from images.

2.2. Advances in Decoder Research for Building Area Segmentation

In neural networks, the encoder and decoder are complementary modules. The encoder is in charge of extracting deep-level features of the target from the original image, while the decoder gradually restores these features to generate an output image that matches the original resolution. Currently, decoders commonly used for building area segmentation can be broadly classified into three types. The first type is transposed convolution [20], which increases the resolution of feature maps through stride expansion and convolution kernel weighting operations. Although this can better restore spatial information, transposed convolution may cause checkerboard effects in the feature maps. The second type is based on interpolation techniques, typically using bilinear interpolation [21], which employs non-parametric methods for feature reconstruction, offering advantages in computational efficiency and effectively avoiding checkerboard effects. However, its performance in detail restoration is relatively inadequate. The third type is based on skip connections [22], which fuse encoded features during the decoding process. Although this method helps recover more detailed information, inappropriate fusion may introduce noise, affecting segmentation performance. As a result, to enhance the reconstruction of building area details and prevent the checkerboard effect, we designed a hierarchical decoder combining the advantages of skip connections and transposed convolutions. Meanwhile, in response to the impact of noise, we designed feature refinement modules in the skip connections to effectively reduce noise interference.

3. Methods

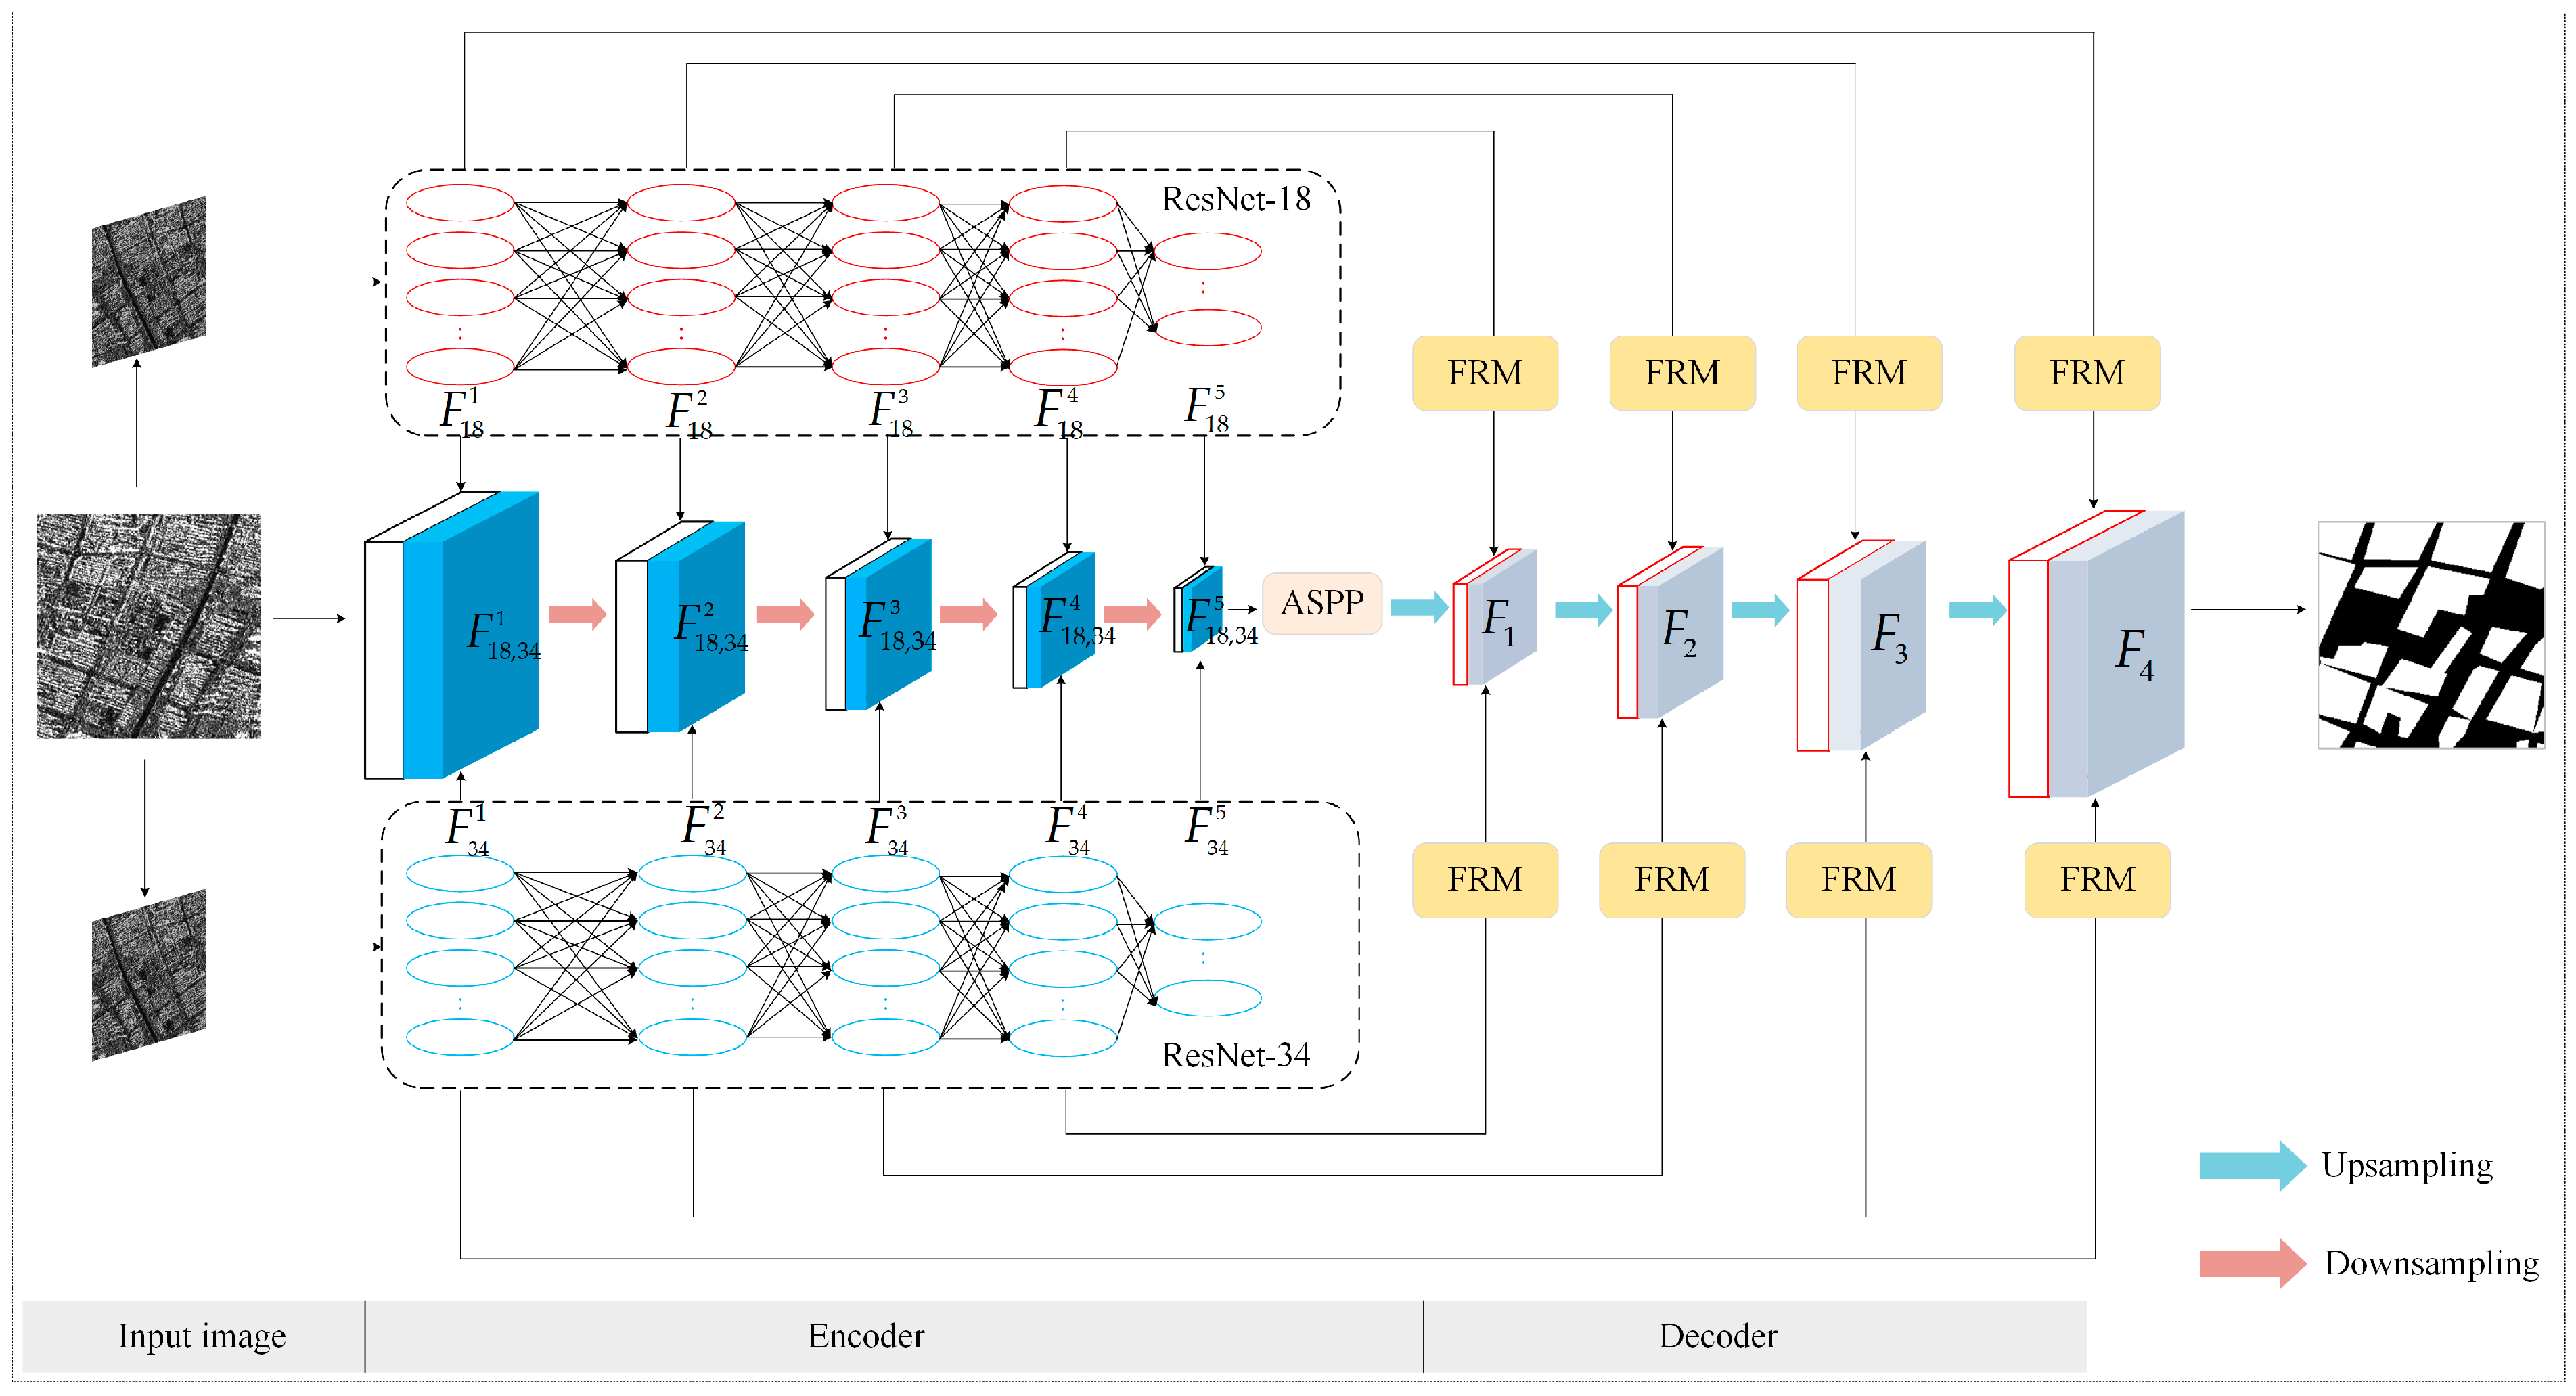
3.1. Overview of the PSANet Structure

PSANet is designed to accurately segment building areas from SAR images. In the encoding stage, PSANet enhances its ability to encode building area features by combining different CNNs, which is crucial for accurate segmentation. In the decoding stage, transposed convolutions and skip connections methods are used to effectively integrate the encoded features into the decoding process, reducing the loss of detailed information resulting from upsampling. The general structure of PSANet is made up of four primary components: a Pseudo-Siamese fusion encoding network, atrous spatial pyramid pooling, a hierarchical decoder, and a feature refinement module, as presented in Figure 1.

3.2. Encoder

3.2.1. Pseudo-Siamese Fusion Encoding Network

During the encoding process, most building area segmentation methods for SAR images use a single CNN to extract building area features. Although the encoding method performs well in terms of computational efficiency, the influence of speckle noise and geometric distortions in SAR images hinders the extraction of deep-level features of building areas using a single CNN. Pseudo-Siamese networks adopt certain concepts from Siamese networks, allowing input data to be processed through distinct networks to extract different features from the same data [23]. Motivated by the architecture, we designed an encoding network based on the Pseudo-Siamese structure that fuses features extracted by different networks during the encoding phase, aiming to produce richer feature representations that enable PSANet to segment building areas from SAR images more accurately.
To efficiently extract features of building areas while reducing the computational cost, we employed the residual neural networks ResNet18 and ResNet34 [24]. The ResNet18 and ResNet34 networks used in our study were modified by removing the global pooling and fully connected layers. The modified models retain the first convolutional layer and four residual modules, totaling five components. The features output by these components are denoted as F 18 1 , F 18 2 , F 18 3 , F 18 4 , and F 18 5 for the ResNet18 network, and F 34 1 , F 34 2 , F 34 3 , F 34 4 , and F 34 5 for the ResNet34 network. The computational processes of the first convolutional layer and the residual modules are outlined below:
F 18 1 = R e L U ( B N ( f 3 × 3 ( i n p u t ) ) )
F 18 i = R e L U   ( B N   ( f 3 × 3 ( R e L U   ( B N ( f 3 × 3 ( F 18 i - 1 ) ) ) ) ) + f 1 × 1 ( F 18 i - 1 ) ) ,   i = 2 , 3 , 4 , 5
where BN(⋅) denotes the batch normalization, ReLU(⋅) denotes the ReLU function, f 1 × 1 (⋅) denotes the computation using a 1 × 1 convolution kernel, and f 3 × 3 (⋅) denotes the computation using a 3 × 3 convolution kernel.
During the fusion of the two groups of features extracted from ResNet-18 and ResNet-34, a fusion encoding algorithm was designed, as presented in Figure 2.
First, the features F 18 1 and F 34 1 extracted from ResNet18 and ResNet34 were concatenated. Next, the concatenated features were padded with zeros on both sides, followed by a convolution operation that reduced the channel number by half. Meanwhile, a batch normalization layer (BN) and ReLU activation function were sequentially applied after each convolution operation. Finally, to prevent gradient loss, a similar operation was applied again, but the channel count remained unchanged, resulting in the fused feature F 18,34 1 . Differently, for each subsequently generated fusion feature F 18,34 n , where n = 2, 3, 4, 5 correspond to the four features generated by fusing the residual modules in ResNet-18 and ResNet-34, we concatenated the previous fusion feature in the fusion algorithm. Their calculation formulas are as follows:
F 18,34 1 = R e L U ( B N ( f 3 × 3 ( R e L U ( B N ( f 3 × 3 ( C ( F 34 1 , F 18 1 ) ) ) ) ) ) )
F 18,34 n = R e L U ( B N ( f 3 × 3 ( R e L U ( B N ( f 3 × 3 ( C ( F 34 n , F 18 n , F 18,34 n 1 ) ) ) ) ) ) )
where C(⋅) denotes the concatenation function.

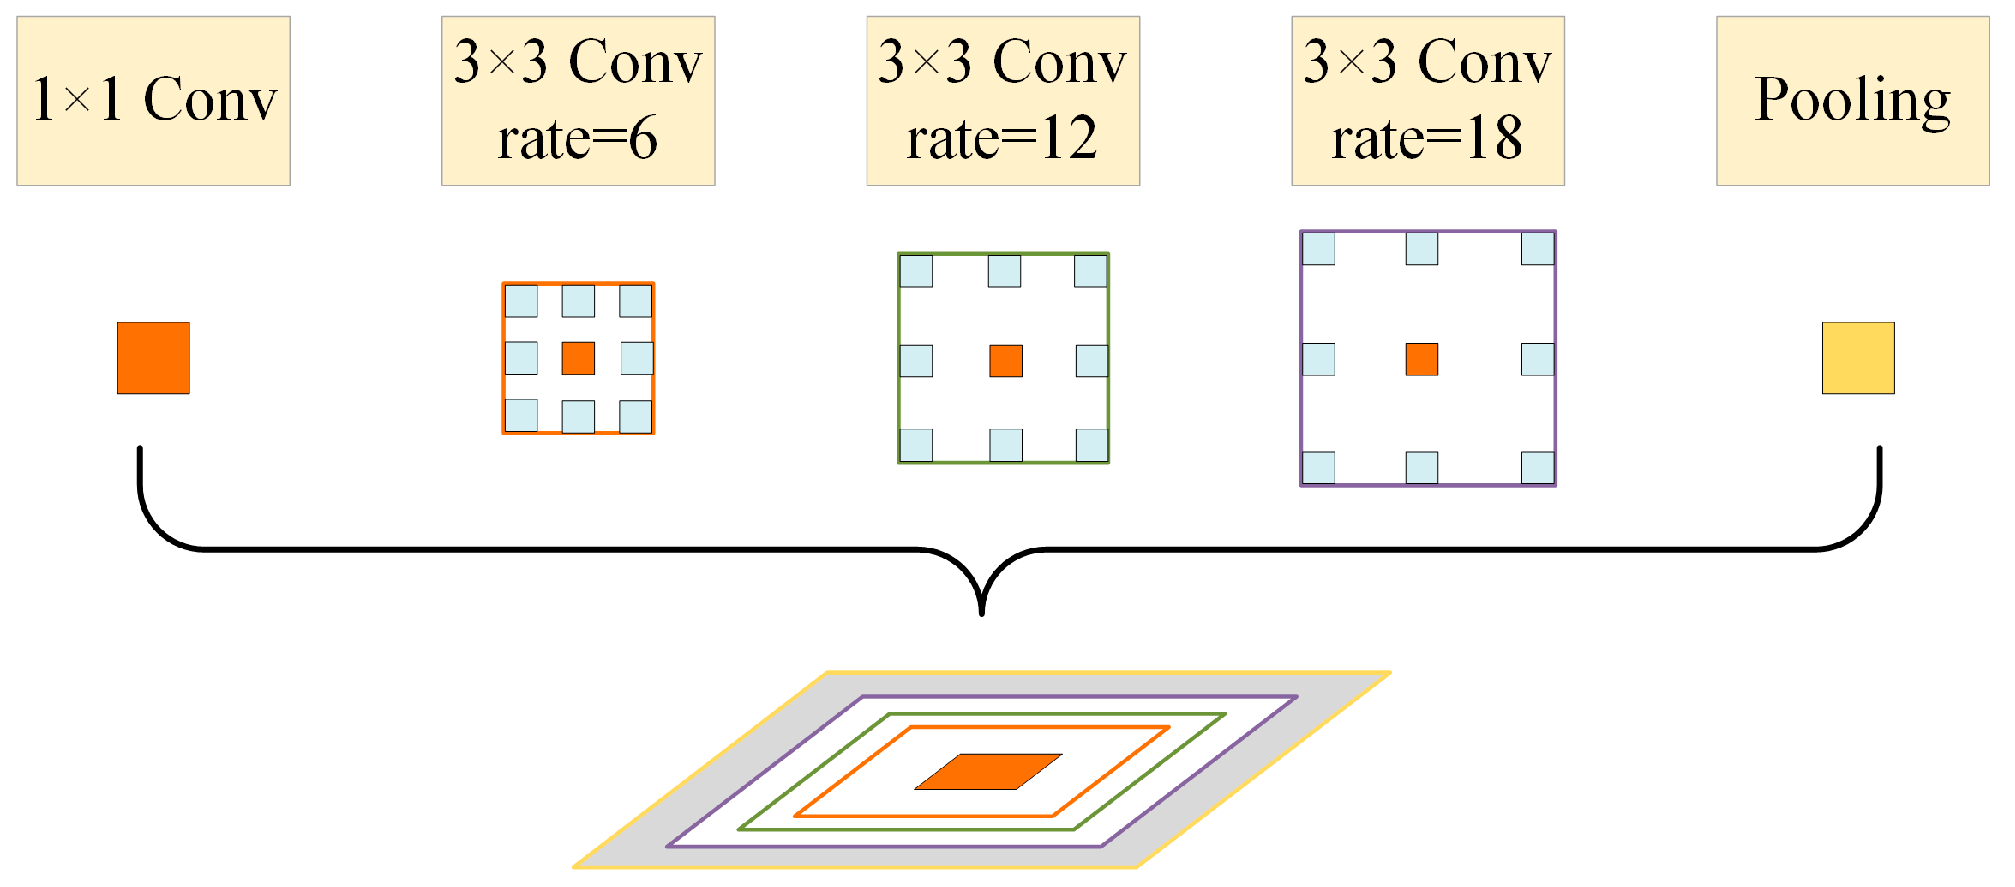
3.2.2. Atrous Spatial Pyramid Pooling

The shape and sizes of buildings vary across different scenes, making it difficult for single-scale features to fully represent building areas. Meanwhile, the pooling layers in CNNs cause the loss of small-scale building area information during feature extraction. To address the issues, we incorporated atrous spatial pyramid pooling (ASPP) [25] during the encoding stage. ASPP utilizes three parallel dilated convolutions, with dilated rates of [6,12,18] selected based on reference [25], to extract features at different receptive fields, thereby enhancing the ability to capture features from targets of varying scales. The structure of ASPP is shown in Figure 3.
In practice, F 18,34 5 was first processed through a 1 × 1 convolutional layer, three 3 × 3 convolutional layers with dilation rates of 6, 12, and 18, and ASPP pooling, which included an average pooling layer, a 1 × 1 convolutional layer, and an upsampling operation. Subsequently, the outputs were concatenated, and a 1 × 1 convolutional layer was applied to reduce the channel number of the concatenated feature maps to match the channel count of F 18,34 5 , generating the processed feature map F 18,34 ( 5 ) . Formally,
F 18,34 ( 5 ) = f 1 × 1 ( C ( f 3 × 3 ( F 18,34 5 ) , f 3 × 3 ( F 18,34 5 ) , f 3 × 3 ( F 18,34 5 ) , f 1 × 1 ( F 18,34 5 ) , U p ( f 1 × 1 ( G A P ( F 18,34 5 ) ) ) ) )
where Up(⋅) denotes the upsampling operation, and GAP(⋅) denotes the global average pooling operation.

3.3. Decoder

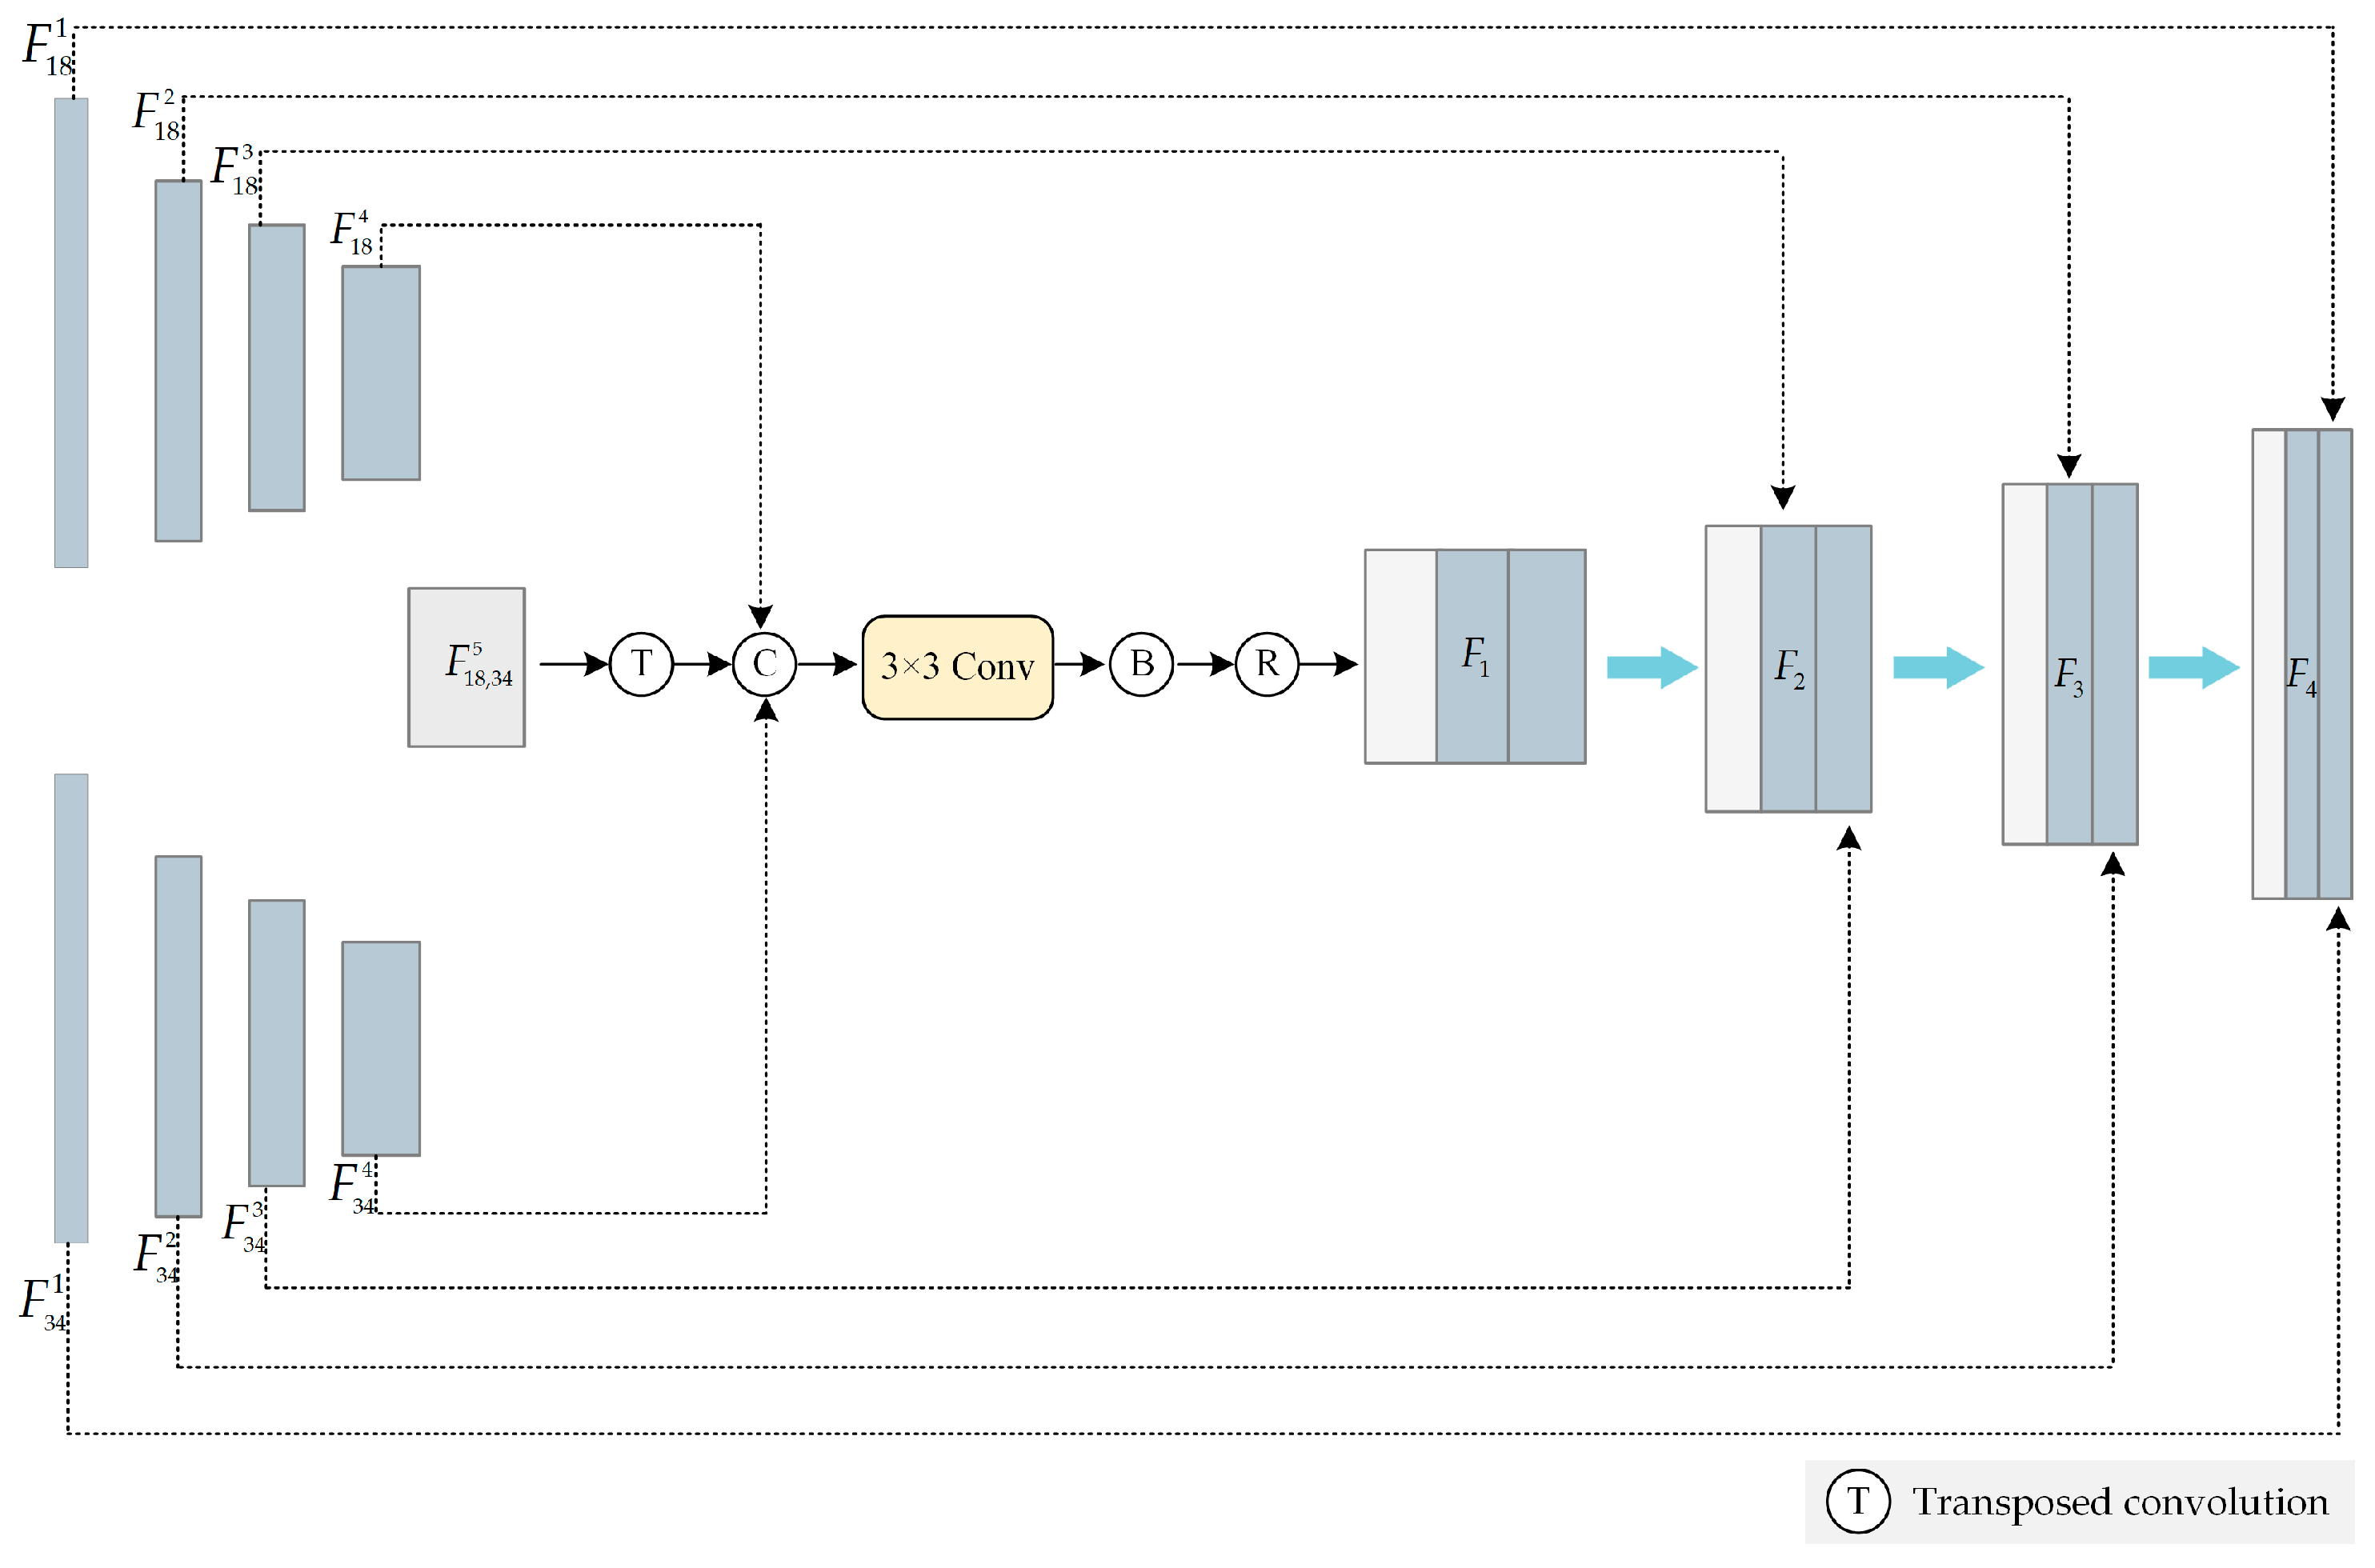
3.3.1. Hierarchical Decoder

After encoding the target features, the decoding stage needs to accurately restore the encoded features to the original image size. Using interpolation for decoding may result in the loss of detailed information, negatively affecting the segmentation accuracy. To solve the problem, we designed a hierarchical decoder that integrates decoding features with the encoded features of corresponding spatial sizes for decoding, thereby minimizing the loss of detailed information. The hierarchical decoder consists of four upsampling modules, and its structure is shown in Figure 4.
In practice, the encoder feature map F 18,34 ( 5 ) was first processed with transposed convolution to increase its resolution to the feature space dimensions of the penultimate residual module in the Pseudo-Siamese fusion encoding network. Subsequently, the output was combined with the encoded feature maps F 18 4 and F 34 4 using a concatenation operation. Finally, the concatenated feature maps sequentially were processed through a convolutional layer with a kernel size of 3 × 3, a BN layer, and a ReLU function to produce the output F 1 of the first upsampling module. Formula 6 can be used to represent the calculation carried out in the first upsampling module, and the processing method for the remaining upsampling modules is similar:
F 1 = R e L U ( B N ( f 3 × 3 ( C ( T ( F 18,34 ( 5 ) ) , F 18 4 , F 34 4 ) ) ) )
where T(⋅) denotes the transposed convolution operation.

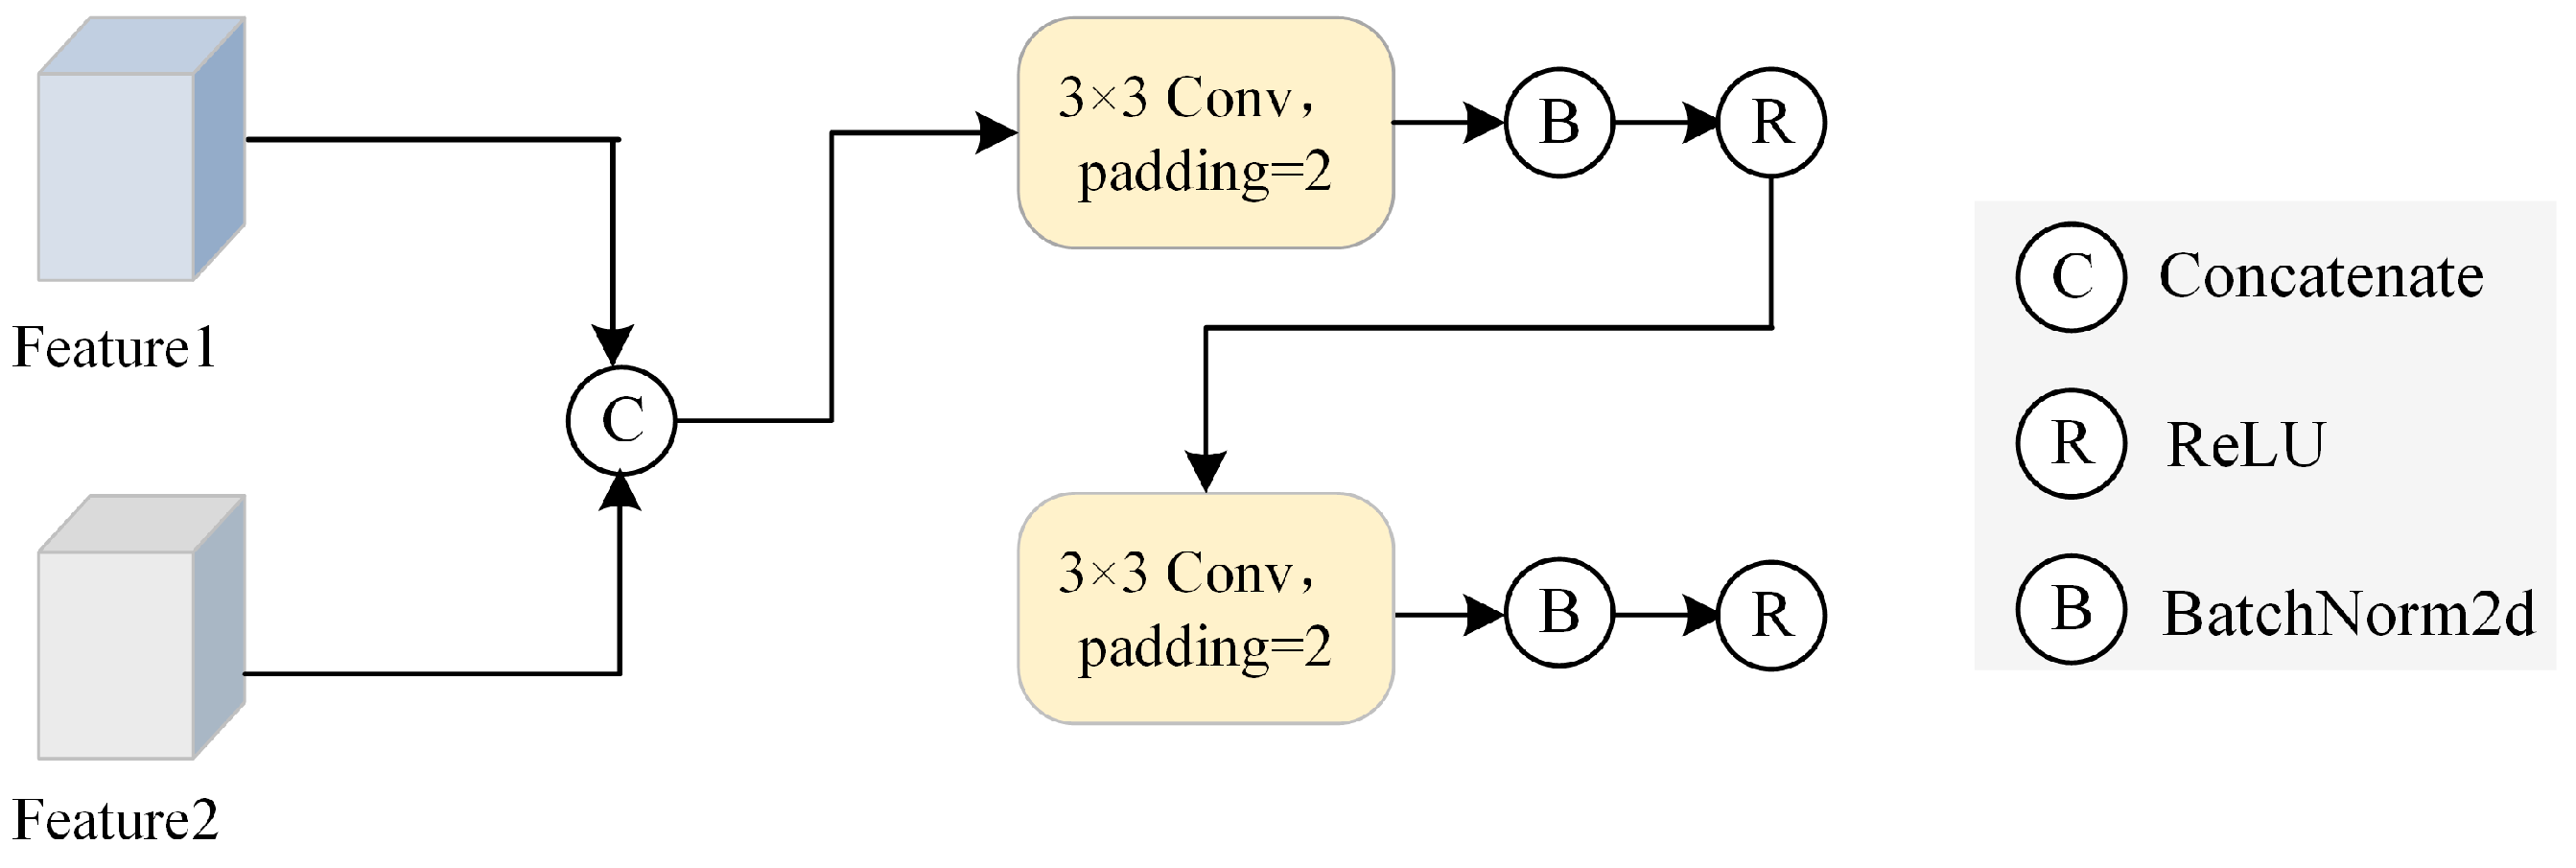
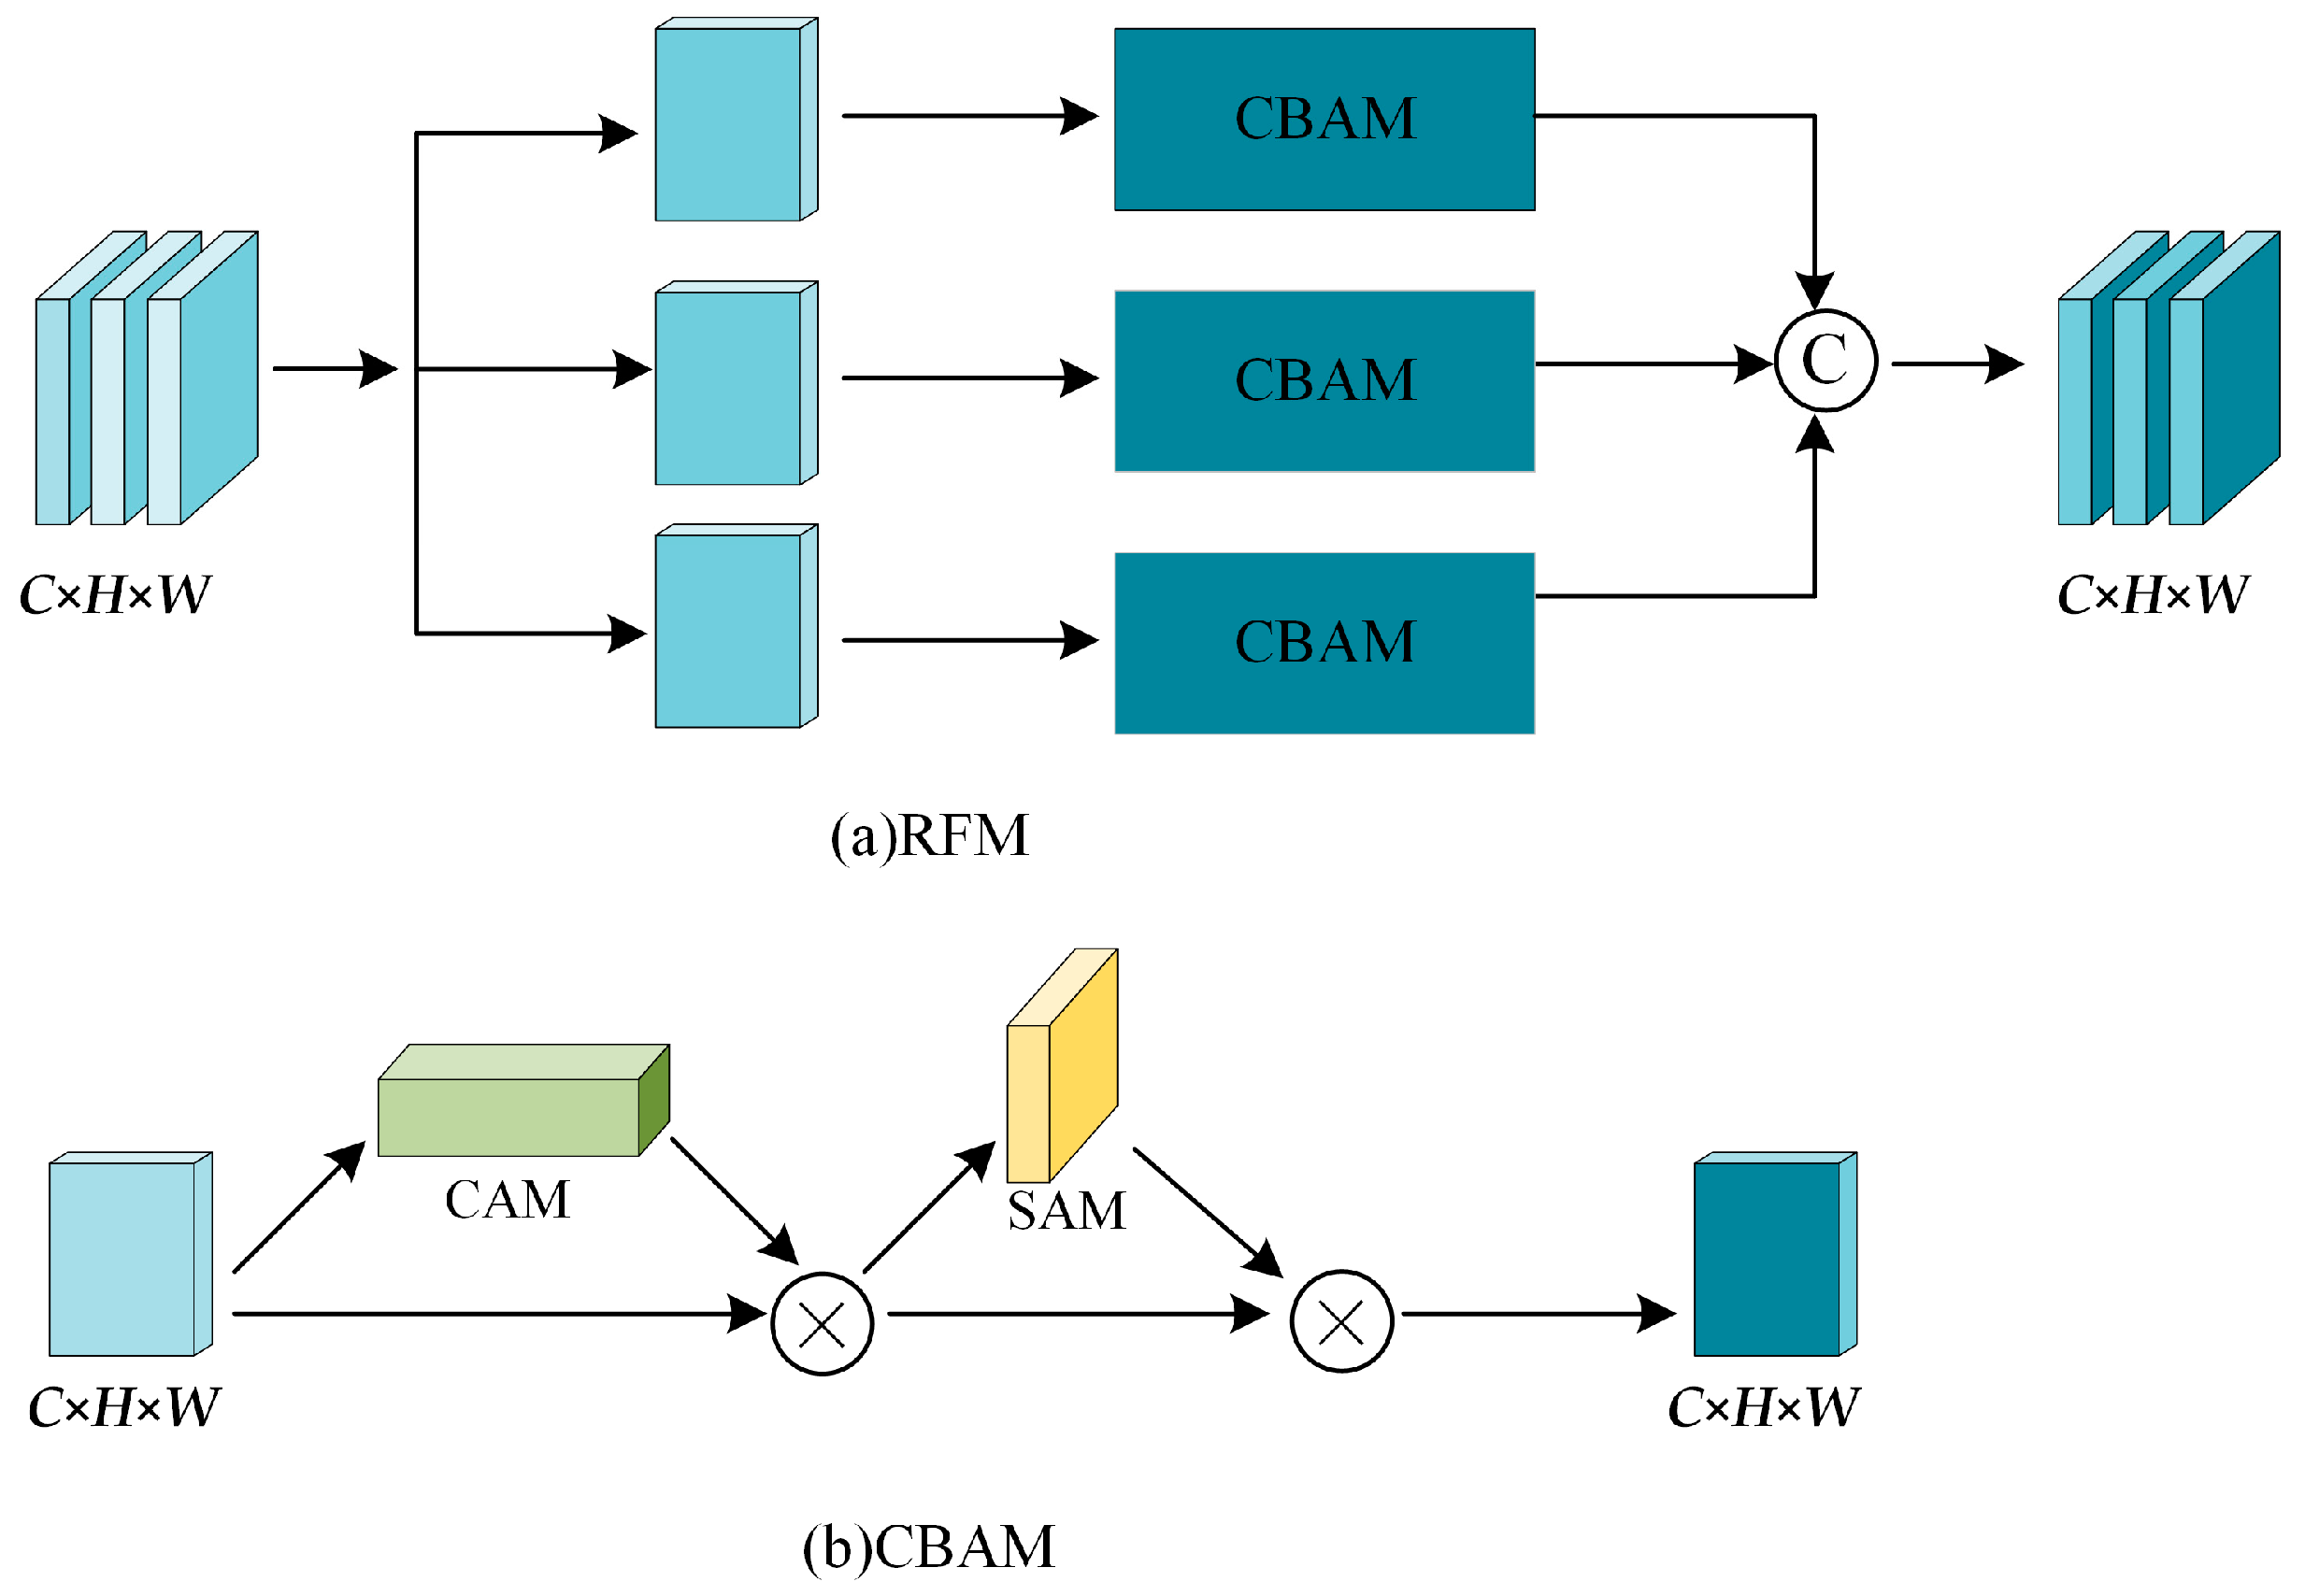
3.3.2. Feature Refinement Module

Due to the imaging mechanism of SAR, noise is inevitably present in the images, which significantly complicates feature processing. A common method to suppress noise interference is the integration of attention mechanisms into the network. The core idea is to automatically assign different weights to features, assigning higher weights to target features and lower weights to noise, thereby reducing interference. However, when the distribution of noise and target features is similar, directly applying attention mechanisms may not accurately distinguish between noise and target features. To minimize the potential impact of noise, we designed a feature refinement module (FRM) that applies weighting to different features within a local scope, allowing the network to focus more precisely on the target features, as shown in Figure 5.
Given an input feature map, we divided it into three sub-feature maps F ( t ) , where t = 1, 2, 3 correspond to the three sub-features, respectively. Next, we applied the CBAM [26] to F ( t ) . The CBAM includes both a channel attention module (CAM) and a spatial attention module (SAM), which collaboratively enhance feature representations across both the channel and spatial domains. Specifically, F ( t ) was processed through max pooling and average pooling layers, generating two separate outputs. These outputs were then passed through a shared multi-layer perceptron (MLP), and their outcomes were summed. Next, the summed results were processed through a Sigmoid function to output the channel attention weights M C ( t ) . Mathematically,
M C ( t ) = σ ( M L P ( A v g P o o l ( F ( t ) ) + M L P ( M a x P o o l ( F ( t ) )
where σ (⋅) denotes the Sigmoid function, and MaxPool(⋅) and AvgPool(⋅) denote the max pooling and average pooling operations, respectively.
M C ( t ) are multiplied by F ( t ) to generate the channel-wise refined feature map F C ( t ) . Mathematically,
F C ( t ) = F ( t ) M C ( t )
where means element-wise multiplication.
After channel refinement, F C ( t ) is further refined in the spatial domain through the SAM. F C ( t ) is processed using both max pooling and average pooling, and the outputs of each pooling process are concatenated. The concatenated feature map is passed through a 7 × 7 convolutional layer, followed by a Sigmoid function to output the spatial attention weights M S ( t ) . Mathematically,
M S ( t ) = σ ( f 7 × 7 ( [ M a x P o o l ( F C ( t ) ) , A v g P o o l ( F C ( t ) ) ] ) )
where f 7 × 7 (⋅) denotes the computation using a 7 × 7 convolution kernel.
M S ( t ) are multiplied by F C ( t ) to generate the spatial-wise refined feature map F S ( t ) . Mathematically,
F S ( t ) = F C ( t ) M S ( t )
Finally, each enhanced sub-feature map is concatenated to form the final output F . Mathematically,
F = C ( F S ( 1 ) , F S ( 2 ) , F S ( 3 ) )

3.4. Loss Function Combining Cross-Entropy and Dice Loss

During the training phase, we used the combined loss function CE-Dice, which integrates the cross-entropy loss [27] and Dice loss [28] to guide the training of PSANet to minimize prediction errors. The Dice loss function measures the overlap between the predicted and true regions, effectively addressing class imbalance. The cross-entropy loss function measures the deviation e in relation to the true and predicted probability distributions and is commonly used in classification tasks. The calculation formulas are as follows:
The Dice loss is defined as:
D i c e l o s s = 1 2 × i = 1 N p i g i + ε i = 1 N p i 2 + i = 1 N g i 2 + ε
The cross-entropy loss is defined as:
C r o s s - E n t r o p y l o s s = 1 N × i = 1 N [ g i × l o g ( p i ) + ( 1 g i ) × l o g ( 1 p i ) ]
The CE-Dice loss is defined as:
C E - D i c e l o s s = a × D i c e l o s s + b × C r o s s - E n t r o p y l o s s
where g i denotes the ground truth value, p i denotes the predicted value, ε denotes a small constant added to prevent division by zero, N denotes the total number of samples, a denotes the weight assigned to Dice loss, and b denotes the weight assigned to cross-entropy loss.

4. Experiments and Analysis

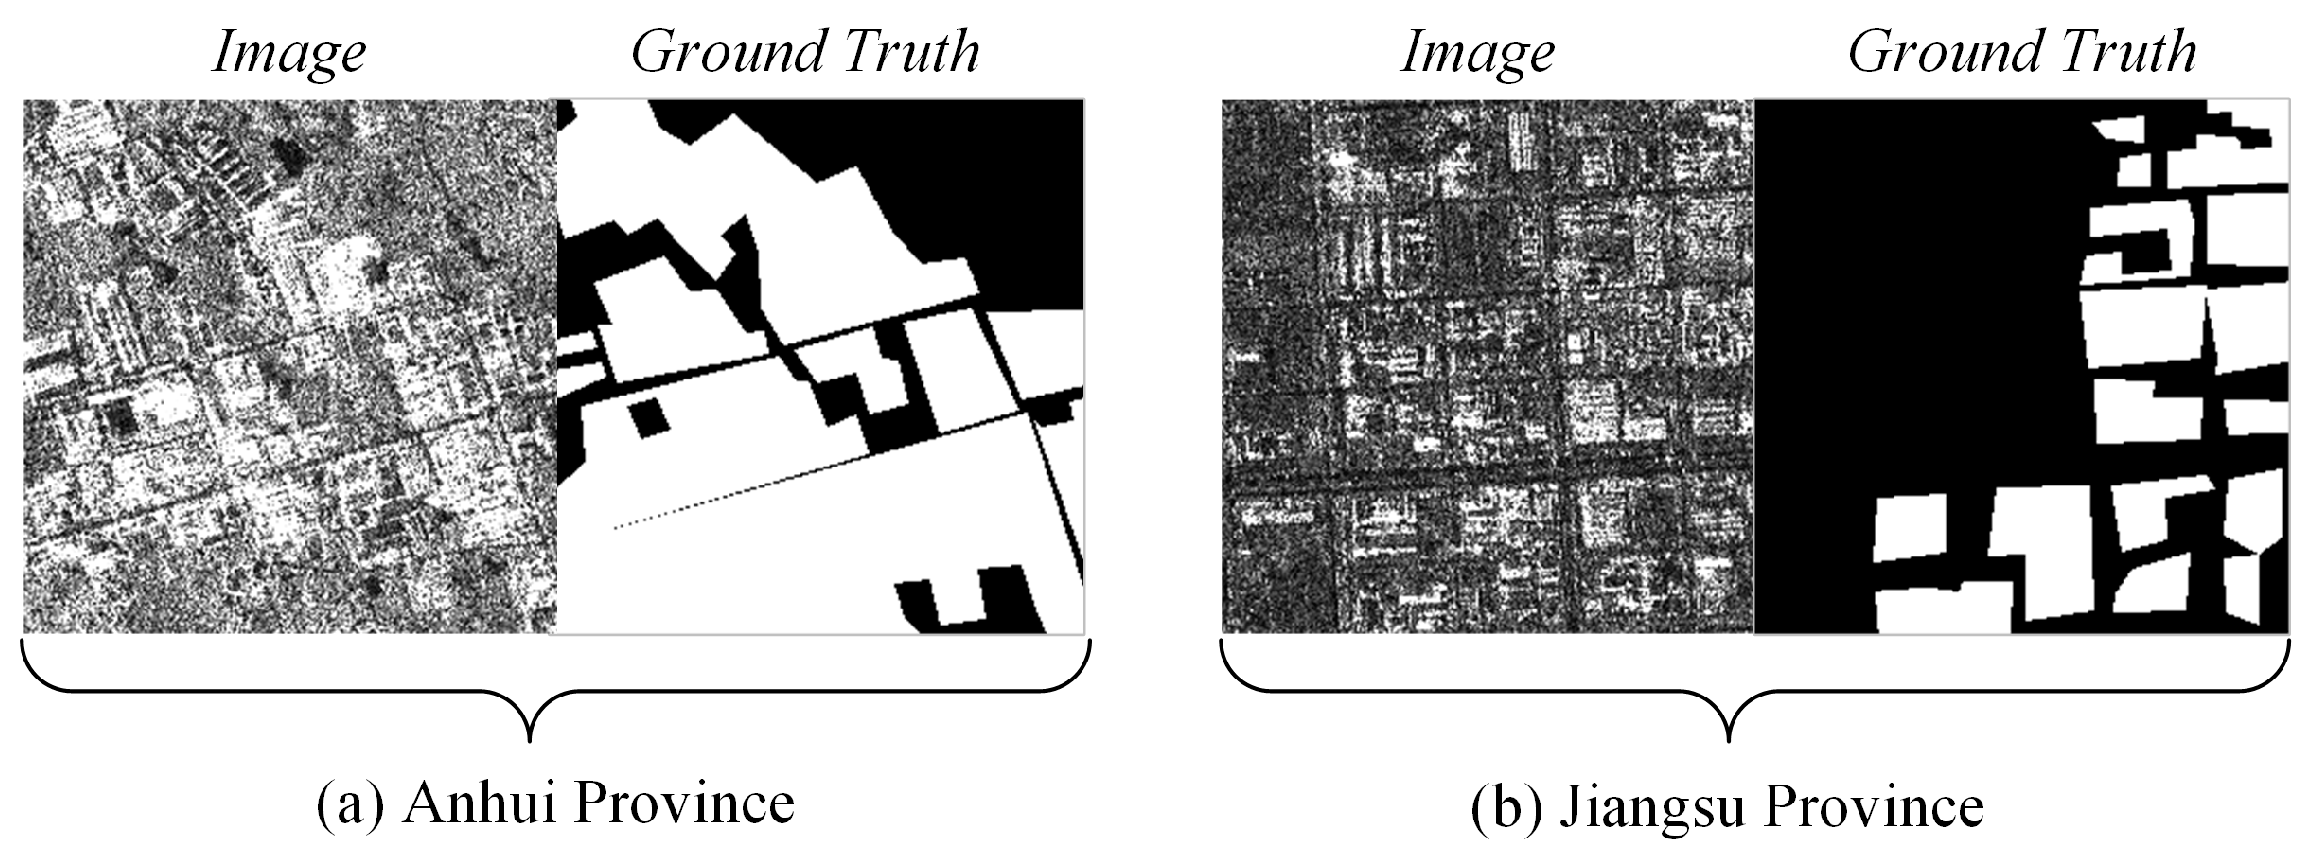
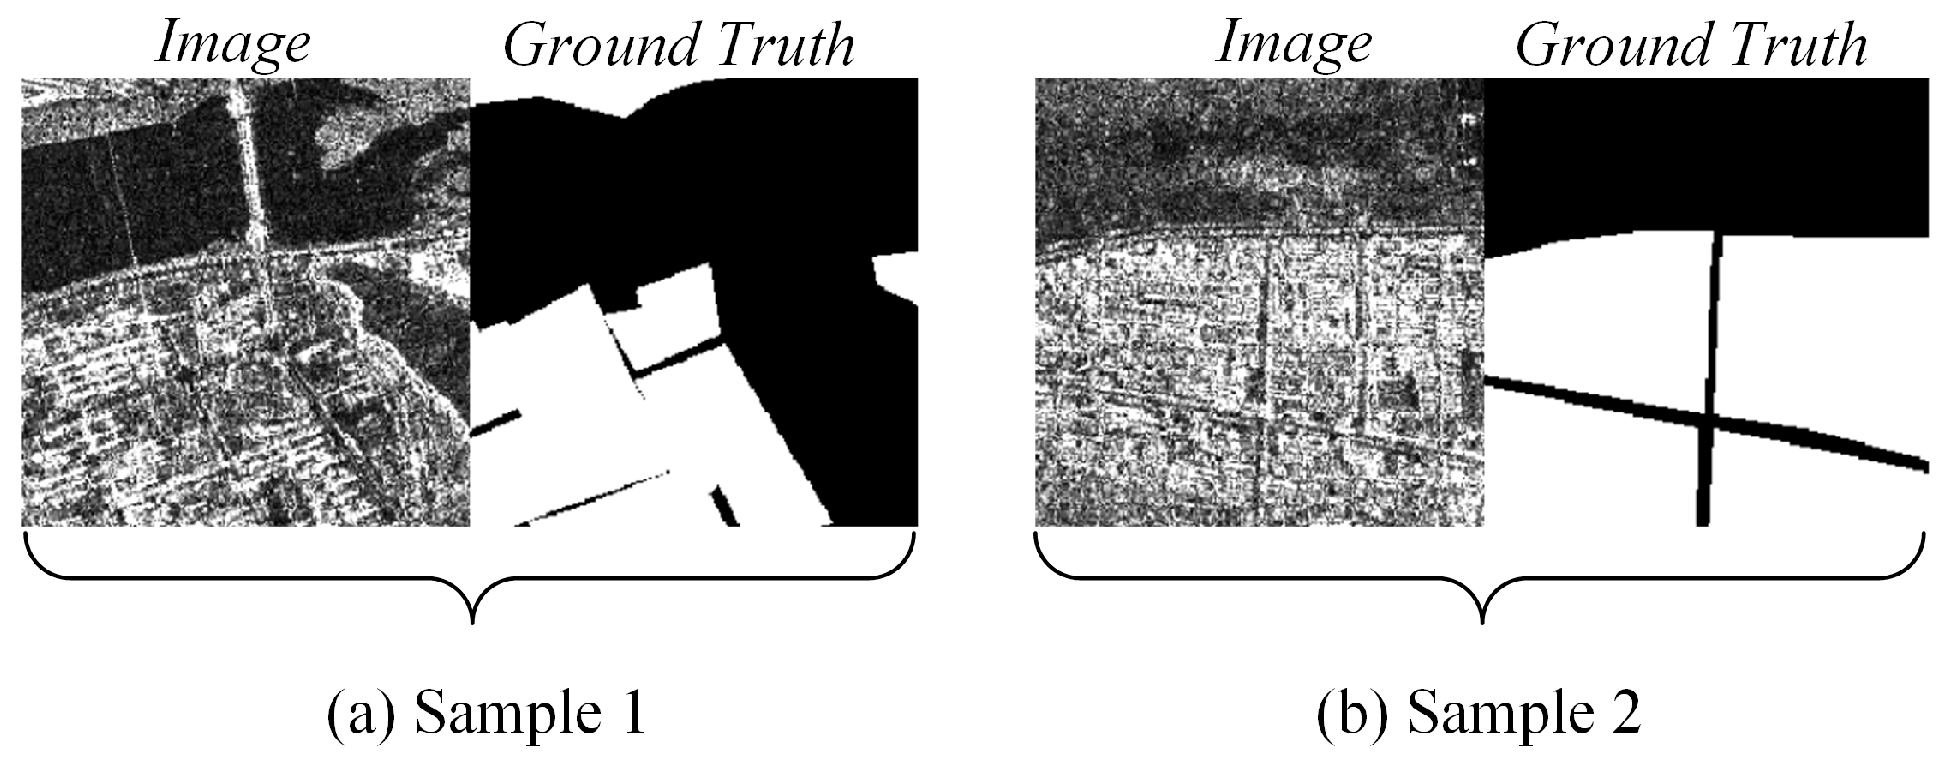
4.1. Dataset Introduction

To assess the performance of PSANet in segmenting building areas from SAR images, we conducted experiments using the SARBuD 1.0 dataset produced by the team of the Chinese Academy of Sciences, which uses GF-3 SAR images as the data source and covers the land area of 20 provinces, cities, and autonomous regions in China. The dataset contains 60,000 sample images, each having a size of 256 × 256 pixels and a spatial resolution of 10 m. Considering the massive size of the dataset, direct use will consume a significant amount of computing resources and time. In addition, directly dividing the dataset into training and validation sets cannot accurately evaluate the model’s generalization ability in different geographical regions. Therefore, we selected Anhui Province and Jiangsu Province from the SARBuD 1.0 dataset for experiments, considering that these two regions have different geographical characteristics and significant differences in sample size, pixel spacing, and incident angle. Specifically, compared to Anhui Province, Jiangsu Province has a larger sample size, smaller pixel spacing, and a smaller incidence angle. These differences help in evaluating the model’s effectiveness under various conditions.
Anhui Province comprises 1735 images collected between February and March 2019 in Anhui, China. We divided the dataset into two subsets: 80% for training and 20% for testing. The sample images are shown in Figure 6a.
Jiangsu Province comprises 3451 images collected between January and May 2019 in Jiangsu, China. Similarly, the dataset was divided into two subsets: 80% for training and 20% for testing. The sample images are shown in Figure 6b.

4.2. Evaluation Metrics

We used Recall, Precision, Overall Accuracy (OA), IoU, and the F1-Score to assess the performance of different network architectures. Their definitions are as follows:
Recall is defined as:
R e c a l l = T P T P + F N
Precision is defined as:
P r e c i s i o n = T P T P + F P
OA is defined as:
O A = T P + T N T P + F N + T N + F P
IoU is defined as:
I o U = T P T P + F N + F P
The F1-Score is defined as:
F 1 - S c o r e = 2 × P r e c i s i o n × R e c a l l P r e c i s i o n + R e c a l l
where TP denotes the number of pixels correctly classified as building areas, TN denotes the number of pixels correctly classified as non-building areas, FN denotes the number of pixels incorrectly classified as non-building areas, and FP denotes the number of pixels incorrectly classified as building areas.

4.3. Hyperparameter Setting

Our model implementation is based on PyTorch and is trained on a single NVIDIA RTX 4060Ti GPU with 8 GB of memory capacity. During the training process, we used Adam as the optimizer and set the weight decay to 0.0005. Meanwhile, the initial learning rate was set to 0.001, and a warm-up strategy was adopted in the first few epochs of training to avoid excessive learning rates in the early stages, which could help the model converge more smoothly, reducing instability. In addition, considering the size of the dataset and computing resources, we set the number of epochs for training to 100 and the batch size to 4. In particular, we found that when the learning rate was set below 0.0003, the model’s convergence speed significantly slowed down, and it was prone to getting stuck in local minima. Additionally, when the number of epochs was set to 50, the model’s performance was poor, with its IoU being around 3% lower compared to the 100-epoch setting. This was likely due to underfitting caused by insufficient training.

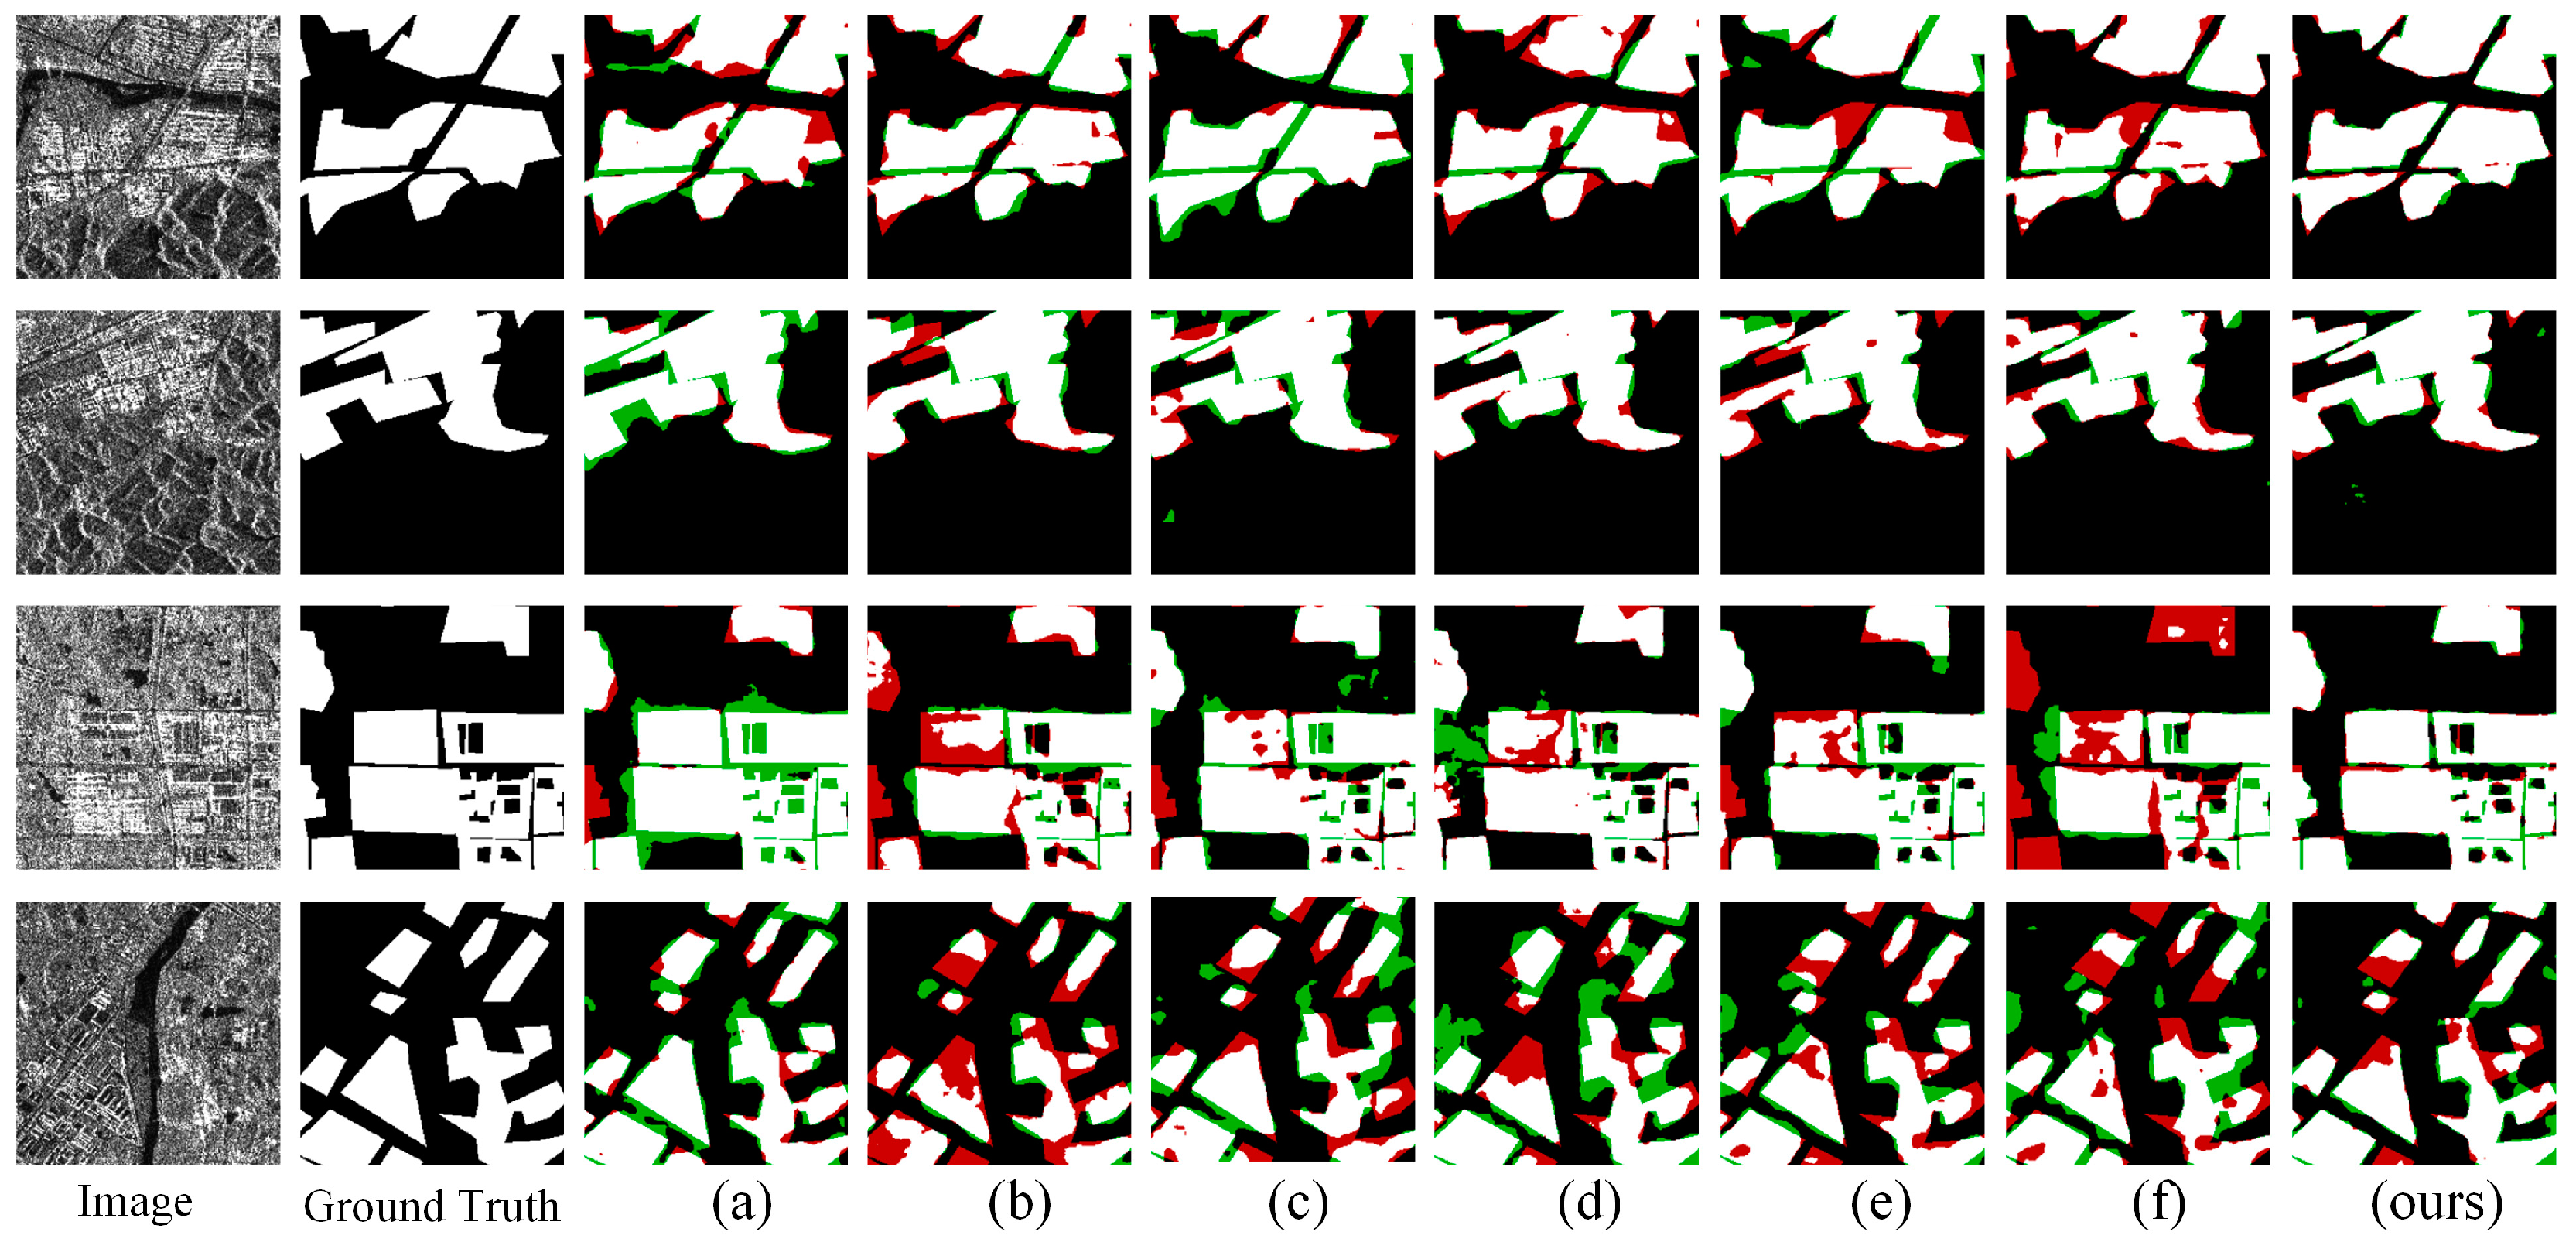
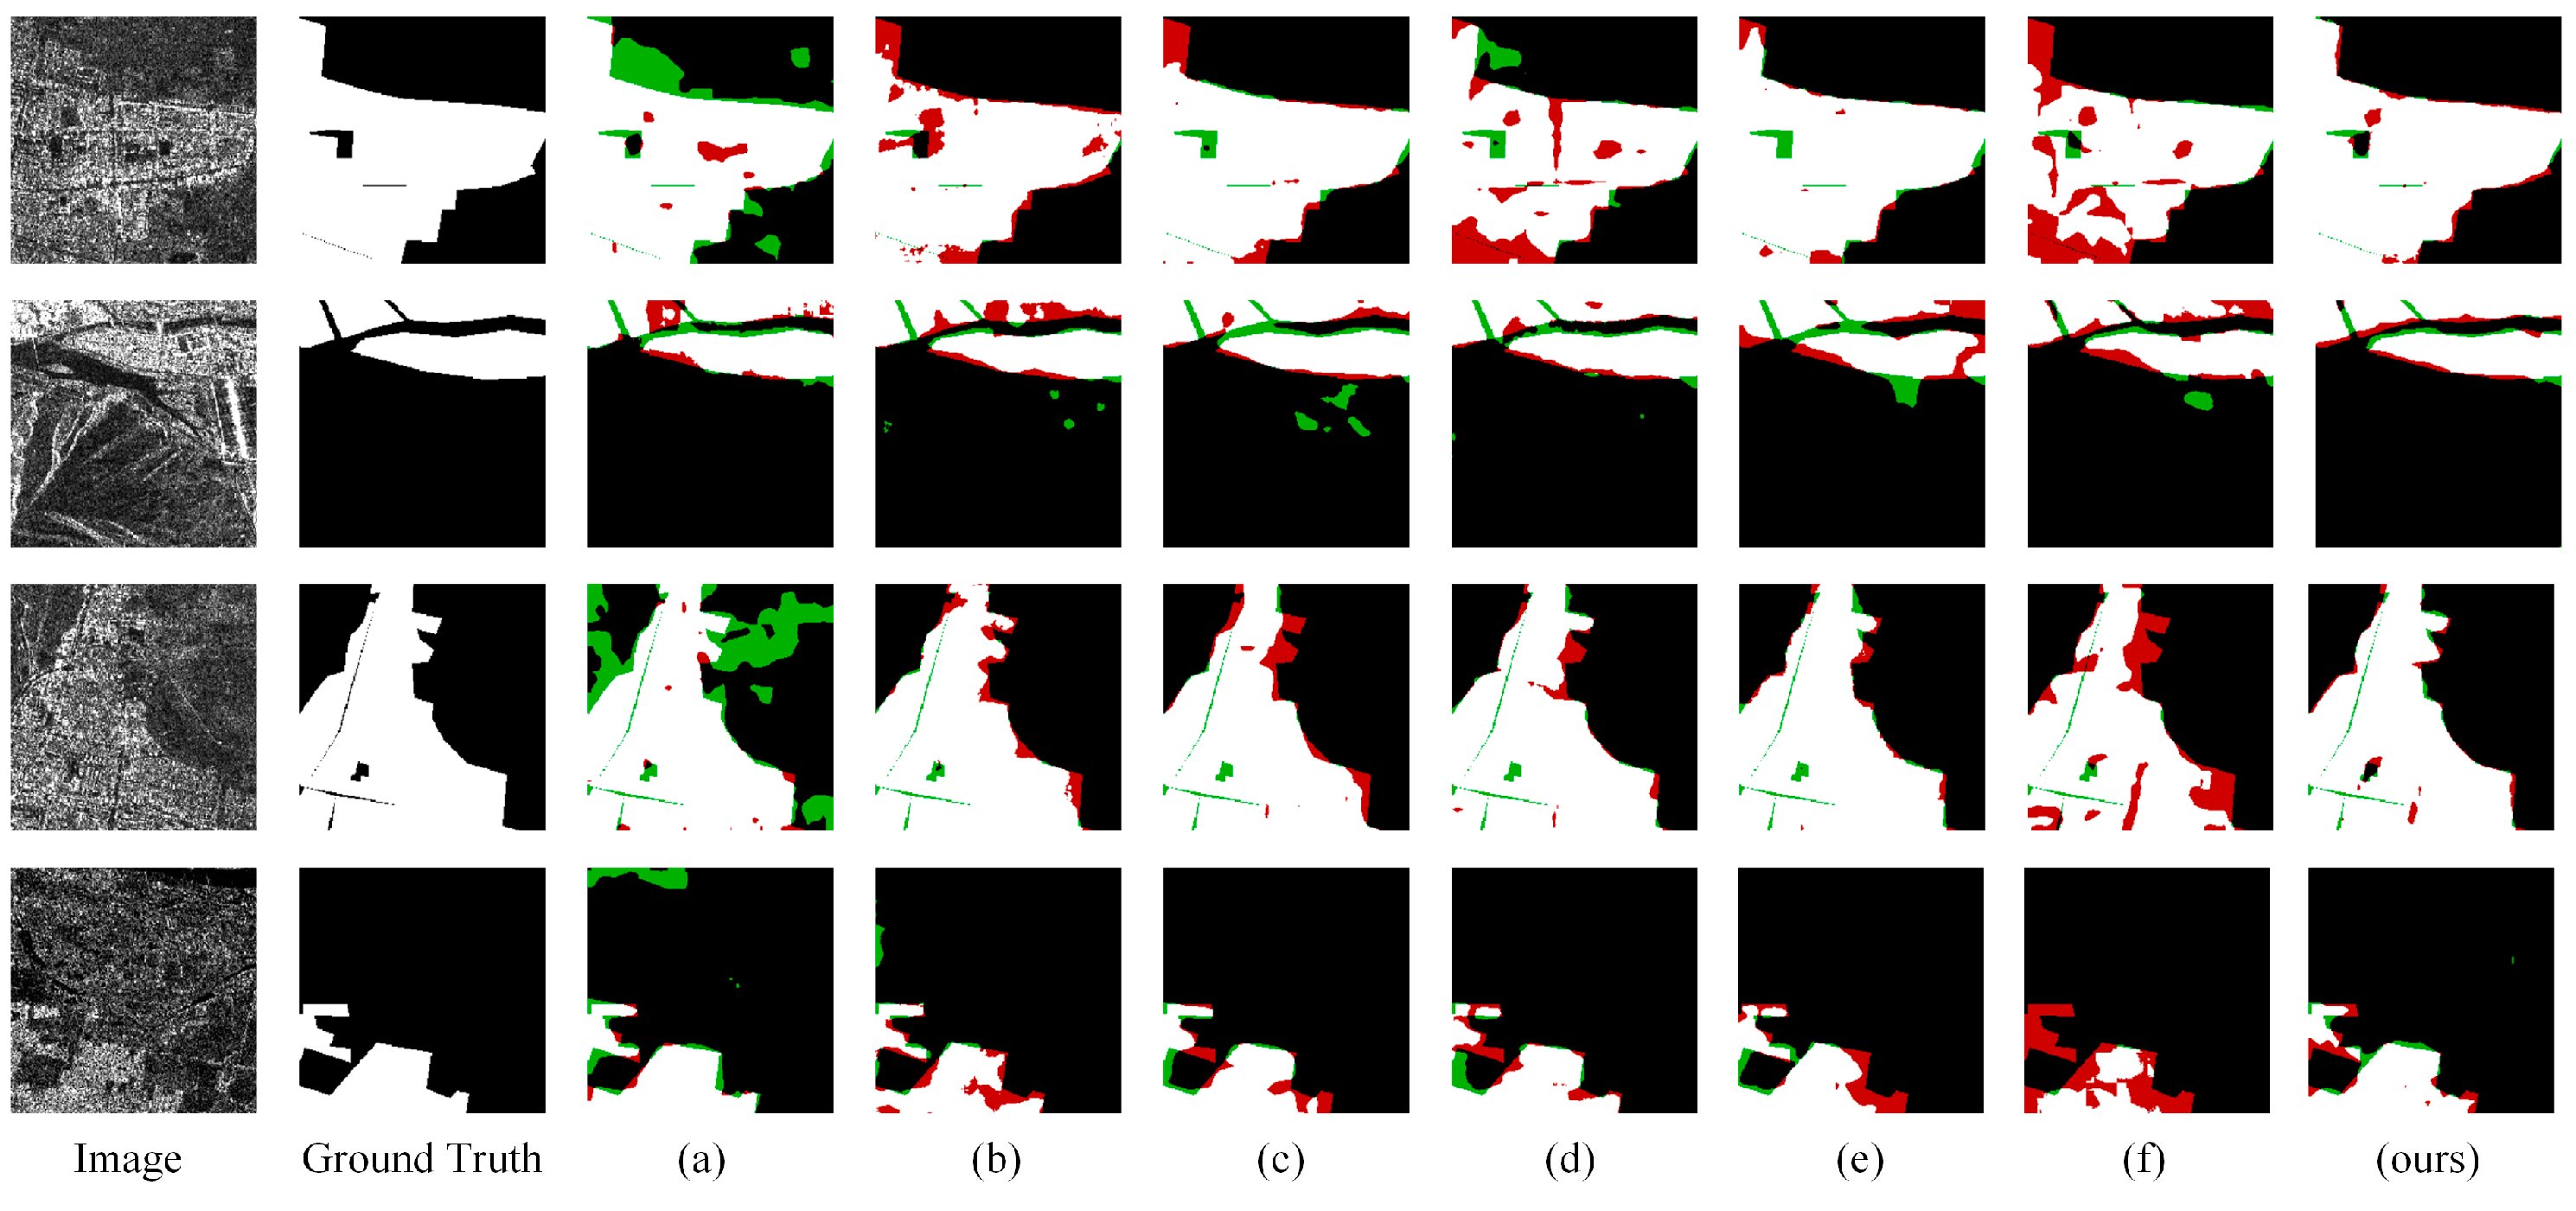
4.4. Experimental Results

4.4.1. Anhui Province

To demonstrate the advantages of PSANet in building area segmentation, we compared it with six advanced building area segmentation networks: SegNet [29], DeepLabV3-Plus [30], MAFF-HRNet [31], UNet++ [32], SegFormer [33], and PSPNet [34]. All networks were evaluated under identical parameter settings, with the results presented in Table 1. It can be seen that PSANet achieved superior results in terms of the F1-Score, IoU, OA, and Precision, with scores of 85.26%, 74.31%, 96.63%, and 86.01%, outperforming the other six methods. This indicates that PSANet can segment building areas in Anhui Province more accurately than the other methods. In addition, although PSANet had relatively low Recall, its F1-Score and Precision were the highest, indicating that it had better stability in building area segmentation in Anhui Province.
Figure 7 shows the segmentation results of four representative images from the Anhui Province test set, with red pixels indicating false negatives and green pixels indicating false positives. The seven methods displayed varying levels of error in segmentation results. Specifically, the results from methods (b), (e), and (f) contained a relatively large number of red pixels, indicating that these methods misclassified many building areas as non-building areas. The errors in methods (b) and (f) may stem from the lack of effective denoising techniques, making it difficult to suppress noise in the SAR data, thereby increasing classification errors. On the other hand, method (e) utilizes a transformer to capture global dependencies in the image, making it effective for processing large-scale regions. However, this also means that when handling complex areas where building regions are intertwined with the background, method (e) may struggle to accurately distinguish these differences, leading to classification errors. Meanwhile, methods (a), (c), and (d) contained a relatively large number of green pixels, indicating that these methods misclassified many non-building areas as building areas. The errors in methods (a) and (c) may stem from the use of a symmetric encoder–decoder architecture, which may result in excessive spatial smoothing during feature extraction, leading to the loss of detailed information. In addition, method (c) enhances feature extraction at different scales through a multi-scale feature fusion mechanism. However, in SAR images, the reflection characteristics of background areas are similar to those of buildings at certain scales, leading to the misclassification of these areas as building areas. Although our results contain some errors, which may stem from the model’s insufficient sensitivity to certain variations in the input data, such as noise or slight changes in pixel values, the total number of red and green pixels remains relatively small. In addition, by enhancing the reconstruction of building area details and the extraction of deep-level features of building areas, our method demonstrates superior segmentation performance for all building types in Anhui Province compared to other methods. This illustrates that our method outperforms others in segmenting building areas in Anhui Province.

4.4.2. Jiangsu Province

Similarly, we evaluated the performance of seven algorithms on Jiangsu Province images under identical experimental conditions. As shown in Table 2, PSANet achieved superior results in terms of the F1-Score, IoU, and OA, with scores of 83.31%, 71.38%, and 94.18%, outperforming the other six methods. This indicates that PSANet is still able to accurately segment building areas in Jiangsu Province. In addition, although PSANet had a relatively low Recall, its F1-Score remained the highest, and its Precision was only slightly lower than that of DeepLabV3-Plus, indicating that it still has good stability in Jiangsu Province. In particular, we noticed that the IoU in the Jiangsu region is about 2.77% lower than that in the Anhui region, and the F1-Score is about 1.92% lower, which may be due to the influence of multiple factors. On the one hand, the incident angles of the Anhui and Jiangsu regions are 34.89° and 31.37°, respectively. The difference in incident angles results in distinct radar scattering characteristics, which affect the model’s performance in recognizing the building area. On the other hand, the pixel spacing area of the Jiangsu region is 8.92 square meters, which is lower than the 10.68 square meters in the Anhui region. The smaller spacing contains richer details, which helps to identify building areas more accurately but also increases the complexity of the background. Furthermore, the sample size of the Jiangsu region is 3451, which is more than the 1735 samples in Anhui. Generally, a larger sample size can enhance the model’s generalization ability. However, considering the potential class imbalance in the data, the model may tend to recognize categories with more samples, thereby overlooking categories with fewer samples.
Figure 8 shows the segmentation results of four representative images from the Jiangsu Province test set. Upon observation, all seven methods still have a certain degree of segmentation error. The results derived using methods (b) and (e) contained a relatively large number of red pixels, indicating that these methods misclassified many building areas as non-building areas. In particular, we noticed that method (e) showed improved segmentation performance in the Jiangsu region compared to the Anhui region and outperformed method (b). This may be due to the large sample size of the Jiangsu region, which enables the transformer to extract important features from large amounts of data better, thus performing better than traditional CNN methods on larger datasets. Meanwhile, methods (a), (d), and (f) contained a relatively large number of green pixels, indicating these methods misclassified many non-building areas as building areas. Although our method also had some errors, the total number of red and green pixels in the segmentation results was relatively small. In addition, for the low-density and high-density building areas in Jiangsu Province, our method delivered more accurate segmentation results than other methods. From a qualitative assessment perspective, this illustrates the superiority of our method for segmenting building areas in Jiangsu Province.

4.5. Ablation Experiment

4.5.1. Effect of Different Modules

In order to assess the effect of each module in PSANet on its performance, the following combination methods were designed:
  • Base: The encoder consisted solely of ResNet34, and the decoder used only a hierarchical decoder to decode the encoded features;
  • Proposal 1: The encoder consisted of ResNet34 and ASPP, and the decoder used only a hierarchical decoder to decode the encoded features;
  • Proposal 2: The encoder consisted of ResNet34 and ASPP, and the decoder used a hierarchical decoder and FRM to decode the encoded features;
  • Proposal 3: The encoder consisted of the Pseudo-Siamese fusion encoding network and ASPP, and the decoder used a hierarchical decoder and FRM to decode the encoded features.
Table 3 presents the evaluation metrics obtained using different combination methods, from which it can be observed that Proposal 1 outperformed the Base in terms of the F1-Score, Recall, OA, and IoU in both regions, with a particularly notable improvement of 3.74% and 2.62% in Recall. This indicates that the multi-scale features extracted by ASPP through different receptive fields help the model recognize buildings of different sizes, thereby reducing the under-detection of building areas. Next, compared to Proposal 1, Proposal 2 shows improvements in Recall by 1.35% and 0.69%, IoU by 0.34% and 1.50%, and the F1-Score by 0.25% and 1.01% across the two regions. This indicates that the introduced FRM reduces noise interference and enhances the semantic features of building areas, leading to more accurate building area segmentation. Furthermore, Proposal 3 outperformed Proposal 2 in terms of the F1-Score, Recall, Precision, OA, and IoU. In particular, it achieved an increase of 1.29% and 1.21% in the F1-Scores and an increase of 1.87% and 1.82% in IoU in both regions. This result indicates that the Pseudo-Siamese fusion encoding structure can extract richer feature representations than a single network structure, thereby obtaining more comprehensive contextual information, which, in turn, effectively improves segmentation accuracy and stability.
Figure 9 shows the segmentation results obtained using different combination methods, from which it can be observed that as each module was progressively added, the false positive rate and false negative rate gradually decreased, as reflected in the changes in the quantity of red and green pixels. Specifically, compared to the Base, Proposal 1 contained fewer red pixels and more green pixels. This is because the introduced ASPP enriches the multi-scale information of deep-level encoded features, thereby improving the recognition of building areas at various scales. However, while recognizing more building areas, relying solely on ASPP makes it difficult to accurately determine the true number of building areas, leading to an increase in false positives. Next, after introducing the FRM, the segmentation result of Proposal 2 contained fewer green pixels than Proposal 1. This indicates that the FRM has a positive impact, particularly in reducing false positives. Furthermore, after replacing ResNet34 with ResNet18-ResNet34, the segmentation results in Proposal3 contain fewer red and green pixels compared to Proposal 2, which is due to the fact that ResNet18, with its shallower network structure, is able to extract more low-level spatial features of the building areas, while ResNet34, due to its deeper architecture, can more effectively extract high-level semantic features. This illustrates that by combining the characteristics of these two networks, it is possible to extract high-level features while also preserving more detailed information about the building areas, thereby reducing false positives and false negatives. Therefore, each module is effective and has a positive impact on building area segmentation to varying degrees.

4.5.2. Effect of Different Encoding Networks

To further analyze the advantages of the Pseudo-Siamese fusion encoding network in building area segmentation, we conducted comparative experiments from two perspectives. On the one hand, to analyze whether the Pseudo-Siamese structure has advantages, we replaced the Pseudo-Siamese fusion encoding network with two networks different from the ResNet type—namely, MobileNetv3 [35] and Xception [36]—in the encoding stage while keeping the rest of the structure basically unchanged. On the other hand, to analyze the impact of different backbone networks and fusion methods within the Pseudo-Siamese structure on performance, we used deeper versions of ResNet, VGG, and a new fusion method named Sum-Fusion, where feature concatenation was replaced with addition in the fusion encoding algorithm, as well as the fusion method proposed in reference [1], and obtained their evaluation results. Table 4 presents the comparative results, from which it can be observed that the Xception network outperformed the MobileNetV3 network in terms of IoU, Recall, and F1-Score. This indicates that Xception can more effectively extract deep-level features of building areas, thereby improving the accuracy of the segmentation results. Meanwhile, our method outperformed the other two single neural networks in terms of F1-Score, Recall, Precision, OA, and IoU, indicating that its structural fusion from different networks has better performance in building area segmentation compared to single neural networks. In addition, although the IoU and F1-Scores obtained using ResNet18 and ResNet34 are slightly lower than those of ResNet50 and ResNet101 in the Jiangsu Province images, their computational consumption is significantly lower. Furthermore, in the Anhui Province images, the IoU, F1-Scores, and OA obtained using ResNet18 and ResNet34 outperform those of other methods. This indicates that ResNet18 and ResNet34 offer relatively high accuracy while maintaining higher computational efficiency, making them more suitable for practical applications with limited resources. Meanwhile, their excellent performance on the Anhui province dataset indicates better generalization when handling smaller datasets, which further highlights that, although deeper networks can provide higher accuracy, they are not always the optimal choice when considering the computational resources and generalization ability of the resource-limited model. In comparison, VGG13 and VGG16 have similar computational complexity to ResNet18 and ResNet34, but their IoU, Recall, OA, and F1-Score are all lower than the latter, which is likely due to the fact that the VGG series does not use residual connections, which makes them more susceptible to the vanishing gradient problem during training. Therefore, ResNet18 and ResNet34 have more advantages in balancing accuracy and computational efficiency. In particular, the fusion method using concatenation outperforms the additive fusion method, which is likely due to the fact that additive fusion directly sums features, resulting in conflicts between features from different sources, while concatenation preserves the features by listing them together, thus better maintaining the independence of each feature, indicating that using feature concatenation in the fusion process is a more appropriate choice. Furthermore, our fusion method outperforms the method in reference [1] in terms of IoU, Precision, OA, and F1-Score, as it incorporates the fusion features of the previous layer during the fusion process, which enhances the expression of the features, thus improving the model’s performance.

4.5.3. Effect of FRM

To further analyze the role of the FRM, we performed comparative experiments from two perspectives. On the one hand, to analyze whether the split–aggregation design of the FRM is effective, we replaced the FRM with a CBAM. On the other hand, to analyze whether using different attention modules in the FRM structure would yield positive effects, we replaced the CBAM with a Bottleneck Attention Module (BAM) [37] or the Pyramid Split Attention Module (PSAM) [38], where the BAM simultaneously optimizes both the spatial and channel domains of features, while the PSAM focuses more on optimizing the channel domain. Table 5 presents the comparative results, from which it can be observed that the performance of using the FRM outperformed that of using the CBAM, achieving better results in terms of the F1-Score, Precision, OA, and IoU. This indicates that the design of the FRM is effective, and the high F1-Score further indicates the good stability of the FRM. In addition, applying the CBAM in the FRM structure outperforms the PSAM and BAM in terms of the F1-Score, Recall, OA, and IoU, which is likely due to the fact that the PSAM primarily optimizes the channel domain, lacking spatial domain optimization. Meanwhile, although both the BAM and CBAM optimize the spatial and channel domains, the CBAM’s greater adaptability allows it to be seamlessly integrated into any CNN architecture, enabling it to perform better in FRM structures, which indicates that using the CBAM in the FRM is appropriate.
Figure 10 shows the attention heatmaps after each stage of the FRM, which were obtained by extracting the weights from the intermediate stages of the FRM using the Grad-CAM [39] method. It can be seen that when only the SAM was used in the FRM structure, the model can focus on the spatial structure of the building area, which is reflected in the heatmap displaying the complete outline of the building area. In addition, when only the CAM was used in the FRM structure, the model effectively focuses on the features of large buildings, which is reflected in the fact that large buildings are endowed with higher heating values. Furthermore, when the CBAM was introduced into the FRM structure, the model’s attention to building features in both the spatial and channel domains is optimized, which is reflected in the fact that the heatmap not only effectively shows the spatial structure of the building area but also assigns higher heatmap values to the building features.

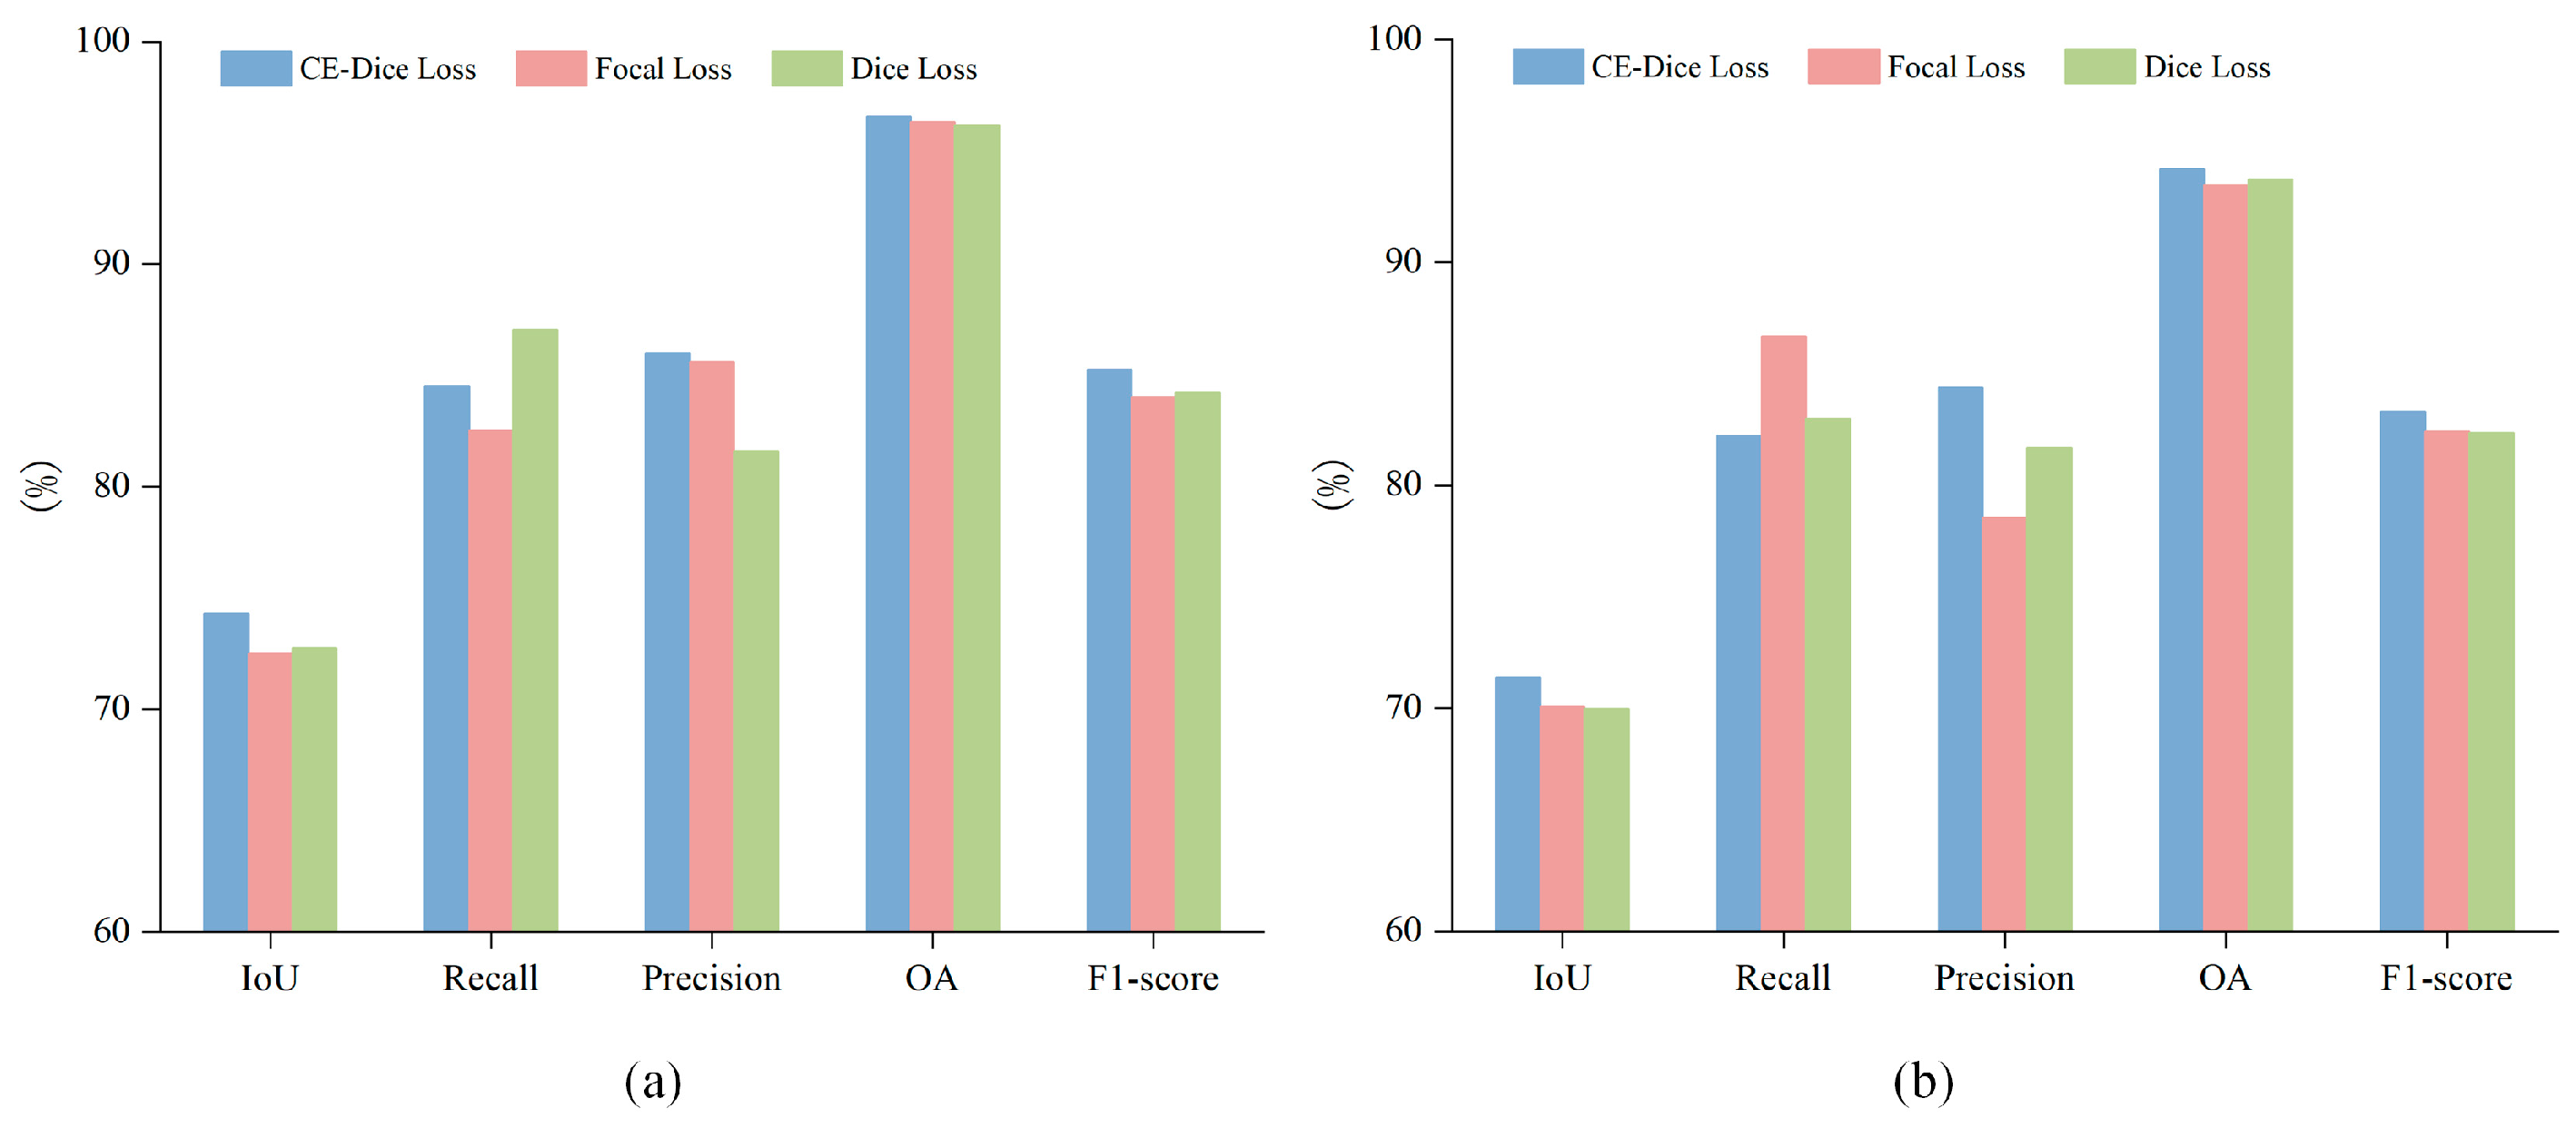
4.5.4. Effect of Loss Function

To evaluate the applicability of the CE-Dice in PSANet, we conducted comparative experiments by replacing CE-Dice loss with Focal loss [40] or Dice loss during the training process. Focal loss modifies the cross-entropy loss function by introducing a modulation factor, enabling it to assign greater weight to samples with fewer instances. Therefore, these loss functions can address the imbalance between the number of target-area and non-target-area pixels. Figure 11 shows the experimental results, from which it can be seen that CE-Dice loss outperformed the other two loss functions in terms of IoU, F1-Score, Precision, and OA in both regions. Focal loss may pose difficulties when dealing with small targets, as inappropriate focus factor settings can lead to insufficient learning of small targets. In addition, since Dice loss is calculated based on the degree of overlap, if the overlap between the ground truth and the predicted value is small in the early stages of training, it may affect the convergence speed and overall performance of the model. In comparison, CE-Dice loss effectively combines the advantages of cross-entropy loss and Dice loss, where cross-entropy loss ensures classification accuracy, while Dice loss enhances the focus on small targets, thereby improving segmentation accuracy and ensuring better training stability. This indicates that CE-Dice loss is more suitable for PSANet with regard to prediction accuracy and stability.

4.5.5. Model Efficiency Evaluation

To analyze the segmentation efficiency of different networks, we compared the computational consumption of all networks. Table 6 shows the comparison results, from which it can be seen that the number of parameters in PSANet is about 46.51 M, and the memory requirement is about 177 MB, only higher than SegNet and UNet++, indicating that PSANet is relatively lightweight in terms of memory usage. In addition, PSANet outperforms MAFF-HRNet, SegFormer, and Deeplabv3plus in terms of Flops, inference time, and training time, indicating that PSANet can complete segmentation tasks more quickly while ensuring lower memory consumption.

4.5.6. Effect of Dilation Rate

In order to further analyze the impact of the dilation rate on model performance, we selected a smaller dilation rate (r = {4, 8, 12}) for ASPP-Small and a larger dilation rate (r = {12, 24, 36}) for ASPP-Large and obtained corresponding evaluation results. Table 7 shows the comparison results, from which it can be seen that ASPP-Small performs better than ASPP-Large in terms of IoU, Precision, OA, and F1-Score in both regions. This may be due to the inability of ASPP-Large to effectively enhance the model’s focus on small buildings, thereby affecting its performance. In addition, our method outperforms ASPP-Small in terms of IoU, F1-Score, and Recall, indicating that our chosen dilation rate is more appropriate.

5. Discussion

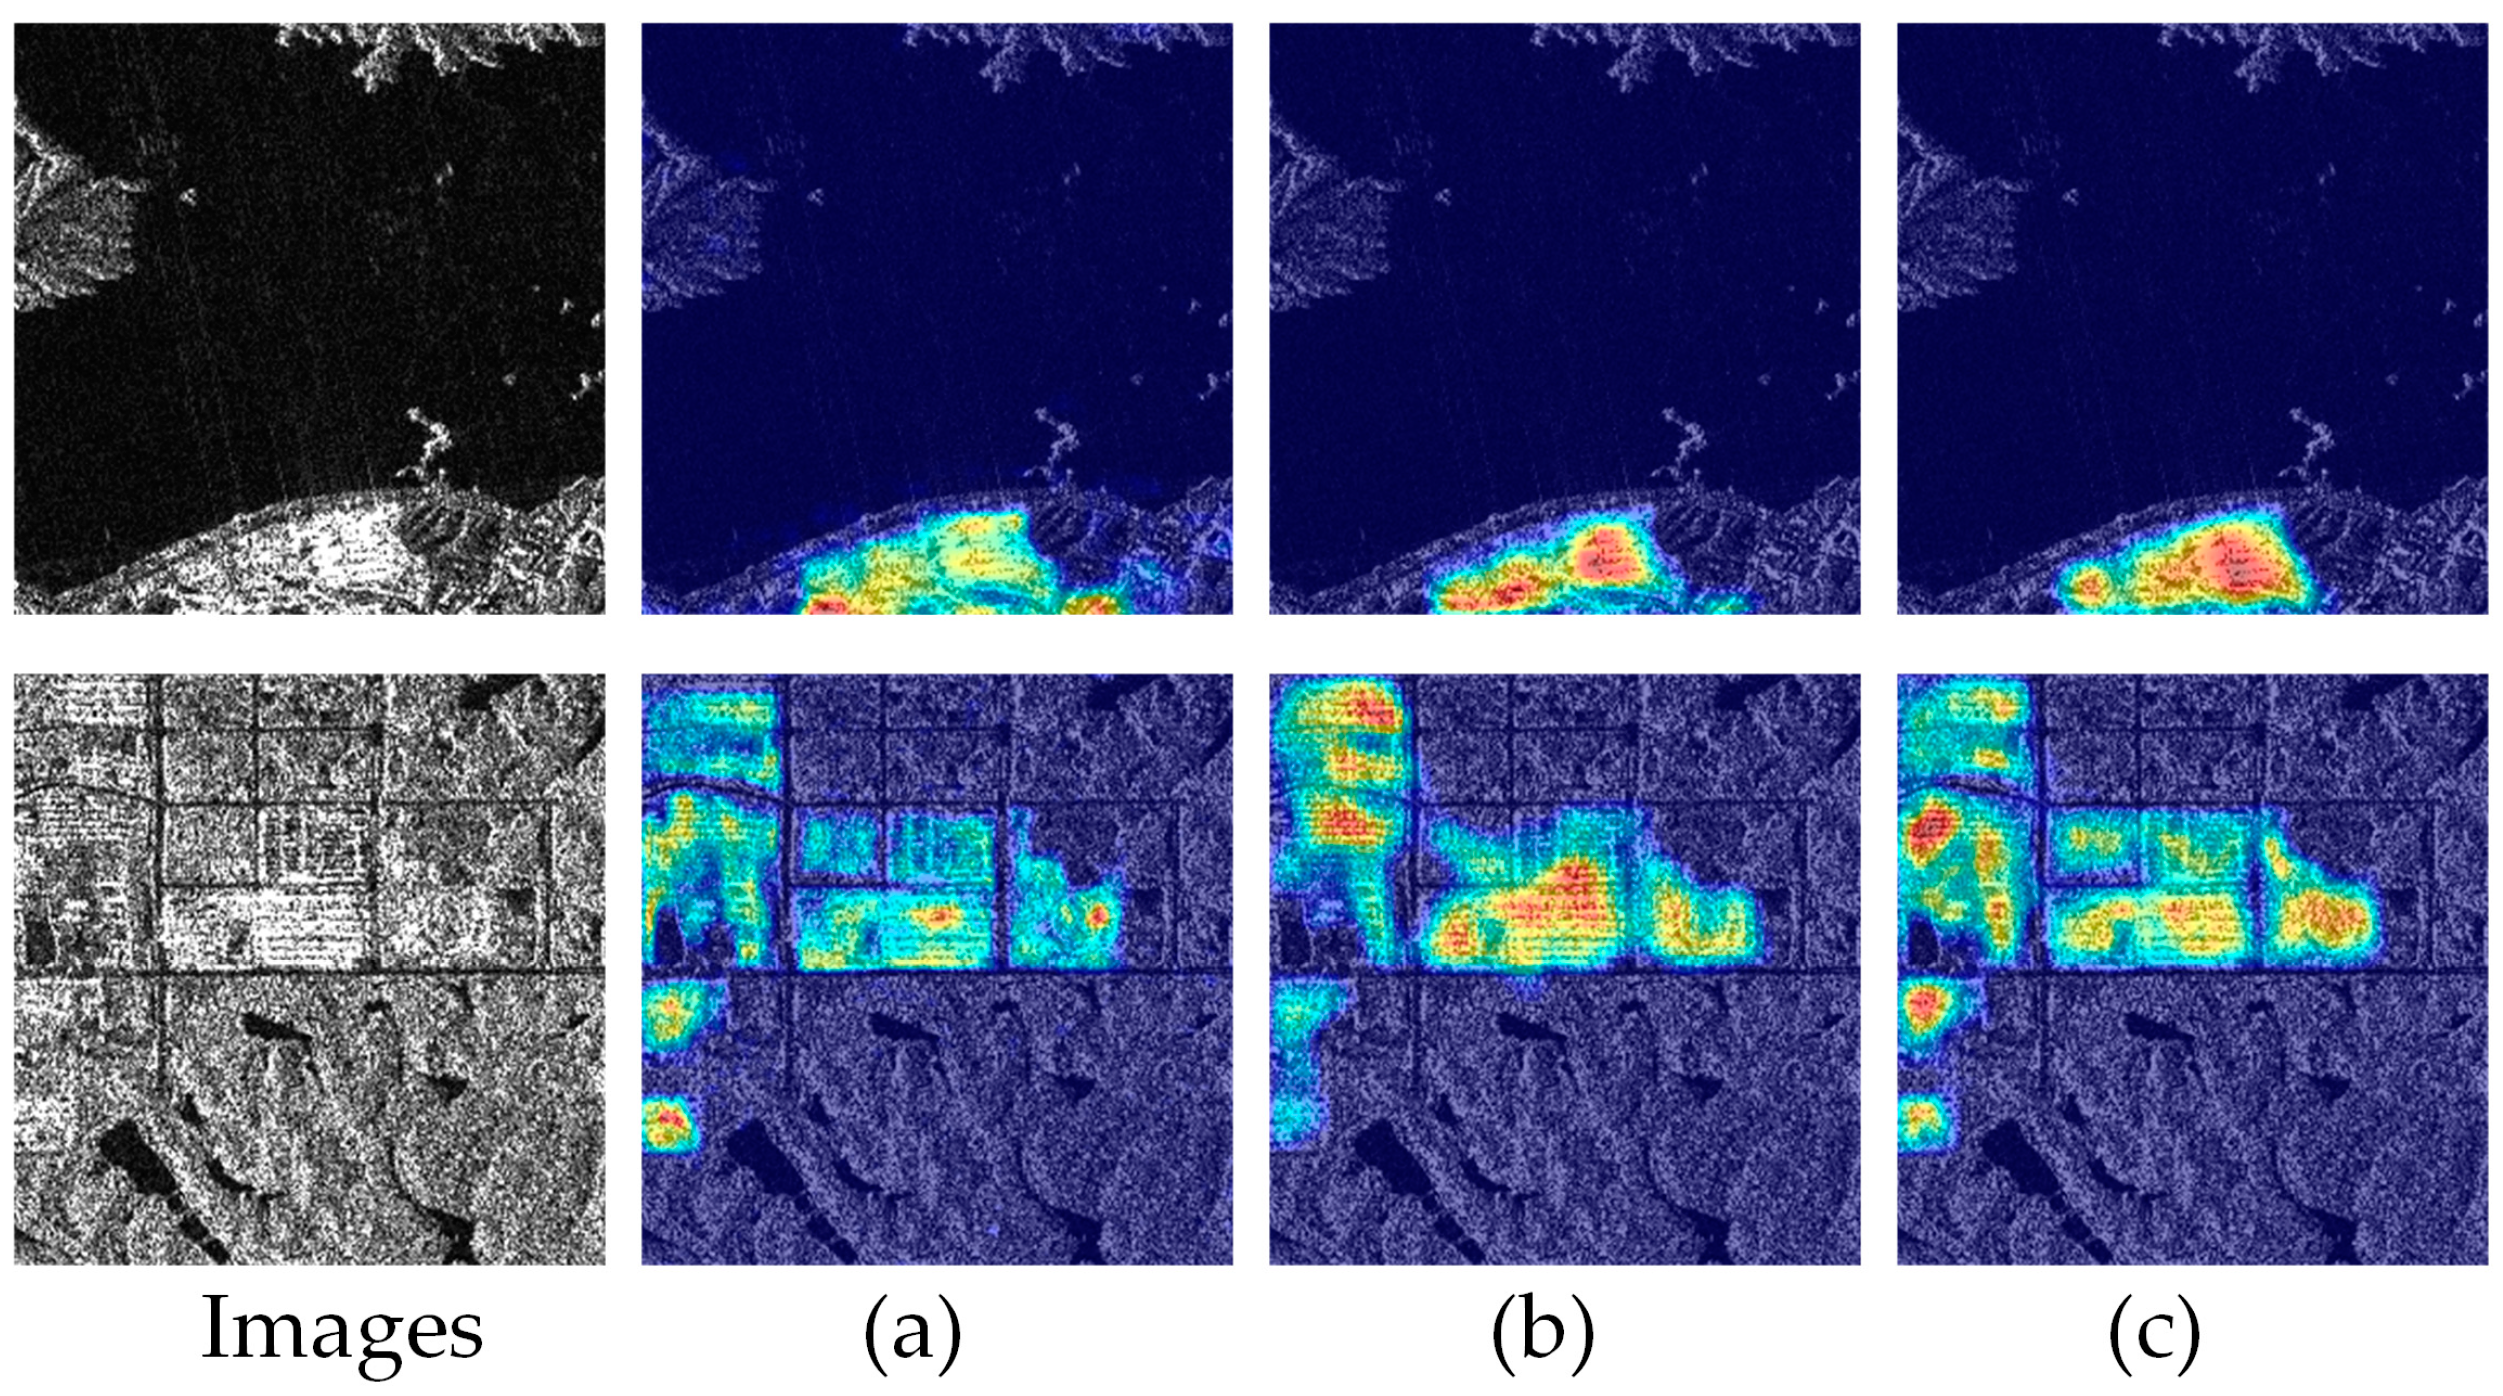
5.1. Feature Visualization Analysis

To more intuitively visualize the attention points of PSANet in the images, we used Grad-CAM to extract the weights from the model’s final convolutional layer, generating attention heatmaps. Figure 12 shows the heatmap results for different scenes, from which it can be observed that in building area-dominated scenes, PSANet accurately focused on the building areas in the images while also recognizing the complete boundary contours and assigning lower heat values to the blurry pixels along the boundaries. Meanwhile, in scenes dominated by the background, PSANet was still able to accurately focus on the building areas in the images. This illustrates that PSANet successfully learned the spatial and contextual information of the building areas, thereby enabling accurate recognition of the building areas in the images. In addition, when there were objects in the image with similar echo intensity to the building areas, PSANet was able to correctly classify them as background while preserving the integrity of the building area pixels. This illustrates that PSANet has strong robustness to effectively cope with complex backgrounds and noise interference, ensuring the accurate identification of building areas.

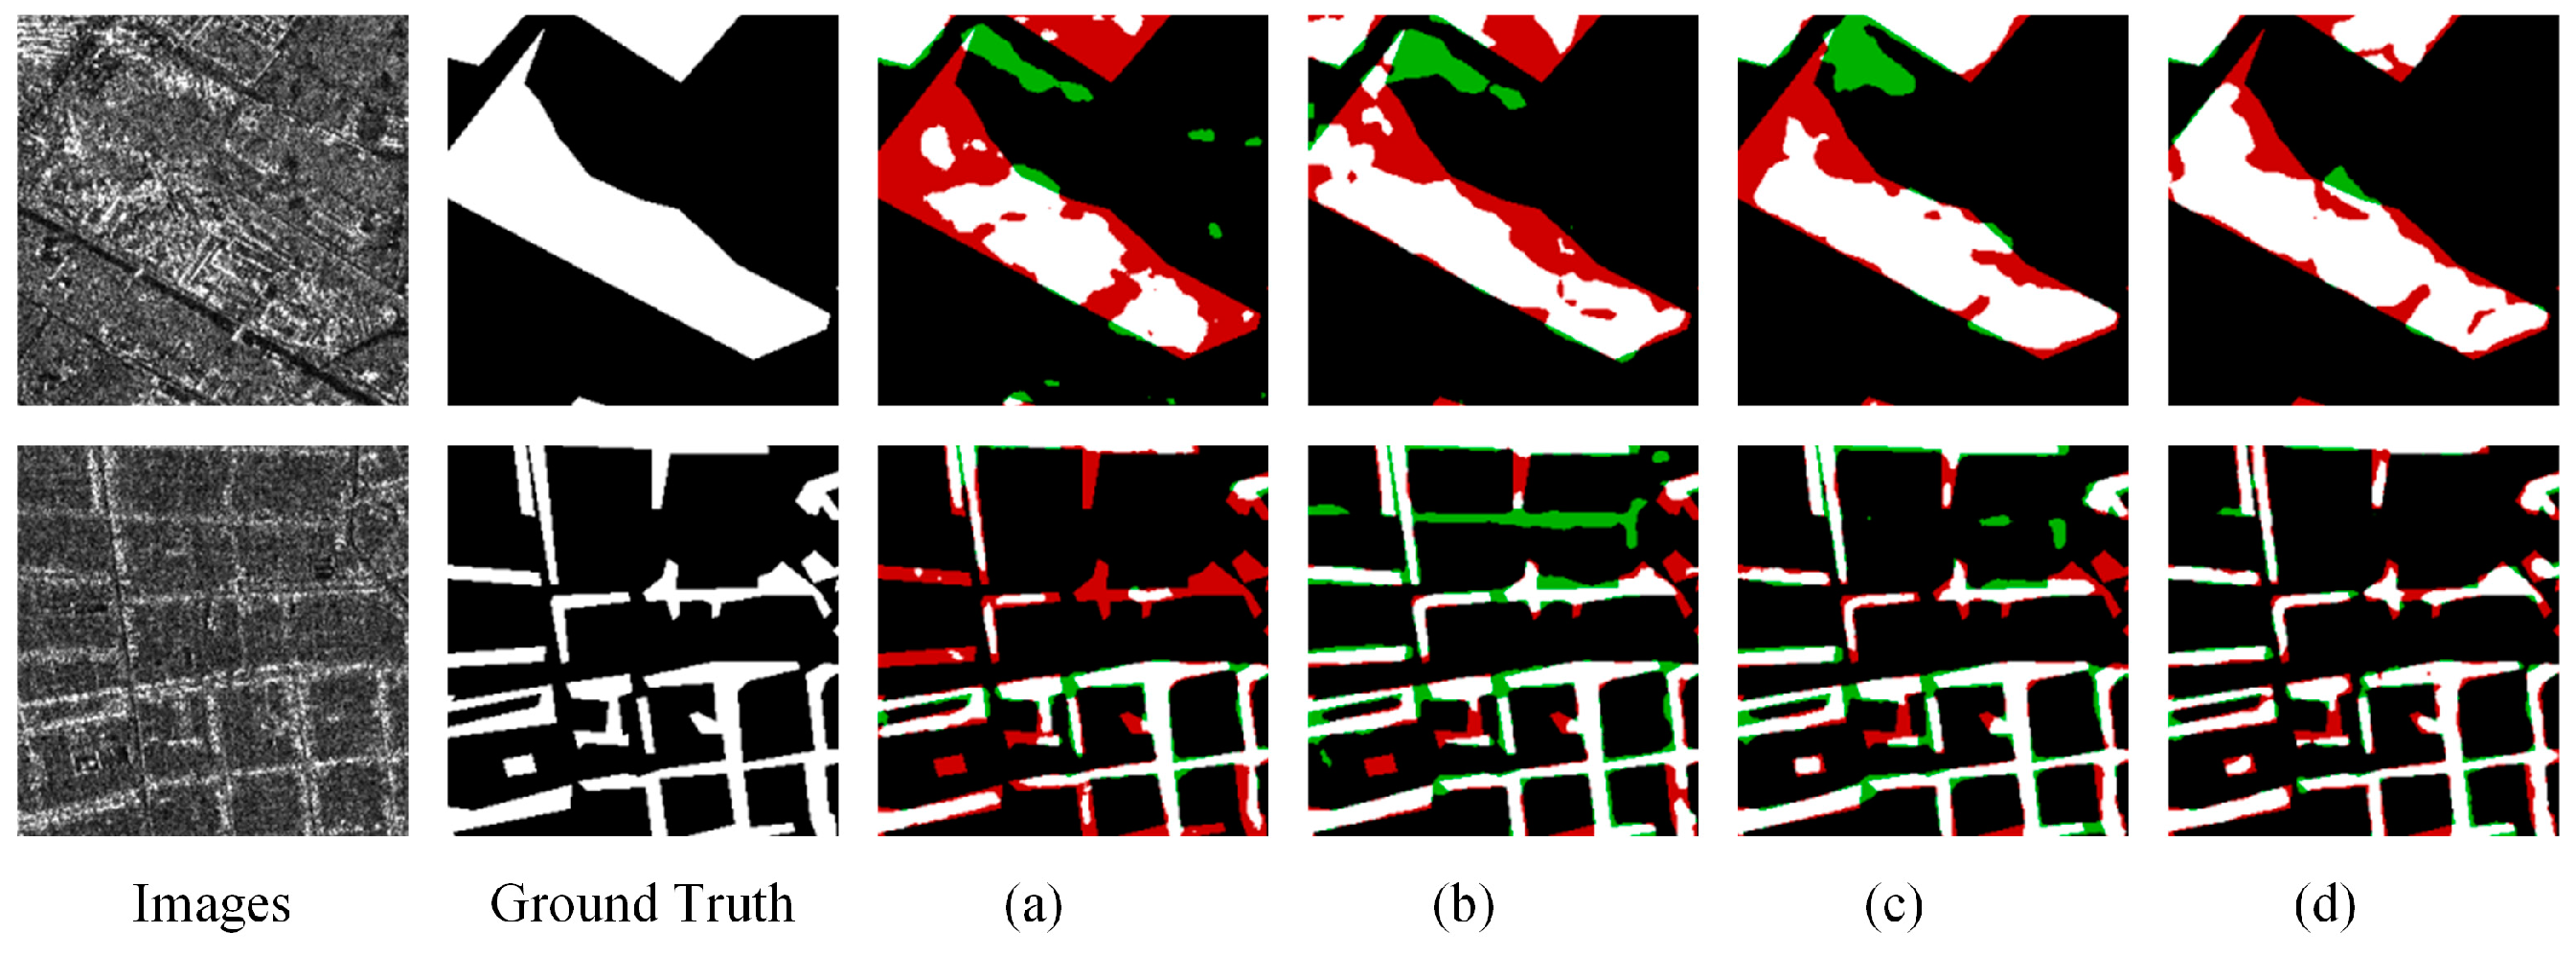
5.2. Method Applicability

5.2.1. Tibet Province

To evaluate the applicability of PSANet, we selected Tibet Province from the SARBuD 1.0 dataset, which has significant geographical differences compared to Anhui and Jiangsu Provinces. To facilitate knowledge transfer across regions, we employed transfer learning techniques [41], transferring the knowledge learned by the models from Anhui and Jiangsu to Tibet. Specifically, we froze the weights of all layers before the second to last upsampling module and trained the model using an SGD optimizer with a learning rate of 0.0003, momentum of 0.9, and weight decay of 0.0002 for a total of 30 iteration cycles and a batch size of 4. Then, we applied these trained models to evaluate the performance in Tibet Province.
Tibet Province consists of 254 images collected in February 2019 in Tibet, as presented in Figure 13.
Figure 14 shows the segmentation results of four representative images from the Tibet Province, from which it can be observed that all seven methods had certain errors. In particular, the segmentation results of method (a) contained more green pixels, while the segmentation results of method (f) contained more red pixels, indicating that these two methods fail to effectively transfer the learned knowledge, resulting in poor applicability on Tibet. In addition, our method performs better on large building areas compared to small building areas, which may be due to the more regular structural characteristics and larger size of large building areas, making them easier to distinguish in the image. Meanwhile, the fused encoded features can enhance the network’s understanding of contextual information, which helps to accurately identify large building areas that typically contain more global information.

5.2.2. Taiwan Province

Similarly, we also selected Taiwan Province from the SarBurd1.0 dataset for the experiment, which has different geographical features compared to Anhui, Jiangsu, and Tibet. Taiwan Province consists of 290 images collected in June 2017 in Taiwan, as presented in Figure 15.
Figure 16 shows the segmentation results of four representative images from the Taiwan Province, from which it can be observed that all seven methods still had certain errors. In particular, the segmentation results of method (a) contained more green pixels, while the segmentation results of methods (b) and (f) contained more red pixels, indicating that these three methods struggle to effectively transfer the learned knowledge to the Taiwan region. In addition, although our method performs poorly in the segmentation of building area boundaries due to the model’s limited ability to capture detailed features, there are fewer red and green pixels in its results, which indicates that it can better adapt to the distribution of building areas in Taiwan than other methods, demonstrating stronger generalization ability and applicability.

6. Conclusions

This study explores several major challenges faced in segmenting building areas from SAR images, including complex backgrounds, speckle noise interference, and the impact of geometric distortions. These factors make building area segmentation from SAR images more difficult than from optical images. Therefore, we analyzed the existing methods for building area segmentation and discussed the advantages and disadvantages of different methods. Specifically, we focused on the limitations of current encoder–decoder architecture, such as the inability to fully extract deep-level features of building areas and the tendency to lose information from small-scale building areas during encoding. To address these issues, we designed an innovative network based on the encoder–decoder architecture. First, we designed an improved Pseudo-Siamese network that uses fusion encoding algorithm to encode the extracted two sets of features at distinct levels, thereby enhancing the extraction of deep-level features of building areas. Meanwhile, information on the deepest encoded features was enriched using an atrous spatial pyramid pooling module, thereby reducing the information loss of small-scale building areas during encoding. Next, we designed a hierarchical decoder that combines the advantages of transposed convolutions and skip connections to accurately decode the encoded features. Finally, the model prediction was optimized using the combined loss function CE-Dice to achieve optimal performance. We selected four regions with different geographical characteristics from the SARBud 1.0 dataset for experiments, namely, Jiangsu Province, Anhui Province, Tibet Province, and Taiwan Province. The experimental results demonstrate the superiority of PSANet in segmenting building areas from SAR images. Semantic segmentation of SAR images is still in its developmental stage, with many aspects requiring further research and exploration. In the next phase, we will explore suitable methods to integrate the transformer architecture. Specifically, our model has limitations in building area boundary segmentation and handling high-density building areas. We plan to enhance the understanding of contextual information using the transformer architecture, as transformers are more efficient than CNNs in capturing global information, which can improve segmentation performance. Furthermore, in SAR data, noise interference is one of the key factors affecting segmentation performance. Although incorporating attention mechanisms in the model, which automatically assigns weights to strengthen important features, can improve the model’s robustness to noise to some extent, combining specialized denoising methods during the data preprocessing stage—such as non-local means denoising and the CycleGAN algorithm [42]—will further enhance the model’s segmentation performance.

Author Contributions

Conceptualization, M.L. and L.H.; methodology, M.L. and L.H.; software, M.L. and S.L.; validation, S.L. and L.H.; formal analysis, M.L. and L.H.; investigation, S.L. and L.H.; resources, M.L. and S.L.; data curation, M.L. and S.L.; writing—original draft preparation, L.H.; writing—review and editing, L.H., M.L. and S.L.; visualization, M.L. and L.H.; supervision, S.L.; project administration, M.L. and L.H. All authors have read and agreed to the published version of the manuscript.

Funding

This research was funded by project supported by the Natural Science Foundation of Hunan Province, China (Grant No. 2023JJ30233), Key Laboratory of Smart Earth, China (Grant No. KF2023YB02-03), and project supported by the Scientific Research Fund of Hunan Provincial Education Department (Grant No. 24B0451).

Institutional Review Board Statement

Not applicable.

Informed Consent Statement

Not applicable.

Data Availability Statement

The dataset used for this study is publicly available. The SARBud 1.0 can be downloaded at https://github.com/CAESAR-Radi/SARBuD (accessed on 5 October 2024).

Conflicts of Interest

The authors declare no conflicts of interest.

References

  1. Guo, N.; Jiang, M.; Hu, X.; Su, Z.; Zhang, W.; Li, R.; Luo, J. NPSFF-Net: Enhanced Building Segmentation in Remote Sensing Images via Novel Pseudo-Siamese Feature Fusion. Remote Sens. 2024, 16, 3266. [Google Scholar] [CrossRef]
  2. Cao, H.; Zhang, H.; Wang, C.; Zhang, B. Operational built-up areas extraction for cities in China using Sentinel-1 SAR data. Remote Sens. 2018, 10, 874. [Google Scholar] [CrossRef]
  3. Sun, Y.; Hua, Y.; Mou, L.; Zhu, X.X. CG-Net: Conditional GIS-aware network for individual building segmentation in VHR SAR images. IEEE Trans. Geosci. Remote Sens. 2021, 60, 1–15. [Google Scholar] [CrossRef]
  4. Miura, H.; Midorikawa, S.; Matsuoka, M. Building Damage Assessment Using High-Resolution Satellite SAR Images of the 2010 Haiti Earthquake. Earthq. Spectra 2016, 32, 591–610. [Google Scholar] [CrossRef]
  5. Tan, C.; Chen, T.; Liu, J.; Deng, X.; Wang, H.; Ma, J. Building Extraction from Unmanned Aerial Vehicle (UAV) Data in a Landslide-Affected Scattered Mountainous Area Based on Res-Unet. Sustainability 2024, 16, 9791. [Google Scholar] [CrossRef]
  6. Semenzato, A.; Pappalardo, S.E.; Codato, D.; Trivelloni, U.; De Zorzi, S.; Ferrari, S.; De Marchi, M.; Massironi, M. Mapping and Monitoring Urban Environment through Sentinel-1 SAR Data: A Case Study in the Veneto Region (Italy). ISPRS Int. J. Geo Inf. 2020, 9, 375. [Google Scholar] [CrossRef]
  7. Li, X.; Yang, Y.; Sun, C.; Fan, Y. Investigation, Evaluation, and Dynamic Monitoring of Traditional Chinese Village Buildings Based on Unmanned Aerial Vehicle Images and Deep Learning Methods. Sustainability 2024, 16, 8954. [Google Scholar] [CrossRef]
  8. Joyce, K.E.; Samsonov, S.; Levick, S.R.; Engelbrecht, J.; Belliss, S. Mapping and monitoring geological hazards using optical, LiDAR, and synthetic aperture RADAR image data. Nat. Hazards 2014, 73, 137–163. [Google Scholar] [CrossRef]
  9. Li, Y.; Xu, W.; Chen, H.; Jiang, J.; Li, X. A novel framework based on mask R-CNN and histogram thresholding for scalable segmentation of new and old rural buildings. Remote Sens. 2021, 13, 1070. [Google Scholar] [CrossRef]
  10. Orhei, C.; Vert, S.; Vasiu, R. A novel edge detection operator for identifying buildings in augmented reality applications. In Proceedings of the International Conference on Information and Software Technologies, Kaunas, Lithuania, October 15–17 2020; pp. 208–219. [Google Scholar]
  11. Liu, K.; Ma, H.; Zhang, L.; Liang, X.; Chen, D.; Liu, Y. Roof segmentation from airborne LiDAR using octree-based hybrid region growing and boundary neighborhood verification voting. IEEE J. Sel. Top. Appl. Earth Obs. Remote Sens. 2023, 16, 2134–2146. [Google Scholar] [CrossRef]
  12. Chen, Y.; Wang, Z.; Peng, Z. A Study on Carbon Emission Reduction in the Entire Process of Retrofitting High-Rise Office Buildings Based on the Extraction of Typical Models. Sustainability 2024, 16, 8506. [Google Scholar] [CrossRef]
  13. Muhammed, E.; El-Shazly, A.; Morsy, S. Building Rooftop Extraction Using Machine Learning Algorithms for Solar Photovoltaic Potential Estimation. Sustainability 2023, 15, 11004. [Google Scholar] [CrossRef]
  14. Paul, A.; Mukherjee, D.P.; Das, P.; Gangopadhyay, A.; Chintha, A.R.; Kundu, S. Improved Random Forest for Classification. IEEE Trans. Image Process. 2018, 27, 4012–4024. [Google Scholar] [CrossRef]
  15. Emek, R.A.; Demir, N. Building Detection from Sar Images Using Unet Deep Learning Method. Int. Arch. Photogramm. Remote Sens. Spat. Inf. Sci. 2020, 44, 215–218. [Google Scholar] [CrossRef]
  16. Jing, H.; Sun, X.; Wang, Z.; Chen, K.; Diao, W.; Fu, K. Fine Building Segmentation in High-Resolution SAR Images via Selective Pyramid Dilated Network. IEEE J. Sel. Top. Appl. Earth Obs. Remote Sens. 2021, 14, 6608–6623. [Google Scholar] [CrossRef]
  17. Peng, B.; Zhang, W.; Hu, Y.; Chu, Q.; Li, Q. LRFFNet: Large Receptive Field Feature Fusion Network for Semantic Segmentation of SAR Images in Building Areas. Remote Sens. 2022, 14, 6291. [Google Scholar] [CrossRef]
  18. Ji, S.; Wei, S.; Lu, M. A scale robust convolutional neural network for automatic building extraction from aerial and satellite imagery. Int. J. Remote Sens. 2019, 40, 3308–3322. [Google Scholar] [CrossRef]
  19. Xiao, X.; Guo, W.; Chen, R.; Hui, Y.; Wang, J.; Zhao, H. A swin transformer-based encoding booster integrated in u-shaped network for building extraction. Remote Sens. 2022, 14, 2611. [Google Scholar] [CrossRef]
  20. Sariturk, B.; Seker, D.Z. A residual-inception U-Net (RIU-Net) approach and comparisons with U-shaped CNN and transformer models for building segmentation from high-resolution satellite images. Sensors 2022, 22, 7624. [Google Scholar] [CrossRef] [PubMed]
  21. Assad, M.B.; Kiczales, R. Deep Biomedical Image Classification Using Diagonal Bilinear Interpolation and residual network. Int. J. Intell. Netw. 2020, 1, 148–156. [Google Scholar] [CrossRef]
  22. Gu, Y.; Ren, C.; Chen, Q.; Bai, H.; Huang, Z.; Zou, L. A Conditionally Parameterized Feature Fusion U-Net for Building Change Detection. Sustainability 2024, 16, 9232. [Google Scholar] [CrossRef]
  23. Xu, Q.; Chen, K.; Sun, X.; Zhang, Y.; Li, H.; Xu, G. Pseudo-Siamese capsule network for aerial remote sensing images change detection. IEEE Geosci. Remote Sens. Lett. 2020, 19, 1–5. [Google Scholar] [CrossRef]
  24. He, K.; Zhang, X.; Ren, S.; Sun, J. Deep residual learning for image recognition. In Proceedings of the IEEE Conference on Computer Vision and Pattern Recognition, Las Vegas, NV, USA, 26 June–1 July 2016; pp. 770–778. [Google Scholar]
  25. Chen, L.-C.; Papandreou, G.; Kokkinos, I.; Murphy, K.; Yuille, A.L. Deeplab: Semantic image segmentation with deep convolutional nets, atrous convolution, and fully connected crfs. IEEE Trans. Pattern Anal. Mach. Intell. 2017, 40, 834–848. [Google Scholar] [CrossRef] [PubMed]
  26. Woo, S.; Park, J.; Lee, J.-Y.; Kweon, I.S. Cbam: Convolutional block attention module. In Proceedings of the European Conference on Computer Vision (ECCV), Munich, Germany, 8–14 September 2018; pp. 3–19. [Google Scholar]
  27. Zhang, Z.; Sabuncu, M.R. Generalized cross entropy loss for training deep neural networks with noisy labels. Adv. Neural Inf. Process. Syst. 2018, 31, 8792–8802. [Google Scholar]
  28. Ronneberger, O.; Fischer, P.; Brox, T. U-net: Convolutional networks for biomedical image segmentation. In Proceedings of the Medical Image Computing and Computer-Assisted Intervention—MICCAI 2015: 18th International Conference, Munich, Germany, 5–9 October 2015; pp. 234–241. [Google Scholar]
  29. Badrinarayanan, V.; Kendall, A.; Cipolla, R. Segnet: A deep convolutional encoder-decoder architecture for image segmentation. IEEE Trans. Pattern Anal. Mach. Intell. 2017, 39, 2481–2495. [Google Scholar] [CrossRef]
  30. Chen, L.-C.; Zhu, Y.; Papandreou, G.; Schroff, F.; Adam, H. Encoder-decoder with atrous separable convolution for semantic image segmentation. In Proceedings of the European Conference on Computer Vision (ECCV), Munich, Germany, 8–14 September 2018; pp. 801–818. [Google Scholar]
  31. Che, Z.; Shen, L.; Huo, L.; Hu, C.; Wang, Y.; Lu, Y.; Bi, F. MAFF-HRNet: Multi-attention feature fusion HRNet for building segmentation in remote sensing images. Remote Sens. 2023, 15, 1382. [Google Scholar] [CrossRef]
  32. Zhou, Z.; Rahman Siddiquee, M.M.; Tajbakhsh, N.; Liang, J. Unet++: A nested u-net architecture for medical image segmentation. In Proceedings of the Deep Learning in Medical Image Analysis and Multimodal Learning for Clinical Decision Support: 4th International Workshop, DLMIA 2018, and 8th International Workshop, ML-CDS 2018, Held in Conjunction with MICCAI 2018, Granada, Spain, 20 September 2018; pp. 3–11. [Google Scholar]
  33. Xie, E.; Wang, W.; Yu, Z.; Anandkumar, A.; Alvarez, J.M.; Luo, P. SegFormer: Simple and efficient design for semantic segmentation with transformers. Adv. Neural Inf. Process. Syst. 2021, 34, 12077–12090. [Google Scholar]
  34. Zhao, H.; Shi, J.; Qi, X.; Wang, X.; Jia, J. Pyramid scene parsing network. In Proceedings of the IEEE Conference on Computer Vision and Pattern Recognition, Honolulu, HI, USA, 21–26 July 2017; pp. 2881–2890. [Google Scholar]
  35. Howard, A.; Sandler, M.; Chu, G.; Chen, L.-C.; Chen, B.; Tan, M.; Wang, W.; Zhu, Y.; Pang, R.; Vasudevan, V. Searching for mobilenetv3. In Proceedings of the IEEE/CVF International Conference on Computer Vision, Seoul, Republic of Korea, 27 October–2 November 2019; pp. 1314–1324. [Google Scholar]
  36. Chollet, F. Xception: Deep learning with depthwise separable convolutions. In Proceedings of the IEEE Conference on Computer Vision and Pattern Recognition, Honolulu, HI, USA, 21–26 July 2017; pp. 1251–1258. [Google Scholar]
  37. Park, J.; Woo, S.; Lee, J.-Y.; Kweon, I.S. Bam: Bottleneck attention module. arXiv 2018, arXiv:1807.06514. [Google Scholar]
  38. Zhang, H.; Zu, K.; Lu, J.; Zou, Y.; Meng, D. Epsanet: An efficient pyramid split attention block on convolutional neural network. arXiv 2021, arXiv:2105.14447. [Google Scholar]
  39. Selvaraju, R.R.; Cogswell, M.; Das, A.; Vedantam, R.; Parikh, D.; Batra, D. Grad-cam: Visual explanations from deep networks via gradient-based localization. In Proceedings of the IEEE International Conference on Computer Vision, Venice, Italy, 22–29 October 2017; pp. 618–626. [Google Scholar]
  40. Ross, T.-Y.; Dollár, G. Focal loss for dense object detection. In Proceedings of the IEEE Conference on Computer Vision and Pattern Recognition, Honolulu, HI, USA, 21–26 July 2017; pp. 2980–2988. [Google Scholar]
  41. Pan, S.J.; Yang, Q. A survey on transfer learning. IEEE Trans. Knowl. Data Eng. 2009, 22, 1345–1359. [Google Scholar] [CrossRef]
  42. Zhu, J.-Y.; Park, T.; Isola, P.; Efros, A.A. Unpaired image-to-image translation using cycle-consistent adversarial networks. In Proceedings of the IEEE International Conference on Computer Vision, Honolulu, HI, USA, 21–26 July 2017; pp. 2223–2232. [Google Scholar]
Figure 1. The structure overview of PSANet.
Applsci 15 02339 g001
Figure 2. The structure of fusion encoding algorithm.
Applsci 15 02339 g002
Figure 3. The structure of atrous spatial pyramid pooling.
Applsci 15 02339 g003
Figure 4. The structure of hierarchical decoder.
Applsci 15 02339 g004
Figure 5. The structure of feature refinement module.
Applsci 15 02339 g005
Figure 6. Experimental datasets.
Applsci 15 02339 g006
Figure 7. The segmentation results of building areas using different methods on Anhui Province images: (a) SegNet, (b) DeepLabV3-Plus, (c) MAFF-HRNet, (d) UNet++, (e) SegFormer, (f) PSPNet, and PSANet (ours).
Applsci 15 02339 g007
Figure 8. The segmentation results of building areas using different methods on Jiangsu Province images: (a) SegNet, (b) DeepLabV3-Plus, (c) MAFF-HRNet, (d) UNet++, (e) SegFormer, (f) PSPNet, and PSANet (ours).
Applsci 15 02339 g008
Figure 9. The segmentation results of building areas using different combination methods: (a) Base, (b) Proposal 1, (c) Proposal 2, and (d) Proposal 3.
Applsci 15 02339 g009
Figure 10. Attention heatmaps at the intermediate stage of FRM (a) using SAM only, (b) using CAM only, and (c) using CBAM.
Applsci 15 02339 g010
Figure 11. Evaluation metrics obtained using different loss functions in (a) Anhui Province and (b) Jiangsu Province.
Applsci 15 02339 g011
Figure 12. Heatmaps in different scenarios.
Applsci 15 02339 g012
Figure 13. Tibet Province.
Applsci 15 02339 g013
Figure 14. The segmentation outcomes of building areas using different networks on Tibet Province images: (a) SegNet, (b) DeepLabV3-Plus, (c) MAFF-HRNet, (d) UNet++, (e) SegFormer, (f) PSPNet, and PSANet (ours).
Applsci 15 02339 g014
Figure 15. Taiwan Province.
Applsci 15 02339 g015
Figure 16. The segmentation outcomes of building areas using different networks on Taiwan Province images: (a) SegNet, (b) DeepLabV3-Plus, (c) MAFF-HRNet, (d) UNet++, (e) SegFormer, (f) PSPNet, and PSANet (ours).
Applsci 15 02339 g016
Table 1. Results of different methods on Anhui Province images (%).
MethodIoURecallPrecisionOAF1-Score
SegNet69.2485.3378.5995.6281.82
DeepLabV3-Plus 71.5182.2284.5996.2283.39
MAFF-HRNet72.3686.0381.9996.2183.97
UNet++71.5983.3983.4996.1883.44
SegFormer70.8183.8782.1796.0282.91
PSPNet70.7680.8485.0296.1482.88
PSANet (Ours)74.3184.5286.0196.6385.26
Table 2. Results of different methods on Jiangsu Province images (%).
MethodIoURecallPrecisionOAF1-Score
SegNet65.9384.7374.8292.2779.47
DeepLabV3-Plus68.5278.0484.8993.6781.32
MAFF-HRNet69.7582.2882.0893.7182.18
UNet++69.3783.1880.7193.5281.92
SegFormer68.5881.8580.8893.3881.36
PSPNet67.8682.7279.0693.0880.85
PSANet (Ours)71.3882.2384.3994.1883.31
Table 3. The evaluation metrics obtained using different combination methods (%).
DatasetMethodIoURecallPrecisionOAF1-Score
Jiangsu ProvinceBase66.5376.5283.5993.2179.91
Proposal 169.1780.2683.3593.6981.77
Proposal 269.5181.6182.4293.6882.02
Proposal 371.3882.2384.3994.1883.31
Anhui ProvinceBase69.5479.2485.0295.9982.03
Proposal 170.9981.8684.2596.1483.04
Proposal 272.4982.5585.6196.3884.05
Proposal 374.3184.5286.0196.6385.26
Table 4. The evaluation metrics obtained using different encoding networks (%).
DatasetEncoding NetworkIoURecallPrecisionOAF1-ScoreParameter (M)Flops (G)
Jiangsu ProvinceMobileNetv367.9777.9884.1193.5180.9326.5926.02
Xception68.4681.9680.6193.3481.2833.1121.28
ResNet50-ResNet10171.4986.5980.3894.0983.37207.91126.62
VGG13-VGG1668.2679.8782.4393.6581.1346.7340.19
Sum-Fusion70.3381.9283.2593.8982.5841.7536.45
Reference [1]70.4982.2583.1594.1282.6943.2938.71
Ours71.3882.2384.3994.1882.0246.5141.43
Anhui ProvinceMobileNetv369.4179.9984.0195.9381.9426.5926.02
Xception71.8581.5685.7996.3183.6233.1121.28
ResNet50-ResNet10172.5884.7983.4496.1184.11207.91126.62
VGG13-VGG1671.6478.9888.4996.1983.4746.7340.19
Sum-Fusion73.2483.2985.8496.4984.5541.7536.45
Reference [1]73.8184.5485.3296.3584.9243.2938.71
Ours74.3184.5286.0196.6385.2646.5141.43
Table 5. The assessment metrics derived from different strategies (%).
DatasetStrategyIoURecallPrecisionOAF1-Score
Jiangsu ProvinceCBAM70.8582.4983.3894.0182.94
Replaced with PSAM70.9180.5585.5494.1682.97
Replaced with BAM71.1481.8184.5194.1483.12
FRM71.3882.2384.3994.1883.31
Anhui ProvinceCBAM73.5483.6185.9496.5384.75
Replaced with PSAM73.4482.4387.0696.5684.68
Replaced with BAM74.1383.8186.5196.6185.14
FRM74.3184.5286.0196.6385.26
Table 6. The computational consumption of different networks.
ModelParameters (M)Flops (G)Inference Time (s)Training Time on Anhui ImagesTraining Time on Jiangsu ImagesMemory (MB)
SegNet29.4440.170.121 h 32 min 8 s2 h 35 min 17 s112
DeepLabV3-Plus58.7562.850.182 h 9 min 58 s3 h 40 min 54 s224
MAFF-HRNet97.6862.670.253 h 1 min 39 s5 h 30 min 49 s374
UNet++36.63138.660.144 h 6 min 9 s7 h 32 min 17 s139
SegFormer84.5924.940.233 h 15 min 4 s5 h 44 min 36 s323
PSPNet47.7114.840.151 h 5 min 7 s1 h 41 min 59 s178
PSANet (Ours)46.5141.430.171 h 49 min 42 s3 h 7 min 11 s177
Table 7. Evaluation metrics obtained using different dilation rates.
DatasetMethodIoURecallPrecisionOAF1-Score
Jiangsu ProvinceASPP-Small71.1979.3987.3394.3383.17
ASPP-Large70.7684.8181.0393.8182.87
Ours71.3882.2384.3994.1883.31
Anhui ProvinceASPP-Small73.7780.6489.6496.6984.89
ASPP-Large73.3584.9784.2996.4484.63
Ours74.3184.5286.0196.6385.26
Disclaimer/Publisher’s Note: The statements, opinions and data contained in all publications are solely those of the individual author(s) and contributor(s) and not of MDPI and/or the editor(s). MDPI and/or the editor(s) disclaim responsibility for any injury to people or property resulting from any ideas, methods, instructions or products referred to in the content.

