
Hybrid Trust Model for Node-Centric Misbehavior Detection in Dynamic Behavior-Homogeneous Clusters

 ,
,
Abstract
1. Introduction
- [1]
- Proposing a method for the dynamic segmentation of behavior-homogeneous clusters.
- [2]
- Investigating the weights of interrelationships among vehicles within a cluster.
- [3]
- Introducing a method for identifying misbehavior nodes in complex networks within dynamic behavior-homogeneous clusters based on a hybrid trust model.
2. Related Work
- A.
- Trust-based detection
- B.
- RSU-aided detection
- C.
- Node collaboration detection
3. Methodology
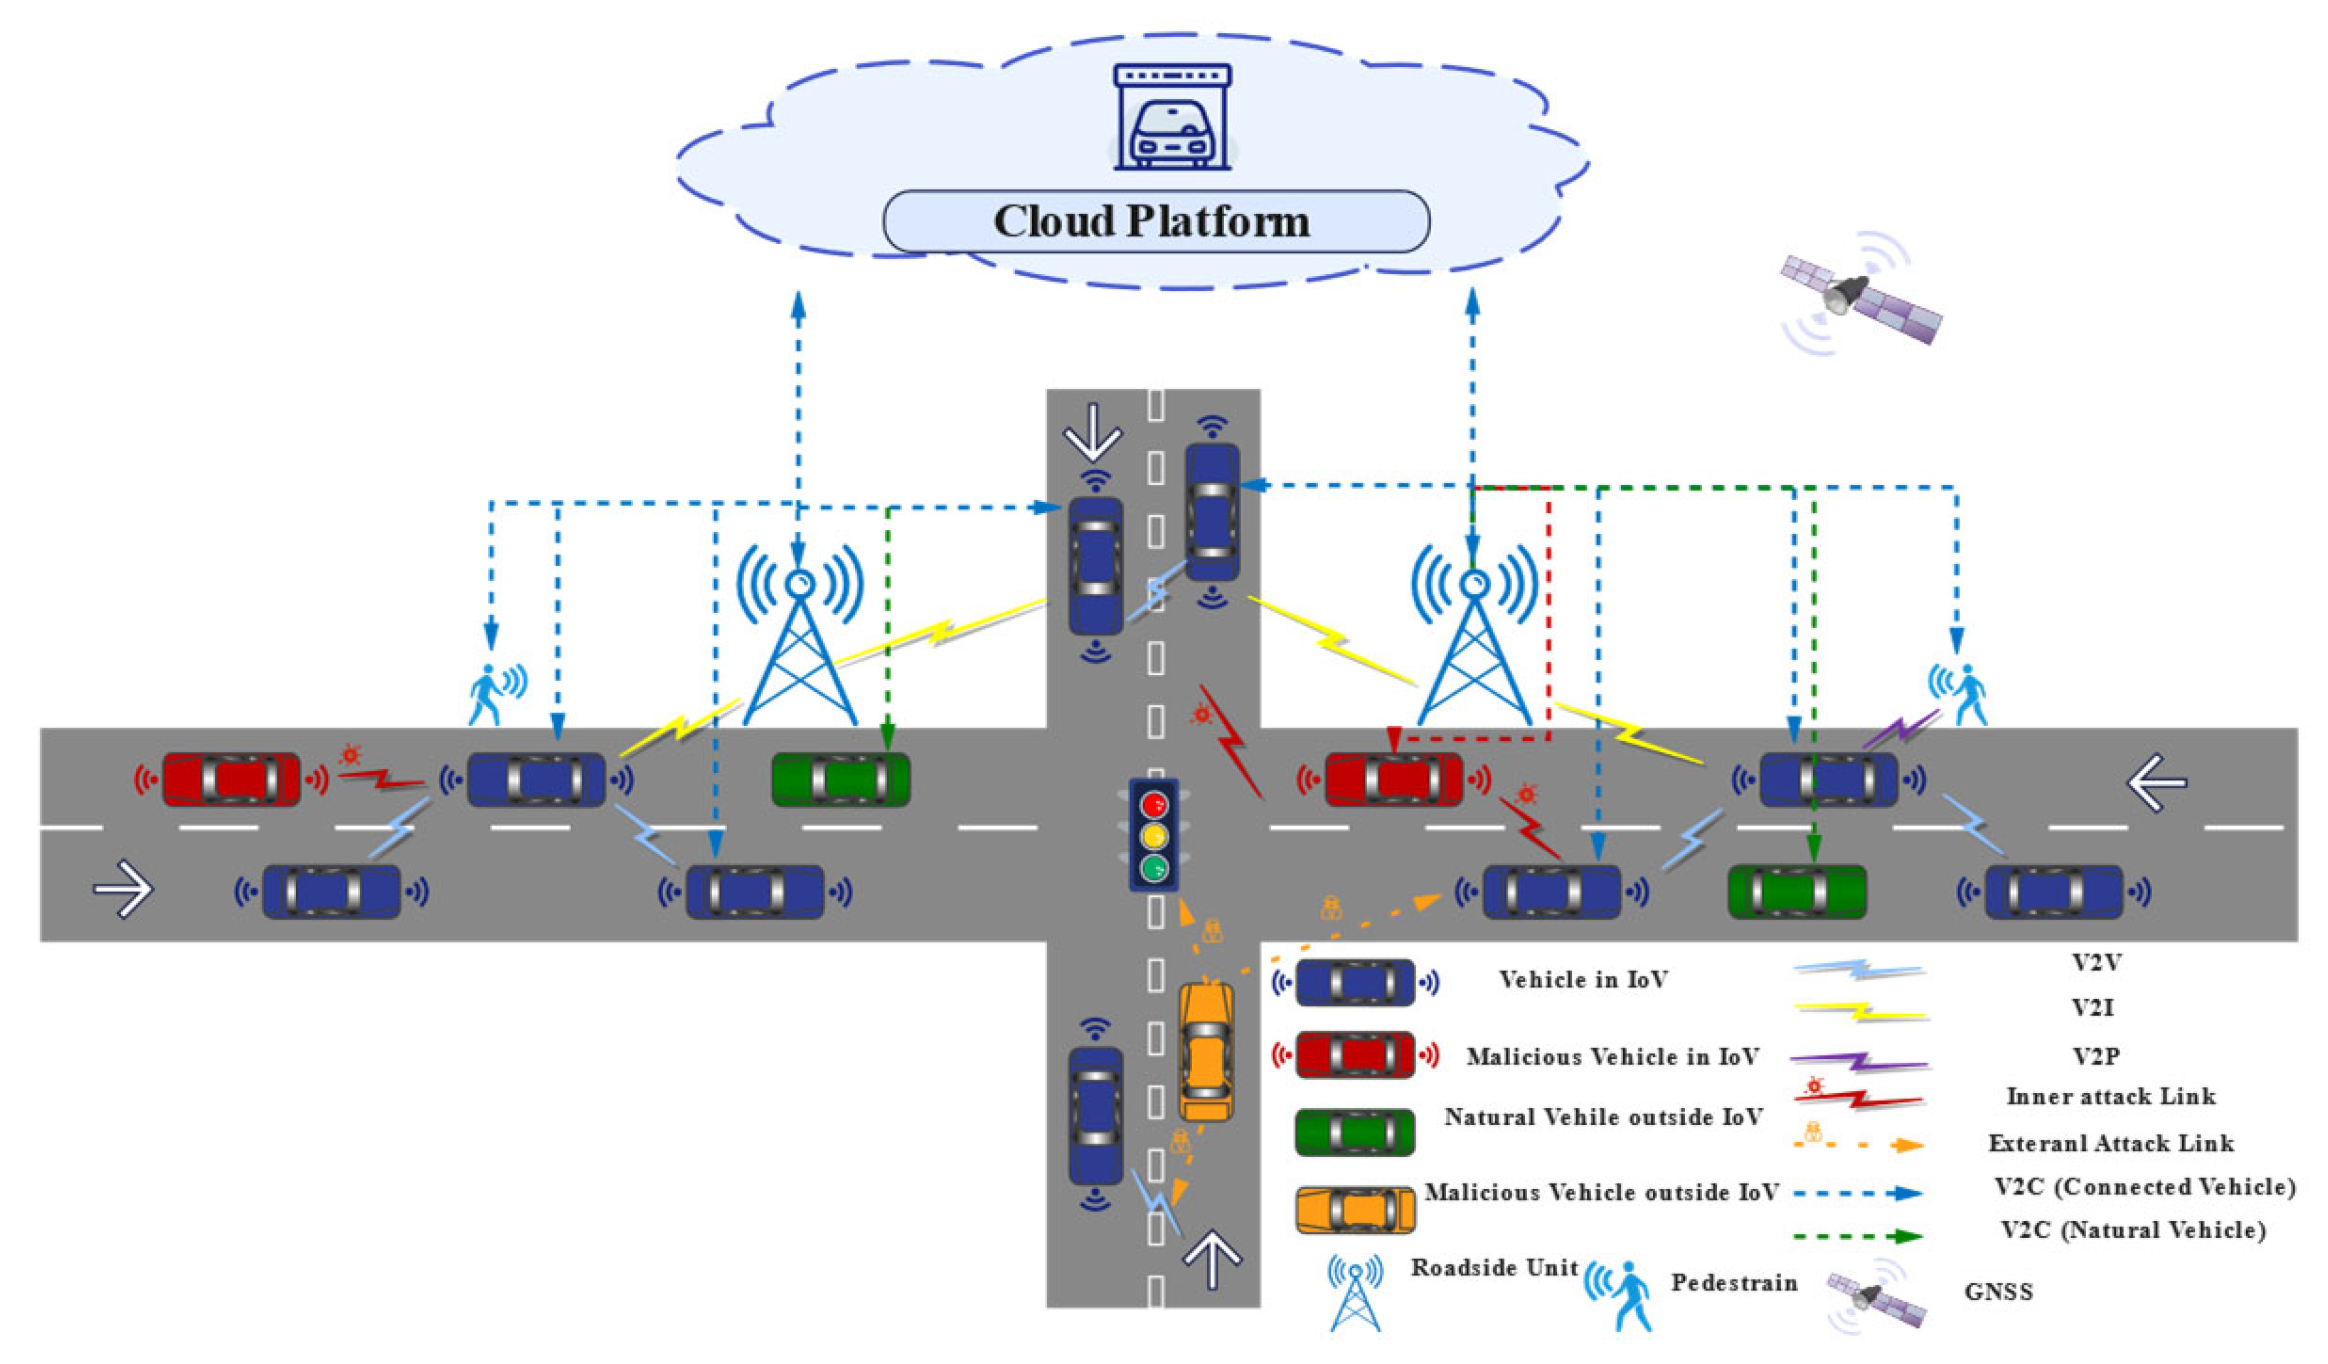
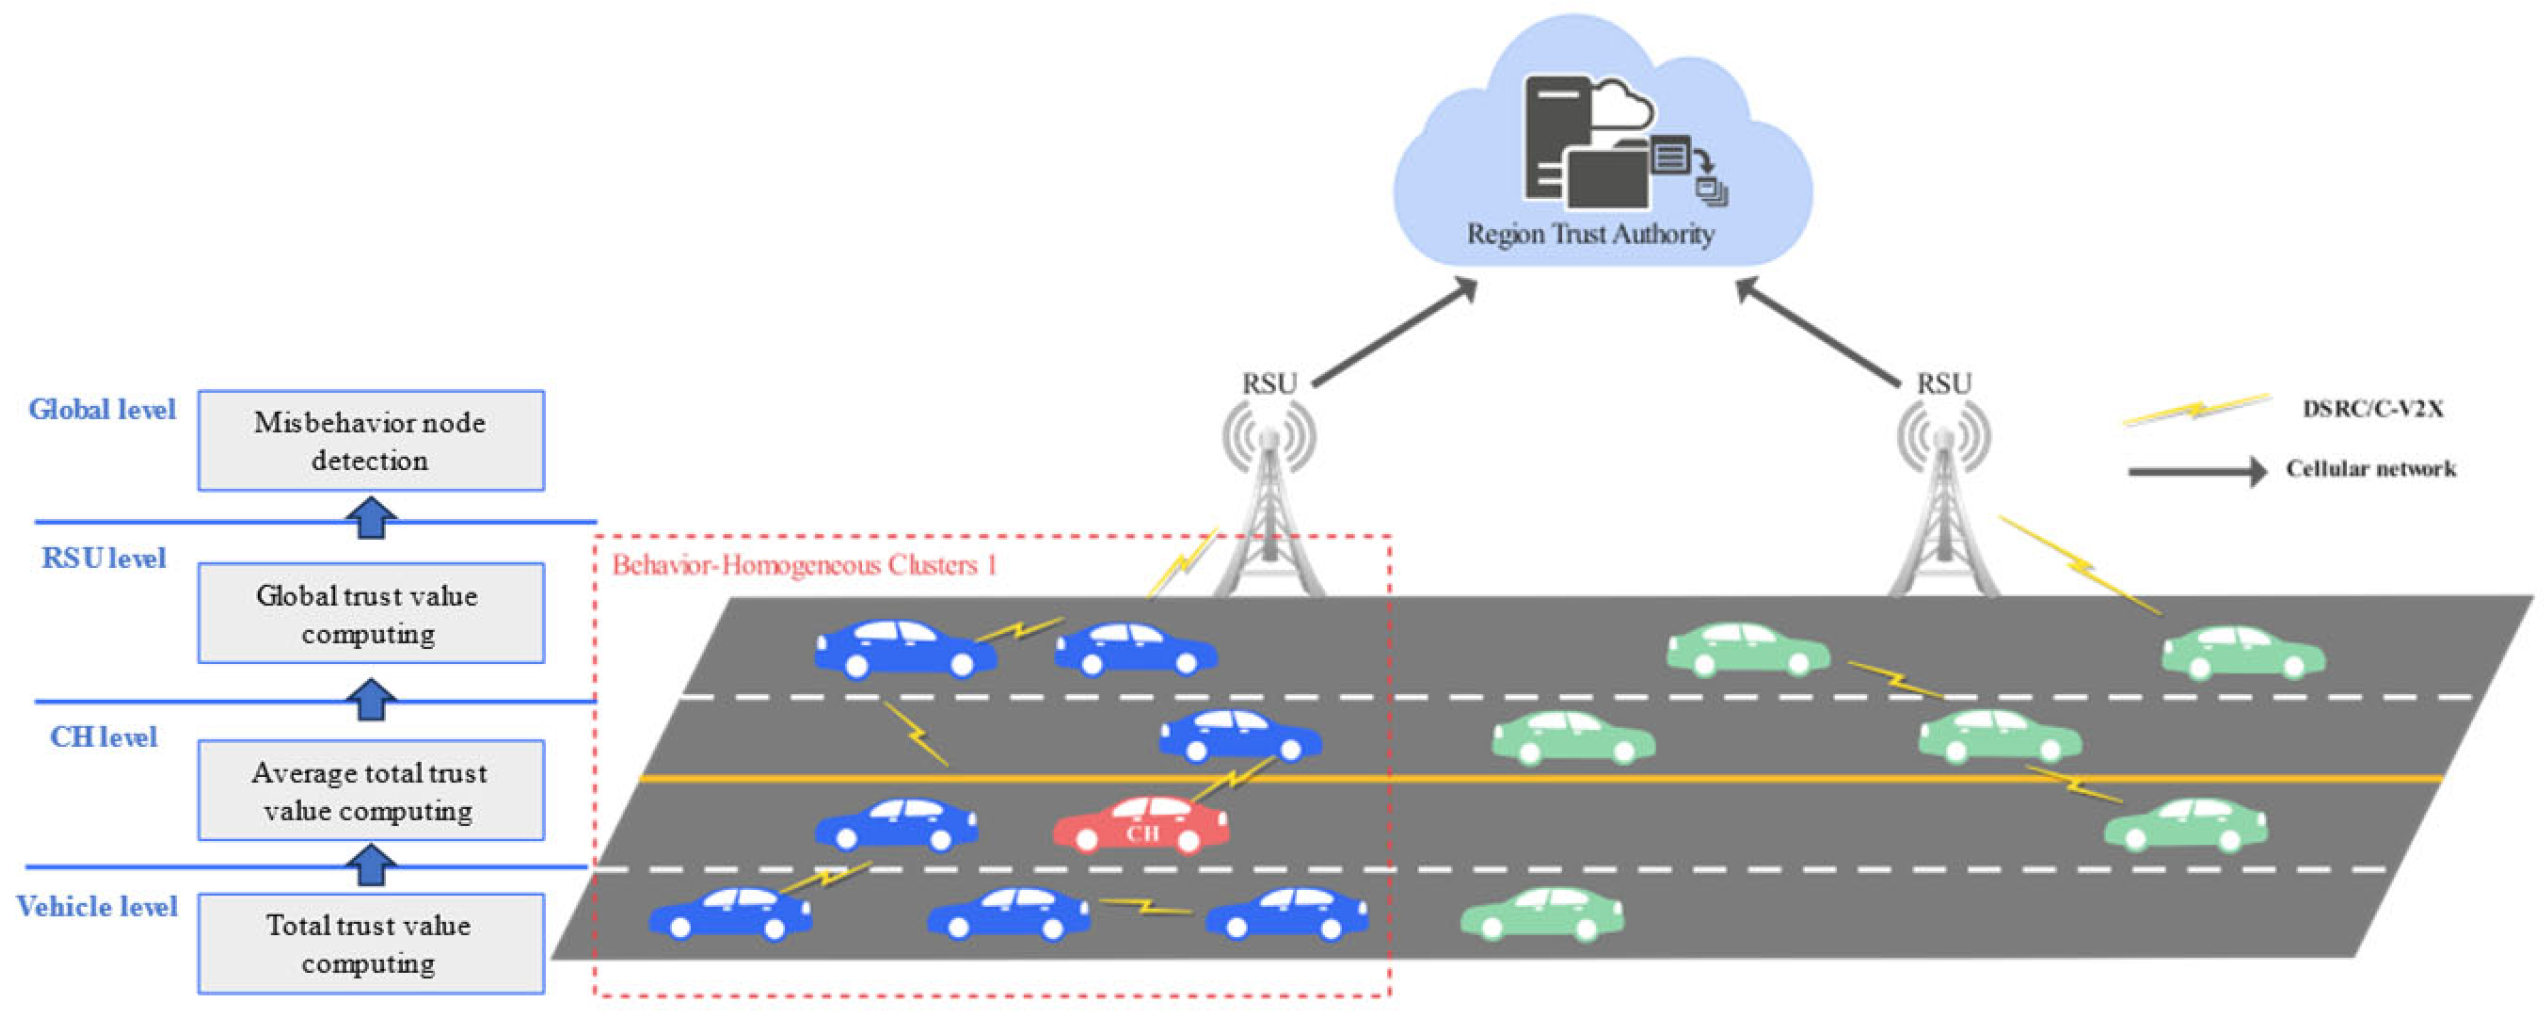
3.1. System Model
- Vehicle Node Layer: Each vehicle node computes its total trust value by integrating both direct trust (self-observed behavior) and indirect trust (recommendations from neighboring vehicles).
- Cluster Head Layer: The cluster head aggregates the total trust values of member vehicles within its cluster, computing an average total trust value for the cluster. This calculation incorporates association weights, quantifying the strength of relationships between individual vehicles and their cluster.
- RSU Layer: The RSU further refines the trust evaluation by aggregating trust data from multiple clusters within its coverage area. A global hybrid trust value is computed considering inter-cluster associations and vehicle trust assessments.
- Cloud Controller Layer: The cloud controller collects hybrid trust values from RSUs across different regions. A trust threshold range is dynamically computed using a consistency parameter.
3.2. Overview of the Proposed Scheme
- Segmentation of Dynamic Behavior-Homogeneous Vehicular Clusters
- Mining of Complex Relationship Weights in Dynamic Vehicle Clusters
- Hybrid Trust Value Computation Based on Weighted Vehicle Behavior
- Collaborative Node-Centric Misbehavior Detection
4. Segmentation of Dynamic Behavior-Homogeneous Vehicular Cluster
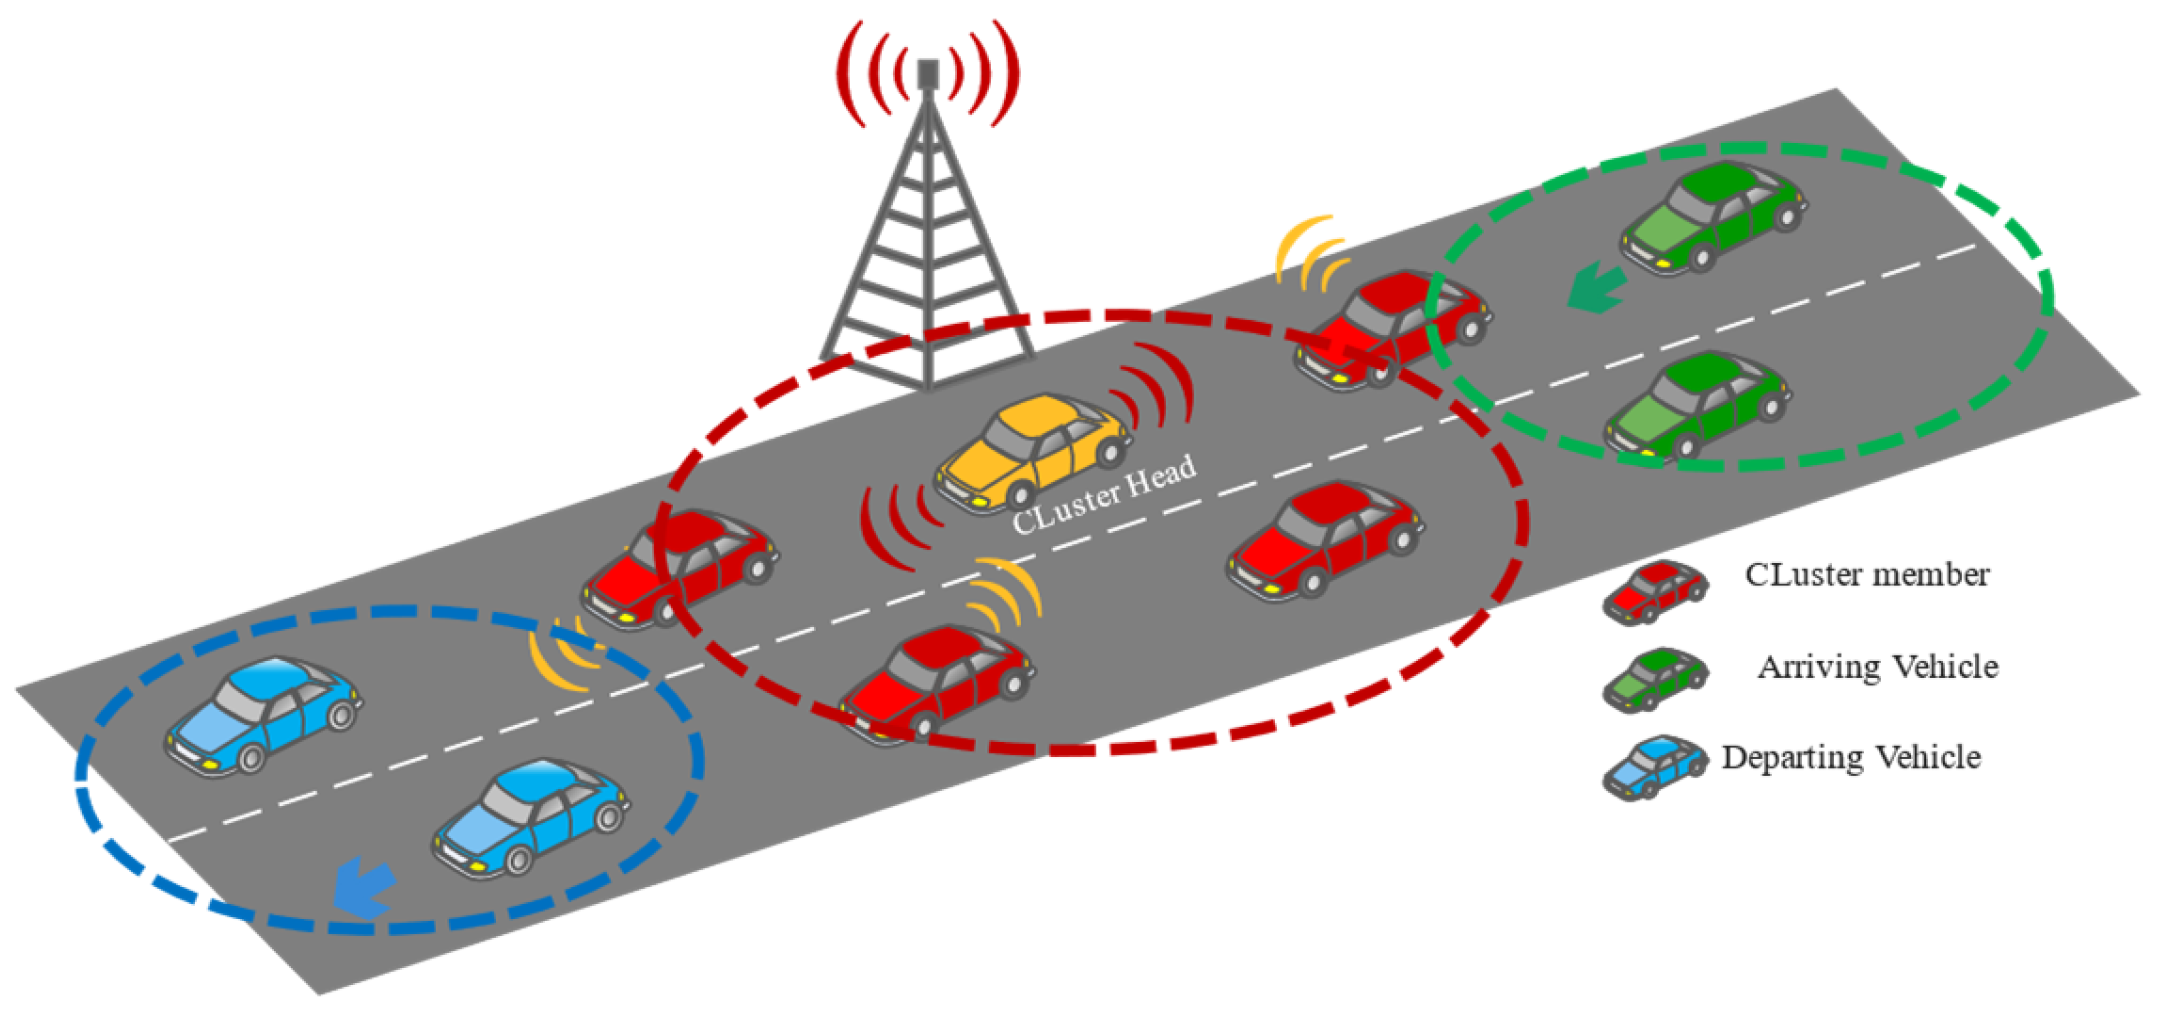
4.1. Dynamic Cluster Head Selection
- Cluster Initialization
- Cluster Head Update
- Cluster Head Departure
4.2. Clustering Method
5. Mining of Complex Relationship Weights in Dynamic Vehicle Clusters
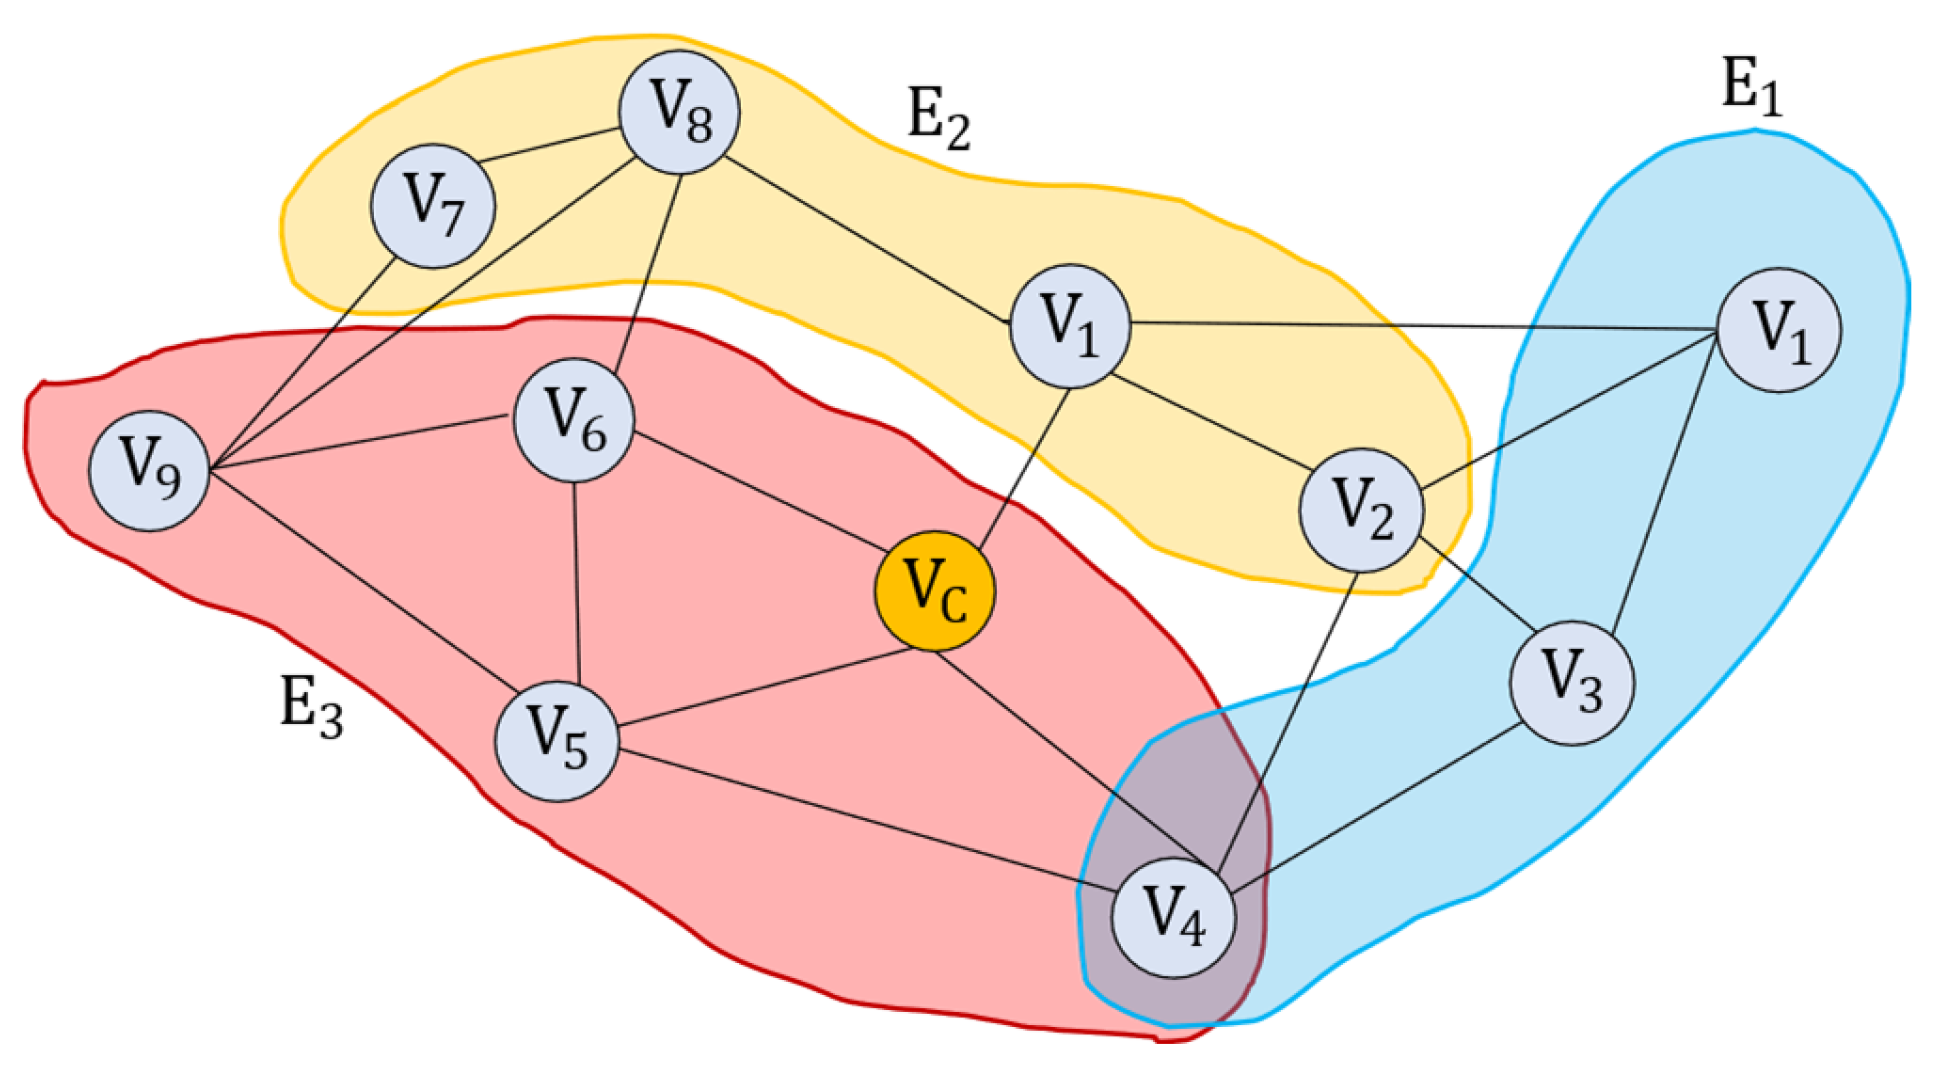
5.1. Vehicle Cluster Representation Method Based on Hypergraph Model
5.2. Association Relationship Mining Based on Hypergraph Model
- Calculation of Vehicle Node Authority
- Mining of Association Relationships Between Vehicle Nodes
- Mining of Association Relationships Between Vehicle Nodes and Vehicle Clusters
- Mining of Association Relationships Between Vehicle Clusters
6. Hybrid Trust Value Based on Weighted Vehicle Behavior
6.1. Trust Value Initialization
6.2. Vehicle Node Layer Trust Value Computation
- 1)
- Direct Trust Value
- Direct Trust Based on Node Speed
- -
- If exceeds the speed limit by more than 30% or is below the speed limit by more than 30%, the trust value is set to 0.3.
- -
- If is between +30% to +15% or −30% to −15% of the speed limit, the trust value is set to 0.5.
- -
- If is between +15% to +10% or −15% to −10% of the speed limit, the trust value is set to 0.7.
- -
- If is within +10% to −10% of the speed limit, the trust value is set to 0.9.
- Direct Trust Based on Transmission Rate
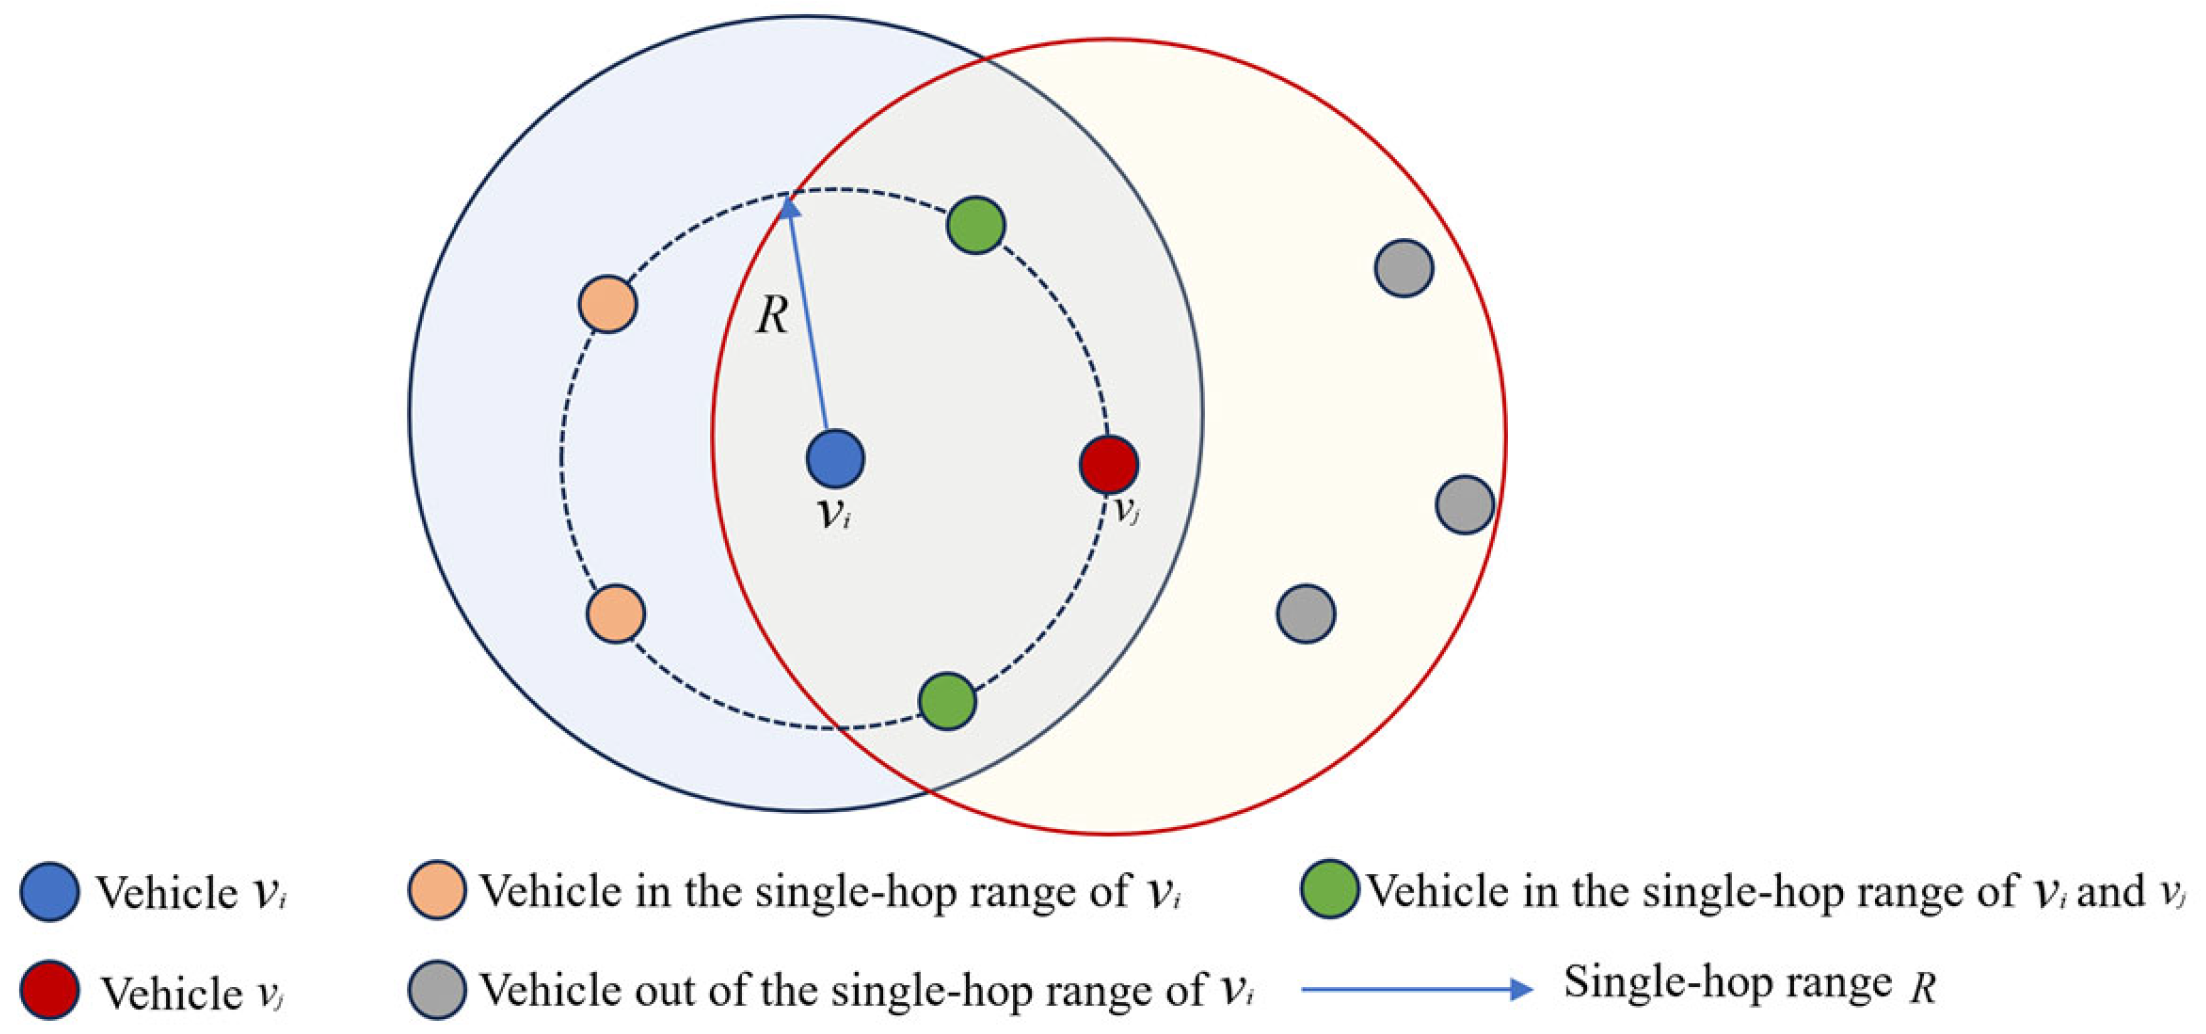
- Calculation of Trust Value Based on Node Distance
- 2)
- Indirect Trust Value
- 3)
- Total Trust Value
6.3. Average Total Trust Value at the Cluster Head Layer
6.4. Global Hybrid Trust Value at the RSU Layer
7. Collaborative Node-Centric Misbehavior Detection Based on Hybrid Trust Values
7.1. Node Layer Misbehavior Detection
7.2. Cluster Head Layer Misbehavior Detection
7.3. Cloud Layer Misbehavior Detection and Periodic Checks
8. Performance Analysis
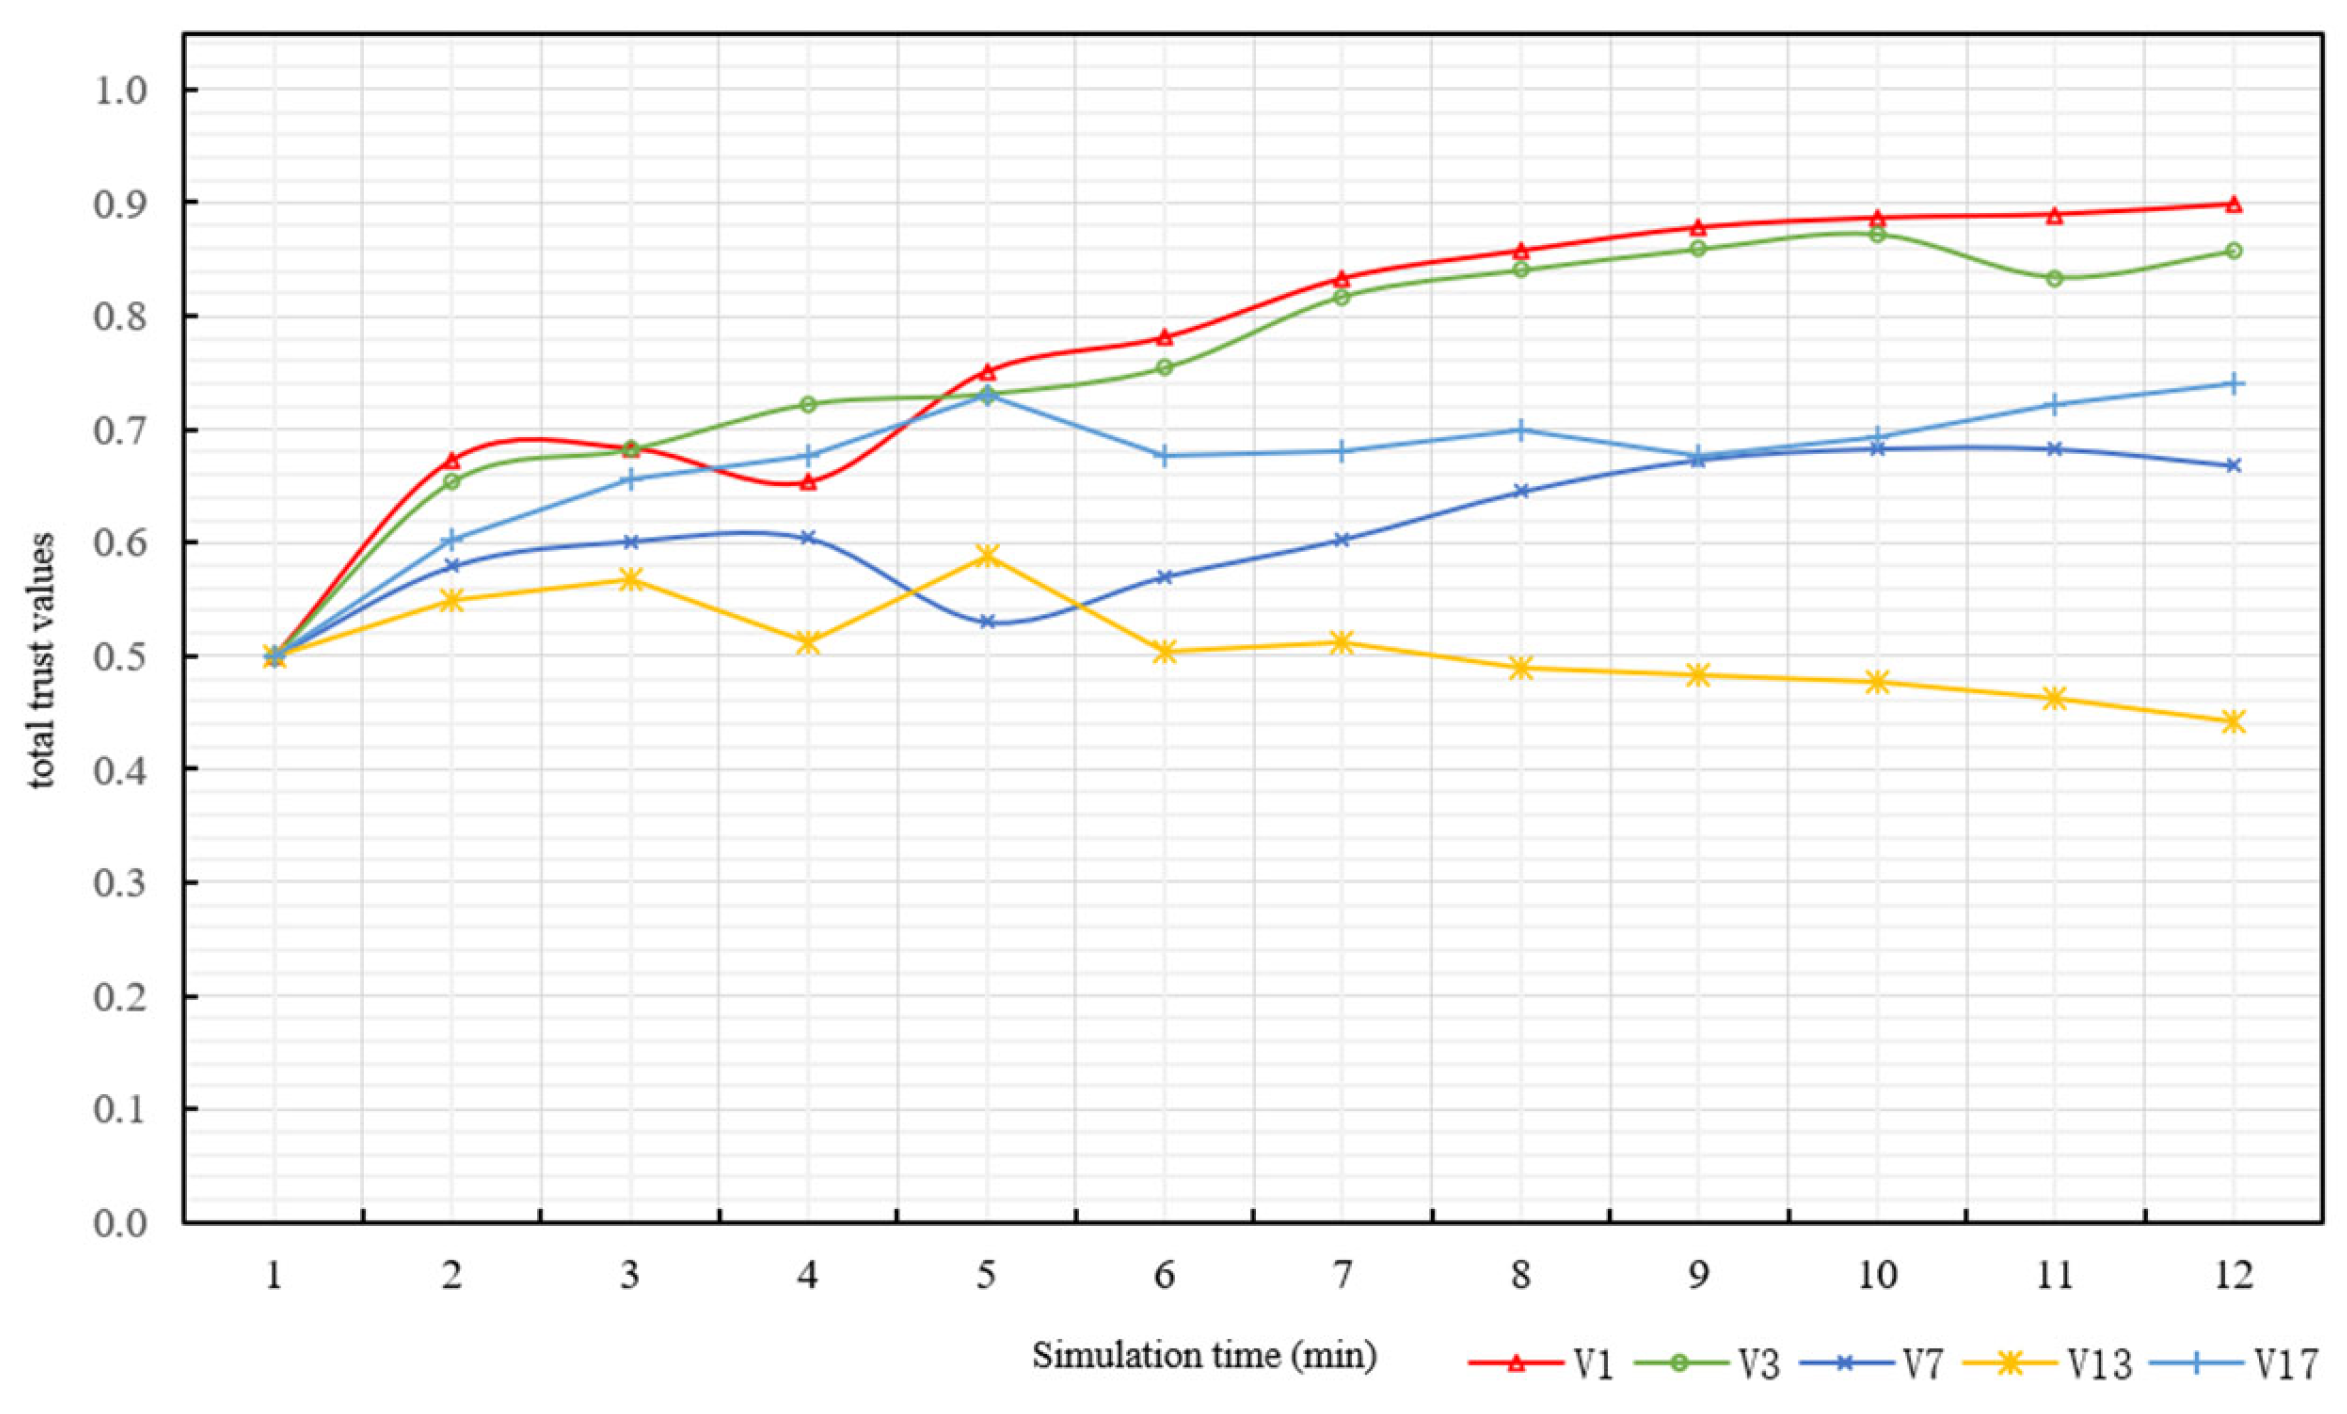
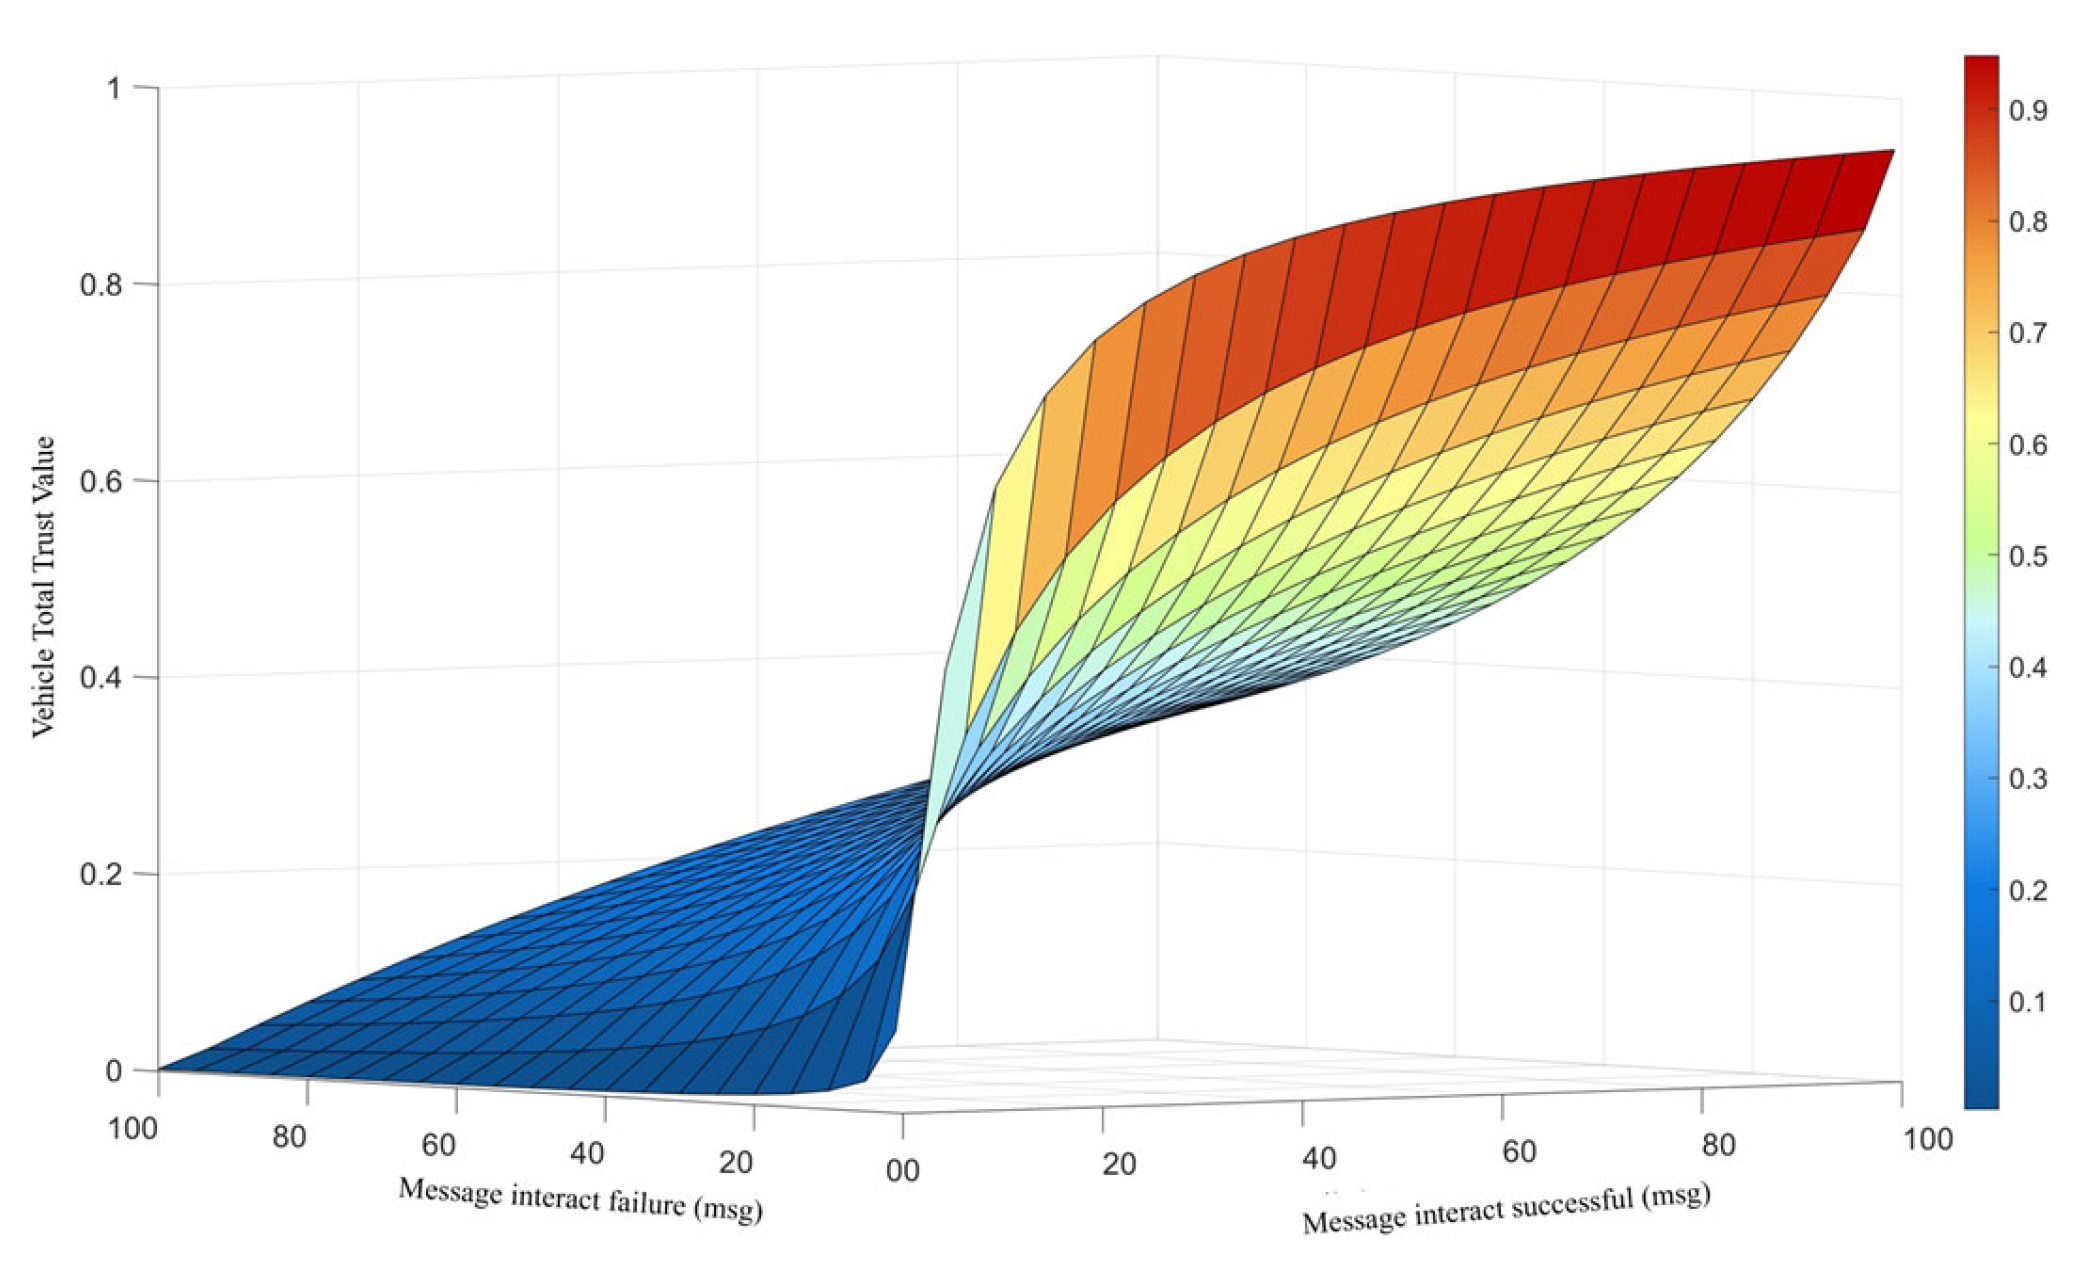
8.1. Experiment 1: Total Trust Value Assessment at the Vehicle Node Layer
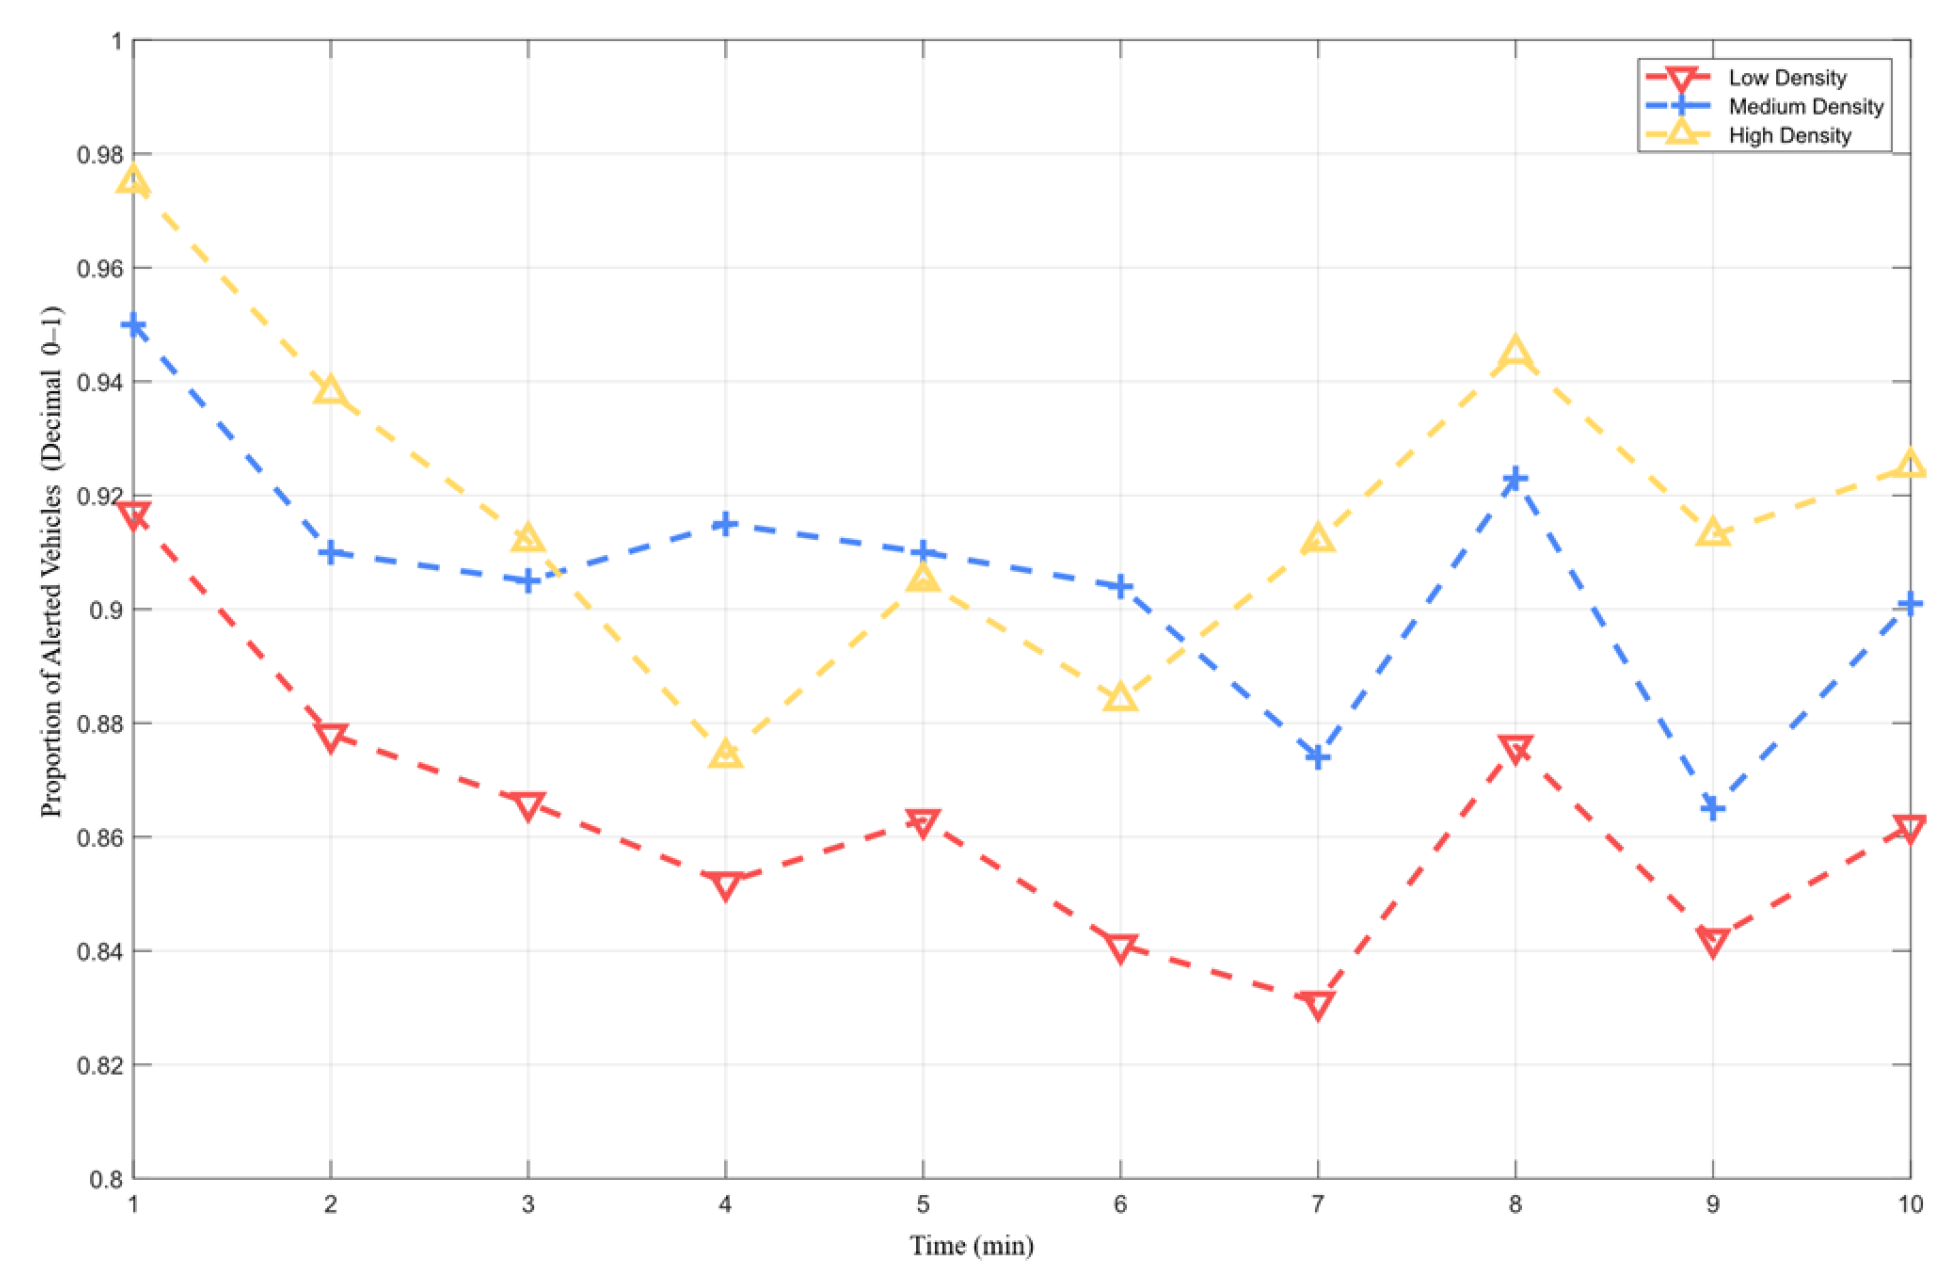
8.2. Experiment 2: Impact of Information Interaction on the Hybrid Trust Model in Different Traffic Densities
- 1)
- Performance Differences of the Mixed Trust Model Under Different Densities
- 2)
- Impact of Information Interaction on Total Trust Value of Vehicles in Different Traffic Densities
8.3. Experiment 3: Calculation of Average Total Trust Value and Vehicle Status Determination Based on Vehicle Cluster Trust Threshold
- 1)
- Vehicle Status Determination Based on Trust Threshold Following the Method
9. Discussion
10. Conclusions
Author Contributions
Funding
Institutional Review Board Statement
Informed Consent Statement
Data Availability Statement
Conflicts of Interest
References
- Ahmad, I.; Noor, R.M.; Ahmedy, I.; Shah, S.A.A.; Yaqoob, I.; Ahmed, E.; Imran, M. VANET–LTE Based Heterogeneous Vehicular Clustering for Driving Assistance and Route Planning Applications. Comput. Netw. 2018, 145, 128–140. [Google Scholar] [CrossRef]
- Hasrouny, H.; Samhat, A.E.; Bassil, C.; Laouiti, A. VANET Security Challenges and Solutions: A Survey. Veh. Commun. 2017, 7, 7–20. [Google Scholar] [CrossRef]
- Raya, M.; Papadimitratos, P.; Hubaux, J.-P. Securing Vehicular Communications. IEEE Wirel. Commun. 2006, 13, 8–15. [Google Scholar] [CrossRef]
- Zhuo, X.; Hao, J.; Liu, D.; Dai, Y. Removal of Misbehaving Insiders in Anonymous VANETs. In Proceedings of the 12th ACM International Conference on Modeling, Analysis and Simulation of Wireless and Mobile Systems, New York, NY, USA, 26–29 October 2009; pp. 106–115. [Google Scholar]
- Rivas, D.A.; Barceló-Ordinas, J.M.; Zapata, M.G.; Morillo-Pozo, J.D. Security on VANETs: Privacy, Misbehaving Nodes, False Information and Secure Data Aggregation. J. Netw. Comput. Appl. 2011, 34, 1942–1955. [Google Scholar] [CrossRef]
- Malhi, A.K.; Batra, S.G. A Framework for Secure Vehicular Communication Systems. Ph.D. Thesis, Bournemouth University, Poole, UK, 2016. [Google Scholar]
- Hbaieb, A.; Ayed, S.; Chaari, L. A Survey of Trust Management in the Internet of Vehicles. Comput. Netw. 2022, 203, 108558. [Google Scholar] [CrossRef]
- Javaid, U.; Aman, M.N.; Sikdar, B. A Scalable Protocol for Driving Trust Management in Internet of Vehicles with Blockchain. IEEE Internet Things J. 2020, 7, 11815–11829. [Google Scholar] [CrossRef]
- Ahmad, F.; Franqueira, V.N.; Adnane, A. TEAM: A Trust Evaluation and Management Framework in Context-Enabled Vehicular Ad-Hoc Networks. IEEE Access 2018, 6, 28643–28660. [Google Scholar] [CrossRef]
- Kanchana Devi, V. A Comprehensive Review on Reputation-Based Trust Management Framework for Cyber Physical Systems. In International Virtual Conference on Industry 4.0; Kannan, R.J., Geetha, S., Sashikumar, S., Diver, C., Eds.; Lecture Notes in Electrical Engineering; Springer: Singapore, 2021; Volume 355, pp. 277–289. ISBN 978-981-16-1243-5. [Google Scholar]
- Luo, W.; Ma, W.; Gao, Q. A Dynamic Trust Management System for Wireless Sensor Networks. Secur. Comm. Netw. 2016, 9, 613–621. [Google Scholar] [CrossRef]
- Grover, J.; Gaur, M.S.; Laxmi, V.; Tiwari, R.K. Detection of Incorrect Position Information Using Speed and Time Span Verification in VANET. In Proceedings of the SIN ’12: Proceedings of the Fifth International Conference on Security of Information and Networks, Jaipur, India, 25–27 October 2012; ACM: New York, NY, USA, 2012; pp. 53–59. [Google Scholar]
- Gyawali, S.; Xu, S.; Qian, Y.; Hu, R.Q. Challenges and Solutions for Cellular Based V2X Communications. IEEE Commun. Surv. Tutor. 2021, 23, 222–255. [Google Scholar] [CrossRef]
- Michiardi, P.; Molva, R. Core: A Collaborative Reputation Mechanism to Enforce Node Cooperation in Mobile Ad Hoc Networks. In Advanced Communications and Multimedia Security; Springer: Berlin/Heidelberg, Germany, 2002; pp. 107–121. [Google Scholar]
- Abirami, K.R.; Sumithra, M.G. Evaluation of Neighbor Credit Value Based AODV Routing Algorithms for Selfish Node Behavior Detection. Clust. Comput. 2019, 22, 13307–13316. [Google Scholar]
- Marias, G.F.; Georgiadis, P.; Flitzanis, D.; Mandalas, K. Cooperation Enforcement Schemes for MANETs: A Survey. Wirel. Commun. Mob. Comput. 2006, 6, 319–332. [Google Scholar] [CrossRef]
- RoselinMary, S.; Maheshwari, M.; Thamaraiselvan, M. Early Detection of DOS Attacks in VANET Using Attacked Packet Detection Algorithm (APDA). In Proceedings of the 2013 International Conference on Information Communication and Embedded Systems (ICICES), Chennai, India, 21–22 February 2013; IEEE: New York, NY, USA, 2013; pp. 237–240. [Google Scholar]
- Verma, K.; Hasbullah, H. Bloom-Filter Based IP-CHOCK Detection Scheme for Denial of Service Attacks in VANET. Secur. Commun. Netw. 2015, 8, 864–878. [Google Scholar] [CrossRef]
- Hamed, H.; Keshavarz-Haddad, A.; Haghighi, S.G. Sybil Attack Detection in Urban VANETs Based on RSU Support. In Proceedings of the Iranian Conference on Electrical Engineering (ICEE), Mashhad, Iran, 8–10 May 2018; IEEE: New York, NY, USA, 2018; pp. 602–606. [Google Scholar]
- Chang, S.; Qi, Y.; Zhu, H.; Zhao, J.; Shen, X. Footprint: Detecting Sybil Attacks in Urban Vehicular Networks. IEEE Trans. Parallel Distrib. Syst. 2011, 23, 1103–1114. [Google Scholar] [CrossRef]
- Leinmüller, T.; Schoch, E.; Kargl, F.; Maihöfer, C. Decentralized Position Verification in Geographic Ad Hoc Routing. Secur. Commun. Netw. 2010, 3, 289–302. [Google Scholar] [CrossRef]
- Van der Heijden, R.W.; Kargl, F.; Abu-Sharkh, O.M. Others Enhanced Position Verification for VANETs Using Subjective Logic. In Proceedings of the 2016 IEEE 84th Vehicular Technology Conference (VTC-Fall), Montréal, QC, Canada, 18–21 September 2016; IEEE: New York, NY, USA, 2016; pp. 1–7. [Google Scholar]
- Wang, B.; Zhang, R.; Chen, C.; Cheng, X.; Yang, L.; Jin, Y. Interference Hypergraph-Based 3D Matching Resource Allocation Protocol for NOMA-V2X Networks. IEEE Access 2019, 7, 90789–90800. [Google Scholar] [CrossRef]
- Yang, W.; Ma, L.; Cui, R.; Wang, G. Hypergraph Partitioning for Big Data Applications. In Proceedings of the 2018 IEEE SmartWorld, Ubiquitous Intelligence & Computing, Advanced & Trusted Computing, Scalable Computing & Communications, Cloud & Big Data Computing, Internet of People and Smart City Innovation (SmartWorld/SCALCOM/UIC/ATC/CBDCom/IOP/SCI), Guangzhou, China, 8–12 October 2018; IEEE: New York, NY, USA, 2018; pp. 1705–1710. [Google Scholar]
- Brin, S.; Page, L. The Anatomy of a Large-Scale Hypertextual Web Search Engine. Comput. Netw. ISDN Syst. 1998, 30, 107–117. [Google Scholar] [CrossRef]
- MacHardy, Z.; Khan, A.; Obana, K.; Iwashina, S. V2X Access Technologies: Regulation, Research, and Remaining Challenges. IEEE Commun. Surv. Tutor. 2018, 20, 1858–1877. [Google Scholar] [CrossRef]
- ETSI EN 302 637-2; ETSI Intelligent Transport Systems (ITS). Vehicular Communications. Basic Set of Applications. Part 2: Specification of Cooperative Awareness Basic Service. v.1.3.2. European Telecommunications Standards Institute: Sophia Antipolis, France, 2014.
- Ganeriwal, S.; Balzano, L.K.; Srivastava, M.B. Reputation-Based Framework for High Integrity Sensor Networks. ACM Trans. Sens. Netw. (TOSN) 2008, 4, 1–37. [Google Scholar] [CrossRef]
- Rawat, D.B.; Yan, G.; Bista, B.B.; Weigle, M.C. Trust On the Security of Wireless Vehicular Ad-Hoc Networking. Ad Hoc Sens. Wirel. Netw. 2015, 24, 283–305. [Google Scholar]
- Roy, D.; Das, P. Trust and Group Leader Based Model to Avoid Broadcast Storm Problem in Vehicular Ad-Hoc Networks. Adv. Comput. Sci. Technol. 2017, 10, 575–597. [Google Scholar]
- Tan, S.; Li, X.; Dong, Q. Trust Based Routing Mechanism for Securing OSLR-Based MANET. Ad Hoc Netw. 2015, 30, 84–98. [Google Scholar] [CrossRef]
- Jadliwala, M.; Zhong, S.; Upadhyaya, S.J.; Qiao, C.; Hubaux, J.-P. Secure Distance-Based Localization in the Presence of Cheating Beacon Nodes. IEEE Trans. Mob. Comput. 2010, 9, 810–823. [Google Scholar] [CrossRef]
- Bullen, P.S. Handbook of Means and Their Inequalities; Springer Science & Business Media: Berlin/Heidelberg, Germany, 2013; Volume 560. [Google Scholar]


| Notations | Description |
|---|---|
| Representing dynamic vehicle clusters using hypergraphs | |
| vertices in the hypergraph | |
| Hyperedges in the hypergraph. | |
| weight for hyperedge | |
| The hyperedge function for nodes | |
| H | The total number of hyperedges in the hypergraph |
| the degree of a hyperedge | |
| the degree of a vertex , indicating the number of edges encompassing the vertex | |
| The set of nodes connected to the vehicle node | |
| The number of directed edges emanating from node | |
| The authority of vehicle nodes | |
| The association between vehicle nodes | |
| The relationship between node and the vehicle cluster V | |
| The association between adjacent vehicle clusters | |
| The direct trust value of a vehicle node | |
| The speed limit of the current road segment | |
| The standard transmission frequency of sensor nodes | |
| The actual transmission frequency of the vehicle node | |
| The number of scans conducted by the sensor node i | |
| The direct trust value assessed based on the transmission frequency | |
| and | The weighting coefficient |
| The fault tolerance coefficient | |
| The threshold of transmission frequency representing the upper limit of scan counts | |
| The RSS strength of | |
| The distance between vehicle nodes | |
| The minimum distance threshold between nodes | |
| The maximum distance threshold between nodes | |
| The direct trust value of vehicle | |
| The weighting coefficient | |
| Trust assessed through various observational indicators. | |
| Constant parameter | |
| The indirect trust value of vehicle | |
| The total trust value | |
| The weights of direct and indirect trust values | |
| The total trust list of neighboring vehicles | |
| The average total trust value of | |
| The frequency of occurrence of the total trust value of vehicle | |
| The total trust value of vehicle computed by vehicle | |
| The global trust value | |
| The average total trust value | |
| The time range for direct trust calculation | |
| Time distance | |
| The direct trust within the sliding time window T | |
| The consistency parameter | |
| The trust threshold of vehicle at the vehicle layer | |
| The trust threshold of vehicle at the cluster head layer | |
| The periodic check parameter |
| Parameter | Value |
|---|---|
| Simulation Area | 20 km2 |
| Vehicle Speed | [0, 60] |
| Communication Range | 300 m |
| Transmission Rate | 3 Mbps |
| Cluster Head Driving Mode | Constant speed mode |
| Vehicle Driving Mode | Krauss vehicle following model |
| Speed Standard Deviation | |
| Number of Vehicle Nodes | 100, 200, 300, 400, 500 |
| Vehicle Density | 0.05, 0.10, 0.15, 0.20, 0.25 |
| Bandwidth | 10 MHz |
| Communication Protocol | IEEE 802.11p |
| Modulation | Quadrature Phase Shift Keying (QPSK) |
| Signal-to-Noise Ratio (SNR) | 20 dB |
| Data Rate | 3 Mbps |
| Vehicle Communication Range | 100 m |
| Signal Attenuation Model | Nakagami model |
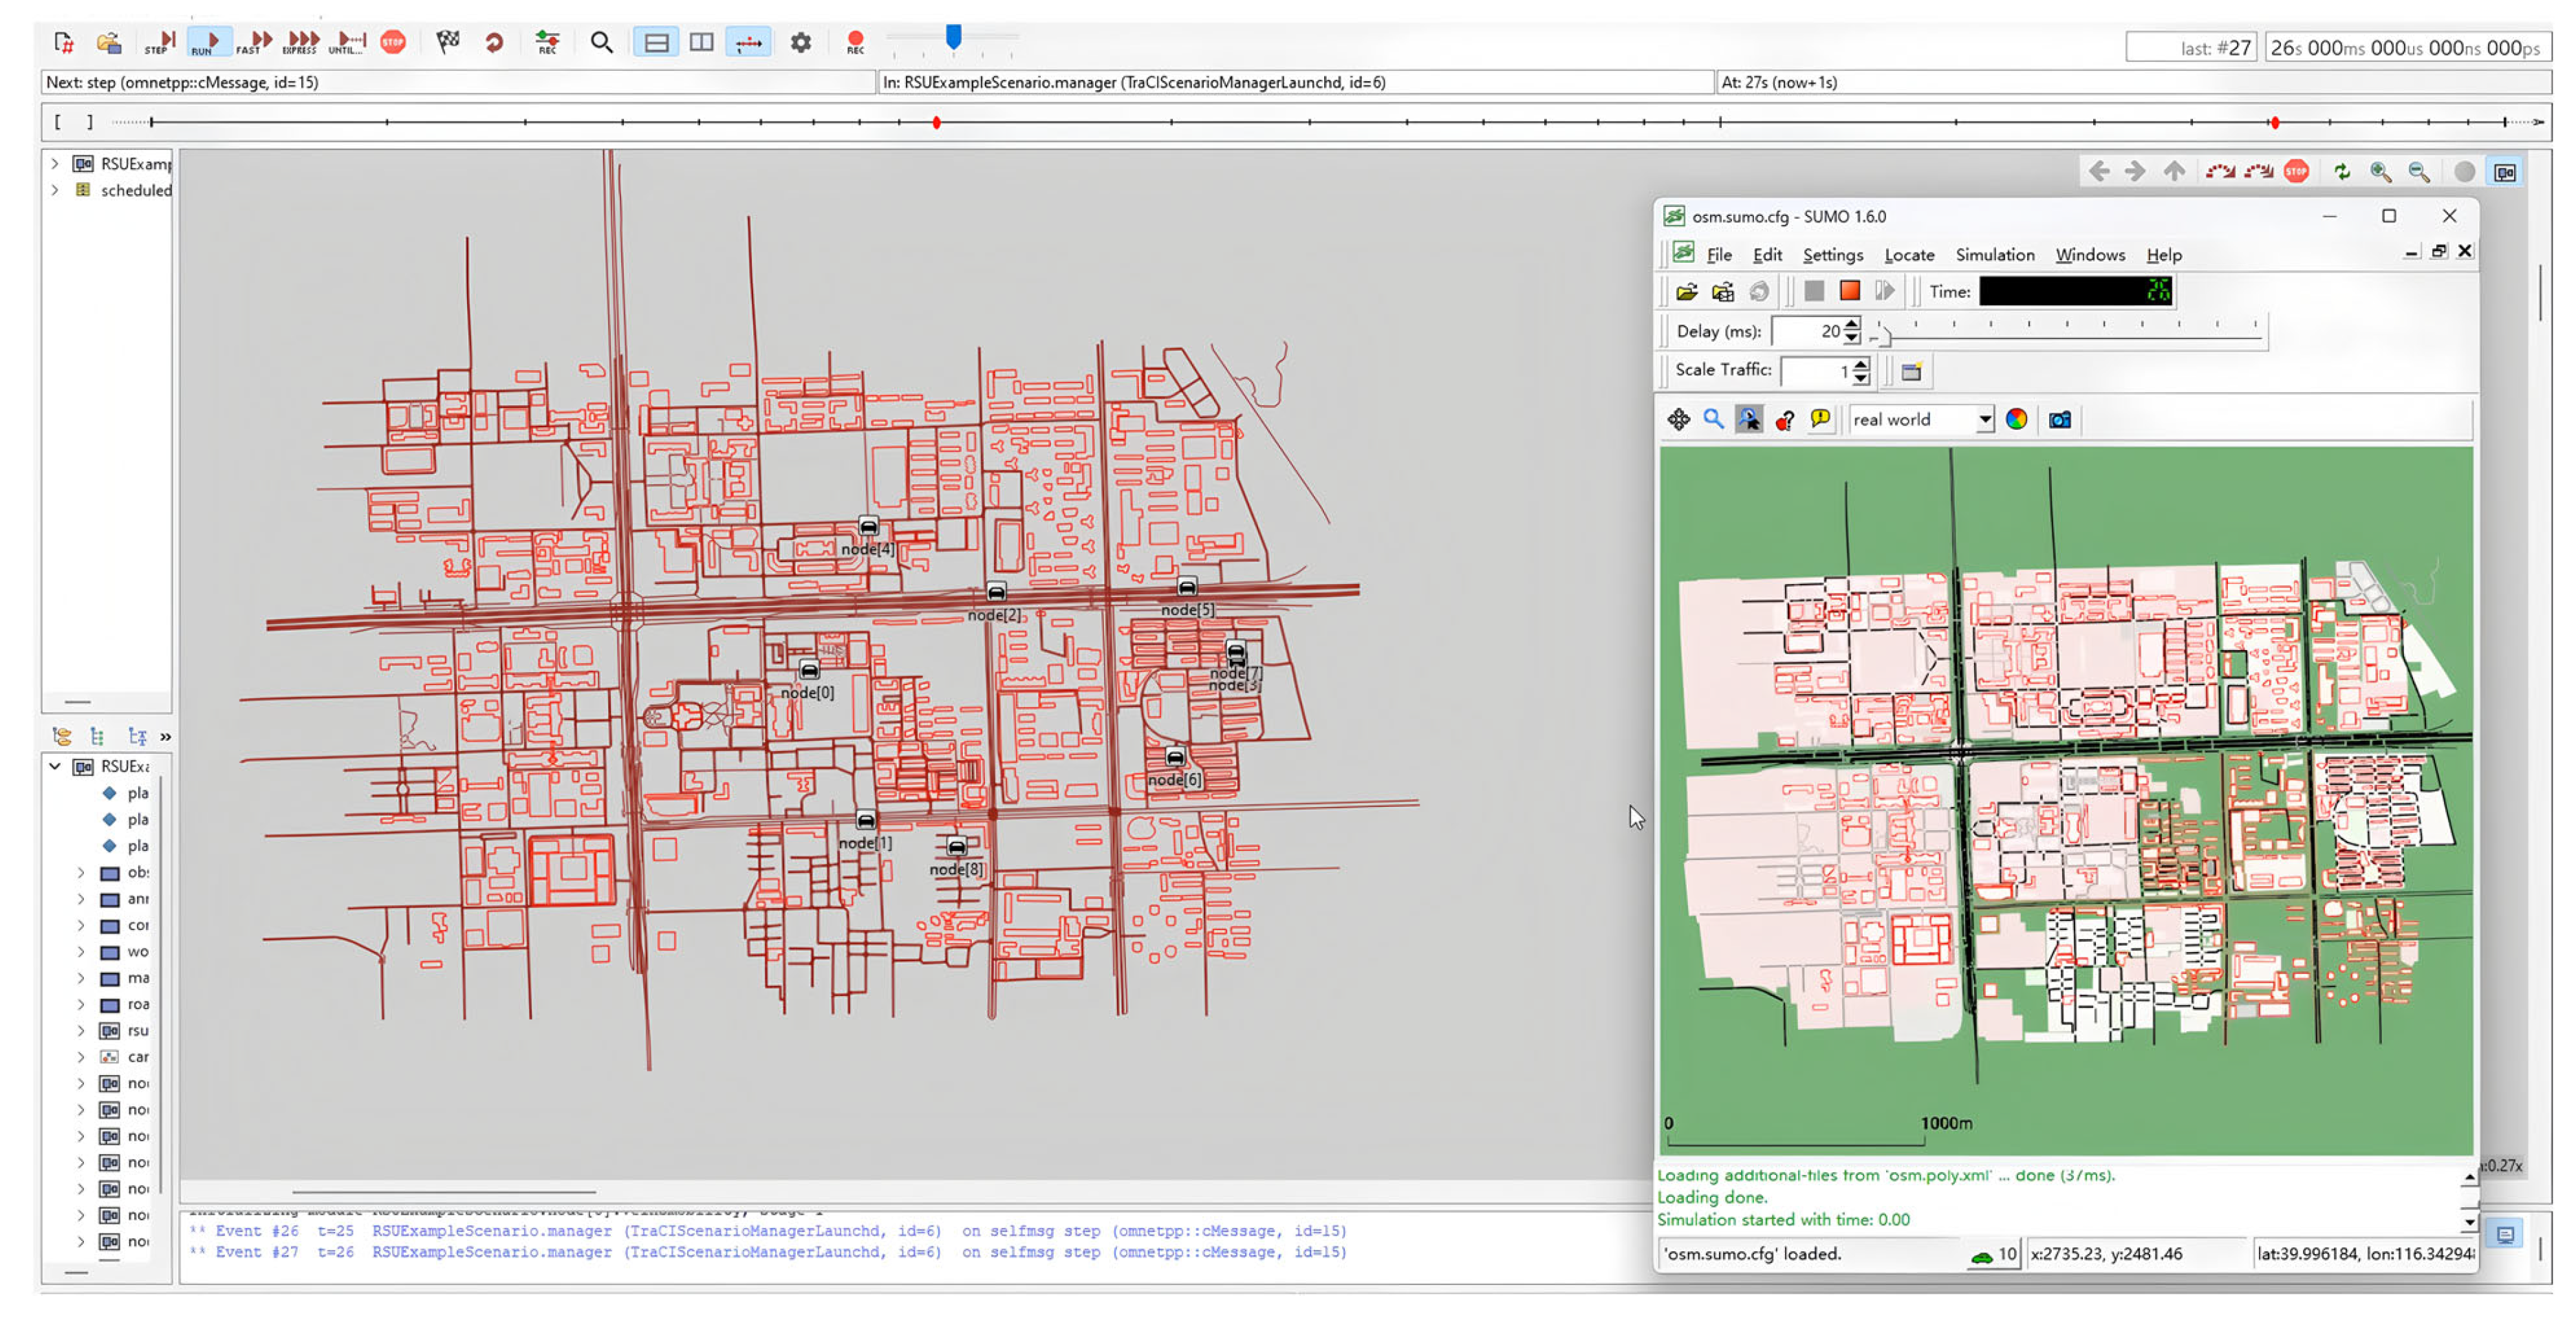
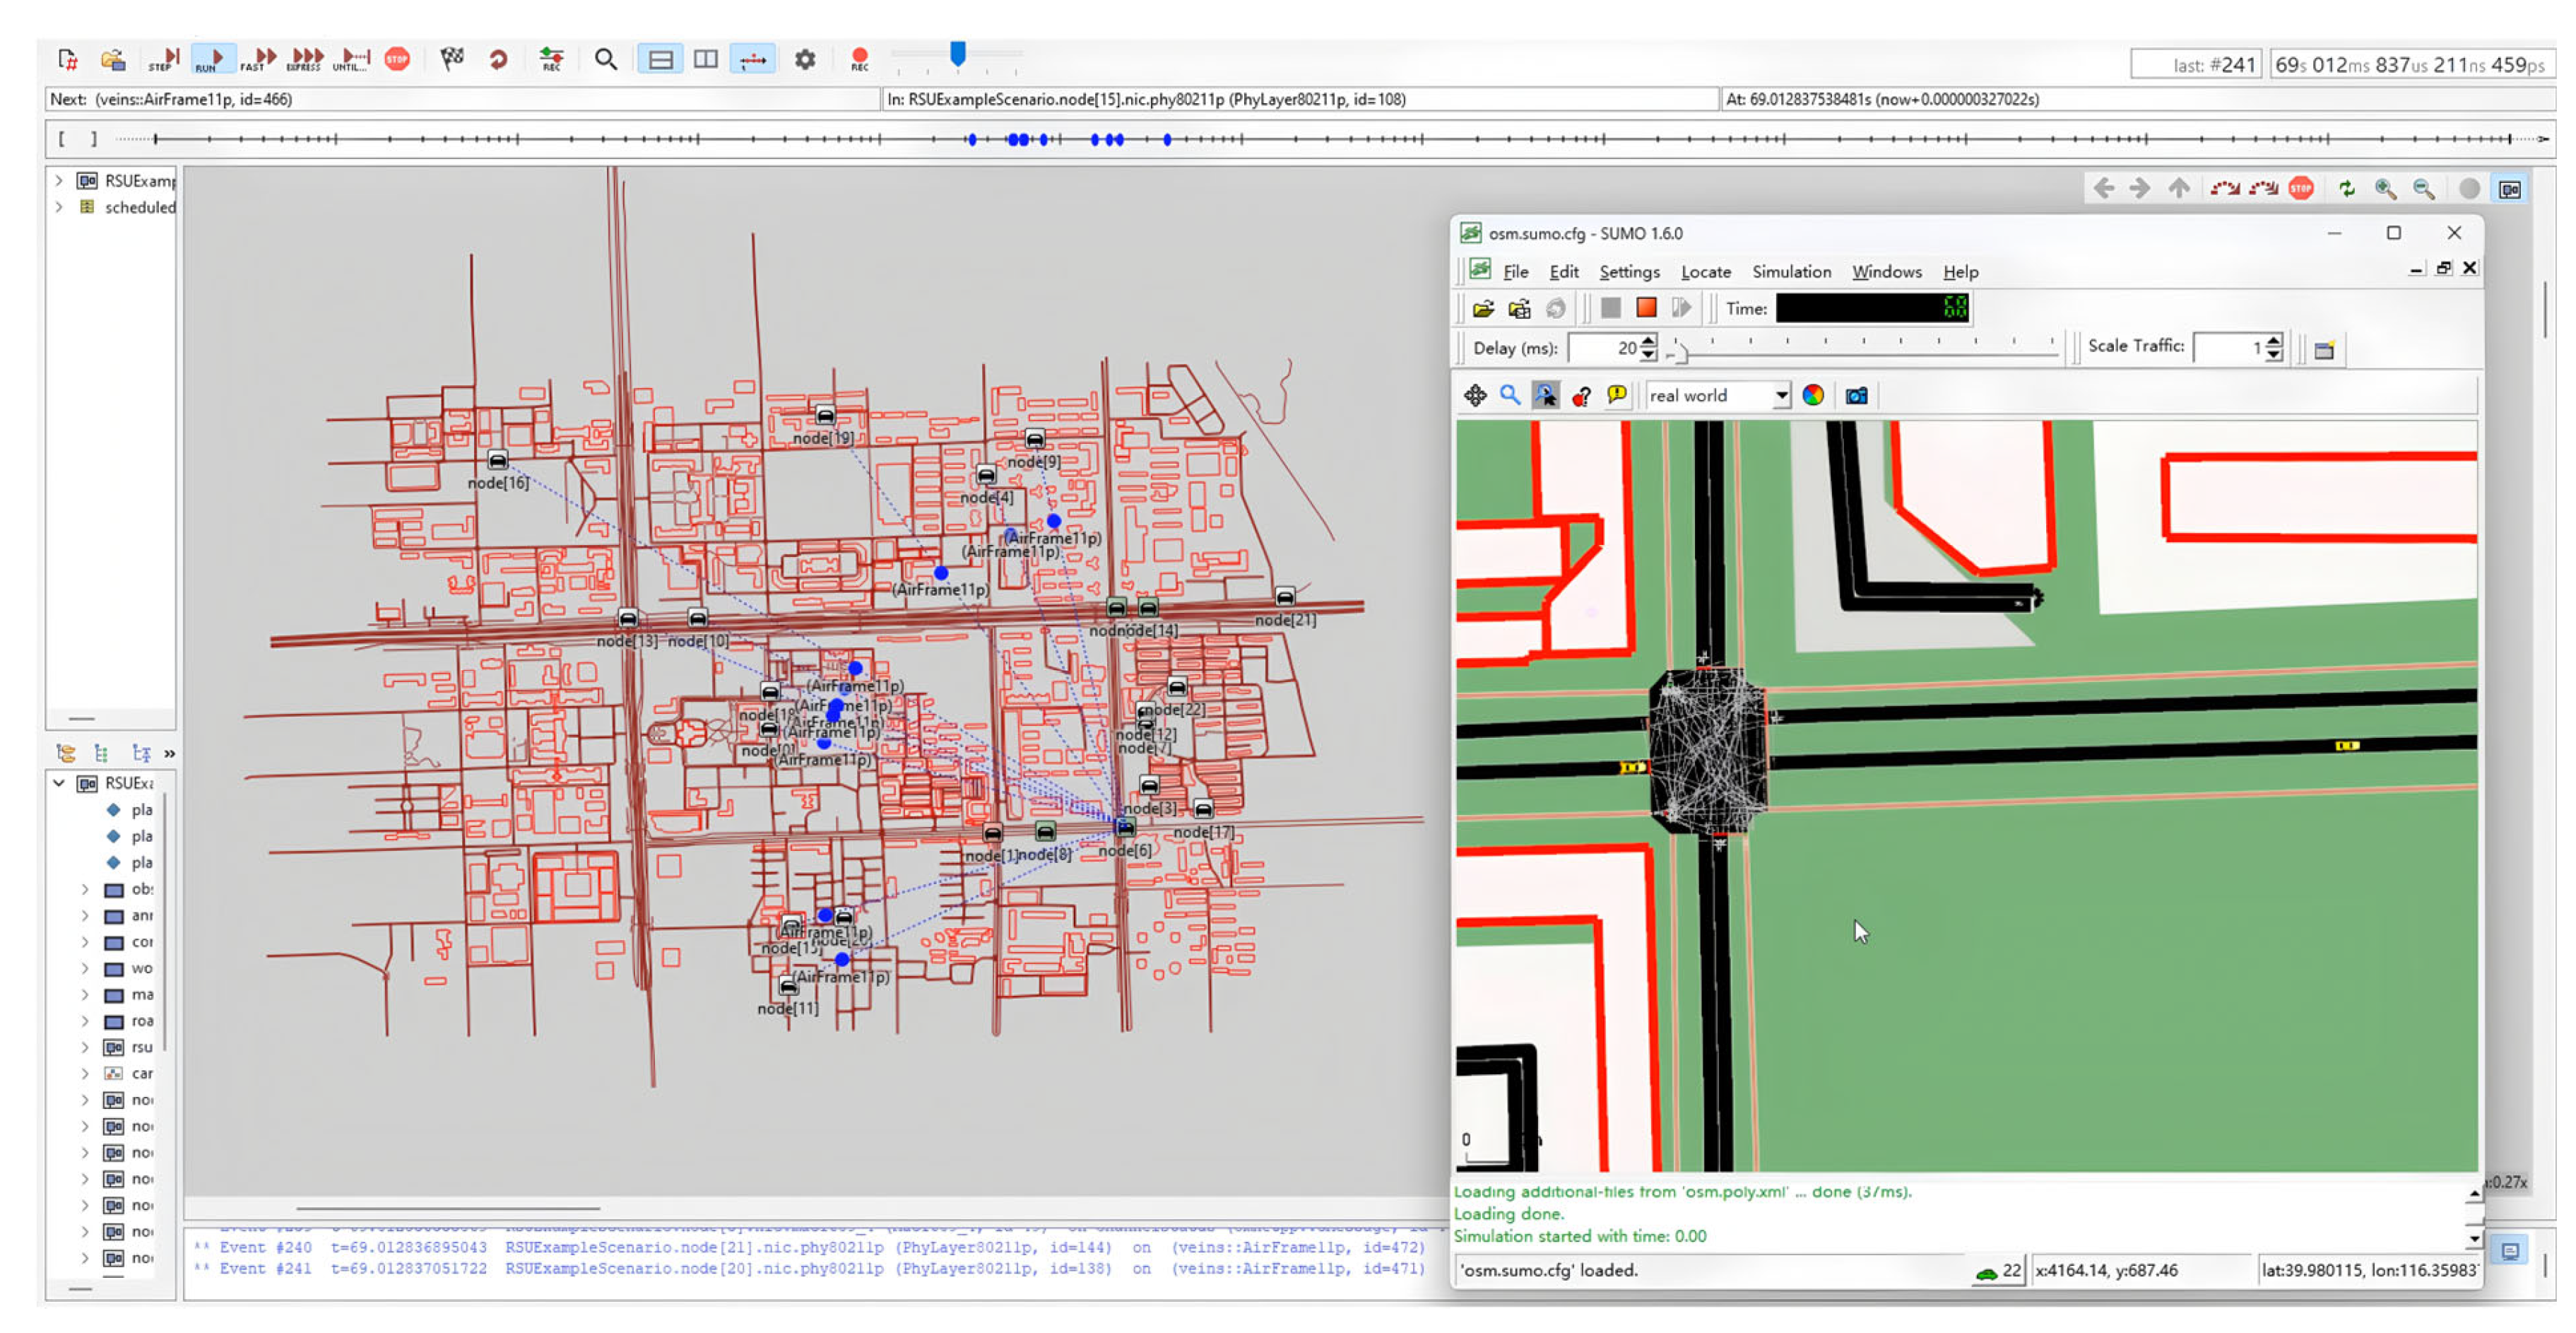
| Simulation Map | OSM |
| Vehicle ID | Time | Average Total Trust Value | Average Weight of Node Relationship | Vehicle Status |
|---|---|---|---|---|
| 1 | 7 | 0.718 | 0.977 | Trusted |
| 3 | 7 | 0.788 | 0.948 | Trusted |
| 7 | 7 | 0.553 | 0.957 | Neutral |
| 13 | 7 | 0.371 | 0.771 | Misbehavior |
| 17 | 7 | 0.509 | 0.955 | Neutral |
Disclaimer/Publisher’s Note: The statements, opinions and data contained in all publications are solely those of the individual author(s) and contributor(s) and not of MDPI and/or the editor(s). MDPI and/or the editor(s) disclaim responsibility for any injury to people or property resulting from any ideas, methods, instructions or products referred to in the content. |
© 2025 by the authors. Licensee MDPI, Basel, Switzerland. This article is an open access article distributed under the terms and conditions of the Creative Commons Attribution (CC BY) license (https://creativecommons.org/licenses/by/4.0/).
Share and Cite
Xu, X.; Zhu, W.; Fu, X.; Yang, G.; Jin, L.; Yu, W.; You, L. Hybrid Trust Model for Node-Centric Misbehavior Detection in Dynamic Behavior-Homogeneous Clusters. Appl. Sci. 2025, 15, 2020. https://doi.org/10.3390/app15042020
Xu X, Zhu W, Fu X, Yang G, Jin L, Yu W, You L. Hybrid Trust Model for Node-Centric Misbehavior Detection in Dynamic Behavior-Homogeneous Clusters. Applied Sciences. 2025; 15(4):2020. https://doi.org/10.3390/app15042020
Chicago/Turabian StyleXu, Xiaoya, Weijie Zhu, Xiufeng Fu, Guang Yang, Longlong Jin, Wanting Yu, and Lingfei You. 2025. "Hybrid Trust Model for Node-Centric Misbehavior Detection in Dynamic Behavior-Homogeneous Clusters" Applied Sciences 15, no. 4: 2020. https://doi.org/10.3390/app15042020
APA StyleXu, X., Zhu, W., Fu, X., Yang, G., Jin, L., Yu, W., & You, L. (2025). Hybrid Trust Model for Node-Centric Misbehavior Detection in Dynamic Behavior-Homogeneous Clusters. Applied Sciences, 15(4), 2020. https://doi.org/10.3390/app15042020