Abstract
In elite basketball, closely contested games are often decided in the last minute, where a single possession can significantly alter the outcome. The objective of this study was to analyze the offensive patterns and effectiveness of successful play sequences executed during the last minute and overtime periods of the 2022–2023 EuroLeague men’s basketball season. Specifically, we examined how offensive strategies varied based on score conditions and team status (winning, losing, or tied) in games with a score difference of three points or fewer, representing a maximum one-possession margin. The sample consisted of 709 technical–tactical actions performed in one-possession games during the last minute and overtime periods of the men’s EuroLeague 2022–2023 season. An observational methodology was employed using the LINCE PLUS software with a purpose-designed observational instrument. Descriptive analyses and chi-square (χ2) tests were conducted using SPSS 25, and T-Pattern analysis was performed with Theme 6 software. Statistical significance was set at p < 0.05. The results showed that teams leading at the start of the possession executed a higher number of successful actions, primarily through free throws drawn from fouls committed by the opposing team. Additionally, plays involving few or no passes, executed within the first 17 s of possession, and completed by point guards or centers, were associated with higher success rates. While less frequent, fast breaks proved to be more effective than set offenses. Furthermore, the study highlights the role of elite playmakers in late-game situations, as their ability to read defenses and create scoring opportunities plays a crucial role in determining offensive success. The practical implications of this study can assist coaches in optimizing offensive strategies during high-pressure moments in elite men’s basketball by refining late-game decision-making and tactical planning.
1. Introduction
In competitions like the NBA, closely contested games are often decided in the final minute [1]. When the score difference is minimal (1–3 points), a single possession can significantly alter the outcome, commonly referred to as a “one-possession game” [2]. This scenario places immense strategic importance on offensive decision-making, as the gameplay dynamics shift significantly in the final minute of the match, giving rise to new strategic patterns [3]. End-of-game possessions often play a crucial role in determining the final outcome [4], and a coach’s decision on tactics may be critical to a team’s win or loss [5]. The ability to execute precise offensive actions while under pressure is often a distinguishing factor between championship-winning teams and those that fall short [6].
Extensive research has analyzed game-related statistics [7,8,9,10,11,12,13,14,15,16,17] and general offensive strategies in basketball [18,19,20]. Despite extensive research on game-related statistics, these analyses fail to explain the development of plays, as they do not capture patterns such as pre-shot combinations or specific aspects of pick-and-roll dynamics that provide a deeper understanding of team strategies [21]. To address this limitation, methodologies like observational analysis allow for the dynamic study of performance factors during matches [22].
However, fewer studies have specifically examined offensive patterns in critical moments [3,4,5,23,24,25,26,27,28]. A critical moment can be defined as possessions occurring within the final five minutes of regulation or overtime [29] with a score differential of 10 points or fewer [2]. In the last five minutes of close games and overtime, players may be more vulnerable to distractions, leading to poorer decision-making, which can result in turnovers or poor shot selection [24]. These scenarios frequently demand a departure from conventional play execution, requiring teams to focus on new dynamics of the game [3]. Transition plays, inbound plays, and structured offensive sets may yield different success rates compared to regular game situations, yet these aspects remain underexplored in the context of elite European basketball. Understanding how teams perform under these conditions is crucial for optimizing game strategies and developing evidence-based coaching interventions.
The EuroLeague presents a unique setting to study these one-possession scenarios due to how it has become the most prestigious basketball competition in Europe, boasting the fifth-highest attendance among all indoor professional sports leagues and the second-highest attendance among professional basketball leagues globally, surpassed only by the NBA [30]. Unlike the NBA, European teams tend to execute more structured plays, with a greater emphasis on post-up actions and pick-and-roll scenarios, whereas the NBA features more transitions, early offense, isolation plays, and a higher total scoring output during these phases [31]. This divergence highlights a clear difference in the pace of play [16]. In European teams, an open shot is typically preceded by collective effort characterized by cooperation and communication, whereas American basketball emphasizes improvisation by highly skilled players [18]. Despite the differences in playing systems and offensive/defensive strategies, the EuroLeague is progressively resembling the NBA both quantitatively and qualitatively, with notable differences only in the areas of shot-blocking and rebounding structure [16]. This trend is also reflected at the individual level, as no significant differences have been observed in statistics indirectly related to perception, such as assists, turnovers, or steals, between European players competing in the EuroLeague and their NBA counterparts [13].
These fundamental differences could affect late-game strategies; however, it remains unclear how EuroLeague teams adapt their offensive strategies in these scenarios where a single possession can determine the outcome. Prior research has shown that shorter possessions (under 6 s) were more effective than longer ones, and cooperative playstyles improved possession efficiency in the final moments of the game [4].
Considering these precedents, this study aims to analyze the effectiveness and successful offensive play patterns executed during the last minute and overtime periods of the 2022–2023 EuroLeague men’s basketball season, specifically in scenarios where the score difference was three points or fewer, representing a maximum one-possession margin. To our knowledge, this is the first study to apply T-Pattern analysis to identify offensive strategies in late-game EuroLeague situations, offering novel insights into decision-making and tactical execution in elite basketball.
We hypothesize that (1) teams leading on the scoreboard at the start of a possession will have a higher success rate in scoring, (2) home teams will demonstrate greater shooting effectiveness compared to visiting teams, and (3) fast break plays, although less frequent, will be more effective than set offenses.
2. Methods
This section describes the methodological approach used to analyze offensive patterns in one-possession scenarios during the last minute and overtime periods of EuroLeague games. It includes details on the study design, the sample selection, the instruments used, the procedure, and the data analysis.
2.1. Design
An observational methodology [32] was employed to evaluate the efficiency and key patterns of plays during pivotal moments in the 2022/23 men’s EuroLeague season. This method is particularly well-suited for the analysis of various sports, as it facilitates the study of activities within their natural context and inherent dynamics [22,33]. Its applicability in basketball has been validated through multiple research studies [27].
The observational design [34] was characterized as nomothetic, examining offensive actions across all participating teams; longitudinal, as it encompassed 117 games from the 2022/23 men’s EuroLeague season; and unidimensional, with each observation item corresponding to a singular response category. The research was conducted through a structured non-participant observation approach, where pre-recorded game footage was analyzed by trained analysts without any direct involvement in the matches.
2.2. Sample
The sample for this research comprised offensive technical–tactical actions executed during the final minute of regulation time and overtime periods in the Regular Season, Playoffs, and Final Four of the 2022/23 men’s EuroLeague. These actions were included only when the point difference in the closing moments was three points or fewer (n = 709). For this study, the critical moments were defined as the final 60 s of regulation time and any overtime periods, ensuring that all analyzed sequences were within a one-possession game context. The study was approved by the Ethics Committee of the Faculty of Education and Sport Science (University of Vigo, Application 06-280722).
2.3. Instruments
To ensure accuracy, a predefined observational instrument was used to capture key offensive strategies. This process followed rigorous methodological standards, allowing for a consistent and reliable classification of observed actions.
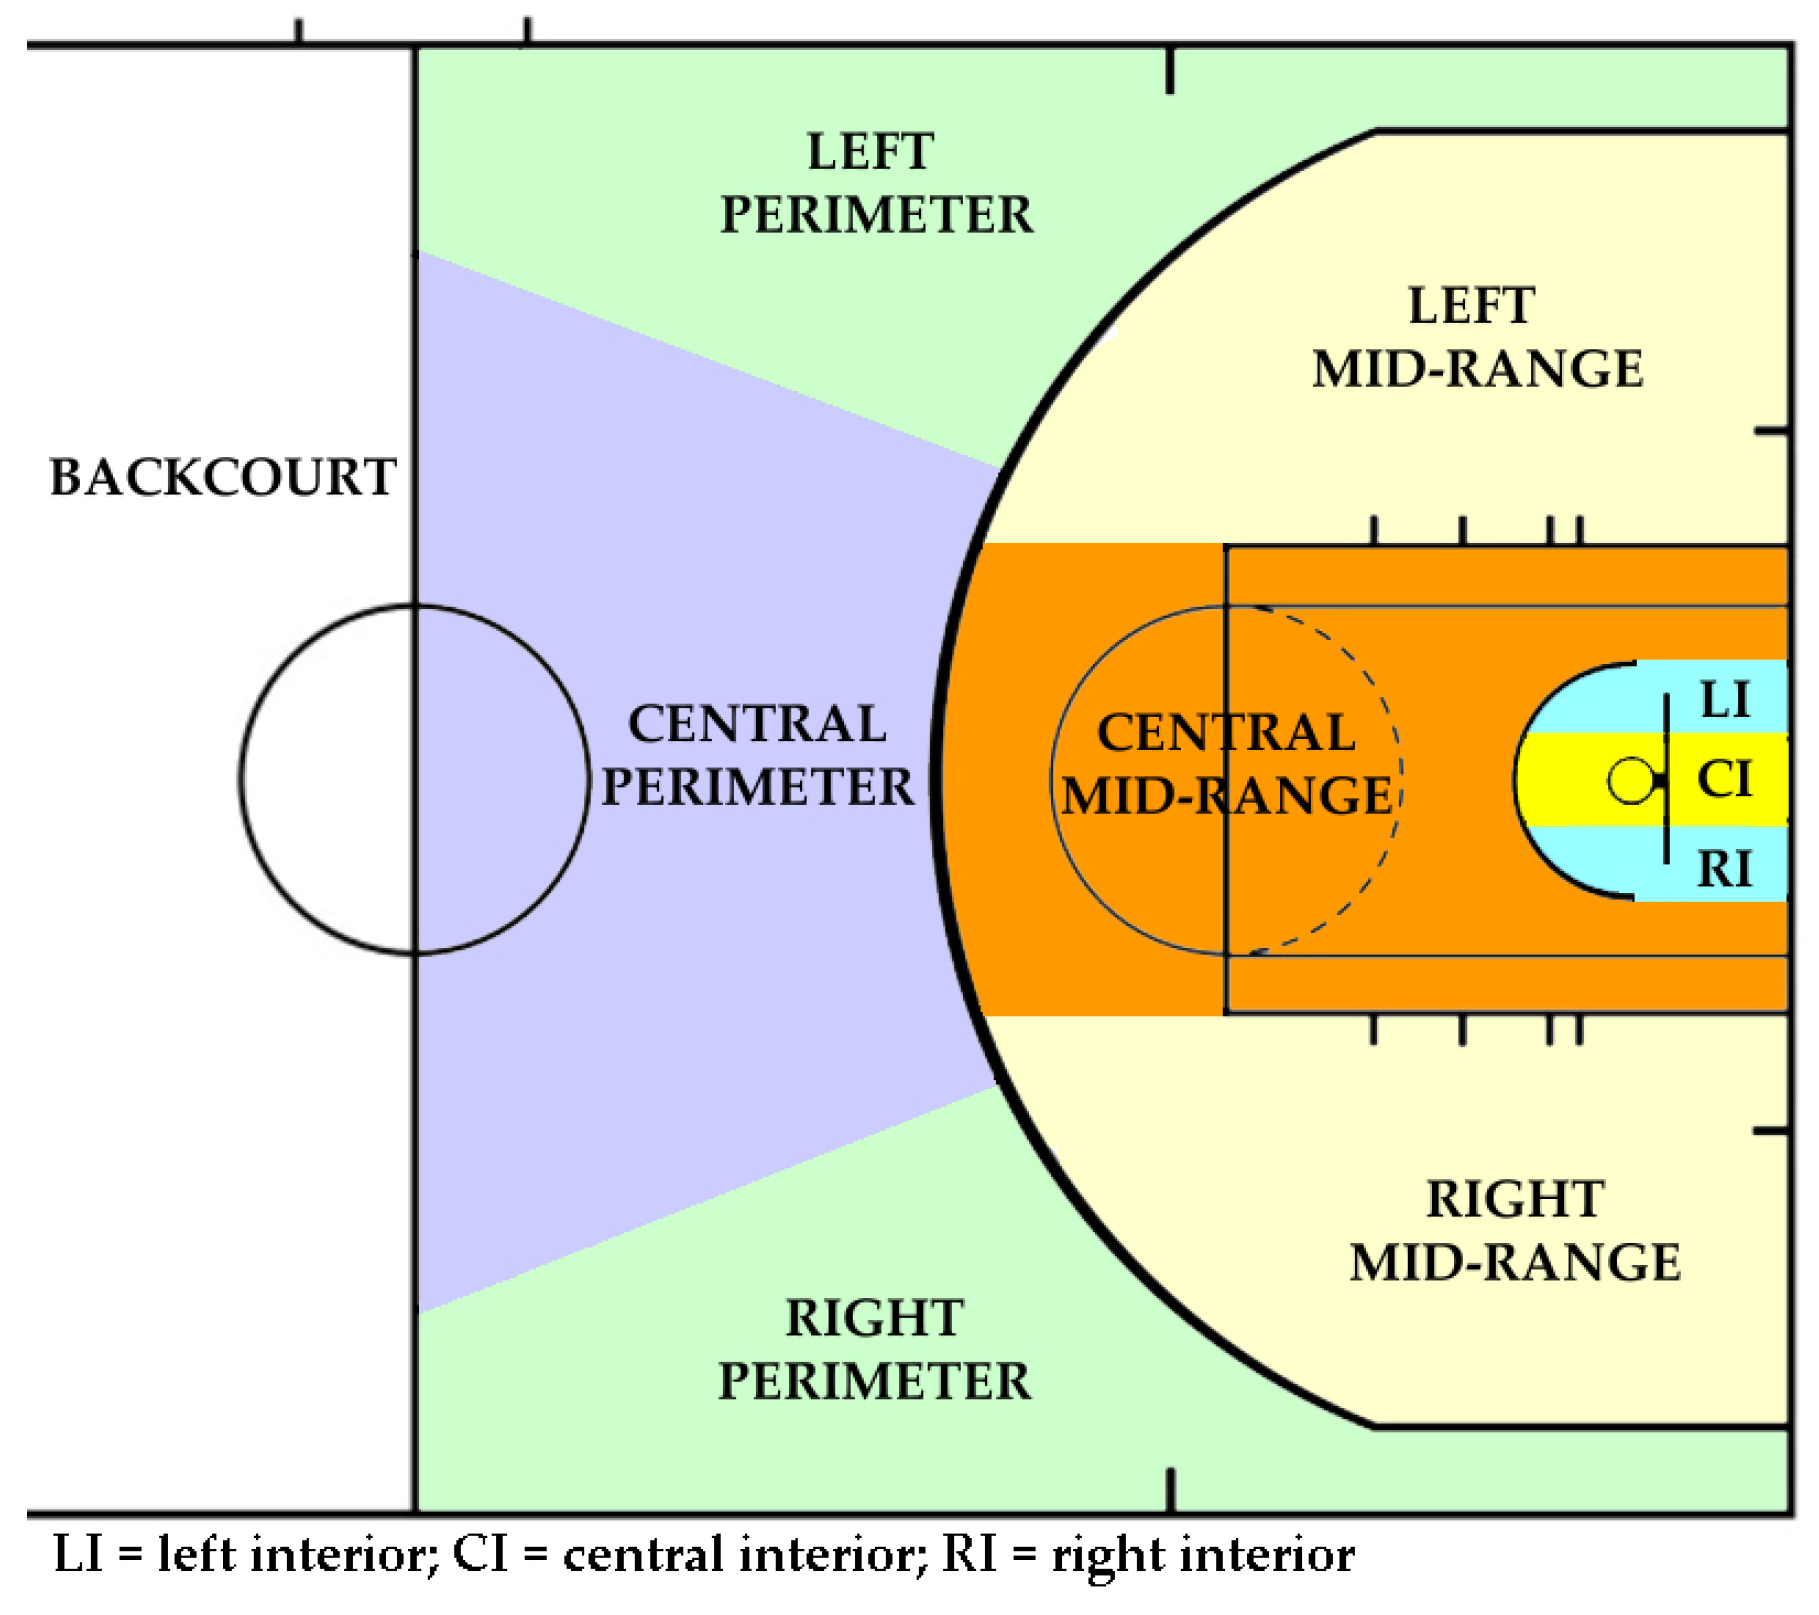
The observational tool developed for this research was specifically tailored to meet the study’s requirements, comprising fifteen criteria and seventy-four categories (Table 1 and Figure 1). This system was designed to adhere to the principles of exhaustiveness and mutual exclusivity. The criteria were established based on insights drawn from various scientific studies [5,35,36]. Data collection was conducted using the LINCE PLUS software (Alberto Soto Fernández, INEFC, Lleida, Spain), version 2.1 [37].

Table 1.
Observational instrument.
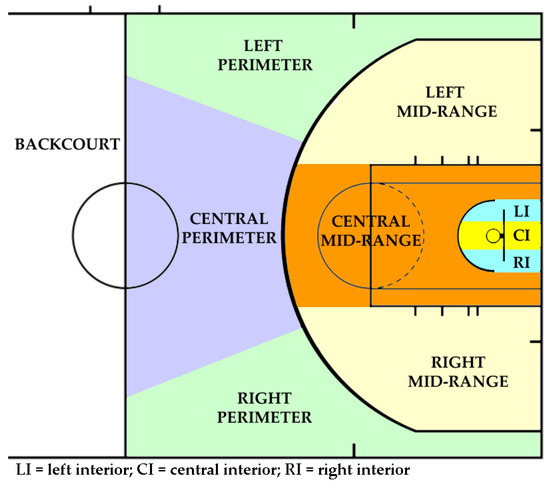
Figure 1.
Ending court zone.
2.4. Procedure
The videos utilized in this study were recorded and retrieved from the official image rights distributor of the EuroLeague for the 2022/23 season in Spain (DAZN) (accessed on 22 January 2024).
After obtaining the required footage, the final minute of the fourth quarter and any overtime periods from each match were extracted. These segments were then compiled into a single file, arranged chronologically by match date. The editing and compilation of this file were completed using Filmora software (Wondershare, Shenzhen, China), version 10.1.20.15.
Following specialized training in the use of the instruments, expert observers identified and catalogued the technical–tactical offensive actions. To verify the reliability of the data collection process [38], the quality of the recorded data was evaluated by calculating Cohen’s Kappa coefficient [39] through the LINCE software. For this purpose, a subset of plays was selected from the total sample (n = 100; approximately 1/7 of the dataset).
The analysis of intra-observer reliability yielded Kappa values of 0.92 and 0.93 for observers 1 and 2, respectively. Additionally, inter-observer reliability analysis produced a Kappa value of 0.90. Any discrepancies between observers were resolved through consensus to improve consistency and precision in the observations. Once this process was finalized, the complete dataset was recorded through a consensus analysis conducted by both observers. Although this additional step was not strictly necessary (either observer could have performed the task independently), it was implemented to further refine the observation process.
Finally, all recorded actions were consolidated into an Excel file, chosen for its adaptability in facilitating the various transformations and analyses required in subsequent phases of the research.
2.5. Data Analysis
All statistical analyses were performed using IBM’s Statistical Package for the Social Sciences (SPSS), version 25.0 (IBM-SPSS Inc., Chicago, IL, USA). Descriptive statistics were calculated for each variable, with results expressed as frequencies and percentages. The χ2 goodness-of-fit test was utilized to assess differences within the categories of each criterion. Furthermore, the χ2 test of independence was applied to explore relationships between all criteria and the variables “basket” and “team result”. A significance threshold of p < 0.05 was established for all analyses.
To identify the most relevant offensive patterns, a T-Pattern analysis was conducted using Theme software (PatternVision Ltd., Reykjavik, Iceland), version 5.0 [40], with the significance level set at 0.005. This method enabled the detection of successful offensive patterns based on factors such as game location, team result, and possession. Theme software is particularly effective in uncovering latent structures and behavioral patterns that are not directly observable in basketball [41].
The results obtained from SPSS and Theme software were then structured into tables to enhance clarity and facilitate interpretation. While the software provided the raw statistical outputs, the selection and organization of the data presented in the tables were refined manually to ensure relevance to the study’s objectives.
3. Results
3.1. General Descriptive Analysis
Table 2 provides a descriptive overview of all the variables analyzed, accompanied by the results of the χ2 test applied to evaluate differences across the categories of each criterion (χ2 goodness-of-fit test). The analysis revealed significant differences in the following criteria: team result, quarter, score difference, start location, type of offense, type of defense, number of passes used, screens, possession, type of finish, finish outcome, ending court zone and ending player.

Table 2.
Descriptive analysis of the research.
We also carried out a χ2 test of independence to explore the relationships between the study’s criteria and those identified by the researchers as most significant (basket and team result). When basket was used as the reference criterion, significant associations were found with team result, score difference, screens, possession, type of offense, type of finish, finish outcome, and ending court zone. On the other hand, when team result was selected as the reference, notable differences emerged in relation to start location, score difference, quarter, number of passes, possession, screens, type of offense, type of finish, finish outcome, ending court zone, and basket.
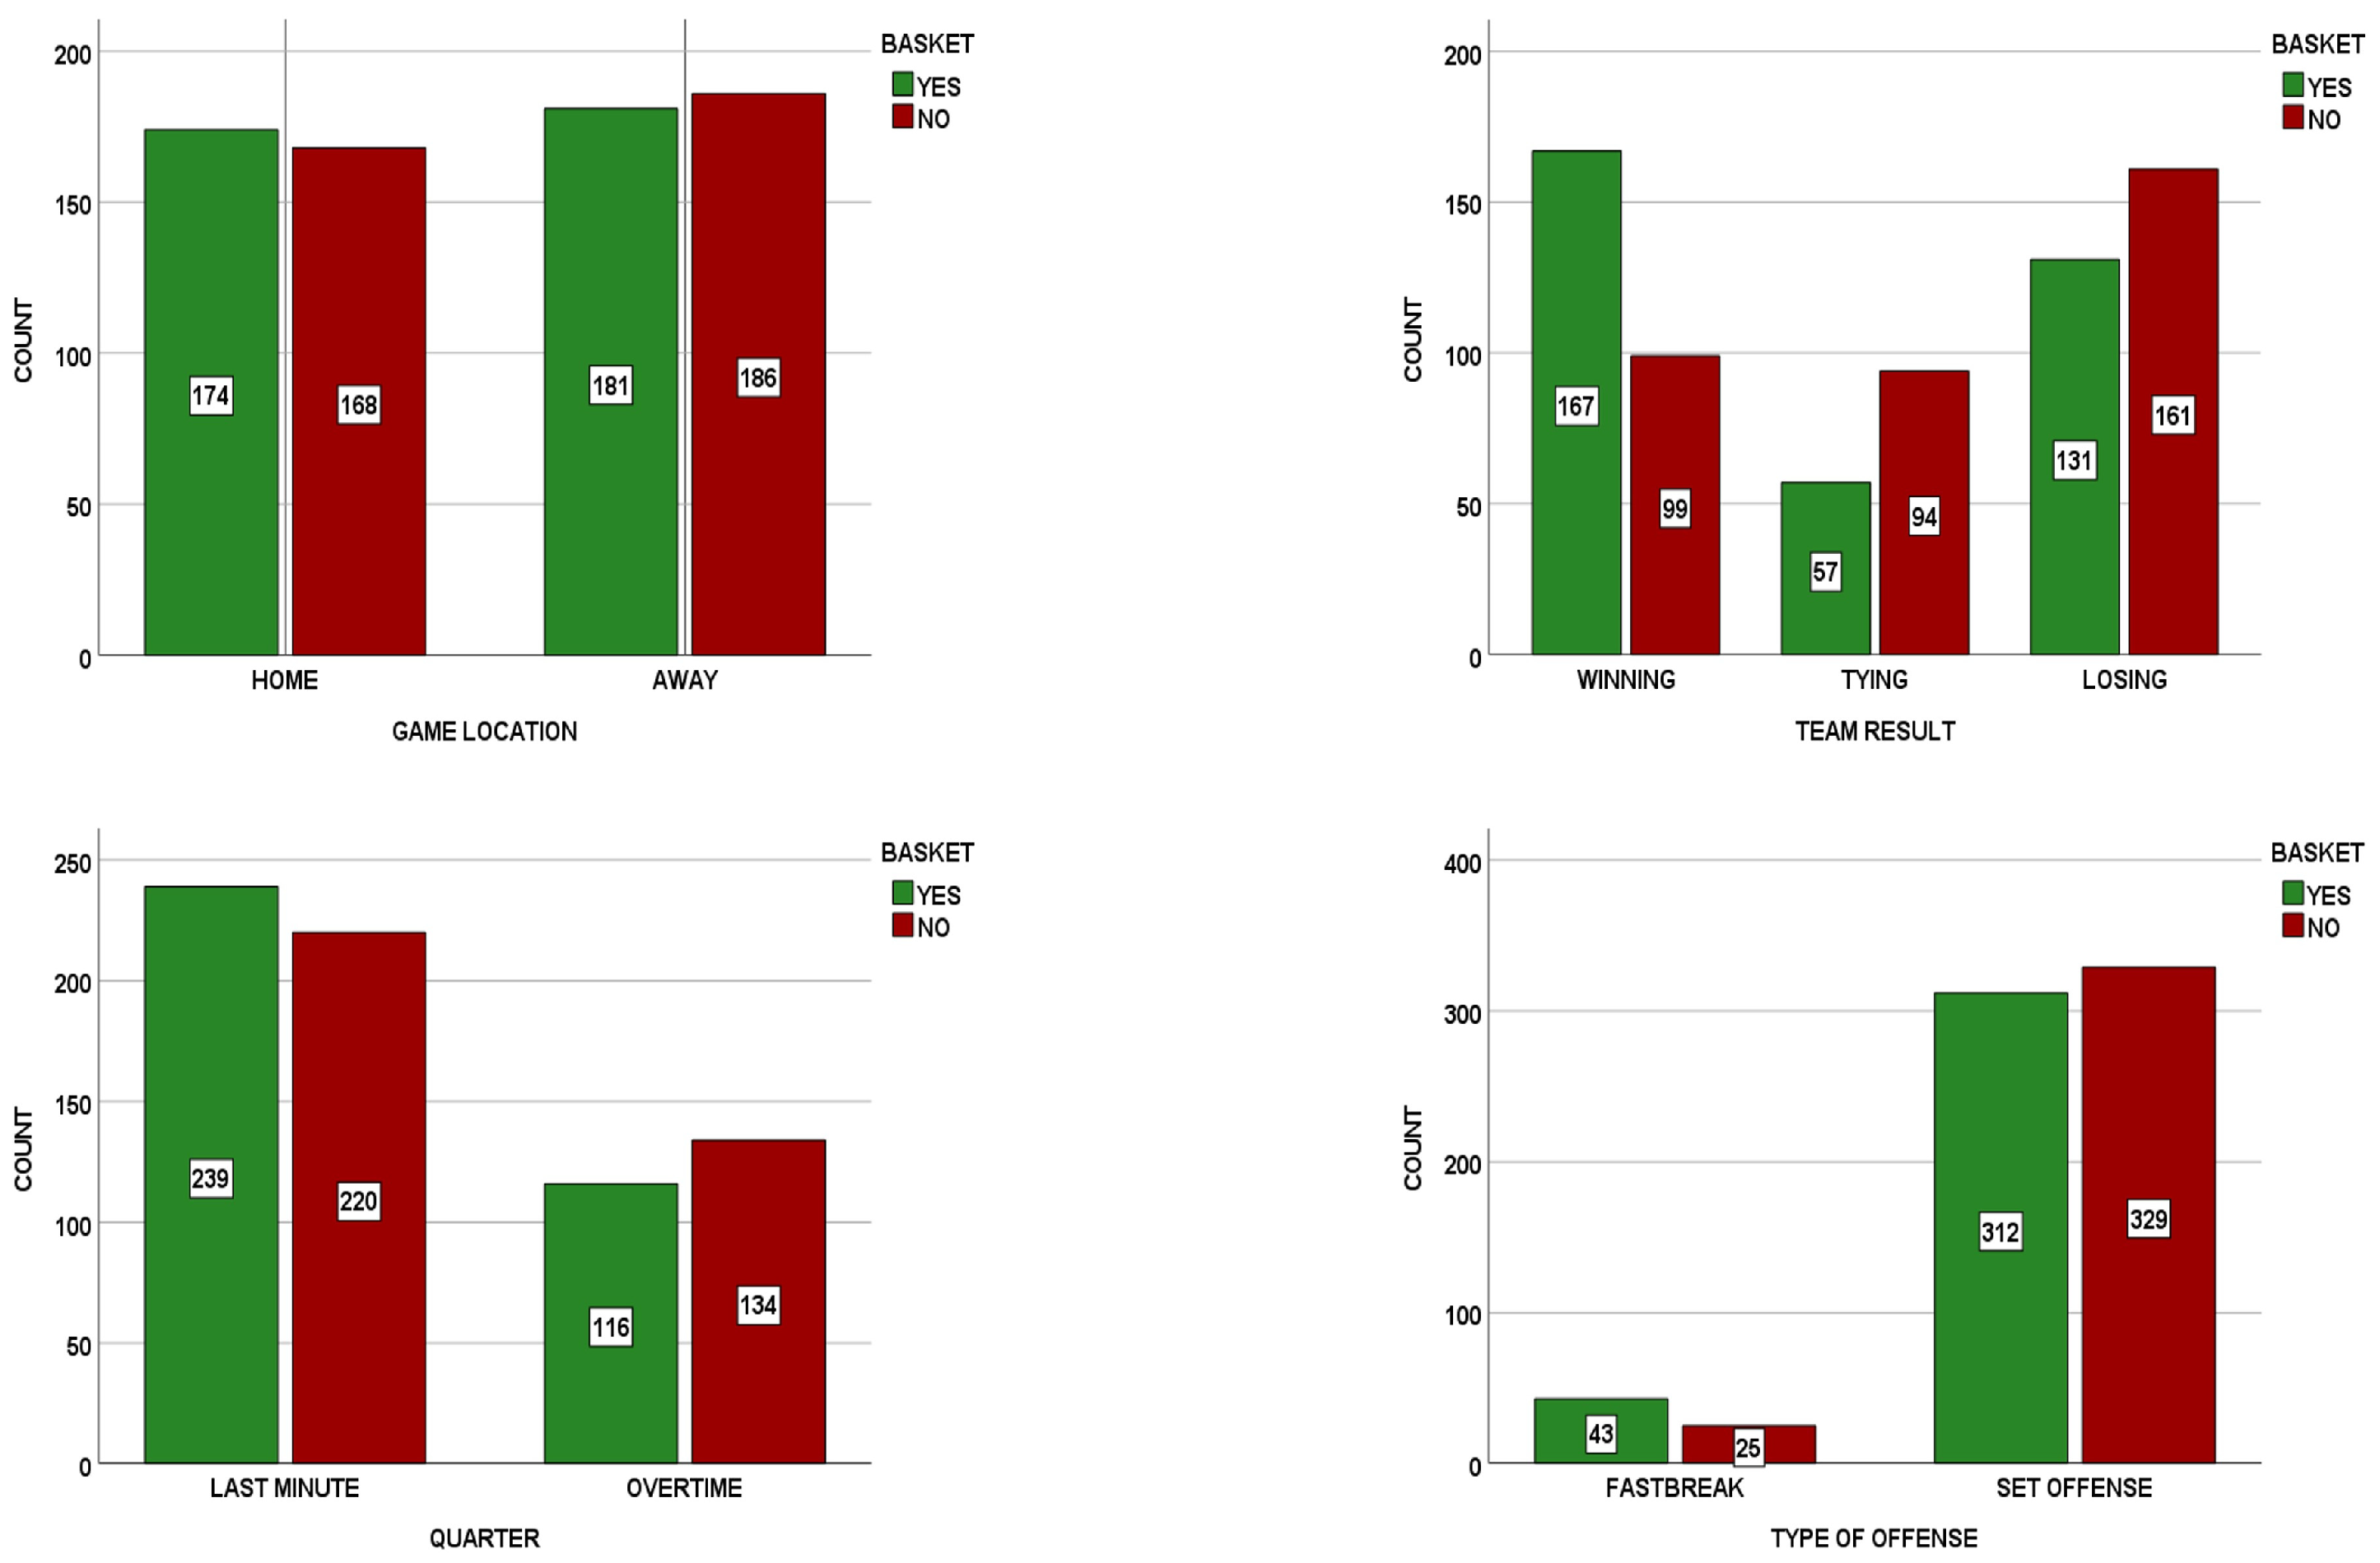
As depicted in Figure 2, home teams slightly outperformed visiting teams in terms of successful actions (50.9% vs. 49.3%). Additionally, teams that started the play while winning were more successful (62.8%) compared to those tied (37.7%) or losing (44.9%). Similarly, a higher number of successful plays occurred during the final minute of regular time (52.1%) than in overtime (46.4%). Lastly, despite the limited occurrence of fast break plays, they proved to be more effective (63.2%) compared to set offenses (48.7%).
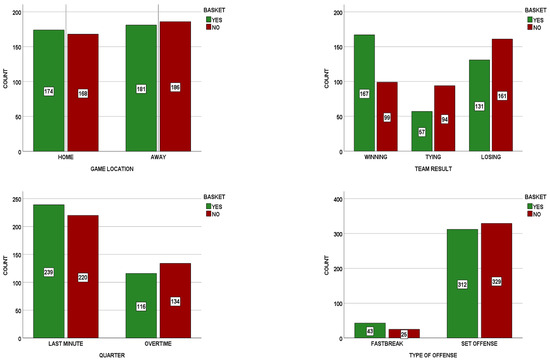
Figure 2.
Relationship between the “Basket” criteria and “Game Location”, “Team Result”, “Quarter”, and “Type of Offense” criteria.
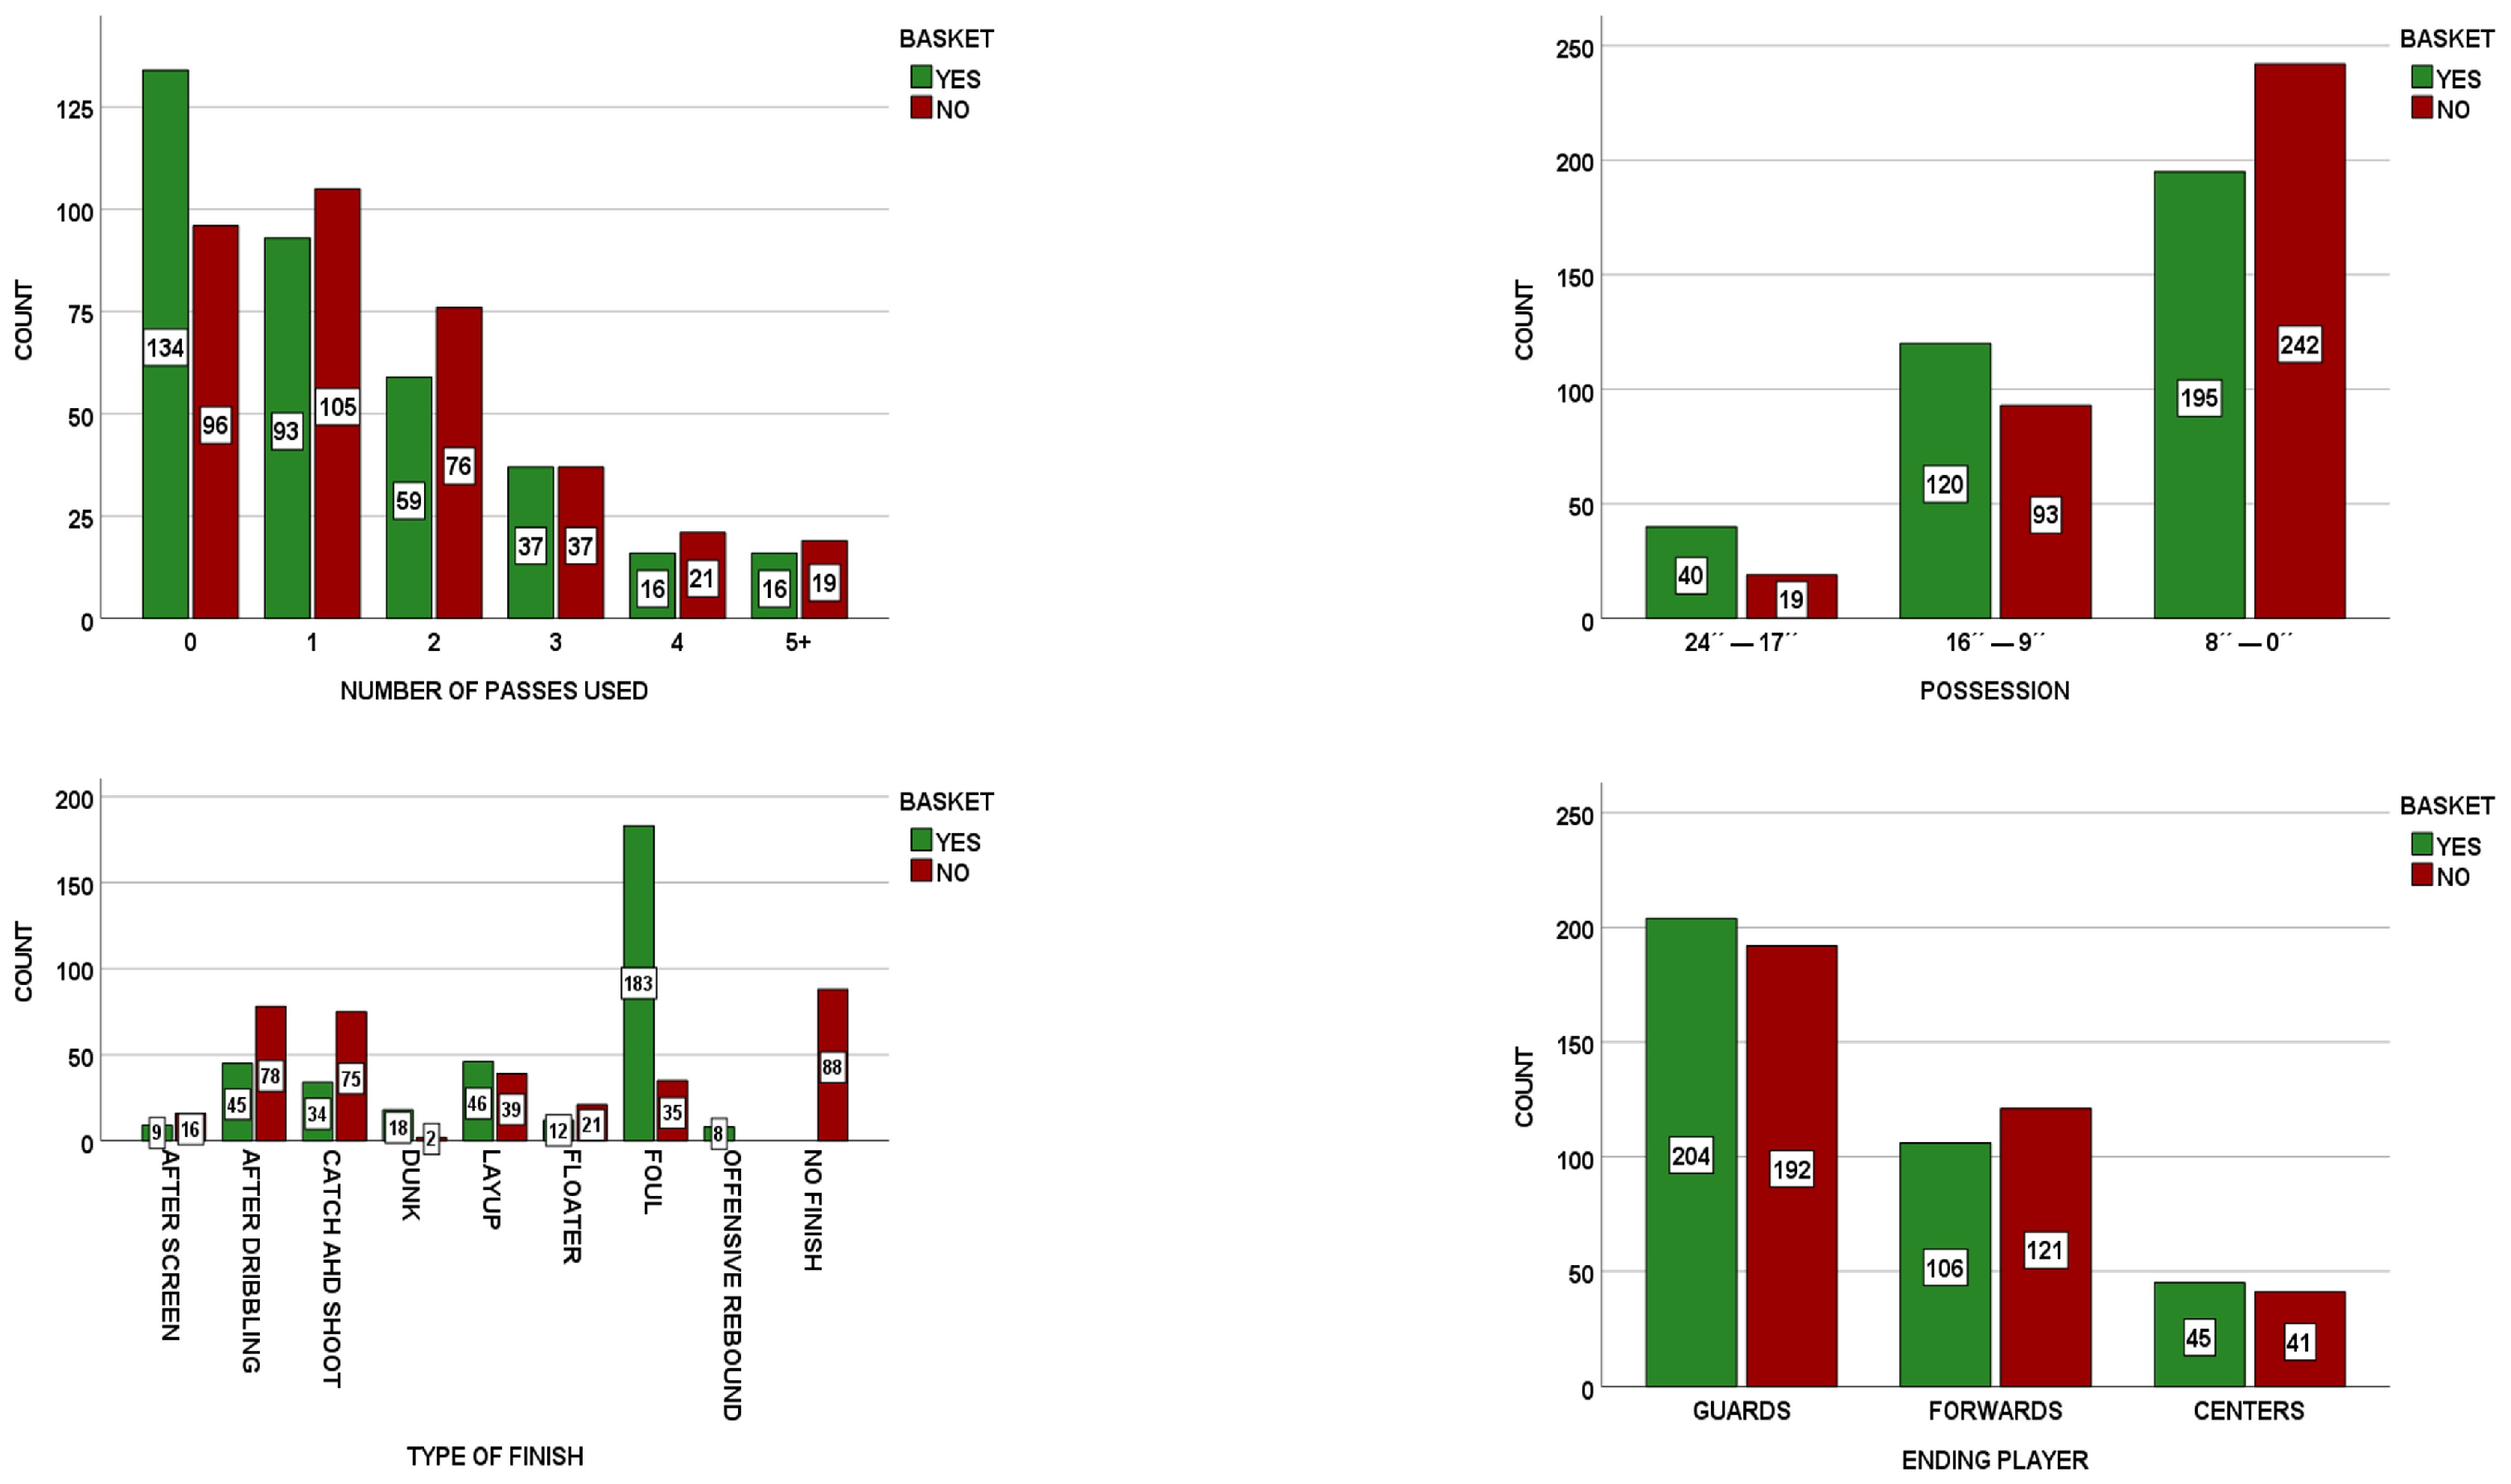
Figure 3 highlights that plays involving no passes during their execution achieved the highest success rate in scoring (58.3%). Regarding possession phases, the greatest success rates were observed during the initial phase (24″–17″) and the mid-phase (16″–9″) of possession, with 67.8% and 56.3% effectiveness, respectively. In terms of the type of finish, the highest success rates were recorded for plays ending with a layup (54.1%), dunk (90%), or following a personal foul (83.9%). Lastly, point guards (51.5%) and centers (52.3%) demonstrated higher scoring accuracy compared to forwards (46.7%).
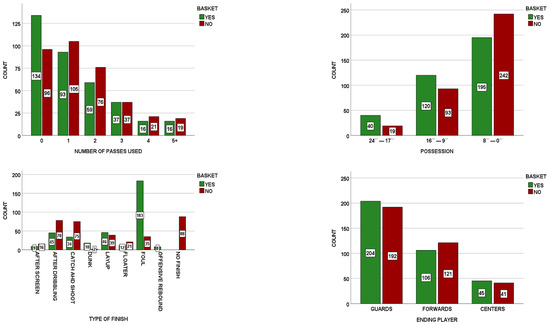
Figure 3.
Relationship between the “Basket” criteria and “Number of Passes Used”, “Possession”, “Type of Finish”, and “Ending Player” criteria.
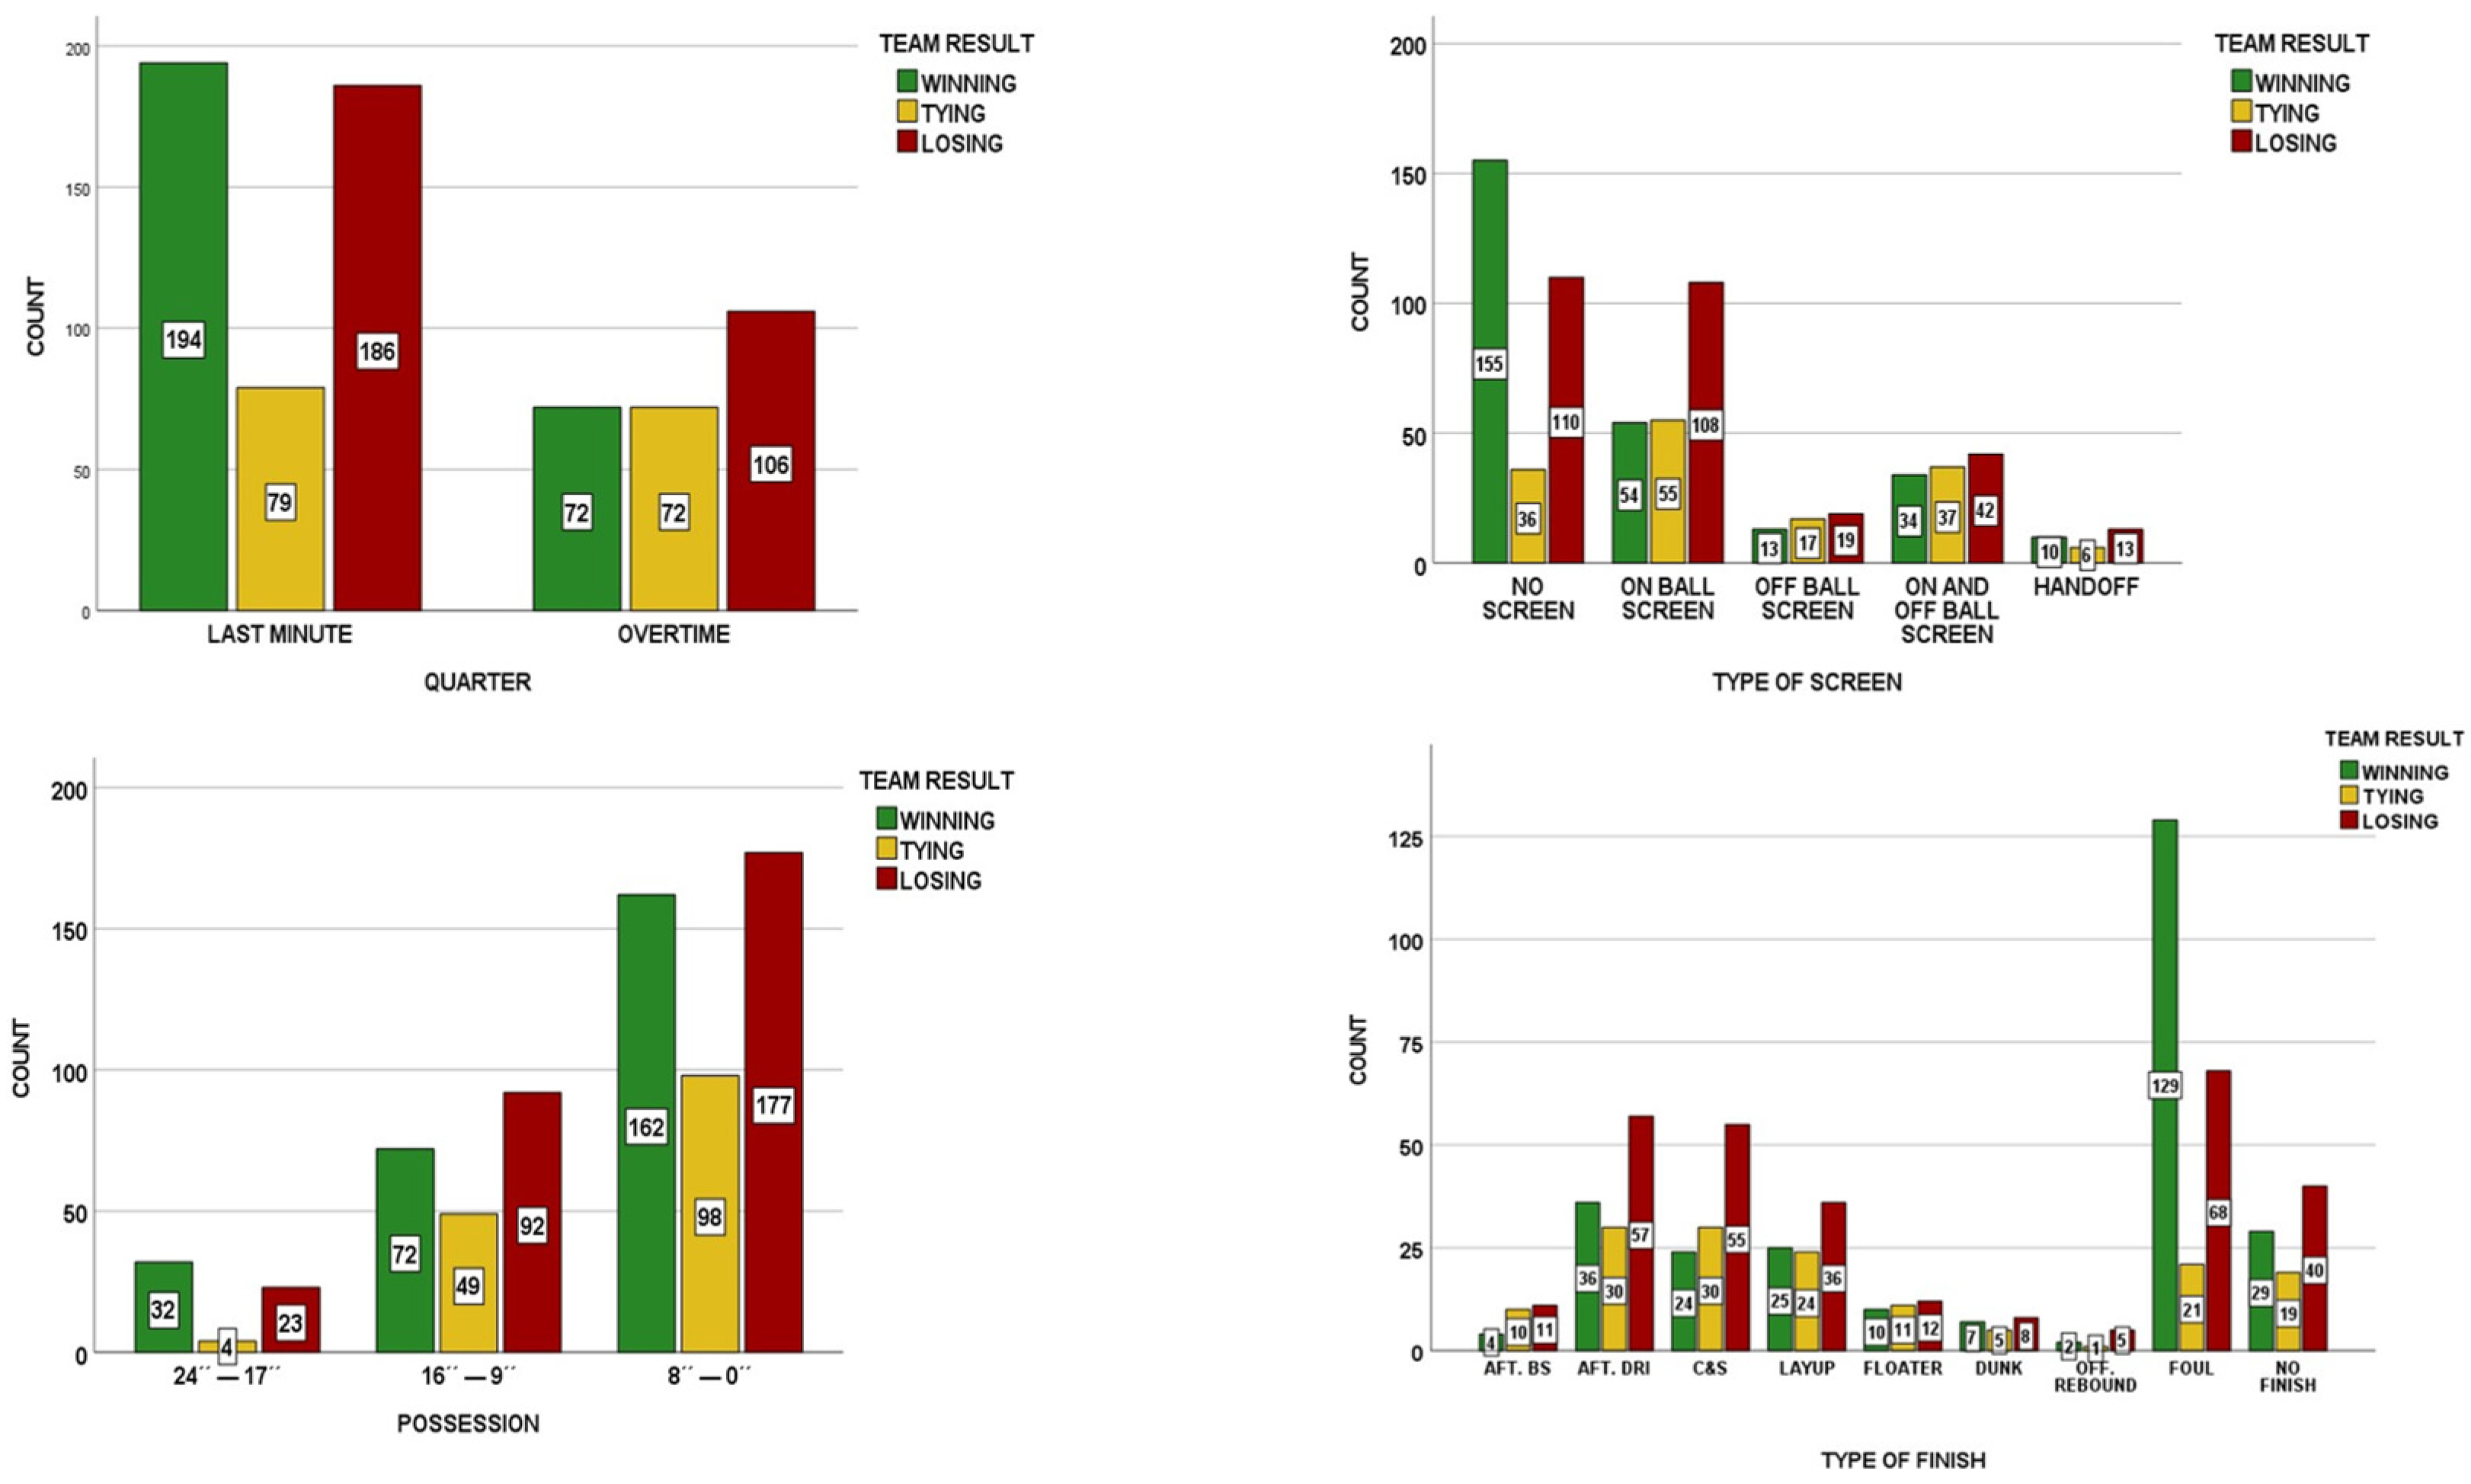
Figure 4 illustrates that during the final minute, teams that were winning or tying completed a similar proportion of plays (42.3% and 40.5%, respectively). However, in overtime, teams that were tying executed 42.4% of plays compared to 28.8% for teams that were tied or winning. Regarding the use of screens, teams in the lead avoided screens in 51.5% of cases, while those losing employed on-ball screens in 49.8% of situations where this game element was utilized.
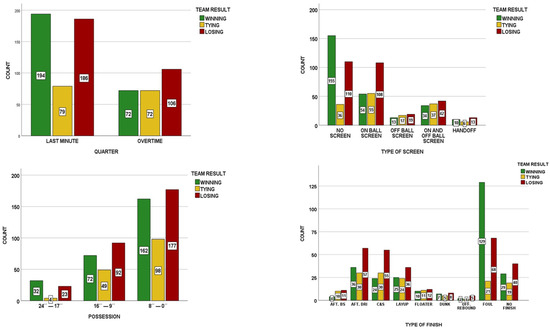
Figure 4.
Relationship between the “Team Result” criterion and “Quarter”, “Type of Screen”, “Possession”, and “Type of Finish” criteria. Note: AFT. BS: After Ball Screen; AFT. DRI: After Dribbling; C&S: Catch and Shoot.
In terms of possession phases, winning teams completed more actions during the initial phase of possession (54.2%), whereas losing teams executed more plays in the mid-phase (43.2%) and final phase (40.5%). Lastly, winning teams concluded more plays through personal fouls (59.2%), while losing teams favored actions such as catch-and-shoot attempts (50.5%), pull-up shots (46.3%), and layups (42.4%).
3.2. Analysis of Successful Patterns on Offense
Table 3 displays the results of a T-Pattern analysis conducted on the 355 successful actions identified. In terms of the team’s result at the beginning of each play (winning, losing, or tying), home teams that started with a lead executed the largest share of successful plays (43.7%), followed by those losing (39.1%) and those tying (17.2%). On the other hand, for away teams, those starting the play while winning accounted for the highest proportion of successful actions (50.3%), compared to teams that were losing (34.8%) or tying (14.9%).

Table 3.
T-Pattern analysis of the 355 successful plays observed.
When examining the phase of possession, most successful plays, regardless of the game location or team result, were completed during the final phase of possession (8″–0″).
The most characteristic patterns of play are detailed below, categorized by game location, team result, and possession phase.
4. Discussion
This study provides new insights into effective offensive dynamics and patterns during critical moments in closely contested elite men’s basketball games, focusing specifically on the last minute and overtime periods of the 2022/23 EuroLeague season. By analyzing high-pressure scenarios where the score difference was three points or fewer, this research highlights key factors influencing team performance under intense physical and mental conditions, contributing to a deeper understanding of the game in such contexts.
First, the findings indicate negligible differences in scoring success between home and away teams during the last minute and overtime periods (50.9% vs. 49.3%, respectively). The phenomenon of home-court advantage has been widely studied in basketball [42], particularly in the EuroLeague [14,43,44,45]. Historically, this advantage has been notable, with home teams winning 66% of games during the 2004/05 EuroLeague season [14]. Similarly, in the 2008/09 season, home teams achieved a 66% win rate during the regular season, which decreased to 58% during the playoffs [43]. Factors contributing to home-court advantage include player performance, crowd influence, familiarity with the home court, geography, travel distances, and sleep patterns [42]. Notably, the absence of spectators during the COVID-19 pandemic reduced the pre-pandemic home-court advantage (approximately 70%) to around 51% in competitions held behind closed doors [45]. However, approximately two-thirds of this advantage is concentrated in the first quarter and diminishes progressively as the game progresses [46]. During the last minute and overtime periods, this effect wanes as visiting teams adapt to factors such as the opposing crowd or unfamiliar facilities [47,48]. This adaptation is reflected in the current study, where no significant differences were observed between game location and scoring success.
Additionally, scoring accuracy was higher during the last minute compared to overtime periods (52.1% vs. 46.4%). This discrepancy may be attributed to physical and mental fatigue, as overtime is characterized by accumulated exhaustion, stress, and player disqualifications due to fouls [24]. Research on U-18 basketball games revealed that total distance covered and physical load were significantly lower during overtime compared to the fourth quarter [49]. Similarly, overtime periods have been shown to induce proportionally greater increases in perceptual load (29%), physiological load (26%), and medium-intensity accelerative movements (40–43%) compared to regular game time [50]. Psycho-physiological alterations from competitive demands can also lead to a “psychological crisis state,” marked by diminished player performance [23].
Fast breaks emerged as more effective than set offenses (63.2% vs. 48.7%). These findings align with previous studies on Italian professional and semi-professional teams, where fast breaks demonstrated a 63.5% success rate [51]. In the 2017/18 EuroLeague season, two-point shots were the most common and efficient possession outcomes, with fast breaks being one of the most effective types of offensive plays [20]. Coaches are strongly encouraged to train their teams to execute transition plays whenever possible [5]. However, the total number of fast breaks during the final minute and overtime (9.6%) were lower compared to other datasets, such as complete EuroLeague matches (18.3%) [31]. This disparity is likely due to physical wear and tear, as previously noted for overtime periods. Vigorous activities tend to decrease during the final quarter, potentially contributing to reduced lactate concentrations and lower heart rate responses [52]. External load analysis in professional basketball has shown a consistent decline in physical demands throughout game quarters, with the most significant reductions occurring between the third and fourth quarters [53].
Regarding passes and possession, plays with no passes had the highest success rate (58.3%), as did those executed during the early and middle phases of possession (67.8% and 56.3%, respectively). Previous research on Spanish league teams observed increased possession effectiveness when no passes were used during the last five minutes of play [35]. However, the manner of executing passes is as important as their use. Coaches should emphasize incorporating two essential passing techniques into their training regimen: one-handed passes (basic passes) and two-handed passes (overhead and chest passes) [54]. Effective possession durations of 0–20 s have been linked to improved outcomes during the final five minutes of games [35]. Conversely, shots taken in the last phase of possession (8″–0″) are often unplanned and heavily influenced by aggressive defensive pressure, which increases the likelihood of failure [55].
Finally, point guards (51.5%) and centers (52.3%) demonstrated higher scoring success than forwards (46.7%). Studies on individual player profiles in elite basketball reveal that EuroLeague centers tend to have moderate playing time and are generally older, relying more on physical behavior and decision-making rather than athleticism. Conversely, point guards are typically younger, play the most minutes, and are often the top performers in game-related statistics [8]. The performance of point guards is more critical to game outcomes than that of forwards, as poor performance from point guards cannot be offset by better forward performance [14]. Point guards typically score more points per minute and take and make more three-pointers, while centers dominate two-point attempts and scoring near the basket due to their size and proximity to the rim [56].
In terms of successful patterns, teams leading on the scoreboard consistently concluded possessions through free throws resulting from fouls by the opposing team, regardless of game location or possession phase. Winning teams have been observed to draw more fouls from opponents [57]. Free throws accounted for 69% of points scored during the final minute, highlighting the importance of having strong free-throw shooters on the court in critical moments [23]. Guards and forwards tend to cope better with pressure in free-throw situations compared to centers during close games [58]. Meanwhile, trailing teams often adopt a defensive strategy of intentional fouling to stop the clock and limit the opponent’s scoring efficiency through free throws [25]. Intentional fouling has been shown to increase the likelihood of winning compared to allowing the opponent to execute a play and try to defend it [59].
The findings of this study contribute to the growing body of research on basketball performance analysis by focusing on structured offensive behaviors in the most decisive moments of the game. The application of T-Pattern analysis, which has not been widely used in the study of single-possession offensive strategies, reveals tactical insights that are not observable through conventional statistical methods. These results offer practical implications for coaches and analysts, allowing for data-driven decision-making in high-pressure scenarios.
4.1. Practical Applications
The results of this study have several practical implications that can be useful for both coaches and their technical staff in elite basketball. Coaches should prioritize simple and effective offensive strategies during the final moments of games, such as seeking free throws through actions that generate contact with the opponent and drawing personal fouls, particularly when their team is winning. Selecting the best free-throw shooters during these critical moments can be crucial to securing points. Conversely, teams that are losing often resort to intentional fouls as a strategy to stop the clock and reduce the offensive efficiency of their opponents. Practicing free-throw shooting under pressure and designing defensive schemes to counter this tactic can significantly impact the final outcome.
For teams that are losing, an effective approach to completing plays involves the use of on-ball screens, finishing with two-point baskets through layups or three-point baskets via catch-and-shoot plays.
Since actions executed during the initial and middle phases of possession demonstrate higher success rates, coaches can design quick plays to capitalize on these time windows, avoiding reliance on prolonged possessions that are typically influenced by greater defensive pressure. In this context, fast breaks have proven to be more effective than set offenses; however, their execution depends on the accumulation of players’ physical and mental fatigue. The higher success rates observed among point guards and centers during critical moments suggest that these positions should be actively involved in key plays. Coaches can develop systems that prioritize decision-making by point guards and enable centers to finish plays near the basket.
4.2. Limitations and Future Perspectives
This study presents certain limitations that should be taken into account when interpreting the results. First, the dataset is exclusively limited to offensive possessions during the final moments of games and overtime periods in the 2022/23 men’s EuroLeague season. While this allows for a specific analysis of critical situations, it does not encompass other phases of the game that could provide a more comprehensive understanding of performance dynamics. Second, the focus on a single competition restricts the generalizability of the findings to other competitive contexts, such as national leagues or international tournaments. Additionally, this study does not consider external variables such as psychological pressure, players’ physical condition, or contextual factors (e.g., injuries, coaching strategies), which might have influenced the results.
Moreover, the lack of temporal analysis prevents us from understanding how performance varies throughout the season, and how competition level, team rankings, and playing styles affect late-game offensive strategies.
Future studies could expand this work by exploring different competitions and categories, such as women’s leagues or youth divisions, to assess whether the observed patterns hold consistent across other contexts. It would also be valuable to incorporate additional variables, such as physiological or psychological metrics, to better understand the impact of pressure and fatigue on decision-making during critical moments of the game. Lastly, examining how specific defensive strategies influence the success of offensive possessions in high-pressure situations could provide a more balanced view of game dynamics.
5. Conclusions
This study has identified successful offensive patterns and key factors influencing performance during critical moments of men’s EuroLeague games, specifically in the last minute and overtime periods. The findings highlight that competitive context—such as the game result, possession phase, or type of offense—plays a fundamental role in the success of offensive actions.
Firstly, it was observed that teams winning at the start of plays were more likely to succeed, particularly through free throws resulting from fouls committed by the opposing team. Additionally, fast actions, such as fast breaks, proved to be more effective than set offenses, although they were less frequent in the final moments, likely due to accumulated physical and mental fatigue. Moreover, plays involving fewer passes and those executed during the early and middle phases of possession demonstrated higher success rates. Regarding player roles, point guards and centers showed higher success rates, underscoring the importance of point guard skills and the effectiveness of centers.
While these findings provide valuable insights into offensive strategies in high-pressure moments, it is important to acknowledge that the applicability of these results is limited to the EuroLeague context.
These results not only enhance the understanding of game dynamics in elite basketball but also offer practical implications for coaches and teams. Although the findings are specific to the EuroLeague, they provide a foundation for further exploration, which could help teams refine their late-game strategies and adapt to the challenges presented throughout a season.
Author Contributions
Conceptualization, I.P.-L., C.V.-E., M.T.-G., X.R.-L.-d.-l.-O. and A.G.-S.; methodology, I.P.-L., C.V.-E., X.R.-L.-d.-l.-O. and A.G.-S.; software, I.P.-L., M.T.-G. and A.G.-S.; validation, J.A.G.-S., M.T.-G. and X.R.-L.-d.-l.-O.; formal analysis, I.P.-L. and A.G.-S.; investigation, I.P.-L., J.A.G.-S., C.V.-E., M.T.-G., X.R.-L.-d.-l.-O. and A.G.-S.; resources, I.P.-L., C.V.-E., J.A.G.-S., M.T.-G. and X.R.-L.-d.-l.-O.; data curation, I.P.-L., C.V.-E., J.A.G.-S. and A.G.-S.; writing—original draft, I.P.-L., M.T.-G., C.V.-E. and A.G.-S.; writing—review and editing, I.P.-L., X.R.-L.-d.-l.-O. and A.G.-S.; visualization, C.V.-E., J.A.G.-S. and M.T.-G.; supervision, I.P.-L., C.V.-E. and A.G.-S.; project administration, I.P.-L., J.A.G.-S., X.R.-L.-d.-l.-O. and A.G.-S.; funding acquisition, C.V.-E., I.P.-L. and A.G.-S. All authors have read and agreed to the published version of the manuscript.
Funding
This study was funded by the Ministerio de Cultura y Deporte (https://www.culturaydeporte.gob.es/portada.html (accessed on 20 June 2024)), Consejo Superior de Deportes (https://www.csd.gob.es/es (accessed on 20 June 2024)), and the European Union (https://european-union.europa.eu/index_es (accessed on 20 June 2024)) under Project “Integración entre datos observacionales y datos provenientes de sensores externos: Evolución del software LINCE PLUS y desarrollo de la aplicación móvil para la optimización del deporte y la actividad física beneficiosa para la salud (2023)” EXP_74847 to A.G.-S. and I.P.-L. This research was funded by the Universidade de Vigo through a predoctoral fellowship awarded to C.V.-E. (Axudas Predoutorais para a formación de Doutoras/es 2022, Universidade de Vigo. P.P. 00VI 131H 6410211).
Institutional Review Board Statement
The study was approved by the ethics committee of the Faculty of Education and Sport Science (University of Vigo, application 06-280722).
Informed Consent Statement
Not applicable.
Data Availability Statement
The data presented in this study are openly available in FigShare at https://doi.org/10.6084/m9.figshare.28112015.
Acknowledgments
This publication was made possible thanks to the research stays during the years 2023 and 2024 at the Instituto Politécnico de Viana do Castelo (IPVC)—Escola Superior de Desporto e Lazer.
Conflicts of Interest
The authors declare no conflicts of interest.
References
- González, J.M.M.; De Saá Guerra, Y.; García-Manso, J.M.; Arriaza, E. Design and Flow in Basketball. Int. J. Heat Technol. 2016, 34, S51–S58. [Google Scholar] [CrossRef]
- Ferreira, A.P.; Volossovitch, A.; Sampaio, J. Towards the Game Critical Moments in Basketball: A Grounded Theory Approach. Int. J. Perform. Anal. Sport 2014, 14, 428–442. [Google Scholar] [CrossRef]
- García-Manso, J.M.; Martín-González, J.M.; De Saá Guerra, Y.; Valverde, T.; Jiménez, S.L. Last Minute in NBA Games. Rev. Psicol. Deport. 2015, 24, 31–35. [Google Scholar]
- Foteinakis, P.; Pavlidou, S.; Stavropoulos, N. Analysis of the Effectiveness of Different Play Types in the End of Game Possessions of Close EuroLeague Matches. J. Hum. Sport Exerc. 2024, 19, 617–630. [Google Scholar] [CrossRef]
- Christmann, J.; Akamphuber, M.; Müllenbach, A.L.; Güllich, A. Crunch Time in the NBA—The Effectiveness of Different Play Types in the Endgame of Close Matches in Professional Basketball. Int. J. Sports Sci. Coach. 2018, 13, 1090–1099. [Google Scholar] [CrossRef]
- Asenjo, M.Á.O.; Sáiz, S.L.J.; Calvo, A.L. Choking under Pressure En Los Tiros Libres de La Liga ACB. Rev. Psicol. Deport. 2017, 26, 121–126. [Google Scholar]
- Özmen, M.U. Marginal Contribution of Game Statistics to Probability of Winning at Different Levels of Competition in Basketball: Evidence from the Euroleague. Int. J. Sports Sci. Coach. 2016, 11, 98–107. [Google Scholar] [CrossRef]
- Mateus, N.; Esteves, P.; Gonçalves, B.; Torres, I.; Gomez, M.A.; Arede, J.; Leite, N. Clustering Performance in the European Basketball According to Players’ Characteristics and Contextual Variables. Int. J. Sports Sci. Coach. 2020, 15, 405–411. [Google Scholar] [CrossRef]
- Strumbelj, E.; Vračar, P.; Robnik-Sikonja, M.; Dežman, B.; Erčulj, F. A Decade of Euroleague Basketball: An Analysis of Trends and Recent Rule Change Effects. J. Hum. Kinet. 2013, 38, 183–189. [Google Scholar] [CrossRef] [PubMed]
- Çene, E. What Is the Difference between a Winning and a Losing Team: Insights from Euroleague Basketball. Int. J. Perform. Anal. Sport 2018, 18, 55–68. [Google Scholar] [CrossRef]
- Dogan, I.; Ersoz, Y. The Important Game-Related Statistics for Qualifying next Rounds in Euroleague. Montenegrin J. Sports Sci. Med. 2019, 8, 43–50. [Google Scholar] [CrossRef]
- Mikołajec, K.; Banyś, D.; Zurowska-Cegielska, J.; Zawartka, M.; Gryko, K. How to Win the Basketball Euroleague? Game Performance Determining Sports Results during 2003–2016 Matches. J. Hum. Kinet. 2021, 77, 287–296. [Google Scholar] [CrossRef] [PubMed]
- Paulauskas, R.; Masiulis, N.; Vaquera, A.; Figueira, B.; Sampaio, J. Basketball Game-Related Statistics That Discriminate between European Players Competing in the Nba and in the Euroleague. J. Hum. Kinet. 2018, 65, 225–233. [Google Scholar] [CrossRef] [PubMed]
- Sampaio, J.; Ibanez, S.J.; Gomez, M.A.; Lorenzo, A.; Ortega, E. Game Location Influences Basketball Players’ Performance across Playing Positions. Int. J. Sport Psychol. 2008, 39, 205–216. [Google Scholar]
- Marmarinos, C.; Apostolidis, A.; Bolatoglou, T. Game-Related Statistics That Discriminate Playoffs Teams from the Rest of the Competition in Euroleague Basketball. J. Athl. Enhanc. 2016, 5, 6. [Google Scholar] [CrossRef]
- Mandić, R.; Jakovljević, S.; Erèulj, F.; Štrumbelj, E. Trends in NBA and Euroleague Basketball: Analysis and Comparison of Statistical Data from 2000 to 2017. PLoS ONE 2019, 14, e0223524. [Google Scholar] [CrossRef] [PubMed]
- Yilmaz, B.; Işik, Ö.; Doğan, İ. Determining the Most Important Game-Related Statistics in Euroleague Basketball Competitions: A Five-Year Follow-Up. Turkish J. Sport Exerc. 2023, 25, 455–461. [Google Scholar] [CrossRef]
- Selmanovic, A.; Luka, M.; Škegro, D. Finishing Actions in Relation with Basketball Offense Outcome Types in NBA and Euroleague. Acta Kinesiol. 2019, 13, 29–34. [Google Scholar]
- Erčulj, F.; Štrumbelj, E. Basketball Shot Types and Shot Success in Different Levels of Competitive Basketball. PLoS ONE 2015, 10, e0128885. [Google Scholar] [CrossRef]
- Matulaitis, K.; Bietkis, T. Prediction of Offensive Possession Ends in Elite Basketball Teams. Int. J. Environ. Res. Public Health 2021, 18, 1083. [Google Scholar] [CrossRef]
- Akinci, Y. Examining the Differences Between Playoff Teams and Non-Playoff Teams in Men’s Euroleague; Play-Type Statistics Perspective. SAGE Open 2023, 13, 21582440231220155. [Google Scholar] [CrossRef]
- Anguera, M.T.; Hernández-Mendo, A. Observational Methodology and Sports Psychology: State of Affairs. Rev. Psicol. Deport. 2014, 23, 103–109. [Google Scholar]
- Navarro, R.M.; Lorenzo, A.; Gómez, M.Á.; Sampaio, J. Analysis of Critical Moments in the League ACB 2007-08. Rev. Psicol. Deport. 2009, 18, 391–395. [Google Scholar]
- Gómez, M.Á.; Lorenzo, A.; Jiménez, S.; Navarro, R.M.; Sampaio, J. Examining Choking in Basketball: Effects of Game Outcome and Situational Variables during Last 5 Minutes and Overtimes. Percept. Mot. Skills 2015, 120, 111–124. [Google Scholar] [CrossRef] [PubMed]
- Gómez, M.Á.; Gasperi, L.; Lupo, C. Performance Analysis of Game Dynamics during the 4th Game Quarter of NBA Close Games. Int. J. Perform. Anal. Sport 2016, 16, 249–263. [Google Scholar] [CrossRef]
- Vázquez-Estévez, C.; Paramés-González, A.; Prieto-Lage, I.; Reguera-López-de-la-Osa, X.; Álvarez-Rodríguez, M.; Gutiérrez-Santiago, A. Analysis of Successful Offensive Patterns in Critical Moments in Men’s EuroBasket 2022 and Women’s 2021. Appl. Sci. 2024, 14, 10883. [Google Scholar] [CrossRef]
- Prieto-Lage, I.; Vázquez-Estévez, C.; Paramés-González, A.; Argibay-González, J.C.; Reguera-López-de-la-Osa, X.; Gutiérrez-Santiago, A. Ball Screens in the Men’s 2019 Basketball World Cup. Int. J. Environ. Res. Public Health 2023, 20, 59. [Google Scholar] [CrossRef] [PubMed]
- Vázquez-Estévez, C.; Prieto-Lage, I.; Reguera-López-de-la-Osa, X.; Silva-Pinto, A.J.; Argibay-González, J.C.; Gutiérrez-Santiago, A. Analysis of Offensive Patterns After Timeouts in Critical Moments in the EuroLeague 2022/23. Appl. Sci. 2025, 15, 1580. [Google Scholar] [CrossRef]
- Bar-Eli, M.; Tractinsky, N. Criticality of Game Situations and Decision Making in Basketball: An Application of Performance Crisis Perspective. Psychol. Sport Exerc. 2000, 1, 27–39. [Google Scholar] [CrossRef]
- Di Mattia, A.; Krumer, A. Fewer Teams, More Games, Larger Attendance? Evidence from the Structural Change in Basketball’s EuroLeague. Eur. J. Oper. Res. 2023, 309, 359–370. [Google Scholar] [CrossRef]
- Jørgensen, J.H.; Selmanović, A.; Thomann, K. Difference of Offensive Structure between European and American Top-Level Basketball. J. Phys. Educ. Sport 2021, 21, 1988–1997. [Google Scholar] [CrossRef]
- Anguera, M.T.; Blanco-Villaseñor, A.; Losada, J.L.; Portell, M. Guidelines for Designing and Conducting a Study That Applies Observational Methodology. Anu. Psicol. 2018, 48, 9–17. [Google Scholar] [CrossRef]
- Serna, J.; Muñoz-Arroyave, V.; March-Llanes, J.; Teresa Anguera, M.; Prat, Q.; Rillo-Albert, A.; Falcón, D.; Lavega-Burgués, P. Effect of Ball Screen and One-on-One on the Level of Opposition and Effectiveness of Shots in the Acb. Int. J. Environ. Res. Public Health 2021, 18, 2676. [Google Scholar] [CrossRef] [PubMed]
- Anguera, M.T.; Blanco-Villaseñor, A.; Hernández-Mendo, A.; Losada-López, J.L.; López-Losada, J.L.; Losada-López, J.L. Observational Designs: Their Suitability and Application in Sports Psychology. Cuad. Psicol. Deport. 2011, 11, 63–76. [Google Scholar]
- Gómez, M.Á.; Lorenzo, A.; Ibañez, S.J.; Sampaio, J. Ball Possession Effectiveness in Men’s and Women’s Elite Basketball According to Situational Variables in Different Game Periods. J. Sports Sci. 2013, 31, 1578–1587. [Google Scholar] [CrossRef] [PubMed]
- Gómez, M.Á.; Alarcón, F.; Ortega, E. Analysis of Shooting Effectiveness in Elite Basketball According to Match Status. Rev. Psicol. Deport. 2015, 24, 37–41. [Google Scholar]
- Soto, A.; Camerino, O.; Iglesias, X.; Anguera, M.T.; Castañer, M. LINCE PLUS: Research Software for Behavior Video Analysis. Apunt. Educ. Física i Esports 2019, 137, 149–153. [Google Scholar] [CrossRef]
- Blanco-Villaseñor, A.; Anguera, M.T. Evaluación de La Calidad En El Registro Del Comportamiento. Aplicación a Los Deportes de Equipo. In Métodos Numéricos en Ciencias Sociales; Oñate, E., García-Sicilia, F., Ramallo, L., Eds.; Centro Internacional de Métodos Numéricos en Ingeniería: Barcelona, Spain, 2000; pp. 30–48. [Google Scholar]
- Cohen, J. Weighted Kappa: Nominal Scale Agreement with Provision for Scaled Disagreement of Partial Credit. Psychol. Bull. 1968, 70, 213–220. [Google Scholar] [CrossRef]
- Magnusson, M.S. Discovering Hidden Time Patterns in Behavior: T-Patterns and Their Detection. Behav. Res. Methods Instrum. Comput. 2000, 32, 93–110. [Google Scholar] [CrossRef]
- Alsasua, R.; Lapresa, D.; Arana, J.; Anguera, M.T.; Garzón, B. Successful and Unsuccessful Offensive Sequences Ending in a Shot in Professional and Elite Under-16 Basketball. J. Hum. Kinet. 2018, 64, 147–159. [Google Scholar] [CrossRef] [PubMed]
- Mochales Cuesta, I.; Jiménez-Sáiz, S.L.; Kelly, A.L.; Bustamante-Sánchez, Á. The Influence of Home-Court Advantage in Elite Basketball: A Systematic Review. J. Funct. Morphol. Kinesiol. 2024, 9, 192. [Google Scholar] [CrossRef]
- Pojskić, H.; Šeparović, V.; Užičanin, E. Modelling Home Advantage in Basketball at Different Levels of Competition. Acta Kinesiol. 2011, 5, 25–30. [Google Scholar]
- Bourdas, D.I.; Mitrousis, I.; Zacharakis, E.D.; Travlos, A.K. Home-Audience Advantage in Basketball: Evidence from a Natural Experiment in Euro League Games during the 2019–2021 Covid-19 Era. J. Phys. Educ. Sport 2022, 22, 1761–1771. [Google Scholar] [CrossRef]
- Paulauskas, R.; Stumbras, M.; Coutinho, D.; Figueira, B. Exploring the Impact of the COVID-19 Pandemic in Euroleague Basketball. Front. Psychol. 2022, 13, 979518. [Google Scholar] [CrossRef]
- Jones, M.B. Home Advantage in the NBA as a Game-Long Process. J. Quant. Anal. Sports 2007, 3, 1–16. [Google Scholar] [CrossRef]
- Ribeiro, H.V.; Mukherjee, S.; Zeng, X.H.T. The Advantage of Playing Home in NBA: Microscopic, Team-Specific and Evolving Features. PLoS ONE 2016, 11, e0152440. [Google Scholar] [CrossRef] [PubMed]
- Sampaio, J.; Lago, C.; Casais, L.; Leite, N. Effects of Starting Score-Line, Game Location, and Quality of Opposition in Basketball Quarter Score. Eur. J. Sport Sci. 2010, 10, 391–396. [Google Scholar] [CrossRef]
- Sosa, C.; Alonso Pérez-Chao, E.; Trapero, J.; Ribas, C.; Leicht, A.S.; Lorenzo, A.; Jiménez, S.L. External Physical Demands during Official Under-18 Basketball Games: Consideration of Overtime Periods. J. Hum. Kinet. 2024, 94, 181–190. [Google Scholar] [CrossRef] [PubMed]
- Scanlan, A.T.; Stanton, R.; Sargent, C.; O’Grady, C.; Lastella, M.; Fox, J.L. Working Overtime: The Effects of Overtime Periods on Game Demands in Basketball Players. Int. J. Sports Physiol. Perform. 2019, 14, 1331–1337. [Google Scholar] [CrossRef]
- Conte, D.; Favero, T.G.; Niederhausen, M.; Capranica, L.; Tessitore, A. Determinants of the Effectiveness of Fast Break Actions in Elite and Sub-Elite Italian Men’s Basketball Games. Biol. Sport 2017, 34, 177–183. [Google Scholar] [CrossRef]
- Stojanović, E.; Stojiljković, N.; Scanlan, A.T.; Dalbo, V.J.; Berkelmans, D.M.; Milanović, Z. The Activity Demands and Physiological Responses Encountered During Basketball Match-Play: A Systematic Review. Sports Med. 2018, 48, 111–135. [Google Scholar] [CrossRef] [PubMed]
- Salazar, H.; Ujakovic, F.; Plesa, J.; Lorenzo, A.; Alonso-Pérez-Chao, E. Do Elite Basketball Players Maintain Peak External Demands throughout the Entire Game? Sensors 2024, 24, 4318. [Google Scholar] [CrossRef] [PubMed]
- Gryko, K.; Mikołajec, K.; Marszałek, J.; Adamczyk, J.G.; Molik, B.; Waśkiewicz, Z.; Nikolaidis, P.; Knechtle, B. How Did Basketball Teams Win EuroBasket 2015? A Non-Standard Analysis of Performance Based on Passes, Dribbling and Turnovers. Int. J. Perform. Anal. Sport 2020, 20, 339–356. [Google Scholar] [CrossRef]
- Vencúrik, T.; Milanović, Z.; Lazić, A.; Li, F.; Matulaitis, K.; Rupčić, T. Performance Factors That Negatively Influence Shooting Efficiency in Women’s Basketball. Front. Physiol. 2022, 13, 1042718. [Google Scholar] [CrossRef] [PubMed]
- Escudero-Tena, A.; Rodríguez-Galán, V.; García-Rubio, J.; Ibáñez, S.J. Influence of the Specific Position on The Final Result of The Match in Professional Basketball. Rev. Psicol. Deport. 2021, 30, 19–24. [Google Scholar]
- Raval, K.M.R.; Pagaduan, J.C. Factors That Differentiate Winning and Losing in Men’s University Basketball. Montenegrin J. Sports Sci. Med. 2021, 10, 13–17. [Google Scholar] [CrossRef]
- Gómez, M.Á.; Avugos, S.; Oñoro, M.Á.; Lorenzo, A.; Bar-Eli, M. Shaq Is Not Alone: Free-Throws in the Final Moments of a Basketball Game. J. Hum. Kinet. 2018, 62, 135–144. [Google Scholar] [CrossRef]
- Annis, D.H. Optimal End-Game Strategy in Basketball. J. Quant. Anal. Sports 2006, 2, 1–11. [Google Scholar] [CrossRef][Green Version]
Disclaimer/Publisher’s Note: The statements, opinions and data contained in all publications are solely those of the individual author(s) and contributor(s) and not of MDPI and/or the editor(s). MDPI and/or the editor(s) disclaim responsibility for any injury to people or property resulting from any ideas, methods, instructions or products referred to in the content. |
© 2025 by the authors. Licensee MDPI, Basel, Switzerland. This article is an open access article distributed under the terms and conditions of the Creative Commons Attribution (CC BY) license (https://creativecommons.org/licenses/by/4.0/).

