Abstract
This study details the design and implementation of a real-time river monitoring station established on the Sakarya River, capable of instantaneously tracking water levels and flow rates. The system comprises an ultrasonic distance sensor, a GSM module (Global System for Mobile Communications), which enables real-time wireless data transmission to a server via cellular networks, a solar panel, a battery, and a microcontroller board. The river monitoring station operates by transmitting water level data collected by the ultrasonic distance sensor to a server via a communication module developed on a microcontroller board using an Arduino program, and then sharing these data through a web interface. The developed system performs regular and continuous water level readings without the need for human intervention. During the installation and calibration of the monitoring station, laboratory and field tests were conducted, and the obtained data were validated by comparison with data from the hydropower plant located upstream. This system, mounted on a bridge, measures water levels twice per minute and sends these data to the relevant server via the GSM module. During this process, precipitation data were utilized as a critical reference point for validating measurement data for the 2023 hydrological year, with changes in precipitation directly correlated with river water levels and calculated flow values, which were analyzed accordingly. The real-time river monitoring station allows for instantaneous monitoring of the river, achieving a measurement accuracy of within 0.1%. The discharge values recorded by the system showed a high correlation (r2 = 0.92) with data from the hydropower plant located upstream of the system, providing an accurate and comprehensive database for water resource management, natural disaster preparedness, and environmental sustainability. Additionally, the system incorporates early warning mechanisms that activate when critical water levels are reached, enabling rapid response to potential flood risks. By combining energy-independent operation with IoT (Internet Of Things)-based communication infrastructure, the developed system offers a sustainable solution for real-time environmental monitoring. The system demonstrates strong applicability in field conditions and contributes to advancing technologies in flood risk management and water resource monitoring.
1. Introduction
Floods are among the most common and destructive natural disasters globally. With the impact of climate change, the frequency and intensity of floods are increasing, posing significant threats to life and property [1,2,3]. Increased rainfall and irregular weather events cause sudden and unexpected rises in river water levels, thereby elevating flood risk [4]. In this context, the development of effective flood management systems is of paramount importance to mitigate the impacts of floods and minimize potential damages [1,2,3]. The integration of artificial intelligence and remote sensing technologies has become increasingly vital in enhancing flood prediction and management, allowing for early detection and more effective response strategies [5,6,7].
In recent years, advanced technologies used in flood warning systems, sensor networks, and real-time monitoring systems have made early detection of floods and rapid response to these events possible. These technologies play a crucial role in reducing flood risk by continuously and accurately monitoring water levels [8,9,10]. For instance, studies using ultrasonic distance sensors have demonstrated that these sensors can accurately measure river water levels, making them effective for early warning systems [11]. These systems offer significant advantages in water resource management, disaster preparedness, and environmental sustainability [12,13,14,15,16].
The integration of Internet of Things (IoT) technology has significantly enhanced the capabilities of these systems. IoT sensors can transmit data in real time to central systems, facilitating instant decision making and intervention [17,18]. This connectivity is critical for maintaining up-to-date flood maps and predicting potential flood zones based on real-time data [13,19,20]. By continuously monitoring changes in water levels, IoT sensors enable immediate response to sudden water level increases. These systems provide substantial advantages in disaster preparedness and environmental sustainability [12,13,14,15,16,21].
Arduino, an open-source electronic platform, is widely used in developing economical and customizable flood monitoring systems [22]. Arduino-based systems can interface with various sensors to measure water levels, flow rates, and other environmental parameters [15]. These systems are both cost-effective and highly adaptable, making them suitable for deployment in diverse geographical and socio-economic conditions. For example, an Arduino combined with a GSM module can transmit data to remote servers, allowing authorities to monitor flood conditions in real time [23,24].
The implementation of such technologies shows significant promise in enhancing communities’ resilience to flood risks. By leveraging sensor data and advanced analytics, flood management systems can provide accurate predictions and timely warnings, thereby reducing the impact of floods on lives and infrastructure [12,14,20]. Furthermore, research on water management and flood warning systems continuously improves the effectiveness and accuracy of sensor technologies [16,20,23,25,26,27,28,29].
Real-time monitoring of rivers is critically important for water resource management, disaster preparedness, and environmental sustainability. This study addresses the design and implementation of a real-time river monitoring station installed on the Örencik Bridge over the Sakarya River. The system continuously monitors water levels and transmits data, with the accuracy and reliability of the collected data being validated against precipitation data and data from a nearby hydroelectric power plant. The increase or decrease in precipitation amounts was directly correlated with the river water level measurements and the calculated flow values, and these relationships were thoroughly analyzed. This process confirmed the reliability and accuracy of the system.
The developed real-time river monitoring station allows for the continuous monitoring of water level changes in the Sakarya River, enabling the early detection and prevention of flood risks. Such systems offer significant advantages in water resource management, natural disaster preparedness, and environmental sustainability. This study established a river monitoring station capable of measuring flow and water levels accurately and comprehensively, at desired intervals, using ultrasonic distance sensors without human intervention at bridge sections. Thus, reliable flow calculations can be made for various projects planned on the river. Furthermore, in this system, if the level measured by the ultrasonic distance sensor reaches the critical level determined at the bridge sections, warning and information messages are sent to the relevant authorities, creating an early warning system against possible floods. In this way, the aim is to minimize potential loss of life and property.
This study proposes an innovative approach to real-time river monitoring systems by integrating energy-independent operation with IoT-based communication infrastructure. Utilizing solar power and GSM-based data transmission, the system ensures uninterrupted monitoring and real-time data sharing, particularly in regions with limited energy infrastructure. Additionally, the system’s early warning capabilities enhance its effectiveness in critical applications such as flood risk management and water resource monitoring. By addressing the limitations of existing methods, the developed system demonstrates robust applicability in field conditions and offers a practical contribution to advancing environmental monitoring technologies.
2. Materials and Methods
The real-time river monitoring station is installed on the Örencik Bridge, located at coordinates 40°35′2.33″ N 30°19′56.21″ E on the Lower Sakarya River. As shown in Figure 1, the Örencik Bridge, located downstream of the Doğançay HPP I (hydroelectric power plant), is strategically positioned upstream of central residential areas, industrial establishments, and factories. This location is crucial for gaining lead time in flood warnings and implementing preventive measures.
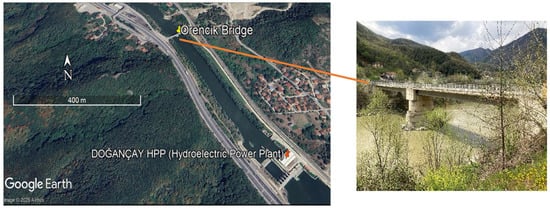
Figure 1.
Örencik Bridge and Doğançay HPP I.
2.1. Station Design
The real-time river monitoring station comprises an ultrasonic liquid level sensor, a Sim 800 L GSM module, a 12-volt 7 Ah battery, a microprocessor card, an RS 485 converter, and an integrated solar panel (see Figure 2). The manufactured station possesses energy independence through an MPPT solar energy control unit and battery group, eliminating the need for an external power supply. The manufactured station can perform river level measurements within the desired timing period. The measurement data obtained can be transmitted to a central server using cellular communication infrastructure.
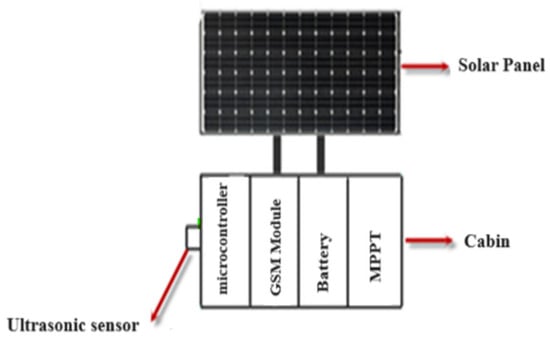
Figure 2.
Real-Time River Monitoring Station Components.
The station’s electronic components are housed within a waterproof cabin to ensure protection from environmental conditions. The energy required for operation is supplied by a solar panel integrated into the top of the cabin. Direct current electricity generated by the solar panel is transferred to gel batteries via an MPPT regulator. This setup ensures continuous and uninterrupted operation of components such as the microcontroller, ultrasonic sensor, and a GSM module without external power sources. The solar panel is positioned at a 38-degree angle, optimized for the solar radiation conditions of the Sakarya region, maximizing energy capture throughout the year.
The energy requirements of the system have been carefully calculated. The ultrasonic sensor consumes 1.2 Wh per hour, while other components, including the microcontroller and a GSM module, consume 4 Wh per hour, resulting in a total system consumption of 5.2 Wh per hour. To ensure uninterrupted operation for one week, the system requires 873.6 Wh of energy (168 h × 5.2 Wh). The integrated 12 V, 72 Ah battery is sufficient to meet this demand, allowing the station to function reliably even under low sunlight conditions.
To securely mount the ultrasonic sensor, a custom-designed cradle was developed to ensure stable placement and protection against external interferences. The cradle design allows for easy removal, when necessary, while ensuring the measurement area remains unobstructed. Figure 3 illustrates the station’s schematic and fabricated designs, highlighting the optimized placement of the sensor and the solar panel orientation.
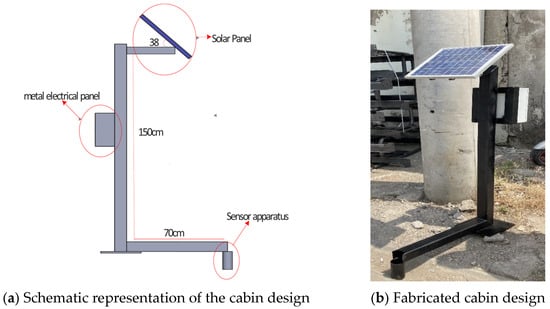
Figure 3.
Cabin Design.
2.2. Software and Connections
The communication module of the River monitoring station has been programmed using an Arduino program that interacts with sensors, utilizing PHP get functions. Arduino is an open-source development platform with an open library that allows processing of both digital and analog signals [30]. The Arduino program takes advantage of its open libraries to handle the communication between the sensors and the River monitoring station, ensuring seamless integration and efficient data processing.
The Arduino program has been employed for the communication module of the river monitoring station’s integrated components (Figure 4).
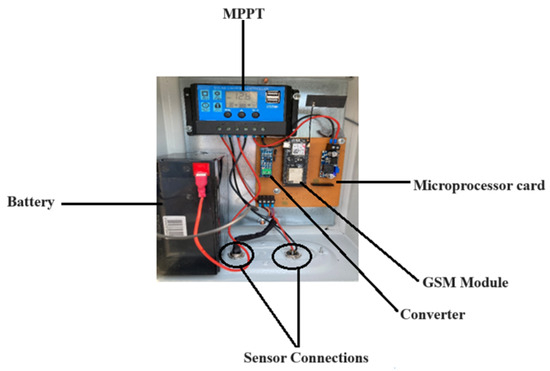
Figure 4.
Monitoring Station Integrated Components.
Through the coding within the program, communication is established with the SIM800 modem, and values read from the sensor are converted and transmitted to the server through the RS485 converter. In the coding, essential libraries, sensor values, server information, and other variable parameters are initially defined. As seen in the Arduino interface in Figure 5, these variables include APN settings, GPRS username and password, SIM card PIN code, and server address.
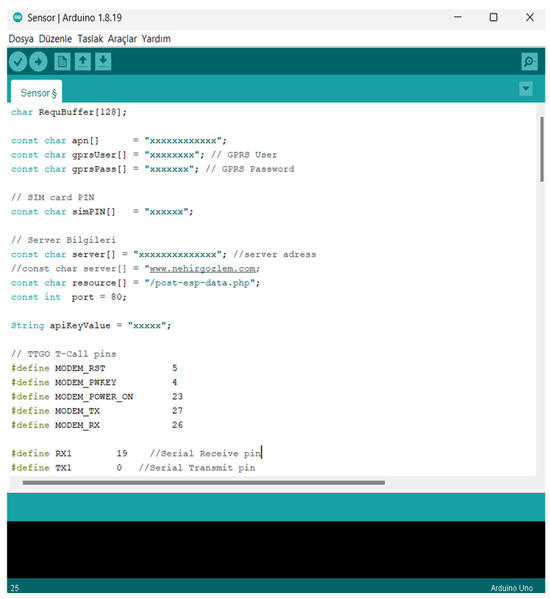
Figure 5.
Arduino Program Interface and Protocols.
The values read from the sensor are processed via RS485 and displayed on the serial port. Then, a GPRS connection is established and sent to the server via HTTP POST request. This request is carried out by the server with PHP get functions (Figure 6). Additionally, when data transfer is successful, the device is put into deep sleep mode with ESP32 and energy is saved. The ESP32 remains in deep sleep mode for a defined duration (set to 1 s in the code), and it wakes up automatically when this time elapses, as managed by a programmed timer.
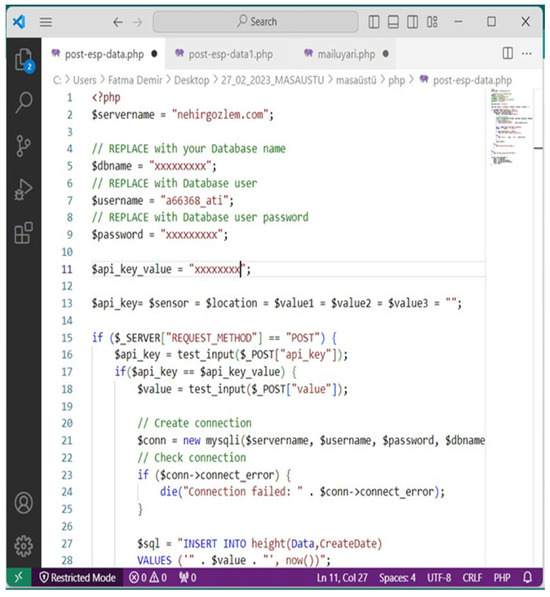
Figure 6.
Php Functions.
Coding and communication protocols were written on the sim 800 L GSM module and ESP32 microcontroller card used in the manufactured system and data flow was provided.
After it was determined that the sensor installed in the system supported RS-485 and MODBUS protocols, MAX485 integration was used for data conversion. The Modbus RTU communication protocol functions used and the distance at which the sensor measures at address 520 specified in the user manual are calculated with the given formula and transferred to the server with RS-485 conversion integration.
The request formulated using the Modbus protocol is as follows:
{0 × 01, 0 × 03, 0 × 02, 0 × 08, 0 × 00, 0 × 01, 0 × 04, 0 × 70}, and it consists of 8 bytes. This includes information such as the sensor’s network address, the command to read the registers, and the starting address of the data to be read.
Byte (0 × 01): The sensor’s network address.
Byte (0 × 03): The command to read the registers.
And 4. Bytes (0 × 02, 0 × 08): The starting address of the data to be read (520).
And 6. Bytes (0 × 00, 0 × 01): The amount of data to be read (1 register).
And 8. Bytes (0 × 04, 0 × 70): Used for error checking.
The read value is converted according to the reference values provided by the sensor manufacturer and transmitted to the server in centimeters. This conversion is carried out using the following formula:
distance = (float)adc0 × 0.013528 × 2.54;
In this formula, distance represents the calculated distance and is given in centimeters (cm). adc0 denotes the raw measurement value obtained from the sensor, provided by the analog-to-digital converter (ADC). The factor 0.013528 is used to convert the ADC value into a distance measurement and is based on the reference values specified in the sensor’s datasheet. Additionally, 2.54 is a multiplier that facilitates the conversion from inches to centimeters, indicating that 1 inch is equivalent to 2.54 cm. This formula ensures that the sensor data are accurately converted into a distance measurement in centimeters and is consistent with the conversion formula specified in the sensor’s datasheet. The calculated distance value is then transmitted to the server following this conversion.
To further illustrate the interaction between the Arduino and the ultrasonic distance sensor, a general flowchart of the connection and data processing steps is provided below (Figure 7).
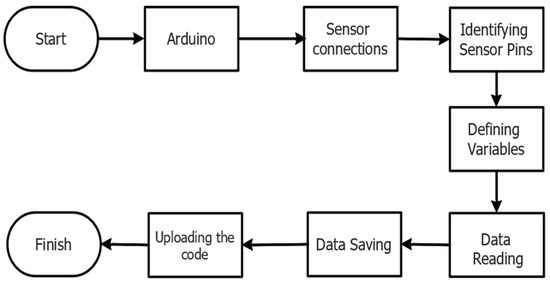
Figure 7.
Arduino–Sensor Connection Flowchart.
2.3. River Monitoring Station Laboratory and Field Calibration
The components and software system of the real-time river monitoring station were integrated and enclosed in a waterproof cabinet to prevent adverse weather effects. Calibration studies were conducted on an open channel at the Hydraulic Laboratory of Sakarya University. During calibration, the distance readings obtained by the sensor were compared directly with manual measurements made using a measuring tape on the water surface. This comparison is crucial for verifying the measurement accuracy of the sensor and making necessary adjustments. Additionally, a web interface designed to monitor and record data from the sensor in real time was utilized.
The web interface was integrated to record, access, and analyze calibration data, allowing for real-time evaluation through remote access. Calibration studies conducted on the open channel in the laboratory environment meticulously integrated manual and automatic measurement techniques for the fabricated discharge monitoring station.
The calibration study of the ultrasonic distance sensor conducted in the laboratory is shown in Figure 8. The figure illustrates the manual measurement of the distance between the sensor and the water surface using a measuring tape, which is then verified with the sensor readings. The manual measurement is recorded as 106.7 cm, corresponding to the 106.76 cm data automatically recorded by the ultrasonic sensor. Data from the sensor are monitored and recorded in real time on a computer screen, playing a critical role in verifying the sensor’s measurements and making necessary calibration adjustments. The consistency between manual measurements and sensor data confirms that the sensor is accurately calibrated and provides reliable data.
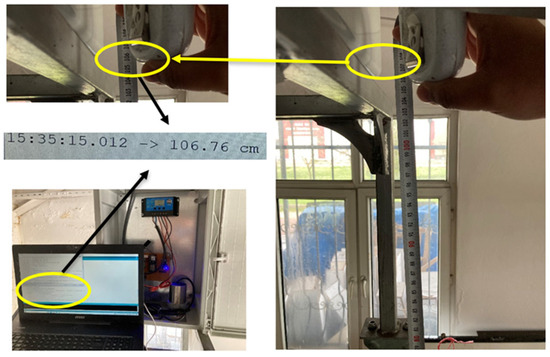
Figure 8.
Laboratory calibration.
Following the laboratory calibration of the river monitoring station, fieldwork was conducted to determine its suitability for field conditions and to identify the effects of external factors. The field calibration studies for the river monitoring station, fabricated using an ultrasonic distance sensor for real-time level readings in rivers, were conducted on the Sakarya River at the pipeline bridge connecting Hanlı village and the Örencik Bridge, where the station will be installed. These studies are illustrated in Figure 9. During the calibration process, the accuracy and response of the sensors to external factors were thoroughly examined through measurements taken on these two bridges.
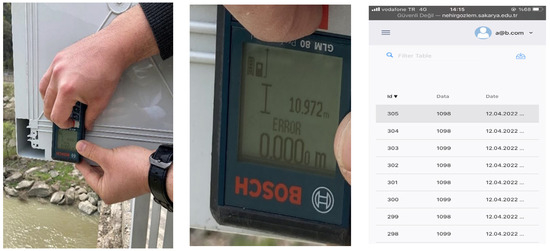
Figure 9.
Field Calibration.
During the validation phase of the calibration, the distance measurements taken by the sensor at the Örencik Bridge and the bridge connecting Hanlı village were monitored via the web interface and compared with laser meter and manual measurements. At the Örencik Bridge, the sensor recorded a distance of 1098 cm, while the laser meter measurement was determined to be 1097 cm; at the Hanlı bridge, the sensor measured 1100 cm, and the manual measurement was recorded as 1099 cm. The close proximity of these measurements (with a 0.1% margin of error) indicates that the sensor settings were correctly adjusted and the calibration was successful.
Following the field study, the sensor was integrated with a protective apparatus to ensure safe and efficient operation, considering the physical conditions of the Örencik Bridge. This protective apparatus is designed to prevent interference with sensor measurements and can be easily removed when necessary.
The real-time river monitoring station was integrated into a compact and waterproof cabinet (30 × 25 × 15 cm) to ensure the secure operation of components and resistance to environmental conditions. The necessary connections for the sensor and solar panel were optimized to guarantee reliable and uninterrupted functionality. The completed design was installed at the designated location, Örencik Bridge, after obtaining the necessary permissions from the Sakarya Metropolitan Municipality (Figure 10). After installation, sensor data were validated by comparing laser meter measurements with the values displayed on the web interface.
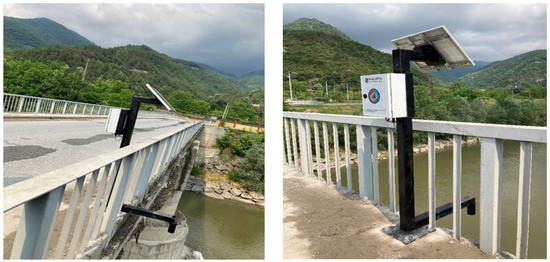
Figure 10.
Real-Time Flow Monitoring Station Cabin Installation.
2.4. Discharge Level Monitoring and Discharge Calculation Integration into the Web System
The river monitoring station installed on the Örencik Bridge over the Sakarya River has been conducting level readings since 13 June 2022. Flow calculations for the Örencik Bridge section are determined using the Manning’s n formula based on the readings taken. The Manning formula is a hydraulic formula used to calculate discharge by utilizing the velocity and cross-sectional area of a flow [31].
The first step in accurately measuring river discharge involves creating a bathymetric map of the river. This map illustrates the underwater topography of the river, showing detailed depth distributions across the riverbed (Figure 11). This map provides critical information about the riverbed’s depths and shapes, which are essential for understanding water flow and distribution [32].
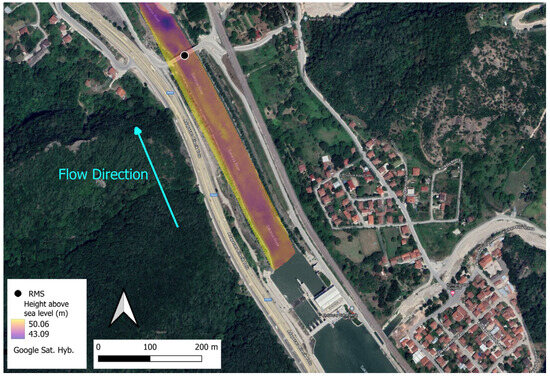
Figure 11.
Topography of the River and RMS (River Monitoring Station) Location.
For determining the cross-section at the Örencik Bridge, both the bathymetric map and the bridge project cross-section were utilized. The bathymetric map depicts the depth and underwater topography of a specific section of the river. Creating a cross-sectional profile involves calculating the wet area and wetted perimeter, which vary with changes in the water level.
Real-time monitoring station installed on the Örencik Bridge measures the distance between the bridge deck and the water surface, facilitating the monitoring of water levels. Figure 12 presents a schematic representation showing the sensor’s placement on the bridge deck along with a Google Earth image of the bridge where the sensor is installed. This visual representation clearly displays the position of the sensor and its placement on the bridge. The calculation of the water level is performed by subtracting the distance from the bridge deck to the water surface from the total distance between the bridge deck and the riverbed.
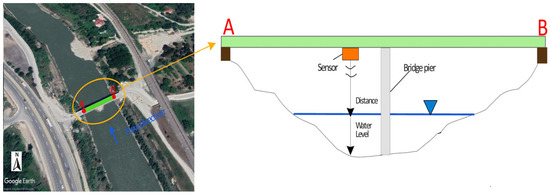
Figure 12.
Schematic Representation of Sensor Placement on Örencik Bridge.
The discharge calculation is performed using Manning’s formula:
Q = 1/n × R2/3 × J1/2 × A
The formula represents the calculation of discharge Q (m3/s), Manning’s roughness coefficient n (m1/3 s−1), the cross-sectional area of the flow A (m2), the hydraulic radius R (m), and the channel slope J (m/m) [31].
Based on field studies and measurements, Manning’s roughness coefficient (n = 0.15) has been determined. Manning’s roughness coefficient represents the resistance of the channel to flow, which is influenced by factors such as channel geometry and flow conditions. In this study, the roughness coefficient was calculated by incorporating field-measured flow data into Manning’s equation and was validated through a comparison of computed discharge values with real-time data obtained from the upstream hydropower plant. Furthermore, this value aligns with the ranges reported in the hydraulic literature for channels with comparable physical and hydraulic characteristics [33]. As a result of this comprehensive assessment, the roughness coefficient (n = 0.15) has been determined.
The channel slope J was determined as 0.0025 at the sensor point. This value was obtained through detailed bathymetric mapping and land surveys conducted across the study area. The slope was calculated by measuring the elevation change over a certain distance along the channel.
The hydraulic radius R for the bridge section was calculated using the wetted area A and wetted perimeter P. The wetted area A was determined by measuring the cross-sectional area of the flow at the bridge section, while the wetted perimeter P was measured as the length of the channel boundary in contact with the water. The hydraulic radius R was computed using the formula R = A/P, where P represents the wetted perimeter. This calculation was used to characterize the flow dynamics within the channel.
The Manning’s formula is used to calculate the discharge, and transfer from a MySQL database to a web page is facilitated through PHP code to ensure visibility This PHP code comprises a class that handles river data-related operations in a web application and a script that processes incoming HTTP requests using this class.
3. Results
3.1. Validation of River Monitoring Station Data
The measured values were compared on an hourly, daily, and monthly basis with the data from Doğançay HPP I, located upstream of the manufactured river monitoring station. The river monitoring station takes two measurements per minute, and all data covering the 2023 hydrological year (1 October 2022–30 September 2023) were analyzed. During the system validation process, hourly, daily, and monthly averages were calculated for both the river monitoring station and the hydropower plant to account for the difference in measurement frequencies. While the river monitoring station produces approximately 2880 data points per day, the hydropower plant generates approximately 144 data points per day by measuring every 10 min. This approach allowed for a balanced and meaningful comparison of the systems during periods with both low- and high-rainfall regimes.
3.1.1. Comparison of Hourly Data
The hourly variations in the river monitoring station data and the HPP data are presented in Figure 13. On 1 May 2023, the hourly average discharge values obtained from HPP were 50.84 m3/s, while the observation station recorded 49.03 m3/s. The hourly averages were computed by taking the mean of the discharge values recorded during each hour. The maximum discharge observed in HPP was 74.24 m3/s, whereas it was 63.54 m3/s in the observation data. The minimum discharge measured in HPP was 37.24 m3/s, compared to the 38.83 m3/s recorded by the observation station. The difference between the two datasets was determined to be 2.4%, with a high correlation value of r2 = 0.92. HPP data are recorded every 10 min, while the observation station records measurements twice every minute. These differences in measurement frequency contribute to variations in discharge values, especially under rapidly changing hydrological conditions.
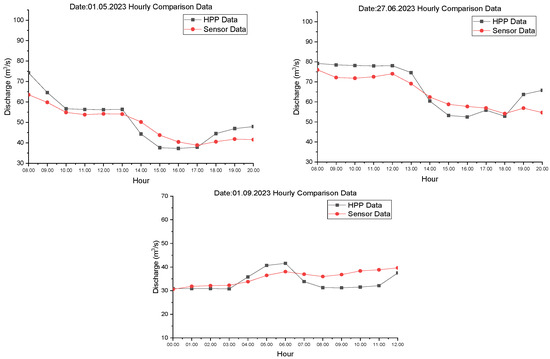
Figure 13.
Comparison of Hourly Discharge Variations.
The data from 27 June and 1 September 2023 show that while the alignment between the HPP and the river monitoring station remains consistent, the differences become slightly more pronounced. On 27 June, the hourly average discharge recorded by the HPP was 61.28 m3/s, while the river monitoring station recorded 60.16 m3/s. The maximum discharge was 79.18 m3/s at the HPP and 75.98 m3/s at the river monitoring station, while the minimum discharge was 52.48 m3/s at the HPP and 54.12 m3/s at the river monitoring station. The difference between the two datasets was calculated to be 2.9%, with a correlation value of r2 = 0.92. On September 1, the differences increased slightly, with the hourly average discharge from the HPP at 32.41 m3/s and the river monitoring station at 33.76 m3/s. The maximum discharge was 41.56 m3/s at the HPP and 39.74 m3/s at the river monitoring station, while the minimum discharge was 30.74 m3/s at the HPP and 30.56 m3/s at the river monitoring station. On this date, the difference between the two datasets was calculated to be 2.7%, with a correlation value of r2 = 0.91.
The differences in measurement frequency, particularly during periods of rapidly increasing or decreasing discharge, become more evident. The less frequent measurements from the HPP make it more difficult to capture sudden changes; however, the overall trend between the two datasets remains consistent. The river monitoring station records higher values than the HPP during periods of rapid discharge increases, which can be attributed to the station’s more frequent data collection. This allows the river monitoring station to capture short-term discharge fluctuations more accurately.
3.1.2. Comparison of Daily Data
Figure 14 shows the comparison of daily average discharge values between HPP and the river monitoring station for the periods of 13–19 March 2023, 15–21 May 2023, and 19–25 June 2023. In the comparison for the period 13–19 March 2023, the weekly average discharge for HPP was 90.70 m3/s, while it was 73.65 m3/s for the observation station. The correlation coefficient between the two datasets was found to be r = 0.99, with a determination coefficient of 97.9%. This high level of agreement indicates the consistency and reliability of the measurements.
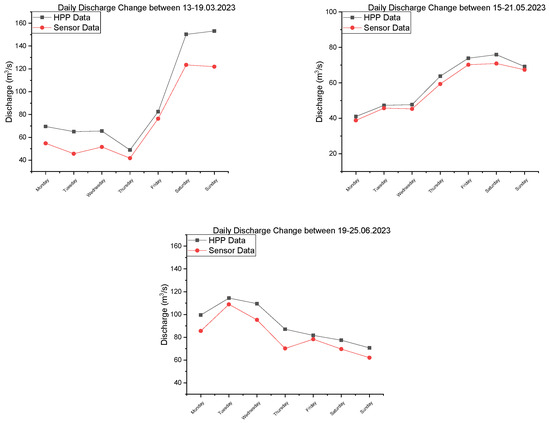
Figure 14.
Comparison of Daily Discharge Variations.
In the comparison for the period 15–21 May 2023, a strong correlation is observed between the HPP data and the river monitoring station. The weekly average discharge for the HPP was recorded as 58.70 m3/s, while for the river monitoring station it was 56.96 m3/s. The maximum discharge values were 75.91 m3/s for the HPP and 70.92 m3/s for the river monitoring station. These results support the accuracy of the river monitoring station data and demonstrate the consistency of the measurements when compared to the HPP data. In the comparison for the period 19–25 June 2023, small differences are observed between the HPP and the river monitoring station. The weekly average discharge for the HPP was 91.61 m3/s, while for the river monitoring station it was 81.99 m3/s. The maximum discharge was 114.41 m3/s for the HPP and 108.89 m3/s for the river monitoring station.
The positioning of the hydroelectric power plant (HPP) approximately 450 m upstream from the river monitoring station, along with dam operations, leads to differences in the discharge values measured at the HPP and the river monitoring station. The processes of retaining water in the reservoir and controlled release back into the river channel by the HPP have a reducing effect on the total measured discharge. These operational differences are fundamental factors in explaining the variations observed between the discharge values measured at the HPP and the river monitoring station, while simultaneously reinforcing the accuracy and reliability of the data provided by the river monitoring station.
3.1.3. Comparison of Monthly Data
Figure 15 shows the comparison of daily average discharge values between HPP and the river monitoring station for May 2023 and August 2023. During May 2023, the daily average discharge for HPP ranged between 41.02 m3/s and 118.73 m3/s, while for the river monitoring station, it varied between 38.81 m3/s and 103.08 m3/s. The correlation coefficient between the two datasets was calculated as 0.92, indicating a high level of agreement. In August 2023, the daily average discharge for HPP was approximately 32 m3/s, while for the river monitoring station, it was approximately 31.5 m3/s. The correlation coefficient was calculated as 0.85, showing a strong linear relationship between the datasets. Notably, significant discrepancies were observed between 16–20 August, primarily due to water retention operations and sudden releases for electricity generation at the dam. The average absolute error during this period was approximately 1.5 m3/s, and the root mean square error was 2 m3/s. The strong agreement observed during both periods reinforces the accuracy of the river monitoring station’s measurements.
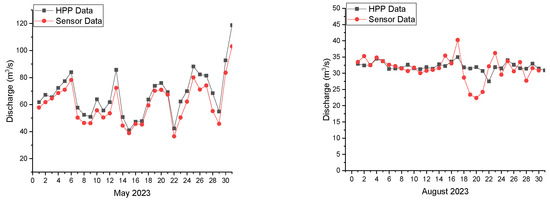
Figure 15.
Comparison of Monthly Discharge Variations.
3.2. Evaluation of 2023 Hydrological Year Real-Time Monitoring Station Data
During the verification process of data obtained from real-time monitoring stations, precipitation data serve as a critical reference point. The increase or decrease in precipitation amounts is directly correlated with the river water level and discharge measurements. This verification process allows for a clear understanding of the correlation between precipitation and river flow, serving as an important method for confirming the accuracy of measurement data. Consequently, the reliability of data from monitoring stations is enhanced, and hydrological models can yield more accurate results.
The daily precipitation data from the General Directorate of Meteorology’s 17,662 meteorological station were compared with the discharge measurements obtained from the real-time river monitoring station. This comparison, as shown in Figure 16, evaluates the sensitivity of the monitoring station data to precipitation changes and the consistency of the relationship between these datasets.
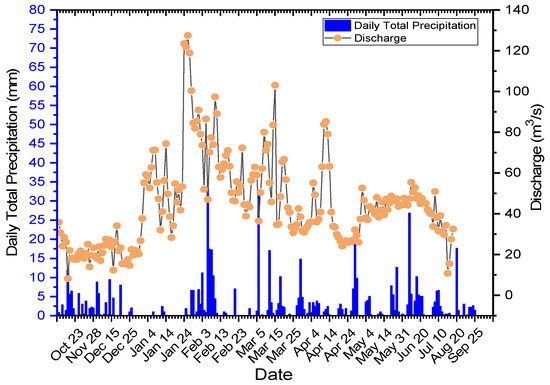
Figure 16.
River Monitoring Station 2023 Hydrological Year Discharge Variation and Daily Total Precipitation.
The analysis reveals a significant increase in discharge values during periods of increased precipitation. Notably, the increase in discharge recorded during the precipitation rise in June 2023 provides strong evidence supporting the accuracy and reliability of these data. These findings demonstrate that the measurements obtained from the monitoring station are consistent with the regional meteorological conditions and align well with the basin’s characteristics.
The impact of runoff from precipitation events on river discharge becomes evident in the subsequent rise of discharge values, as reflected in the hydrograph. This pattern becomes more pronounced in the days following rainfall, and the rise in discharge levels further reinforces the accuracy of the monitoring station’s data. While cumulative precipitation is valuable for capturing long-term hydrological trends, the use of daily precipitation data, considering the basin’s characteristics, provides a clearer insight into the system’s short-term discharge responses. These data are used to more accurately capture the short-term variations in discharge and water levels through real-time monitoring.
The water level measurements obtained from the real-time monitoring station were compared with the daily total precipitation, as shown in Figure 17. Increases in water level observed during periods of increased precipitation are significant indicators supporting the accuracy of these data.
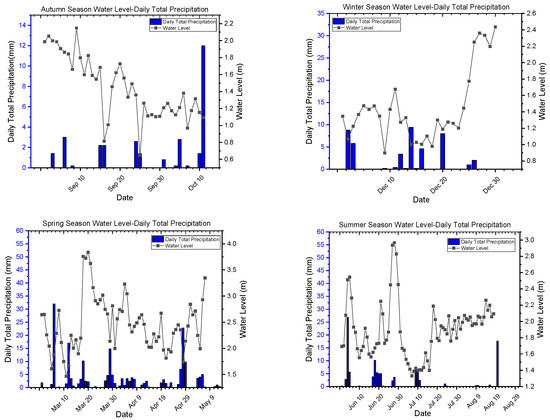
Figure 17.
Seasonal Water Level Variation in River Monitoring Station and Daily Total Precipitation.
Especially during periods of intense rainfall, increases in water level values can be observed. For instance, in the autumn months, when the amount of precipitation increases, the discharge and water level also rise. This indicates how responsive the basin is to changes in precipitation amounts and demonstrates how well the real-time monitoring station measurement data align with basin characteristics. Figure 17 illustrates how the daily water levels obtained from the river monitoring station varied across different seasons between September 2022 and August 2023. During the winter months, the water level generally ranges between 1.5 m and 3 m, while in the summer months, it mainly fluctuates between 1.5 m and 2.5 m. The frequent fluctuations of water level between 1 m and 3 m in the spring indicate the impact of melting snow and seasonal precipitation. In autumn, similar fluctuation patterns to those in summer are observed, but the water level in winter shows higher averages.
The delayed inclusion of runoff into the river following precipitation is clearly observed through increases in the hydrograph. This becomes more evident in the days after the rainfall, where the rise in water levels further reinforces the accuracy of the monitoring station’s data. While cumulative precipitation is useful for assessing long-term trends, daily precipitation data, particularly considering the characteristics of the basin and the retention capacity of the dam, allows for a more precise analysis of the system’s short-term responses. Therefore, daily precipitation totals were utilized to more accurately reflect short-term variations in water levels.
Figure 18 presents the seasonal variation in daily average discharges obtained from the real-time monitoring station between September 2022 and August 2023. The sharp peaks in seasonal variation are explained by the daily total precipitation changes. The annual average discharge value of the real-time monitoring station was calculated to be 50.71 m3/s and has been added to the graphs as a comparison axis.
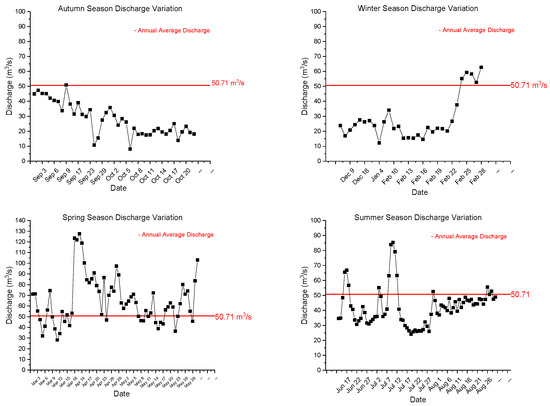
Figure 18.
Seasonal Discharge Variation In River Monitoring Station.
During the winter months, discharge values generally range between 20 m3/s and 70 m3/s, often remaining below the annual average discharge value. However, significant increases in discharge levels are observed in January and February, corresponding with increased precipitation during this period, leading to discharge values occasionally exceeding the average.
In the summer months, discharge values fluctuate between 30 m3/s and 90 m3/s, with a notable decline in July and August. This decrease in discharge levels corresponds to a reduction in precipitation, with values typically falling below the annual average. In spring, discharge values fluctuate widely, ranging from 30 m3/s to 130 m3/s. In March and April, the discharge levels generally exceed the annual average, driven by increased precipitation. This period marks the highest discharge levels observed throughout the year.
Overall, the discharge measurements obtained from the monitoring station generally align with seasonal precipitation changes, either remaining below or exceeding the annual average as dictated by these variations. This indicates the station’s capacity to accurately represent the underlying hydrological processes. Furthermore, the consistency of the discharge data with the annual average values reaffirms the accuracy and reliability of the measurements obtained from this station.
3.3. Real-Time River Monitoring Station and Early Warning System
The real-time river monitoring station continuously and accurately measures the river’s water level using ultrasonic sensors. These data are transmitted to a server via the internet using microcontroller and IoT (Internet of Things) technology.
Connections established using the PHP programming language process the data collected from the sensors and store them in a database. The data stored on the server are analyzed by computation files and displayed on a web page. This web interface allows users to easily access the data and provides real-time information.
On the web page, measurements are displayed in real time with date and time information. The discharge value is calculated in cubic meters (m3/s), and the river depth is provided in meters. Additionally, the maximum and minimum discharge and river depth values for the last 1 day, 7 days, and 1 month can be viewed in real time. The data monitoring system is also available on a separate website, where the data sent to the server can be viewed and downloaded in various formats such as Excel and PDF.
The primary goal of the real-time river monitoring station is to detect flood risks early and promptly warn relevant parties. When the water level exceeds a certain threshold, the system automatically sends alerts. The values read by the ultrasonic sensor are processed, and emergency alerts are sent to predefined email addresses based on the level of risk. The web interface can be accessed at https://nehirgozlem.com/.
4. Discussion
The real-time river monitoring station represents a significant innovation in environmental monitoring technologies, providing accurate and continuous measurements of river water levels. This system transmits measurement data to a server via the internet using microcontroller and Internet of Things (IoT) technology. The design, functionality, and application potential of the system are assessed based on its energy independence, integration of advanced technologies, communication and software infrastructure, and calibration processes.
One of the most remarkable features of the monitoring station is its energy independence. The integration of a solar panel and Maximum Power Point Tracking (MPPT) solar energy control unit allows the system to operate autonomously without the need for an external power source [34]. This design reduces operational costs and enhances the system’s reliability in remote or off-grid areas. The ability of the system to function for approximately a week solely on battery power, even without solar input, demonstrates its durability and robustness under varying weather conditions. This feature provides significant advantages in terms of sustainability and uninterrupted data collection, which are critical for effective environmental monitoring.
The ultrasonic liquid level sensor used in the system ensures high accuracy in water level measurements [35]. This sensor can measure river levels at specified intervals and transmit the data to a central server via the GSM module. The use of an RS485 converter for data processing and transmission further enhances the reliability and accuracy of the data flow. The communication module of the monitoring station is programmed using the Arduino platform to interact with the sensors. Arduino’s open-source libraries facilitate efficient communication and data processing between the sensors and the river monitoring Station. The program establishes communication with the SIM800 modem, converts sensor readings, and transmits the data to the server via the RS485 converter. Key variables such as APN settings, GPRS credentials, SIM card PIN code, and server address are defined within the Arduino interface, ensuring seamless data transmission and processing.
Calibration studies were conducted in both laboratory and field environments to ensure the accuracy and reliability of sensor readings. In the laboratory, the sensor’s distance readings were compared with manual measurements, validating the sensor’s accuracy and enabling necessary adjustments. The integration of a web interface facilitated real-time monitoring and recording of calibration data, allowing for remote evaluation. Field calibration was performed by installing the station on the Örencik Bridge over the Sakarya River. The sensor’s measurements were validated against laser meter and manual measurements, demonstrating high accuracy with minimal error margin. This validation confirmed the sensor’s reliability under external environmental conditions.
The software infrastructure of the system plays a crucial role in data processing and accessibility [36]. Data collected from the sensors are processed using connections established through the PHP programming language and stored in a database. These data are analyzed and displayed on a web interface, allowing users to easily access real-time information. Measurements are presented with date and time information, and discharge values are calculated in cubic meters per second (m3/s), with river depth provided in meters. Additionally, maximum and minimum discharge and river depth values for the last day, week, and month can be viewed in real time. A separate website allows users to view and download data in various formats such as Excel and PDF.
The primary objective of the real-time river monitoring station is to detect flood risks early and promptly warn relevant parties. When the water level exceeds a certain threshold, the system automatically sends alerts. The values read by the ultrasonic sensor are processed, and emergency alerts are sent to predefined email addresses based on the level of risk. This functionality is crucial for flood prevention and response, providing timely information to mitigate potential damage.
As missing data management is an important research topic in hydrology and water resources, the performance of the proposed system has also been evaluated in cases of missing data. In the current study, data loss during the data collection process is very limited. However, in the case of rare data losses, the system’s resilience is maintained, and data reliability is enhanced. Minor discrepancies in discharge values were mitigated through optimized measurement intervals, with the system performing two measurements per minute to improve data accuracy and continuity. Future studies are planned to address missing data by integrating statistical methods and artificial intelligence-based approaches to ensure a more robust data management system. These enhancements, along with the system’s ability to address minor discrepancies in discharge values, underline its potential as a reliable tool for river level monitoring.
5. Conclusions
In this study, a real-time river monitoring station was designed and implemented to provide continuous monitoring of river water levels, offering a reliable and energy-independent solution for environmental monitoring. The system’s capabilities were validated through comprehensive calibration and testing, ensuring its accuracy and effectiveness in real-world applications.
- The real-time river monitoring station provides a robust and sustainable solution for continuous river level monitoring, integrating solar-powered energy independence and advanced IoT communication technologies.
- Calibration and validation studies conducted in both laboratory and field environments confirmed the sensor’s high measurement accuracy, with error margins within 0.1%, ensuring reliability for long-term monitoring applications.
- Validation against upstream hydropower plant (HPP) data demonstrated high correlation (r2 = 0.92) and confirmed the accuracy of the system’s measurements in real-world conditions. This high degree of consistency between the station and HPP data reinforces the station’s reliability in monitoring river water levels and discharge.
- The system’s capability to operate autonomously for up to one week without solar input highlights its resilience and adaptability to remote or poorly infrastructured locations.
- Real-time data sharing and accessibility through an open-access web interface allow users to monitor, download, and analyze measurements in various formats, supporting effective water resource management and flood prevention.
- The early warning system, triggered by ultrasonic sensor readings, provides timely alerts to relevant authorities, significantly enhancing flood risk management and disaster preparedness efforts.
- Minimal data loss during operation has been mitigated through optimized measurement intervals, with future enhancements planned to integrate artificial intelligence and statistical methods for even greater data reliability.
- The system’s flexible design allows for scalability and adaptation to various geographic and climatic conditions, making it a model for similar environmental monitoring projects worldwide.
- By addressing the limitations of existing methods, the system offers a practical and innovative tool for advancing flood risk management, water resource planning, and environmental sustainability.
Overall, the results of this study demonstrate that the real-time river monitoring station is an effective and adaptable solution for environmental monitoring. Its successful implementation and validation underline its potential to contribute to water resource management, disaster risk reduction, and sustainability efforts on a global scale.
Author Contributions
Conceptualization, F.D. and O.S.; methodology, F.D. and O.S.; software, F.D.; validation, O.S.; writing—preparation of the original draft, F.D.; writing—review and editing, O.S.; visualization, F.D. All authors have read and agreed to the published version of the manuscript.
Funding
This study was supported by the Sakarya University Scientific Research Projects Unit under project number 2016-50-02-16.
Institutional Review Board Statement
Not applicable.
Informed Consent Statement
Not applicable.
Data Availability Statement
Data is contained within the article.
Acknowledgments
We would like to appreciate Akfen Renewable Energy for their assistance in providing data for our study.
Conflicts of Interest
The authors declare no conflicts of interest.
References
- Myhre, G.; Alterskjær, K.; Stjern, C.W.; Hodnebrog, Ø.; Marelle, L.; Samset, B.H.; Sillmann, J.; Schaller, N.; Fischer, E.; Schulz, M.; et al. Frequency of Extreme Precipitation Increases Extensively with Event Rareness under Global Warming. Sci. Rep. 2019, 9, 16063. [Google Scholar] [CrossRef] [PubMed]
- Lin, Y.N.; Yun, S.-H.; Bhardwaj, A.; Hill, E.M. Urban Flood Detection with Sentinel-1 Multi-Temporal Synthetic Aperture Radar (SAR) Observations in a Bayesian Framework: A Case Study for Hurricane Matthew. Remote Sens. 2019, 11, 1778. [Google Scholar] [CrossRef]
- Zhang, W.; Wang, X.; Liu, Y.; Zhang, T. Retracted: Simulation of Rainstorm Waterlogging Based on SWMM and Visualization Module Research. In Proceedings of the 2016 International Conference on Smart City and Systems Engineering (ICSCSE), Hunan, China, 25–26 November 2016; pp. 394–397. [Google Scholar]
- Kundzewicz, Z.W.; Kanae, S.; Seneviratne, S.I.; Handmer, J.; Nicholls, N.; Peduzzi, P.; Mechler, R.; Bouwer, L.M.; Arnell, N.; Mach, K.; et al. Flood Risk and Climate Change: Global and Regional Perspectives. Hydrol. Sci. J. 2014, 59, 1–28. [Google Scholar] [CrossRef]
- Hussain Shah, S.M.; Yassin, M.A.; Abba, S.I.; Lawal, D.U.; Hussein Al-Qadami, E.H.; Teo, F.Y.; Mustaffa, Z.; Aljundi, I.H. Flood Risk and Vulnerability from a Changing Climate Perspective: An Overview Focusing on Flash Floods and Associated Hazards in Jeddah. Water 2023, 15, 3641. [Google Scholar] [CrossRef]
- Zalnezhad, A.; Rahman, A.; Nasiri, N.; Haddad, K.; Rahman, M.M.; Vafakhah, M.; Samali, B.; Ahamed, F. Artificial Intelligence-Based Regional Flood Frequency Analysis Methods: A Scoping Review. Water 2022, 14, 2677. [Google Scholar] [CrossRef]
- Cappato, A.; Baker, E.A.; Reali, A.; Todeschini, S.; Manenti, S. The Role of Modeling Scheme and Model Input Factors Uncertainty in the Analysis and Mitigation of Backwater Induced Urban Flood-Risk. J. Hydrol. 2022, 614, 128545. [Google Scholar] [CrossRef]
- Furquim, G.; Filho, G.; Jalali, R.; Pessin, G.; Pazzi, R.; Ueyama, J. How to Improve Fault Tolerance in Disaster Predictions: A Case Study about Flash Floods Using IoT, ML and Real Data. Sensors 2018, 18, 907. [Google Scholar] [CrossRef]
- Lo, S.-W.; Wu, J.-H.; Lin, F.-P.; Hsu, C.-H. Visual Sensing for Urban Flood Monitoring. Sensors 2015, 15, 20006–20029. [Google Scholar] [CrossRef]
- Muñoz, P.; Orellana-Alvear, J.; Bendix, J.; Feyen, J.; Célleri, R. Flood Early Warning Systems Using Machine Learning Techniques: The Case of the Tomebamba Catchment at the Southern Andes of Ecuador. Hydrology 2021, 8, 183. [Google Scholar] [CrossRef]
- Krzhizhanovskaya, V.V.; Shirshov, G.S.; Melnikova, N.B.; Belleman, R.G.; Rusadi, F.I.; Broekhuijsen, B.J.; Gouldby, B.P.; Lhomme, J.; Balis, B.; Bubak, M.; et al. Flood Early Warning System: Design, Implementation and Computational Modules. Procedia Comput. Sci. 2011, 4, 106–115. [Google Scholar] [CrossRef]
- Mosavi, A.; Ozturk, P.; Chau, K. Flood Prediction Using Machine Learning Models: Literature Review. Water 2018, 10, 1536. [Google Scholar] [CrossRef]
- Mason, D.C.; Dance, S.L.; Cloke, H.L. Floodwater Detection in Urban Areas Using Sentinel-1 and WorldDEM Data. J. Appl. Remote Sens. 2021, 15, 032003. [Google Scholar] [CrossRef]
- McCallum, I.; Liu, W.; See, L.; Mechler, R.; Keating, A.; Hochrainer-Stigler, S.; Mochizuki, J.; Fritz, S.; Dugar, S.; Arestegui, M.; et al. Technologies to Support Community Flood Disaster Risk Reduction. Int. J. Disaster Risk Sci. 2016, 7, 198–204. [Google Scholar] [CrossRef]
- Arshad, B.; Ogie, R.; Barthelemy, J.; Pradhan, B.; Verstaevel, N.; Perez, P. Computer Vision and IoT-Based Sensors in Flood Monitoring and Mapping: A Systematic Review. Sensors 2019, 19, 5012. [Google Scholar] [CrossRef]
- Schumann, G. Preface: Remote Sensing in Flood Monitoring and Management. Remote Sens. 2015, 7, 17013–17015. [Google Scholar] [CrossRef]
- Prafanto, A.; Budiman, E. A Water Level Detection: IoT Platform Based on Wireless Sensor Network. In Proceedings of the 2018 2nd East Indonesia Conference on Computer and Information Technology (EIConCIT), Makassar, Indonesia, 6–7 November 2018; pp. 46–49. [Google Scholar]
- Siddula, S.S.; Jain, P.C.; Upadhayay, M.D. Real Time Monitoring and Controlling of Water Level in Dams Using IoT. In Proceedings of the 2018 IEEE 8th International Advance Computing Conference (IACC), Greater Noida, India, 14–15 December 2018; pp. 14–19. [Google Scholar]
- Guo, Z.; Leitão, J.P.; Simões, N.E.; Moosavi, V. Data-driven Flood Emulation: Speeding up Urban Flood Predictions by Deep Convolutional Neural Networks. J. Flood Risk Manag. 2021, 14, e12684. [Google Scholar] [CrossRef]
- Martinis, S.; Kersten, J.; Twele, A. A Fully Automated TerraSAR-X Based Flood Service. ISPRS J. Photogramm. Remote Sens. 2015, 104, 203–212. [Google Scholar] [CrossRef]
- Rony, J.H.; Karim, N.; Rouf, M.D.A.; Islam, M.d.M.; Uddin, J.; Begum, M. A Cost-Effective IoT Model for a Smart Sewerage Management System Using Sensors. J 2021, 4, 356–366. [Google Scholar] [CrossRef]
- Koestoer, R.A.; Pancasaputra, N.; Roihan, I.; Harinaldi, H. A Simple Calibration Methods of Relative Humidity Sensor DHT22 for Tropical Climates Based on Arduino Data Acquisition System. AIP Conf. Proc. 2019, 2062, 020009. [Google Scholar] [CrossRef]
- Mohd Sabre, M.S.; Abdullah, S.S.; Faruq, A. Flood Warning and Monitoring System Utilizing Internet of Things Technology. Kinet. Game Technol. Inf. Syst. Comput. Netw. Comput. Electron. Control 2019, 4, 287–296. [Google Scholar] [CrossRef][Green Version]
- Devaraj Sheshu, E.; Manjunath, N.; Karthik, S.; Akash, U. Implementation of Flood Warning System Using IoT. In Proceedings of the 2018 Second International Conference on Green Computing and Internet of Things (ICGCIoT), Bangalore, India, 16–18 August 2018; pp. 445–448. [Google Scholar]
- Zeng, F.; Pang, C.; Tang, H. Sensors on the Internet of Things Systems for Urban Disaster Management: A Systematic Literature Review. Sensors 2023, 23, 7475. [Google Scholar] [CrossRef] [PubMed]
- Schroeder, R.; McDonald, K.; Chapman, B.; Jensen, K.; Podest, E.; Tessler, Z.; Bohn, T.; Zimmermann, R. Development and Evaluation of a Multi-Year Fractional Surface Water Data Set Derived from Active/Passive Microwave Remote Sensing Data. Remote Sens. 2015, 7, 16688–16732. [Google Scholar] [CrossRef]
- Hayder, I.M.; Al-Amiedy, T.A.; Ghaban, W.; Saeed, F.; Nasser, M.; Al-Ali, G.A.; Younis, H.A. An Intelligent Early Flood Forecasting and Prediction Leveraging Machine and Deep Learning Algorithms with Advanced Alert System. Processes 2023, 11, 481. [Google Scholar] [CrossRef]
- Li, L.; Xu, H.; Chen, X.; Simonovic, S.P. Streamflow Forecast and Reservoir Operation Performance Assessment Under Climate Change. Water Resour. Manag. 2010, 24, 83–104. [Google Scholar] [CrossRef]
- Acosta-Coll, M.; Ballester-Merelo, F.; Martinez-Peiró, M.; De la Hoz-Franco, E. Real-Time Early Warning System Design for Pluvial Flash Floods—A Review. Sensors 2018, 18, 2255. [Google Scholar] [CrossRef]
- Çavuş, V.; Tuna, R.; Duran, İ.U. Arduino Devreleri Için Kod Üretme ve Veri İşleme Uygulaması Tasarımın. Muş Alparslan Üniversitesi Fen Bilim. Derg. 2017, 5, 387. [Google Scholar] [CrossRef]
- Chow, V. Te Open-Channel Hydraulics; McGraw-Hill Book Company: New York, NY, USA, 1959. [Google Scholar]
- Smith, W.H.F.; Sandwell, D.T. Global Sea Floor Topography from Satellite Altimetry and Ship Depth Soundings. Science 1997, 277, 1956–1962. [Google Scholar] [CrossRef]
- Cruise, J.F.; Sherif, M.M.; Singh, V.P. Elementary Hydraulics; Cengage Learning: Boston, MA, USA, 2007; p. 334. ISBN 978-0-534-49483-4. [Google Scholar]
- Boutahir, M.K.; Farhaoui, Y.; Azrour, M.; Sedik, A.; Nasralla, M.M. Advancing Solar Power Forecasting: Integrating Boosting Cascade Forest and Multi-Class-Grained Scanning for Enhanced Precision. Sustainability 2024, 16, 7462. [Google Scholar] [CrossRef]
- Zulkifli, C.Z.; Garfan, S.; Talal, M.; Alamoodi, A.H.; Alamleh, A.; Ahmaro, I.Y.Y.; Sulaiman, S.; Ibrahim, A.B.; Zaidan, B.B.; Ismail, A.R.; et al. IoT-Based Water Monitoring Systems: A Systematic Review. Water 2022, 14, 3621. [Google Scholar] [CrossRef]
- Ullo, S.L.; Sinha, G.R. Advances in Smart Environment Monitoring Systems Using IoT and Sensors. Sensors 2020, 20, 3113. [Google Scholar] [CrossRef]
Disclaimer/Publisher’s Note: The statements, opinions and data contained in all publications are solely those of the individual author(s) and contributor(s) and not of MDPI and/or the editor(s). MDPI and/or the editor(s) disclaim responsibility for any injury to people or property resulting from any ideas, methods, instructions or products referred to in the content. |
© 2025 by the authors. Licensee MDPI, Basel, Switzerland. This article is an open access article distributed under the terms and conditions of the Creative Commons Attribution (CC BY) license (https://creativecommons.org/licenses/by/4.0/).