
Attitude-Predictive Control of Large-Diameter Shield Tunneling: PCA-SVR Machine Learning Algorithm Application in a Case Study of the Zhuhai Xingye Express Tunnel


Abstract
1. Introduction
2. Methodology
2.1. Support Vector Regression Model
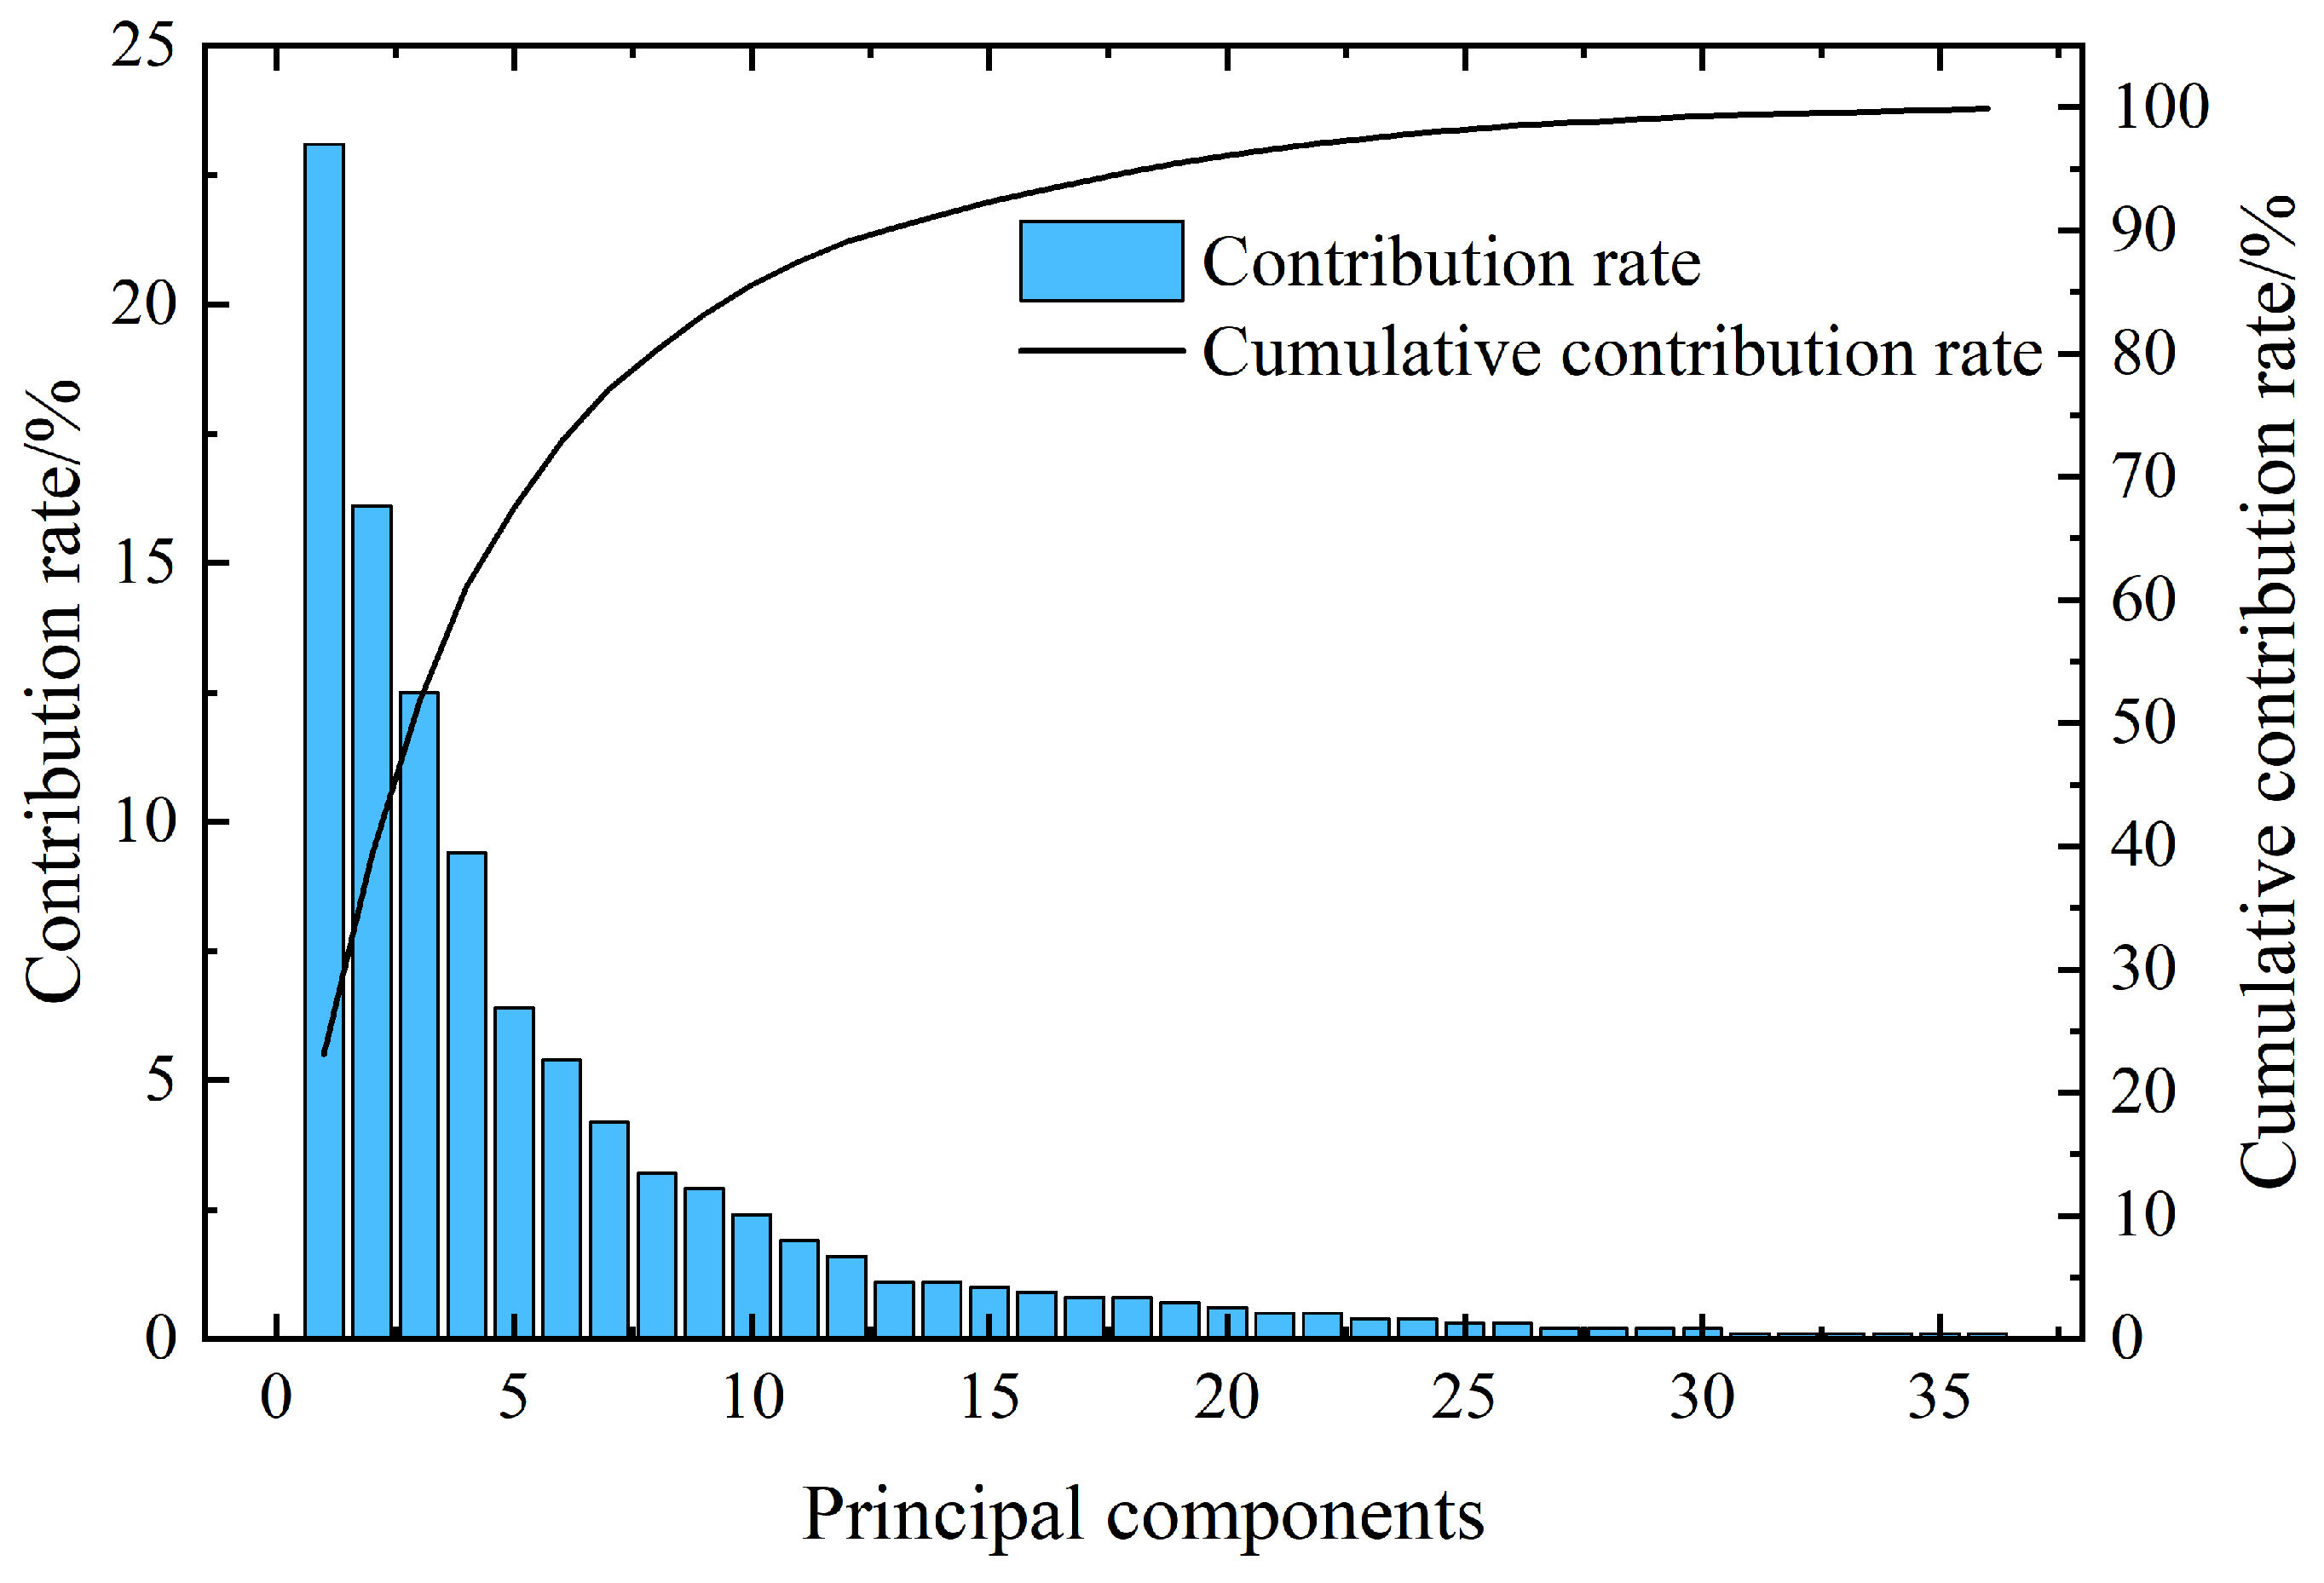
2.2. Principal Component Analysis
2.3. Evaluation Index
3. Case Study
3.1. Project Background
3.2. Data Preprocessing
3.3. Input and Output Variable Selection
4. Analysis of Attitude-Prediction Results
4.1. Model Implementation and Parameter Processing
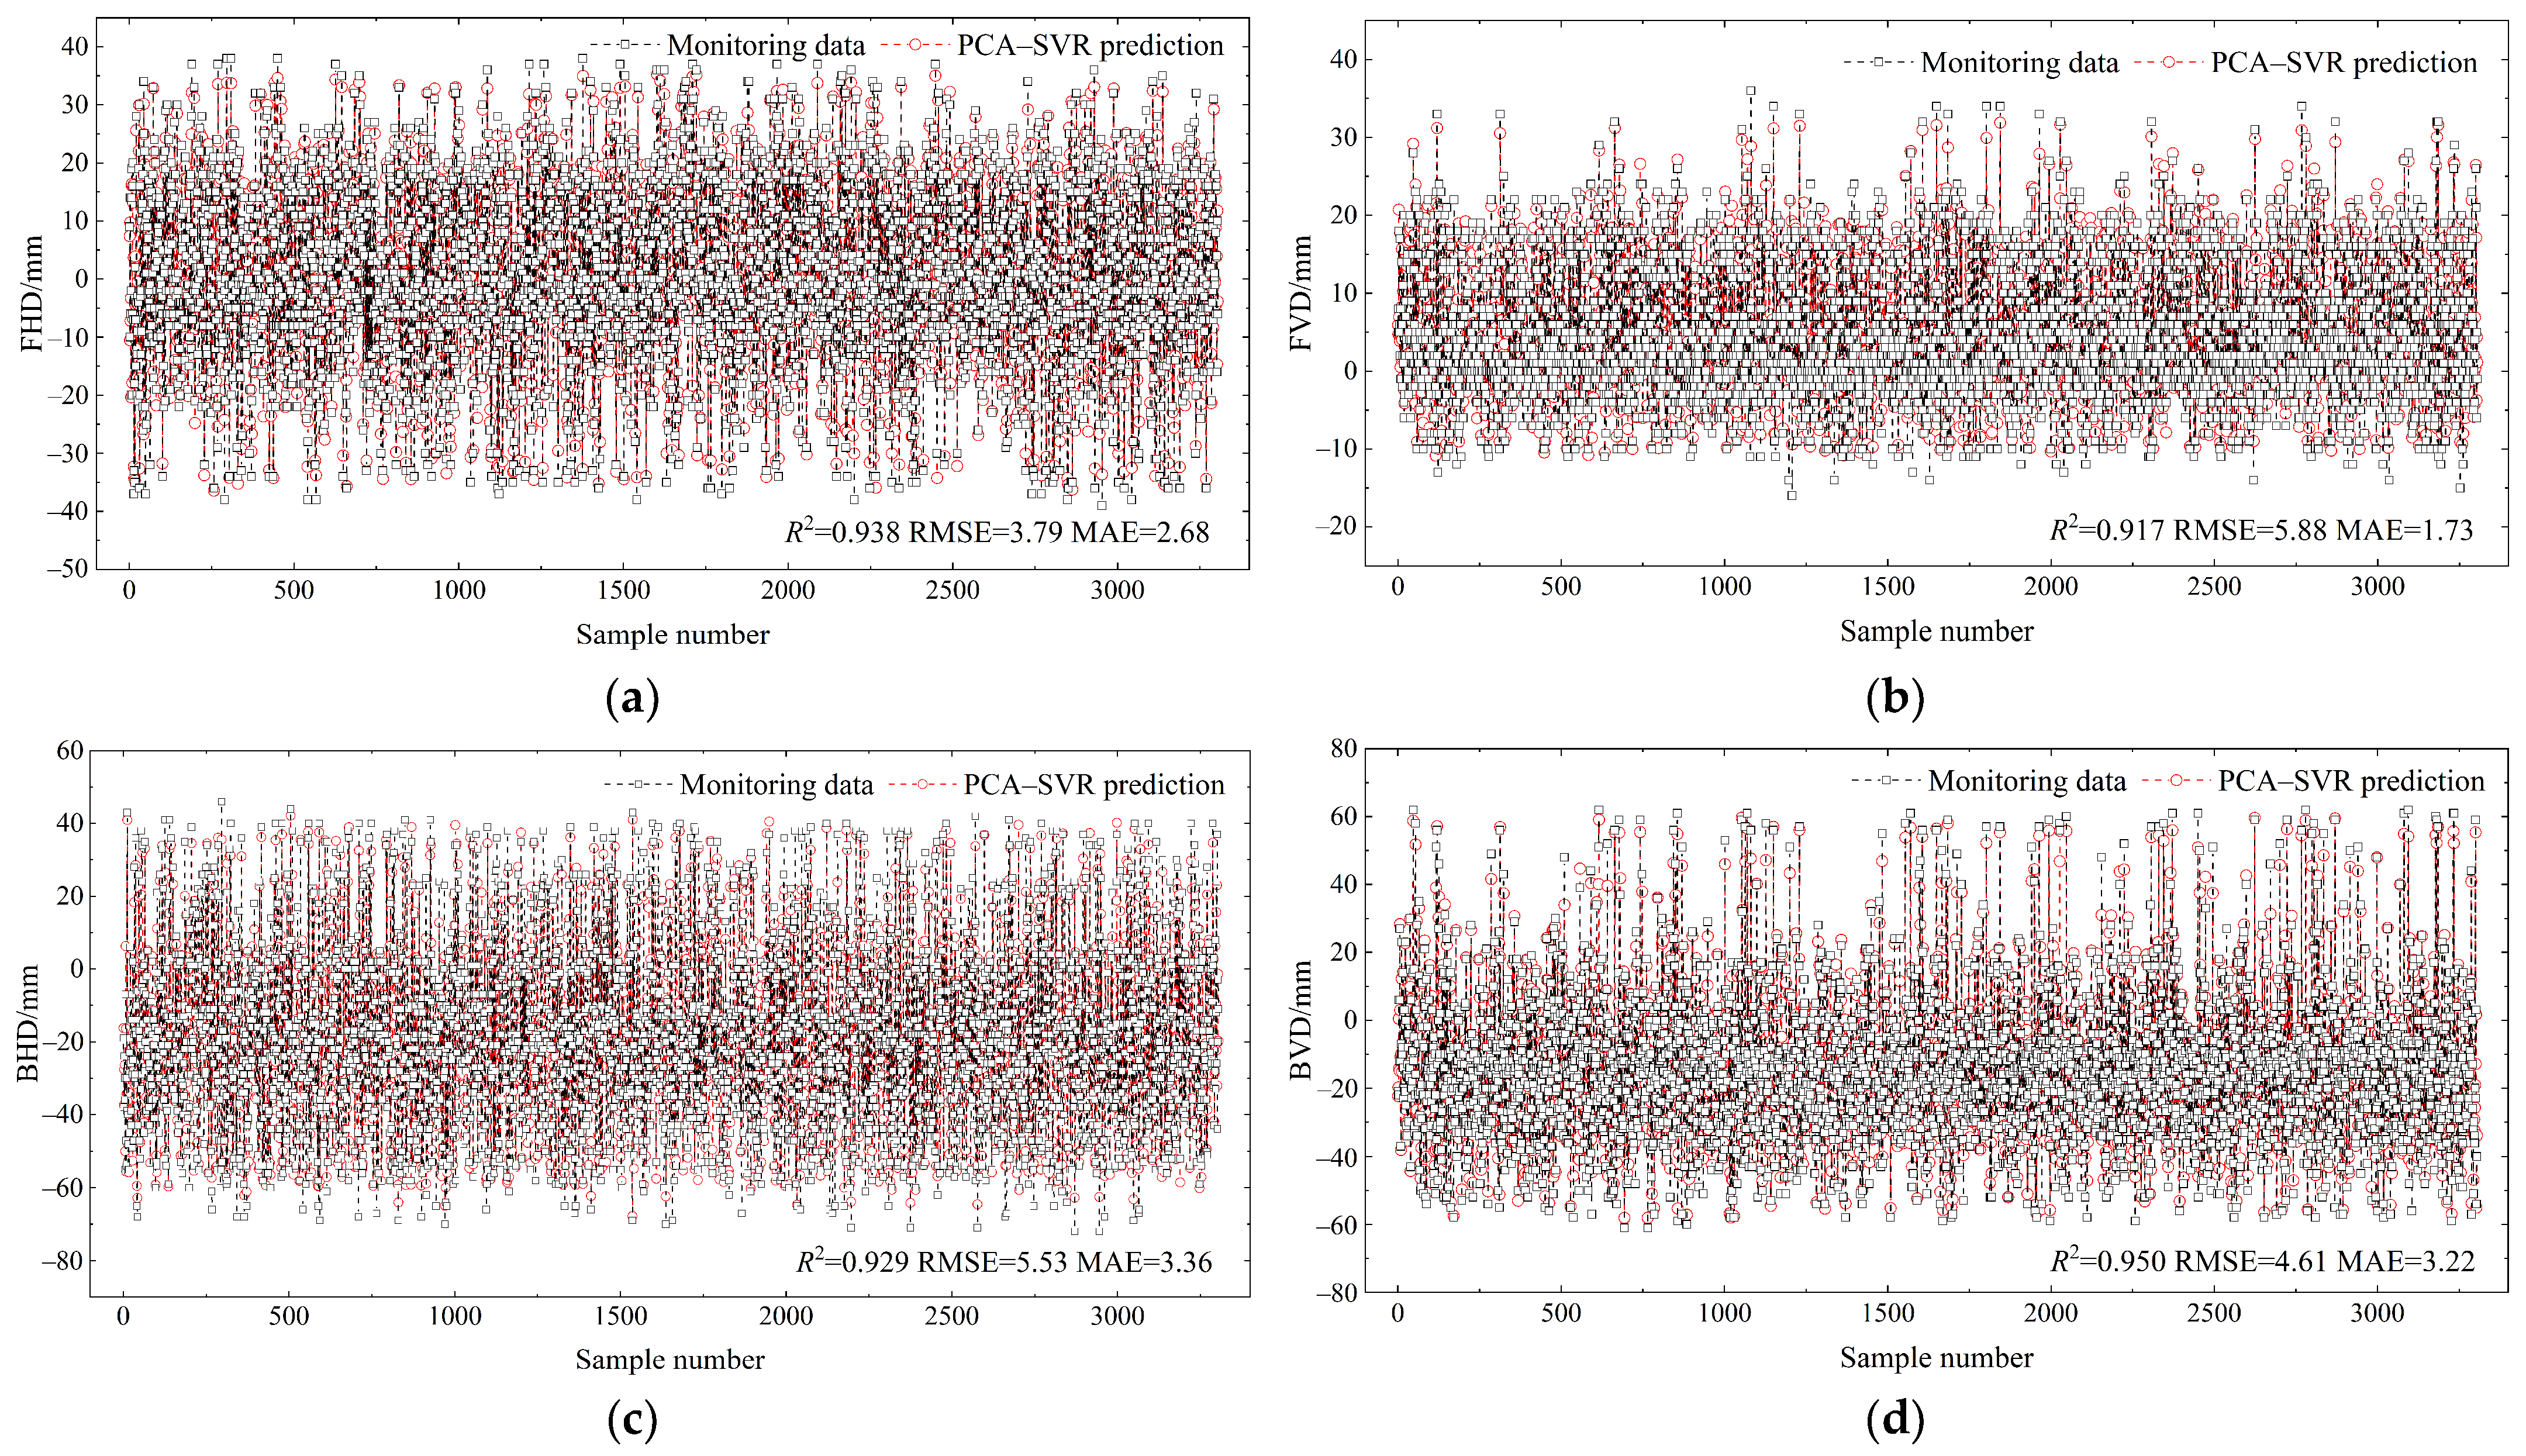
4.2. Model Evaluation
4.3. Prediction Model Validation
5. Discussion
6. Conclusions
- (1)
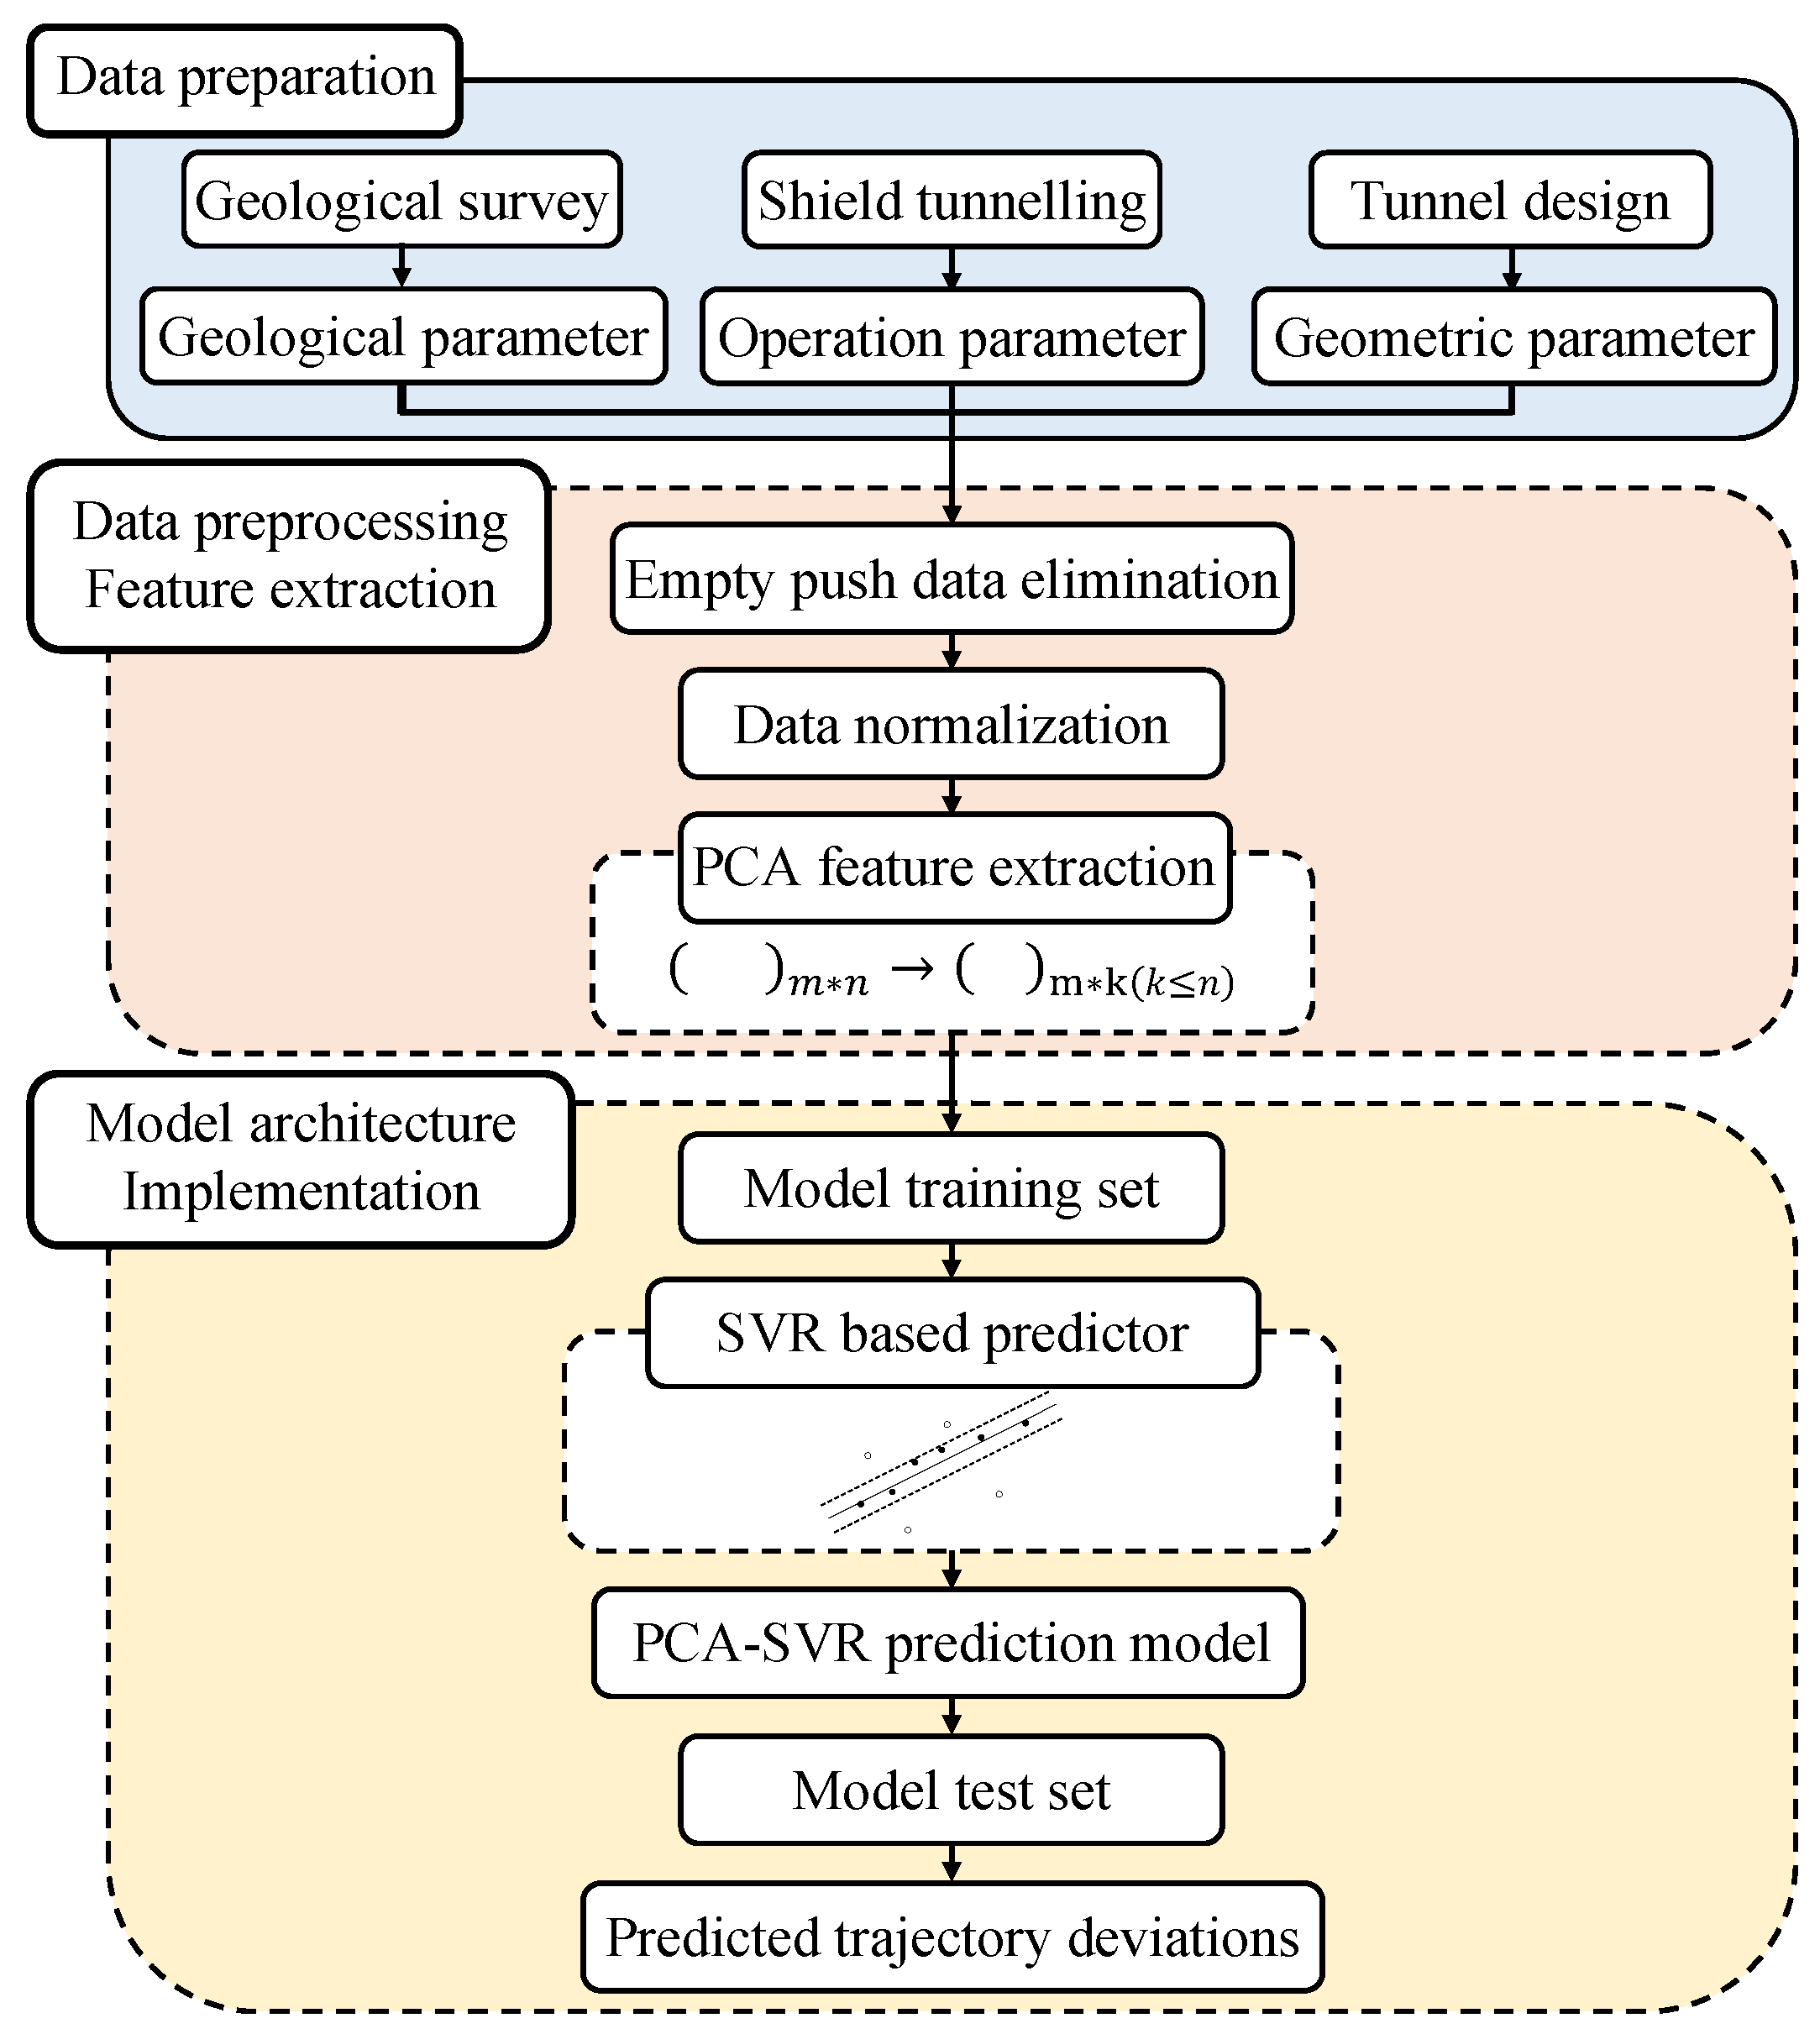
- An intelligent model combining principal component analysis (PCA) and support vector regression (SVR) was employed to predict the trajectory of the shield’s driving attitude. PCA effectively reduced the data dimension and accompanying data noise, while the SVR model adopted the principle of structural risk minimization and statistical learning theory to predict the attitude parameters of the shield machine. The PCA–SVR model was validated using in situ data from the shield-tunnel project of the Xingye Express line in Zhuhai, China, and accurately foresaw the trajectory deviations of tunneling.
- (2)
- An engineering example confirmed that the proposed hybrid PCA–SVR model accurately predicted the attitude motion trajectory. Compared with the standalone SVR model, PCA–SVR reduced the calculation time cost and exhibited a high prediction accuracy. The proposed prediction model has the potential to guide shield operators in adjusting tunneling parameters, thereby improving the attitude motion trajectory.
- (3)
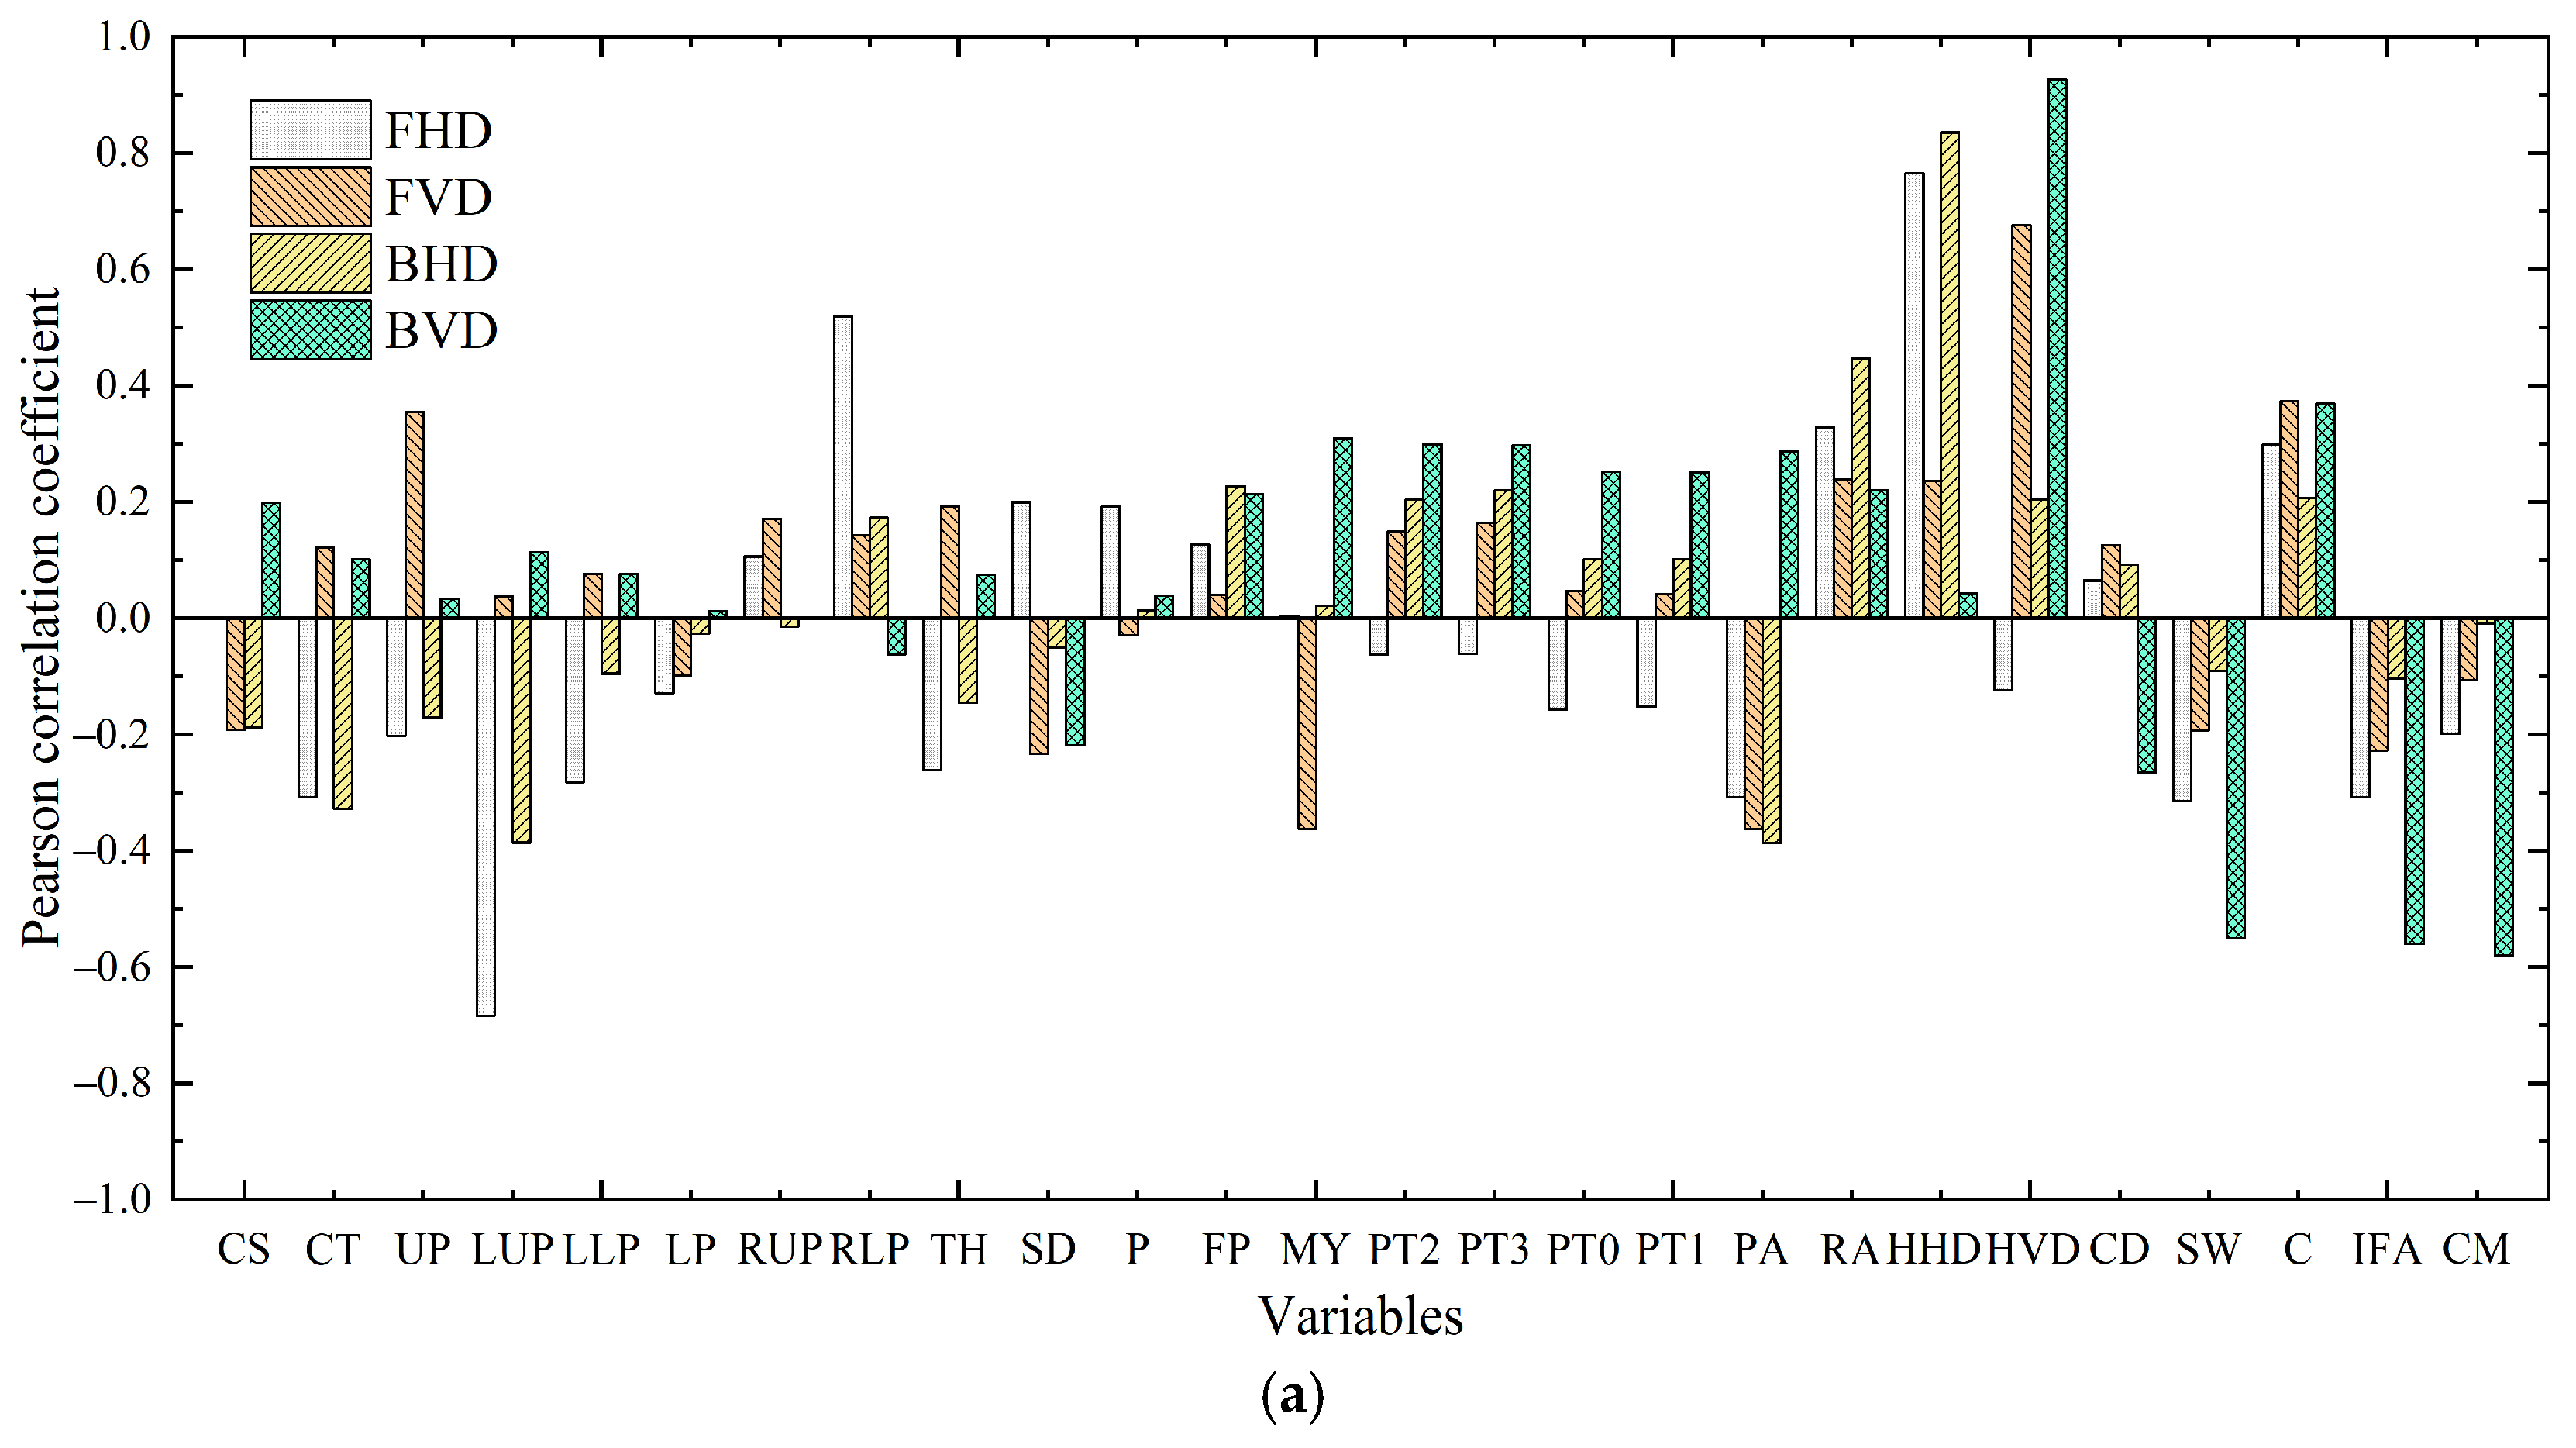
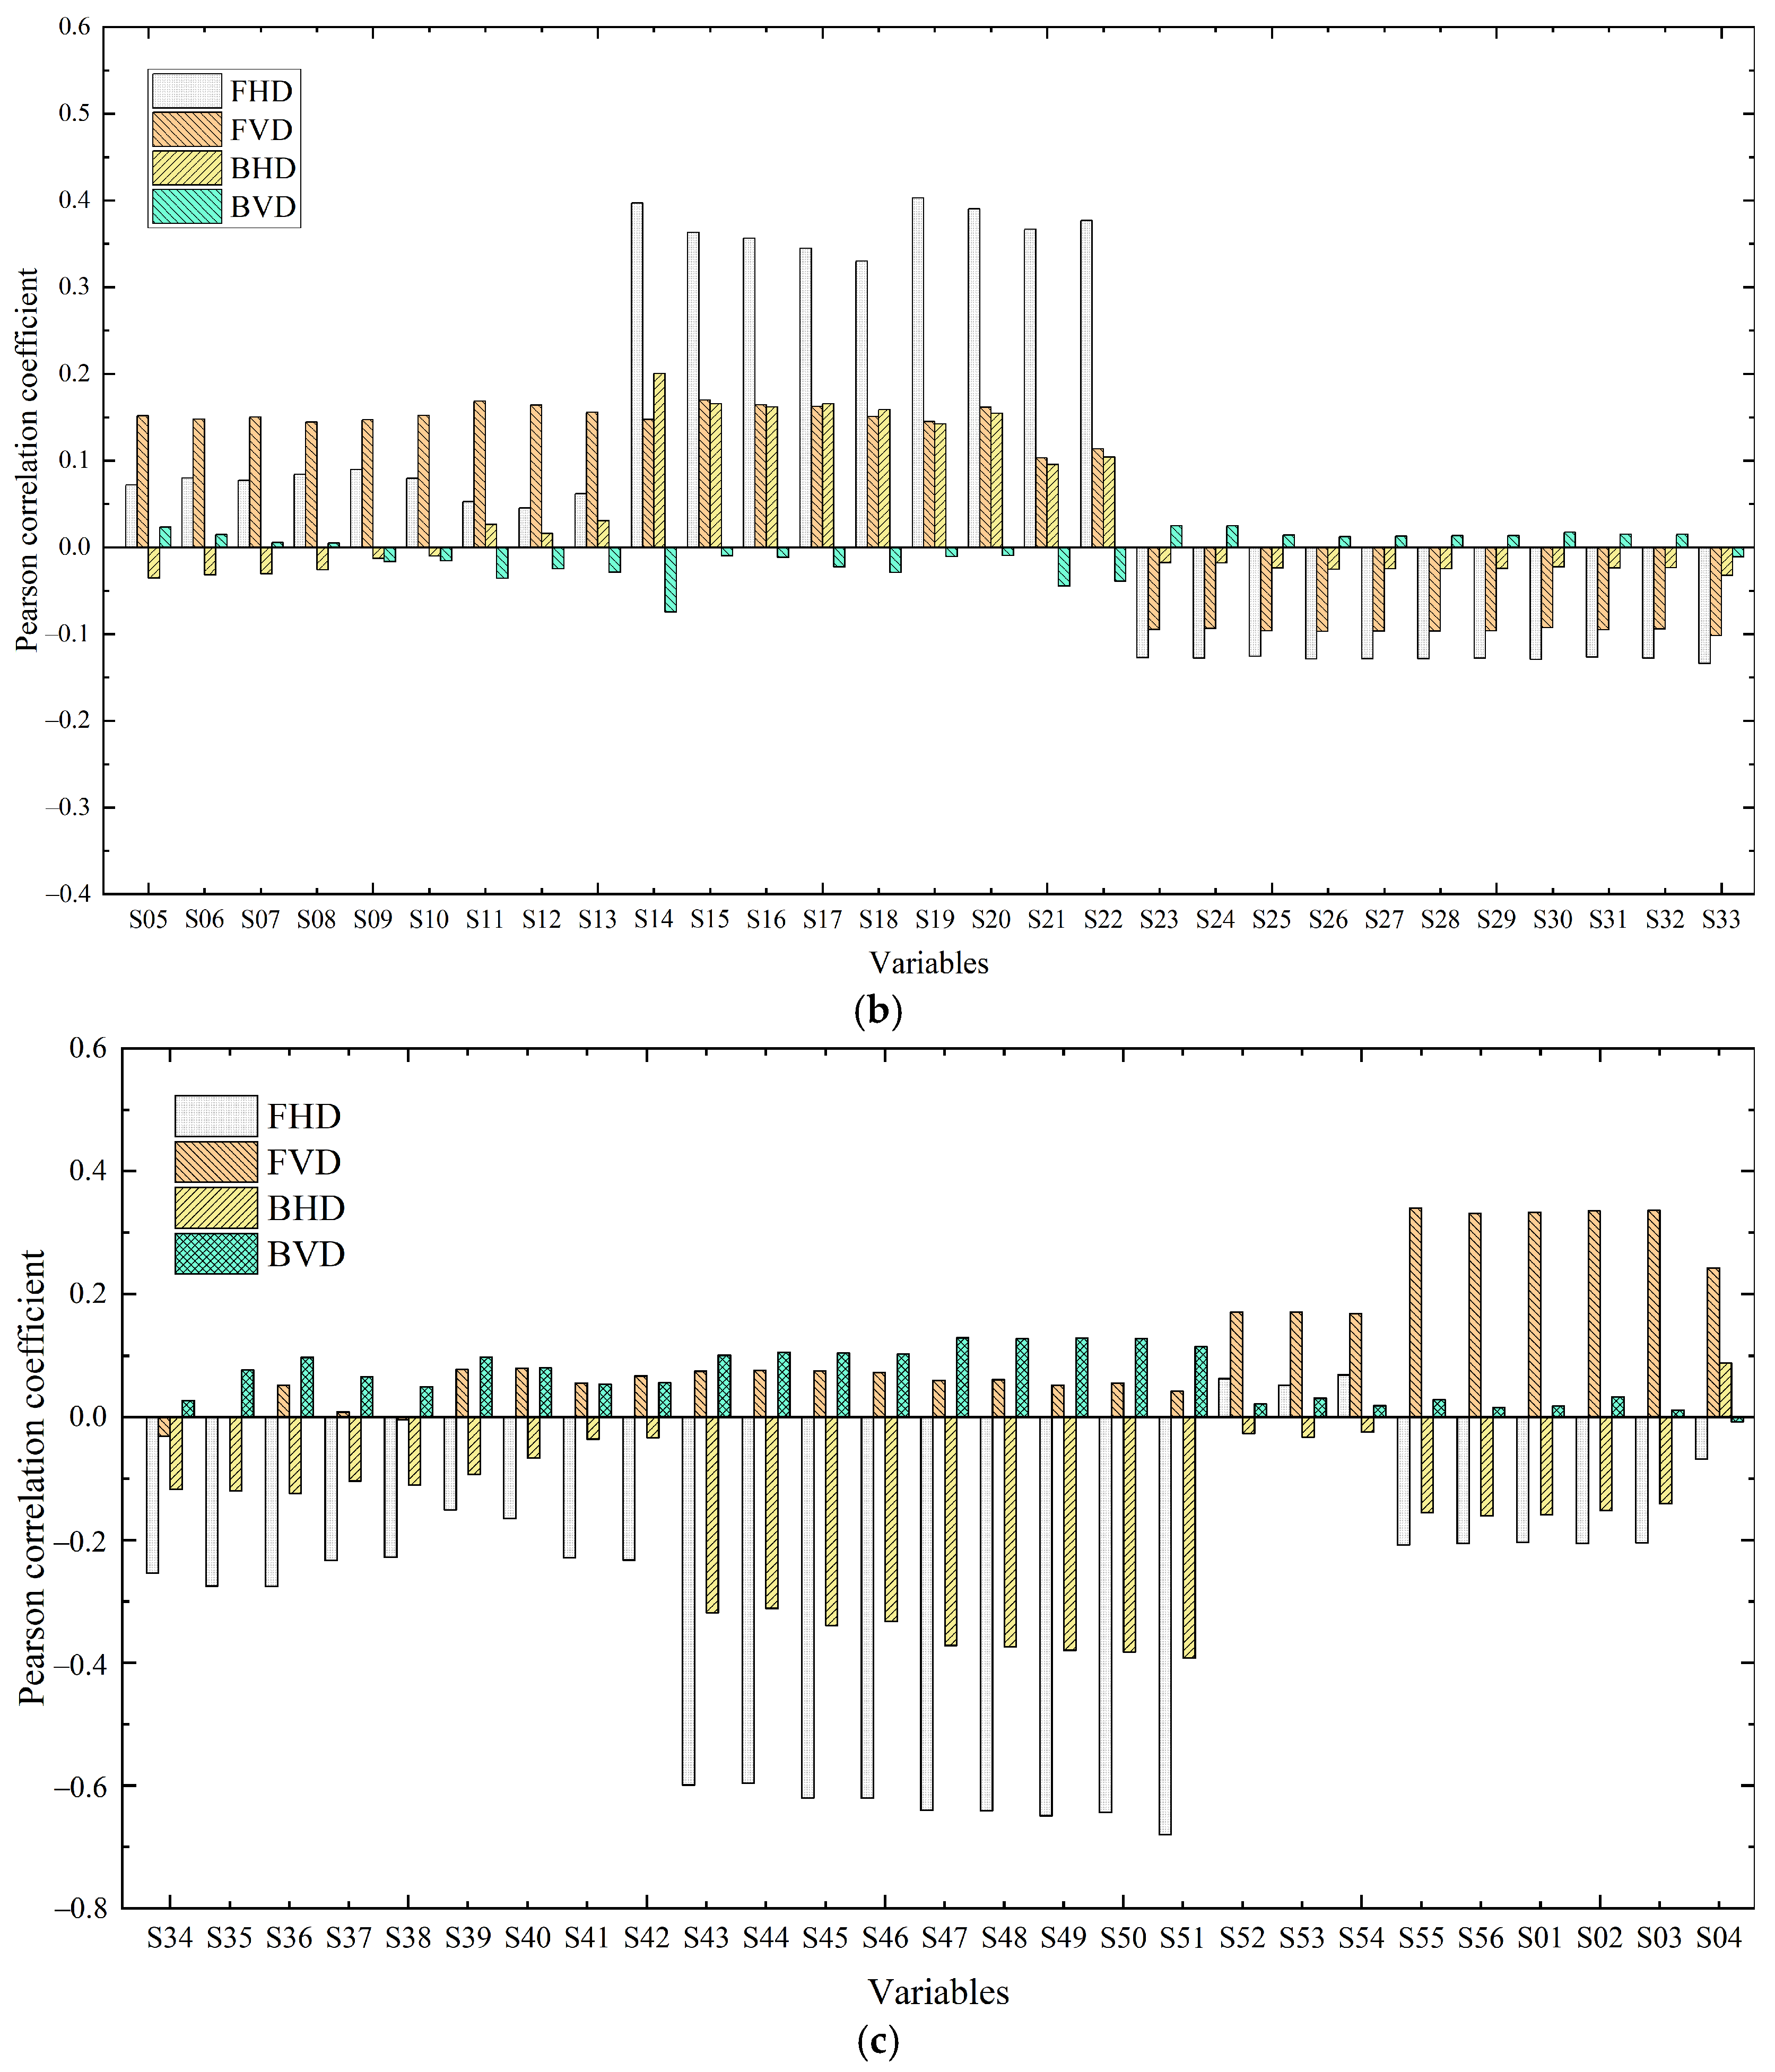
- The sensitivity analysis revealed that the propeller cylinder pressure significantly affected the attitude trajectory of the shield machine. Additionally, the correlation between the geometric and geological parameters of the shield and the output parameters was generally strong. However, the correlation between certain driving parameters and the output parameters was weak. Deviations from the desired tunneling attitude (DTA) were regulated by the thrust of the push cylinders in the corresponding positions. Future work should refine the model with more parameters and advanced machine learning, and test it at various geological sites, including those with complex rocks, to enhance its accuracy and general applicability. Additionally, research will focus on real-time prediction, with the proposal of a program embeddable in the shield computer for real-time data export and training.
Author Contributions
Funding
Institutional Review Board Statement
Informed Consent Statement
Data Availability Statement
Acknowledgments
Conflicts of Interest
References
- Stavropoulou, M.; Xiroudakis, G.; Exadaktylos, G. Spatial estimation of geotechnical parameters for numerical tunneling simulations and TBM performance models. Acta Geotech. 2010, 5, 139–150. [Google Scholar] [CrossRef]
- Lorenzo, S.G. Design guidelines for concrete segmental linings in transverse interaction with the TBM. Tunn. Undergr. Space Technol. 2022, 122, 104388. [Google Scholar] [CrossRef]
- Jia, G.P.; Huo, J.Z.; Yang, B.W.; Wu, Z. The real-time optimal attitude control of tunnel boring machine based on reinforcement learning. Appl. Sci. 2023, 13, 10026. [Google Scholar] [CrossRef]
- Li, X.; Di, X.H.; Zhou, S.X.; Huo, P.; Huang, Q. Effective method for adjusting the uplifting of shield machine tunneling in upper-soft lower-hard strata. Tunn. Undergr. Space Technol. 2021, 115, 104040. [Google Scholar] [CrossRef]
- Kong, X.X.; Ling, X.Z.; Tang, L.; Tang, W.C.; Zhang, Y.F. Random forest-based predictors for driving forces of earth pressure balance (EPB) shield tunnel boring machine (TBM). Tunn. Undergr. Space Technol. 2022, 122, 104373. [Google Scholar] [CrossRef]
- Xiao, H.H.; Xing, B.; Wang, Y.J.; Yu, P.; Liu, L.P.; Cao, R.L. Prediction of Shield Machine Attitude Based on Various Artificial Intelligence Technologies. Appl. Sci. 2021, 11, 10264. [Google Scholar] [CrossRef]
- Zhang, W.G.; Phoon, K.K. Editorial for advances and applications of deep learning and soft computing in geotechnical underground engineering. J. Rock Mech. Geotech. Eng. 2022, 14, 671–673. [Google Scholar] [CrossRef]
- Chwała, M. Undrained bearing capacity of spatially random soil for rectangular footings. Soils Found. 2019, 59, 1508–1521. [Google Scholar] [CrossRef]
- Savvides, A.A.; Papadopoulos, L. A neural network model for estimation of failure stresses and strains in cohesive soils. Geotechnics 2022, 2, 1084–1108. [Google Scholar] [CrossRef]
- Jordan, M.I.; Mitchell, T.M. Machine learning: Trends, perspectives, and prospects. Science 2015, 349, 255–260. [Google Scholar] [CrossRef]
- Guo, D.; Li, J.H.; Jiang, S.H.; Li, X.; Chen, Z.Y. Intelligent assistant driving method for tunnel boring machine based on big data. Acta Geotech. 2022, 17, 1019–1030. [Google Scholar] [CrossRef]
- Zhang, W.G.; Li, H.R.; Li, Y.Q.; Liu, H.L.; Chen, Y.M.; Ding, X.M. Application of deep learning algorithms in geotechnical engineering a short critical review. Artif. Intell. Rev. 2021, 54, 5633–5673. [Google Scholar] [CrossRef]
- Pan, Q.J.; Li, X.Z.; Huang, S.; Wang, L.; Wang, S.Y.; Fang, G.G. Application of machine learning to intelligent shield tunnelling: Review and prospects. Hazard Control Tunn. Undergr. Eng. 2022, 4, 10–30. (In Chinese) [Google Scholar]
- Mahdevari, S.; Shahriar, K.; Yagiz, S.; Shirazi, M.A. A support vector regression model for predicting tunnel boring machine penetration rates. Int. J. Rock Mech. Min. 2014, 72, 214–229. [Google Scholar] [CrossRef]
- Lin, S.S.; Shen, S.L.; Zhang, N.; Zhou, A.N. Modelling the performance of EPB shield tunnelling using machine and deep learning algorithms. Geosci. Front. 2021, 12, 101177. [Google Scholar] [CrossRef]
- Shen, S.L.; Njock, P.G.A.; Zhou, A.N.; Lyu, H.M. Dynamic prediction of jet grouted column diameter in soft soil using Bi-LSTM deep learning. Acta Geotech. 2021, 16, 303–315. [Google Scholar] [CrossRef]
- Fu, X.L.; Wu, M.Z.; Ponnarasu, S.; Zhang, L.M. A hybrid deep learning approach for dynamic attitude and position prediction in tunnel construction considering spatio-temporal patterns. Expert Syst. Appl. 2023, 212, 118721. [Google Scholar] [CrossRef]
- Zhou, C.; Xu, H.C.; Ding, L.Y.; Wei, L.C.; Zhou, Y. Dynamic prediction for attitude and position in shield tunneling: A deep learning method. Automat. Constr. 2019, 105, 102840. [Google Scholar] [CrossRef]
- Zhang, Y.K.; Gong, G.F.; Yang, H.Y.; Li, W.J.; Liu, J. Precision versus intelligence: Autonomous supporting pressure balance control for slurry shield tunnel boring machines. Automat. Constr. 2020, 114, 103173. [Google Scholar] [CrossRef]
- Shen, S.L.; Elbaz, K.; Shaban, W.M.; Zhou, A.N. Real-time prediction of shield moving trajectory during tunnelling. Acta Geotech. 2022, 17, 1533–1549. [Google Scholar] [CrossRef]
- Sun, W.; Shi, M.L.; Zhang, C.; Zhao, J.H.; Song, X.G. Dynamic load prediction of tunnel boring machine (TBM) based on heterogeneous in-situ data. Automat. Constr. 2018, 92, 23–34. [Google Scholar] [CrossRef]
- Huang, H.W.; Chang, J.Q.; Zhang, D.M.; Zhang, J.; Wu, H.M.; Li, G. Machine learning-based automatic control of tunneling posture of shield machine. J. Rock Mech. Geotech. Eng. 2022, 14, 1153–1164. [Google Scholar] [CrossRef]
- Wang, L.T.; Yang, X.; Gong, G.F.; Du, J.N. Pose and trajectory control of shield tunneling machine in complicated stratum. Automat. Constr. 2018, 93, 192–199. [Google Scholar] [CrossRef]
- Wu, H.M.; Chang, J.Q.; Li, G.; Zhang, D.M.; Huang, H.W. Prediction of driving posture and optimization of construction parameters for shield based on support vector machine. Tunn. Constr. 2021, 41, 11–18. (In Chinese) [Google Scholar]
- Zhang, N.; Zhang, N.; Zheng, Q.; Xu, Y.S. Real-time prediction of shield moving trajectory during tunnelling using GRU deep neural network. Acta Geotech. 2021, 17, 1167–1182. [Google Scholar] [CrossRef]
- Zhao, S.; Liao, S.M.; Yang, Y.F.; Tang, L.H. Prediction of shield tunneling attitudes: A muti-dimensional feature synthesizing and screening method. J. Rock Mech. Geotech. Eng. 2024. [Google Scholar] [CrossRef]
- Ayawah, P.E.A.; Sebbeh-Newton, S.; Azure, J.W.A.; Kaba, A.G.A.; Anani, A.; Bansah, S.; Zabidi, H. A review and case study of artificial intelligence and machine learning methods used for ground condition prediction ahead of tunnel boring machines. J. Rock Mech. Geotech. Eng. 2022, 125, 104497. [Google Scholar] [CrossRef]
- Yang, W.H.; Su, D.; Lin, X.T.; Lv, Z.J.; Yao, Z.H.; Li, H.; Zhang, Y.Z.; Chen, X.S. Super-large diameter slurry shield tunnel encountering boulder formation: Detection, treatment and data analysis. Transp. Geotech. 2024, 49, 101408. [Google Scholar] [CrossRef]
- Gajjar, S.; Palazoglu, A. A data-driven multidimensional visualization technique for process fault detection and diagnosis. Chemom. Intell. Lab. Syst. 2016, 154, 122–136. [Google Scholar] [CrossRef]


| Type | Formula | Parameter |
|---|---|---|
| Linear kernel function | ||
| Polynomial kernel function | γ, r, d | |
| Gaussian kernel function | γ | |
| Sigmoid kernel function | γ, r |
| Parameters | Value |
|---|---|
| Length of shield machine/m | 15.80 |
| Excavation diameter/m | 15.76 |
| Cutter speed/rpm | 0–1.33–3.0 |
| Cutter form | With pressure and atmospheric pressure |
| Minimum turning radius/m | 599.5 |
| Aperture opening ratio/% | 30 |
| Maximum total thrust/kN | 277,200 |
| Cylinder stroke/mm | 4200 |
| Number of stroke sensors (built-in) | 56 |
| Number of advanced cylinder partitions | 6 |
| Maximum propulsion speed/(mm/min) | 50 |
| Geotechnical Designation | Status | γ 1/% | ω 2/% | c 3/kPa | φ 3/(°) | Es1–2 4/MPa |
|---|---|---|---|---|---|---|
| Fill soil | Slight compaction | 17.93 | 25.00 | 21.7 | 14.4 | 4.10 |
| Silty clay | Plasticity | 18.13 | 26.50 | 22.8 | 16.5 | 4.18 |
| Gravel clay | Hard plastic | 18.52 | 23.60 | 20.4 | 24.3 | 4.86 |
| Fully weathered granite | Hard soil | 18.62 | 21.90 | 21.5 | 25.6 | 5.25 |
| Moderately weathered granite | Half rock and half earth | 19.50 | / | 26.0 | 29.0 | / |
| Number | Parameters | Min | Max | Mean | Unit |
|---|---|---|---|---|---|
| 1 | Cutter speed (CS) | 0.78 | 1.06 | 0.99 | rpm |
| 2 | Cutter torque (CT) | 1077 | 6296 | 2912 | kN·m |
| 3 | Upper pressure (UP) | 3.5 | 17.2 | 7.5 | MPa |
| 4 | Left upper pressure (LUP) | 2.8 | 15.7 | 9.1 | MPa |
| 5 | Left lower pressure (LLP) | 0.1 | 28.9 | 12.2 | MPa |
| 6 | Lower pressure (LP) | 8.6 | 25.3 | 14.8 | MPa |
| 7 | Right upper pressure (RUP) | 0.2 | 14.5 | 8.2 | MPa |
| 8 | Right lower pressure (RLP) | 0.1 | 23.0 | 11.7 | MPa |
| 9 | Thrust (TH) | 63,144 | 113,463 | 84,850 | kN |
| 10 | Upper and lower stroke difference (SD) | −41 | 203 | 90 | mm |
| 11 | Penetration (P) | 2.0 | 32.0 | 9.4 | mm/r |
| 12 | Cutting face pressure (FP) | 0.23 | 0.26 | 0.24 | MPa |
| 13 | Deflection moment in the y-direction (MY) | −22,047 | 3418 | −5330 | kN·m |
| 14 | Right cut water pressure (PT2) | 2.325 | 2.668 | 2.462 | bar |
| 15 | Left cut water pressure (PT3) | 2.318 | 2.655 | 2.456 | bar |
| 16 | Right upper cut water pressure (PT0) | 1.578 | 1.903 | 1.703 | bar |
| 17 | Left upper cut water pressure (PT1) | 1.575 | 1.898 | 1.700 | bar |
| 18 | No.01–No.56 propulsion cylinder pressure (SP1–SP56) | 0.0 | 28.9 | 10.6 | MPa |
| 19 | Pitch angle (PA) | −0.55 | 0.41 | 0.16 | degree |
| 20 | Rolling angle (RA) | −0.40 | 0.17 | 0.30 | degree |
| 21 | Hinged horizontal deviation (HHD) | −52 | 22 | −13 | mm |
| 22 | Hinged vertical deviation (HVD) | −29 | 47 | −4 | mm |
| 23 | Cover depth (CD) | 11.0 | 14.4 | 12.6 | mm/r |
| 24 | Soil weight (SW) | 1.87 | 1.89 | 1.88 | g/cm3 |
| 25 | Cohesion (C) | 20.8 | 21.5 | 21.1 | MPa |
| 26 | Internal friction angle (IFA) | 21.6 | 23.8 | 23.0 | degree |
| 27 | Compression modulus (CM) | 4.7 | 4.9 | 4.8 | MPa |
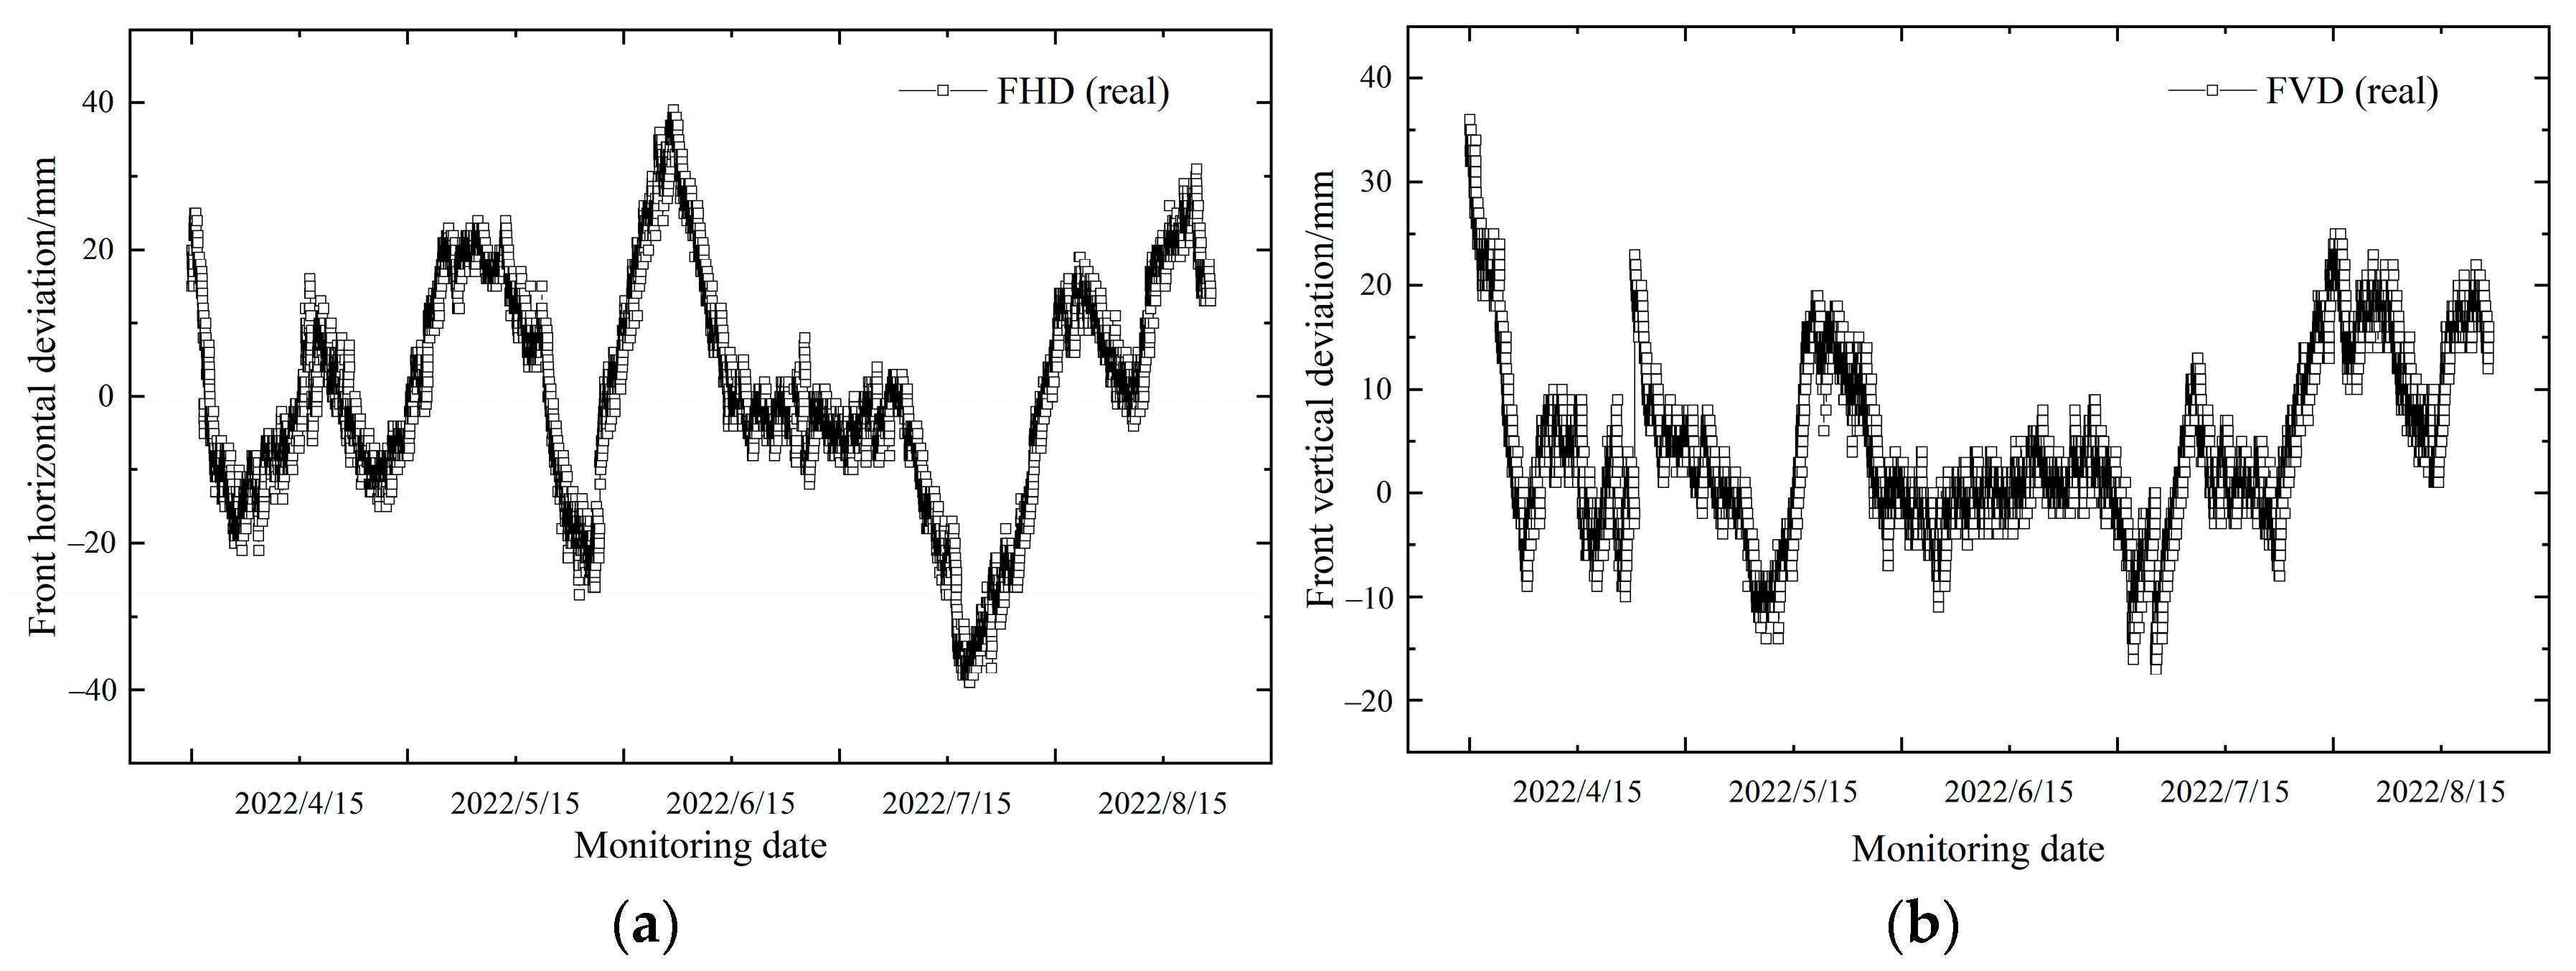
| 28 | Front horizontal deviation (FHD) | −39 | 39 | 1 | mm |
| 29 | Front vertical deviation (FVD) | −17 | 36 | 5 | mm |
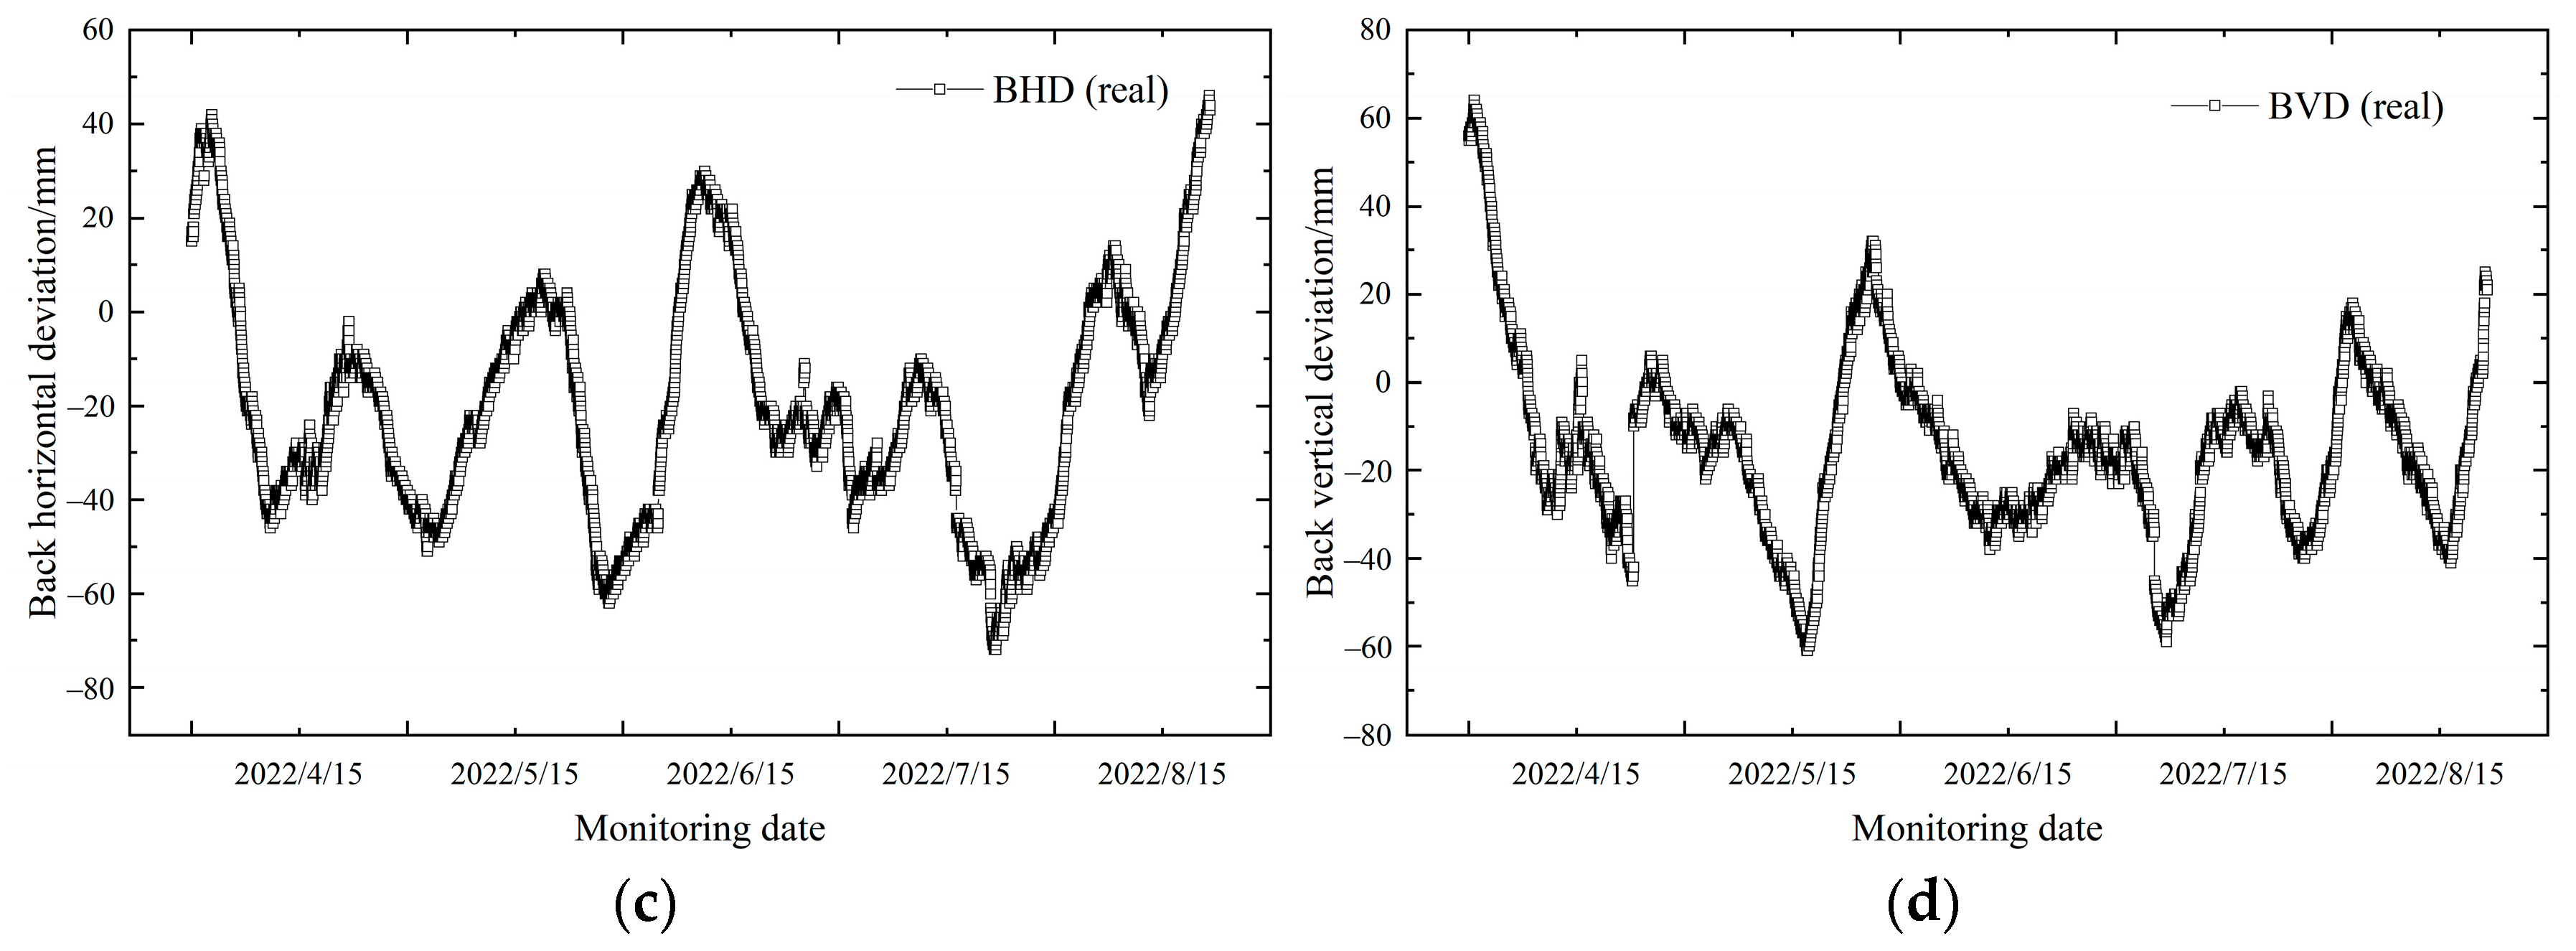
| 30 | Back horizontal deviation (BHD) | −72 | 46 | −20 | mm |
| 31 | Back vertical deviation (BVD) | −61 | 64 | −15 | mm |
| Principal Component | 1 | 2 | 3 | 4 | 5 | 6 | 7 | 8 | 9 | 10 | 11 | 12 | 13 |
|---|---|---|---|---|---|---|---|---|---|---|---|---|---|
| Contribution rate | 0.23 | 0.16 | 0.13 | 0.10 | 0.06 | 0.05 | 0.04 | 0.03 | 0.03 | 0.02 | 0.02 | 0.02 | 0.01 |
| Cumulative contribution rate | 0.23 | 0.39 | 0.52 | 0.62 | 0.68 | 0.73 | 0.77 | 0.80 | 0.83 | 0.85 | 0.87 | 0.89 | 0.90 |
| Model | Index | FHD | FVD | BHD | BVD |
|---|---|---|---|---|---|
| PCA–SVR | R2 | 0.938 | 0.917 | 0.929 | 0.950 |
| RMSE | 3.79 | 5.88 | 5.53 | 4.61 | |
| MAE | 2.68 | 1.73 | 3.36 | 3.22 | |
| SVR | R2 | 0.956 | 0.95 | 0.957 | 0.974 |
| RMSE | 3.17 | 3.47 | 4.52 | 3.36 | |
| MAE | 2.22 | 1.36 | 3.18 | 2.17 |
Disclaimer/Publisher’s Note: The statements, opinions and data contained in all publications are solely those of the individual author(s) and contributor(s) and not of MDPI and/or the editor(s). MDPI and/or the editor(s) disclaim responsibility for any injury to people or property resulting from any ideas, methods, instructions or products referred to in the content. |
© 2025 by the authors. Licensee MDPI, Basel, Switzerland. This article is an open access article distributed under the terms and conditions of the Creative Commons Attribution (CC BY) license (https://creativecommons.org/licenses/by/4.0/).
Share and Cite
Li, H.; Tan, Y.; Zeng, D.; Su, D.; Qiao, S. Attitude-Predictive Control of Large-Diameter Shield Tunneling: PCA-SVR Machine Learning Algorithm Application in a Case Study of the Zhuhai Xingye Express Tunnel. Appl. Sci. 2025, 15, 1880. https://doi.org/10.3390/app15041880
Li H, Tan Y, Zeng D, Su D, Qiao S. Attitude-Predictive Control of Large-Diameter Shield Tunneling: PCA-SVR Machine Learning Algorithm Application in a Case Study of the Zhuhai Xingye Express Tunnel. Applied Sciences. 2025; 15(4):1880. https://doi.org/10.3390/app15041880
Chicago/Turabian StyleLi, Hui, Yijun Tan, Decheng Zeng, Dong Su, and Shiye Qiao. 2025. "Attitude-Predictive Control of Large-Diameter Shield Tunneling: PCA-SVR Machine Learning Algorithm Application in a Case Study of the Zhuhai Xingye Express Tunnel" Applied Sciences 15, no. 4: 1880. https://doi.org/10.3390/app15041880
APA StyleLi, H., Tan, Y., Zeng, D., Su, D., & Qiao, S. (2025). Attitude-Predictive Control of Large-Diameter Shield Tunneling: PCA-SVR Machine Learning Algorithm Application in a Case Study of the Zhuhai Xingye Express Tunnel. Applied Sciences, 15(4), 1880. https://doi.org/10.3390/app15041880