Article

Investigation of Select Pure Earth Metals as Redox Catalytic Electrodes in Single Compartment Hydrogen Peroxide Fuel Cells

by
Faraz Alderson
,
Raveen Appuhamy
and
Stephen Andrew Gadsden
*
Mechanical Engineering, McMaster University, 1280 Main Street West, Hamilton, ON L8S 4L8, Canada
*
Author to whom correspondence should be addressed.
Appl. Sci. 2025, 15(4), 1857; https://doi.org/10.3390/app15041857
Submission received: 29 November 2024 / Revised: 30 January 2025 / Accepted: 6 February 2025 / Published: 11 February 2025
(This article belongs to the Section Energy Science and Technology)

Abstract

:
Hydrogen peroxide is a promising alternative to hydrogen gas for fuel cells, as it can act as the oxidizing and reducing agent and be stored in a stable liquid form, it simplifies the structure of the fuel cell. This study aims to investigate the use of antimony, bismuth, indium, tantalum, silver, dysprosium, erbium, gadolinium, holmium, and terbium as electrodes for the first time in a single-compartment hydrogen peroxide fuel cell. In this study, the procedure for custom electrodes for these metals is documented. The performance of the electrodes was evaluated by measuring the open circuit potential, comparing the cyclic voltammograms and observing the physical reactions of the cell combinations. The results of the study show the catalytic reaction is likely due to the formation of molecular oxide layers on the electrode surface. It was evident that an acidic peroxide electrolyte favors the best catalytic reaction. Tantalum and antimony were found to be the best-performing electrodes in this electrolyte, providing the best stability and performance.

1. Introduction

The original simple fuel cell was invented by Wilhelm Ostwald in 1894, who thought that instead of typical combustion, certain fuels could undergo oxidation through controlled electromechanical mechanisms [1]. It was not until the mid-1980s that fuel cells were given formal and practical consideration for generating on-demand electrical power in remote areas. Today, fuel cells are a renowned category with many industrial applications and substantial research in various types and operations.
A typical fuel cell contains two electrodes, a cathode and an anode, in two segments isolated by a proton conductive barrier material. The fuel flows through the anode compartment while the reactant flows through the cathode compartment. A redox reaction occurs facilitated by the passage of protons across the proton exchange barrier [2]. The chemical reaction creates a net electrical potential difference at the cathode and anode sites. Hydrogen is a popular type of fuel cell where hydrogen gas is reacted with oxygen; however, the use of hydrogen peroxide as fuel has promising capabilities to improve upon hydrogen fuel cells. Hydrogen peroxide is stable in liquid form, making it easier to store and transport without the need for high-pressure methods like with hydrogen. Hydrogen peroxide, even at very high concentrations, can be reliably stored in containers made of passivated resistant stainless-steel, high-density polyethylene (HDPE), or glass. Pressurized hydrogen will almost always require the use of a reinforced metallic capsule, and despite all efforts, hydrogen has inherent material damaging risks. A concern with the use of hydrogen peroxide as both the fuel and oxidant pertains to how it can undergo a mixed potential reaction called hydrogen peroxide disproportionation. In this mixed reaction, oxidation and reduction can occur between the peroxide molecules without reacting with the electrode. This causes the degradation of the peroxide without the formation of any potential difference across the electrodes. The decomposition of Hydrogen peroxide in acidic solutions occurs through the redox reactions shown in Equations (1) and (2) [3]. In an alkaline solution, the redox reaction differs as the peroxide enters the reaction in its dissociated form, as shown in Equations (3) and (4). In these reactions, the hydrogen peroxide reacts with the anode to produce hydrogen protons and electrons. The electrons travel from the anode to the cathode through a circuit to generate electricity. The electrons then react with the peroxide and hydrogen protons at the cathode electrode to produce water. The net cell electrochemical reaction of the hydrogen peroxide, as shown in Equation (5), generates a predicted electrical potential of 1.09 V. This theoretical voltage is comparable to other common fuel cells such as hydrogen fuel cells (1.23 V) and methanol fuel cells (1.21 V).
H 2 O 2 O 2 + 2 H + + 2 e
H 2 O 2 + 2 H + + 2 e 2 H 2 O
H O 2 + H O O 2 + H 2 O + 2 e
H O 2 + H 2 O + 2 e 3 O H
2 H 2 O 2 + O 2 2 H 2 O
Yamazaki et al. conducted the first academic investigation of a single-compartment hydrogen peroxide, published in 2008 [4]. The study assessed the effectiveness of Gold (Au), Platinum (Pt), Palladium (Pd), Silver (Ag), and Nickel (Ni) as electrode materials using alkaline hydrogen peroxide as the common electrolyte. Since then, there have been various studies investigating hydrogen peroxide fuel cells as shown in Table 1.
This paper uses different electrolyte pH values to investigate the use of seven pure elemental metals for the first time as potential electrocatalytic electrodes in a single-compartment hydrogen peroxide fuel cell. This study investigates the following rare earth metals: pure dysprosium (Dy), erbium (Er), gadolinium (Gd), holmium (Ho), terbium (Tb), antimony (Sb), and tantalum (Ta). These metals have not been investigated for use as catalytic electrodes in a peroxide fuel cell setting. However, they have been used as catalysts in related or close fields. A modified Dy catalyst was employed for low-temperature selective catalytic reduction denitrification, Tb mixed oxides were investigated as an alternative for three-way catalysts in engines, and Gd-based photocatalysts have demonstrated favourable properties for environmental remediation [14,15,16,17]. Dy, Tb, Er, Gd, and Ho were selected as representatives of rare metals that are non-hazardous and relatively inexpensive. Sb and Ta were selected as metals as they also have been used as catalysts in previous research papers. Ta has the added attribute of being resilient against corrosion in harsh chemical conditions such as extreme pH and highly oxidizing settings, like a fuel cell. This study compares the electrocatalytic performances and constructs plausible theories to explain the observed results and the catalytic mechanisms. Key findings from these investigations include that Dy, Er, Gd, Ho, and Tb can function as electrocatalytic electrode materials to produce a moderate cell output potential in the range of 0.14 V to 0.16 V in alkaline hydrogen peroxide electrolytes. (Sb) and (Ta) functioned as the highest-performing electrode in neutral (0.307 V and 0.2 V) and acidic (0.521 V and 0.457 V) electrolytes, respectively. Ta can also perform well in alkaline electrolytes with an output potential of 0.146 V. It was also observed that an acidic electrolyte leads to a more stable and greater energy output.

2. Materials and Methods

The materials required to complete the experiment in this study can be found in Table 2. These are the materials included are used as electrodes, for electrode fabrication as well as electrolyte preparation. In addition to the materials outlined, a potentiostat was used to complete the cyclic voltammetry tests. The EmStat4S (PALM-ES4S-LR.F0, standard instrument measurement error of ≤0.2% ± 1 mV) manufactured by PalmSense BV (Houten, The Netherlands) was selected. The software used to control the potentiostat was PSTrace (version 5.9), provided by PalmSense BV. It was connected to a Windows 10 laptop via a USB port. Cyclic voltammetry is a common and popular method to evaluate redox electrocatalysts by sweeping the electrodes across a potential. For instance, it was used to evaluate the enhanced electrooxidation of various alcohols for nanocomposite electrodes as well as measure the improved performance profile of ultrafine bimetal alloys [18,19]. During the experiments, the ambient room temperature was measured and maintained between 20 °C and 25 °C. The temperature was measured using a Fluke 87V-NISt True RMS (Fluke, Everett, WA, USA) Industrial Multimeter with the factory-provided K-type thermocouple probe (instrument standard measurement error of ±0.05% + 1). This multimeter was also used to measure the cell output potential values. In addition to the listed supplies, tools found in typical electrochemistry labs were used. These include items like beakers, pipettes, calibrated scales, pH meters, ultrasonic water baths, and magnetic mixers.

2.1. Fabrication of Electrodes

The pure metals to be investigated in this study could not be easily sourced as electrodes in the form needed for precise electrochemical tests. Therefore, electrodes for Sb, Bi, In, Ta, Ag, Dy, Er, Gd, Ho, and Tb were fabricated manually. The fabrication process used the following steps:
  • Each pure metal was cut into squares with a side length of 0.4 mm using a metal saw.
  • Each piece was filed to form a near square-like shape, roughly having a length of 0.3 mm to 0.4 mm for each side.
  • Copper rod was extracted from a solid core 12-gauge copper wire by removing its outer plastic shield and cut to 12 cm in length.
  • The copper rod is attached to the back side of each piece of metal using conductive silver paste.
  • The silver paste was left to dry at room temperature for one hour and then coated with cyanoacrylate adhesive twice (Figure 1a) to improve the sturdiness of the joint.
  • To cast the electrodes in epoxy resin, polypropylene plastic straws (5 mm diameter) with a length of 10 cm were inserted into a sheet of polystyrene foam (Styrofoam). The straws were then glued from the outside to create a seal.
  • Two-part epoxy resin was mixed and poured to fill each plastic straw, ensuring there were no leaks from the bottom at the polystyrene foam.
  • Each electrode metal attached to the copper rod was then inserted through the straw and resin, making sure to insert the copper end into the polystyrene foam. It is important to ensure that the end surface of the metal is flush with the top of the straw. The resin was then left to cure for at least 48 h at room temperature (Figure 1b).
  • Once the resin had cured, the fabricated metal electrode was removed from the plastic straw shell and using a sterile scalpel any excess resin was trimmed.
  • The metal tips of the electrodes were then polished to remove any irregularities. The metal tips were smoothed, starting with 240 grit sandpaper, and then working up through 320, 400, 600, 800, 1000, 3000, and 5000 grit. The sandpaper was fixed over a tabletop and the standard figure-8 sanding pattern was used during sanding operations to ensure an even polishing and as squared as possible polished edges. For the 1000 through 5000 grits, wet sanding was used as well (Figure 1c).
  • The sanded tips of all the electrodes were placed next to a metric scale and photographed (Figure 2).
  • Next, the sanded electrodes were wet-polished. A thin microfiber cloth was affixed to a tabletop. Then, 5000, 14,000, and 50,000 grit polishing compounds were applied to the cloth. The standard figure-8 sanding pattern was used again. Polishing was stopped for each electrode as soon as the metal electrode tip formed a mirror-like clean polish (Figure 1d).
  • An ultrasonic water bath is filled with a solution of 70% isopropanol. The fully polished electrodes were submerged and sonicated for 15 min. Afterwards, they were rinsed using fresh 70% isopropanol and fully dried at room temperature.
  • After ensuring the joint between the copper wire and metal joint with silver paste was fully intact, the resistance of each electrode was measured using the digital multimeter.
  • Using the scaled photographs, the surface area of each electrode tip was calculated. Then, electrodes were stored in a desiccator to be used in future experiments. The surface area of each electrode is summarized in Table 3.
The Ni electrodes were fabricated using two sources of Ni foil with differing purity levels, as listed in Table 2. The foil was cut into 10 cm by 0.4 cm ribbons. The ribbons were sanded and polished to a mirror finish. Then, three coasts of cyanoacrylate adhesive were applied to the body of the ribbons, leaving one tip bare for the connection to the wire and the other tip (about 0.4 cm by 0.4 cm in shape) bare as the electrode surface to be submerged in the electrolyte solution. After each experiment, the electrodes were visually inspected, and after every use, cleaned using isopropanol.

2.2. Fuel Cell Setup and Preparation of Electrolytes

A single-compartment fuel cell was used for this experiment, as shown in Figure 3. This fuel cell setup consisted of a 100 mL glass beaker as the cell chamber, filled with 50 mL of the respective hydrogen peroxide electrolyte at the specified pH value as per Table 4. A Teflon cap with pre-drilled holes for electrode placement was used to cover the beaker and placed over a magnetic mixer. During the experiment, the pairs of electrodes to be tested (plus the Ag/AgCl reference electrode for voltammetry measurements) and a 1 cm stir bar were placed in the electrolyte, setting the stirrer to mix at the lowest speed setting (about 200 rpm). For the experiment, three different electrolytes that use hydrogen peroxide as the fuel and the oxidant were prepared as per Table 4. The recipes for each electrolyte solution were selected based on existing single-compartment hydrogen peroxide fuel cell publications. The acidifying agent, methane sulfonic acid (MSA), was used in Acidic Electrolyte 1, as it is less corrosive on metals than hydrochloric acid when used in hydrogen peroxide solutions [20]. To maximize the conductivity of the neutral and Acidic Electrolytes, sodium chloride is used as the ionic electrolyte agent. This also minimizes any resistive current drop during the electrochemical tests.

2.3. Electrochemical Measurement Parameters

The study was completed at room temperature between 20 °C and 25 °C. Before measuring the cell output potential values from the anode and cathode combinations, the electrodes were submerged in the respective electrolyte solution for 5 min with the stirring turned on. Using each compatible electrode as the working electrode, a coiled wire platinum electrode as the counter electrode, and an Ag/AgCl reference electrode filled with 3 M NaCl connected to the potentiostat, the voltammograms are generated. The potentiostat started the voltammetry runs by recording the open circuit potential of each setup during a 5 s pause before the start of the potential sweep. The voltammetry potential sweeps were set to start at each electrode’s respective open circuit potential, ensuring the CV scan starts while the system is at equilibrium. The scan ranges were set to −0.5 V to 0.5 V, at a scan rate of 0.05 V/s and in 0.015 V steps. The max current to be measured in each run was set to 30 mA. Three scans were completed and the potential and current values were recorded during each run.

3. Results

3.1. Experimental Observations

3.1.1. Alkaline Electrolyte

Bi and In electrodes both formed visible black corrosion layers during the measurement of their cell output potential. This means that using these electrodes in any cell would result in unstable potential generation. Although no corrosion and oxidation was observed on the Sb electrode during the output potential measurement, a significant amount of black corrosion formed on the surface during the cyclic voltammetry run. This corrosion also occurred in a peroxide-free Alkaline Electrolyte. The instability and corrosion formation confirm their incompatibility with alkaline peroxide electrolytes. The generation of gas bubbles was observed in the following electrodes, in order of greatest to least: Pt, Ag, and Ni. It took about 3 to 5 min in all the cases for the measured cell output potentials to stabilize. Also, stirring during the measurements made no significant changes in the measured output potentials.

3.1.2. Neutral Electrolyte

When used in a cell with the neutral hydrogen peroxide electrolyte, the surfaces of Bi, In, Dy, Er, Gd, Ho, and Tb electrodes formed a corrosion/oxide layer rapidly. The electrodes also had an unexpectedly high measured cell output potential, ranging from 1.3 to 1.8 V. This signifies the generation of corrosion potential at the cell. To improve the results, the surface of the electrodes was covered with 5 μL of 5% Nafion solution (drying at 75 °C for 15 min). This did slow down the rate of visible corrosion formation, but had no difference in the measured cell output potentials. Stirring the electrolyte during the potential measurements also made no significant changes in the measured potentials. The pH of the Neutral Electrolyte did not show any significant changes after being used with any of the electrode combinations.

3.1.3. Acidic Electrolyte 1 and 2

In both Acidic Electrolytes, the surfaces of the Bi, In, Dy, Er, Gd, Ho, and Tb electrodes rapidly formed an oxidation layer. The Ni started to form a light and yet visible oxide layer when it was inserted in either Acidic Electrolyte (Figure 4). This occurred without inducing the flow of charge through the metal. A much higher purity of Ni was used to make a new electrode to ensure that the corrosion was not caused by the level of purity (99.9945% vs. 99%). The high purity Ni electrode behaved the same way, showing visible corrosion from inserting it into the acidic peroxide electrolyte. The nickel corrosion demonstrates that the metal is unfit for acidic peroxide fuel cells. This observation is misreported in the literature, as seen in Table 1. Due to the corrosion formation, the nickel electrode was excluded from investigations involving Acidic Electrolytes. Like the Neutral Electrolyte, the pH of the Acidic Electrolytes did not show a significant change after the measurements with any of the electrode combinations. However, unlike the other electrolytes, stirring did cause the fuel cells’ output potential to change sightly.

3.2. Output Potential and Voltammetry

3.2.1. Alkaline Fuel Cell

For all the electrode combinations in the Alkaline Electrolyte, the cell output potential values are summarized in Table 5. The open circuit potentials for the electrodes that generate high cell output potentials can be found in Figure 5. The potentials were adjusted by +209 mV for the Ag/AgCl reference electrode. Figure 6 summarizes the cyclic voltammograms for all the electrodes in the alkaline electrolyte.

3.2.2. Neutral Fuel Cell

For all the electrode combinations in the Alkaline Electrolyte, the cell output potential values are summarized in Table 6. The open circuit potentials for the electrodes that generate high cell output potentials can be found in Figure 7. The potentials were adjusted by +209 mV for the Ag/AgCl reference electrode. Figure 8 summarizes the cyclic voltammograms for all the electrodes in the neutral electrolyte.

3.2.3. Acidic Fuel Cell

For all the electrode combinations in the Acidic Electrolyte 1 and 2, the cell output’s potential values are summarized in Table 7 and Table 8. The open circuit potentials for the electrodes that generate high cell output potentials can be found in Figure 7. The potentials were adjusted by +209 mV for the Ag/AgCl reference electrode. Figure 9 summarizes the cyclic voltammograms for all the electrodes in the Acidic Electrolyte 1. The voltammograms for the same electrodes in Acidic Electrolyte 2 showed similar results as Acidic Electrolyte 1.
The relative peak power destiny values for each novel electrode was calculated using their voltammogram’s highest current densities and the corresponding potential values. This differs from the conventional method of constructing power density and polarization curves. Table 9 shows the calculated peak power density values for alkaline and acidic peroxide electrolytes. The Neutral Electrolyte results were not included due to its instability and anomalistic voltammograms.

4. Discussion

This experiment is the first of its kind to explore several pure metals as electrode materials in a fuel cell using hydrogen peroxide as the oxidant and reductant. The experiments show that the metals combinations are capable of generating electrical energy at different levels when used in a single-compartment hydrogen fuel cell model. The results demonstrate consistent electrochemical activity when the novel metals are paired with themselves and other commonly used electrodes (like glassy carbon (GC), Ni, Pt, and Ag). The fabricated rare earth metal electrodes had the most stable activity in the alkaline peroxide electrolyte, as no visible oxidation or corrosion formed. In the Alkaline Electrolyte, any combination of electrodes produced a cell output potential of −0.2 V to 0.2 V. The most optimal combination was Dy with Ni, Ag, Ta, and Sb. This is followed by glassy carbon, as shown in Table 5. Dy’s greater cell output potential may be due to it having a similar electrocatalytic activity to GC, as they both performed well with Er. However, this trend did not continue, as GC performed well with Gd, Ho, and Tb, while Dy had a lower output potential when paired with them.
When evaluating results, peak power density is useful for comparing results within similar test conditions, including electrolyte pH, fuel, electrolytic salt concentration, voltammetry sweep range, and sweep rate. As the conditions are kept similar in this experiment, the results can be compared, as shown in Table 9. Ta had the highest electrical power density and alkaline peroxide electrolyte, and Ho had the highest among the rare earth metals. Ta and Sb performed well in the Acidic Electrolyte, delivering similar potential values, with Sb performing the best in an acidic solution with a pH of about 2. It should be noted the quality of the potential values does not correlate with the calculated power density values. Ho, with a larger power density in the alkaline peroxide electrolyte, generated a similar output potential to Er and Tb, despite those having a lower power density than Ho. One possibility for this could be that when Ho is paired with GC in the Alkaline Electrolyte, it produces a similar output potential to Er and Tb, except at a much higher output current. However, this would require further testing to understand.
Acidic peroxide electrolytes are more conducive to catalyzing reactions. Hydrogen peroxide is known to be more stable in acidic pH ranges. As mentioned in the introduction, Equations (1) and (2) are the redox reaction of hydrogen peroxide in acidic pH and Equations (3) and (4) is the reaction in alkaline pH. The alkaline pH enters the reaction in its dissociated form. This reduces the stability of the hydrogen peroxide in an alkaline pH. Therefore, the decrease in stability disproportionately increases the likelihood of hydrogen peroxide. It can be theorized that the decrease in the disproportionation rate of the peroxide in an Acidic Electrolyte allows it to be more efficient at generating electrocatalytic reactions in a fuel cell setup. This follows the trend of Acidic Electrolytes being more effective than Alkaline Electrolytes in the literature.
The cell output potential indicates how each electrode would act as an electrochemical catalyst (as an anode or cathode). This is determined by the sign of the output potential values when measuring the electrodes with a digital multimeter. Attaching the cathode to the positive lead and the negative lead to the anode will result in a positive electrical potential reading. If there is a negative sign, that means the leads were connected in reverse. In this experiment, the novel electrodes act as cathodes when paired with the glassy carbon electrode in the Alkaline Electrolyte. All the rare earth metal electrodes except for Dy displayed cathodic catalytic activity when paired with the Pt and Ni electrodes.
Other literature has predicted that the further the open circuit potential between two electrodes is, the more likely for the pair to generate a greater output potential in a fuel cell setup [21]. This assumption was not entirely accurate in this experiment. Pairing Gd with Ta or Tb in an alkaline peroxide should have yielded the highest output potential; however, as Table 5 shows, this is not the case. Therefore, there may be other mechanisms at play when predicting the output potential from a two-electrode fuel cell setup. This nuance is not commonly reported in other published papers for hydrogen peroxide fuel cells.
The Dy electrode operates similarly to Er, Gd, Ho, and Tb. However, it produces the least amount of output potential when paired with GC or Pt. It is consistently better than the other rare earth metals when paired with Ta, Ag, or Ni electrodes. Dy, Er, Gd, Ho, and Tb have similar atomic structures, empirically measured atomic radii ranging from 175 to 180 picometers, densities in the approximate range of 8 to 9 g/cm3, oxidation states of +1, +2, and +3, low electrical resistance values ranging roughly from 0.8 to 1.3 μΩ/m, and hexagonal close-packed crystal structures. They do have differences in electron configurations and atoms per electron shell, but no reasonable difference for Dy to behave catalytically differently from the other rare earth metals. Further studies are needed to determine the reasons for catalytic behavior.
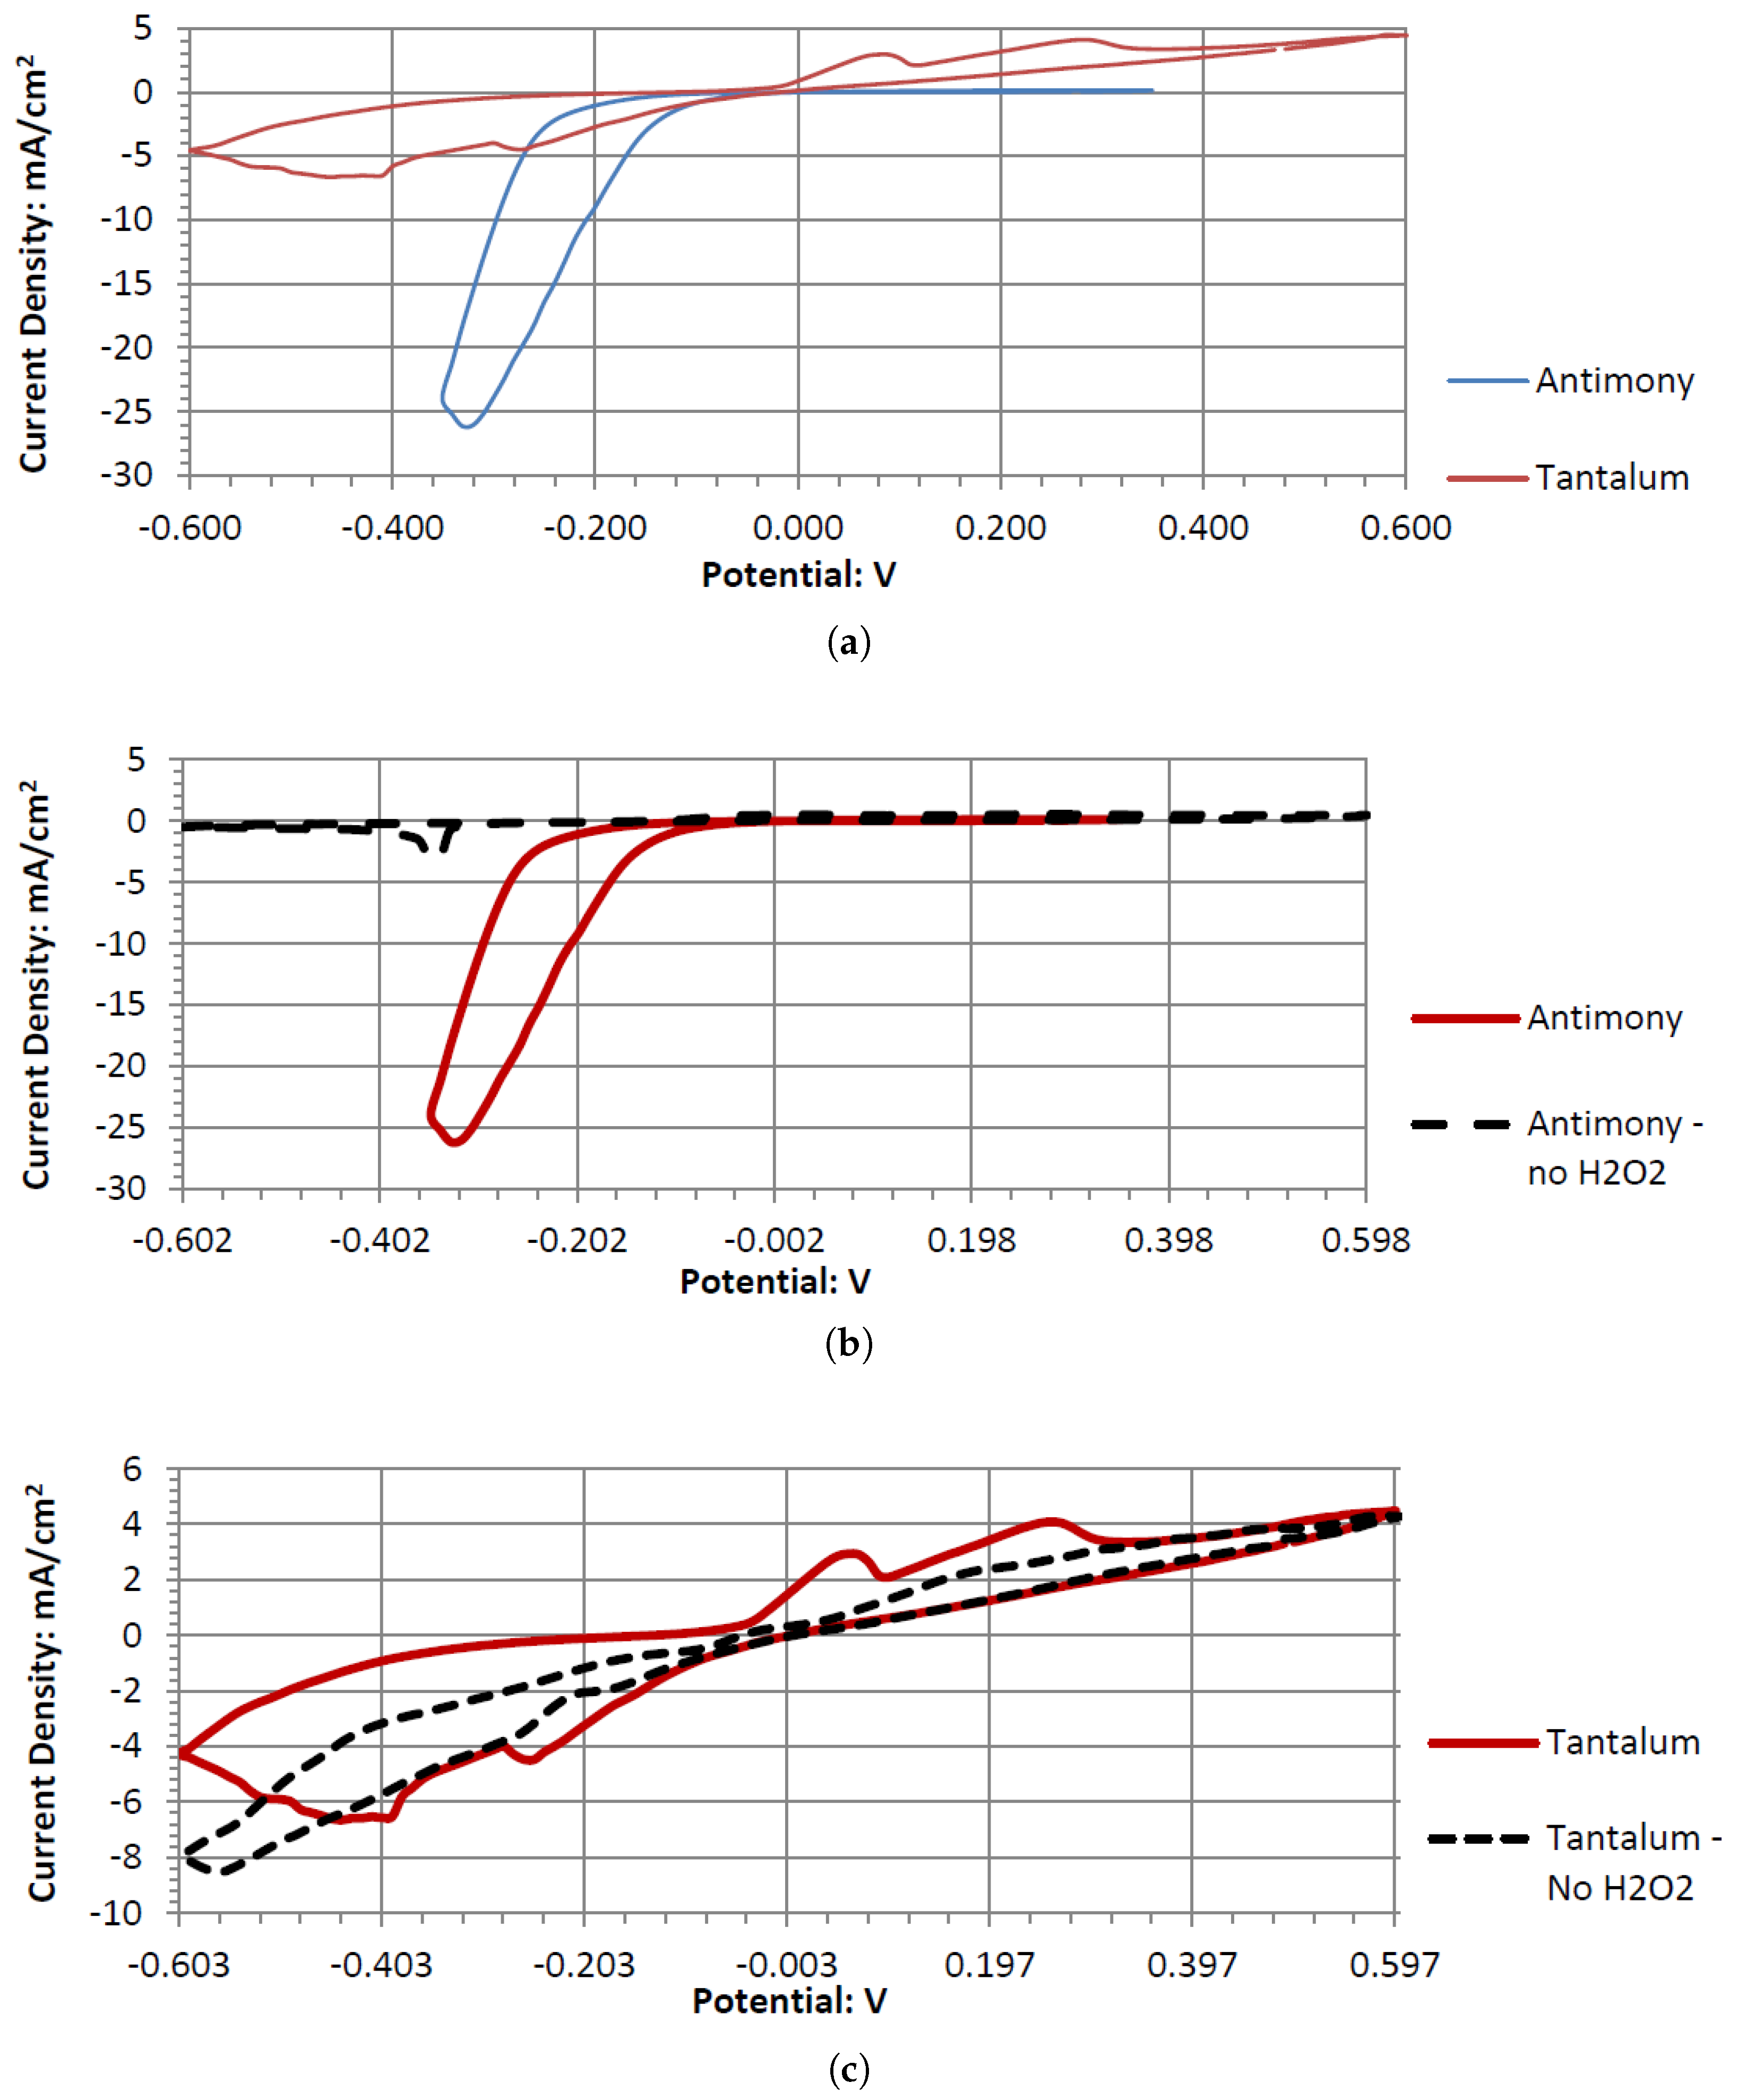
Sb and Ta were the only electrodes tested that were resistant to corrosion in the neutral and acidic hydrogen peroxide electrolytes. Both generated sizable cell output potentials when paired with the Pt electrode. Comparing the various pH peroxide electrolytes, acidic peroxide electrolytes produced a higher output potential. Hydrogen peroxide is also known to have better stability in acidic pH ranges. This leads to the conclusion that an acidic pH is more preferred for the fuel cell model. Sb performs better than Ta when paired with Pt in a neutral electrode. The performance difference decreases as the pH decreases. Also, as the pH decreases to 2, the differences in the output potential between Sb and Ta also decrease. As it decreases further to 1.08, Ta begins to outperform Sb, generating a higher output potential (when paired with Pt). The opposite trend is observed with the open circuit potentials. Sb has a higher OCP in acidic pH solutions and Ta has a higher OCP than Sb in a neutral pH. When paired with the Pt electrode, the Ta and Sb act as anodic electrocatalysts in the neutral and acidic peroxide electrolytes.
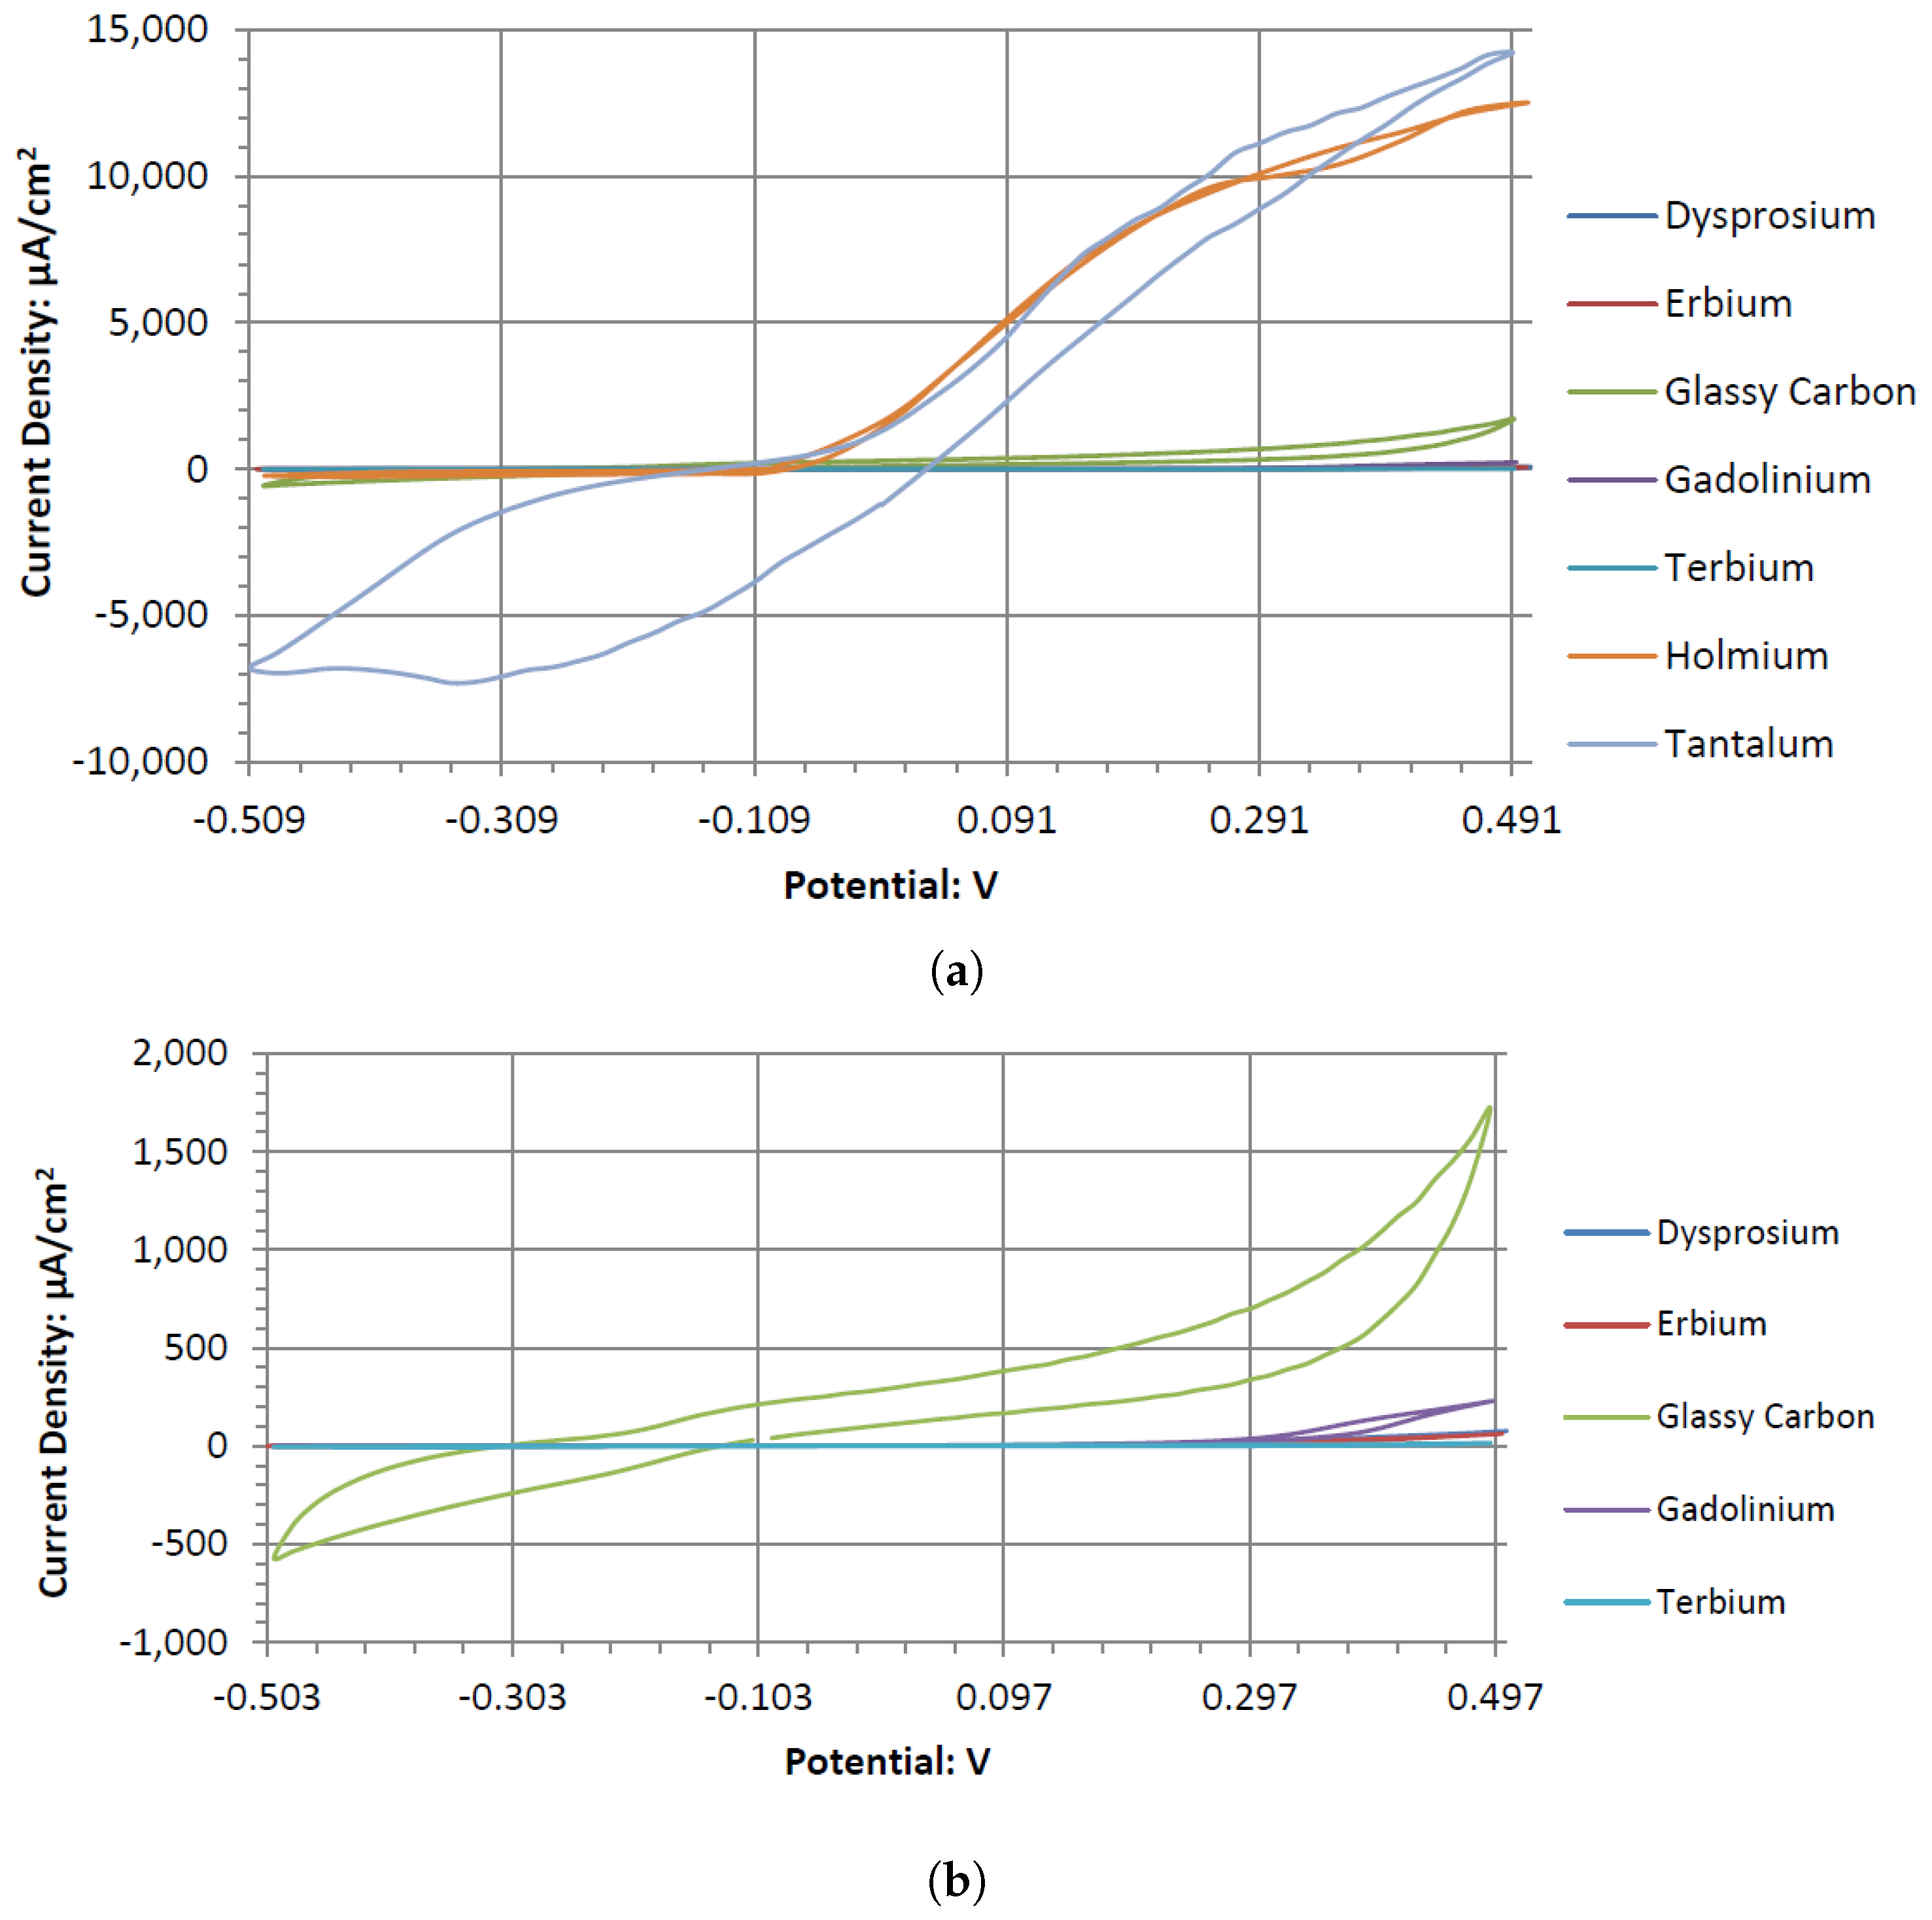
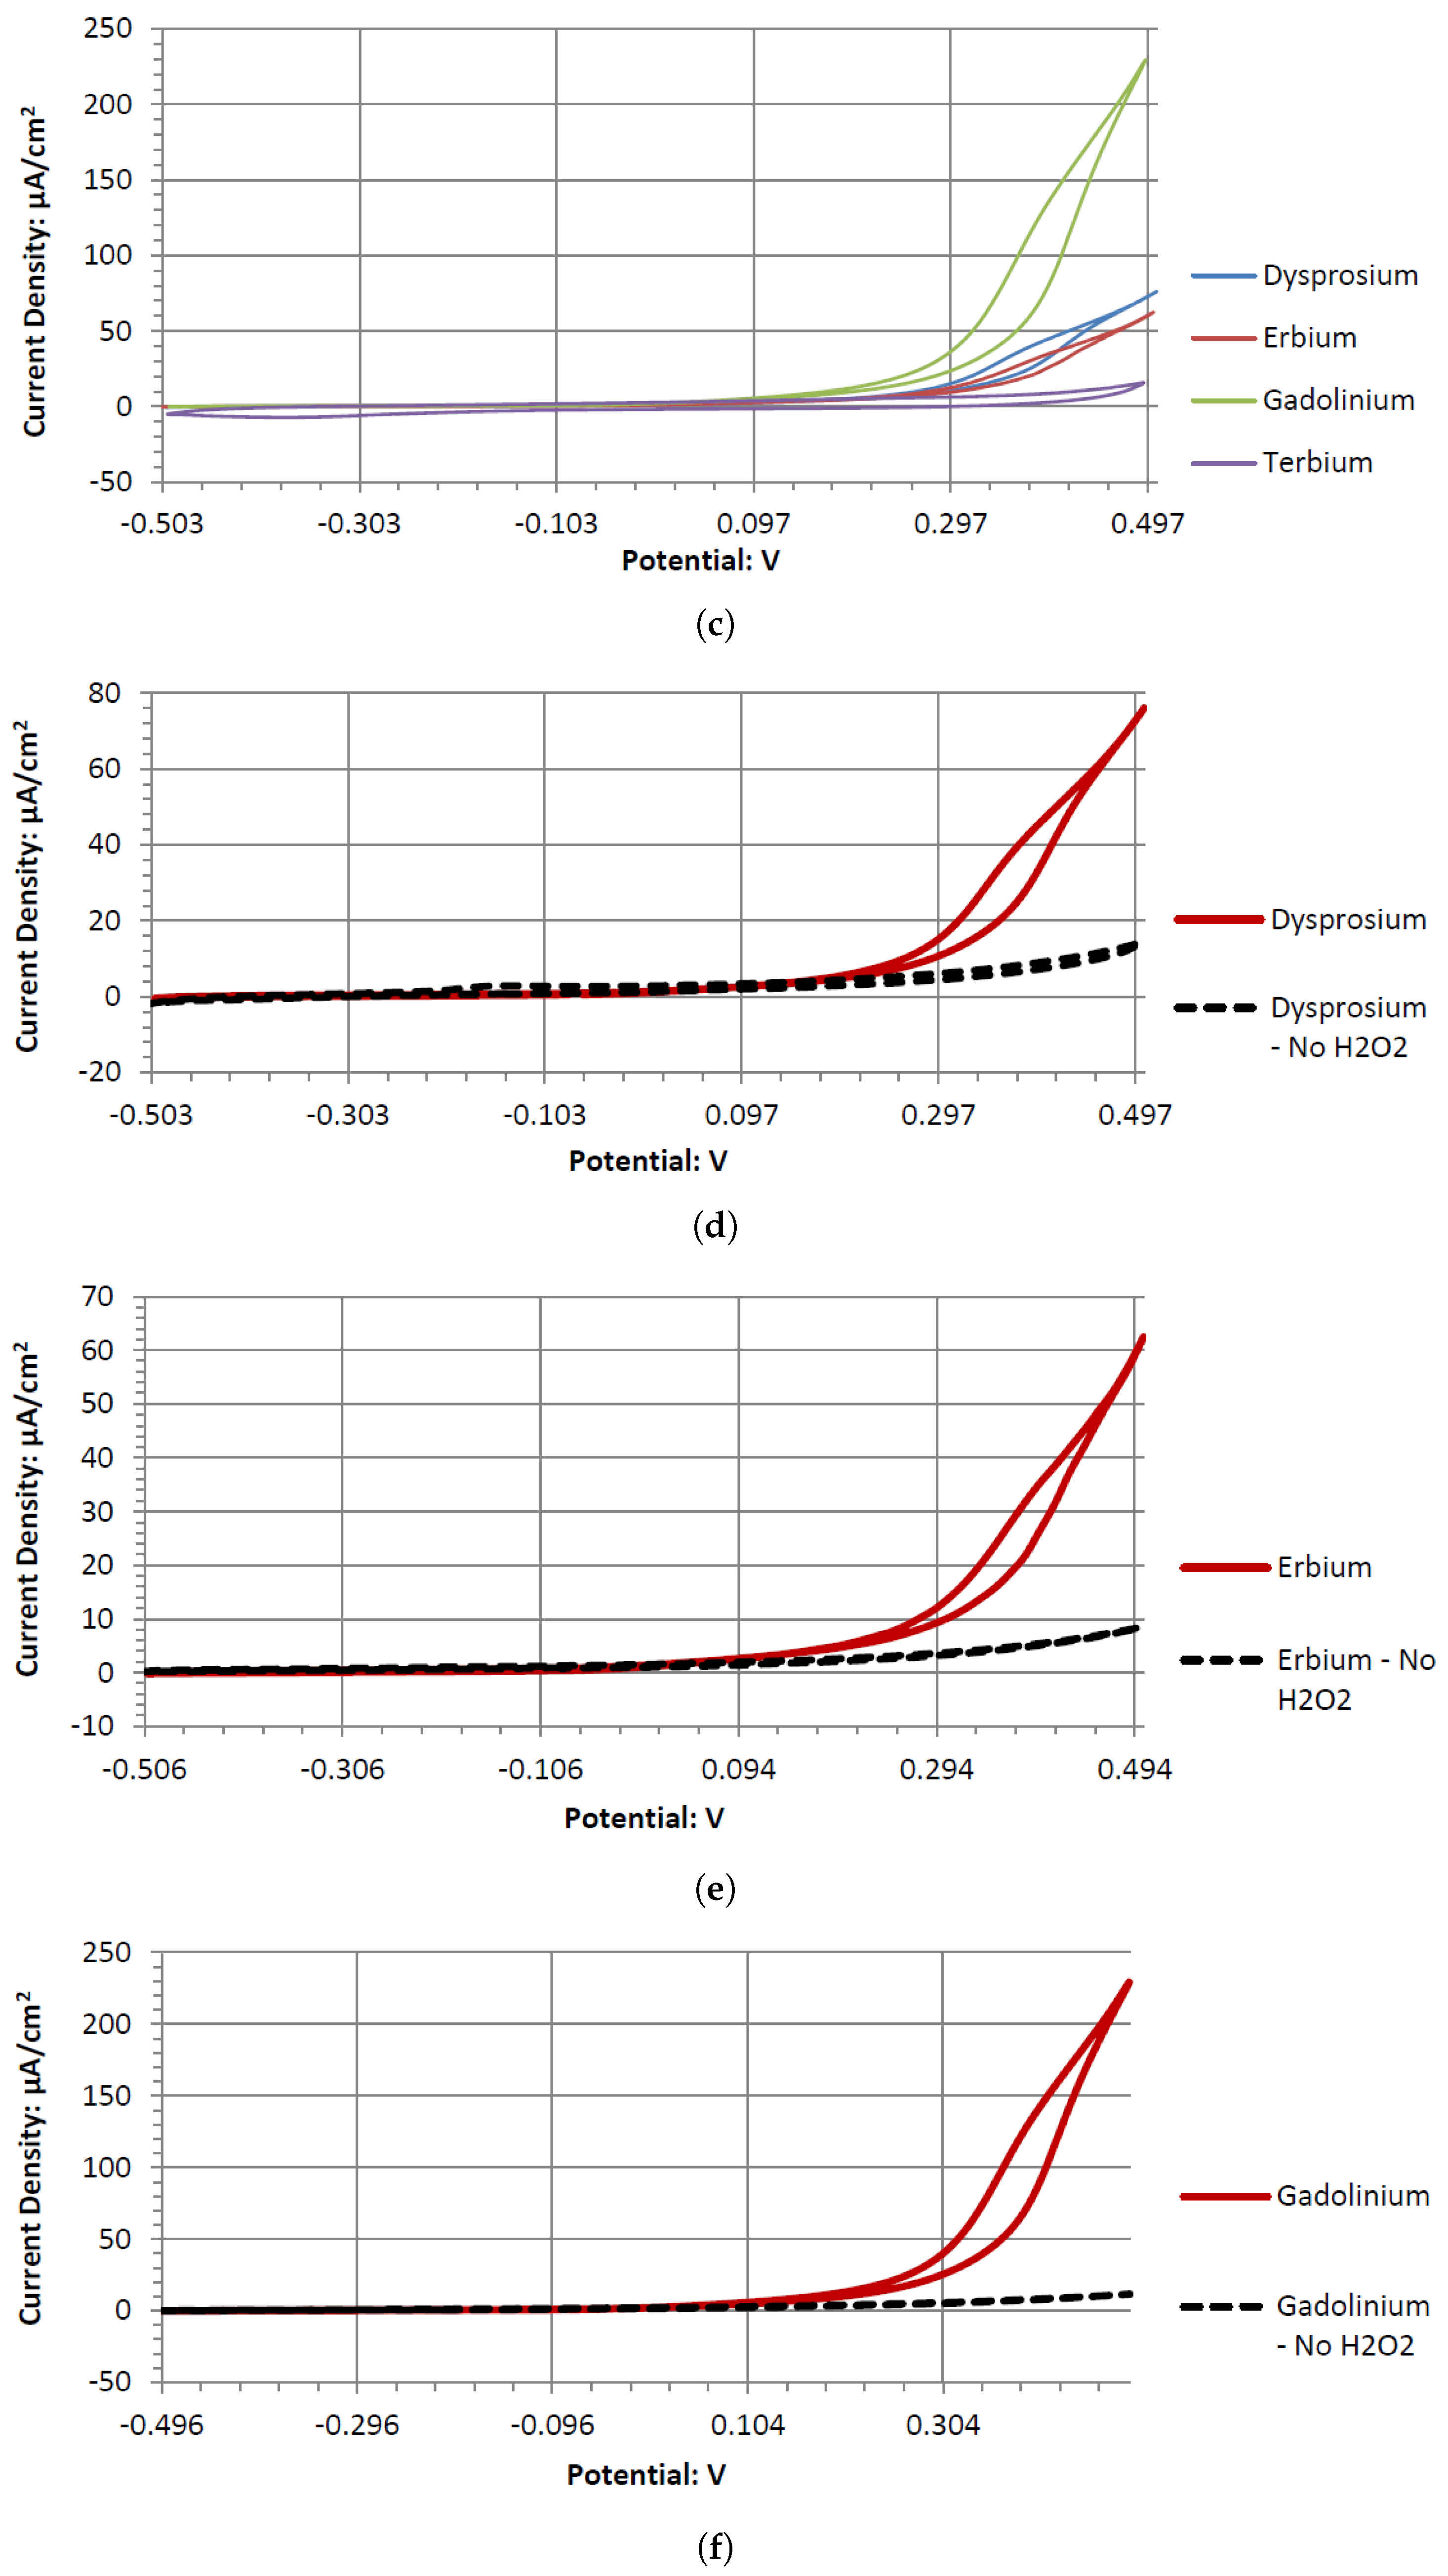
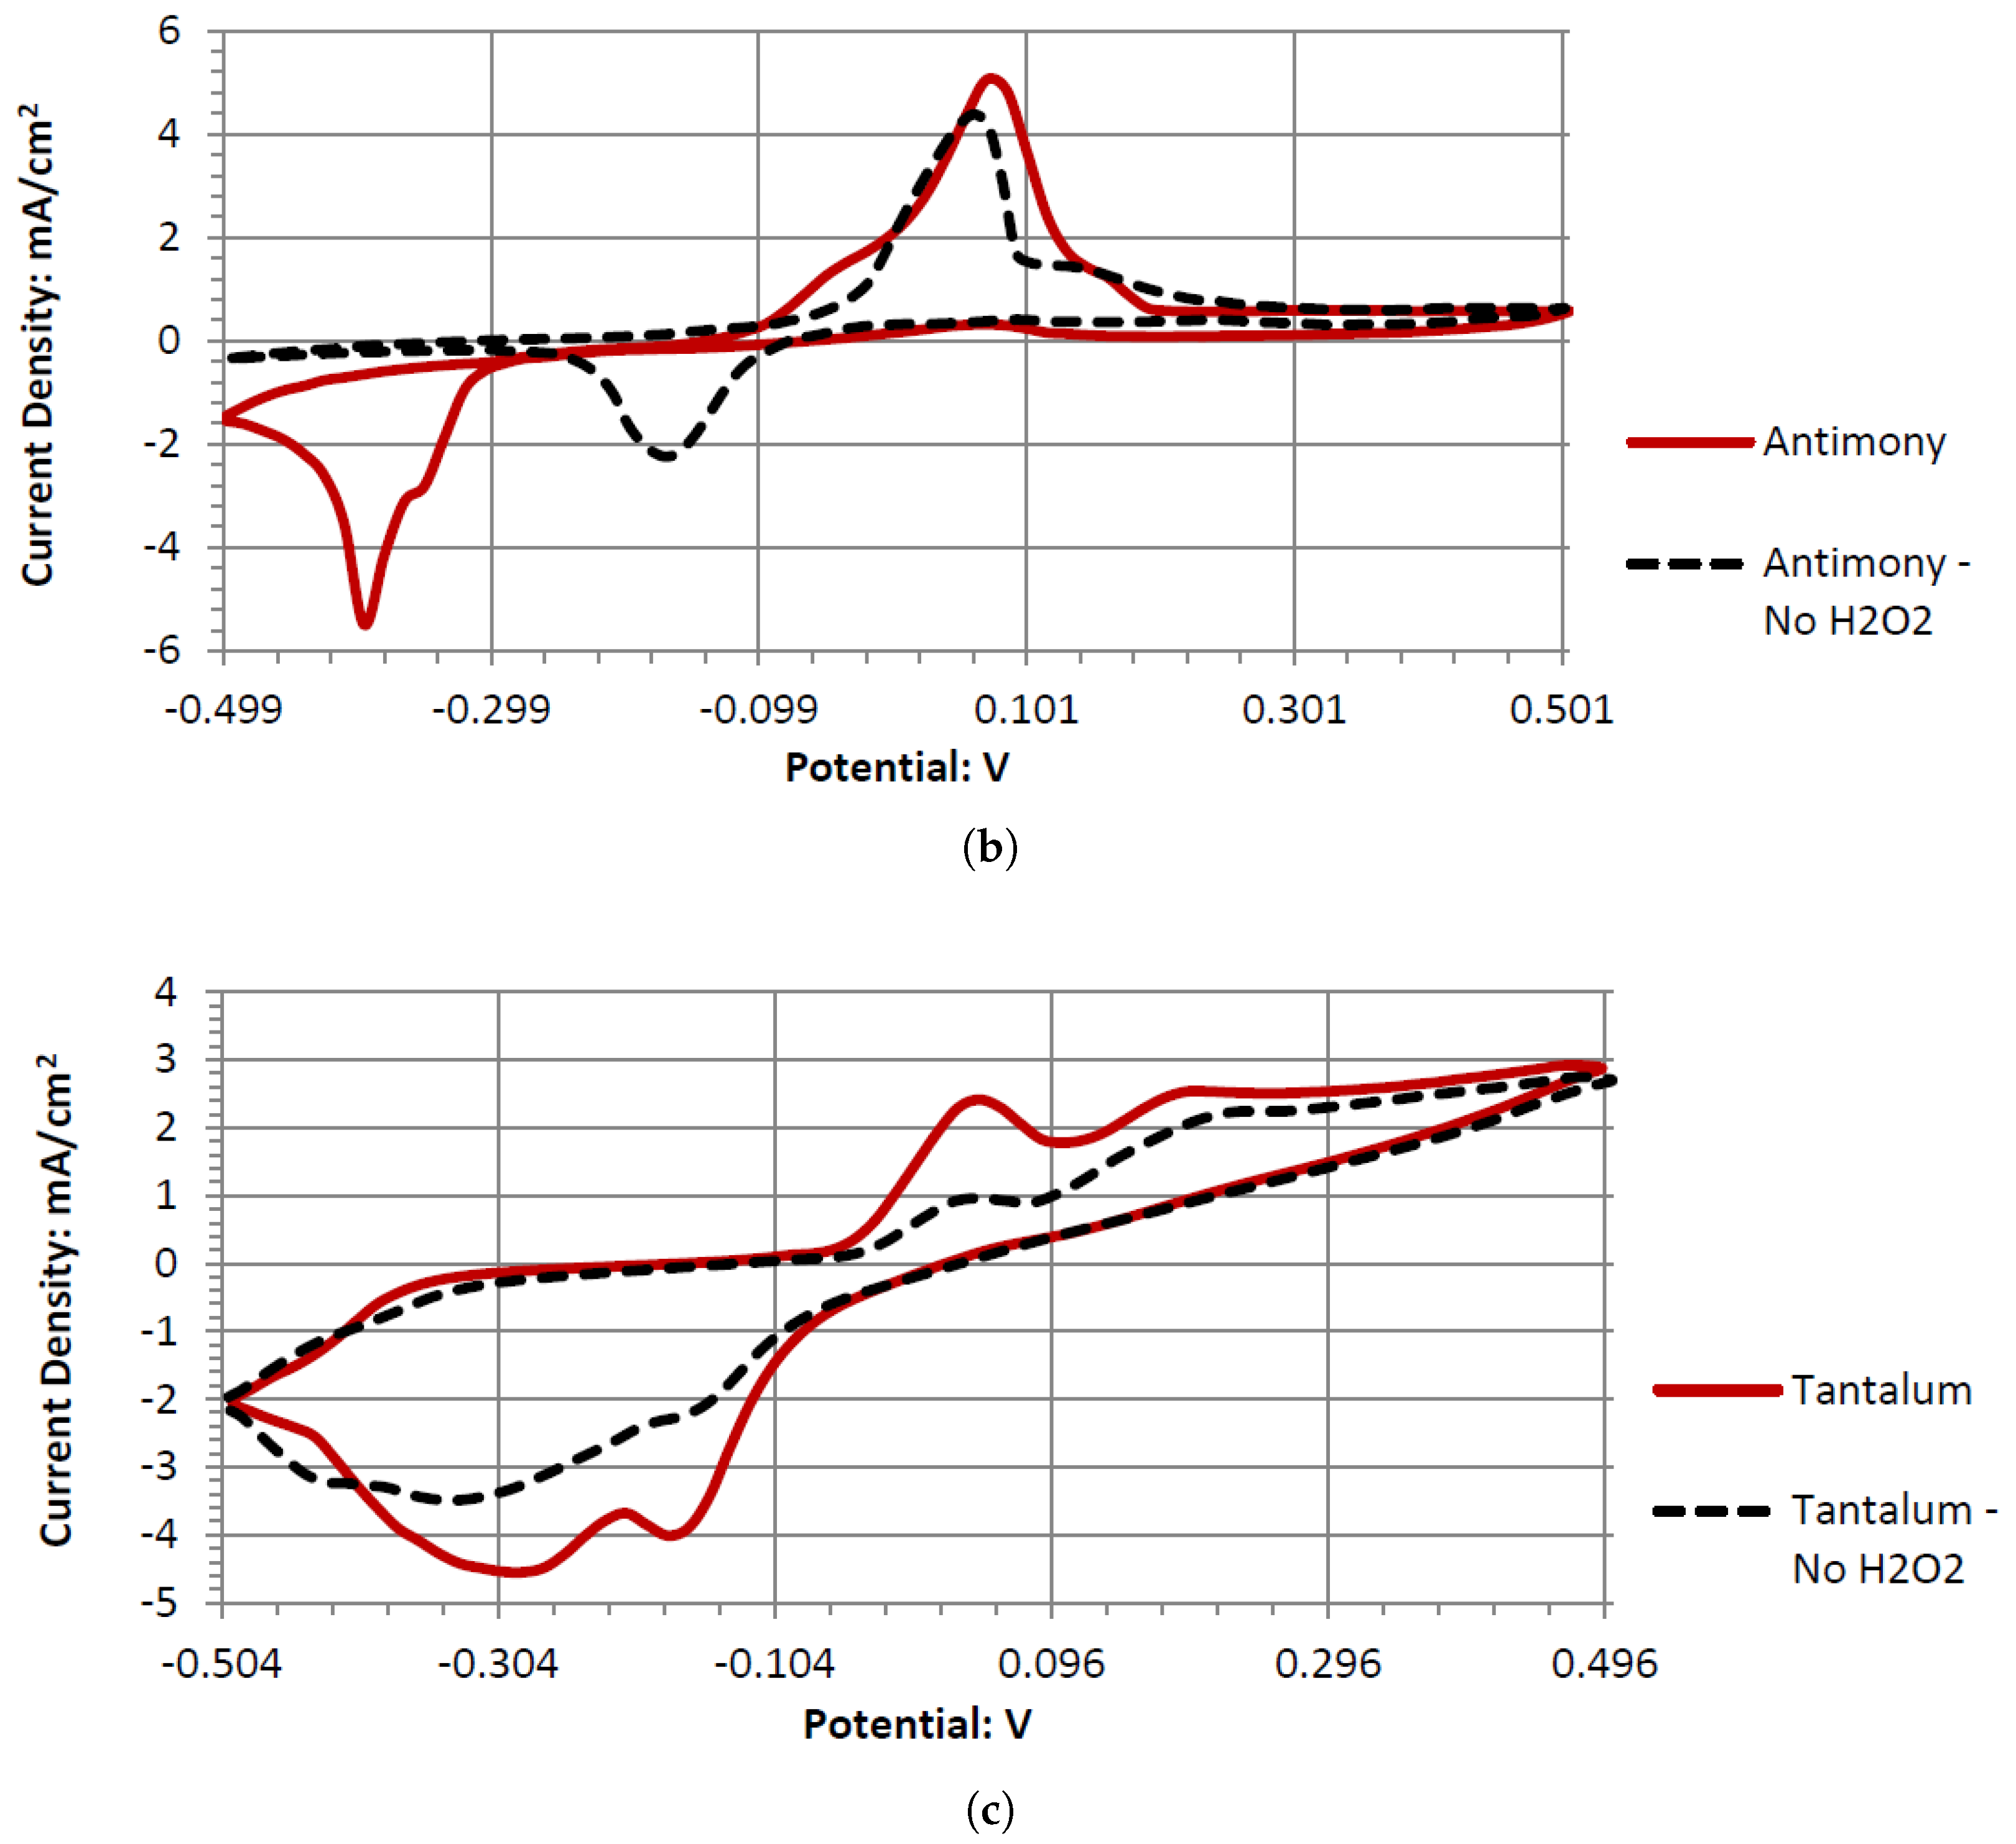
Dy, Er, and Gd produce typical catalytic cyclic voltammograms whether or not they are in peroxide or peroxide-free Alkaline Electrolytes. In the cyclic voltammograms, they have an anodic voltage sweep, indicating oxidative catalysts. Gd and Er voltammagrams have similar potentials around 0.1 V, whereas Dy has a higher potential of 0.2 V. The voltammograms of GC have similar shapes in the presence of hydrogen peroxide and without it. This could be due to GC’s natural defects, where the carbon oxidation can occur at microscopic fault areas through the electrochemical reactions with the dissolved oxygen in the water and hydrogen peroxide in both the anodic and cathodic sweeps. It is also possible the GC has low anodic catalytic activity with hydrogen peroxide, where Ta and Sb would be the main source of the output potentials shown in Table 5.
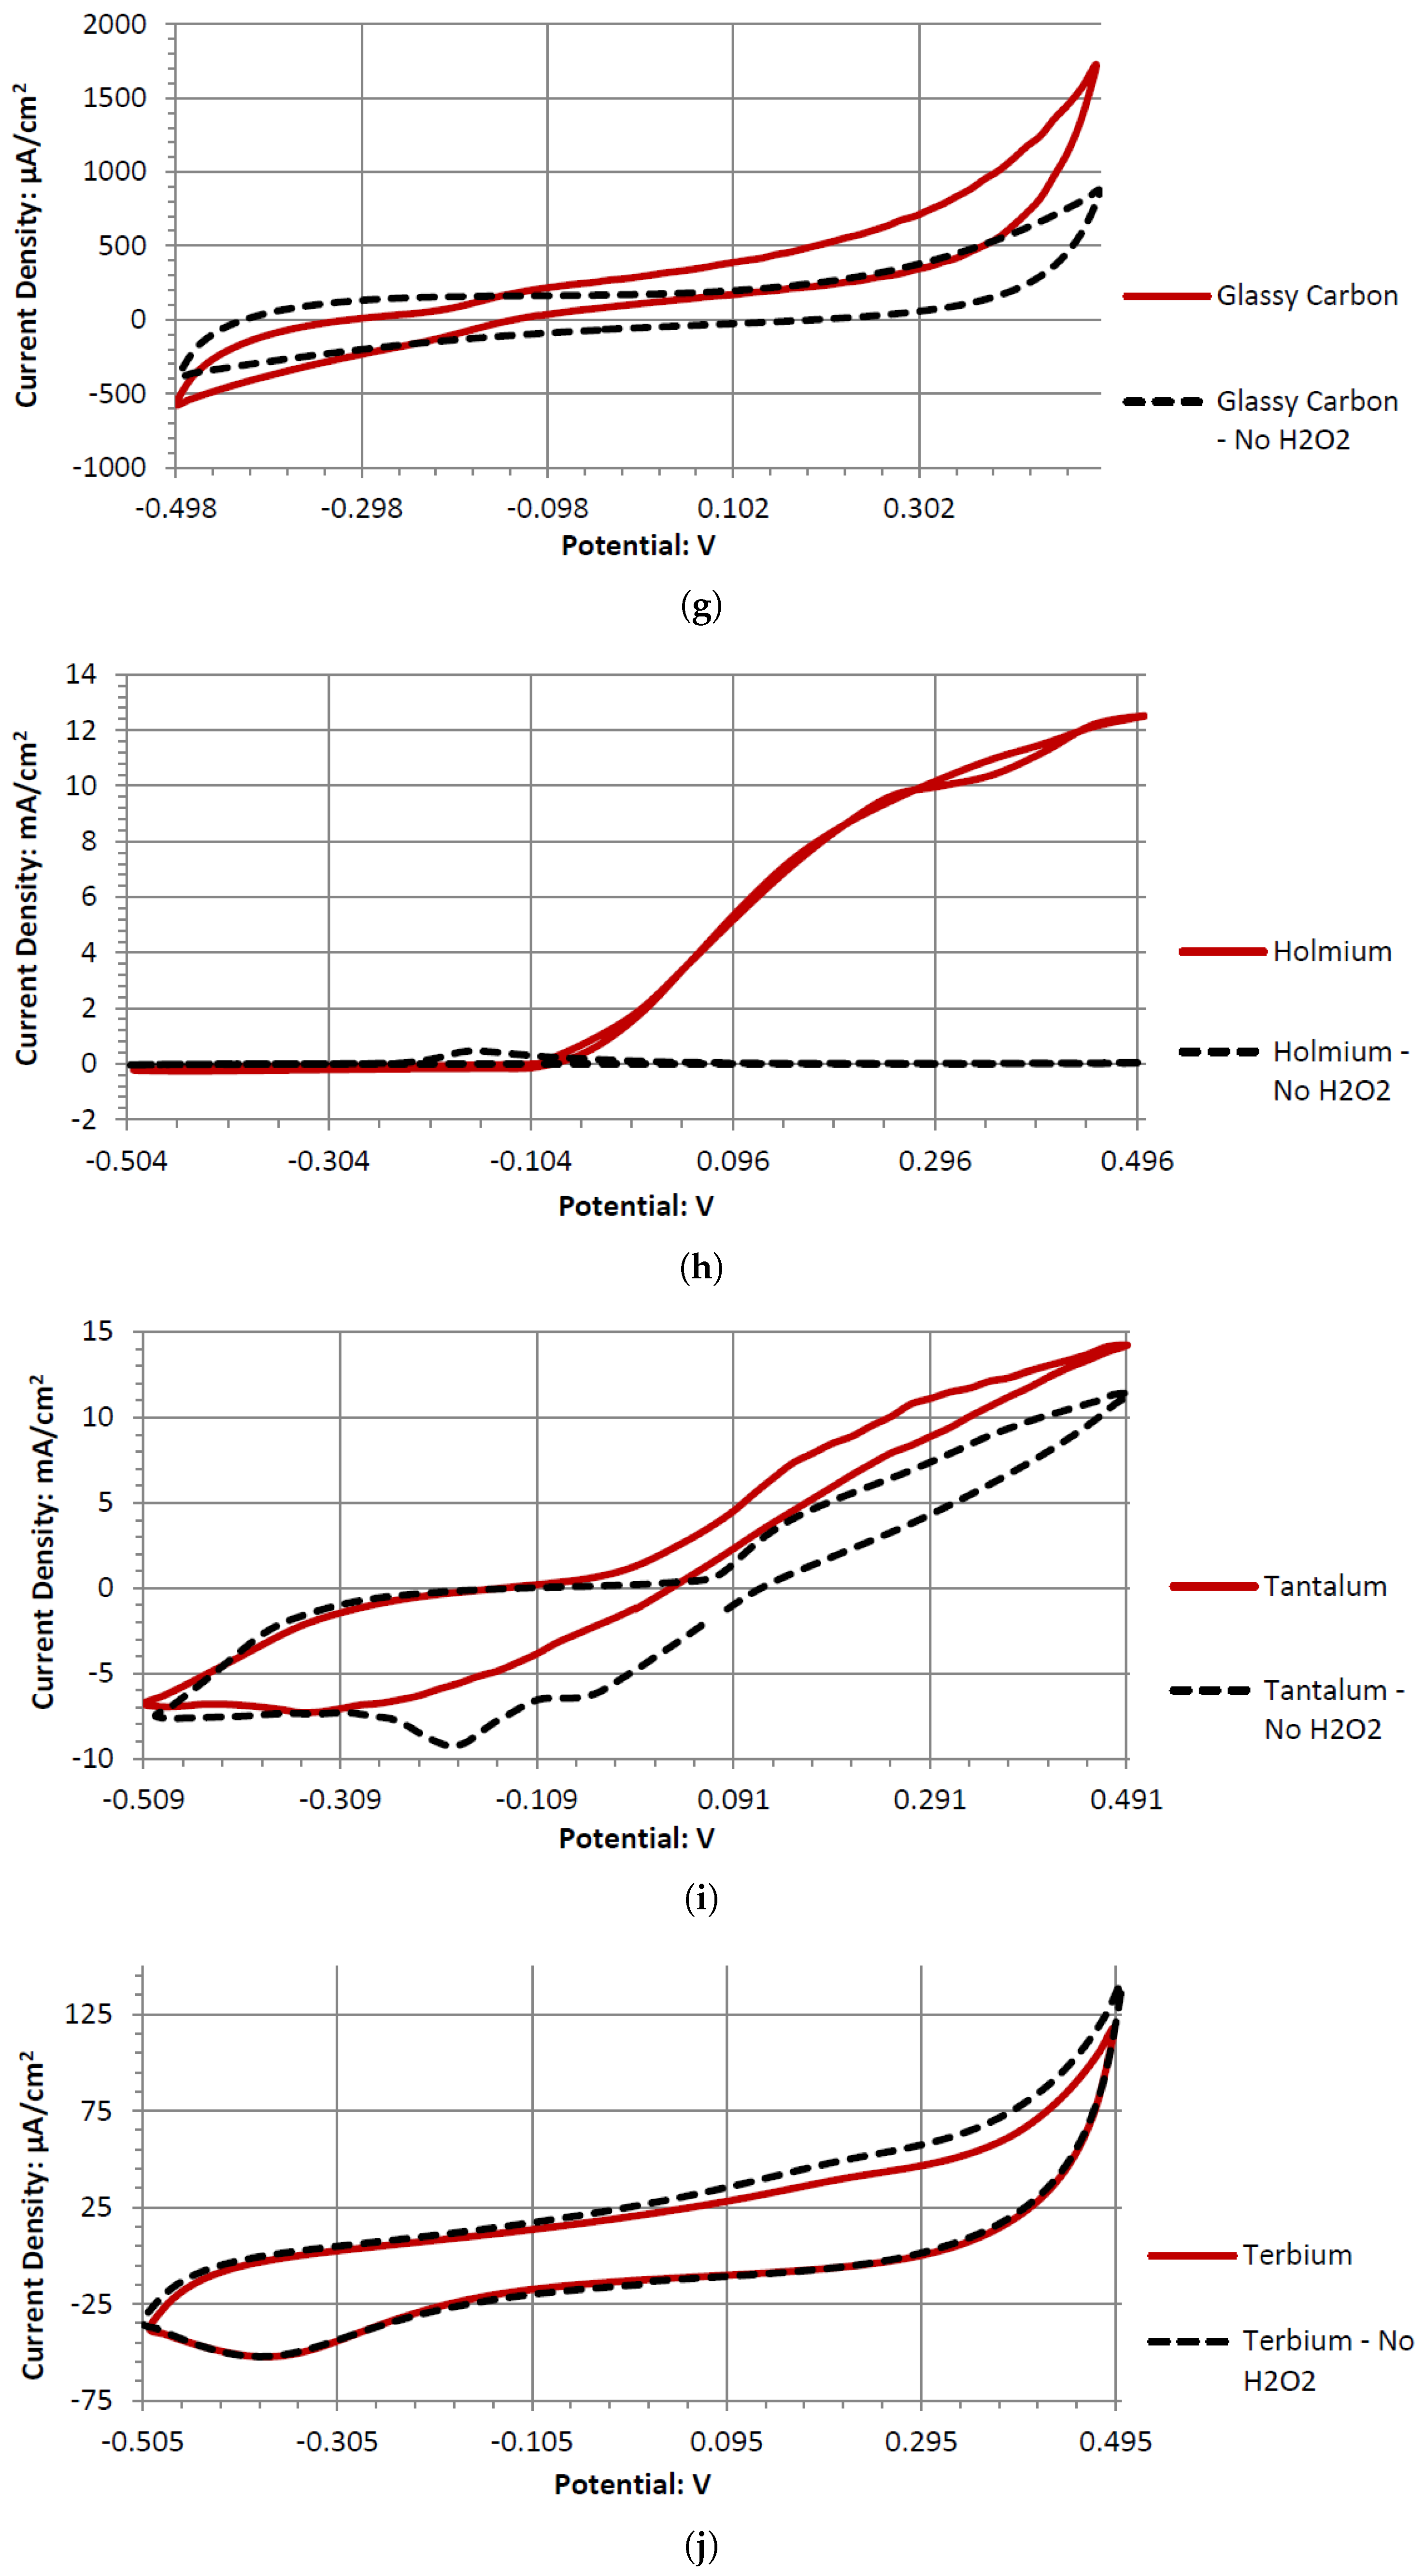
Looking at Ho in the oxidative region at the early anodic sweep potentials, it had one of the strongest catalytic rises in its voltammogram. This rise lasted well beyond 0.5 V, after which it started to plateau. The plateau could be a sign of a need for higher mass transport of hydrogen peroxide to this electrode; however, a concentration of 0.3 M of hydrogen peroxide should be a sufficient amount of hydrogen peroxide molecules near the surface of the Ho electrode. Although Ho had a strong catalytic voltammogram, it cannot perform substantially better than the other novel electrodes in generating cell output potentials when paired with the glassy carbon electrode. The voltammogram of Ho had one of the highest current densities during the anodic voltage sweep, and therefore, it is possible that though it produces a similar output potential as Er, Gd, and Tb, a fuel cell of Ho and GC in alkaline peroxide could produce a higher electric current.
Tb’s voltammogram showed no catalytic activity in the anodic or cathodic directions when scanned in the range of −0.5 to 0.5 V. This is surprising, as Tb can generate a considerable cell output potential when paired with the GC electrode in an Alkaline Electrolyte. Given the inert catalytic activity, the measured potential may be a result of the paired electrodes catalytic activity. An electrode pairing that uses Tb would likely create a measurable amount of potential with low amounts of current.
Sb demonstrated a similar electrochemical activity to Tb in alkaline peroxide. The Sb electrode would generate a large output potential even though the electrode itself formed surface corrosion when used in a cyclic voltammetry experiment. This corrosion could be the result of a low current and a higher output potential. Therefore, forcefully sweeping the potentials in a cyclic voltammetry leads to the observed surface corrosion layer.
Ta is a strong electrode in alkaline peroxide. Compared to any other novel electrode tested, it has the greatest catalytic peak rise in the oxidative scan direction. The catalytic peak also increases by about 3 mA/cm2 at 0.5 V when hydrogen peroxide is included. In the electrolyte without hydrogen peroxide, it is composed of water and sodium hydroxide. It is unknown what is being oxidized during the Ta electrodes cyclic voltammetry, as it would require a much higher potential for the hydroxide ion to oxidize in alkaline pH to form water. It also takes a higher potential than 0.5 V to generate tantalum hydroxide or tantalum oxide. Ta was also one of the only electrodes that was compatible in the alkaline, neutral, and acidic pH ranges, keeping its polished surface after any electrochemical tests.
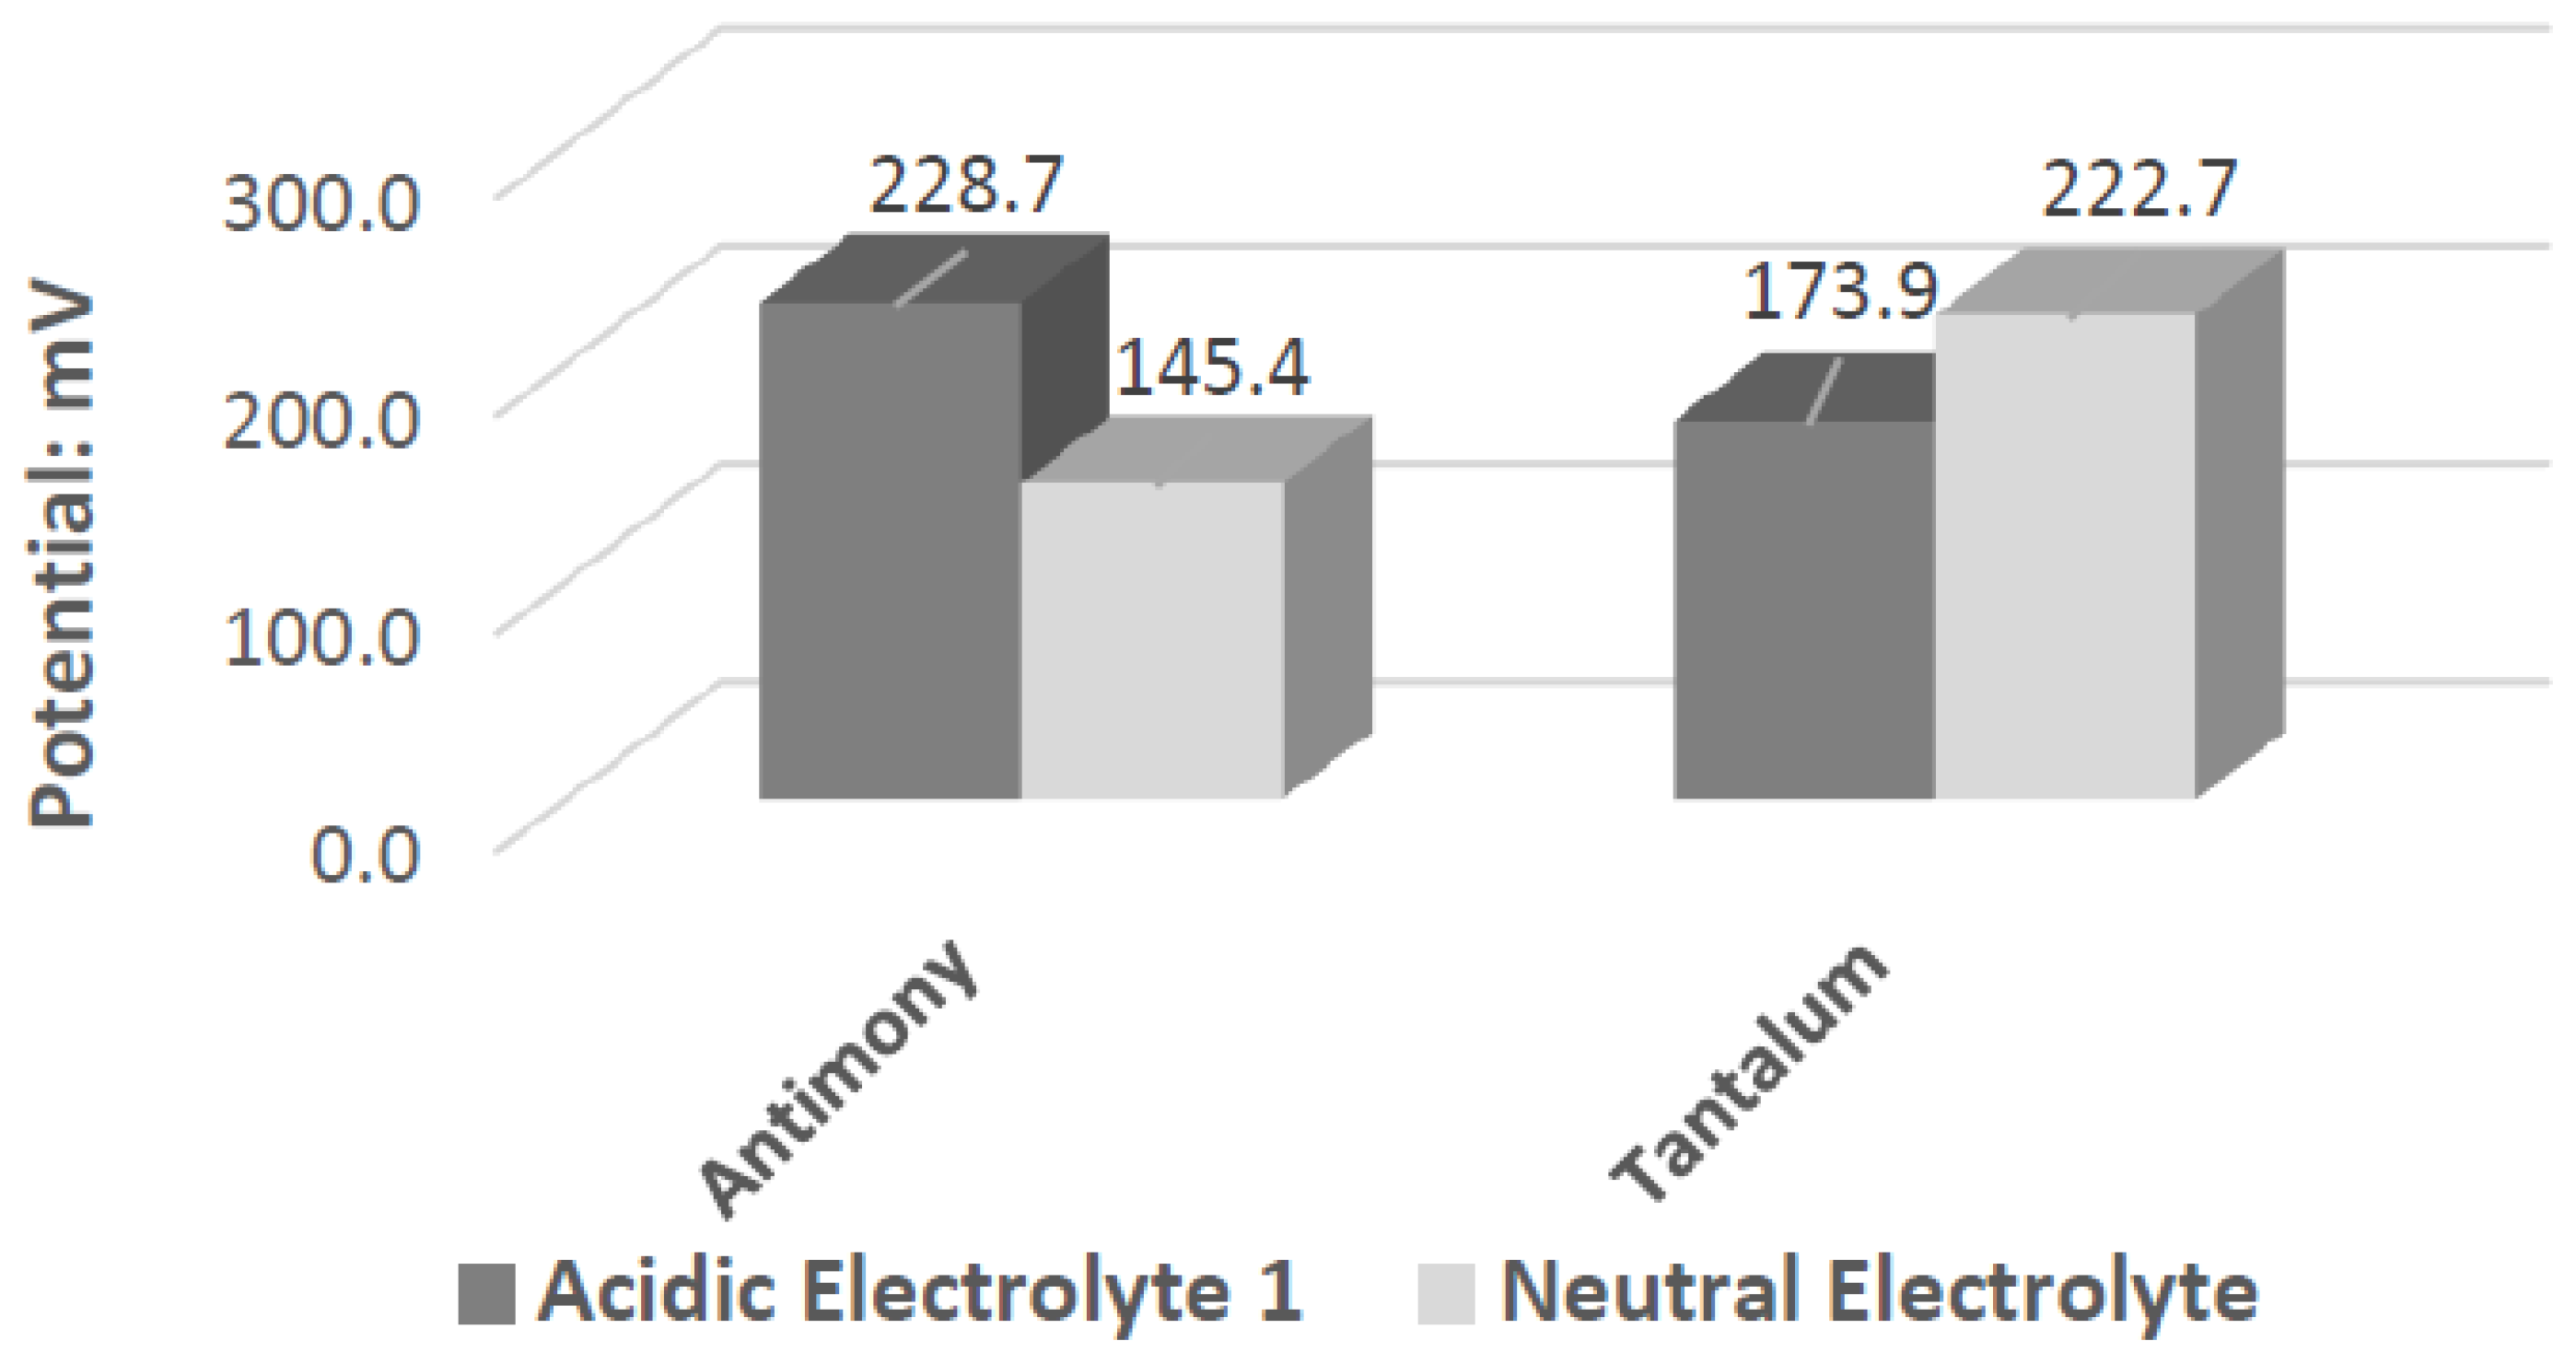
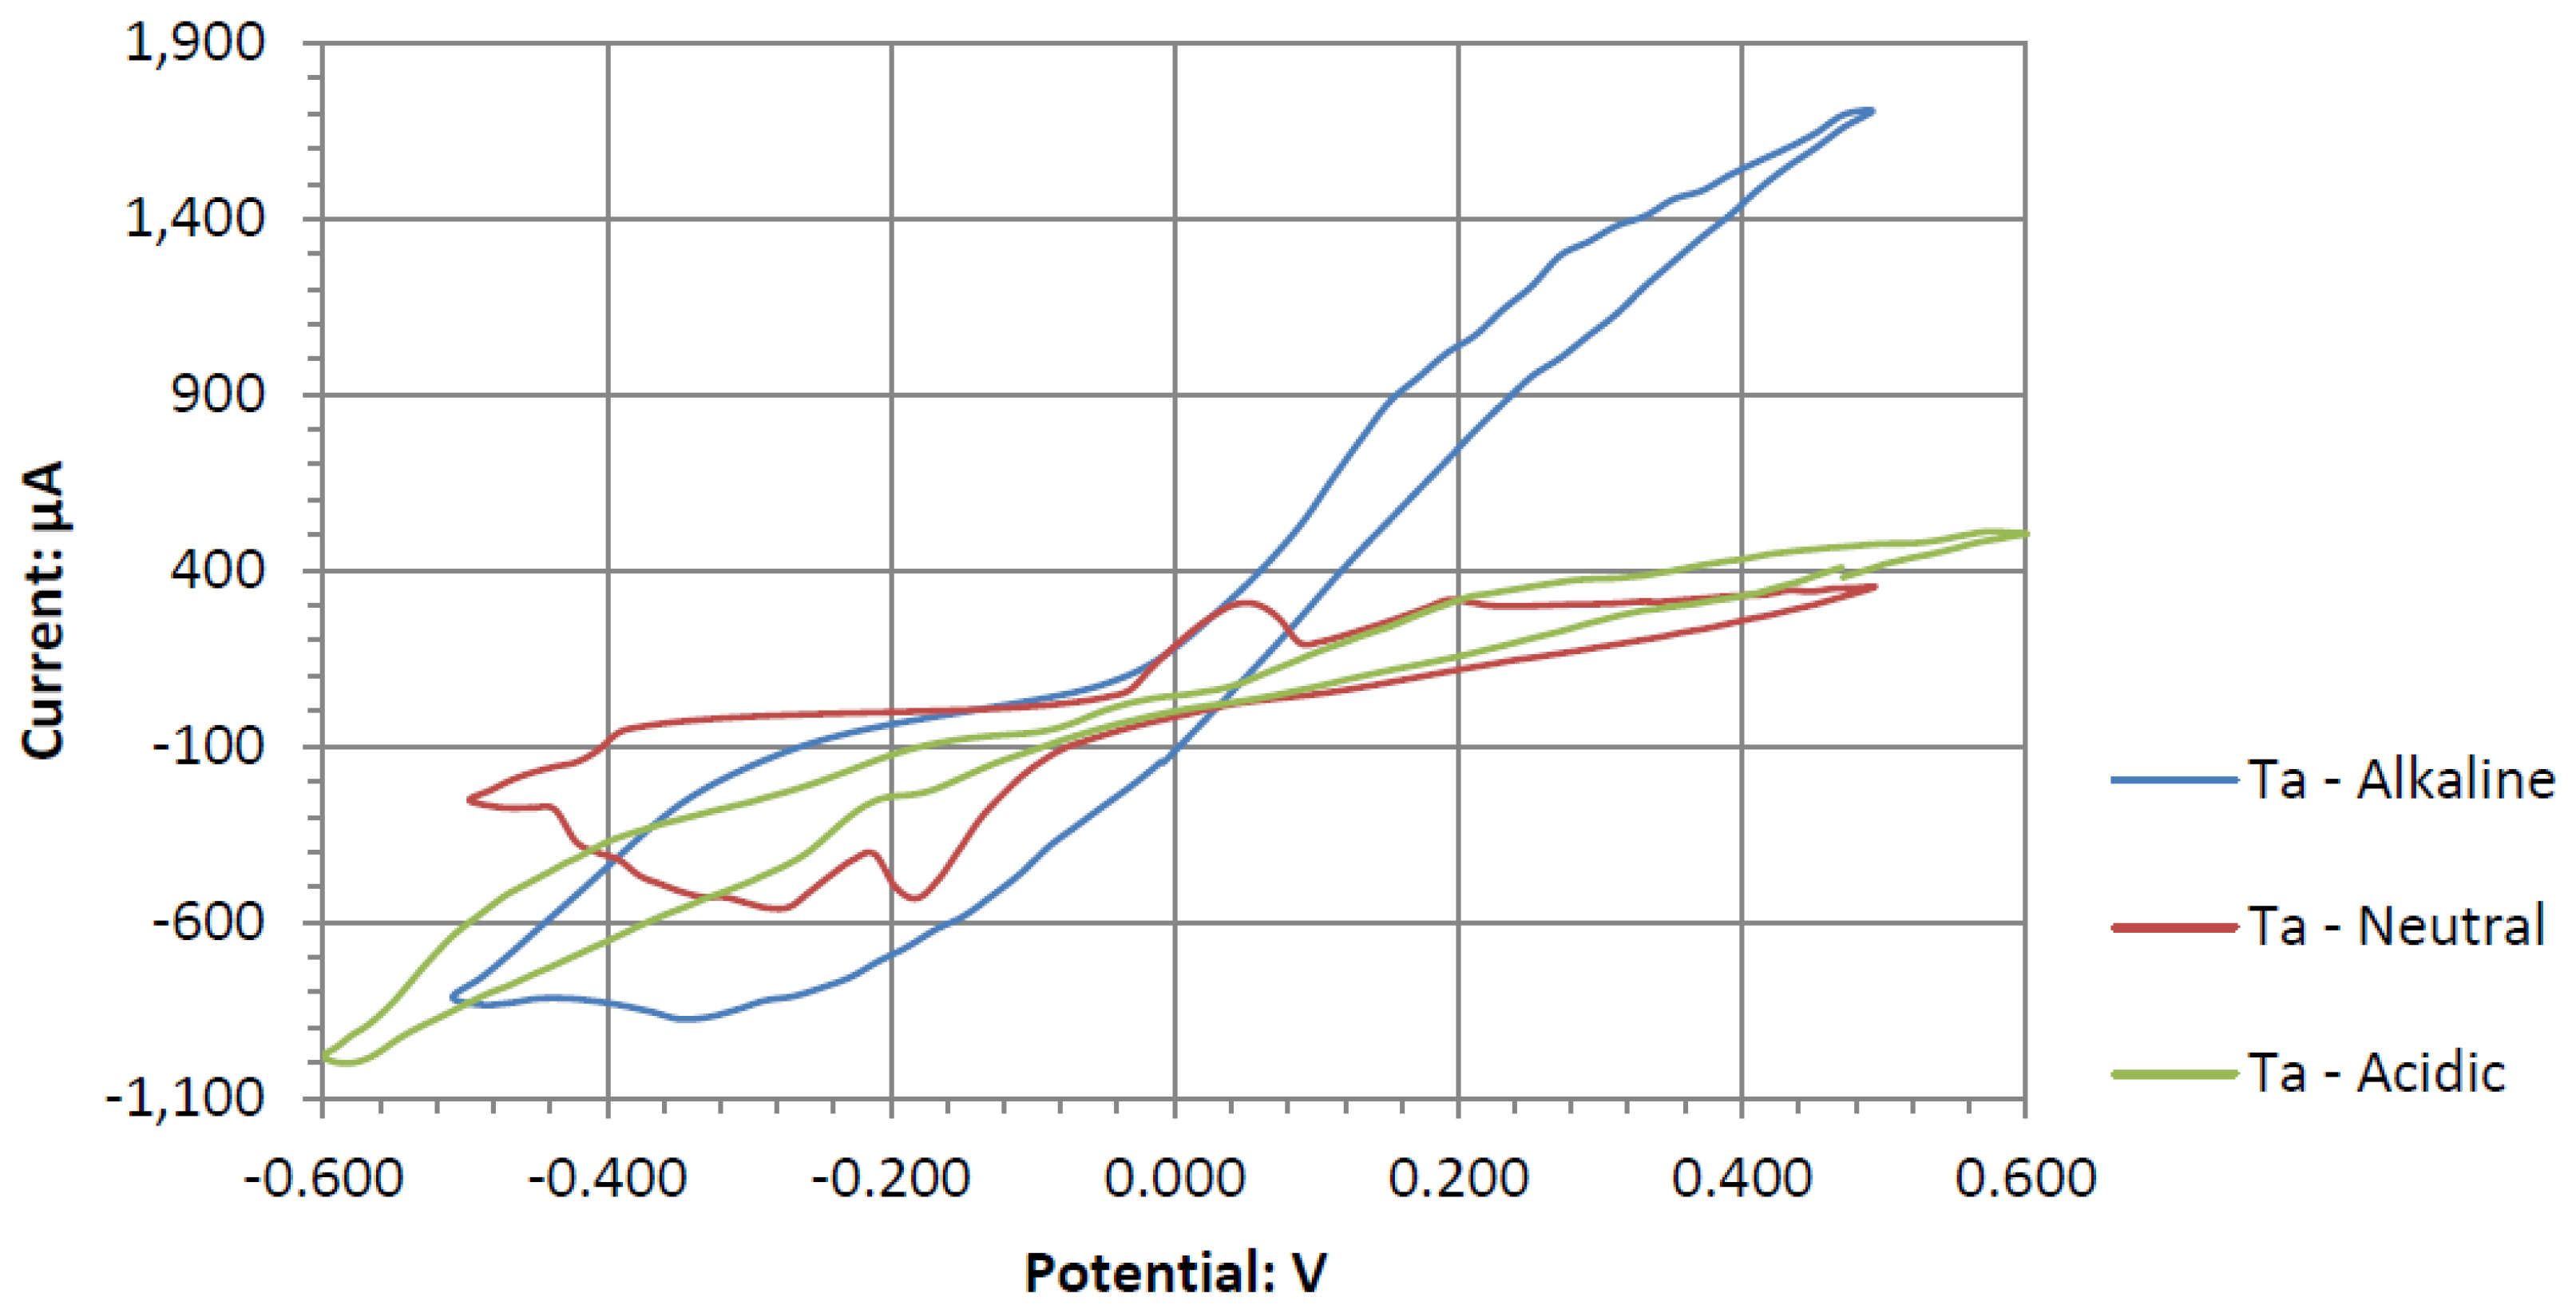
Ta’s different catalytic activity in the presence of hydrogen peroxide in acidic, alkaline, and neutral pH electrolytes can be observed by overlapping its voltammograms in 
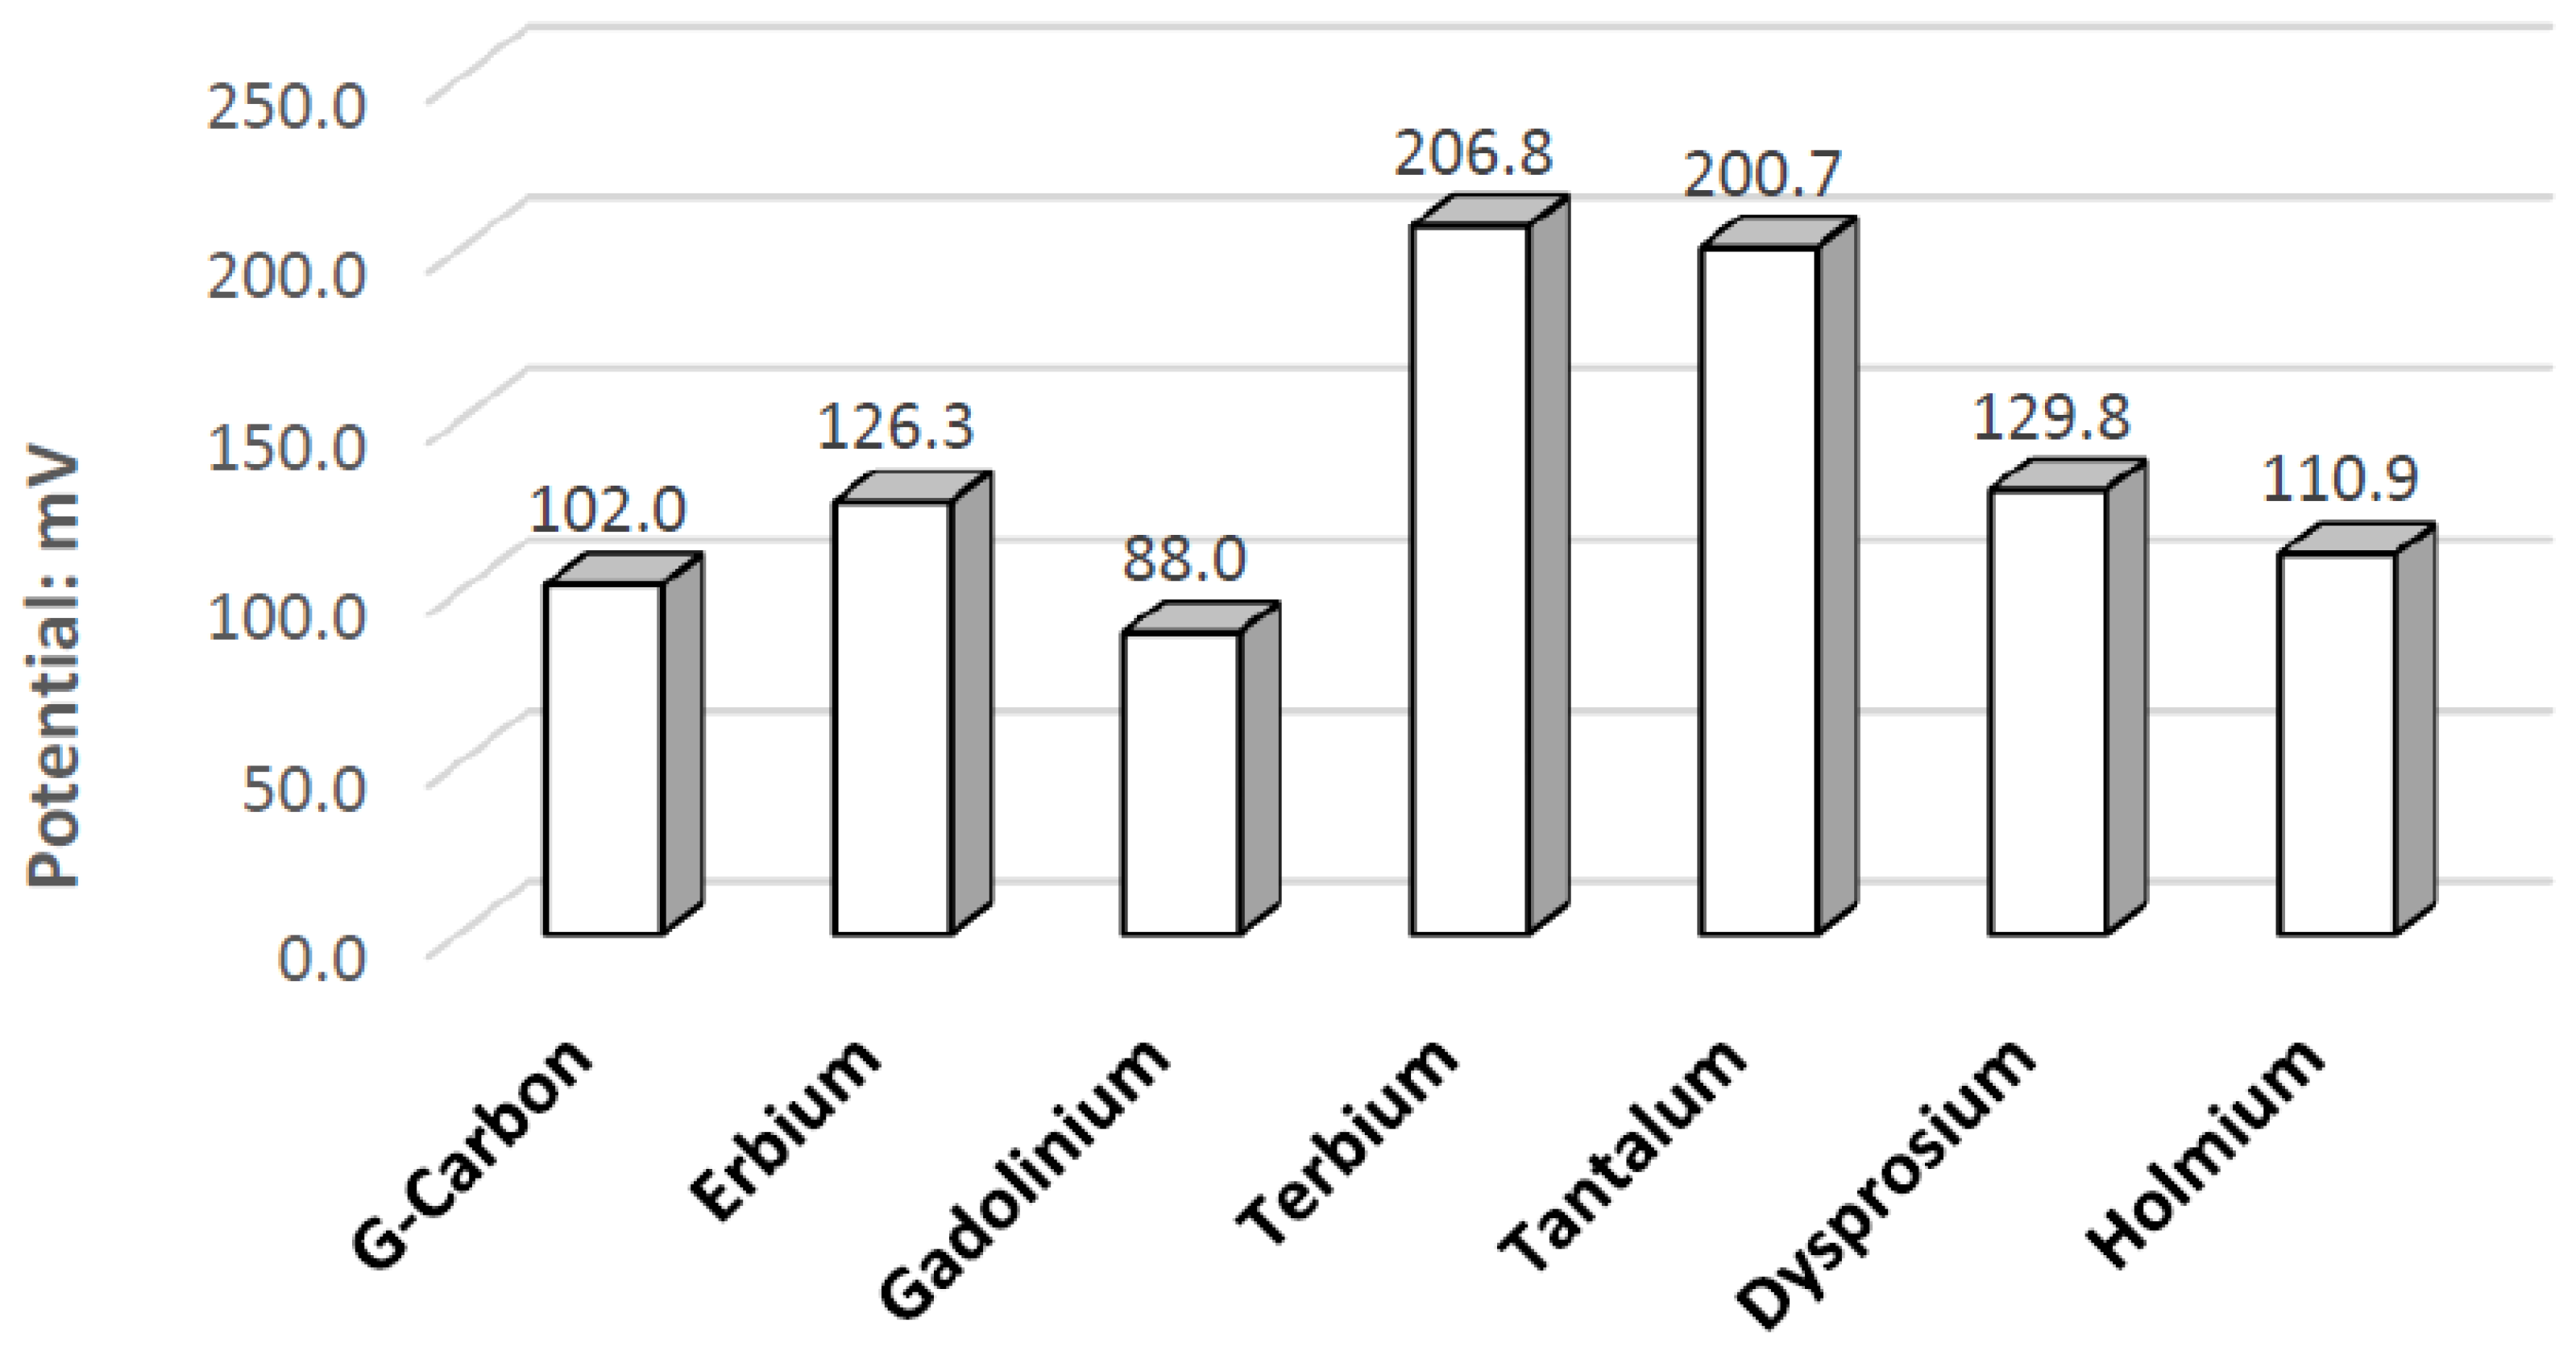
Figure 10. In the three pH electrolytes, Ta has similar onset potentials in the anodic potential sweep direction. The open circuit potentials in the various electrolytes decrease in order of neutral (222.7 mV), alkaline (200.7 mV), and acidic (173.9 mV). The slope of the catalytic voltammogram peaks in the anodic sweep decreases in the order of alkaline, acidic, and neutral. This demonstrates that a Ta electrode in an alkaline peroxide electrolyte will lead to a lower output potential and higher current compared to using an acidic peroxide electrolyte.
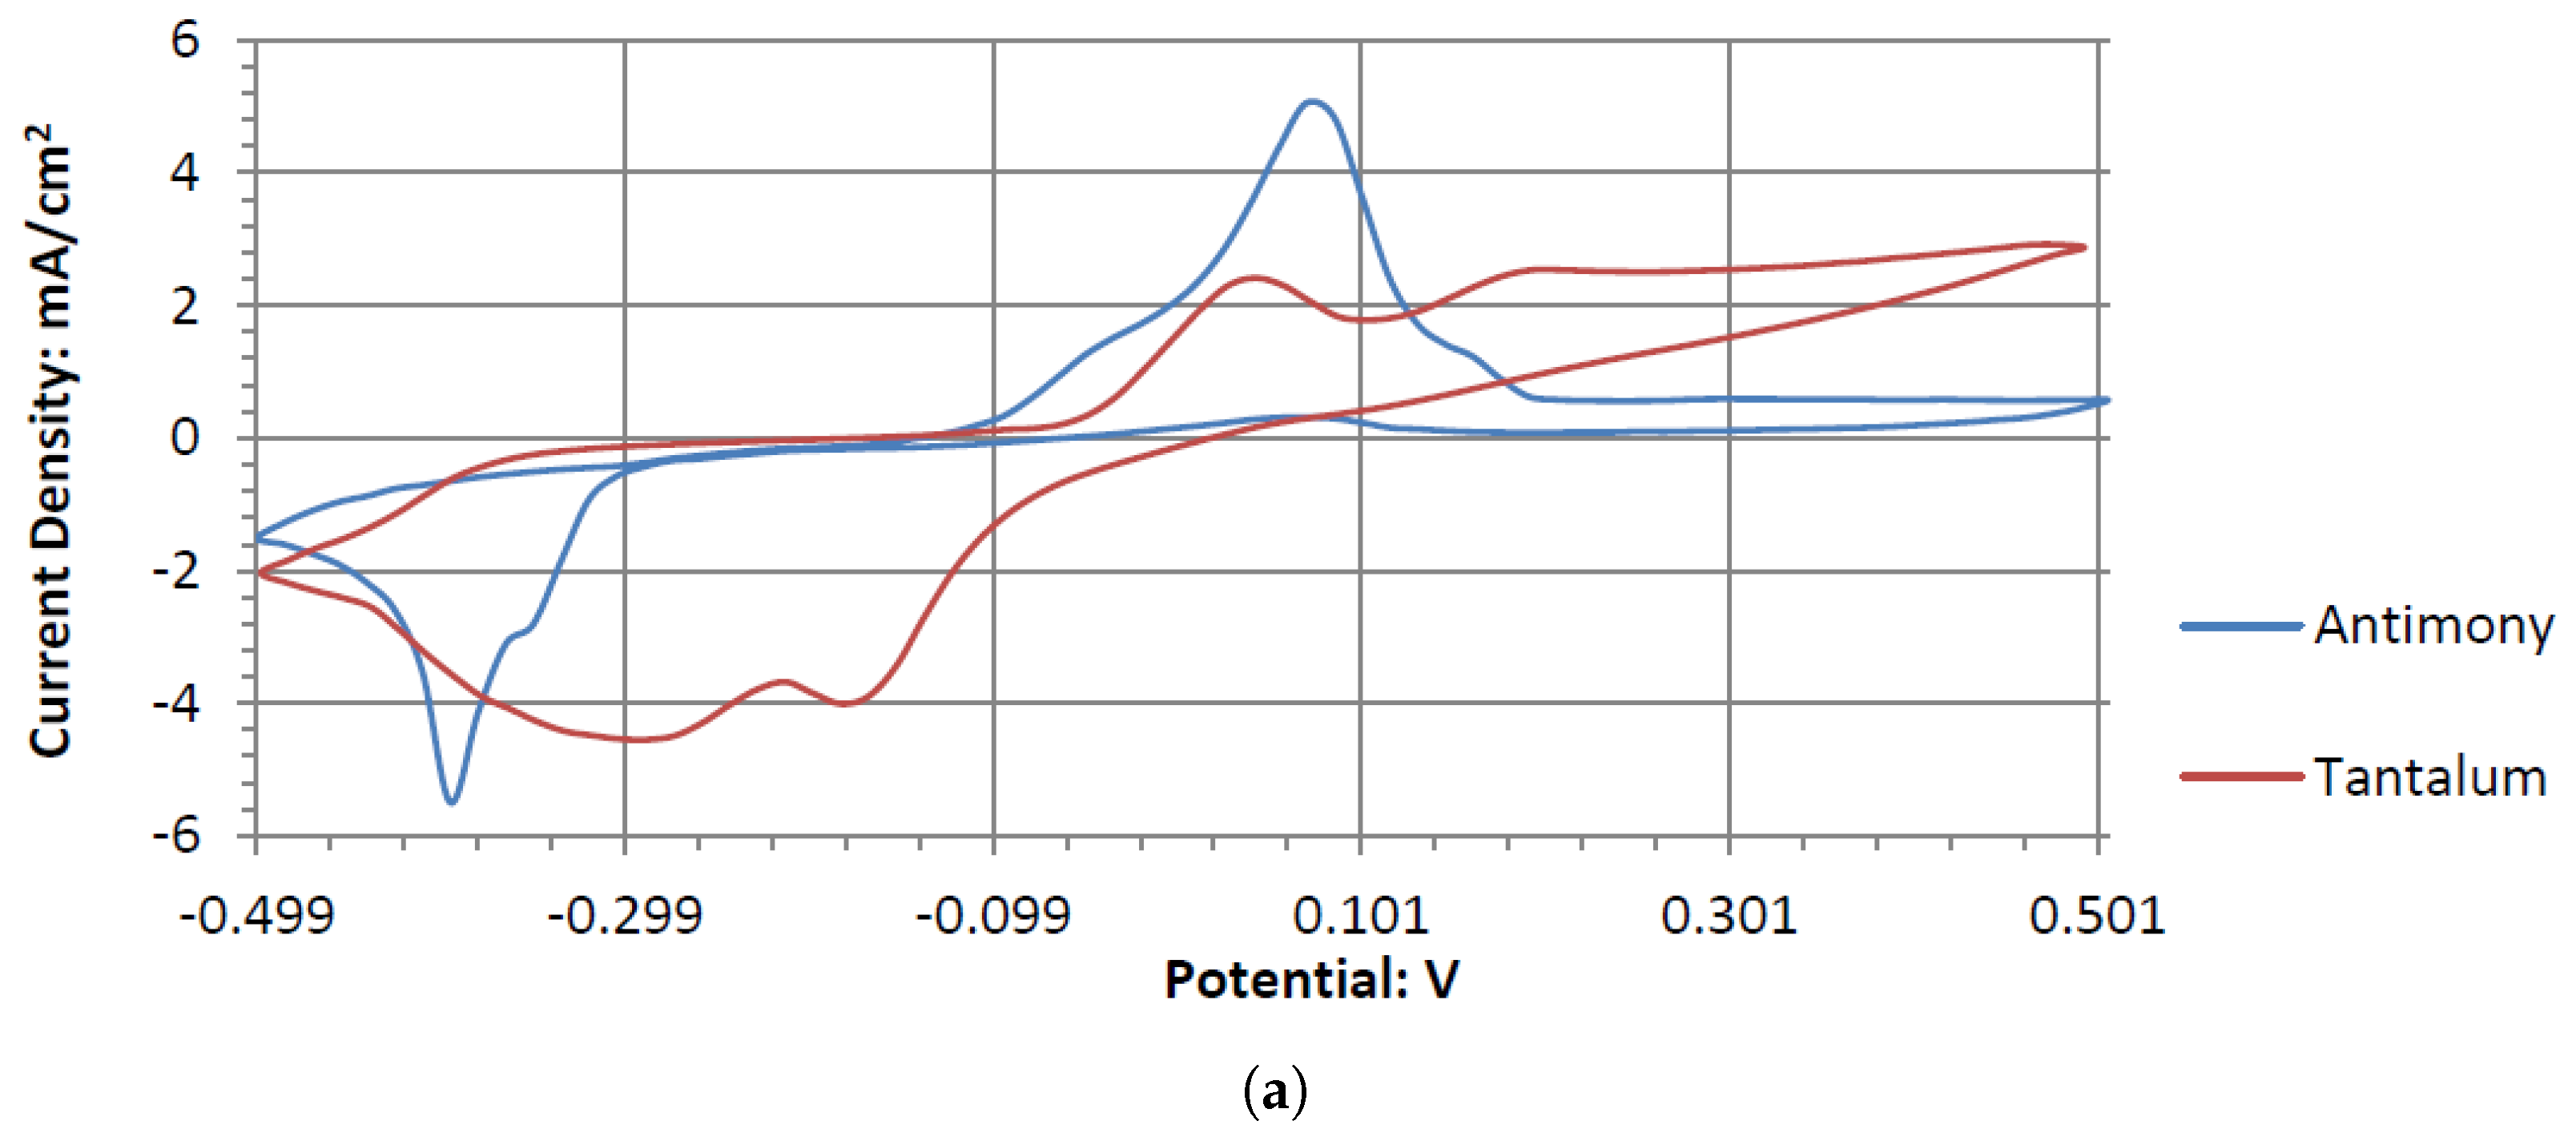
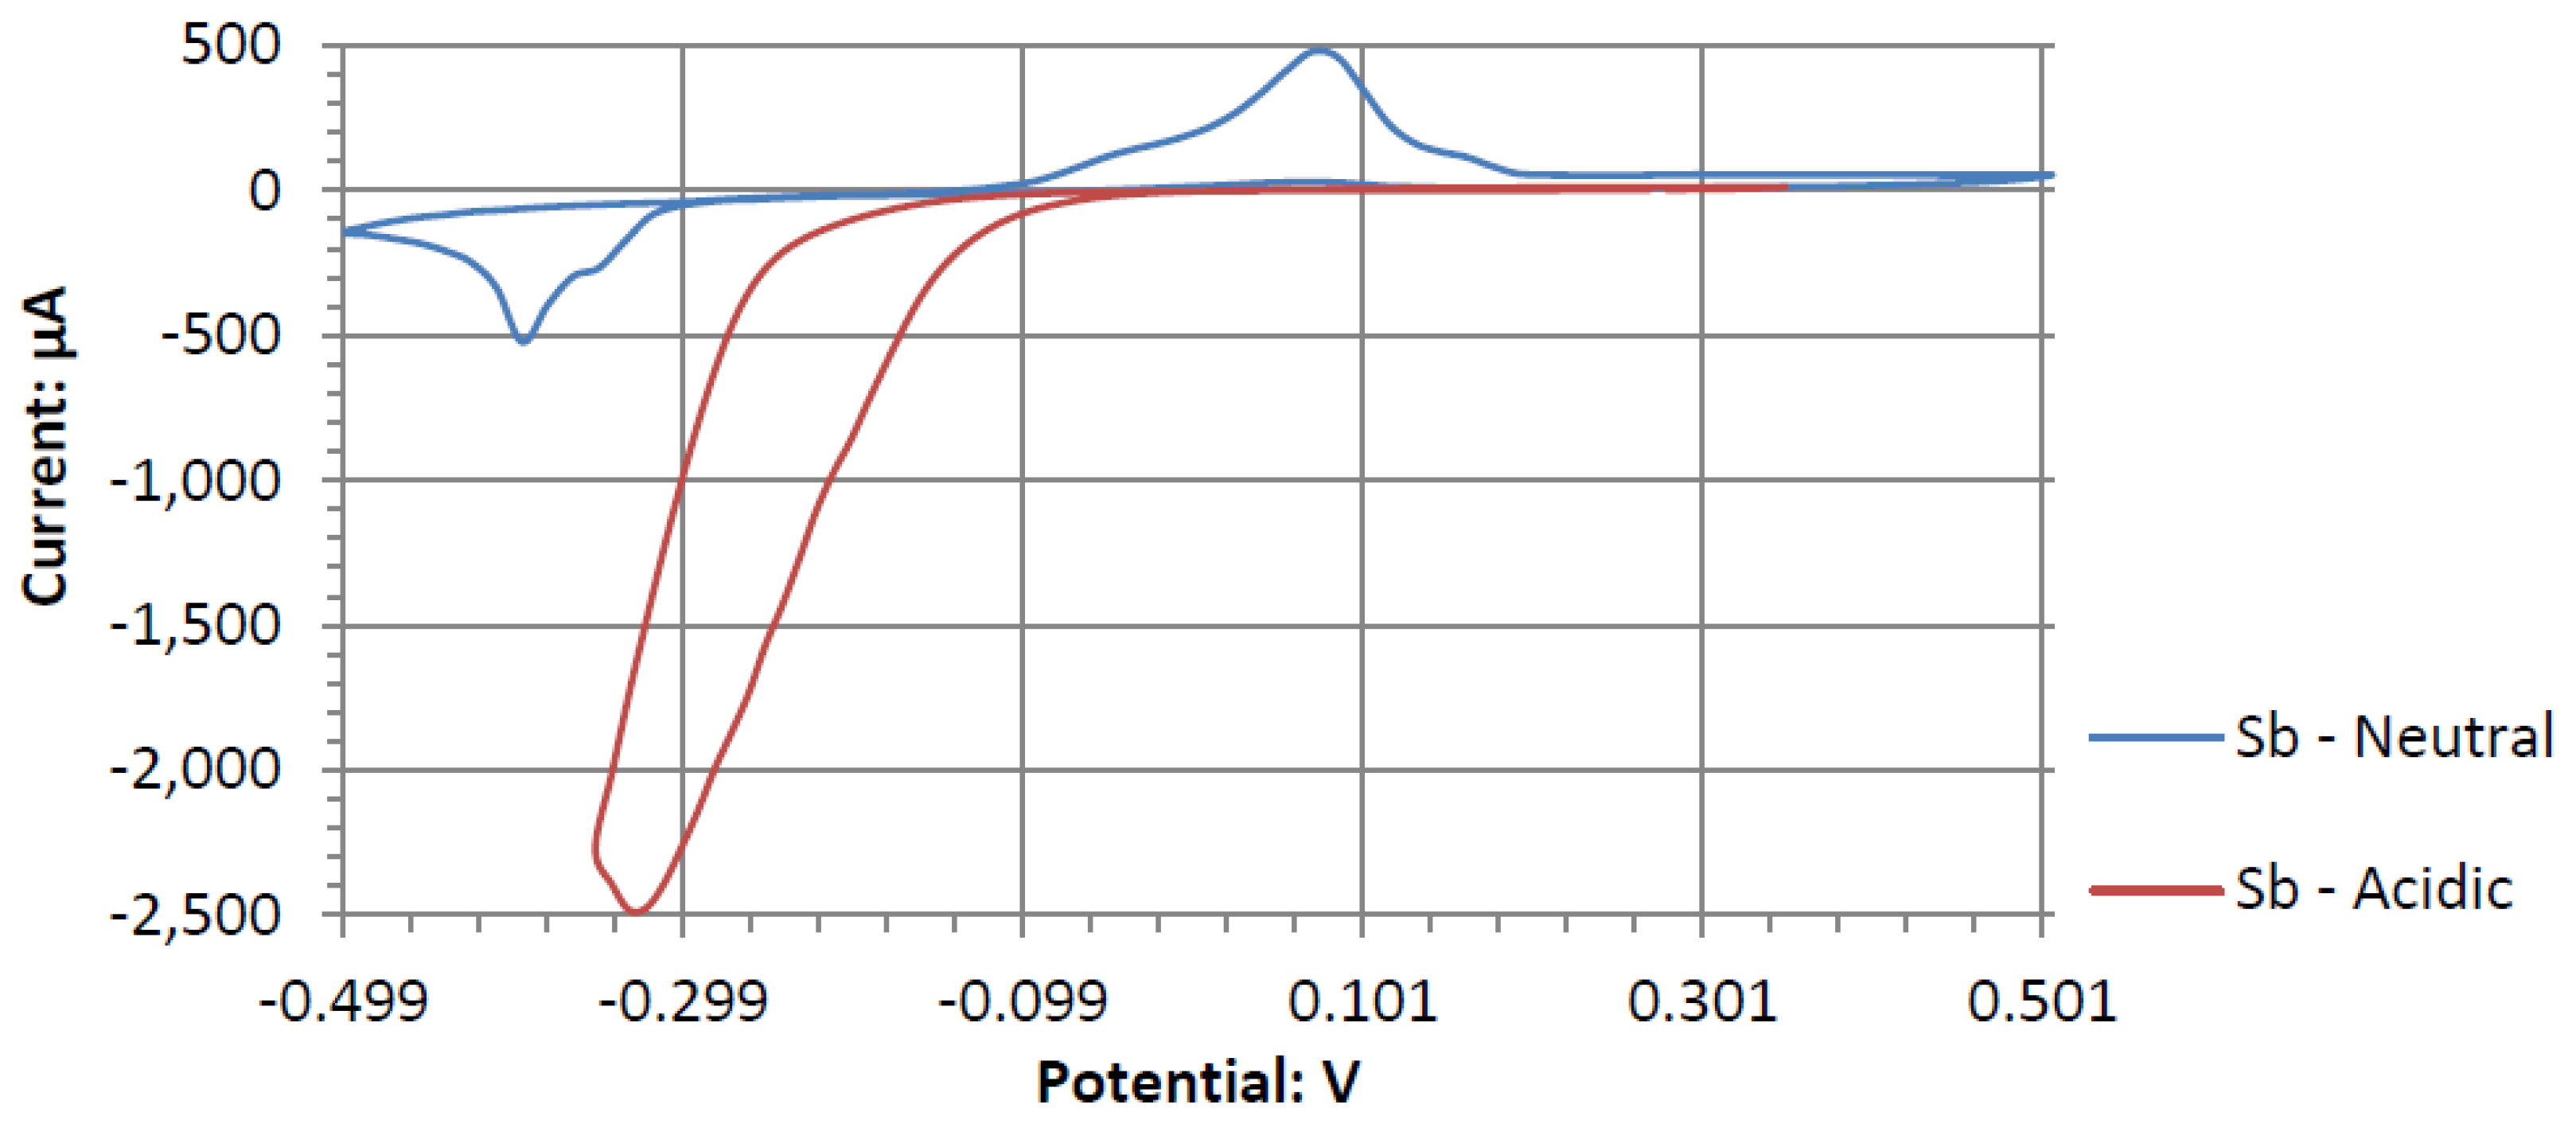
The voltammograms of ceSb in the different pH electrolytes is shown in Figure 11. Sb has the most catalytic activity in the neutral pH. Given the shape of Antimony’s voltammogram in neutral peroxide resembles a possible reversible passivation reaction. The oxide layer formation and removal on the electrode surface are seen as the anodic and cathodic potential sweeps occur. The observed peaks can be the result of mass adsorption and desorption of salt ions to and from electrode surfaces. This behavior is not observed in the acidic peroxide electrolyte. The Acidic Electrolyte demonstrates a typical cathodic catalytical behavior with an onset potential of about −0.09 V.
The observed redox catalytic activities of Dy, Tb, Er, Dg, Gd, Ta, and Sb pure metal electrodes on hydrogen peroxide in their respective pH ranges is likely from molecular oxide layers forming on the electrode surface. Since all the metals can switch to higher and lower oxidation states, the oxide layer acts as an oxygen reservoir source. This oxygen reservoir introduces an excess of oxygen atoms, allowing the peroxide to undergo an electron-yielding decomposition reaction. The surface oxide formation occurs when the metal is submerged in the electrolyte and comes in contact with water, oxygen, and hydrogen peroxide. The switching activity causes the catalytic functions to accelerate the transfer of oxygen (and electrons) to and from electrode surfaces in the hydrogen peroxide redox reactions. Figure 12 visually demonstrates this mechanism. Ta and Sb are observed to have a similar yet improved performance compared to the other pure metals. The reason for the difference in the catalytic mechanisms in the specific context of hydrogen peroxide fuel cells has not been investigated in the literature; however, it can be hypothesized that the formation of a thin metal oxide layer on the surface of the electrode may play a central role in the reaction and the electrical yield. Given that there is no investigation on this exact mechanism in the literature, there is an opportunity for a separate and chemically focused investigation in the field of inorganic chemistry catalysis to determine the exact reaction mechanism. One way to determine the involvement of the oxide layer in the catalytic reaction would be to treat the electrode surfaces with a known corrosion inhibitor agent, such as benzotriazole or tolyltriazole, right after they are fully polished. The corrosion-inhibiting molecules often help with preventing oxidation from occurring on the surface. If the corrosion-inhibitor-treated electrode has a drop in electrocatalytic output in the fuel cell, then there could be some evidence from this quick test. This testing would also have its shortcomings, as coverage of the electrode surface with a molecular layer of benzotriazole may also cause isolation of the metal surface from being able to effectively reach the electrolyte and its contents.

Explanations in Other Literature

As there is a lack of prior research on the use of these novel electrode materials in hydrogen peroxide fuel cells and the unavailability of advanced instrumentation, it is difficult to further investigate and precisely theorize the reasons for the newly investigated electrode behaviors. Some indirect references strengthen the hypothesis.
Rare earth metals have been indirectly investigated in their reaction with hydrogen peroxide. Cerium dioxide (CeO2) and other oxides of lanthanum (La) have been used as the active catalysts in fuel cells to oxidize low molecular weight alcohol [22]. In these electrochemical reactions, the rate of oxidation reactions to the molecules adsorbed onto their surface is enhanced by these rare metal oxides, providing a localized oxygen storage capacity. This publication describes CeO2’s reaction with hydrogen peroxide using chemical Equations (6) and (7). The equations show that the oxide of Ce at lower oxidation states transform into an oxide with a high oxidation state, carrying more oxygen as an oxygen storage source. The higher oxidation state CeO2 catalytically reacts with the hydrogen peroxide to return to its lower oxidation state, converting the hydrogen peroxide to water.
2 C e O 2 + 2 H + 2 e C e 2 O 3 + H 2 O
C e 2 O 3 + H 2 O 2 C e O 2 + H 2 O
A different report demonstrated that rare earth metals such as Ce can act similarly to the infamous Fenton reaction, catalytically reacting and decomposing hydrogen peroxide [23]. Another study examined the reaction mechanisms involved in using CeO2 and gadolinium oxide to decompose hydrogen peroxide [24]. The reactions involves the adsorption of hydrogen peroxide molecules onto the metal oxide surfaces, which proceeds to its catalytic decomposition to form water and oxygen. A thin layer of the respective oxides may be forming on the electrode surfaces when inserted into the alkaline peroxide electrolyte, which then acts as a catalytic surface for the peroxide oxidation to occur. Salts of La and lanthanum-doped zinc hydroxycarbonates also catalytically induce disproportionation of hydrogen peroxide [25,26]. Gadolinium-doped cerium oxide is reported to oxidize hydrogen peroxide to form hydroxyl radicals [27]. Therefore, existing publications indicate that the electrocatalytic activities of some rare earth metals occur from their oxides instead of the metals in their pure unreacted forms.
Fewer publications investigate the electrocatalytic ability of Sb and Ta in hydrogen peroxide, as demonstrated by this experiment. One experiment observed that Sb has a higher order reaction order to form SB(OH)4− as a hydroxide byproduct [27], explaining Sb’s susceptibility to corrode in alkaline peroxide solution. However, this does not explain the same corrosion without the presence of hydrogen peroxide. Sb is commonly used in simple pH meter electrodes [28,29]. It provides a good degree of robustness to test the pH of highly alkaline and acidic solutions, where the pH function is related to the natural layer of antimony oxide formed on the electrode surface. In terms of catalytic activity, antimony oxide films have been used to produce hydrogen peroxide when an electric potential of 3.08 V is applied [30]. Sb has demonstrated the capability to catalytically interact with hydrogen peroxide molecules as the addition of Sb to Pt has been shown to create a catalyst for oxidation of organic matters such as cinnamyl alcohol [31]. It was also demonstrated that Sb alloys can decompose hydrogen peroxide through sufficient lowering of the needed activation energy [32]. Combining the limited literature available, it is possible to theorize that the redox catalytic activity of Sb in hydrogen peroxide may involve the molecular oxide layer on the surface of the Sb electrode. The antimony oxide may provide a localized oxygen storage capacity to catalytically facilitate redox reactions. Since Sb2O3 leads to the formation of hydrogen peroxide, the reverse could occur if Sb2O3 is submerged with hydrogen peroxide and paired with another catalytically active electrode to consume the hydrogen peroxide to generate electric energy.
Similar uses and behaviors have been observed in the literature for tantalum oxides’ ability to interact with hydrogen peroxide. When tantalum oxide (Ta2O5) meets hydrogen peroxide, active oxygen generation is observed when forming hydroxyl radicals [33]. Tantalum-based compounds show varied electrocatalytic activity with hydrogen peroxide. Tantalum carbide can decompose hydrogen peroxide, although at a slower rate than niobium carbide. In contrast, a chlorine salt of Ta catalyzes the oxidation of sulfides with high hydrogen peroxide concentrations, while Ta2O5 does not [34]. Tantalum oxides are also used for oxygen reduction to produce hydrogen peroxide. The electrocatalytic behavior of Ta is thought to be due to its natural oxide layer, which protects against corrosion and enables peroxide redox reactions across various pH levels.

5. Conclusions

Au, Pt, Pd, and Ag are part of a group of precious metals that are highly studied as catalytic metals in virtually all catalytic chemistry fields. Precious metals that tend to have good catalytic attributes are expensive, making them prohibitive for prototyping. None of the metals outlined in this paper have the same cost or rarity limitations or have been investigated as potential catalysts for peroxide fuel cells. This paper found that Dy, Er, Gd, Ho, and Tb produce a moderate cell output potential as electrocatalytic electrode materials. Sb and Ta were found to perform better than the rare earth metals in cell potential in various electrolytes. Other novel findings in the experiment are that single-compartment hydrogen peroxide fuel cells favor an electrolyte in an acidic pH range. The higher acidity leads to a better cell output potential performance and suppressed hydrogen peroxide disproportionation. This paper also improves on the under-reported issues of Ni electrode corrosion in acidic hydrogen peroxide, making Ni an unfit choice as a sustainable electrode, and this paper suggests better alternatives.

6. Patents

The work reported in this manuscript is used in USPTO provision patent, application number: 63/637522.

Author Contributions

Conceptualization, F.A.; methodology, F.A.; software, F.A.; validation, F.A.; formal analysis, F.A.; investigation, F.A.; resources, F.A.; data curation, F.A.; writing—original draft preparation, F.A.; writing—review and editing, R.A.; visualization, F.A.; supervision, S.A.G.; project administration, S.A.G.; funding acquisition, S.A.G. All authors have read and agreed to the published version of the manuscript.

Funding

This research received no external funding.

Institutional Review Board Statement

Not applicable.

Informed Consent Statement

Not applicable.

Data Availability Statement

Data available upon request.

Conflicts of Interest

The authors declare no conflict of interest.

Abbreviations

The following abbreviations are used in this manuscript:
GoldAu
PlatinumPt
PalladiumPd
SilverAg
NickelNi
DysprosiumDy
ErdiumEr
GadoliniumGd
HolmiumHo
TerbiumTb
AntimonySb
TantalumTa
Glassy carbonGC
CeriumCe
Cerium dioxideCeO2
LanthanumLa

References

  1. Bagotsky, V.S.; Skundin, A.M.; Volfkovich, Y.M. Electrochemical Power Sources: Batteries, Fuel Cells, and Supercapacitors; John Wiley & Sons, Inc.: Hoboken, NJ, USA, 2015. [Google Scholar]
  2. Alderson, F.A. Investigation and Advancement of Novel Single Compartment Hydrogen Peroxide Fuel Cells. Ph.D. Thesis, University of Guelph, Guelph, ON, Canada, 2023. [Google Scholar]
  3. An, L.; Zhao, T.; Yan, X.; Zhou, X.; Tan, P. The dual role of hydrogen peroxide in fuel cells. Sci. Bull. 2015, 60, 55–64. [Google Scholar] [CrossRef]
  4. Yamazaki, S.i.; Siroma, Z.; Senoh, H.; Ioroi, T.; Fujiwara, N.; Yasuda, K. A fuel cell with selective electrocatalysts using hydrogen peroxide as both an electron acceptor and a fuel. J. Power Sources 2008, 178, 20–25. [Google Scholar] [CrossRef]
  5. Ji, J.; Chung, Y.; Kwon, Y. The effect of a vitamin B12 based catalyst on hydrogen peroxide oxidation reactions and the performance evaluation of a membraneless hydrogen peroxide fuel cell under physiological pH conditions. J. Mater. Chem. C 2020, 8, 2749–2755. [Google Scholar] [CrossRef]
  6. Ji, J.; Chung, Y.; Kwon, Y. The effects of cobalt phthalocyanine and polyacrylic acid on the reactivity of hydrogen peroxide oxidation reaction and the performance of hydrogen peroxide fuel cell. J. Power Sources 2020, 480, 228860. [Google Scholar] [CrossRef]
  7. An, H.; Jeon, H.; Ji, J.; Kwon, Y.; Chung, Y. Amine axial ligand-coordinated cobalt phthalocyanine-based catalyst for flow-type membraneless hydrogen peroxide fuel cell or enzymatic biofuel cell. J. Energy Chem. 2021, 58, 463–471. [Google Scholar] [CrossRef]
  8. Andrade, T.S.; Sá, B.A.C.; Sena, I.C.; Neto, A.R.S.; Nogueira, F.G.E.; Lianos, P.; Pereira, M.C. A photoassisted hydrogen peroxide fuel cell using dual photoelectrodes under tandem illumination for electricity generation. J. Electroanal. Chem. 2021, 881, 114948. [Google Scholar] [CrossRef]
  9. Nguyen, B.; Kuperman, N.; Goncher, G.; Solanki, R. Membraneless H2O2 Fuel Cells Driven by Metallophthalocyanine Electrocatalysts. ECS J. Solid State Sci. Technol. 2020, 9, 061009. [Google Scholar] [CrossRef]
  10. Martins, R.F.; Martins, D.A.A.; Costa, L.A.C.; Matencio, T.; Paniago, R.M.; Montoro, L.A. Copper hexacyanoferrate as cathode material for hydrogen peroxide fuel cell. Int. J. Hydrogen Energy 2020, 45, 25708–25718. [Google Scholar] [CrossRef]
  11. Devassy, A.M.C.; Wankhede, K.D.; Kamalakshan, A.; Mandal, S. A robust single compartment peroxide fuel cell using mesoporous antimony doped tin oxide as the cathode material. Nanoscale 2024, 16, 12060–12070. [Google Scholar] [CrossRef] [PubMed]
  12. Miao, Z.; Wang, R.; Li, X.; Sun, F.; Ge, M.; Huang, N.; Zhao, Y.; Chang, Z.; Wang, H. Photoreduced Ag nanoparticles-decorated BiVO4 nanoplates as photoanode boosting photoelectrochemical H2O2 fuel cell performance. J. Power Sources 2025, 629, 235998. [Google Scholar] [CrossRef]
  13. Zhu, F.; Kuzin, A.; Chen, G.; Gorin, D.A.; Mohan, B.; Huang, G.; Zhao, S.; Mei, Y.; Solovev, A.A. Green Energy for Autonomous Devices: Surfactant-Enhanced Membraneless Hydrogen Peroxide Fuel Cells. In Proceedings of the 2023 International Conference on Manipulation, Automation and Robotics at Small Scales (MARSS), Abu Dhabi, United Arab Emirates, 9–13 October 2023; pp. 1–6. [Google Scholar] [CrossRef]
  14. Xu, B.; Wang, Z.; Hu, J.; Zhang, L.; Zhang, Z.; Liang, H.; Zhang, Y.; Fan, G. Dy-Modified Mn/TiO2 Catalyst Used for the Selective Catalytic Reduction of NO in Ammonia at Low Temperatures. Molecules 2024, 29, 277. [Google Scholar] [CrossRef] [PubMed]
  15. Levasseur, B.; Kaliaguine, S. Effect of the rare earth in the perovskite-type mixed oxides AMnO3 (A = Y, La, Pr, Sm, Dy) Catal. Methanol Oxidation. J. Solid State Chem. 2008, 181, 2953–2963. [Google Scholar] [CrossRef]
  16. Bernal, S.; Blanco, G.; Cauqui, M.A.; Corchado, M.P.; Larese, C.; Pintado, J.M.; Rodriguez-Izquierdo, J.M. Cerium–terbium mixed oxides as alternative components for three-way catalysts: A comparative study of Pt/CeTbOx and Pt/CeO2 model systems. Catal. Today 1999, 53, 607–612. [Google Scholar] [CrossRef]
  17. Harini, G.; Balasurya, S.; Khan, S.S. Recent advances on gadolinium-based nano-photocatalysts for environmental remediation and clean energy production: Properties, fabrication, defect engineering and toxicity. J. Clean. Prod. 2022, 345, 131139. [Google Scholar] [CrossRef]
  18. Kannan, R.; Kim, A.R.; Yoo, D.J. Enhanced electrooxidation of methanol, ethylene glycol, glycerol, and xylitol over a polypyrrole/manganese oxyhydroxide/palladium nanocomposite electrode. J. Appl. Electrochem. 2014, 44, 893–902. [Google Scholar] [CrossRef]
  19. Ramachandran, K.; Vinothkannan, M.; Kim, A.R.; Ramakrishnan, S.; Yoo, D.J. Ultrafine bimetallic alloy supported on nitrogen doped reduced graphene oxide toward liquid-fuel oxidation: Profile of improved performance and extended durability. Int. J. Hydrogen Energy 2019, 44, 21769–21780. [Google Scholar] [CrossRef]
  20. Ahmadpour, F. Shelf-Stable Hydrogen Peroxide Antimicrobial Compositions. U.S. Patent US10450535B2, 22 October 2019. [Google Scholar]
  21. Fukuzumi, S.; Yamada, Y. Hydrogen Peroxide used as a Solar Fuel in One-Compartment Fuel Cells. ChemElectroChem 2016, 3, 1978–1989. [Google Scholar] [CrossRef]
  22. Antolini, E.; Perez, J. The use of rare earth-based materials in low-temperature fuel cells. Int. J. Hydrogen Energy 2011, 36, 15752–15765. [Google Scholar] [CrossRef]
  23. Heckert, E.G.; Seal, S.; Self, W.T. Fenton-Like Reaction Catalyzed by the Rare Earth Inner Transition Metal Cerium. Environ. Sci. Technol. 2008, 42, 5014–5019. [Google Scholar] [CrossRef] [PubMed]
  24. Lousada, C.M.; Yang, M.; Nilsson, K.; Jonsson, M. Catalytic decomposition of hydrogen peroxide on transition metal and lanthanide oxides. J. Mol. Catal. A Chem. 2013, 379, 178–184. [Google Scholar] [CrossRef]
  25. Nardello, V.; Barbillat, J.; Marko, J.; Witte, P.T.; Alsters, P.L.; Aubry, J.M. Lanthanum(III)-catalyzed disproportionation of hydrogen peroxide: A heterogeneous generator of singlet molecular oxygen-1O2 (1Deltag)-in near-neutral aqueous and organic media for peroxidation of electron-rich substrates. Chemistry 2003, 9, 435–441. [Google Scholar] [CrossRef] [PubMed]
  26. Wahlen, J.; De Vos, D.E.; Jacobs, P.A.; Nardello, V.; Aubry, J.M.; Alsters, P.L. Lanthanum-doped zinc hydroxycarbonates for the catalytic disproportionation of hydrogen peroxide into singlet oxygen. J. Catal. 2007, 249, 15–23. [Google Scholar] [CrossRef]
  27. Bhalkikar, A.; Wu, T.S.; Fisher, T.J.; Sarella, A.; Zhang, D.; Gao, Y.; Soo, Y.L.; Cheung, C.L. Tunable catalytic activity of gadolinium-doped ceria nanoparticles for pro-oxidation of hydrogen peroxide. Nano Res. 2020, 13, 2384–2392. [Google Scholar] [CrossRef]
  28. Caflisch, C.R.; Pucacco, L.R.; Carter, N.W. Manufacture and utilization of antimony pH electrodes. Kidney Int. 1978, 14, 126–141. [Google Scholar] [CrossRef]
  29. Edwall, G. Improved antimony–antimony (III) oxide pH electrodes. Med Biol. Eng. Comput. 1978, 16, 661–669. [Google Scholar] [CrossRef] [PubMed]
  30. Wang, Y.; Lian, X.; Zhou, Y.; Guo, W.; He, H. Synthesis and characterization of Sb2O3: A stable electrocatalyst for efficient H2O2 production and accumulation and effective degradation of dyes. New J. Chem. 2021, 45, 8958–8964. [Google Scholar] [CrossRef]
  31. Langa, S.; Nyamunda, B.C.; Heveling, J. Antimony-Modified Platinum Catalysts for the Selective and Stable Oxidation of Cinnamyl Alcohol with Hydrogen Peroxide. Catal. Lett. 2016, 146, 755–762. [Google Scholar] [CrossRef]
  32. Burstein, E.; McWhorter, A.L.; Miller, P.H.; Stevenson, D.T.; Weisz, P.B. Semiconductor Surface Physics; University of Pennsylvania Press: Philadelphia, PA, USA, 1957. [Google Scholar]
  33. Ziolek, M.; Sobczak, I.; Decyk, P.; Wolski, L. The ability of Nb2O5 and Ta2O5 to generate active oxygen in contact with hydrogen peroxide. Catal. Commun. 2013, 37, 85–91. [Google Scholar] [CrossRef]
  34. Kirihara, M.; Yamamoto, J.; Noguchi, T.; Itou, A.; Naito, S.; Hirai, Y. Tantalum(V) or niobium(V) catalyzed oxidation of sulfides with 30% hydrogen peroxide. Tetrahedron 2009, 65, 10477–10484. [Google Scholar] [CrossRef]
Figure 1. Steps of fabricating metal electrodes. (a) An electrode metal joined to the copper rod using silver paste; (b) the casting of each electrode into jackets filled with epoxy resin; (c) a fully fabricated electrode before sanding and polishing; (d) a fully fabricated electrode after sanding, final polishing, and cleansing.
Applsci 15 01857 g001
Figure 2. Photographs of unpolished electrode tips after assembly next to a metric size scale.
Applsci 15 01857 g002
Figure 3. A three-electrode cell setup attached to potentiostat for voltammetry tests. The blue cable is for the working electrode, the red cable is for the counter electrode, and the black cable connects to the reference electrode.
Applsci 15 01857 g003
Figure 4. Corrosion on polished nickel ribbon three minutes after submersion in the Acidic Electrolyte 2. The corroded surface is visible with a light brown discolouration. Corrosion interferes with the chemical reaction so should be mitigated as much as possible.
Applsci 15 01857 g004
Figure 5. Open circuit potentials of electrodes in Alkaline Electrolyte. This depicts which electrodes have the largest potential when attached to a common reference electrode. Tb and Ta have the highest open circuit potential.
Applsci 15 01857 g005
Figure 6. Cyclic voltammograms of electrodes in Alkaline Electrolyte. Graphs (ac) show overlaps of electrode voltammograms in Alkaline Electrolytes containing hydrogen peroxide. Graphs (dj) show voltammograms for each electrode in Alkaline Electrolyte with and without hydrogen peroxide. Ta and Ho had the largest current densities during the potential sweep, demonstrating their favorable reactivity in alkaline electrolytes.
Applsci 15 01857 g006aApplsci 15 01857 g006bApplsci 15 01857 g006c
Figure 7. Open circuit potentials of electrodes in Neutral Electrolyte vs. Acidic Electrolyte 1, where antimony had the highest cell output in the Acidic Electrolyte and tantalum had a higher cell output in the Neutral Electrolyte.
Applsci 15 01857 g007
Figure 8. Cyclic voltammograms of electrodes in the Neutral Electrolyte. Graph (a) shows the overlap of both Sb and Ta electrode voltammograms in the Neutral Electrolyte containing hydrogen peroxide. Graphs (b,c) show voltammograms for Sb and Ta electrodes in the Neutral Electrolyte with and without hydrogen peroxide. Testing the electrodes without hydrogen peroxide present in the electrolyte demonstrates the additional reactivity the compound adds to the reaction.
Applsci 15 01857 g008aApplsci 15 01857 g008b
Figure 9. Cyclic voltammograms of electrodes in Acidic Electrolyte 1. Graph (a) shows overlap of both Sb and Ta electrode voltammograms in Acidic Electrode 1 containing hydrogen peroxide. Graphs (b,c) show voltammograms for Sb and Ta electrodes in Acidic Electrolyte 1 with and without hydrogen peroxide.
Applsci 15 01857 g009
Figure 10. Overlapping voltammograms of Ta electrode in peroxide electrolytes with three different pH values of 13.3 (alkaline), 7.0 (neutral), and 1.99 (acidic), showing that Tantalum had the highest current density in the alkaline electrolyte.
Applsci 15 01857 g010
Figure 11. Overlapping voltammograms of Sb electrode in peroxide electrolytes with two different pH values of 17.0 (neutral) and 1.99 (acidic), showing Sb is much more reactive in an acidic electrolyte.
Applsci 15 01857 g011
Figure 12. Proposed mechanism of hydrogen peroxide redox catalysis over electrode metal oxide surfaces in acidic pH. Metals include those tested in this chapter: Dy, Tb, Er, Ho, Gd, Ta, and Sb. MeXOA and MeYOB represent different oxides of the same metal at different oxidation states. Note that the novel electrode metals introduced in this chapter favor one of oxidation or reduction over the other, and not both simultaneously to then result in disproportionation.
Applsci 15 01857 g012
Table 1. A summary of published single-compartment hydrogen peroxide fuel cell investigations, separated by Alkaline vs. Acidic electrolytes. PPD is peak power density, OCP is open circuit potential, and OP is cell output potential. When the corresponding electrode is underlined, the values in the “OCP or OP” column are for OCP.
Publication YearElectrodesAlkaline Electrolyte pHOCP or OP (Volts)PPD (μW/cm2)Reference
2020CNT/VitB127.40.23353.8[5]
2020rGo/PAA/CoPc vs. [CNT/PEI]/hemin7.40.2672.1[6]
2021PEI-rGO/CoPc/CoPc vs. [CNT/PEI]/hemin7.40.317105.2[7]
2021* W-BiVO4/V2O5 vs. Cu2O/CuO80.41840[8] *
Publication YearElectrodesAcidic Electrolyte pHOCP or OP (Volts)PPD (μW/cm2)Reference
2020FexN vs. Ni mesh0.1 M HCl (1.0)0.58760[9]
2020CePC vs. Ni mesh0.1 M HCl (1.0)0.57400[9]
2020FePC vs. Ni mesh0.1 M HCl (1.0)0.563410[9]
2020CoPC vs. Ni mesh0.1 M HCl (1.0)0.47390[9]
2020CuHCFeIII vs. Ni grid0.1 M HCl (1.0)0.728300[10]
2024ATO/FTO vs. Ni foam1.00.82320[11]
2024Ag/BiVO4 vs. FeIIIPc1.00.612030[12]
2025Carbon Fiber cloth vs. Graphite rod with surfactants1.00.6150.6[13]
* The catalytic function of the fuel cell is photo-assisted.
Table 2. Overview of compounds and materials used with their sources and purities.
Compound/MaterialSourcePurityCAS #
Ag/AgCl (3 M NaCl) reference electrodeBASi Research Products (West Lafayette, IN, USA)N/AN/A
Antimony (chunks)Alfa Aesar (Lancashire, UK)99.9999%7440-36-0
Bismuth (chunks)Alfa Aesar (Lancashire, UK)99.99%7440-69-9
Copper wire, 12 gaugeKris Tech (Rome, GA, USA)N/AN/A
Cyanoacrylate adhesive #495Loctite (Westlake, USA)N/AN/A
Dysprosium (chunks)Alfa Aesar (Lancashire, UK)99.8%7429-91-6
Erbium (chunks)Alfa Aesar (Lancashire, UK)99.9%7440-52-0
Gadolinium (chunks)Alfa Aesar (Lancashire, UK)99.9%7440-54-2
Glassy carbon electrode (3.0 mm diameter)BASi Research Products (West Lafayette, IN, USA)N/AN/A
Holmium (chunks)Alfa Aesar (Lancashire, UK)99.9%7440-60-0
Hydrochloric acidMillipore Sigma (Burlington, MA, USA)37%7647-01-0
Hydrogen peroxide (industrial grade)Arkema (Columbes, France)50%7722-84-1
Indium (sheet)Alfa Aesar (Lancashire, UK)99.9975%7440-74-6
IsopropanolVWR (Radnor, PA, USA)70%67-63-0
Methane sulfonic acid (Lutropur MSA 100)BASF (Ludwigshafen, Germany)99%75-75-2
Microfiber clothFosmon (Woodbury, NY, USA)N/AN/A
NafionTM 117Millipore Sigma (Burlington, MA, USA)5%31175-20-9
NanoSilvex P-01 conductive silver pasteNanoCnet (Kitchener, ON, Canada)N/AN/A
Nickel (foil)Alfa Aesar (Lancashire, UK)99.9945%7440-02-0
Nickel (foil)Millipore Sigma (Burlington, MA, USA)99%7440-02-0
Platinum wire electrode (MW-1033)BASi Research Products (West Lafayette, IN, USA)N/AN/A
Polishing paste, 14,000 grit (1–0.5 μm)TechDiamondTools (Santa Clara, CA, USA)N/AN/A
Polishing paste, 5000 grit (2–3 μm)TechDiamondTools (Santa Clara, CA, USA)N/AN/A
Polishing paste, 50,000 grit (0.5–0.01 μm)TechDiamondTools (Santa Clara, CA, USA)N/AN/A
Reverse-osmosis water (R < 1.3 μs/cm)High Purity Water Services (Oakville, ON, Canada)100%7732-18-5
Sandpapers, 250 to 5000 grits3 M (Saint Paul, USA)N/AN/A
Silver (rod)Alfa Aesar (Lancashire, UK)99.999%7440-22-4
Sodium chlorideMillipore Sigma (Burlington, MA, USA)99.50%7647-14-5
Sodium hydroxideMillipore Sigma (Burlington, MA, USA)98%1310-73-2
Tantalum (foil)Alfa Aesar (Lancashire, UK)99.95%7440-25-7
Terbium (chunks)Alfa Aesar (Lancashire, UK)99.9%7440-27-9
Two-part epoxy resin (EPX128 and EPX762)VViViD (St-Laurent, ON, Canada)N/AN/A
Table 3. Summary of the surface area of electrode tips calculated using photographs.
ElectrodeSurface Area (cm2)
Ag0.152
Ta0.120
Er0.128
Ho0.111
Gd0.112
Bi0.138
Dy0.132
Tb0.135
Sb0.095
Table 4. Ingredients used and pH of four different hydrogen peroxide electrolyte solutions.
Alkaline ElectrolyteNeutral ElectrolyteAcidic Electrolyte 1Acidic Electrolyte 2
Ingredients0.3 M H2O20.3 M H2O20.3 M H2O20.5 M H2O2
1 M NaOH0.5 M NaCl0.5 M NaCl1 M NaCl
Reverse-Osmosis H2O QS 100H3PO4 (pH adj.)MSA (pH adj.)0.1 M HCl
Reverse-Osmosis H2O QS 100Reverse-Osmosis H2O QS 100Reverse-Osmosis H2O QS 100
Electrolyte pH13.307.002.001.08
Table 5. Fuel cell output potentials (mV) obtained from all electrode combinations using Alkaline Electrolyte. Cells are formatted to visually show higher and lower values with red and blue, respectively. The further away the value is from zero, the higher the cell output potential. GC stands for glassy carbon electrode. The horizontal rows represent the positive lead and the vertical columns represent the negative lead.
-NiAgPtGCSbTaDyErGdHo
Ag85xxxxxxxxx
Pt25.6113xxxxxxxx
GC10318571xxxxxxx
Sb−4961.5−80−144xxxxxx
Ta−43.232.7−83.5−14781xxxxx
Dy110149476.3119131xxxx
Er−61.917.7−101−1601.2−13.2−146xxx
Gd−83.1−5.8−120−1509.145.4−52.380xx
Ho−65.1−1.5−98.7−165−5.7−17−48.1−14−112x
Tb−62.25.1−112170−6.3−17.5−30−3.5−106−22
Table 6. Fuel cell output potentials (mV) obtained from all electrode combinations using Neutral Electrolyte. Cells are formatted to visually show higher and lower values with red and blue, respectively. The further away the value is from zero, the higher the cell output potential. GC stands for glassy carbon electrode. The horizontal rows represent the positive lead and the vertical columns represent the negative lead.
-NiAgPtGCSb
Ag169xxxx
Pt−22−191xxx
GC0−86.428xx
Sb26889.5307.8152.7x
Ta17411200103−115
Table 7. Fuel cell output potentials (mV) obtained from all electrode combinations using Acidic Electrolyte 1. Cells are formatted to visually show higher and lower values with red and blue, respectively. The further away the value is from zero, the higher the cell output potential. GC stands for glassy carbon electrode. The horizontal rows represent the positive lead and the vertical columns represent the negative lead.
-AgPtGCSb
Agxxxx
Pt−460xxx
GC−112−5.1xx
Sb5152178x
Ta−1945778−40
Table 8. Fuel cell output potentials (mV) obtained from all electrode combinations using Acidic Electrolyte 2. Cells are formatted to visually show higher and lower values with red and blue, respectively. The further away the value is from zero, the higher the cell output potential. GC stands for glassy carbon electrode. The horizontal rows represent the positive lead and the vertical columns represent the negative lead.
-AgPtGCSb
Pt−640xxx
GC−37040xx
Sb−21574295x
Ta−2662134068
Table 9. The calculated peak power density values of electrodes at respective electrolyte conditions.
ElectrodePeak Power Density—Alkaline Electrolyte (pH 13.3, 0.3 M H2O2)Peak Power Density—Acidic Electrolyte (pH 2.0, 0.3 M H2O2)
Ta6998.45 μW/cm2 @ 0.492 V2677.67 μW/cm2 @ 0.597 V
SbN/A (electrode corrosion)8354.65 μW/cm2 @ 0.320 V
Dy33.97 μW/cm2 @ 0.506 VN/A (electrode corrosion)
Er31.39 μW/cm2 @ 0.503 VN/A (electrode corrosion)
Gd113.51 μW/cm2 @ 0.495 VN/A (electrode corrosion)
Ho6308.55 μW/cm2 @ 0.504 VN/A (electrode corrosion)
Tb57.76 μW/cm2 @ 0.493 VN/A (electrode corrosion)
Disclaimer/Publisher’s Note: The statements, opinions and data contained in all publications are solely those of the individual author(s) and contributor(s) and not of MDPI and/or the editor(s). MDPI and/or the editor(s) disclaim responsibility for any injury to people or property resulting from any ideas, methods, instructions or products referred to in the content.

