1. Introduction
In the field of rock mass engineering, holes often form within the rock mass due to various factors such as geological tectonic movements, differences in rock composition, weathering erosion, and human engineering activities [
1,
2,
3]. These holes undermine the integrity of the rock mass and significantly reduce its mechanical properties [
4,
5,
6]. Key indicators such as strength and elastic modulus decline, as well as bearing capacity and stability, are severely compromised. This phenomenon is particularly prominent in tunnel engineering [
7]. The excavation operation causes changes in the stress field of the surrounding rock, intensifying the stress concentration around the holes and making it extremely easy for cracks to initiate and propagate in these areas. This not only substantially weakens the stability of the surrounding rock itself but also may trigger serious disasters such as tunnel collapses and support structure failures, bringing huge safety risks and economic losses to engineering construction and operation. Therefore, in-depth research on the crack propagation mechanism in rocks with random holes is of great significance for ensuring the safety of rock mass engineering, promoting the smooth progress of projects, and achieving long-term stable operation.
For a long time, numerous scholars have conducted in-depth research on crack propagation in rocks with random holes from multiple dimensions, covering theoretical analysis, experimental research, and numerical simulation. In the theoretical research aspect, many scholars have constructed corresponding theoretical models from different perspectives. For example, Guo et al. [
8] established a mathematical model based on continuum mechanics, finite deformation, and incremental stress theory, and obtained the opening and dislocation displacements of arc-shaped interface cracks and the effective stress components of scattered stress waves through solution; Niu et al. [
9] applied the newly developed non-ordinary state peridynamics theory based on geometric constraints (GC-NOSBPD) to predict the crack propagation paths of semi-disc and disc specimens with defects under compressive stress and analyze the influence of the inclination angle of prefabricated defects; Zhao et al. [
10] proposed an adjusted Paris law and combined it with the adjusted material coefficient β to estimate the fatigue life of rock–concrete structures with prefabricated cracks; Cui et al. [
11] established the Wmic-GMTS and Wmic-GMERR criteria for micro-scale crack propagation in red-bed soft rocks under hydraulic action based on the GMTS and GMERR criteria; Li et al. [
12] defined the rock damage increment based on the phenomenological theory and characterized the evolution law of the number of cracks using a logistic growth model to establish the evolution equation of the number of micro-crack propagations during the compressive failure process of rocks; Xiang et al. [
13] determined the movement law of the freezing front based on the heat transfer theory and the heat conduction differential equation, combined with the frost heaving force formula and the stress intensity factor formula, and used the phase field method to simulate and calculate the influence of key parameters on the crack initiation morphology; Li et al. [
14] theoretically analyzed the propagation and superposition of tangential stress during the simultaneous initiation of double holes and the influence of static tangential stress on crack propagation and coalescence; Wang et al. [
15] derived the momentum equation considering blasting load and analyzed the influence of different stress wave loading modes, distances of prefabricated cracks, crack inclination angles, and in situ stress levels on the blasting crack morphology; Tian et al. [
16] theoretically analyzed that the crack vibration caused by rock fracture is a damped vibration with small and variable damping; Xu et al. [
17] combined the Mohr–Coulomb criterion to deal with the compressive shear fracture energy and derived the phase field variational equation based on the energy minimization principle to analyze the crack propagation and failure process; and Peng et al. [
18] analyzed the relationship between the tangent modulus change of the model under uniaxial compression and the crack parameters based on the energy superposition theory, and then proposed a new calibration method and verified it by simulating specific rocks. However, theoretical research requires a large number of simplifications of the problem, and it is difficult to obtain accurate solutions for complex problems.
Theoretical research has provided important guidance and a foundation for subsequent experimental research and numerical simulation. To more intuitively observe and analyze the actual process of rock crack propagation, scholars have carried out a large number of experimental studies. Fu et al. [
19] used self-made equipment to conduct multiple sets of uniaxial and biaxial hydraulic fracturing experiments to observe the failure process and crack evolution law of the specimens; Zhang et al. [
20] conducted three-point bending tests on green sandstone with type-I prefabricated cracks to study the type-I crack propagation process of the rock; Zhu et al. [
21] prepared brittle solid specimens with three-dimensional non-planar internal cracks and conducted uniaxial compression tests to explore their propagation and fracture behaviors; Chang et al. [
22] conducted uniaxial compression tests on sandstone with different angles of single pre-set cracks and used infrared thermal imaging and acoustic emission (AE) technology to visually describe the crack initiation positions and propagation directions; Xu et al. [
23] conducted cyclic loading tests on gypsum specimens with non-penetrating cracks to study the damage evolution and characteristics of rocks with non-penetrating cracks under cyclic loading; Mei et al. [
24] conducted uniaxial compression creep tests on rock-like material specimens with adjacent cracks to study the propagation characteristics and interaction behaviors of adjacent cracks under hydro-mechanical coupling; Wang et al. [
25] used digital image correlation (DIC) technology to track the strain evolution and crack propagation paths and explained the differences in the plastic zone from a microscopic perspective with the help of a polarizing microscope and a scanning electron microscope (SEM); Ouyang et al. [
26] conducted shear tests and microscopic scanning tests on cemented rock–cement joint specimens with different inclination angles; Wang et al. [
27] conducted direct shear tests on double-joint rock-like specimens with different joint spacings and roughness under different normal stresses to study the influence of JRC, joint spacing, and normal stress on the shear behavior of double-joint rock masses; Alomari et al. [
28] determined the normalized critical crack length through the analysis of the triaxial compression test results of sandstone, limestone, and siltstone samples and literature data; Song et al. [
29] processed rocks of three lithologies—granite, coal, and sandstone—into single-edge notched cuboid specimens and conducted three-point bending tests to improve the accuracy of rock fracture assessment; Liu et al. [
30] prepared soft-hard interlayer rock (SHIR) specimens with different layer thickness ratios (LTRs) and conducted Brazilian tensile tests and numerical simulations under different interface inclination angles (δ), LTRs, and layer sequences (LO); Liu et al. [
31] collected the IRT data of rocks under uniaxial compression through experiments and used methods such as wavelet denoising and reconstruction (WDRTIS) to eliminate the time noise, temperature drift, and spatial background noise in the IRT data; Chen et al. [
32] studied the mechanical properties and failure mechanisms of brittle rock-like samples with different combinations of two-dimensional and three-dimensional preset defects under uniaxial compression through experiments; and Ma et al. [
33] used the double torsion technique to conduct relaxation tests on quartz amphibolite, white sandstone, and red sandstone to study the subcritical crack growth behavior of rocks under the influence of water. However, experimental research can only obtain the “appearance” of rock failure and cannot reflect the internal mechanical mechanism of rock crack propagation. In addition, experimental research is highly affected by external factors and has high discreteness.
Numerical simulation, as another means of scientific research, has broken through the limitations of theoretical and experimental research. Given reasonable parameters, numerical simulation can provide relatively accurate answers. Scholars initially used the finite element method to conduct numerical simulations of rock crack propagation. For example, Wang et al. [
34] established an improved particle-based model (GBM) of granite considering feldspar shape using a new Voronoi generation algorithm to simulate the direct shear tests of different joint persistence numerical models under different normal stresses; Li et al. [
35] introduced the enrichment function of the extended finite element method (XFEM) based on the damage diffusion method (DSM) to accurately characterize cracks and holes; Zhu et al. [
36] studied the cyclic friction response of rough rock joints under shear disturbances through laboratory experiments and numerical simulations and showed that the joint surface had significant plastic deformation and shear wear in the initial cycle. However, the finite element method has disadvantages in dealing with discontinuous problems such as cracks; that is, it is necessary to refine and remesh the grid at the crack propagation position, resulting in a large computational volume and easy calculation failure. The discrete element method is a meshless method different from the finite element method. This method discretizes the calculation domain into a series of particles and uses the contact behavior between particles to represent the complex mechanical behavior of rock crack propagation. For example, Ouyang et al. [
26] used PFC2D to simulate the rock shear process, calibrated the parameters to make the numerical curve match the experimental curve, and analyzed the microscopic force chains and failure mechanisms; Li et al. [
37] simulated the rock breaking process by the impact hammer using the discrete element method (DEM) and found that the rock fragmentation was due to the formation of the crushing zone and crack propagation under the impact load; Wang et al. [
38] reconstructed the numerical specimen using the finite difference and discrete element coupling method to study the dynamic mechanical behavior and microscopic damage evolution mechanism of rock materials. However, the discrete element method has many mesoscopic parameters without practical physical meaning, and it is necessary to conduct complex parameter calibration before numerical simulation, making it difficult to apply to practical engineering. The smoothed particle hydrodynamics (SPH) method is a pure Lagrangian meshless method [
39,
40]. This method overcomes the problem of mesh generation in traditional finite element methods. Therefore, it can be conveniently applied to the simulation of rock crack propagation. Previous scholars have conducted a large number of studies on SPH [
15,
39,
40,
41,
42,
43,
44,
45,
46,
47]. However, the application of the SPH method in the simulation of crack propagation in rocks with random pores is relatively rare.
Based on the deficiencies of previous studies, this paper first improves the traditional SPH control equation. The maximum tensile stress criterion and fracture marker ω are introduced to improve the traditional smooth kernel function to handle crack propagation. Due to the uncertainties of the mechanical properties of rock masses [
48,
49], the generation of random pores inside the rock mass model is realized within the SPH framework. Subsequently, the numerical simulation of crack propagation in the rock model with random pores is carried out, and the influence of different pore properties on the rock crack propagation morphology is obtained. Finally, the crack propagation mode of porous rocks is discussed, and the application prospects of SPH in the crack propagation of porous rocks are prospected. The research results provide a certain reference for correctly understanding the mechanism of crack initiation, propagation, and interaction in rocks with pores.
2. SPH Numerical Simulation Method for Rocks with Random Pores
2.1. Basic Principle of SPH
In SPH calculation, the kernel approximation integral interpolation form of a function is [
50]
In Equation (1), < > is the approximation symbol; W is the kernel function, and its smoothing length h is a parameter that determines the range of the support domain of the smooth kernel function; x’ is the position of the neighboring particle within the support domain of the particle at point x; Ω controls the size of the support domain, and its radius is generally several times the smoothing length h. The kernel function should satisfy the following properties: (1) non-negativity, that is, the kernel function W (x−x’) ≥ 0; (2) unity, that is, ; (3) symmetry, that is, ; (4) Dirac function property, that is, ; and (5) monotonicity, that is, the value of the kernel function W (x−x′) decreases as h increases.
Furthermore, the kernel function approximation expression form of the first derivative of the function is derived as
In solving practical problems, SPH generally converts the integral form of the expression into a discrete particle superposition expression form. Taking particle
i as the target point, when a series of particles is used to approximate this integral form, its value is approximated by the superposition of neighboring particles
j within the support domain. The particle approximation formulas of the function and its spatial first derivative are
In Equation (3), N is the total number of neighboring particles of particle i within the support domain; mj and ρj are the mass and density of neighboring particle j, respectively; and mj/ρj is the volume Vj of the particle.
Similarly, the particle approximation expression form of the first derivative of the function is derived as
In the SPH calculation process, the parameters of particles are updated through the control equation to transfer parameters between particles. In the calculation of solid stress–strain, the key parameters are the update of particle density and velocity, which correspond to the continuity equation and momentum equation in SPH, and their expressions can be written as [
51]
In Equations (5) and (6), vj, σj are the velocity and stress of neighboring particle j, respectively; t is the calculation time step; and α, β are Einstein notations.
2.2. Random Pore Generation Algorithm
There are a large number of pores inside the rock, and the reasons for their formation are as follows: (1) physical weathering, such as temperature changes causing differences in expansion and contraction between the surface and the interior of the rock to form fissures and then pores, and the freeze–thaw action expanding the rock pores when water freezes to form holes; (2) chemical weathering, such as the dissolution of rocks such as limestone leaving holes due to the dissolution effect, and the oxidation effect changing the mineral structure of the rock to produce holes; (3) biological action: the mechanical pressure of plant root growth enlarges the rock fissures to form holes, and the excavation of animals and the decomposition of rocks by substances secreted by microorganisms also cause holes. Pores have a significant impact on the mechanical properties of rocks. They will reduce the strength of the rock. The existence of pores weakens the internal connection of the rock, making it more likely to be damaged under external forces. They also reduce the elastic modulus of the rock, change the deformation characteristics of the rock, and make it more likely to produce large deformations when subjected to force. At the same time, they increase the permeability of the rock. The interconnected pores form channels, making it easier for fluids to flow in the rock. Therefore, it is necessary to consider concrete pores in numerical simulation.
Assume that the shape of the pores in the rock mass is circular, and define the center coordinates of the pore as (
xpori,
ypori) and the radius of the circular pore as
rpori. To characterize the randomness of the pores, random numbers
R1,
R2, and
R3 with values between (0~1) are introduced. For a two-dimensional rock mass model with a length of
l and a width of
m, the
x and
y coordinates of the center of the circular pore can be expressed as
After obtaining the center coordinates of the circular pore, it is necessary to determine the radius of the circular pore. In this section, the particle size range of the generated center pore is defined as (
dmin,
dmax). Therefore, to characterize the randomness of the pore size, the radius of the circular pore can be determined by the following formula:
When generating random aggregates inside the rock mass, it should be noted that the
i+1th pore and the
ith pore cannot overlap. The determination method is that the distance between the centers of the
i+1th circular pore and the
ith circular pore needs to be greater than the sum of the radii of the
i+1th circular pore and the
ith circular pore, that is,
When the area percentage of the pores in the rock mass model reaches the predetermined pore percentage Ppor, the generation of pores stops, and the circular pore data are imported into the SPH program. No SPH particles are generated inside the circular pores.
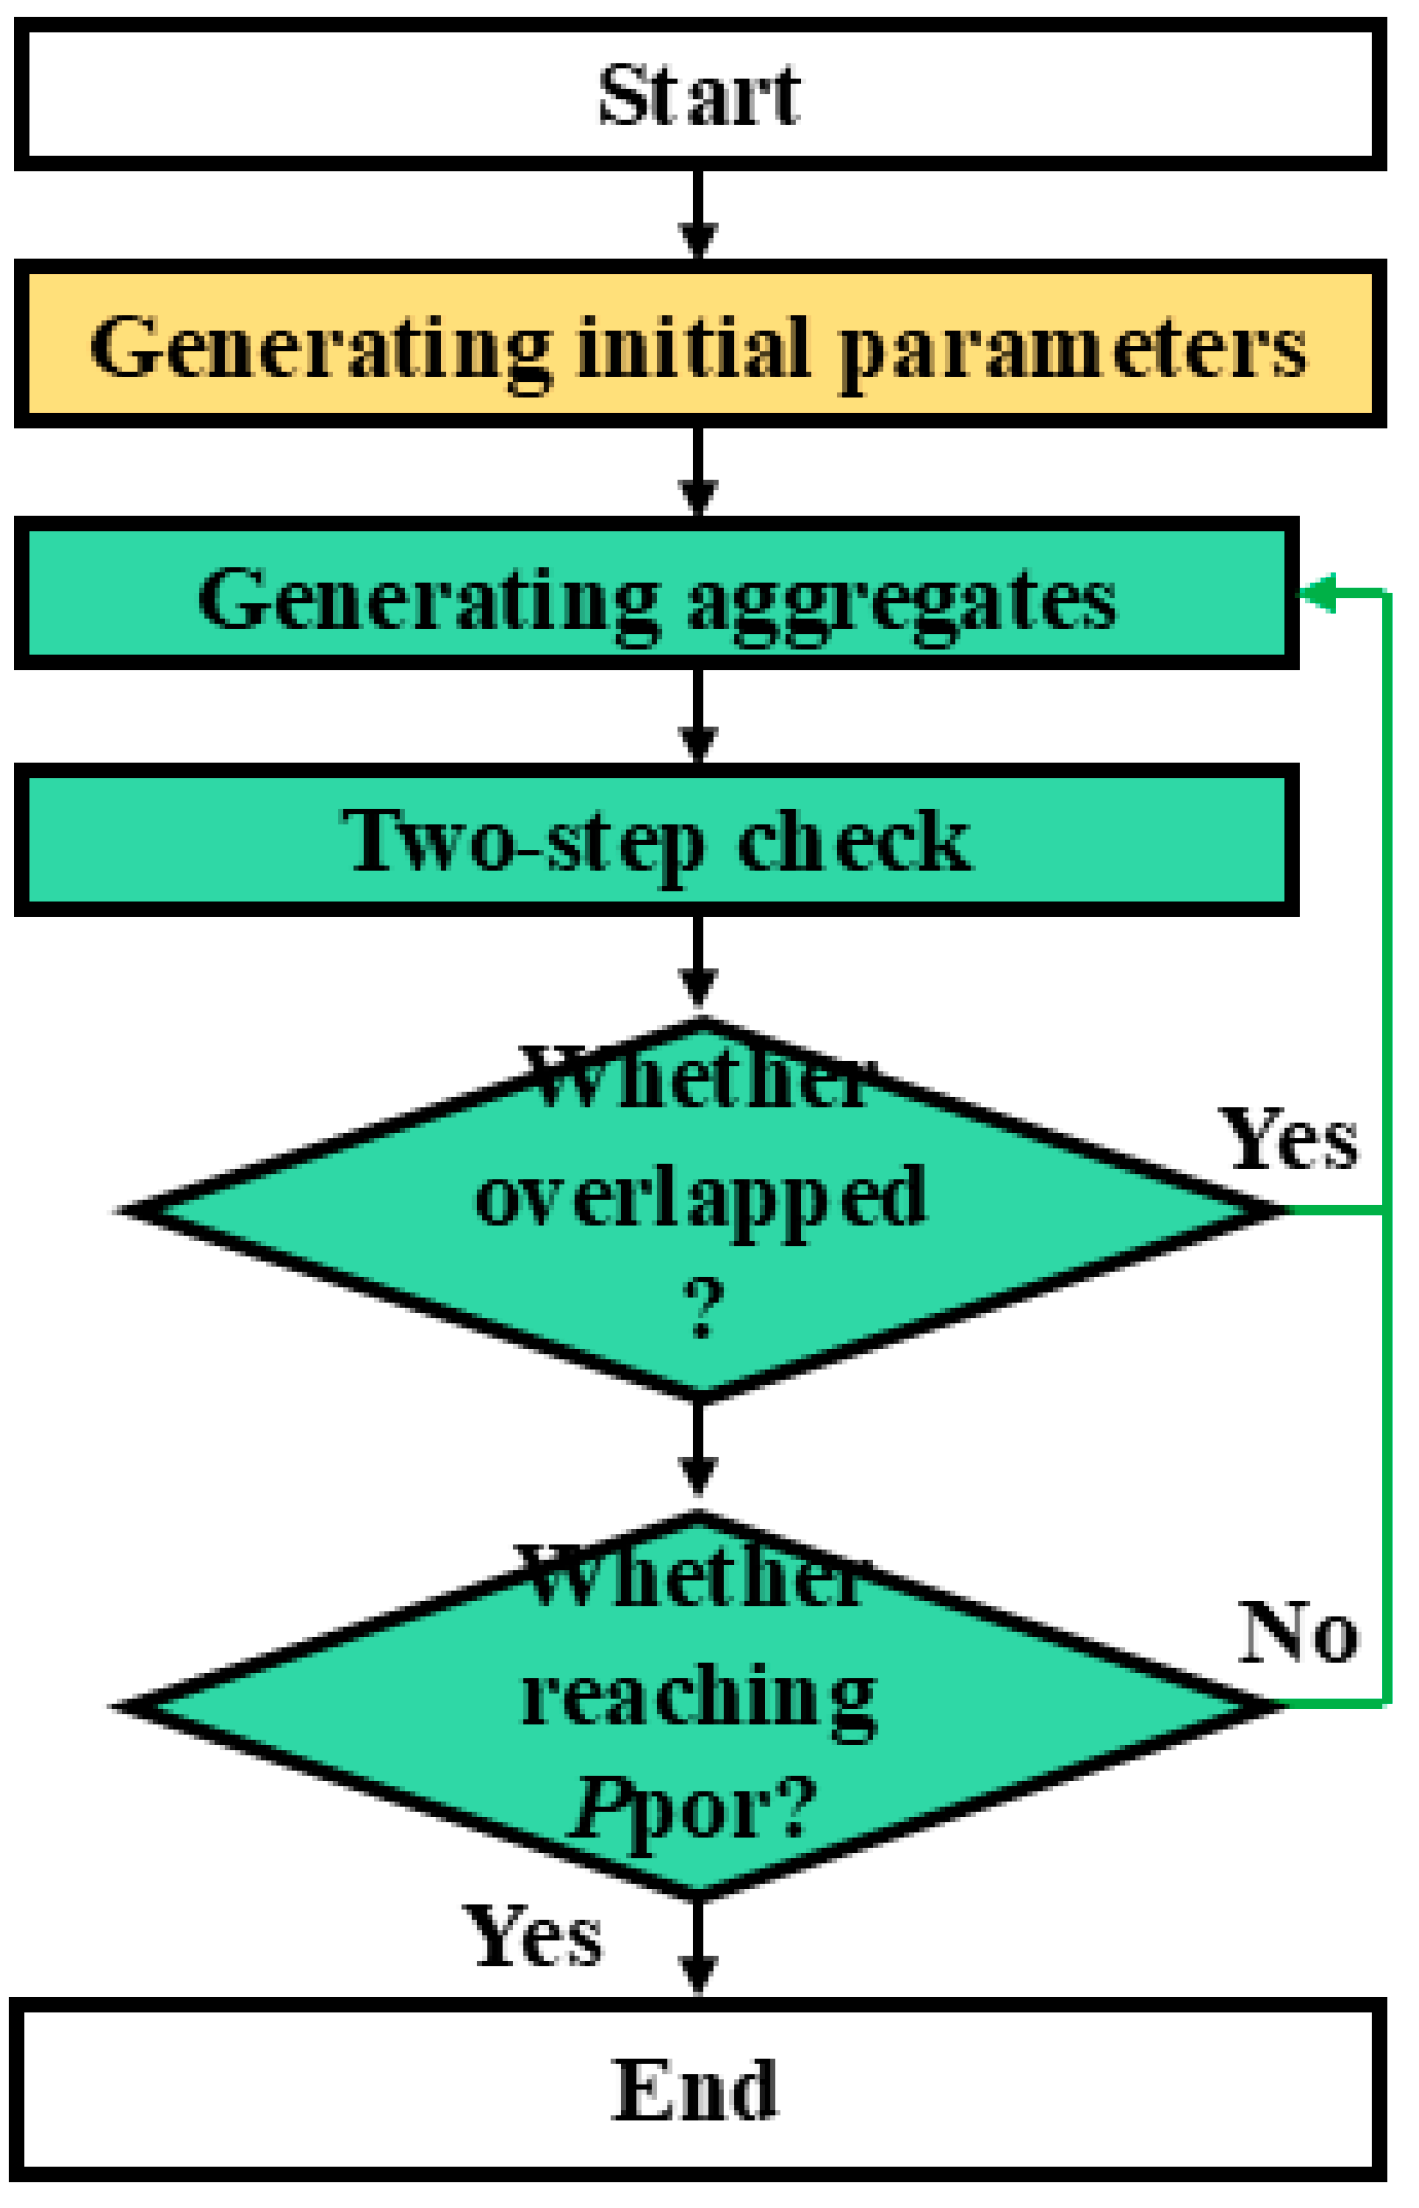
Therefore, according to the above steps, the generation process of random pores inside the rock mass within the SPH framework can be obtained, as shown in
Figure 1. It mainly includes generating initial parameters, generating pore parameters, checking for overlap between pores, and judging whether the target pore percentage has been reached.
2.3. SPH Numerical Treatment Method for Crack Propagation
To deal with particle failure, the failure criterion of the particle must first be determined. In this section, the most commonly used maximum tensile stress criterion is introduced; that is, when the maximum principal stress
σ1 on the SPH particle reaches the tensile strength
σt of the particle, it is considered that the particle has failed, and its expression can be written as [
52]
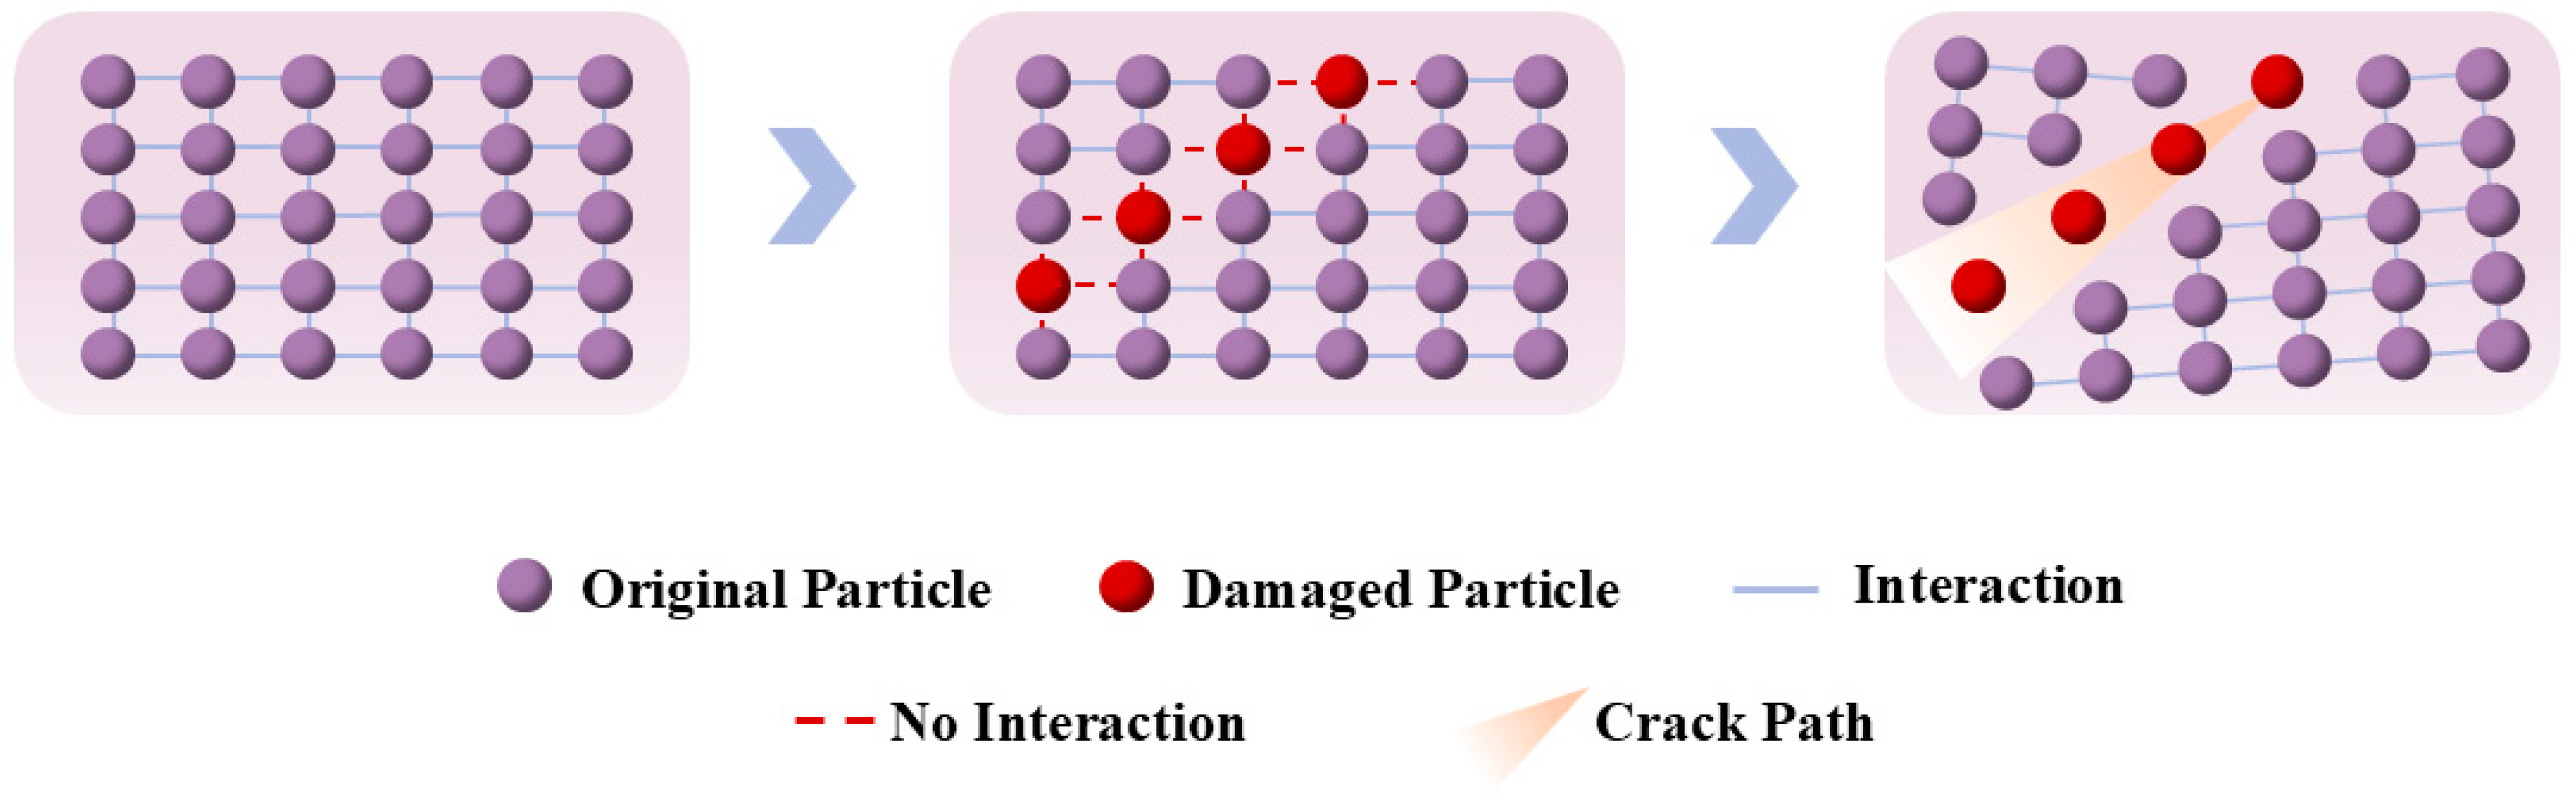
To characterize the failure process of the particle, a fracture marker
ω is introduced in this section to improve the traditional smooth kernel function
W. For the fracture marker
w, it is defined as follows: when the maximum principal stress
σ1 on the particle is greater than its tensile strength
σt,
w = 0, and the particle fails at this time; when the maximum principal stress
σ1 on the particle is less than its tensile strength
σt,
w = 1, and the particle has not failed at this time. The failure treatment process is shown in
Figure 2. The improved smooth kernel function is denoted as
K, and its relationship with the traditional smooth kernel function
W can be expressed as follows [
51]:
Therefore, considering the failure characteristics of the SPH particles in this section, by substituting the improved smooth kernel function
K in Equation (12) into the continuity Equation (5) and momentum Equation (6) of SPH, the SPH control equations considering the failure characteristics of particles can be obtained, as follows:
3. Analysis of Numerical Simulation Results
3.1. Establishment of Numerical Model and Schemes
To investigate the influence of random pore characteristics inside the rock mass on the fracture mechanical properties of the rock under tensile stress, two sets of simulation schemes were set up. Scheme A: different pore percentages; Scheme B: different pore sizes. The specific schemes are shown in
Table 1. The size of the rock mass model is 50 mm × 50 mm, and the entire model is divided into 200 × 200 = 40,000 particles. The upper and lower ends of the model are subjected to tensile stress, and the loading rate is 0.005 m/s. Randomly distributed pores are generated inside the model by the method described in
Section 2.2. The model size and particle discretization are shown in
Figure 3. The model parameters are as follows: elastic modulus
E = 25 GPa, Poisson’s ratio
μ = 0.2, and tensile strength
σt = 2 Mpa.
3.2. Crack Propagation Process
3.2.1. Influence of Different Pore Percentages on Rock Failure Modes
The tensile stress direction is perpendicular to the upper and lower sides of the model.
Figure 4 shows the uniaxial tensile crack propagation process of the rock model under different pore percentages in Scheme A. In the figure, red represents cracks, white represents the generated random pores, and blue represents the rock matrix. In Scheme A1 (
Ppor = 1%), during the initial loading stage, the stress in the rock model is evenly distributed, and the randomly distributed few pores have little influence on the overall stress field. As the tensile stress gradually increases, cracks first initiate in the stress concentration areas in the model. These areas are usually located at the edges of pores or local weak areas of the rock matrix. Due to the low porosity, the interaction between pores is relatively weak, and the crack propagation path is relatively straight, mainly developing along the direction of the maximum principal stress. During the crack propagation process, when encountering pores, the crack will deflect briefly, but due to the limited number of pores, the crack will quickly resume its original direction and continue to propagate until the model finally fails.
For Scheme A2 (Ppor = 2%), the number of pores in the model increases. During the loading process, the influence of pores on the internal stress distribution of the rock is more significant. The crack initiation points increase and are scattered near multiple pores. The crack propagation presents a more complex form. When the crack propagates to the surroundings, it is more likely to be attracted or blocked by adjacent pores, resulting in frequent branching and coalescence of cracks and the formation of multiple interlaced secondary cracks. These secondary cracks interact with the main crack and jointly affect the failure mode of the rock. When the rock fails, the local fracture area increases compared with Scheme A1, the failure mode is more complex, and the integrity is significantly reduced.
Under the condition of Scheme A3 (Ppor = 3%), the higher pore percentage makes the internal structure of the rock more porous. Under a relatively small tensile stress, a large number of microcracks will be generated around the pores. These microcracks will expand and connect rapidly. As the stress further increases, the crack propagation presents a disordered network structure. The pores become the key nodes of crack propagation. The cracks shuttle, branch, and coalesce among the pores, forming a complex crack network system. When the rock fails, it is no longer a simple local fracture but a large-area fragmentation, almost running through the entire model. The failure degree is much higher than that of the previous two schemes.
In Scheme A4 (Ppor = 4%), the pores occupy a large proportion of the rock. The mechanical properties of the rock decline significantly. At the beginning of loading, a large number of microcracks are distributed inside the model. These cracks expand and interweave rapidly under the guidance of the pores. During the crack propagation process, there is almost no obvious main crack direction, showing an all-round expansion trend and forming an extremely complex fragmentation mode. Compared with other schemes, the rock failure in this scheme is the most serious, almost completely losing its original bearing capacity. This shows that the increase in pore percentage greatly changes the failure mode of the rock from a relatively simple fracture to overall fragmentation, and the failure process is more rapid and violent.
In summary, as the pore percentage increases, the rock failure mode gradually changes from a relatively simple main crack propagation to a complex multi-crack network propagation and overall fragmentation mode. The interaction between pores and cracks becomes stronger. The influence of pores on the crack propagation path changes from a local small deflection to a comprehensive guidance and obstruction, resulting in frequent branching and coalescence of cracks and, finally, significantly reducing the strength and stability of the rock and changing its failure mechanism.
3.2.2. Influence of Different Pore Sizes on Rock Failure Modes
The tensile stress direction is perpendicular to the upper and lower sides of the model.
Figure 5 shows the uniaxial tensile crack propagation process of the rock model under different pore percentages in Scheme B. In Scheme B1 ((
dmin,
dmax) = (0.0005, 0.001) m), since the pore size is small, the pores are relatively densely distributed in the model. As the tensile stress increases, cracks initiate in the stress concentration areas. These areas are often located at the periphery of pores or the inhomogeneous areas of the rock matrix. Due to the large number of pores and small size, the crack propagation process is frequently disturbed by the pores, resulting in continuous branching and turning of the cracks. When the crack approaches a pore, it will change the propagation direction due to the stress concentration at the edge of the pore, forming a relatively complex crack network. At this time, the interaction between holes and cracks is strong. The pores act as stress concentration points to continuously promote the generation of new microcracks and guide the crack propagation around them, resulting in local fragmentation and a crack-interlaced failure mode when the rock fails.
For Scheme B2 ((dmin, dmax) = (0.001, 0.002) m), the pore size increases, and the number decreases. During the loading process, the stress concentration areas are mainly distributed around the larger pores. After the crack initiates, when it propagates to the surroundings, compared with Scheme B1, the frequency of being disturbed by the pores decreases. However, due to the increase in pore size, when the crack meets a pore, it will deflect significantly at the pore surface and may even extend along the pore surface for a certain distance before continuing to extend outward, forming a situation where the secondary crack is connected to the main crack. In this case, the interaction between holes and cracks is manifested as a significant change in the crack propagation path. When the rock fails, the fragmentation area is relatively concentrated near the pores, and the failure mode is slightly simpler than that of Scheme B1 but still has a certain complexity.
Under the condition of Scheme B3 ((dmin, dmax) = (0.0015, 0.003) m), the pores further increase in size and decrease in number. During loading, the stress concentration phenomenon mainly appears at a few large pores. After the crack initiates, the number of times affected by the pores during the propagation process is significantly reduced, and the crack propagation path is relatively straight. However, when encountering a pore, there will still be obvious deflection and branching. At this time, the interaction between holes and cracks is mainly reflected in the control of the crack propagation direction at key nodes; that is, the pores become important turning points of the crack propagation path, resulting in a local large block fracture when the rock fails. The failure range is relatively reduced compared with Scheme B1 and B2, but the failure degree is still relatively serious.
In Scheme B4 ((dmin, dmax) = (0.002, 0.004) m), the pore size is the largest, and the number is the least. At the beginning of loading, after the crack initiates in the relatively weak part of the rock matrix and due to the large pore spacing, the crack is basically not disturbed by other pores during the propagation process and mainly develops along the direction of the maximum principal stress. The propagation path is relatively single and straight. Although there will be a certain deflection when encountering a few pores, it will quickly resume the original direction. In this case, the interaction between holes and cracks is weak, and the rock failure is mainly manifested as a relatively simple through fracture. Compared with the previous schemes, the failure mode is the simplest, and the fragmented blocks are relatively large.
In summary, as the pore size increases, the rock failure mode gradually changes from a complex multi-crack network and local fragmentation to a relatively simple single-crack propagation and large block fracture. The interaction between pores and cracks changes from strong to weak. The influence of pores on the crack propagation path changes from frequent interference and guidance to less control at key nodes, resulting in a reduction in the complexity of rock failure. However, the failure degree is still significantly affected by the existence of pores, and the overall strength and stability of the rock decrease with the increase in pore size.
3.3. Stress–Strain Curves
Figure 6 shows the stress–strain curves of the rock under different schemes. During the tensile loading simulation of the rock model under different schemes, the stress–strain curves show obvious stage characteristics. In the elastic stage, the stress and strain have a linear relationship, and the rock exhibits elastic deformation characteristics. The slope of the curve in this stage remains basically unchanged, and this slope is the elastic modulus of the rock. As the loading continues, when the stress reaches a certain level, microcracks begin to initiate and propagate inside the rock, and the curve gradually deviates from the linear relationship and enters the elastoplastic stage. At this time, the stress growth rate gradually slows down. When the crack propagates to a certain extent, the rock reaches its peak strength and then enters the post-peak stage. The stress starts to decline, the strain continues to increase, and the rock fails and is accompanied by large deformation.
For the case of different pore percentages in Scheme A, the stress–strain curve of Scheme A1 (Ppor = 1%) has a relatively large slope in the elastic stage, indicating that its elastic modulus is relatively high. This is because the low porosity makes the internal structure of the rock relatively complete, and the connection between particles is relatively tight, resulting in a strong resistance to deformation. Its peak strength is the highest among all in Scheme A, reaching about 373 KPa. In the post-peak stage, the stress decreases relatively slowly, showing a certain ductility characteristic. This is because although a small number of pores can cause crack propagation, the damage to the overall structure is relatively limited, and the crack propagation process is relatively stable. The elastic modulus of Scheme A2 (Ppor = 2%) is lower than that of A1, and the slope of the curve in the elastic stage becomes smaller. This is because the increase in the number of pores weakens the internal connection of the rock. Its peak strength drops to about 359 KPa, the stress decreases faster in the post-peak stage, and the ductility decreases. This shows that the increase in pores accelerates the crack propagation and interaction, making the rock failure process more rapid. The elastic modulus of Scheme A3 (Ppor = 3%) further decreases, and the linearity of the stress–strain curve in the elastic stage is significantly reduced. The peak strength is about 338 KPa, and the stress drops sharply in the post-peak stage, almost showing a brittle failure characteristic. This is because the higher pore percentage makes the internal structure of the rock porous, and a large number of microcracks start to initiate and connect at a lower stress, resulting in a rapid loss of the rock’s bearing capacity. The elastic modulus of Scheme A4 (Ppor = 4%) is extremely low, and the curve has already shown obvious nonlinearity in the elastic stage. The peak strength is only about 303 KPa. In the post-peak stage, the stress quickly approaches zero, and the rock shows a typical brittle failure. This indicates that the pores have a very significant deterioration effect on the mechanical properties of the rock at this time, and the rock can hardly withstand large deformation.
In the case of different pore sizes in Scheme B, the stress–strain curve of Scheme B1 ((dmin, dmax) = (0.0005, 0.001) m) has a relatively small slope in the elastic stage due to the small pore size and large number, and the elastic modulus is low. This is because the weakening effect of many small pores on the rock structure is relatively dispersed. Its peak strength is about 370 KPa. In the post-peak stage, the stress decreases in a complex manner, showing a multi-stage fluctuating downward trend. This is because the crack propagation in the complex pore network is disturbed and blocked many times, resulting in a tortuous stress release process. The elastic modulus of Scheme B2 ((dmin, dmax) = (0.001, 0.002) m) is slightly higher than that of B1, and the linearity of the curve in the elastic stage is improved. The peak strength is about 359 KPa. The stress decreases faster in the post-peak stage compared with B1 but still has a certain ductility. This is because the increase in pore size makes the stress concentration area relatively concentrated. Although the crack propagation path is affected by the larger pores, the overall failure process is still relatively slow. The elastic modulus of Scheme B3 ((dmin, dmax) = (0.0015, 0.003) m) further increases, and the stress–strain curve in the elastic stage is closer to linear. The peak strength is about 344 KPa. The stress decreases relatively smoothly in the post-peak stage, showing a characteristic similar to the transition from brittle to ductile. This is because the control effect of larger pores on crack propagation makes the rock failure process have a certain regularity, and the stress release is relatively uniform. The elastic modulus of Scheme B4 ((dmin, dmax) = (0.002, dmax) = (0.002, 0.004) m) is the highest in Scheme B. The stress–strain curve in the elastic stage is closest to that of an ideal elastic body. The peak strength is about 321 KPa. The stress decreases relatively steeply in the post-peak stage, but compared with the high porosity case in Scheme A, it still has a certain bearing capacity. This is because although the pore size is large and the number is small, the damage to the overall structure of the rock is relatively concentrated in the local area, and the bearing frame of the rock is not completely destroyed.
By comparing different schemes, it can be seen that in Scheme A, as the pore percentage increases, the elastic modulus of the rock gradually decreases, the peak strength drops significantly, and the post-peak ductility gradually weakens. The failure mode changes from a failure with a certain ductility to a brittle failure, indicating that the influence of porosity on the mechanical properties of the rock is comprehensive and negative. In Scheme B, as the pore size increases, the elastic modulus first decreases and then increases, and the peak strength also changes similarly. The post-peak characteristics change from a complex fluctuating decrease to a relatively smooth transition, reflecting that the influence of pore size on the mechanical properties of the rock is relatively complex and not a simple linear relationship. To a certain extent, the damage of large pores to the rock structure has a relatively concentrated characteristic, which is different from the dispersed damage mode of small pores. Generally speaking, changes in either pore percentage or pore size will significantly change the stress–strain behavior and failure mechanism of the rock.
4. Discussion
4.1. Porous Rock Crack Propagation Modes
Based on the improved SPH method, this paper simulated the rock crack propagation process under different pore properties. The crack propagation modes in different calculation schemes showed significant differences and regularities. For Scheme A, that is, the case of different pore percentages, when the pore percentage was 1% (A1), the crack propagation mainly originated from the local stress concentration areas in the model, which were mostly at the edges of pores or the weak areas of the rock matrix. Due to the small number of pores, the crack was hardly affected by the pores in the initial stage of propagation and basically extended linearly along the direction of the maximum principal stress. Only when encountering a small number of pores did it deflect briefly at a small angle and then quickly resume the original direction. As the pore percentage increased to 2% (A2), the number of pores increased, and the crack initiation points also increased and were scattered near multiple pores. At this time, the crack propagation was no longer a simple straight line. Instead, it was frequently attracted or blocked by adjacent pores, resulting in frequent branching and coalescence, forming a complex secondary crack network that intertwined with the main crack. The failure mode changed from a relatively simple local fracture to a complex mode with an increased number of local fracture areas. When the pore percentage further increased to 3% (A3), the internal structure of the rock became porous due to a large number of pores. Under low stress, a large number of microcracks were generated around the pores and expanded and connected rapidly. The crack propagation path presented a disordered network structure, and the pores became the key nodes. The cracks shuttled, branched, and coalesced among the pores, and the rock was almost completely fragmented when it failed, running through the entire model. This indicated that the increase in pore percentage greatly changed the path morphology and failure degree of crack propagation. When the pore percentage reached 4% (A4), the mechanical properties of the rock deteriorated severely. The model was initially filled with a large number of microcracks, which expanded in all directions under the guidance of the pores without a clear main crack direction, forming an extremely complex fragmentation mode and completely losing the bearing capacity. This further highlighted the strong influence of a high pore percentage on crack propagation, changing it from a relatively orderly propagation to a disorderly overall fragmentation propagation.
In Scheme B, different pore sizes had different influences on the crack propagation mode. When the pore size was small (B1, (dmin, dmax) = (0.0005, 0.001) m), the pores were densely distributed in the model. After the crack initiated, due to the existence of many small pores, the propagation process was frequently blocked and interfered with, constantly branching and turning and forming a complex crack network. The interaction between holes and cracks was strong, promoting the generation of new microcracks, guiding the crack propagation, and resulting in a local fragmentation and crack interlaced failure mode when the rock failed. As the pore size increased to (B2, (dmin, dmax) = (0.001, 0.002) m), the number of pores decreased, and the stress concentration areas were concentrated around the larger pores. The frequency of the crack being disturbed by the pores decreased. However, when it met a pore, it would deflect significantly at the pore surface and might even extend along the pore surface to form a connection between the secondary crack and the main crack. The failure mode was slightly simpler than that of B1 but still had a certain complexity, indicating that the increase in pore size changed the interaction mode between the crack and the pore and the complexity of the propagation path. When the pore size further increased (B3, (dmin, dmax) = (0.0015, 0.003) m), the pores were fewer and larger. The number of times the crack was affected by the pores during propagation was significantly reduced, and the path was relatively straight. However, when encountering a pore, there was still obvious deflection and branching. At this time, the pores served as key turning points to control the crack propagation direction, resulting in a local large block fracture when the rock failed. The failure range was reduced compared with B1 and B2, but the failure degree was still serious, indicating that the control effect of large pores on crack propagation changed from frequent interference to key node guidance. When the pore size was the largest (B4, (dmin, dmax) = (0.002, 0.004) m), the pore spacing was large. The crack was basically not disturbed by other pores during propagation and extended linearly along the direction of the maximum principal stress. Only when encountering a few pores did it deflect slightly and then quickly resume the original direction. The interaction between holes and cracks was weak, and the failure mode was simple, being a through fracture, indicating that in the case of large pores and a small number, the crack propagation was relatively independent and less affected by the pores.
In summary, pore percentage mainly affects crack propagation by changing the porosity and stress distribution uniformity of the rock’s internal structure. With the increase in pore percentage, crack propagation evolves from a simple local propagation to a complex overall fragmentation propagation, and the influence of pores on the crack changes from local interference to comprehensive domination. The influence of pore size on the crack propagation mode lies in changing the interaction frequency and mode between the pore and the crack. Small pores cause frequent interference with crack propagation due to their large number, forming a complex network. Large pores, due to their small number and obvious stress concentration, change from frequent interference to key node control of the crack propagation direction, making the failure mode change from complex to relatively simple. The influences of these two factors on the crack propagation mode are intertwined, jointly determining the crack propagation behavior and final failure mode of the porous rock under stress, and both need to be focused on in rock mechanics research and engineering applications, providing a key theoretical basis for the stability assessment and design of rock engineering.
4.2. Application Prospects of SPH in Simulating Crack Propagation in Porous Rocks
In the field of rock crack propagation simulation, the SPH method has shown significant application potential and advantages. By discretizing the continuous medium into particles, SPH can naturally handle complex boundary conditions and material discontinuities, which is crucial for simulating crack propagation in rocks with random pores. Its kernel function approximation and particle interaction mechanism can effectively capture the local mechanical behavior changes during stress concentration around pores, crack initiation, and propagation. Compared with traditional grid-based methods, it can more accurately reflect the complex mechanical response inside the rock when simulating the pore–crack interaction.
However, this study is based on a two-dimensional model. The rock structures in actual engineering are three-dimensional, and the crack propagation paths and pore distributions in three-dimensional space have more complex geometric shapes and mechanical properties. Therefore, it is of great significance to focus on the development of a three-dimensional SPH high-performance program in future research. During the development process, it is necessary to optimize the particle search algorithm and calculation efficiency to deal with the large increase in the number of particles and calculation complexity in the three-dimensional model. By using advanced computer technology and parallel computing architectures, fast and accurate numerical simulations can be achieved to ensure high-precision results are obtained within a reasonable time. In simulating the crack propagation of real-shaped rocks, the three-dimensional SPH program should be able to accurately characterize the heterogeneity and anisotropy of the rock. By combining geological survey data and rock microstructure analysis, a more realistic rock model can be constructed, considering the influences of different mineral compositions, particle size distributions, and cementation conditions on crack propagation. By introducing multi-scale modeling techniques, the microscopic pore structure can be linked with the macroscopic crack propagation behavior to deeply explore the failure mechanism of the rock under different loading conditions and environmental factors, providing more reliable stability assessment and disaster prediction means for rock engineering, such as underground mining, slope stability, and water conservancy project foundations, and promoting the development and application of rock mechanics in engineering practice. Therefore, future research should focus on developing a high-performance, three-dimensional parallel SPH program.
5. Conclusions
This study developed a numerical simulation system for rocks with random pores based on the improved SPH method. By introducing the maximum tensile stress criterion and the fracture marker ω, the traditional smooth kernel function was improved, and the SPH control equations considering the failure characteristics of particles were obtained, enabling the accurate simulation of particle behavior during crack propagation. Meanwhile, a random pore generation algorithm was developed to create a rock model with random pores. The research found that pore percentage and pore size have significant impacts on crack propagation morphology, the stress–strain law, and the mechanical properties of rocks. As the pore percentage increases, the crack propagation changes from a straight-line propagation slightly disturbed by pores to a complex network-like propagation with frequent branching and coalescence, eventually leading to overall fragmentation. The elastic modulus and peak strength of the rock decrease, and the post-peak ductility weakens. As the pore size increases, the crack propagation changes from a complex network-like shape frequently disturbed by small pores to a relatively simple through fracture controlled by the key nodes of large pores. The elastic modulus first decreases and then increases, the peak strength changes similarly, and the post-peak characteristics change from complex fluctuations to a stable transition.
However, this study has certain limitations. Firstly, the research is based on a two-dimensional model, while rock structures in actual engineering are three-dimensional. The two-dimensional model cannot fully reflect the complex geometric shapes and mechanical properties of crack propagation paths and pore distributions in three-dimensional space. Secondly, although the randomness of pores is considered in the simulation process, other characteristics of rock materials, such as the distribution of mineral components and the complexity of the cementation between particles, have not been fully considered, which may affect the agreement between the simulation results and the actual situation. In addition, in terms of computational efficiency, the current simulation method has certain limitations when dealing with large-scale models. The calculation time is relatively long, making it difficult to meet the requirements of rapid analysis in practical engineering.
In response to the above-mentioned deficiencies, future research will focus on developing a high-performance, three-dimensional parallel SPH program. During the development process, the particle search algorithm will be optimized to improve computational efficiency and cope with the significant increase in the number of particles and computational complexity in three-dimensional models. By combining geological survey data and rock microstructure analysis, a more realistic rock model will be constructed, fully considering the influences of different mineral compositions, particle size distributions, and cementation conditions on crack propagation. Multi-scale modeling techniques will be introduced to link the microscopic pore structure with the macroscopic crack propagation behavior and deeply explore the failure mechanism of rocks under different loading conditions and environmental factors. This will provide more reliable stability assessment and disaster prediction methods for rock engineering, such as underground mining, slope stability analysis, and the design of hydraulic engineering foundations, and promote the development of rock mechanics in engineering practice.


