Article

Study on Delay Time and Rock Mass Damage Patterns in Pre-Split Blasting of Water-Saturated Skarn in Alpine Regions

1
Faculty of Land Resources Engineering, Kunming University of Science and Technology, Kunming 650093, China
2
Advanced Blasting Technology Engineering Research Center of Yunnan Provincial Department of Education, Kunming 650093, China
*
Author to whom correspondence should be addressed.
Appl. Sci. 2025, 15(4), 1776; https://doi.org/10.3390/app15041776
Submission received: 10 January 2025 / Revised: 3 February 2025 / Accepted: 6 February 2025 / Published: 10 February 2025

Abstract

:
In order to solve the problem of ineffective pre-splitting blasting and reduce the damage caused to preserved rock bodies in the Niukutou open-pit quarry in the alpine region of Qinghai Province, China, this study investigated the influence of different delay times on the damage caused to the rock mass, combining numerical calculations with field tests. Using the finite element software ANSYS/LS-DYNA 19.0 and based on the constitutive model of saturated skarn, numerical models of pre-splitting blasting with four different delay times (0 ms, 12 ms, 18 ms, and 24 ms) were established. These models systematically analyze the damage evolution of rock and the effective stress distribution in specific elements under different delay times. The results indicate that a maximum damage depth of 32.56 cm occurs when the inter-hole delay is 0 ms, while a minimum damage depth of 30.61 cm is observed when the inter-hole delay is 18 ms. Further analysis reveals that the peak effective stress is highest when the inter-hole delay is 0 ms, and that the peak effective stress at 18 ms is higher than that at 12 ms and 24 ms. Considering the need to control the damage caused to the surrounding rock and the blasting effectiveness, the best pre-splitting blasting effect is achieved with an inter-hole delay of 18 ms. Field tests show that the damage depth of the retained rock mass is 1.62 m when the inter-hole delay is 0 ms; however, it decreases to 0.90 m when the delay is 18 ms, representing a 44% reduction in rock mass damage depth. This study provides theoretical support and practical guidance for the optimization of pre-splitting blasting in saturated skarn in alpine regions.

1. Introduction

Pre-splitting blasting is a technique that involves the creation of a pre-crack of a certain width between the excavation rock mass and the reserved rock mass before the detonation of the main blasting area; this is in order to mitigate the blasting vibration generated after the detonation of the main area and reduce the damage caused to the reserved rock mass, thereby ensuring the integrity of the slope [1]. In the practical application of pre-splitting blasting, the reasonable setting of pre-split hole parameters is particularly crucial; significant progress has been made in this field of research [2,3]. He et al. [4] used numerical simulation to investigate the effect of four different inter-hole delay times (0 μs, 40 μs, 80 μs, and 120 μs) and hole spacing on the effectiveness of pre-crack formation, and the optimal combination of a delay time of 80 μs and a hole spacing of 60 cm was derived after field verification. Zhang et al. [5] analyzed the impact of the parameters of pre-splitting blasting on its effectiveness using numerical simulations and applied the findings to actual construction, achieving good results. Zuo et al. [6] explored the fracture characteristics of rock influenced by various joint angles via SHPB (Split Hopkinson Pressure Bar) experiments and numerical simulations, providing guidance for geotechnical engineering design. Ma et al. [7] proposed a hole-by-hole pre-splitting blasting technique by conducting theoretical research and field experiments to compare the effects of hole-by-hole initiation pre-splitting blasting with conventional simultaneous pre-splitting blasting. The results showed that the average rate of reduction in the blasting vibration velocity for conventional same-row blasting was 26.40%, while that for hole-by-hole blasting was 41.45%. Based on numerical studies and theoretical analysis, Li et al. [8] provided an optimization scheme for pre-splitting blasting under high in situ stress conditions. Hu et al. [9] proposed the axially decoupled spherical charge pre-splitting blasting (PSB-ADSC) technique and studied the smoothness of the fracture surface and the formation and development process of the pre-crack under PSB-ADSC conditions using high-speed photography and digital image correlation techniques on concrete models. The results indicate that the PSB-ADSC method can produce pre-cracks, fracture surfaces, and half-hole walls that are similar to those of traditional pre-splitting blasting.
In open-pit mining, the damage to the reserved rock mass caused by blasting not only affects the economic efficiency of mine production but also directly relates to the safety of operations. The reasonable control of blasting-induced damage to the surrounding rock is crucial for ensuring the safety of mines and improving the efficiency of production [10]. Studies have shown that rock mass damage is closely related to changes in sound velocity, and blasting damage evolution models based on sound velocity changes have been established and applied [11,12,13]. Taylor et al. [14] proposed relationships between the damage variable D, crack density, and effective bulk modulus and effective Poisson’s ratio, expanding the applicability of damage models. Meglis et al. [15] studied the surrounding rock damage induced by tunnel excavation in the Canadian Atomic Energy Underground Laboratory using ultrasonic tomography, based on the sensitivity of the ultrasonic velocity and amplitude to cracks. Ahrens et al. [16] linked the development of cracks in materials to changes in the longitudinal wave velocity, using changes in the longitudinal wave velocity to evaluate the number of micro-cracks that developed in rock materials. Aftabi Milad [17] conducted several studies on the influence of various parameters, such as the structural plane conditions, depositional environment, and physical and mechanical properties of rock, on the blasting damage. The results indicated that appropriate delay times can effectively control blasting damage, but setting the delay time too high yields poor results. Shi et al. [18] proposed a modal-based method for assessing the damage caused by explosions to reinforced concrete columns based on LS-DYNA numerical simulation experiments and field tests. Cui et al. [19] studied the cumulative damage characteristics of the reserved surrounding rock after cyclic blasting in the Jinjing Tunnel using acoustic wave tests and numerical simulations. Currently, the acoustic wave testing method remains the most commonly used and efficient testing technique for studying the damage caused by blasting to rock masses [20,21,22,23].
Although relatively thorough research on the optimization of pre-splitting blasting parameters and the control of rock mass damage has been performed both domestically and internationally, systematic studies on the specific impact of hole-by-hole pre-splitting blasting on the damage caused to reserved rock masses are lacking. To improve the pre-splitting blasting effect at the Niukutou open-pit mine in the alpine region of Qinghai Province and reduce the damage caused to the reserved rock mass, this study combines numerical calculations with field experiments. Using the ANSYS/LS-DYNA finite element software, the influence of different delay times on rock mass damage was investigated, and the patterns of rock mass damage caused by hole-by-hole pre-splitting blasting were explored. An optimal combination of pre-splitting blasting parameters suitable for the site was determined. Finally, the parameter combination determined by the numerical model was verified through field experiments and acoustic wave testing. These research findings can provide a theoretical basis and technical support for the optimization of pre-splitting blasting technology in alpine regions.

2. Pre-Splitting Blasting Seam Formation Mechanism and Damage Theory

2.1. Analysis of the Crack Propagation Mechanism in Pre-Splitting Blasting

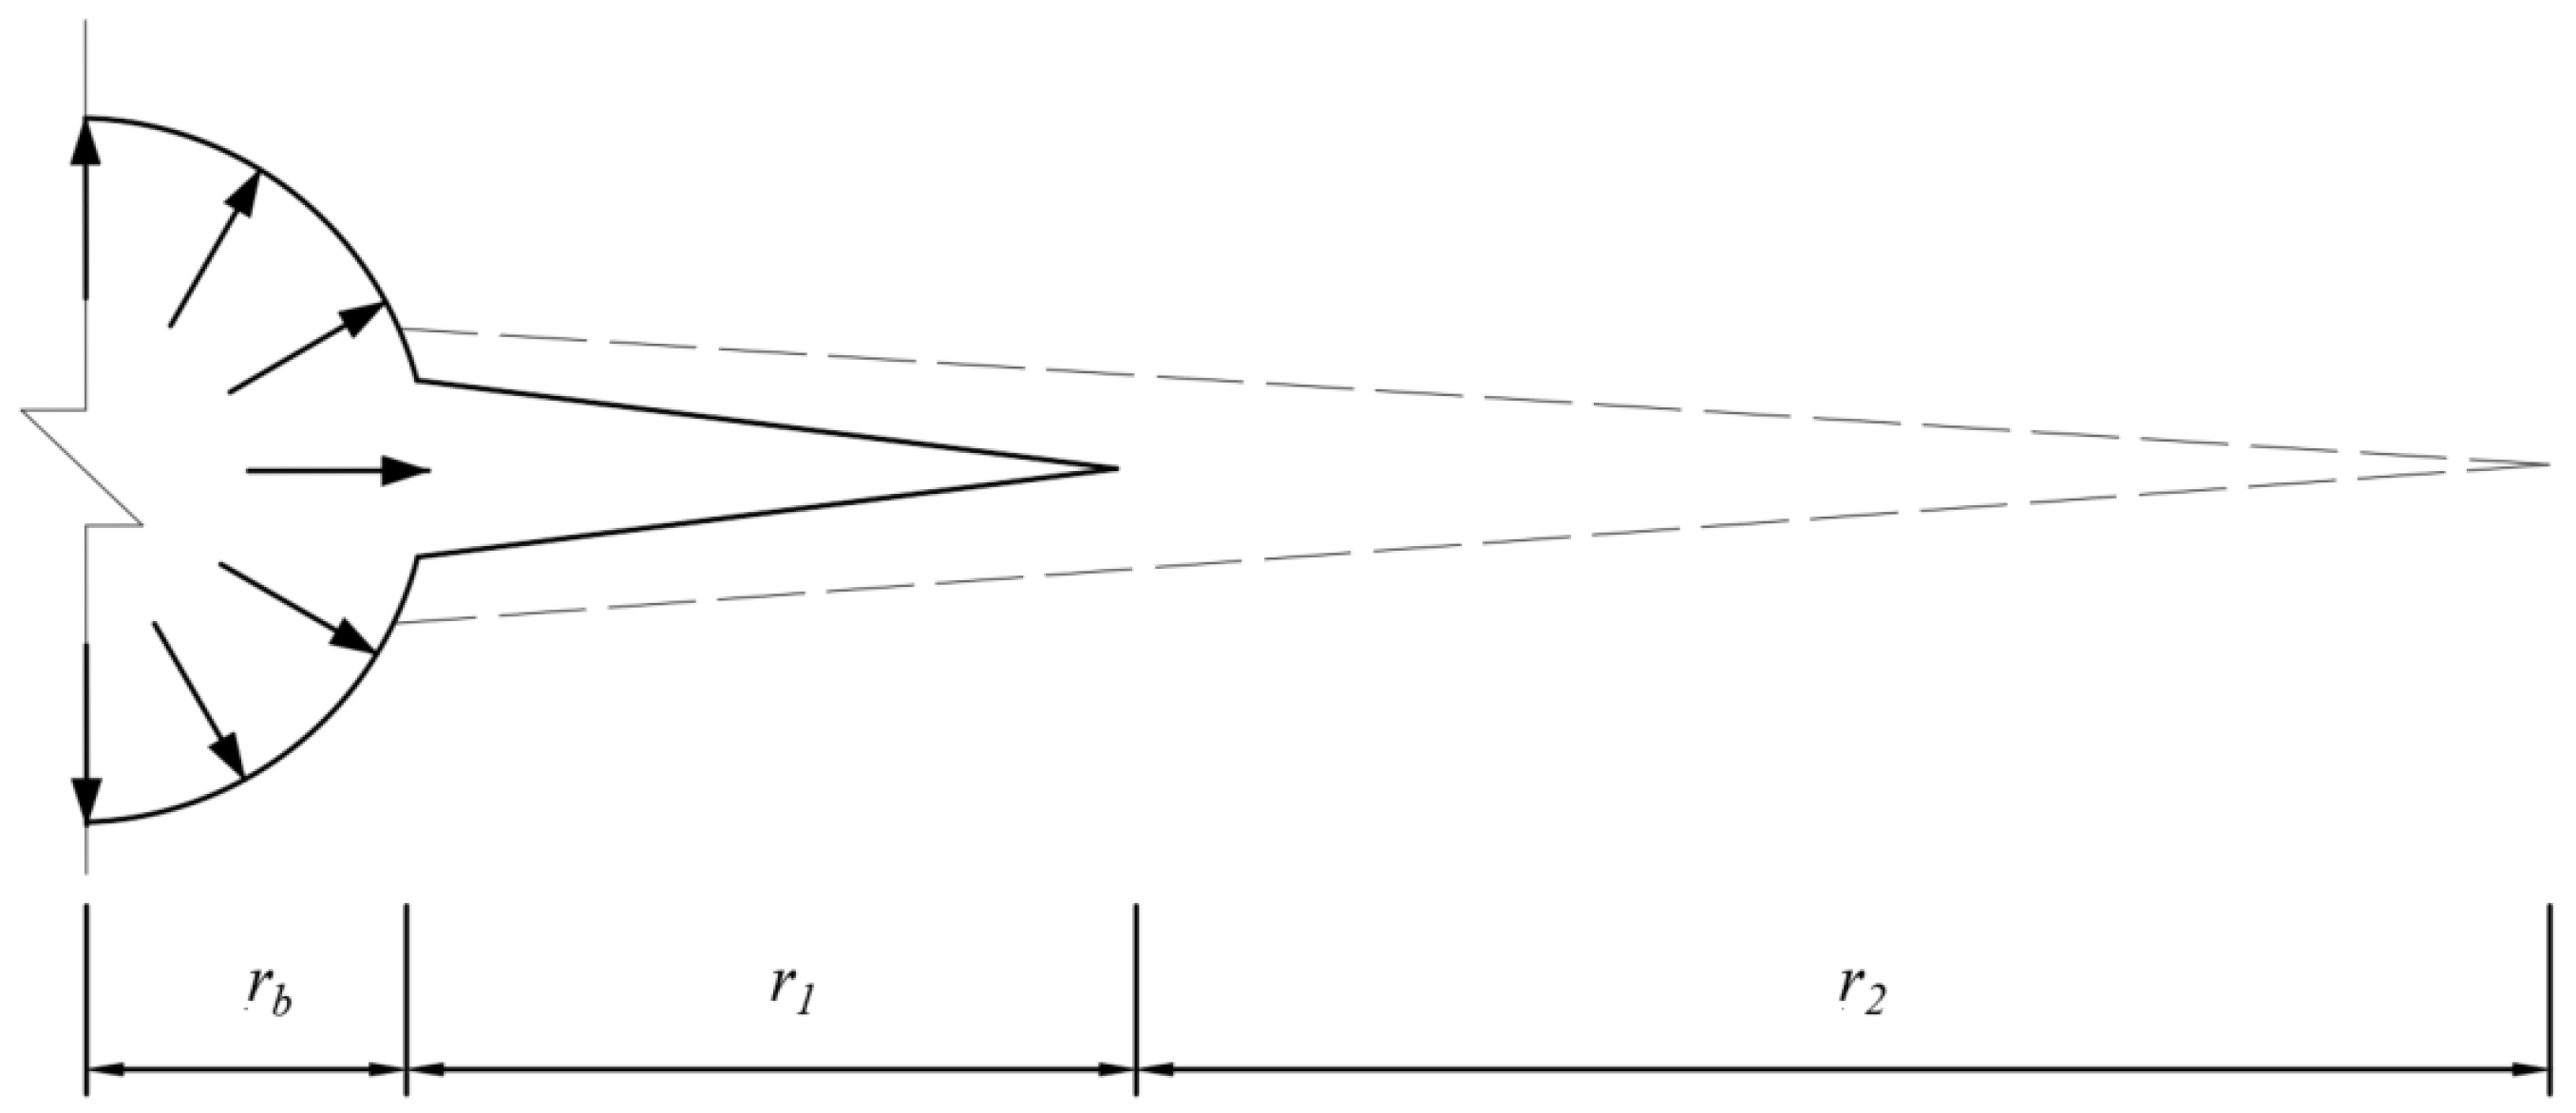
There are three main theories related to the formation of pre-splitting blasting cracks [24,25]: the stress wave superposition theory, the high-pressure static effect theory of explosion gases, and the combined effect theory of stress waves and explosion gases (also known as the joint action theory of stress waves and high-pressure gases). This theory posits that pre-splitting cracks are the result of the combined effects of stress waves generated by explosive detonation, which propagate through the rock mass, and the quasi-static pressure of explosion gases in the blast holes. Specifically, the stress waves created by the blast holes produce initial cracks on the respective hole walls, as shown by the cracks of length r1 in Figure 1; then, these cracks expand and coalesce under the pressure of the explosion gases to form the final cracks, as illustrated by the extended cracks of length r2 in Figure 1. The presence of empty holes causes the reflection of compressive stress waves and concentrates the stress (tangential tensile stress) at the intersections of the empty hole walls and the lines connecting the blast hole centers, playing a crucial role. The detonation sequence is arranged with slight time delays between adjacent blast holes to ensure the existence and effectiveness of the empty holes. As the cracks form, release waves propagate through the rock mass, causing a decrease in the stress peak near the cracks and making it less likely that additional cracks will form, thereby enhancing the stability of the surrounding rock that is retained.

2.2. Mechanism of the Effect of Different Detonation Time Intervals in Pre-Splitting Blasting

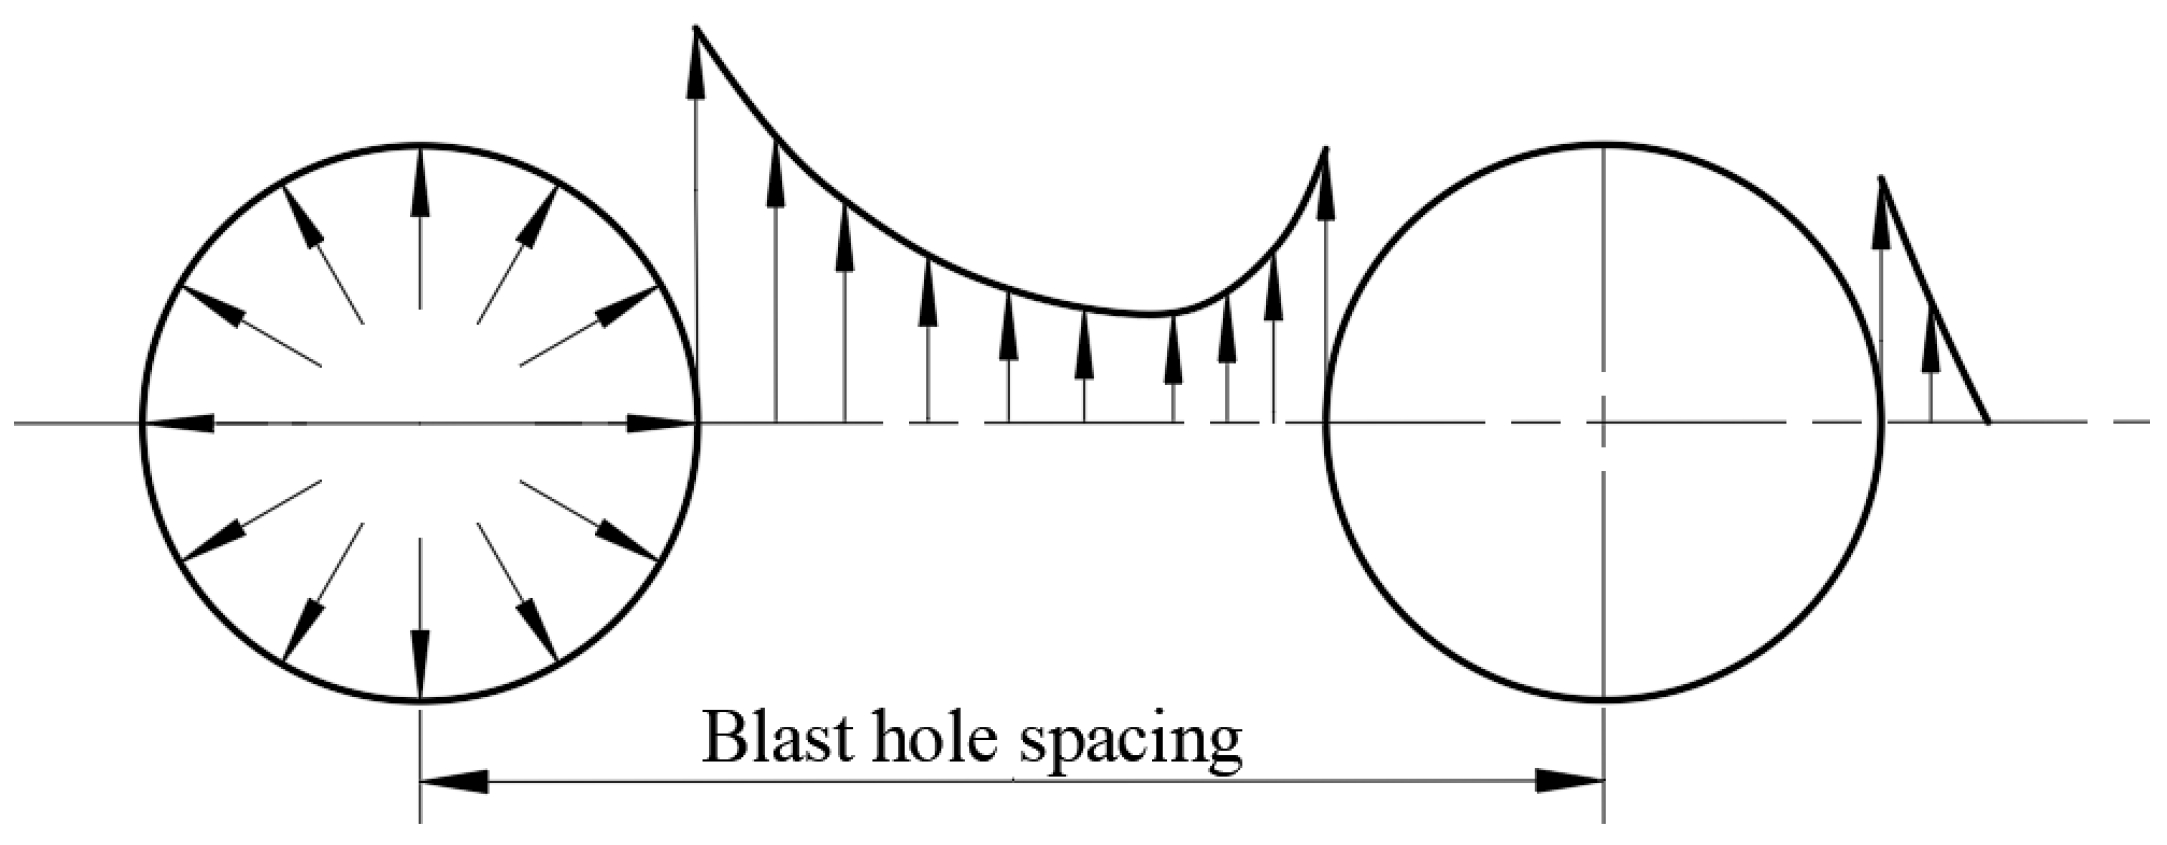
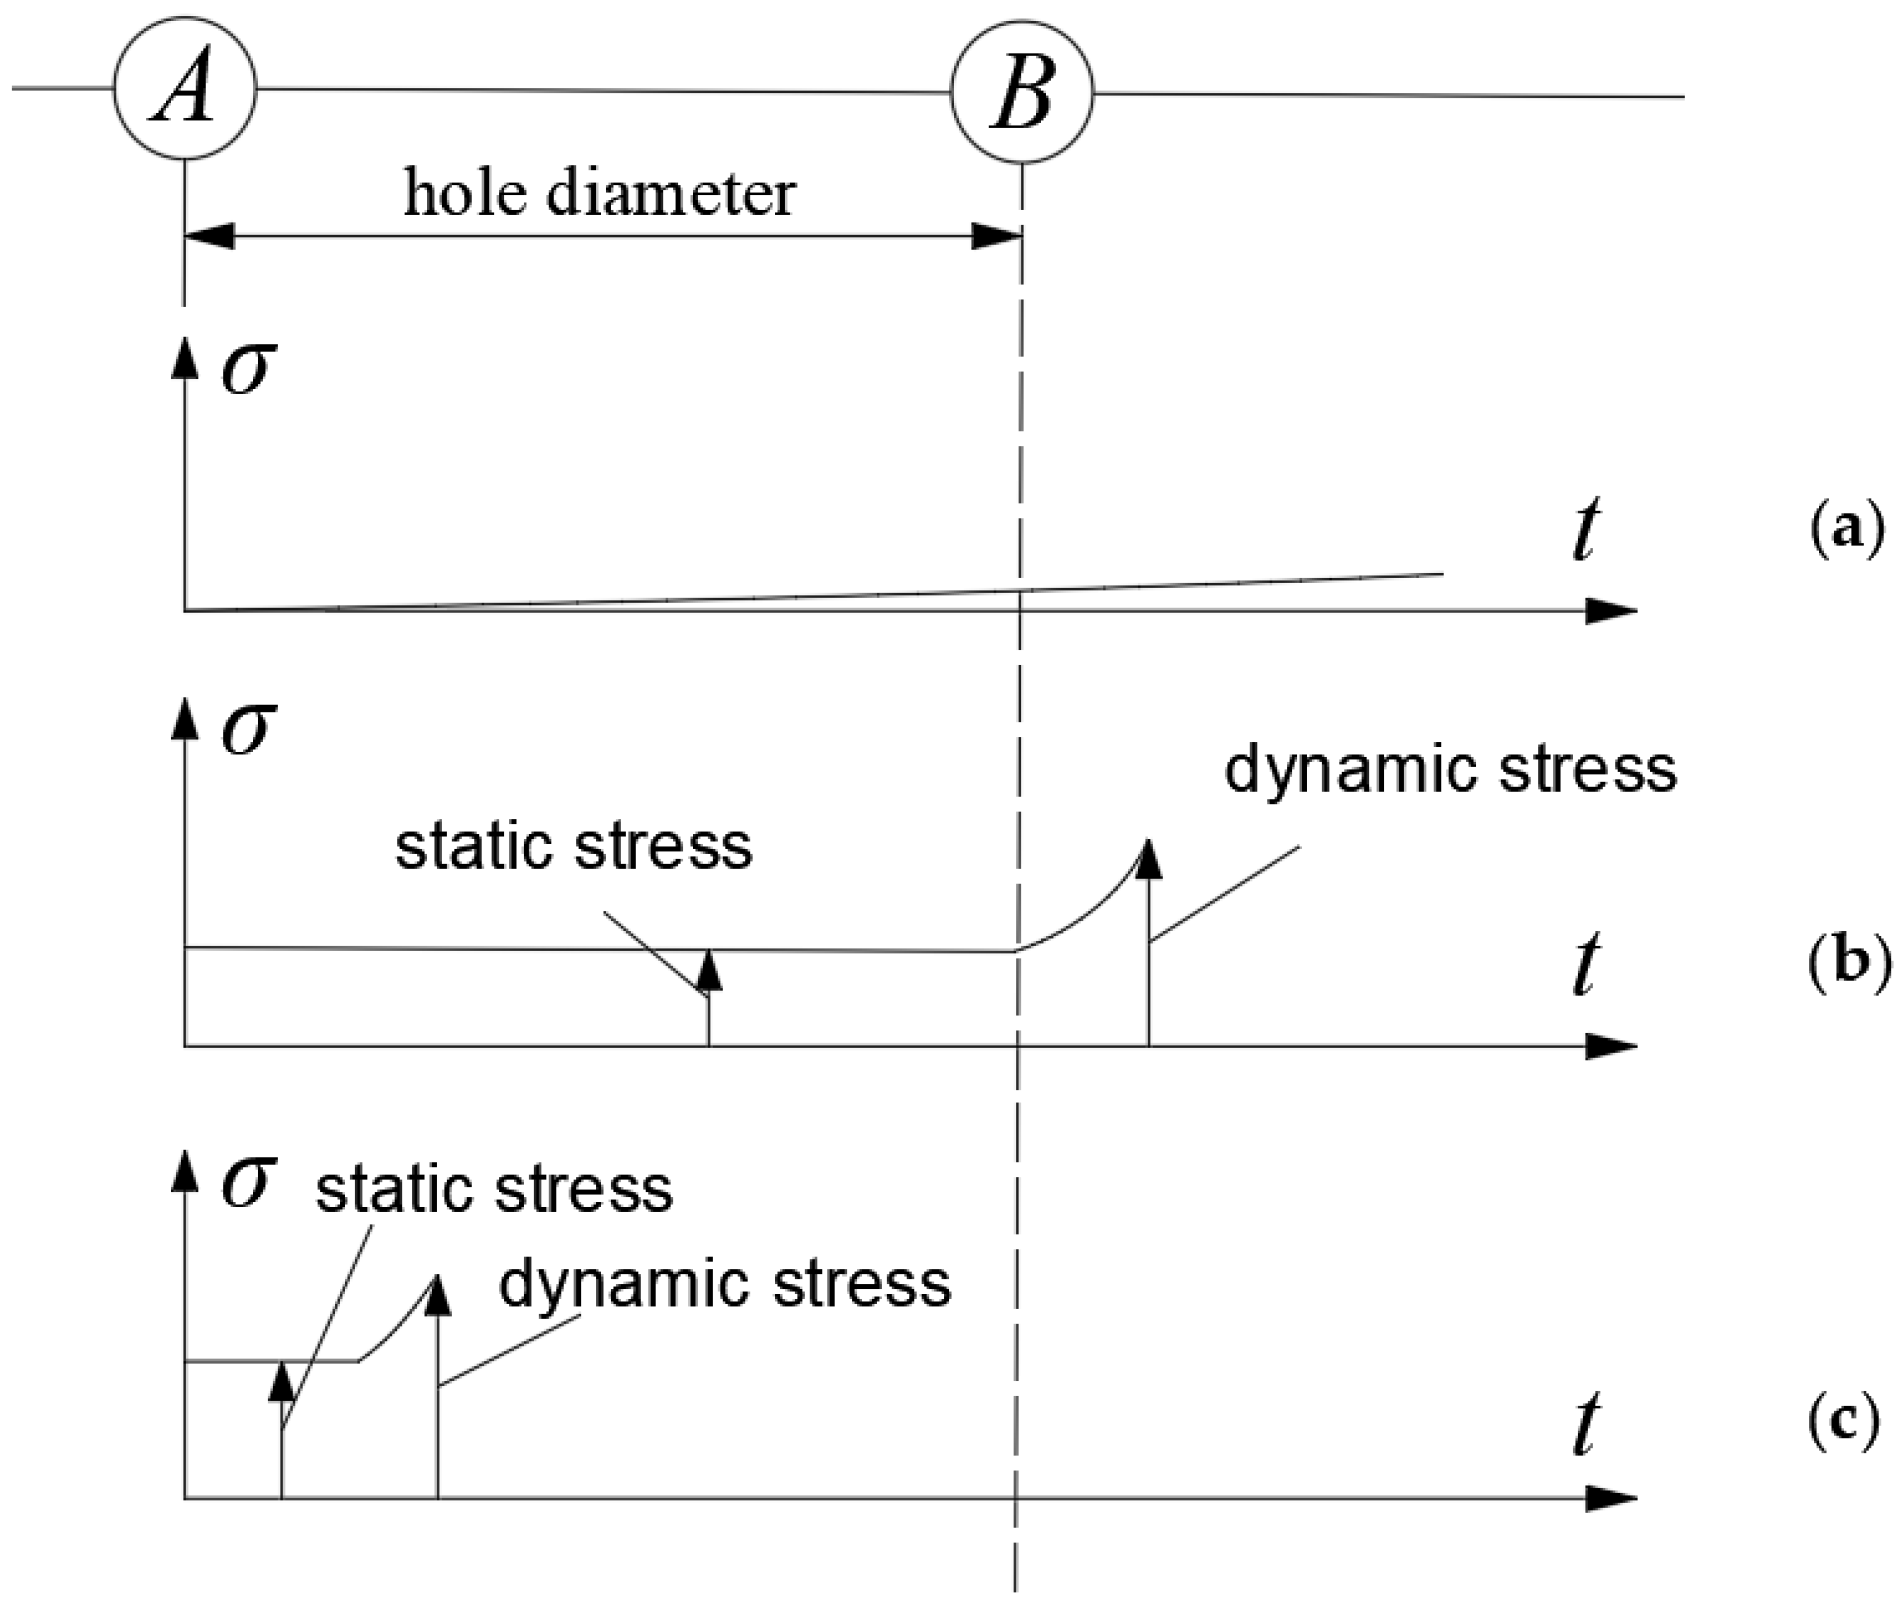
The pre-stress effect of the first detonated hole on the subsequent hole in pre-splitting blasting can be categorized into three typical scenarios based on the magnitude of the detonation time interval between two adjacent holes [26], as shown in Figure 2: (a) represents detonation with a long time interval, (b) represents detonation with a short time interval, and (c) represents simultaneous detonation.
Short-time interval detonation can effectively utilize the superposition effect of stress waves, enhancing the formation and propagation of cracks and thereby improving the effect of pre-splitting blasting. If the detonation time interval is too long, the stress fields of the two blast holes will no longer superimpose, resulting in independent detonations and a reduced overall blasting effect. The ideal pre-splitting blasting effect, where a through crack is formed along the line connecting the centers of two holes without leaving radial cracks on the half-wall hole traces, is only possible under the (b) detonation condition shown in Figure 2 (detonation with a short time interval).
During the simultaneous detonation of two blast holes, the stress waves between the holes interfere with each other, leading to random crack generation. Despite the superposition of stress waves, crack formation primarily propagates from the hole wall rather than from the center of stress superposition. This indicates that simultaneous detonation is not the optimal condition for achieving the penetration of cracks between blast holes. In the case of delayed detonation, the stress wave generated by the first detonated hole will affect the crack propagation of the subsequently detonated hole. Specifically, when the subsequent hole detonates, the longitudinal wave generated by the explosion of the first hole creates a favorable tensile stress field around it, promoting crack propagation. During delayed detonation, the speed of crack propagation increases, and with appropriate delay, cracks can more effectively penetrate between blast holes. The speed of crack propagation significantly increases after the interaction between the stress wave and the crack, indicating that the influence of the stress wave is crucial for crack propagation. To overcome the randomness of crack generation around the first detonated hole, a guiding hole can be drilled next to it, and an appropriate detonation time interval can be adopted. This can effectively control the generation and propagation of cracks, thereby improving the effect of pre-splitting blasting. During blasting, the empty holes near the charged hole act as stress concentrators, as shown in Figure 3, directing cracks towards the nearer empty holes. The perforations near the charged hole guide the cracks and inhibit their propagation in other directions. When uncoupled charging is used, the charged hole also exhibits the properties of an empty hole. Sequential pre-splitting blasting is initiated as the delay time increases, from the smallest to the largest. Thus, the subsequently detonated holes can be considered to act as empty guiding holes for the first detonated holes. Therefore, in practical applications, the key to optimizing the effect of pre-splitting blasting lies in the rational design of detonation time intervals and blast hole arrangement.

2.3. Judgment Standard of Rock Mass Damage Under Blasting Load

Engineering practice has demonstrated that numerous types of damage (such as joints, micro-cracks, etc.) are randomly distributed in rock masses. Under the action of blasting loads, new cracks are generated in the rock mass near the blasting zone. At the same time, due to the effect of stress waves, existing joints and cracks continue to propagate, nucleate, and coalesce, forming main cracks. According to Huygens’ principle, when sound waves reach a structural interface, they will undergo reflection, scattering, diffraction, and other effects. Therefore, these micro-cracks and macroscopic fractures extend the propagation path and reduce the sound wave velocity. Moreover, the reduction in sound velocity is closely related to the number and width of the cracks [27].
When pre-splitting blasting is used on the excavation contour line, according to the specifications and the requirements for the width of the pre-split cracks and the irregularity of the rock surface after excavation, an important criterion reflecting good blasting quality is the residual rate of the half-holes. For intact rock, this rate should be above 80%, for relatively intact and poorly intact rock, it should be no less than 50%, and for fragmented and highly fragmented rock, it should be no less than 20%. In reality, even if the specifications or production regulations are met, the blasting load still causes varying degrees of damage to the retained rock mass.
Reference [23] established a relationship between the rock mass damage variable, integrity coefficient, and sound wave velocity reduction rate based on the acoustic wave method. By integrating these, we can obtain the following:
D = 1 E E 0 = 1 v v 0 2 = 1 K = 1 ( 1 η ) 2
In the equation, E 0 and E represent the elastic moduli of the rock mass before and after blasting, respectively. v p 2 is the sound wave velocity in the rock mass before blasting, and v p 1 is the sound wave velocity after blasting.
According to the “Technical Specification for Construction of Rock Foundation Excavation for Hydraulic Structures” [28] issued in China, when the change rate η ≤ 10%, the rock mass is undamaged or slightly damaged; when 10% < η ≤ 15%, the rock mass is slightly damaged; and when η > 15%, the rock mass is damaged. Based on Equation (1), the threshold value for the influence of blasting on the surrounding rock can be calculated, i.e., when the change rate of the longitudinal wave velocity of the rock mass is 10%, the corresponding rock mass damage threshold is Dcr = 0.19.

3. Material Constitutive Parameters and Verification

3.1. RHT Constitutive Parameters of Saturated Skarn

The RHT constitutive model is the 272nd material model in LS-DYNA software and is defined by the keyword *MAT_RHT. This model employs three limit surfaces to describe the mechanical behavior of the material under load, namely the elastic stage, strain hardening stage, and damage softening stage. It can accurately describe the process of damage evolution in rock under explosive loads. The rock in this constitutive model is silicified carbonate rock, and its physical and mechanical parameters can be directly obtained from the geological exploration report provided by the open-pit mine. Based on the relevant literature [29] regarding the determination of RHT constitutive parameters, the final RHT model parameters for water-saturated albite determined in this paper are shown in Table 1.

3.2. Constitutive Material Parameters of Explosives

Due to the actual production conditions on site, the explosive used was No. 2 emulsified explosive. The high-energy explosive material model *MAT_HIGH_EXPLOSIVE was selected as the explosive material. The explosive material parameters [30] are shown in Table 2. The equation of state used for the model was *EOS_JWL, which can accurately describe the volume, pressure, and energy characteristics of explosion products during the explosion process. The JWL equation of state [31] is given by
P = A ( 1 ω R 1 V ) e R 1 V + B ( 1 ω R 2 V ) e R 2 V + ω E 0 V

3.3. Constitutive Parameters of Water and Air Materials

The air medium was described using the MAT_NULL model and the linear polynomial EOS_LINEAR_POLYNOMIAL in LS-DYNA software. Expression [32] is given by Equation (3). The parameters of the air materials were obtained from [32], and the specific parameters are listed in Table 3.
p = C 0 + C 1 μ + C 2 μ 2 + C 3 μ 3 + ( C 4 + C 5 μ + C 6 μ 2 ) E 0
The water medium was defined using the NULL material model and the EOS_GRUNEISEN equation of state in LS-DYNA software. This equation of state describes the relationship between the pressure, density, and initial internal energy of the water medium under compression. The expression for the equation of state [33] is given by Equation (4). The material parameters for the water medium [34] are listed in Table 4.
P = ρ 0 C 2 u 1 + 1 γ 0 2 u α 2 u 2 1 S 1 1 u S 2 u 2 u + 1 S 3 u 3 u + 1 2 2 + ( γ 0 + a u ) E

3.4. Material Parameter Verification

A series of blasting crater tests that used different blasting funnel depths were designed to verify the validity of the model parameters presented in this paper. The field test results were compared with the numerical simulation results to validate the reliability of the numerical simulations conducted in this study.
Based on the actual production conditions of the mining site and the provided test site conditions, five groups of blasting funnel tests were designed. The specific test parameters are shown in Table 5.
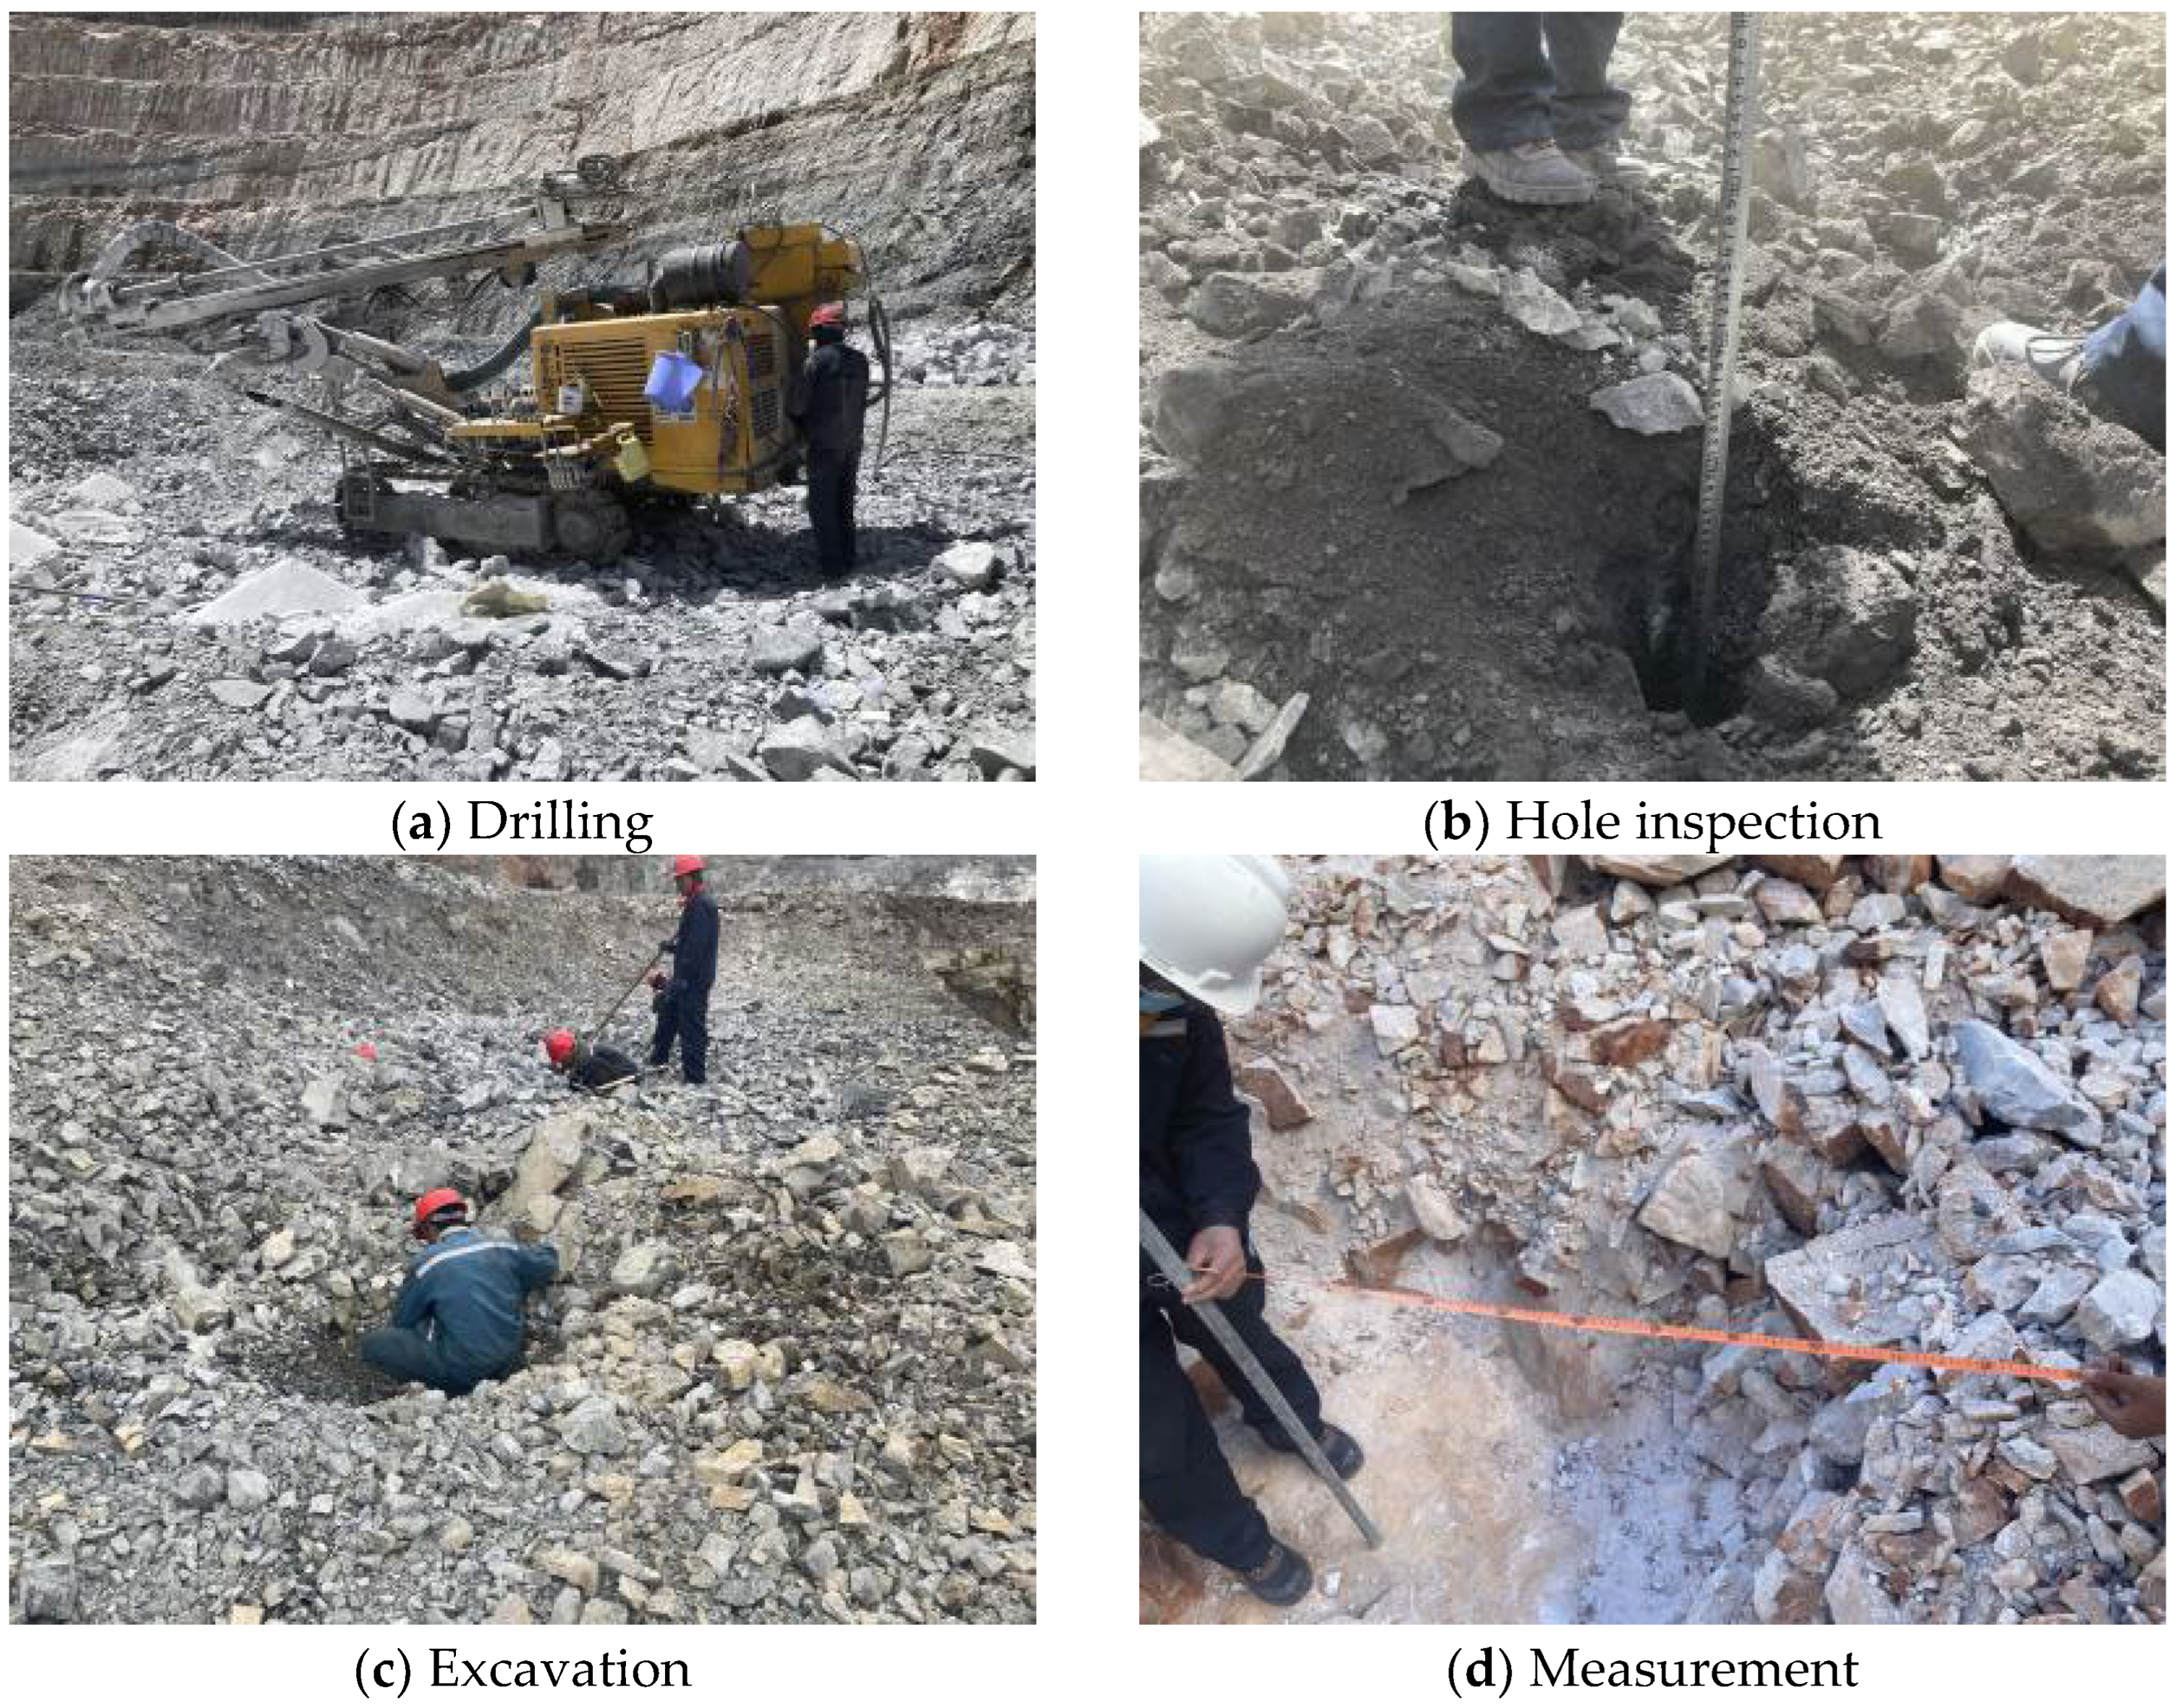
The processes of drilling, hole inspection, excavation, and measurement during the experiment are shown in Figure 4. The on-site measurement data of the blasting crater, obtained once the blasting crater experiment had been completed, are presented in Table 6.
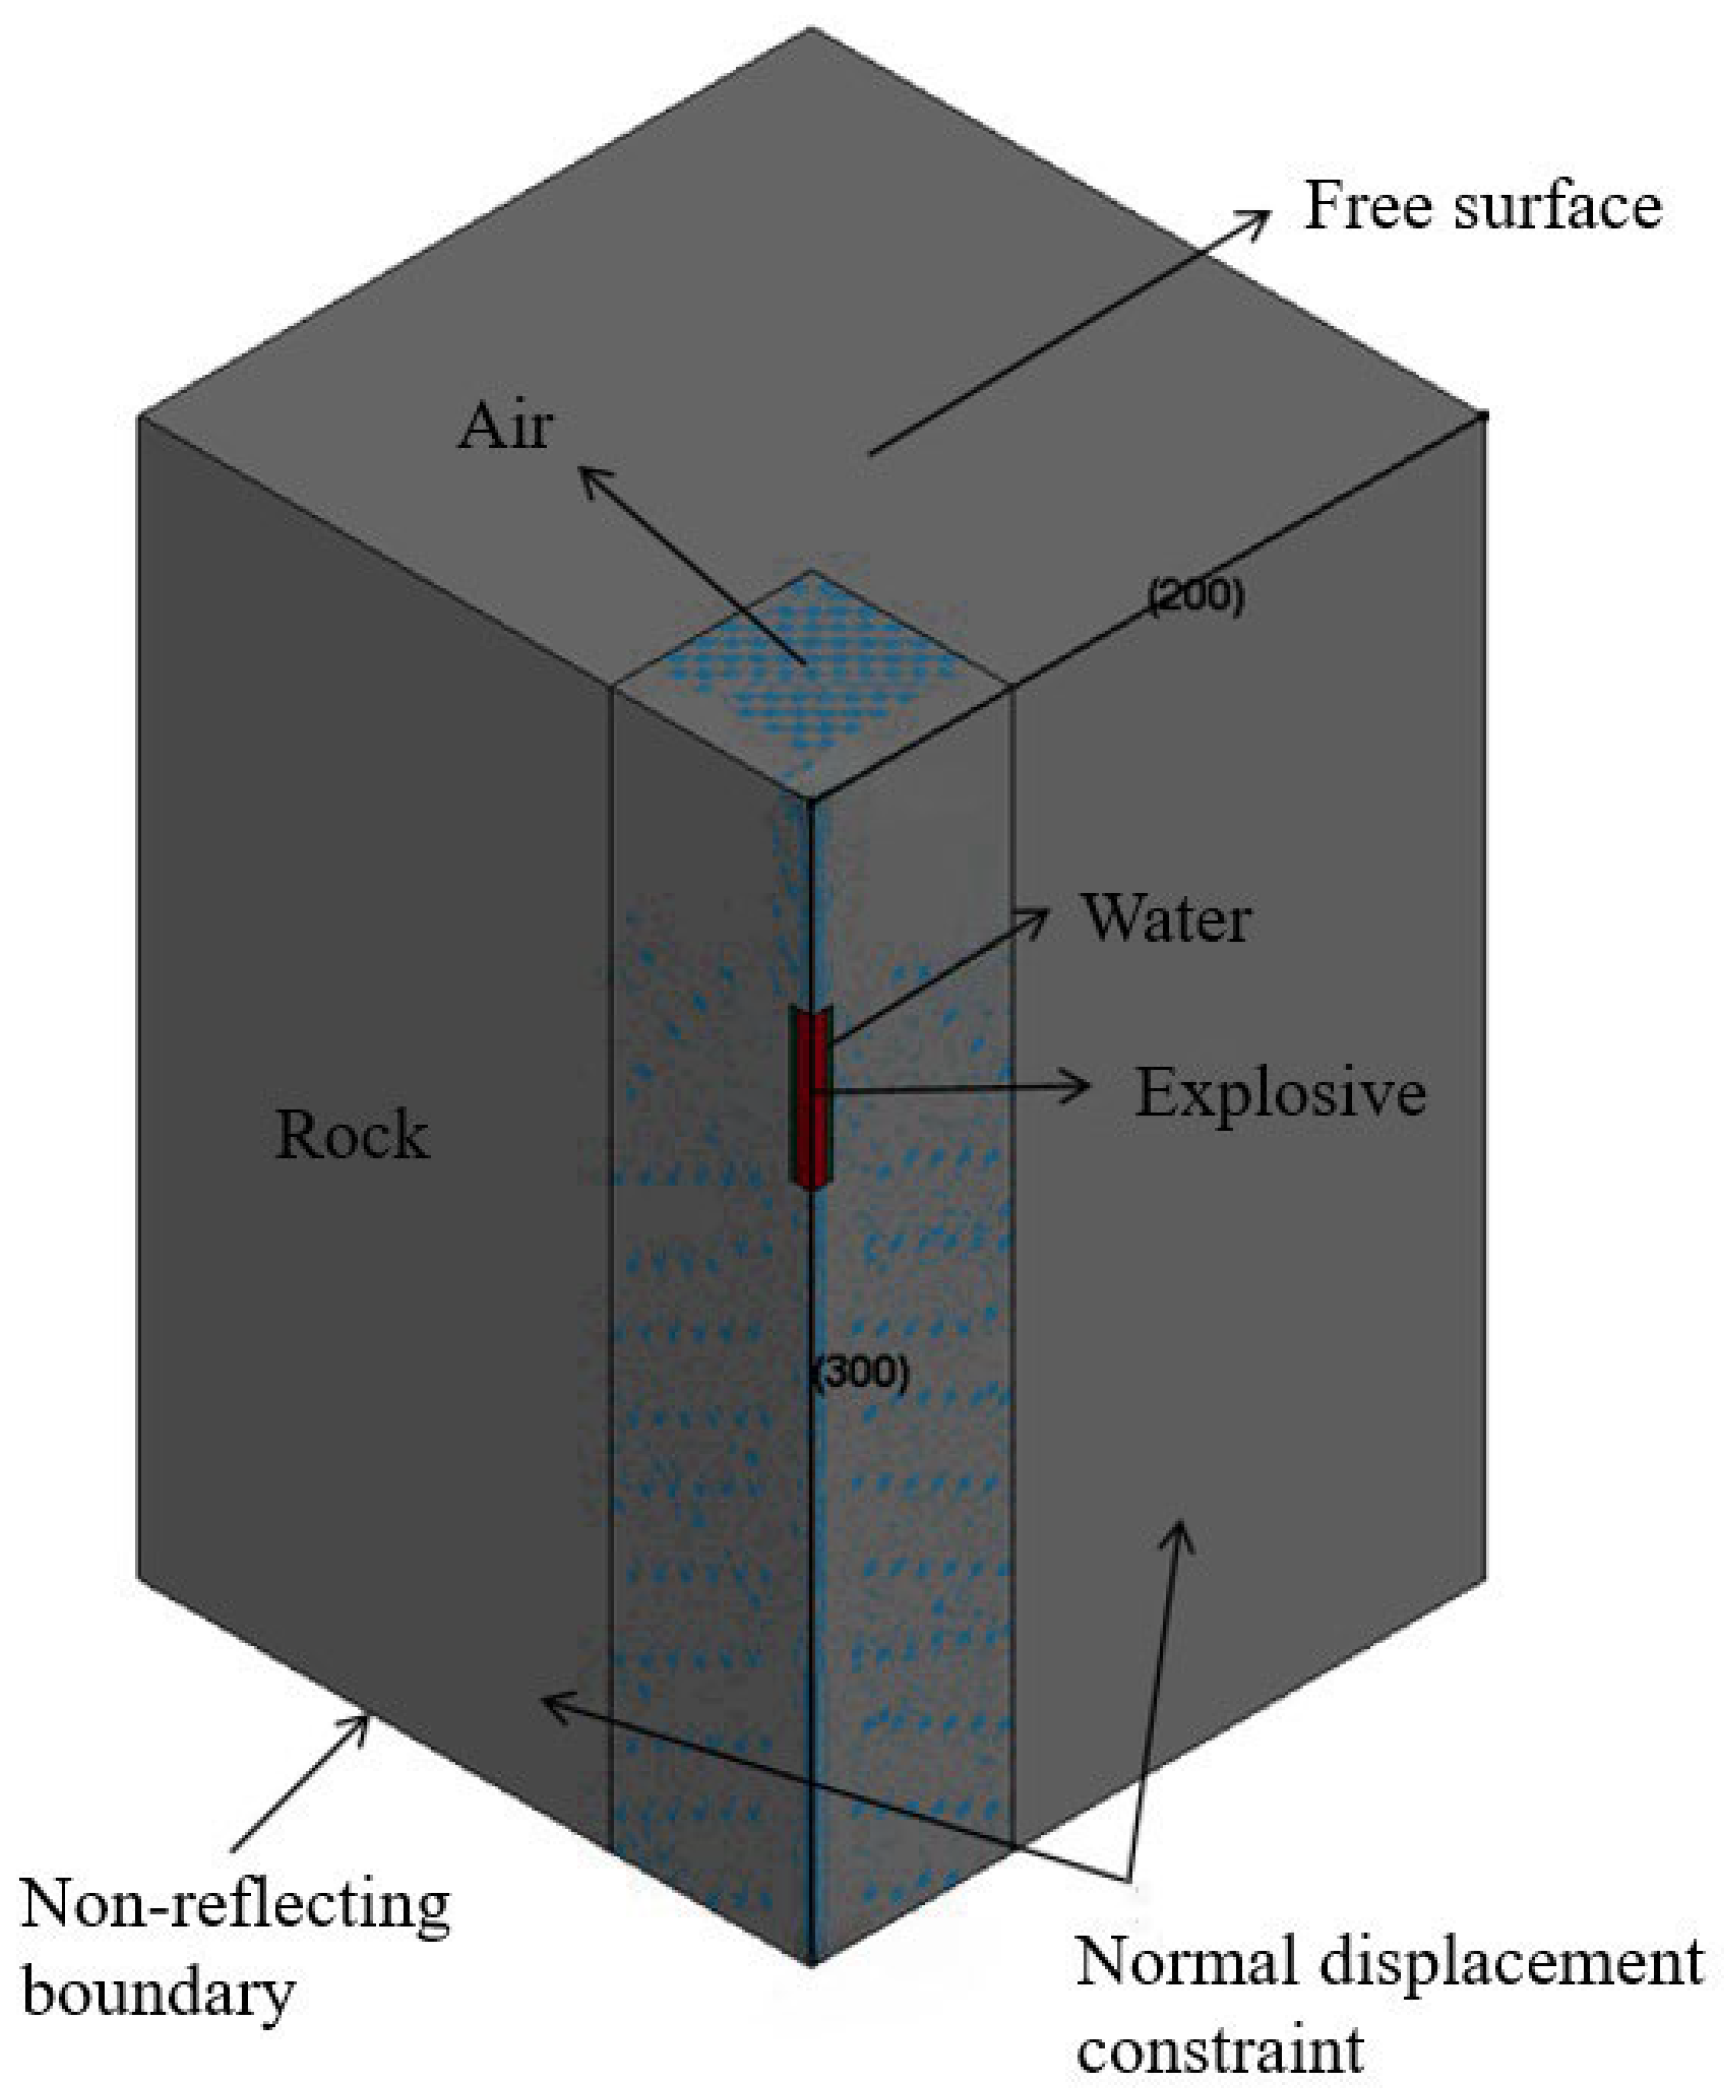
To save computational costs, a one-quarter numerical model was established based on the symmetry of the numerical simulation. The dimensions of the numerical simulation were 200 cm × 200 cm × 300 cm. Parameters such as the drill hole depth, hole diameter, and charge length in the numerical calculation were consistent with those in the on-site crater experiment. The specific numerical model is shown in Figure 5.
After the calculation is completed, the damage results of the numerical model are analyzed and measured. The area with a damage factor of 0–0.1 is defined as the elastic vibration zone, and the damage in this area is ignored. The area with a damage factor of 0.1–0.9 is the crack zone, and the area with a damage factor of 0.9–1.0 is the crushing zone. The specific numerical simulation results of the blasting funnel test are shown in Figure 6.
Once the numerical calculations had been completed, the data obtained from the blasting craters formed by explosives with five different burial depths were statistically analyzed and calculated. The numerical simulation results of the blasting crater experiments are presented in Table 7.
A comparative analysis of the numerical simulation test results and the field test data was performed. The comparison results are shown in Figure 7.
An analysis of Figure 6 shows that the numerical simulation results for the blasting crater exhibit the same patterns as those obtained in the field tests. There is good consistency between the two. Both the radius and volume of the blasting crater decrease as the burial depth of the explosive increases in both the numerical simulation and field tests. The depth of the blasting crater increases as the burial depth of the explosive increases. All data obtained in the field tests of the blasting crater are lower than those obtained in the numerical simulation. However, the errors are relatively small. Compared to the field tests, the average error in crater depth in the numerical simulation is 23%, the average error in crater radius is 18%, and the average error in crater volume is 21%. The reasons for this are as follows: On the one hand, manual excavation of the funnel has certain limitations. It is not possible to remove all the rubble from inside the blasting crater, and some rubble may remain. Additionally, manual excavation cannot reach the edge of the fracture zone formed by the blasting crater. This results in the data being lower than those obtained in the numerical simulation. On the other hand, the results presented by the numerical simulation are relatively ideal. In field tests, the rock conditions may change to some extent. For example, changes in fractures, joints, and local lithology may occur. This leads to certain differences between the field tests and the numerical simulation. In summary, the comparative analysis between the numerical simulation tests and the field tests of the blasting crater yielded good results.

4. Numerical Simulation Analysis

4.1. Establishment of Numerical Simulation Model

In this study, we constructed a three-hole three-dimensional numerical simulation model with consistent model dimensions, material constitutive properties, charging methods, charge lengths, stemming lengths, boundary conditions, and mesh precision. By varying the detonation time of the explosives within the holes, a numerical simulation of pre-splitting blasting was conducted by using different inter-hole delay times.
The three-hole three-dimensional numerical simulation model had dimensions of 640 cm × 400 cm × 500 cm. The drill bit used in the mining site had a diameter of 120 mm; thus, the hole diameter was determined to be 120 mm. Based on the research conclusions and recommendations of other researchers [35] regarding pre-splitting blasting with a radial decoupling charging factor of 2 to 4 and a hole spacing of 8 to 12 times the hole diameter, combined with engineering practices and the researchers’ experience of mining site, a radial decoupling charging factor of 3.75 was ultimately determined (with the decoupling zone filled with water medium), and the hole spacing was set at 120 cm. The charge length was set at 4 m, and the stemming length was set at 1 m; detonation occurs at the bottom of the hole. The explosive used was No. 2 rock emulsion explosive, and the stemming material was the same as the rock material. The specific blasting parameters for the numerical simulation of sequential pre-splitting blasting are shown in Table 8.
To closely align with real-world conditions, non-reflecting boundary conditions were set around the perimeter and bottom of the model to simulate an infinite rock domain, while the top surface of the model was left without specific boundary conditions, defaulting to a free surface. The numerical simulation algorithm employed a fluid–structure interaction (FSI) approach, where the rock, as a structural component, was modeled using the Lagrangian algorithm, and water, air, and explosives, as fluids, were modeled using the Arbitrary Lagrangian–Eulerian (ALE) algorithm. Additionally, a certain flow space was designated as the coupling domain.
In a study on pre-splitting blasting, Wang et al. [36] found that sequential hole detonation with a delay time of 12 ms results in a higher half-hole rate for the pre-split holes. Hu [37] conducted model tests using high-speed photography and concluded that the complete formation of pre-split cracks takes approximately 18 ms. Lou et al. [38] proposed a theoretical model for selecting the delay time in millisecond blasting and verified it through field tests, suggesting an optimal inter-hole delay time of 24 ms.
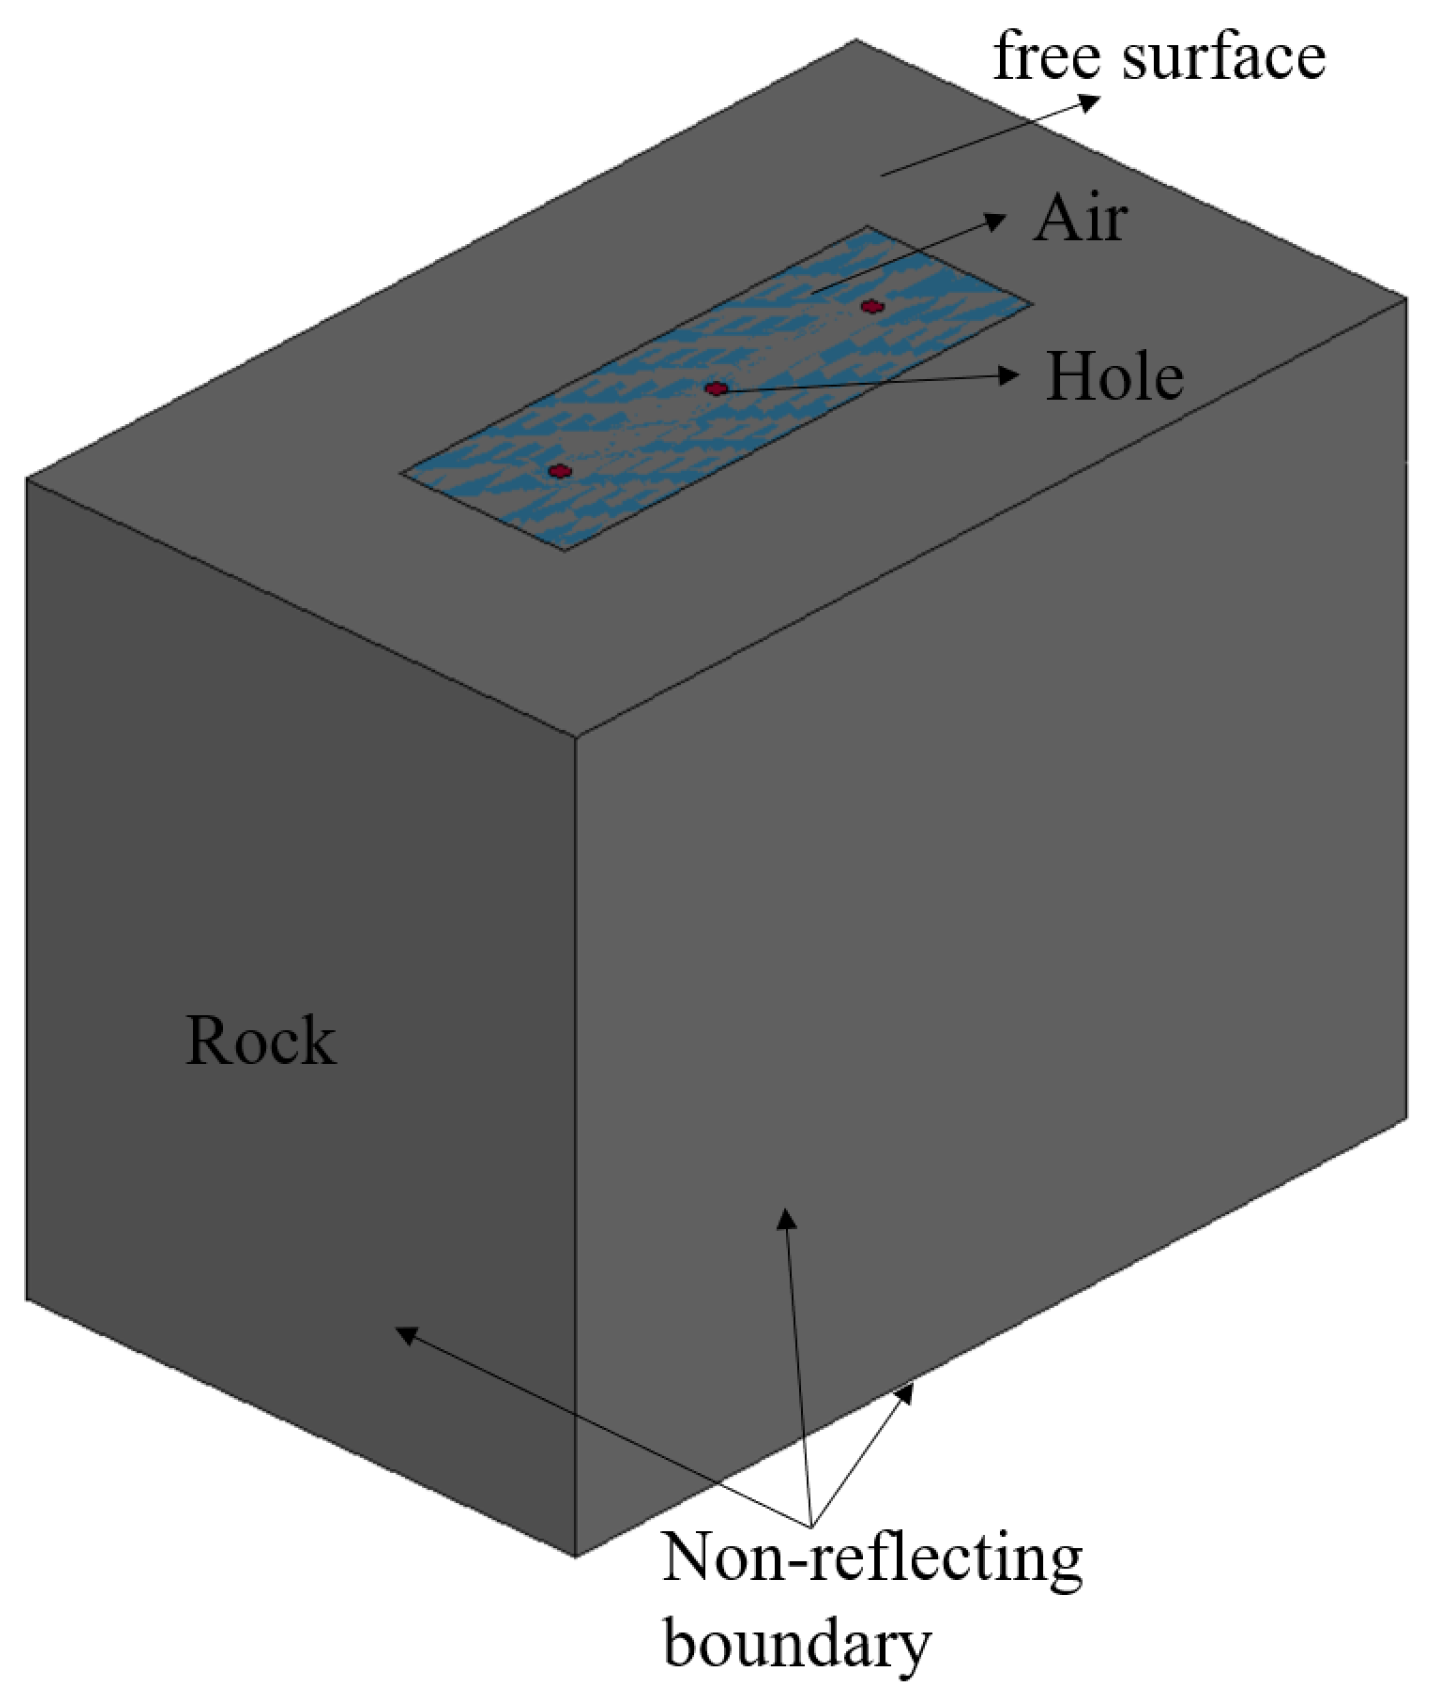
Therefore, four three-hole three-dimensional simulation models were constructed. The detonation of the explosives was defined using the keyword *INITIAL_DETONATION in LS-DYNA’s detonation point definition function. The delay detonation times for the blast holes were set at 0 ms (simultaneous detonation), 12 ms, 18 ms, and 24 ms, respectively. The specific numerical simulation models are shown in Figure 8.

4.2. Analysis of Rock Damage Law

Blasting operations for rock excavation, while enhancing the efficiency and quality of construction, inevitably cause some degree of damage to the retained rock mass due to explosive detonation. Pre-splitting blasting technology can significantly reduce the damage caused to the retained rock mass during detonation in the main blasting zone, yet the damage caused by pre-splitting blasting itself cannot be overlooked. The damage to the rock mass observed on its surface does not reveal the specific depth of the damage, and thus it is often neglected. However, the damaged rock mass, when subjected to excavation disturbances from other areas, vibrations from passing trucks, rainfall, and other factors, can become increasingly unstable. This instability may lead to phenomena such as collapses and landslides, which can affect the progress of construction and pose threats to the safety of construction personnel.
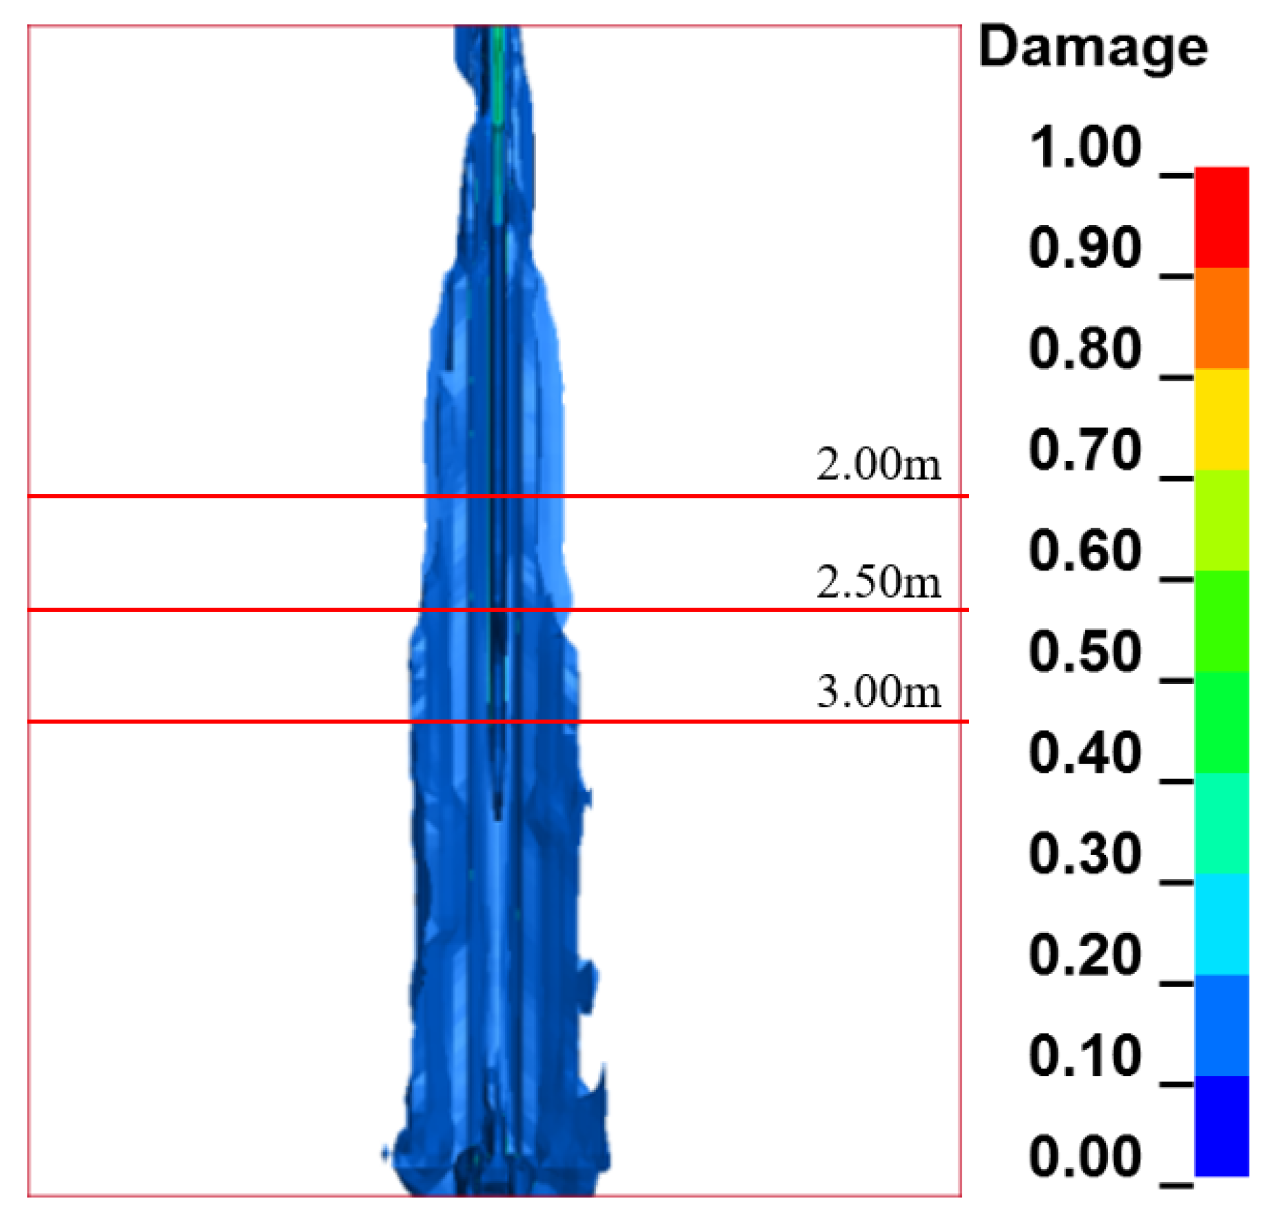
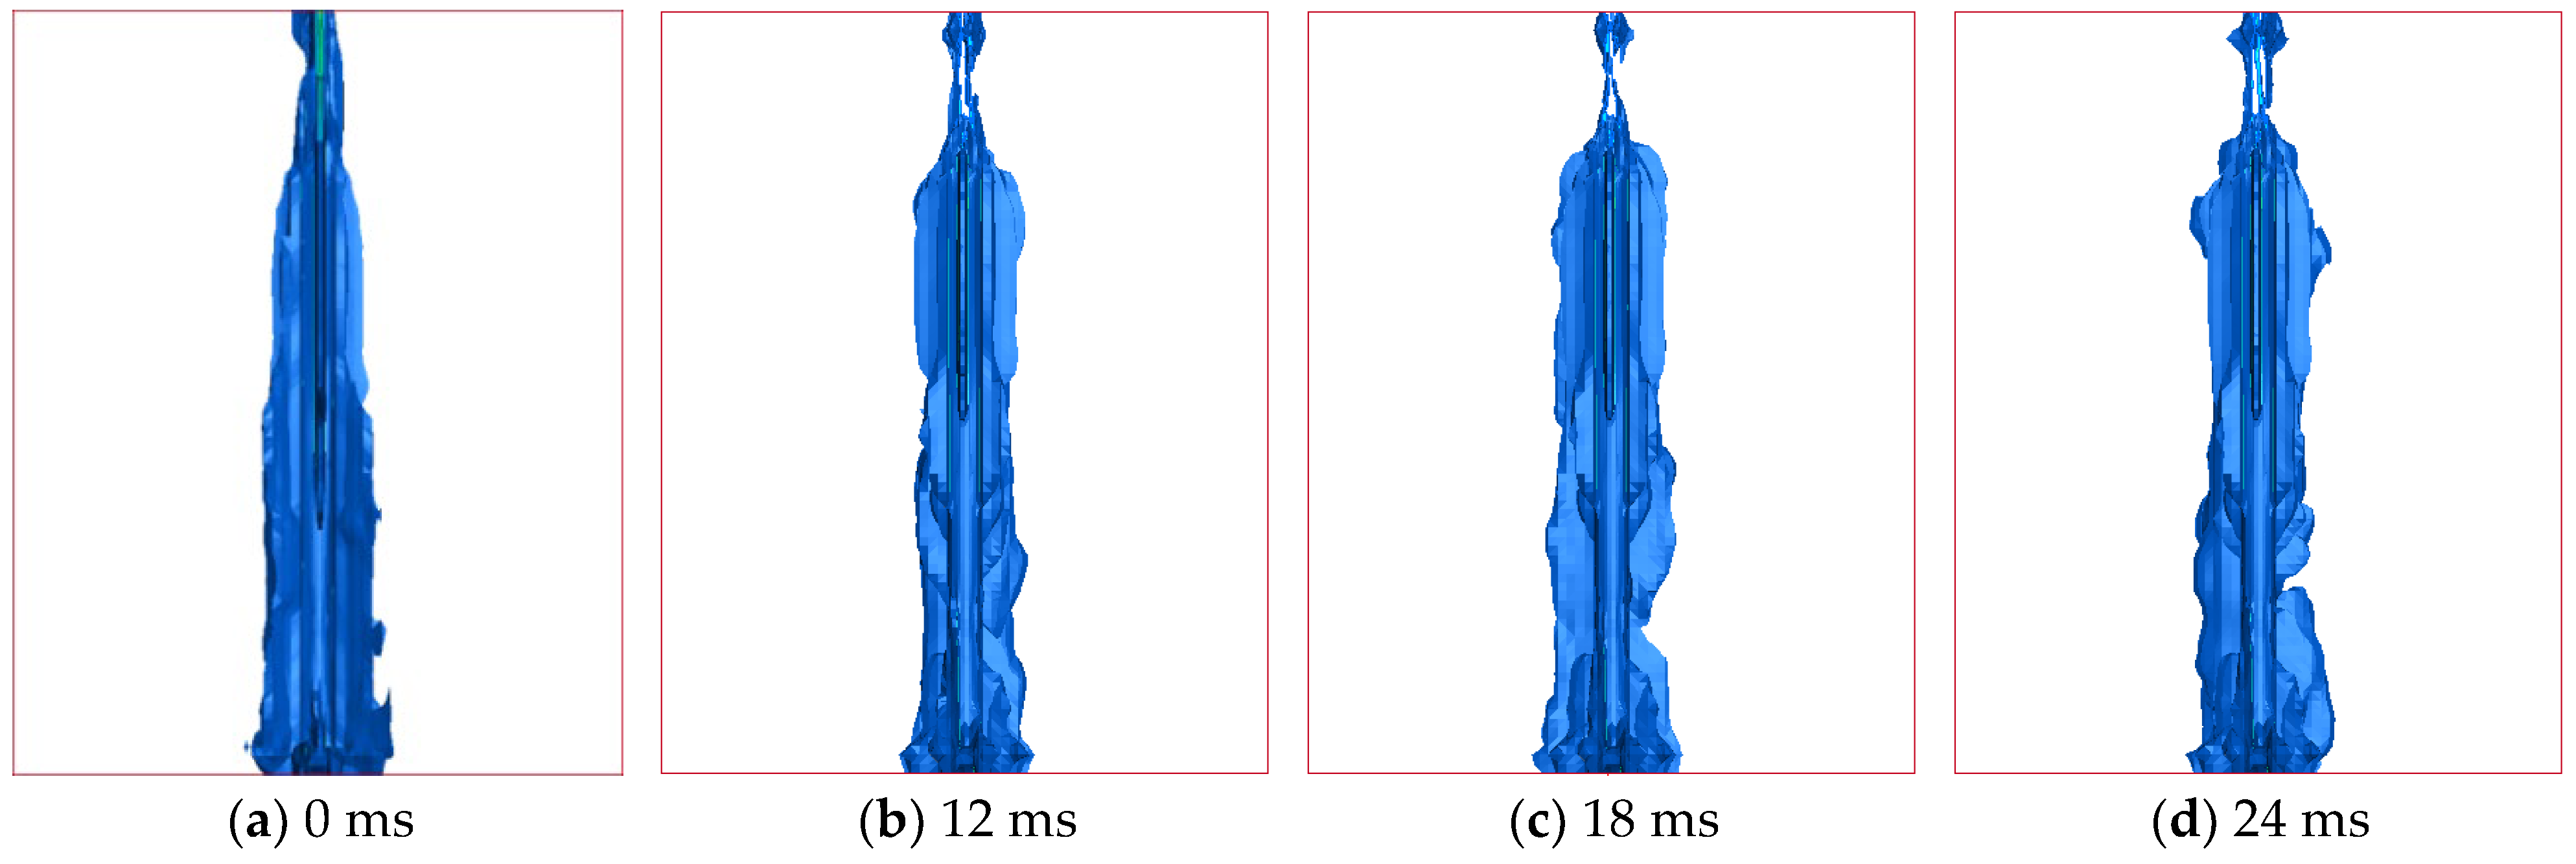
To investigate the damage depth under various conditions in this study, cross-sectional views of the damaged areas are taken, and the depth of the damaged regions is measured. Measurements are conducted at three vertical depths: 2 m, 2.5 m, and 3 m. Multiple measurements are performed, with three data points collected for each depth (at the same measurement locations across all models). Ultimately, the average of the nine data points is taken, and half of this average is used for comparison. The process of measuring the damage depth is illustrated in Figure 9. Side views of the damage cloud diagrams constructed for the four models are shown in Figure 10, and a summary of the damage depth measurement data is presented in Table 9.
When measuring the damage caused to the rock mass after blasting and only varying the inter-hole delay time, it is found that, within the same region, the depth of the damage caused to the rock mass is greatest when the inter-hole delay time is 0 ms, and smallest when the inter-hole delay time is 18 ms; this is shown in Table 9. This indicates that the rock damage is not necessarily reduced with longer delay times. The reason for this is that simultaneous detonation during pre-splitting blasting results in the strongest superposition of explosive stresses. Sequential hole pre-splitting blasting can effectively reduce the superposition of explosive stresses, thereby decreasing the intensity of the stress. However, the free-face effect of the free surfaces created by the previously detonated holes on the subsequently detonated holes cannot be ignored. The fragmented rock area created by the first detonated hole essentially provides a new free surface for the subsequently detonated holes, which enhances the blasting effect after the detonation of the latter. Therefore, when using sequential hole pre-splitting blasting technology, it is particularly important to select an appropriate inter-hole delay time.
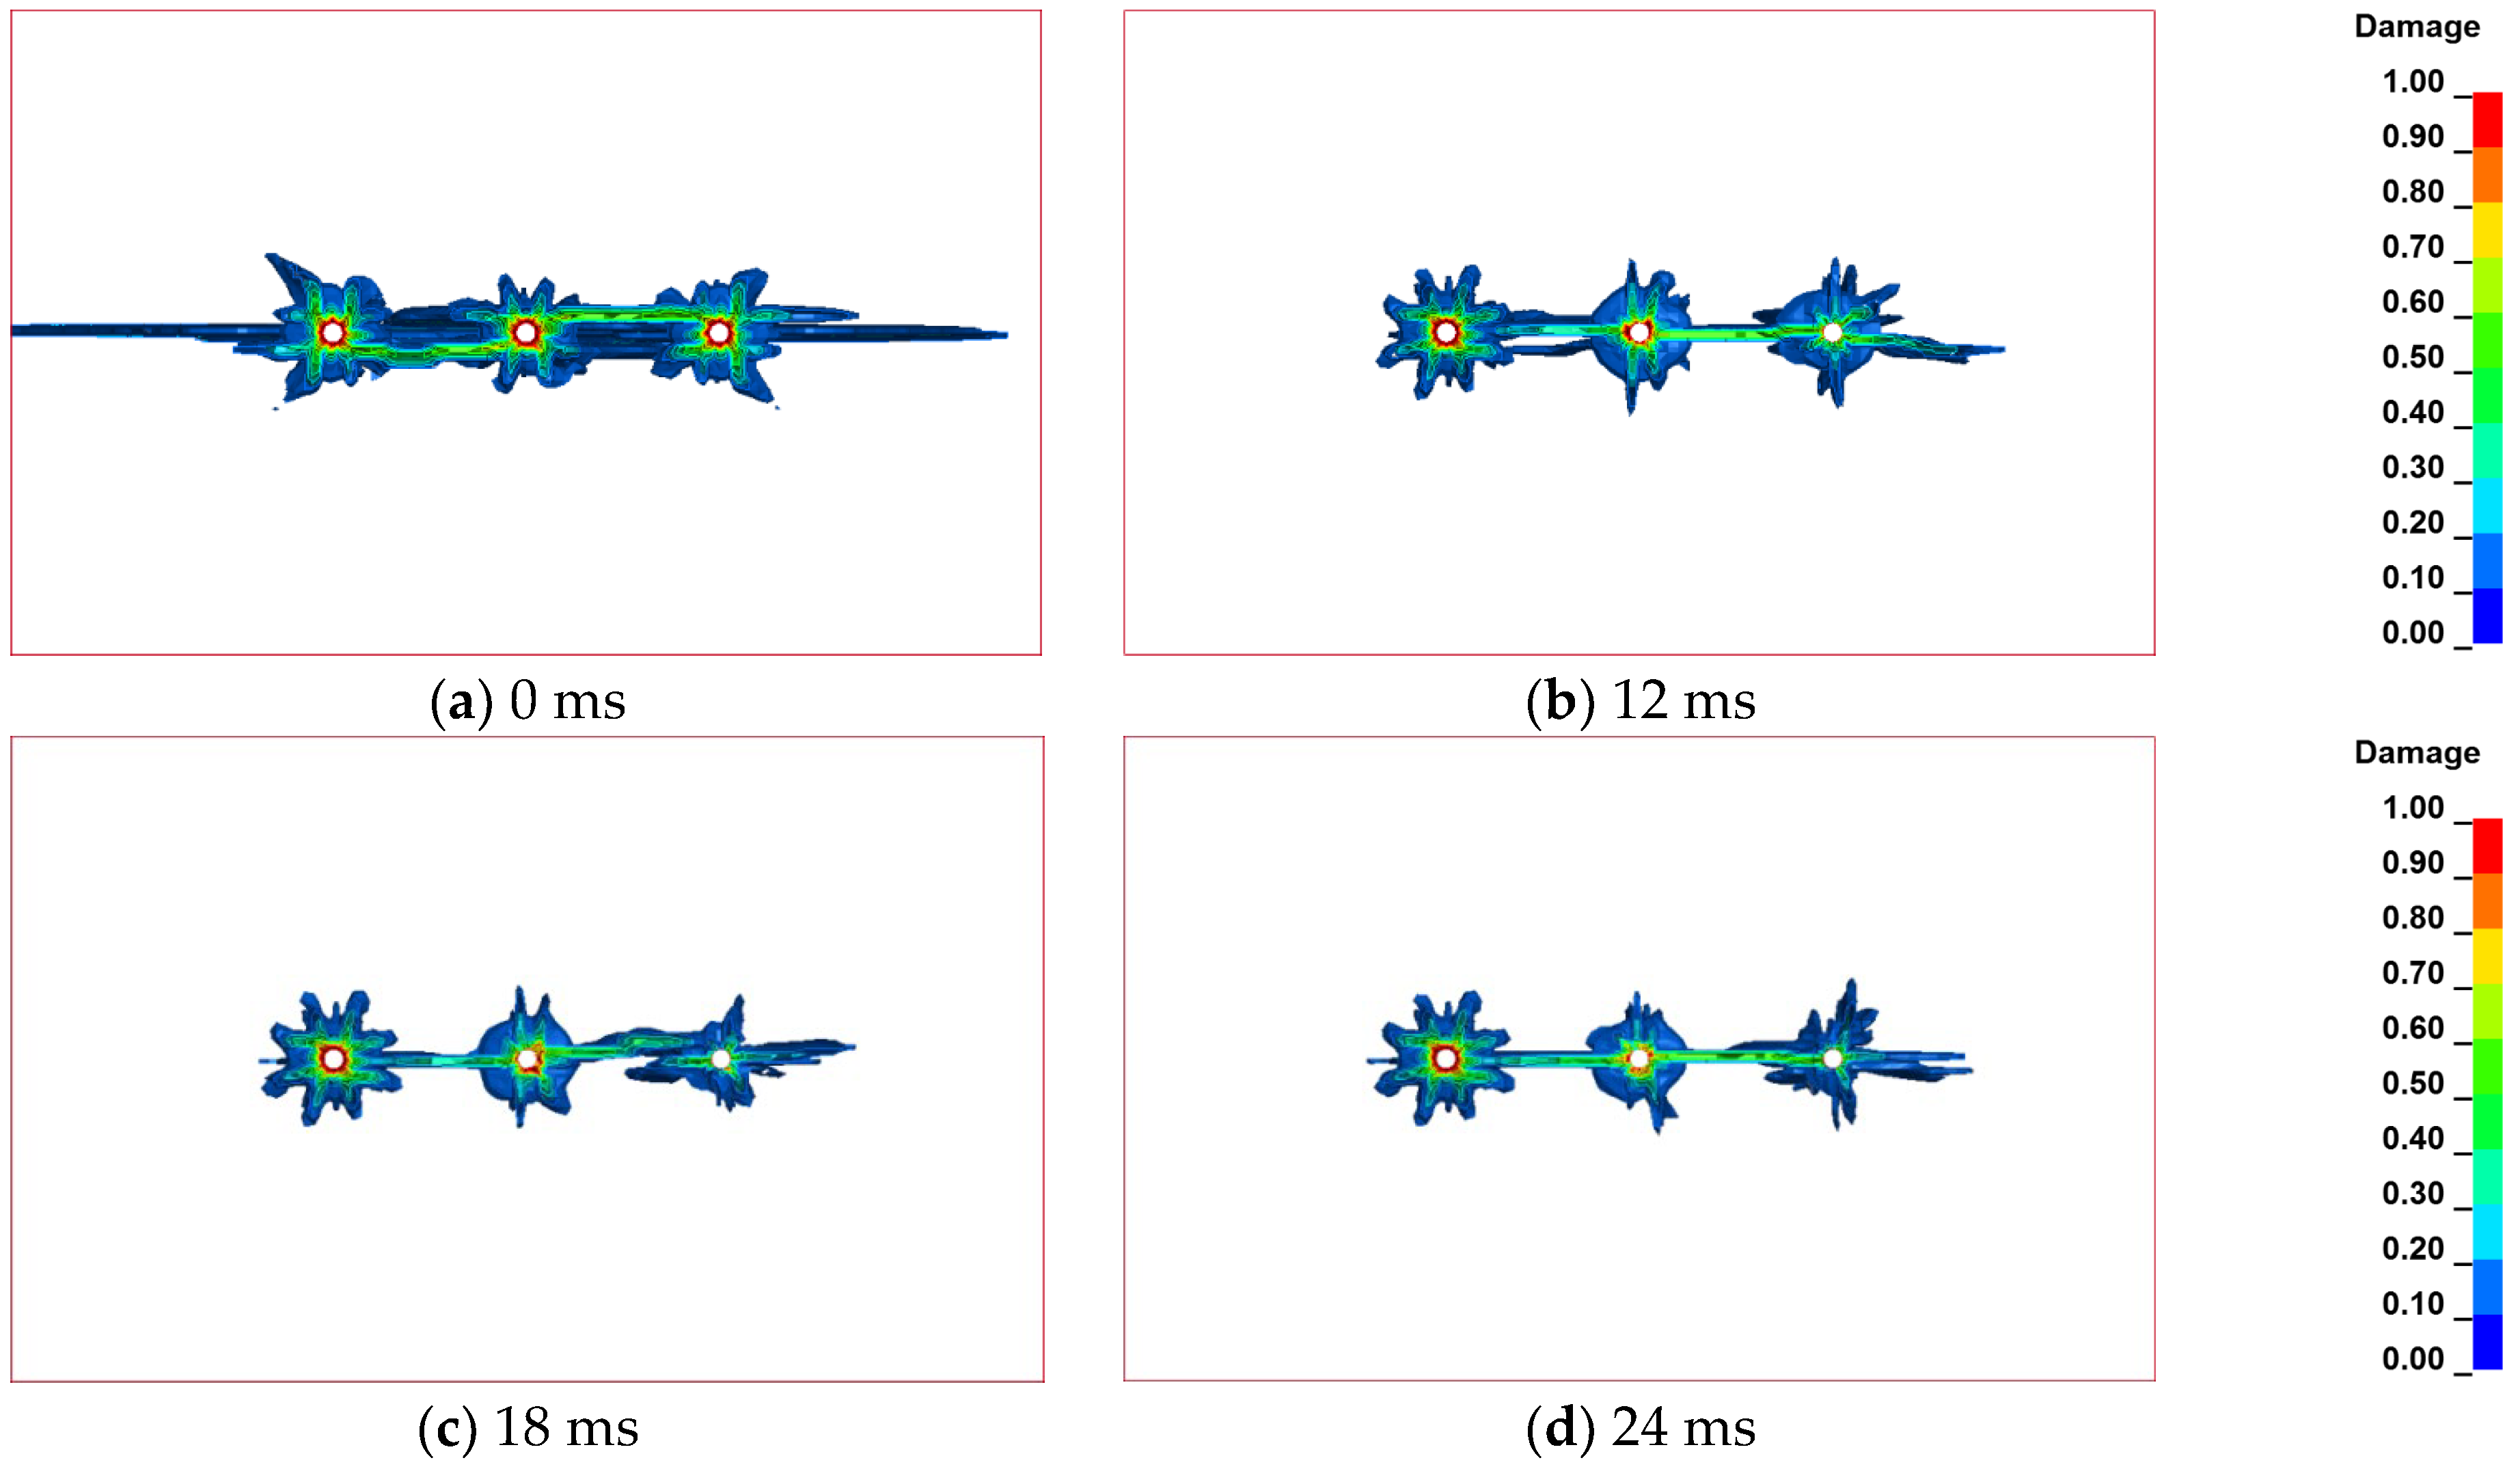
From Figure 11a, it can be seen that in the simultaneous detonation method, the explosives in the blast holes detonate at the same time. The size and morphology of the damage caused to the rock mass around the three blast holes are roughly the same, exhibiting a certain symmetry in the overall damage. From Figure 11b–d, it is evident that in the sequential detonation method, the explosives in the blast holes detonate separately at the set delay times. Except for the first detonated hole, where the damage does not change significantly compared to Figure 11a, the subsequently detonated holes exhibit significant changes in the size and morphology of the damage caused to the rock mass around them due to the influence of the previously detonated holes. Moreover, the damage caused to the rock mass around the subsequently detonated holes is smaller than that around the first detonated hole. The similarities among Figure 11a–d are due to the failure characteristics of the rock mass around the blast holes in simultaneous detonation pre-splitting blasting being similar to those in sequential hole pre-splitting blasting. The differences are that, compared to the two detonation methods, simultaneous detonation pre-splitting blasting results in a larger damage range and a wider damage zone between the holes; meanwhile, sequential hole pre-splitting blasting produces a smaller damage range and a narrower damage zone between the holes. In sequential hole pre-splitting blasting, because the subsequently detonated holes can achieve connectivity with the previously detonated holes, the damage range tends to decrease. The depth and extent of blasting damage caused to the retained rock mass are smaller, which ensures the stability of the retained rock mass. At the same time, it can be seen that the choice of delay time has a relatively small impact on the damage caused to the rock mass around the blast holes. In order to ensure complete connectivity between the holes, we should strive to minimize the damage range, thereby reducing the impact on the stability of the retained rock mass.

4.3. Effective Stress Analysis of Specific Element

In the numerical simulation analysis, the stress experienced by a particular element in the numerical model is primarily described by analyzing its von Mises equivalent stress, which is used to analyze the failure characteristics of rock blasting. When the peak effective stress experienced by the selected element exceeds the dynamic tensile strength of the rock, the rock element is considered damaged [39].
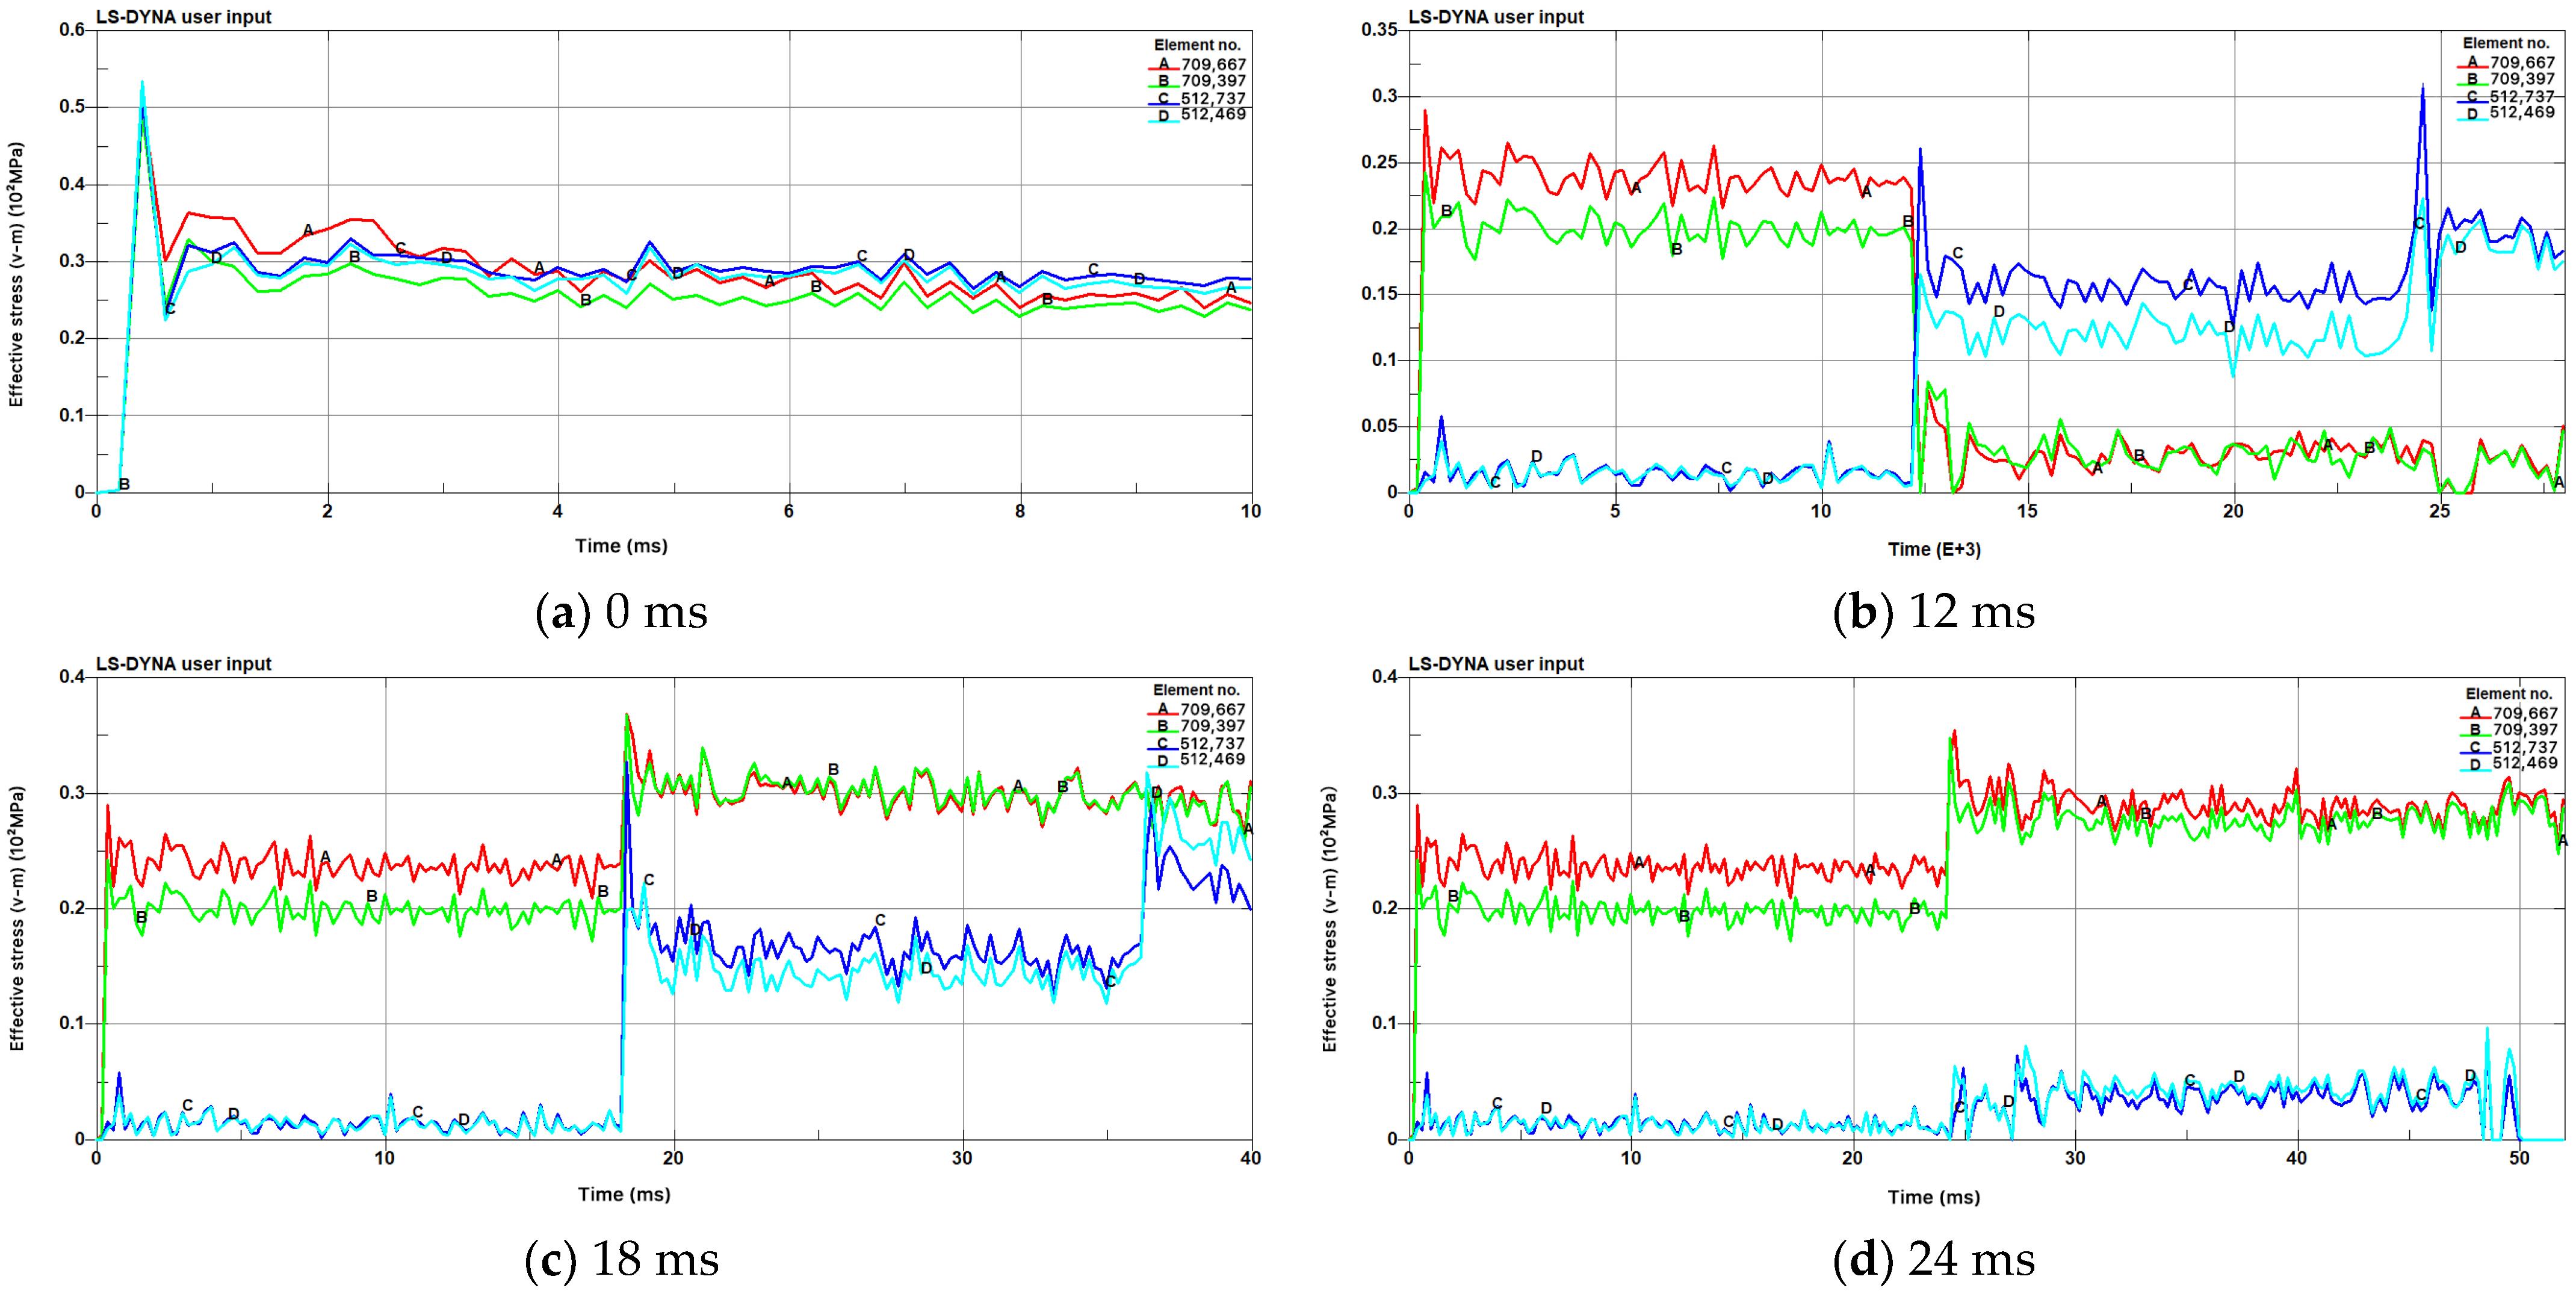
Based on the numerical simulation model presented in the previous section, the effective stresses of the selected characteristic elements were output and analyzed using the LS-PREPOST 4.10 post-processing software to investigate the influence of different inter-hole delay times during pre-splitting blasting on stress propagation. The model was cut in half along the Z-axis, and four characteristic elements that were symmetrically distributed along the centerline connecting the blast holes were selected. During sequential detonation, the rightmost hole (Hole 1) was the first to detonate. The selected characteristic elements were A (H709667), B (H709399), C (H512737), and D (H512469), which were chosen sequentially from right to left. The locations of the selected characteristic elements are shown in Figure 12, and the time–history curves of the effective stresses for these elements are presented in Figure 13.
As shown in Figure 13, under the simultaneous detonation method, since the four selected characteristic elements are located near the midpoint of the line connecting the blast holes and are symmetrically distributed, the detonation wave propagates outward from the center of the explosive package after detonation, acting on the rock wall near the blast holes and forming an initial stress wave. The time taken for the explosion stress wave to reach these four characteristic elements is almost the same, resulting in similar time–history curves for the effective stress of the four selected elements. After the explosive detonates, the explosion shock wave propagates rapidly, and stress begins to appear in elements A, B, C, and D at around 0.2 ms. The effective stress quickly reaches a peak at around 0.4 ms, with peak values of approximately 50 MPa for all four elements. This peak value is less than the dynamic compressive strength of the rock but greater than its dynamic tensile strength, indicating that the rock elements are damaged under tensile stress. Subsequently, the effective stress decreases and levels off.
As shown in Figure 13b, under the sequential detonation method, the time–history curves of the effective stress for the four selected characteristic elements exhibit a “step-like” pattern, with similar curves for adjacent elements. After the detonation of the first hole (rightmost), elements A and B, being closer to the explosion source compared to elements C and D, reach their first peak effective stress at around 0.4 ms, while elements C and D reach their first peak at around 0.9 ms. Due to their greater distance from the explosion source at this time, the change in the effective stress for elements C and D is smaller. As the explosion stress wave propagates, its stress intensity decreases as the distance increases. Therefore, the peak effective stress of the selected elements is inversely proportional to their distance from the explosion source, with larger peaks closer to the source and smaller peaks farther away. The peak effective stresses are as follows: element A (29 MPa) > element B (24.3 MPa) > element C (5.91 MPa) > element D (3.94 MPa). At this point, the peak effective stresses of elements A and B exceed the dynamic tensile strength of the rock, causing damage to these elements; meanwhile, elements C and D remain undamaged as their peak stresses are below the dynamic tensile strength. Subsequently, the effective stress decreases and levels off.
At 12 ms, the middle blast hole detonates. The distances from the selected four elements to the explosion source are almost the same, and the explosion stress wave reaches these elements at almost the same time. Therefore, the time–history curves of the effective stress for all four elements change significantly at almost the same moment (around 12.2 ms) and reach a second peak at around 12.4 ms. The peak effective stresses are as follows: element C (26.2 MPa) > element D (16.6 MPa) > element B (9.45 MPa) > element A (7.79 MPa). At this point, the peak effective stresses of elements C and D exceed the dynamic tensile strength of the rock, causing damage to these elements. Subsequently, the effective stress decreases and levels off.
At 24 ms, the leftmost blast hole detonates. Since elements C and D are now closer to the explosion source, the stress intensity of the explosion stress wave reaching them is greater, resulting in significant changes in their effective stress, with a third peak appearing at around 24.6 ms. Elements A and B, being farther from the explosion source at this time, experience smaller changes in the effective stress, with less pronounced peaks.
In pre-splitting blasting with sequential detonation, even when the inter-hole delay times are varied, the time–history curves of the effective stress for the selected characteristic elements exhibit similar overall patterns, with differences primarily being present in the magnitude of the stress peaks. To avoid repetition, only models with delay times of 0 ms and 12 ms are analyzed in detail, while models with delay times of 18 ms and 24 ms are presented in figure form without further elaboration. The specific data regarding the peak effective stresses of the selected characteristic elements for the four delay times are summarized in Table 10.
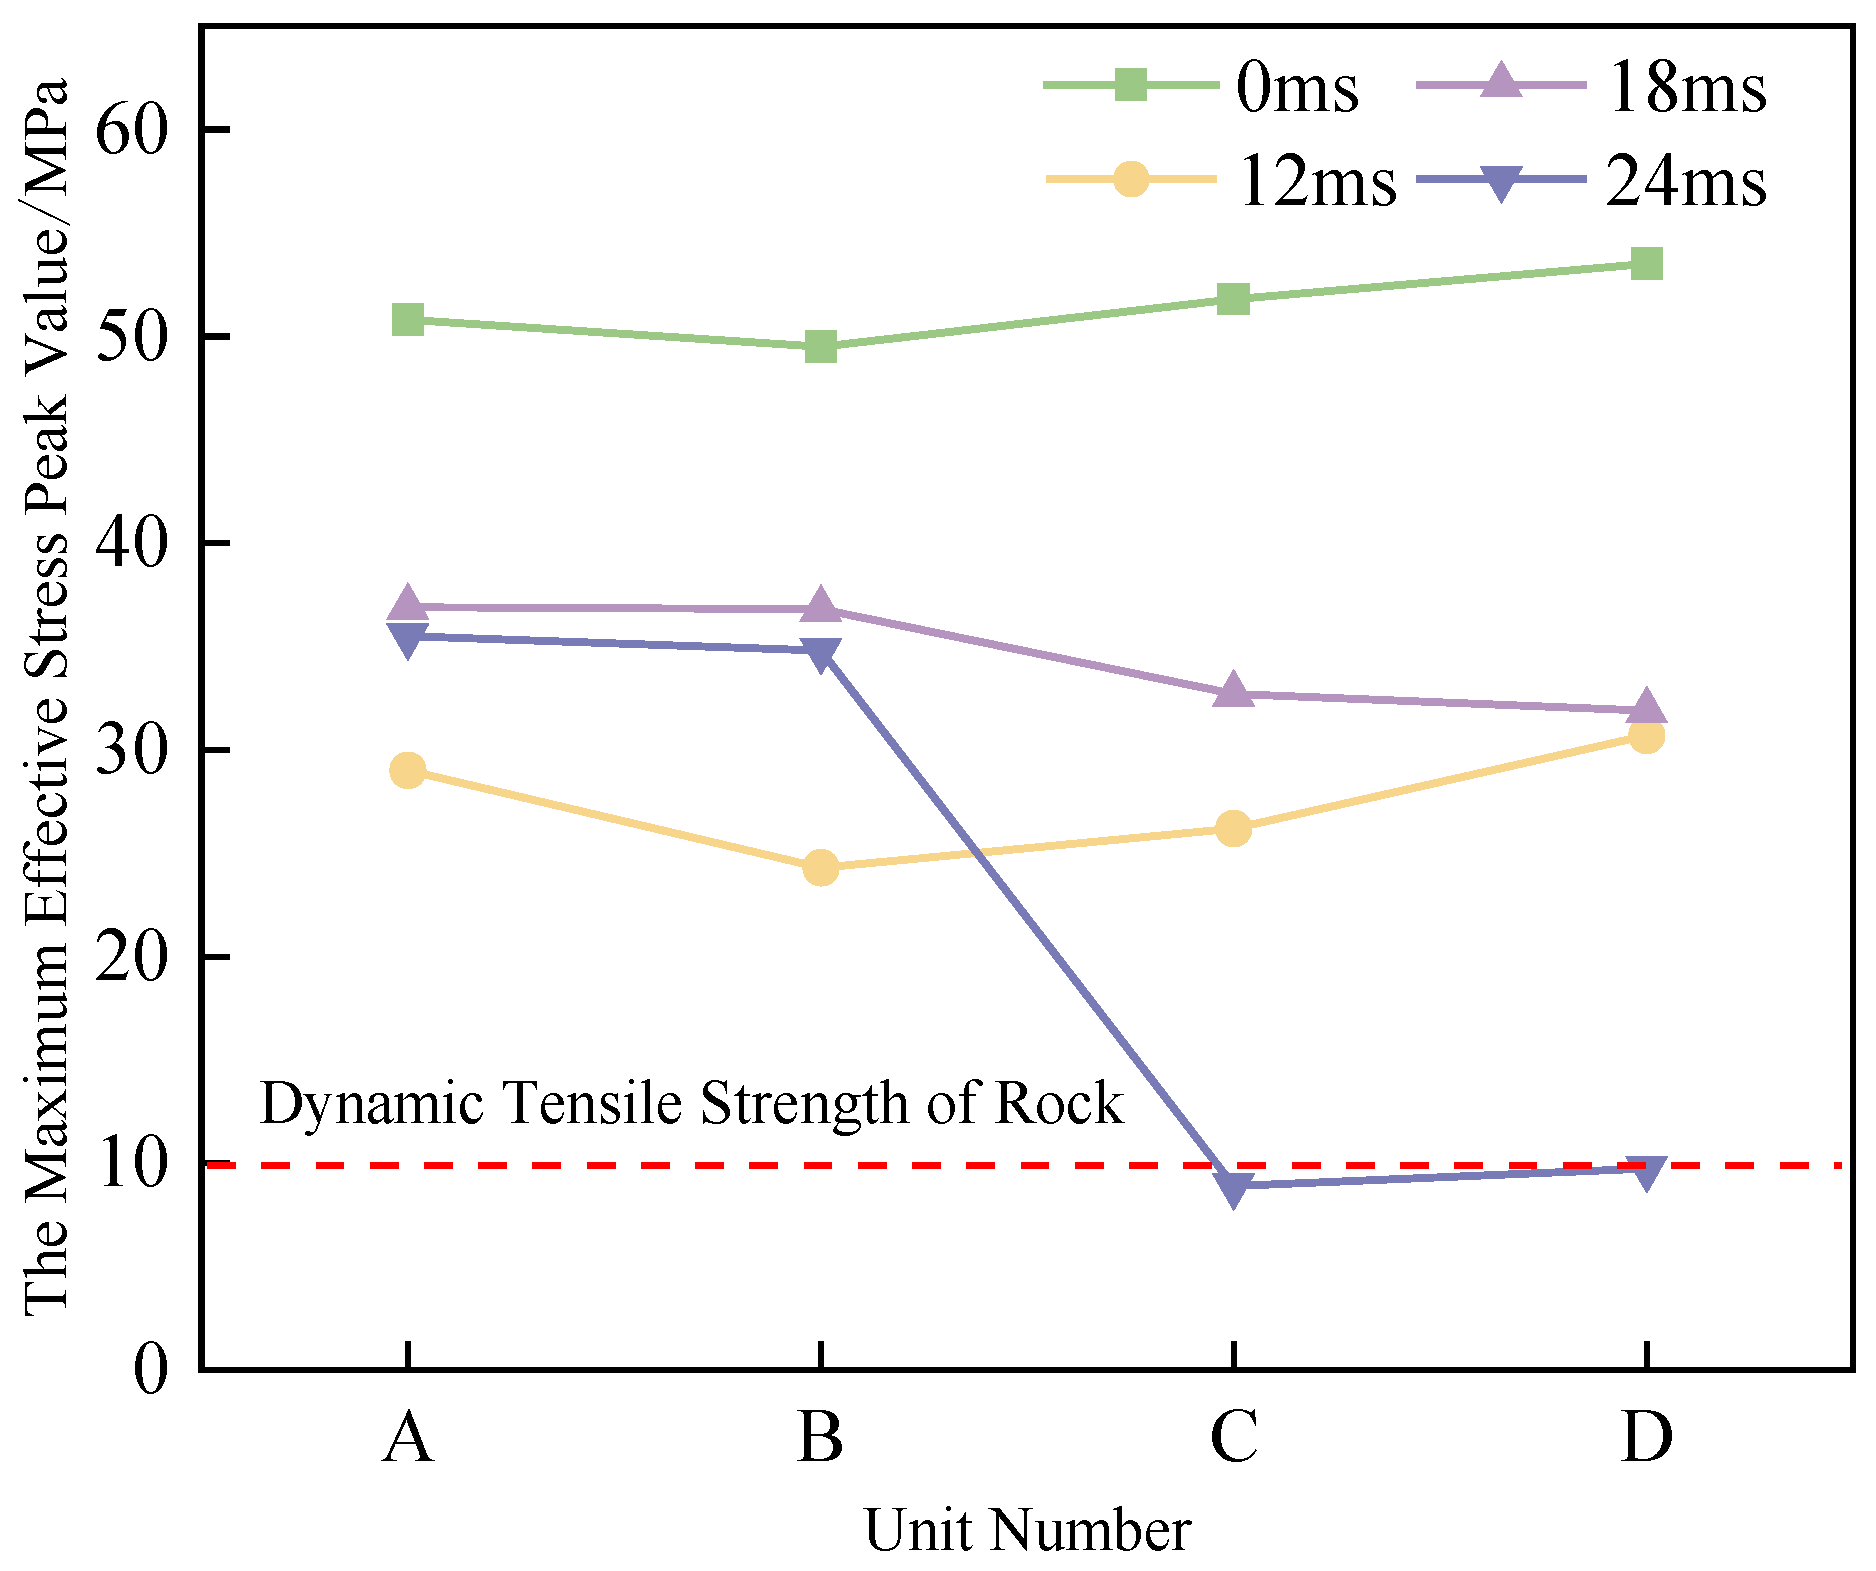
The variation curves of the maximum effective stress peaks for elements A, B, C, and D under different inter-hole delay settings are plotted, as shown in Figure 14. Under different inter-hole delay time settings, when the delay times are set to 0 ms, 12 ms, and 18 ms, the maximum effective stress peaks of elements A, B, C, and D are all greater than the dynamic tensile strength of the rock, indicating that these four elements can all be destroyed. When the inter-hole delay time is set to 24 ms, the maximum effective stress peaks of elements A and B are greater than the dynamic tensile strength of the rock, while those of elements C and D are less than the dynamic tensile strength, indicating that elements A and B can be destroyed, but elements C and D cannot. When the inter-hole delay time is set to 0 ms, which corresponds to simultaneous initiation, the maximum effective stress peaks of elements A, B, C, and D are all greater than those at other delay times due to the optimal stress superposition effect. For sequential initiation, the magnitude of the inter-hole delay time is not inversely proportional to the peak effective stress experienced by the elements. When the inter-hole delay time is set to 18 ms, the peak effective stress of the selected characteristic elements is greater than that at delay times of 12 ms and 24 ms. It is therefore crucial to appropriately set the inter-hole delay time in order to ensure the rock fragmentation effect.
5. Field Test

5.1. Design of Pre-Splitting Blasting Scheme

To observe and compare the effects of two different initiation methods, a representative stope platform was selected for experimentation in the mining area. To enhance comparability, two adjacent skarn regions on the same horizontal bench were selected for experimental comparison. The blasting area selected for the experiment was Platform 3516 at the Niukutou open-pit mine. The inter-hole delay time for the sequential pre-splitting blasting was set to 18 ms, based on the optimal delay time derived in the previous section. Referring to the researchers’ experience of mine blast engineering and using Equations (5) and (6) for calculations, the linear charge density (QL) was found to be approximately 1 kg/m. Therefore, the linear charge density for this on-site pre-splitting blasting was set at 1 kg/m.
Q L 1 = 0.034 ( σ c j ) 0.63 a 0.67
Q L 2 = 0.367 ( σ c j ) 0.5 a 0.36
In the equation, Q L represents the linear charge density; σ c j represents the uniaxial compressive strength of the rock; a represents the spacing between pre-splitting holes; and d represents the diameter of the pre-splitting holes. The arrangement of blasting holes for bench blasting is shown in Figure 15. The specific blasting parameters are presented in Table 11 and Table 12.

5.2. Damage Detection Test Scheme Design

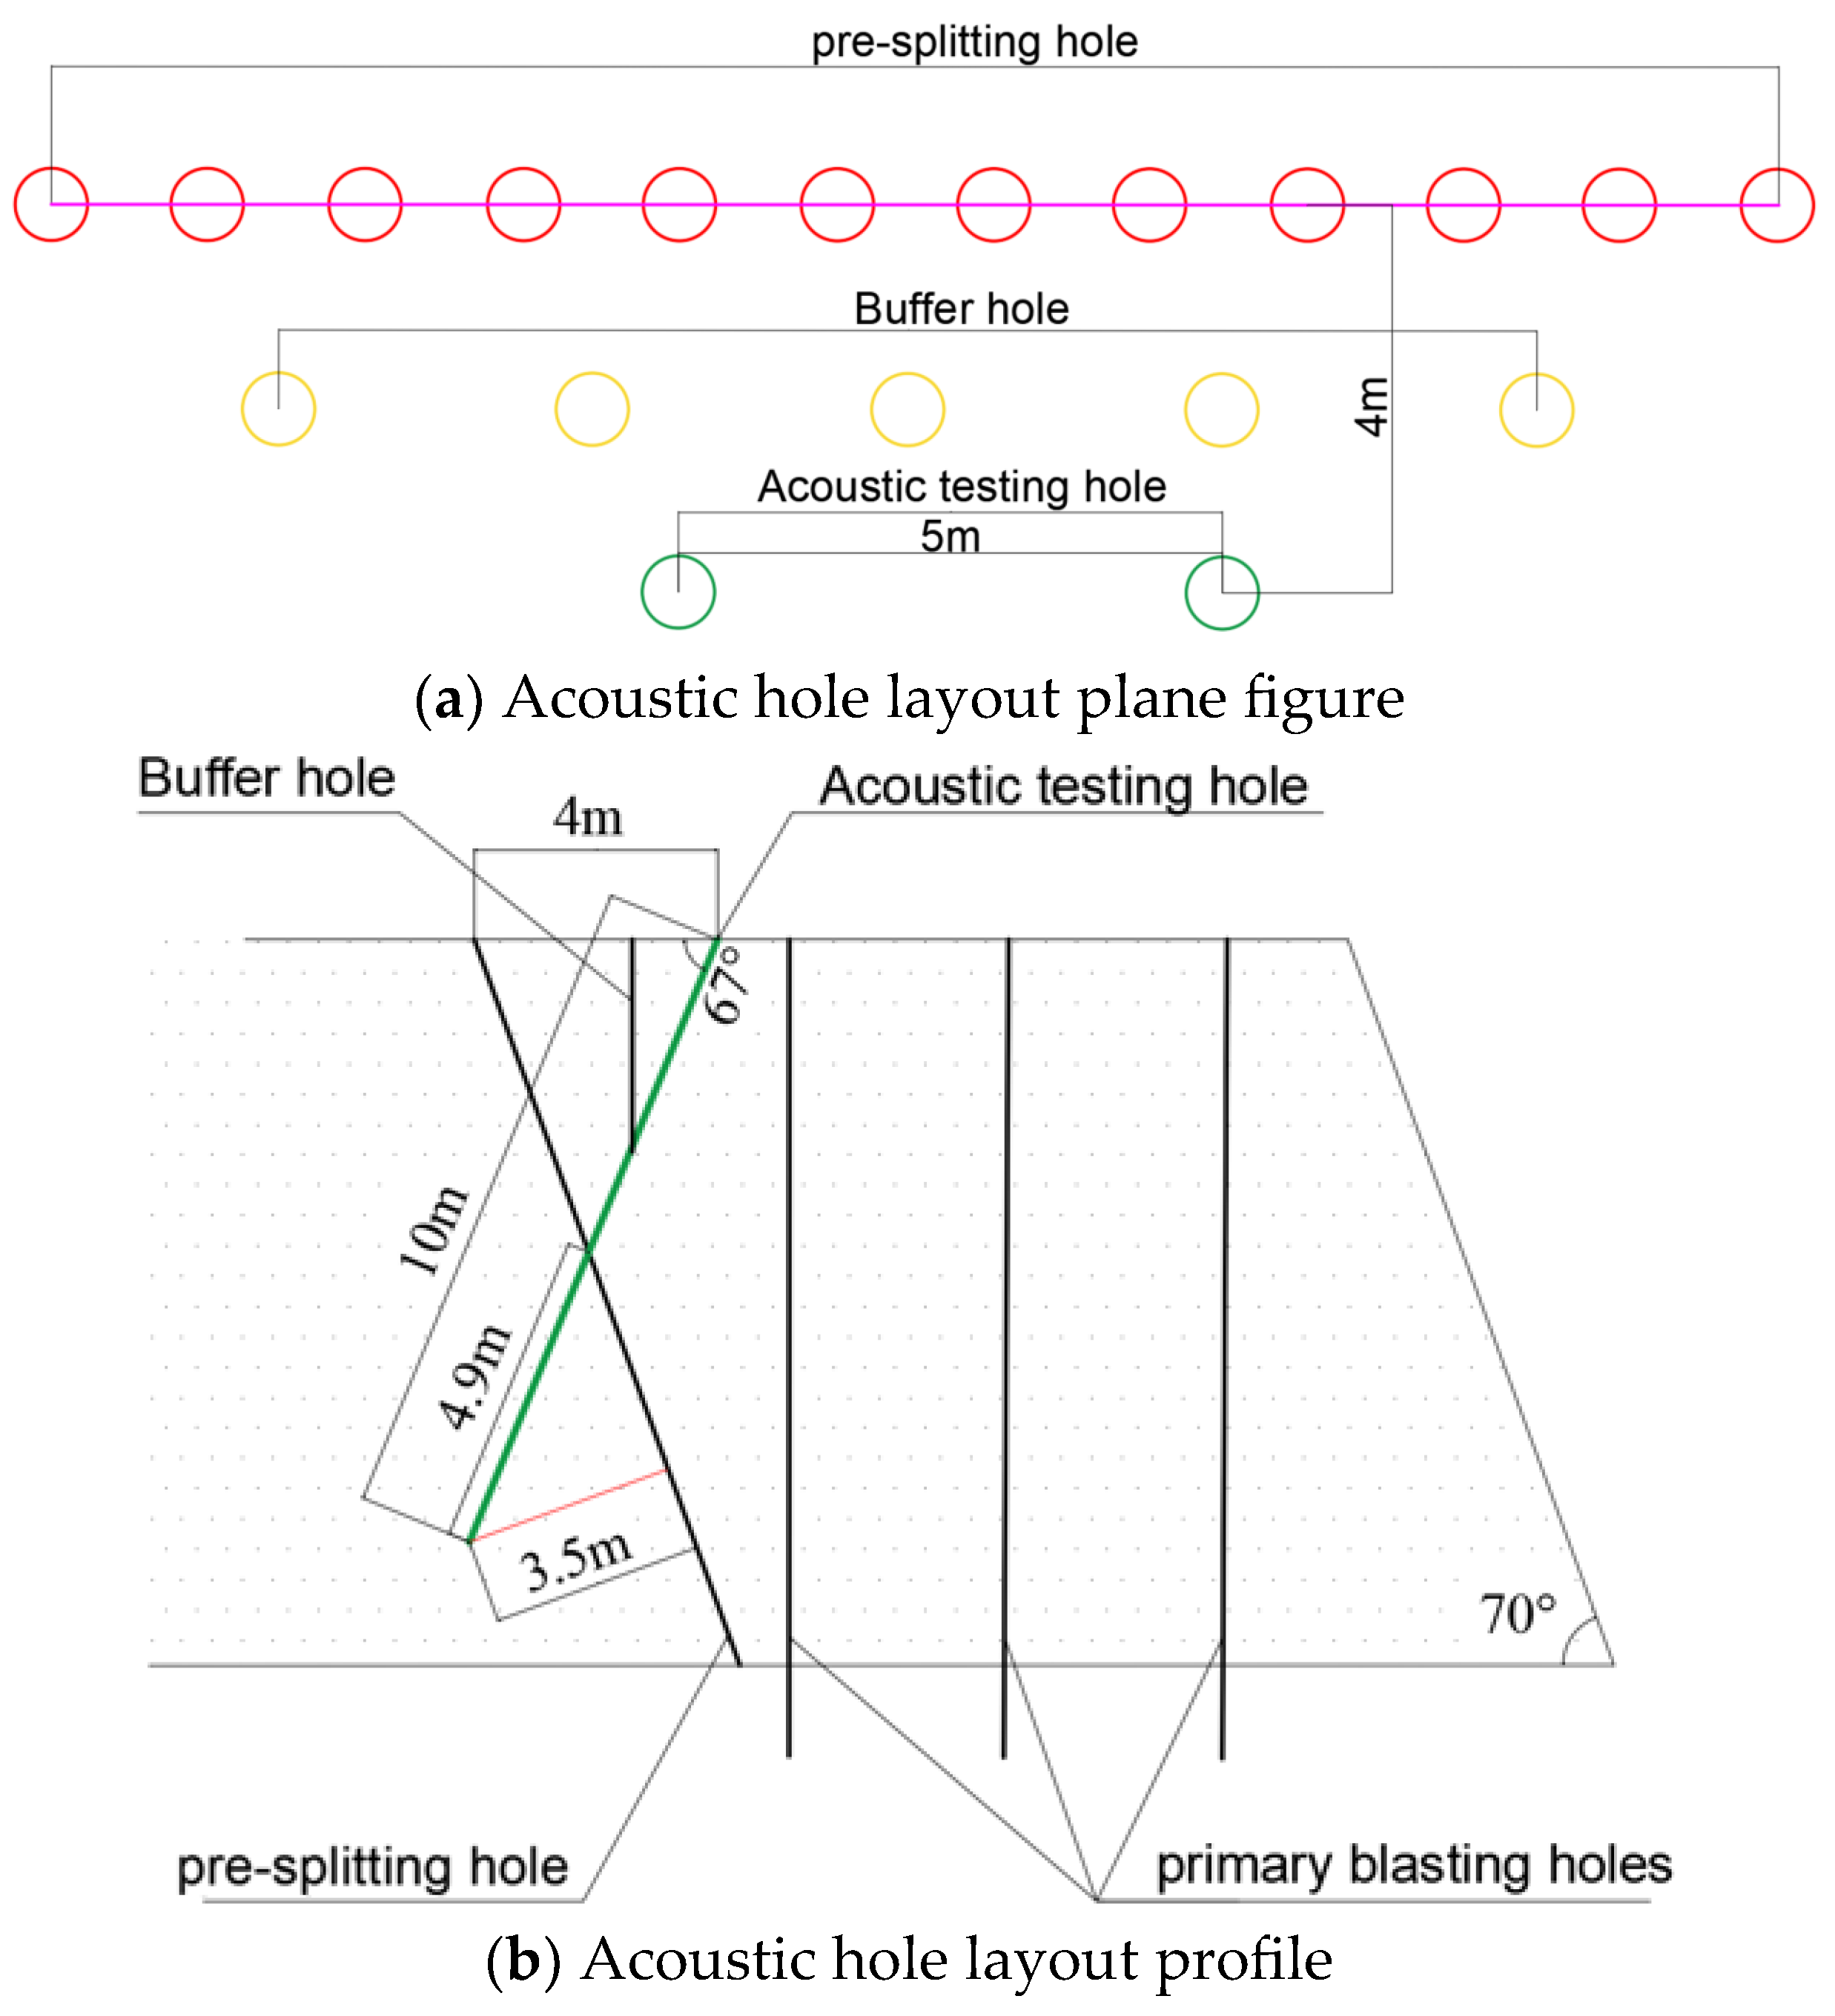
To investigate the differences in the damage caused to the rock mass at the pre-splitting surface during simultaneous initiation pre-splitting blasting and sequential pre-splitting blasting, the rock mass was assessed using acoustic wave testing before and after blasting; this was performed using both simultaneous initiation and sequential pre-splitting blasting methods. The acoustic wave testing scheme used to assess the depth of rock mass damage after blasting is shown in Figure 16. The acoustic wave testing device used in the experiment was the RSM-SY6 non-metallic acoustic wave tester. To meet the design requirements and facilitate on-site worker operations, the diameter of the acoustic wave testing holes was the same as that of the pre-splitting holes, which was 120 mm. The acoustic wave testing holes were located near the midpoint of the designed contour line of the pre-splitting holes, between the main blasting holes and the buffer holes, and at a straight-line distance of 4 m from the pre-splitting holes. Two acoustic wave testing holes were designed for each experiment, with a straight-line distance of 5 m between them. The drilling angle was the same as that of the pre-splitting holes, which was 67°, but in the opposite direction. The acoustic wave testing holes were inserted towards the pre-splitting surface, with the hole depth set at 10 m.

5.3. Analysis of Test Results

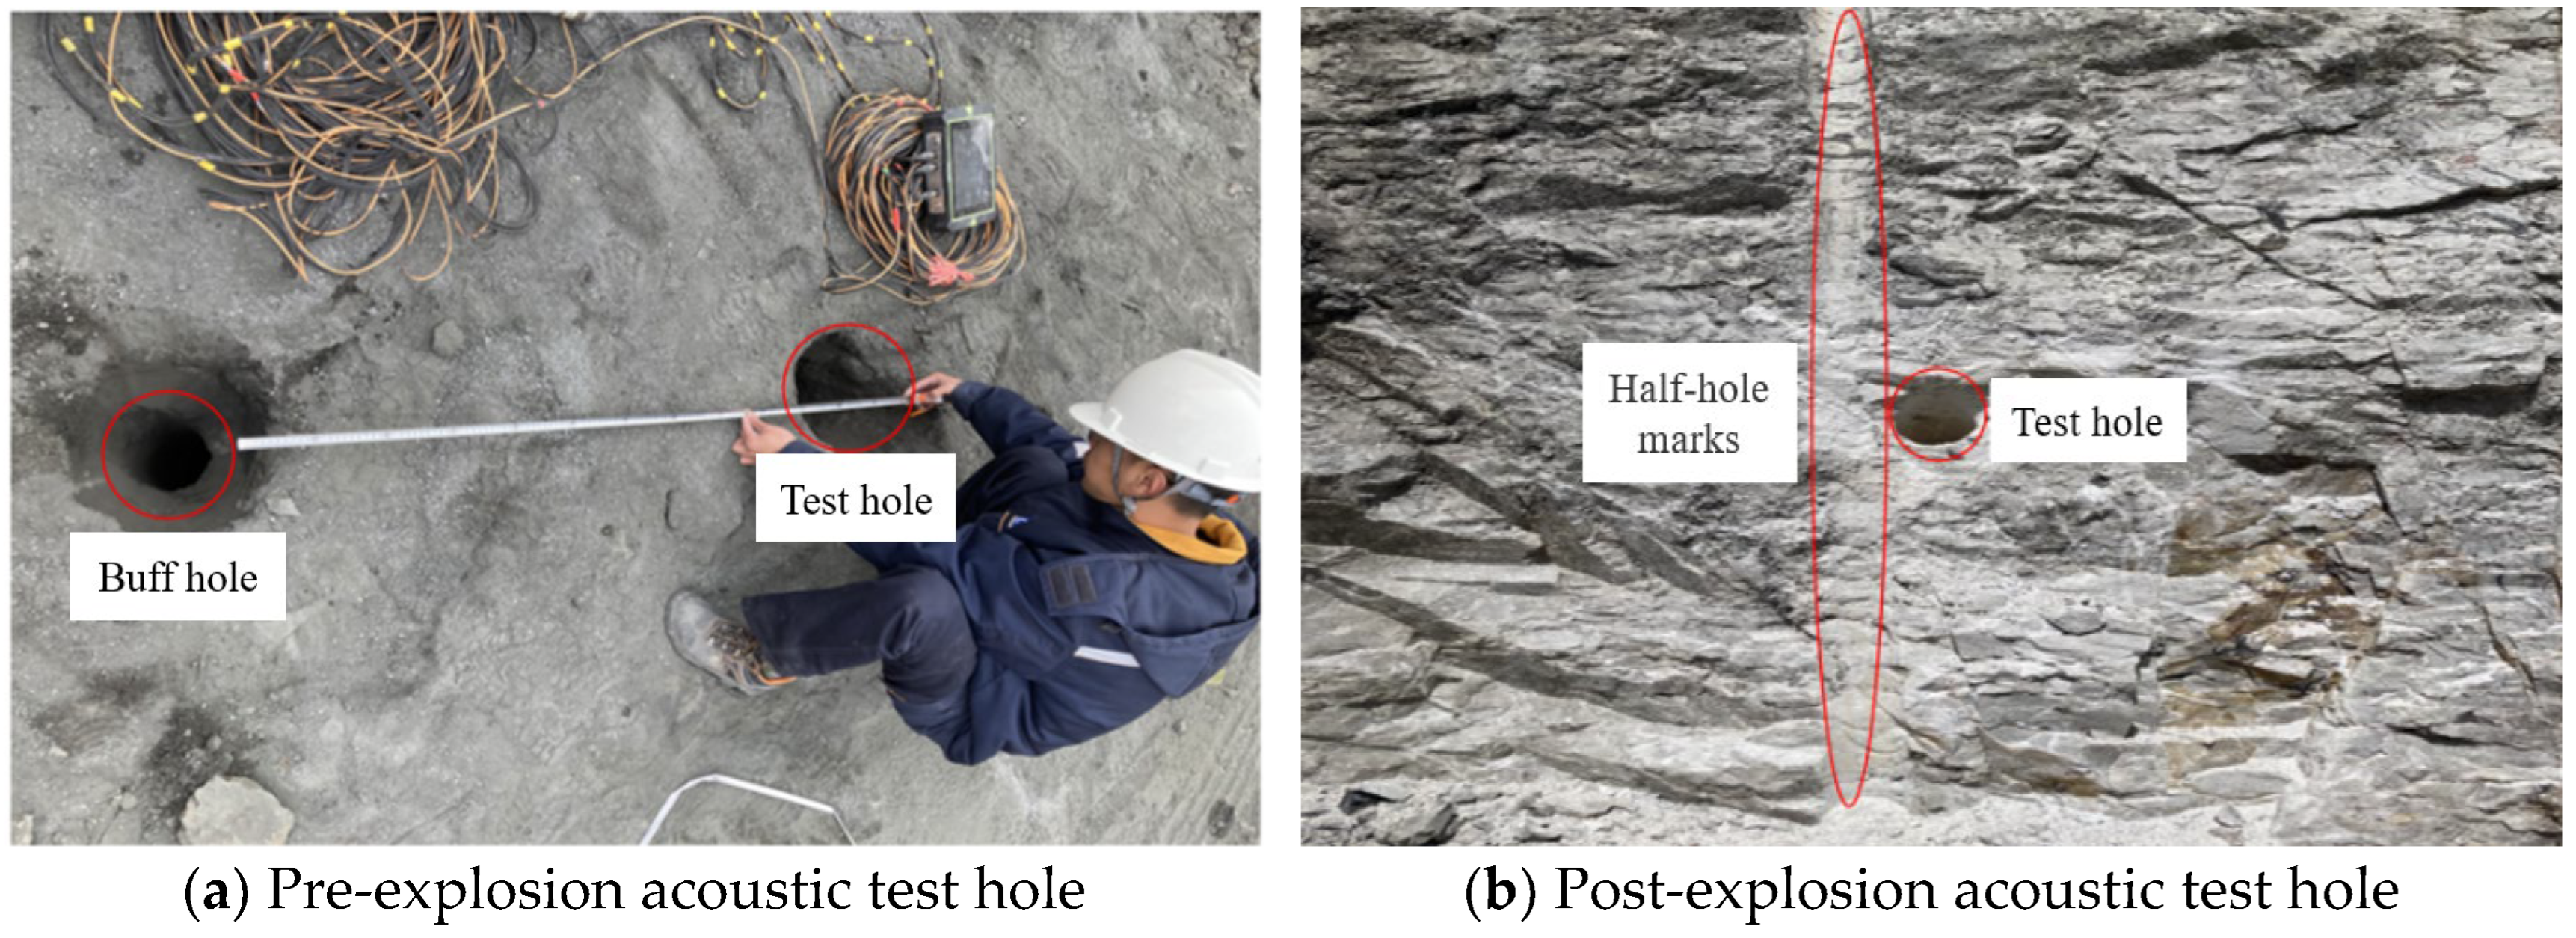
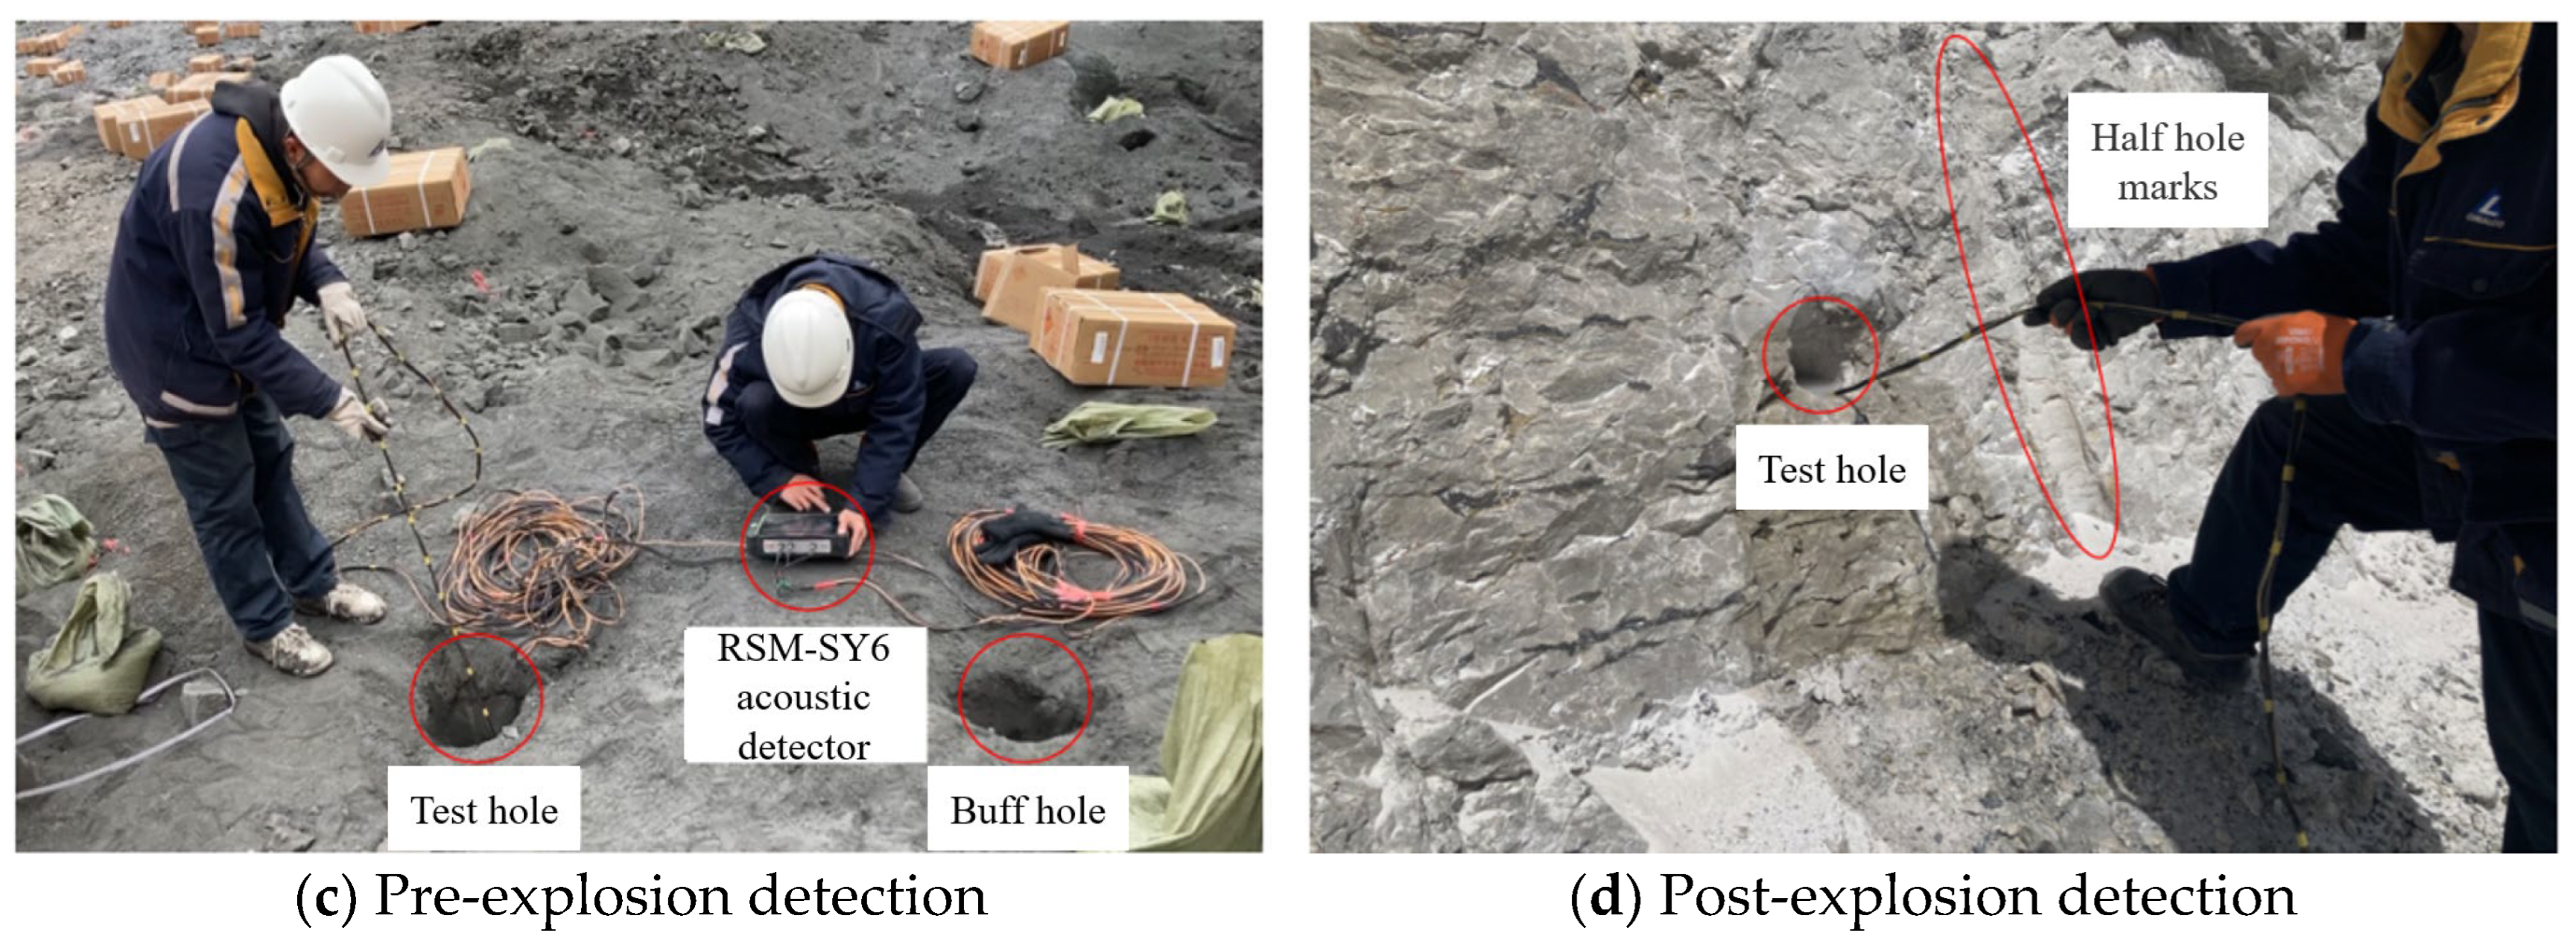
The acoustic holes and the acoustic testing process during the experiment are shown in Figure 17.
The pre-blast and post-blast acoustic wave velocities measured in the same acoustic hole, plotted against hole depth on the same graph, were analyzed using Equation (1). The damage depth was determined based on the damage assessment criteria. Figure 18 shows the pre-blast and post-blast acoustic velocity curves for simultaneous initiation pre-splitting blasting, while Figure 19 shows the corresponding curves for sequential pre-splitting blasting.
Within the industry, a 10% reduction in acoustic velocity is widely used as the benchmark for assessing the damage caused to the rock mass. The depth at which a 10% decrease in wave velocity occurs is considered the depth of blasting influence.
Using the aforementioned method, pre-blast and post-blast acoustic wave velocity comparison curves can be obtained. Since the acoustic holes are not perpendicular to the pre-splitting surface, trigonometric function formulas need to be applied to convert the measurements and obtain the depth of damage caused to the pre-splitting surface. Based on the test results, the average values were taken, and the damage results are presented in Table 13.
Compared to simultaneous initiation pre-splitting blasting, sequential pre-splitting blasting results in a damage depth that is smaller in the retained rock mass after blasting, with a reduction of approximately 44% in the damage depth; this is in comparison to the pre-splitting surface.
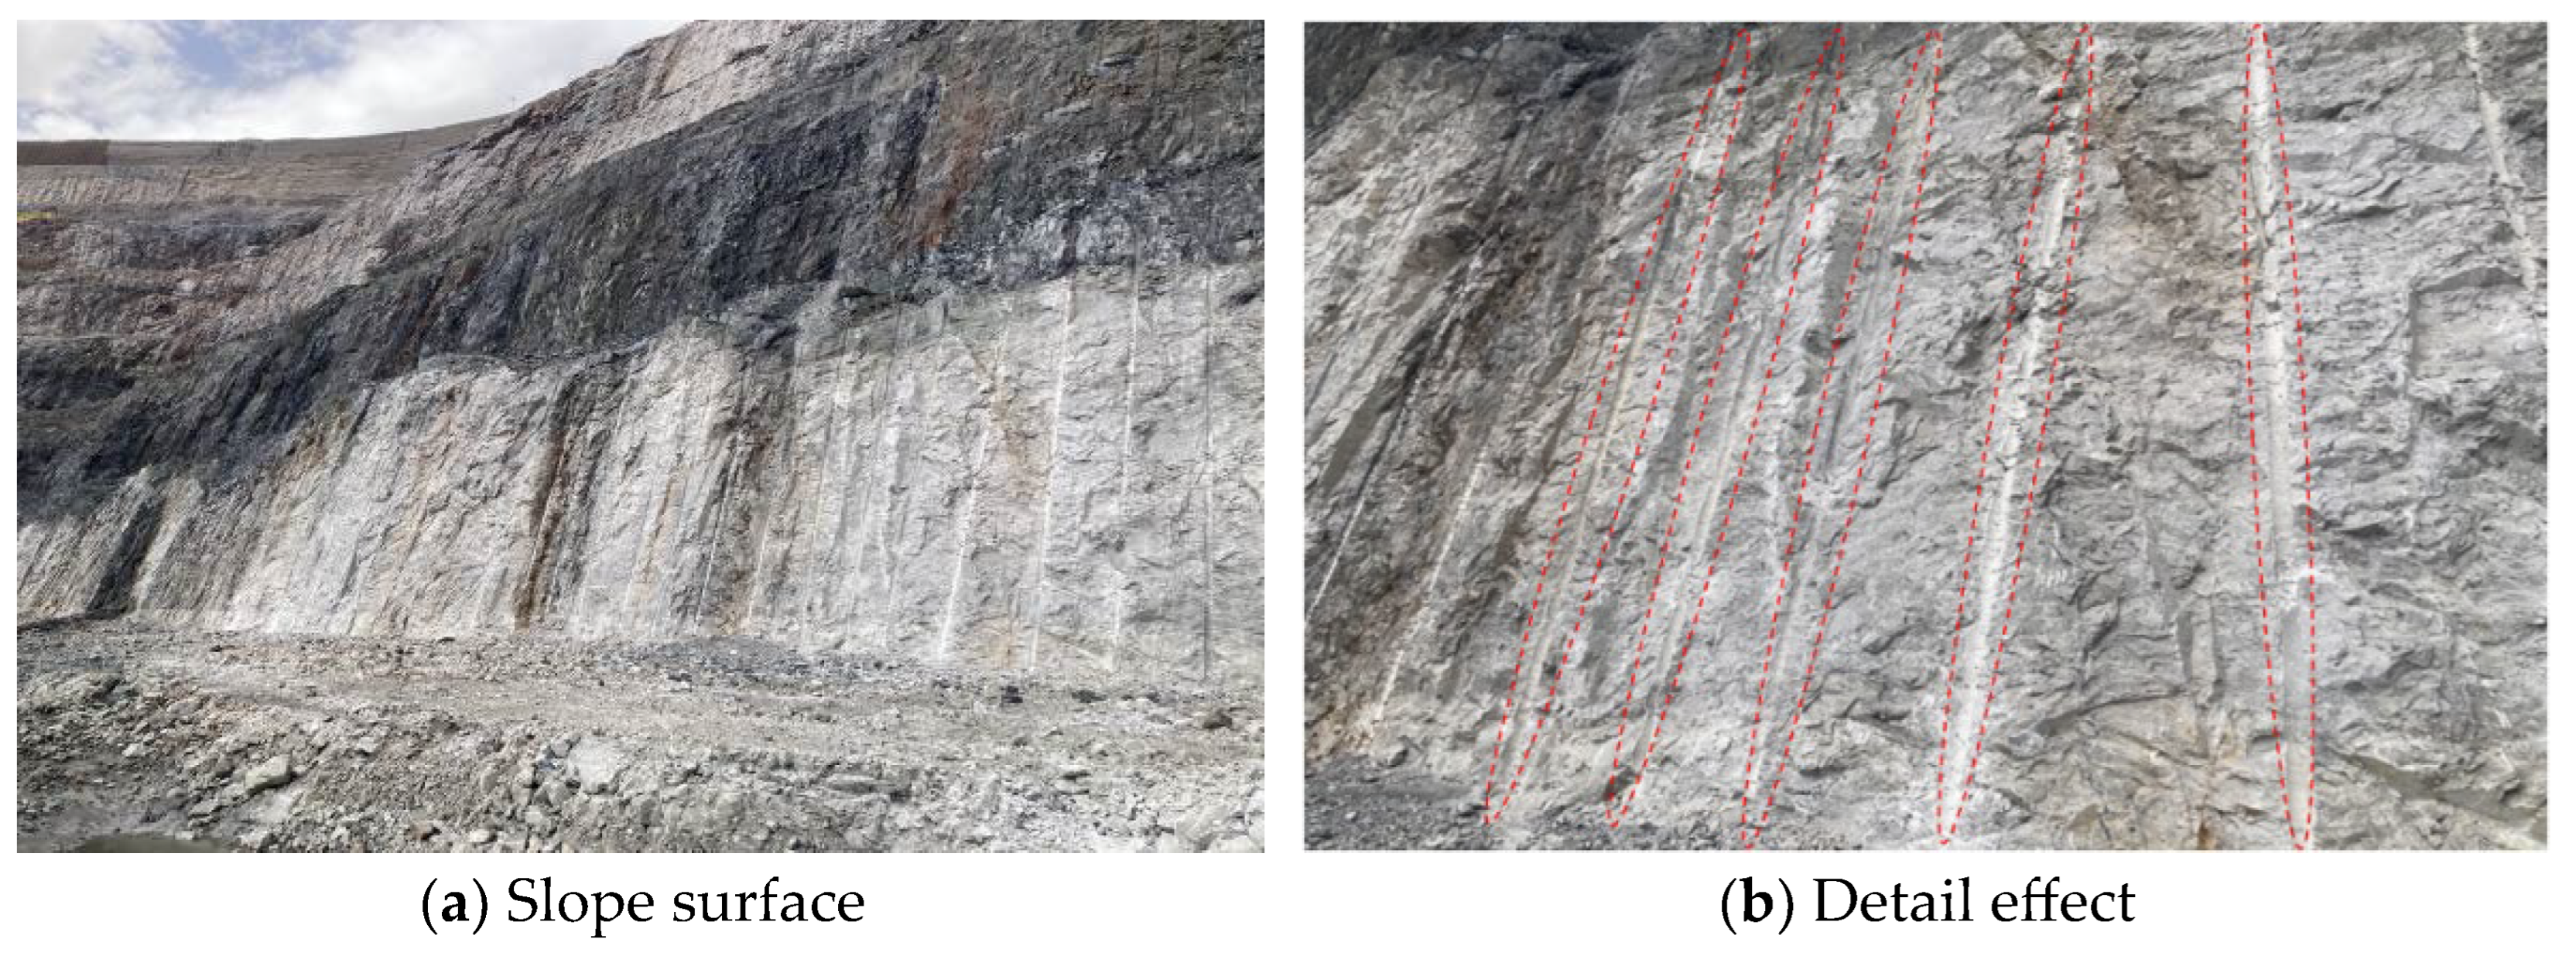
Figure 20 shows the condition of the pre-splitting surface after sequential pre-splitting blasting. It can be seen that the entire slope wall is relatively intact and well formed. No loose rocks or debris are present. Sequential pre-splitting blasting not only reduces the damage caused to the retained rock mass, but also achieves better pre-splitting blasting results.

6. Conclusions

To investigate the optimal delay time between holes for pre-splitting blasting and the damage caused to the retained rock mass at the Niukutou open-pit mine in Qinghai, China, this study employed a research method that combines numerical simulation and field experiments. By comparing and analyzing the results of numerical calculations and field tests, the following conclusions were drawn:
(1)
The numerical calculation results indicate that, within the same blasting area when only the delay time is changed between holes and when the delay time between holes is 0 ms, the maximum damage depth in the rock mass is 32.56 cm; however, when the delay time is 18 ms, the damage depth is much lower, at 30.61 cm. This shows that delayed initiation reduces the depth of damage caused to the rock mass after blasting.
(2)
In the case of simultaneous initiation, the peak maximum effective stress of all selected characteristic elements (A, B, C, and D) is higher than that when the delay time between holes is 12 ms, 18 ms, or 24 ms; when the sequential initiation method is used, the relationship between the delay time between holes and the peak effective stress experienced by the characteristic elements is not a simple inverse relationship. In particular, when the delay time between holes is 18 ms, the peak effective stress of the selected characteristic elements is higher than when the delay time is 12 ms or 24 ms. This indicates that the delay time has a significant impact on the rock fragmentation effect, with a delay time of 18 ms being the most ideal.
(3)
The field test results show that when the delay time between holes is 0 ms, the damage depth of the retained rock mass is 1.62 m; however, when the delay time is 18 ms, the damage depth decreases to 0.90 m, a reduction of approximately 44%. This result indicates that an appropriate delay time, especially a delay time of 18 ms between holes, can significantly reduce the depth of damage caused to the retained rock mass, thereby optimizing the effect of pre-splitting blasting.

Author Contributions

Writing—original draft, investigation, and formal analysis, J.L. Project administration, funding acquisition, and conceptualization, X.L. Software, C.T. Writing—review and editing, T.H. Data curation, J.X. All authors have read and agreed to the published version of the manuscript.

Funding

This research was funded by National Natural Science Foundation of China (No. 52274083), the Basic Research Project of the Yunnan Provincial Department of Science and Technology (No. 202201AT070178), and Yunnan Major Scientific and Technological Projects (No. 202202AG050014), supported by Science and Technology Projects Serving Key Industries in Higher Education Institutions by the Yunnan Provincial Department of Education (FWCY-BSPY2024053).

Institutional Review Board Statement

Not applicable.

Informed Consent Statement

Not applicable.

Data Availability Statement

Some or all data that support the findings of this study are available from the corresponding author upon reasonable request.

Acknowledgments

This work has received support from the School of Land and Resources Engineering at Kunming University of Science and Technology and Qinghai Hongxin Mining Co., Ltd. Thank you to the School of Land and Resources Engineering at Kunming University of Science and Technology and Qinghai Hongxin Mining Co., Ltd. for their support. The author is also very grateful to the staff of Qinghai Hongxin Mining Co., Ltd. for their warm hospitality and valuable support during the on-site inspection and testing period.

Conflicts of Interest

The authors declare no conflicts of interest.

References

  1. Wang, Z.; Wu, G.; Zhou, L. Optimization of Pre-Splitting Blasting Hole Network Parameters and Engineering Applications in Open Pit Mine. Appl. Sci. 2022, 12, 4930. [Google Scholar] [CrossRef]
  2. Shi, X.Z.; Chen, S.R. Delay time optimization in blasting operations for mitigating the vibration-effects on final pit walls’ stability. Soil Dyn. Earthq. Eng. 2011, 31, 1154–1158. [Google Scholar] [CrossRef]
  3. Singh, P.K.; Roy, M.P.; Paswan, R.K. Controlled blasting for long term stability of pit-walls. Int. J. Rock Mech. Min. Sci. 2014, 70, 388–399. [Google Scholar] [CrossRef]
  4. He, M.; Hu, Y.H.; Chen, J.; Zhang, J.Z.; Li, H.L.; Cai, C.G. Numerical Simulation Study on Parameter Optimization of Time Sequential Controlled Blasting. Shock Vib. 2022, 2022, 8728953. [Google Scholar] [CrossRef]
  5. Zhang, B.; Yang, Z.; Yang, X.; Zhang, S.; Lin, J. Presplit Blasting Technique in Treating Hard Overlying Strata: From Numerical Simulation to Field Practice. Adv. Civ. Eng. 2021, 2021, 5558538. [Google Scholar] [CrossRef]
  6. Zuo, T.; Li, X.; Wang, J.; Hu, Q.; Tao, Z.; Hu, T. Insights into natural tuff as a building material: Effects of natural joints on fracture fractal characteristics and energy evolution of rocks under impact load. Eng. Fail. Anal. 2024, 163, 108584. [Google Scholar] [CrossRef]
  7. Ma, J.; Li, X.; Wang, J.; Tao, Z.; Zuo, T.; Li, Q.; Zhang, X.; Lian, H. Experimental Study on Vibration Reduction Technology of Hole-by-Hole Presplitting Blasting. Geofluids 2021, 2021, 5403969. [Google Scholar] [CrossRef]
  8. Li, X.; Liu, K.; Qiu, T.; Sha, Y.; Yang, J. Study of presplit blasting under high in-situ stress. Eng. Fract. Mech. 2023, 288, 109360. [Google Scholar] [CrossRef]
  9. Hu, T.; Li, X.; Wang, J.; Ma, J.; Hu, Q.; Zuo, T. Fracture Behavior and Fracture Surface Smoothness of Rock-like Model Subjected to Axial Decoupling Spherical Charging. Eng. Fract. Mech. 2024, 311, 110549. [Google Scholar] [CrossRef]
  10. Zhu, F.H.; Liu, Z.L.; Huang, A.C. Study on the coupling mechanism of shaped blasting and empty hole to crack coal body. Process Saf. Environ. Prot. 2023, 175, 644–653. [Google Scholar] [CrossRef]
  11. Zhu, X.; Ding, C.; Sui, Z.; Su, H.; Guo, X. Rock Fracture Mechanism of Buffer Blasting with Cushion Layer at the Borehole Bottom. Int. J. Miner. Metall. Mater. 2024, 32, 325–334. [Google Scholar] [CrossRef]
  12. Yan, C.B. Blasting cumulative damage effects of underground engineering rock mass based on sonic wave measurement. J. Cent. South Univ. Technol. 2007, 14, 230–235. [Google Scholar] [CrossRef]
  13. Martino, J.B.; Chandler, N.A. Excavation-induced damage studies at the Underground Research Laboratory. Int. J. Rock Mech. Min. Sci. 2004, 41, 1413–1426. [Google Scholar] [CrossRef]
  14. Taylor, L.M.; Chen, E.P.; Kuszmaul, J.S. Microcrack-induced damage accumulation in brittle rock under dynamic loading. Comput. Methods Appl. Mech. Eng. 1986, 55, 301–320. [Google Scholar] [CrossRef]
  15. Meglis, I.L.; Chow, T.; Martin, C.D.; Young, R.P. Assessing in situ microcrack damage using ultrasonic velocity tomography. Int. J. Rock Mech. Min. Sci. 2005, 42, 25–34. [Google Scholar] [CrossRef]
  16. Ahrens, T.J.; Rubin, A.M. Impact-induced tensional failure in rock. J. Geophys. Res. 1993, 98, 1185–1203. [Google Scholar] [CrossRef]
  17. Aftabi, M.; Molladavoodi, H. Numerical analysis of parameters influencing blast damage and vibration using 3D distinct element method in the Calamine mine. Arab. J. Geosci. 2024, 17, 79. [Google Scholar] [CrossRef]
  18. Shi, Y.; Liu, S.; Hu, Y.; Li, Z.-X.; Ding, Y. A modal-based method for blast-induced damage assessment of reinforced concrete columns: Numerical and experimental validation. Eng. Struct. 2024, 300, 117166. [Google Scholar] [CrossRef]
  19. Cui, Y.Z.; Wu, B.; Meng, G.W.; Xu, S.X. Research on blasting cumulative dynamic damage of surrounding rock in step construction tunnel. Sci. Rep. 2023, 13, 1974. [Google Scholar] [CrossRef]
  20. Hu, Y.G.; Lu, W.B.; Wu, X.X.; Liu, M.S.; Li, P. Numerical and experimental investigation of blasting damage control of a high rock slope in a deep valley. Eng. Geol. 2018, 237, 12–20. [Google Scholar] [CrossRef]
  21. Martini, R.; Carvalho, J.; Mesquita, E.; Arêde, A.; Varum, H. Sonic test singularities of granite stone masonries. Constr. Build. Mater. 2023, 397, 132391. [Google Scholar] [CrossRef]
  22. Zhang, Y.; Ben Jar, P.Y.; Nguyen, K.-C.T.; Le, L.H. Characterization of ductile damage in polyethylene plate using ultrasonic testing. Polym. Test. 2017, 62, 51–60. [Google Scholar] [CrossRef]
  23. Xia, W.J.; Lu, W.B.; Wang, G.H.; Yan, P.; Liu, D.; Leng, Z.D. Safety threshold of blasting vibration velocity in foundation excavation of Baihetan super-high arch dam. Bull. Eng. Geol. Environ. 2020, 79, 4999–5012. [Google Scholar] [CrossRef]
  24. Fourney, W.L. Fragmentation Studies with Small Flaws. In Rock Fracture Mechanics; Rossmanith, H.P., Ed.; Springer: Vienna, Austria, 1983; Volume 275, pp. 321–340. [Google Scholar]
  25. Zhang, Z.C. Engineering Controlled Blasting; Southwest Jiaotong University Press: Chengdu, China, 2019. [Google Scholar]
  26. Cai, G.F. New Technology of Smooth Blasting; China Railway Publishing House: Beijing, China, 1994. [Google Scholar]
  27. Liu, L.; Katsabanis, P.D. Development of a Continuum Damage Model for Blasting Analysis. Int. J. Rock Mech. Min. Sci. 1997, 34, 217–231. [Google Scholar] [CrossRef]
  28. SL 47-2020; Technical Specification for Excavation Construction of Rock-Foundation of Hydraulic Structures. Ministry of Water Resources of the PRC: Beijing, China, 2020. (In Chinese)
  29. Huang, Y.H. The Technology Study on Long-Hole Pyramid Cut Blasting in Hard Rock Vertical Shaft. Ph.D. Thesis, China University of Mining and Technology, Beijing, China, 2013. [Google Scholar]
  30. Ye, Z.; Yang, J.; Chen, M.; Yao, C.; Zhang, X.; Ma, Y.; Zhou, C. Difference in Rock-Breaking Characteristics between Water-Coupling Blasting and Air-Coupling Blasting. Int. J. Rock Mech. Min. Sci. 2024, 183, 105924. [Google Scholar] [CrossRef]
  31. Dehghan Banadaki, M.M.; Mohanty, B. Numerical Simulation of Stress Wave Induced Fractures in Rock. Int. J. Impact Eng. 2012, 40, 16–25. [Google Scholar] [CrossRef]
  32. Alia, A.; Souli, M. High Explosive Simulation Using Multi-Material Formulations. Appl. Therm. Eng. 2006, 26, 1032–1042. [Google Scholar] [CrossRef]
  33. Li, X.; Liu, K.; Sha, Y.; Yang, J.; Song, R. Numerical Investigation on Rock Fragmentation under Decoupled Charge Blasting. Comput. Geotech. 2023, 157, 105312. [Google Scholar] [CrossRef]
  34. Liu, J.C.; Gao, W.X.; Wang, L.T.; Cao, X.L.; Zhang, S.H.; Wei, X. Numerical analysis on the charge structure optimization under hydraulic blasting and its application. J. Vib. Shock 2020, 39, 57–62+96. [Google Scholar] [CrossRef]
  35. Langefors, U.; Kihlström, B.; Kenkyūjo, K. The Modern Technique of Rock Blasting; Almquist and Wiksell: Stockholm, Sweden, 1963. [Google Scholar]
  36. Wang, Z.C.; Li, X.L.; Wang, H.F.; Wang, J.G.; Sun, J.H. Study on Optimization Method of Pre-splitting Blasting Parameters Based on Orthogonal Design Simulation Experiment. Nonferrous Met. Eng. 2021, 11, 96–101. [Google Scholar] [CrossRef]
  37. Hu, Q.W. Research on Precise Delay Number (Single) Hole One Shot Pre Splitting Blasting Test. Master’s Thesis, Kunming University of Science and Technology, Kunming, China, 2018. [Google Scholar]
  38. Lou, X.M.; Zhou, W.H.; Jian, W.B.; Zheng, J.J. Millisecond blasting optimal time delay control based on rock breaking mechanism. J. Harbin Inst. Technol. 2017, 49, 158–163. [Google Scholar] [CrossRef]
  39. Wu, X. Research on the Model Test and Crack Formation Mechanism of Numerical (Single) Hole One Sound Pre Splitting Blasting. Master’s Thesis, Kunming University of Science and Technology, Kunming, China, 2019. [Google Scholar]
Figure 1. Explosive gas-driven crack propagation model.
Applsci 15 01776 g001
Figure 2. There are three typical time differences in the initiation between blast hole A and blast hole B. (a) detonation with a long time interval; (b) detonation with a short time interval; (c) simultaneous detonation.
Applsci 15 01776 g002
Figure 3. Schematic diagram of stress concentration at the edge of an empty hole.
Applsci 15 01776 g003
Figure 4. Blasting funnel test.
Applsci 15 01776 g004
Figure 5. Numerical model of blasting funnel.
Applsci 15 01776 g005
Figure 6. Numerical simulation results of blasting crater test.
Applsci 15 01776 g006
Figure 7. Numerical simulation of blasting funnel test and field comparison.
Applsci 15 01776 g007
Figure 8. Numerical simulation model of pre-splitting blasting.
Applsci 15 01776 g008
Figure 9. Damage depth measurement process.
Applsci 15 01776 g009
Figure 10. Side view of damage cloud image of model.
Applsci 15 01776 g010
Figure 11. Model damage cloud from bottom view.
Applsci 15 01776 g011
Figure 12. Position diagram of feature unit selection.
Applsci 15 01776 g012
Figure 13. Effective stress time–history curve of characteristic elements.
Applsci 15 01776 g013
Figure 14. The change in the maximum effective stress peak value of the selected characteristic element.
Applsci 15 01776 g014
Figure 15. Bench blasting hole layout schematic diagram.
Applsci 15 01776 g015
Figure 16. Schematic diagram of acoustic wave detection scheme.
Applsci 15 01776 g016
Figure 17. On-site acoustic hole and acoustic detection.
Applsci 15 01776 g017aApplsci 15 01776 g017b
Figure 18. Acoustic velocity curve before and after pre-splitting blasting with simultaneous initiation.
Applsci 15 01776 g018
Figure 19. The sound wave velocity curve before and after pre-splitting blasting in one hole.
Applsci 15 01776 g019
Figure 20. Hole-by-hole pre-splitting blasting effect.
Applsci 15 01776 g020
Table 1. Parameters of rock RHT model.
ρ0/(g/cm3)fc/MPaAB0B1α0G/GPaT1/GPaT2/GPaPcrush/MPa
3.8393.62.471.681.681.033.0862.8062.4
NPlock/GPaFs*A1/GPaA2/GPaA3/GPaFt*Q0EOC/s−1EOT/s−1
0.7460.1862.8105.564.50.110.683.0 × 10−53.0 × 10⁻⁶
EC/s−1ET/s−1βcβtBGc*Gt*D1D2EPM
3.0 × 10−53.0 × 10−50.0130.0180.050.530.70.0410.01
AfNfNp
1.60.613
Table 2. Explosive material parameters.
ρ/(g/cm3)D/(m/s)A/GPaB/GPaR1R2ωE0/(GJ/m3)
1.14800214.40.1824.20.90.1524.192
Table 3. Air material parameters.
ρ/(g/cm3)C0C1C2C3C4C5C6E0V0
0.0012900000.40.402.5 × 10−41
Table 4. Water material parameters.
ρ/(g/cm3)CS1S2S3γ0E0V0
10.1482.56−1.9860.2270.52.56 × 10−41
Table 5. Summary table of blasting funnel test parameters.
HoleBlast Hole Diameter/mmBlast Hole Depth/mCharge Length/mFilling Length/mPowder Charge/kgDecoupling Coefficient
11201.20.450.7531.33
21201.30.450.8531.33
31201.40.450.9531.33
41201.50.451.0531.33
51201.60.451.1531.33
Table 6. Data obtained in blasting funnel field tests.
HoleExplosive Burial Depth/mFunnel Depth/mFunnel Radius/mFunnel Volume/m3
11.21.551.062.47
21.32.011.082.46
31.42.081.022.27
41.52.160.962.08
51.62.210.921.96
Table 7. Data obtained in the numerical simulation blasting funnel tests.
HoleExplosive Burial Depth/mFunnel Depth/mFunnel Radius/mFunnel Volume/m3
11.21.921.162.71
21.32.011.082.46
31.42.081.022.27
41.52.160.962.08
51.62.210.921.96
Table 8. Parameters of hole-by-hole pre-splitting blasting model.
Model Dimension/mNumber of Pre-Split HolesPre-Split Hole Diameter/mmPre-Split Hole Depth/mPre-Splitting Hole Spacing/mCartridge
Diameter/mm
Charged
Length/m
Filling
Length/m
LWH
6.445312051.23241
Table 9. Summary of damage depth measurement data.
NumberInter-Hole Delay Time (ms)Damage Depth (cm)
1032.56
21232.48
31830.61
42431.59
Table 10. Selected feature unit effective stress peak data summary.
NumberInter-Hole Delay Time/msUnit NumberFirst Stress Peak/MpaSecond Stress Peak/MpaThird Stress Peak/MpaMaximum Effective Stress Peak/Mpa
10A50.80--50.80
B49.50--49.50
C51.80--51.80
D53.50--53.50
212A29.007.79-29.00
B24.308.45-24.30
C5.8126.2022.4026.20
D3.9416.6030.7030.70
318A29.0036.90-36.90
B24.3036.80-36.80
C5.8132.7029.6032.70
D3.9422.3031.9031.90
424A29.0035.50-35.50
B24.3034.80-34.80
C5.817.318.918.91
D3.948.159.759.75
Table 11. Specific blasting parameters of simultaneous initiation pre-splitting blasting.
NumberType of HoleDrilling ParametersCharge Parameters
Hole Diameter/mmHole Depth/mHole Diameter/mStemming Length/mmExplosive Size/mmSingle-Hole Charge Quantity/kgThe Largest Quantities of One Blasting/kg
1pre-split hole12010.5~14.81.2-329~13.5672
2buffer hole1205.0~8.22.53.1~3.59015~33550
3primary blasting holes1205~12.853.5~4.09051~661056
Table 12. Specific blasting parameters of hole-by-hole pre-splitting blasting.
NumberType of HoleDrilling ParametersCharge Parameters
Bore Diameter/mmHole Depth/mHole Diameter/mStemming Length/mmExplosive Size/mmSingle-Hole Charge Quantity/kgThe Largest Quantities of One Blasting/kg
1pre-split hole12010.8~14.61.2-3210.5~13.512
2buffer hole1204.7~7.82.52.8~3.29016~32586
3primary blasting holes1203.2~15.553.0~3.59052~681258
Table 13. Damage results of pre-splitting blasting acoustic wave test.
Ways of InitiationNumberDamage Depth/mAverage Depth of Damage/m
Simultaneity11.511.62
21.73
Hole by hole10.80.9
21.0
Disclaimer/Publisher’s Note: The statements, opinions and data contained in all publications are solely those of the individual author(s) and contributor(s) and not of MDPI and/or the editor(s). MDPI and/or the editor(s) disclaim responsibility for any injury to people or property resulting from any ideas, methods, instructions or products referred to in the content.