


IoB Internet of Things (IoT) for Smart Built Environment (SBE): Understanding the Complexity and Contributing to Energy Efficiency; A Case Study in Mediterranean Climates

 ,
,  ,
,  and
and
Abstract
Featured Application
Abstract
1. Introduction
2. State of the Art Energy Efficiency and IoT in SBE
2.1. Advances in Energy Efficiency for Buildings
2.2. IoT Applications in SBE
2.3. Challenges and Opportunities
3. Materials and Methods
- Intelligent sustainable eco-design: Based on cultural and contextual criteria, including economic and ecological sustainability, smart architecture should strive for harmony with nature by responding to its physical laws and utilising its resources efficiently [30]. This approach emphasises that smart design extends beyond hardware and software to encompass broader contextual considerations, ensuring that the SBE contributes to a sustainable future;
- Intelligent contextual technology: Technology within SBE should be contextual and situated, combining existing technologies with the specific operating conditions of the SBE. Architecture relates its ways of building with its adaptability to the environment and its expression of cultural values. This context responds to a given boundary condition: the climatic situation, the available energy, the accessible materials, etc. This emphasises the need for technology to be integrated thoughtfully and respectfully within the SBE framework, intrinsically linked to how intelligence understands (within each culture) the relationship between building and environment, between living and being on Earth [31];
- Intelligent adaptive performance of buildings: The architectural configuration and utilisation of facilities should respond to the unique experiences of living in and with spaces in a specific location. Modern societies conduct most (work, personal, leisure) activities inside buildings. As current needs are dynamic and rapidly changing, buildings should adapt to these changes beyond simple maintenance or scheduling of services. This adaptability represents an inclusive form of intelligence, ensuring that SBE remains responsive to the evolving needs of its occupants [32];
- Intelligent inspiration and augmentation of occupants: The capacity to positively influence and maximise human creativity and intellect is crucial. As Winston Churchill stated, ‘we shape our buildings; thereafter they shape us’. Understanding the buildings should reflect a new relationship with nature. From this perspective, the SBE can intensify the relationship between inhabiting and environment. This can be performed by increasing knowledge of building behaviour through technology. This knowledge transcends a physical approach, encompassing how buildings respond to physical constraints, boundary conditions, and resource utilisation. It emerges from technology to empower creative solutions with intelligent capabilities and functionalities, influencing the well-being of people and the environment. This acquired knowledge should provide an intellectually enhanced understanding of the environment and the space we occupy, fostering a deeper connection between humans and the SBE [33].
3.1. Dynamic Habitat
3.2. Modes of Inhabiting
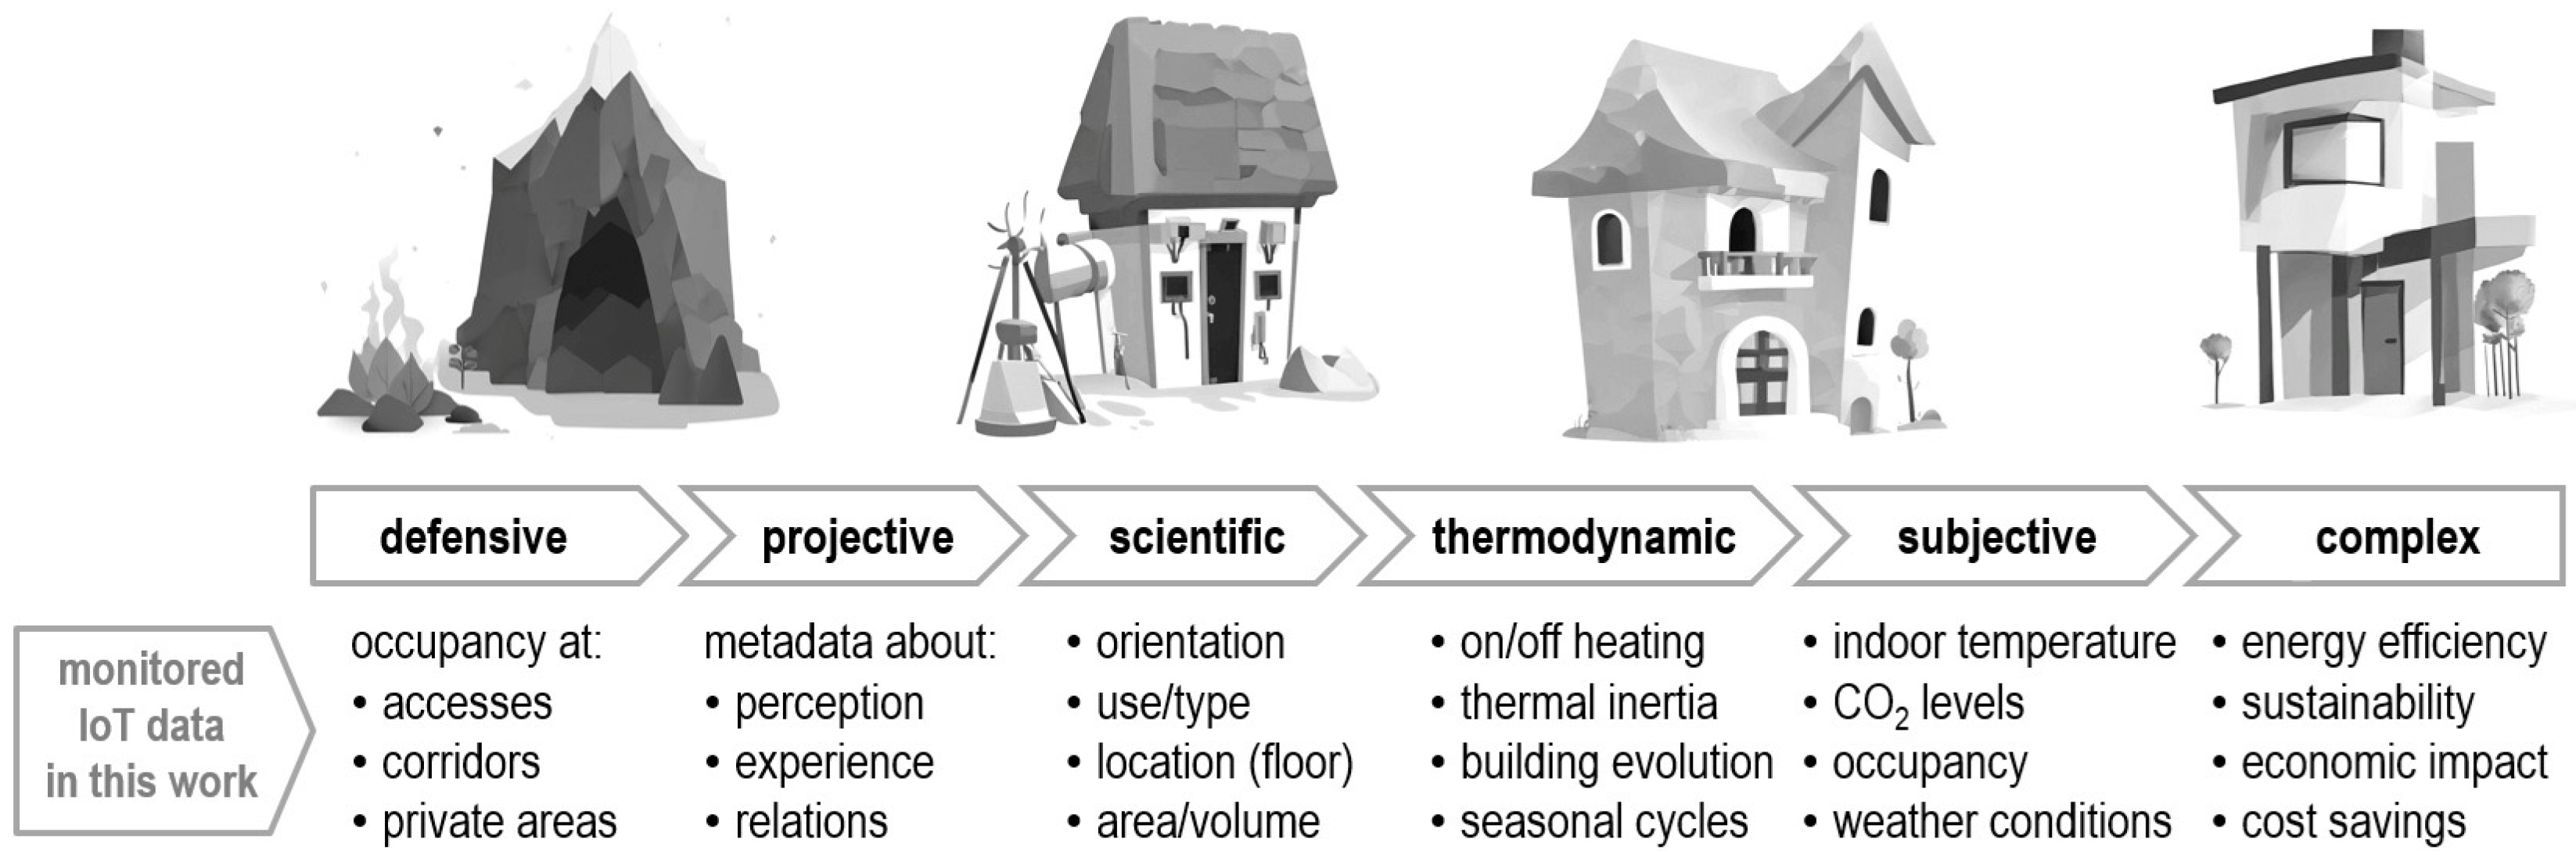
- Defensive. Buildings are often understood as shelters from a hostile world. Humans perceive themselves as part of that world. This mode of inhabitation aligns with the laws, norms, and patterns that humans can deduct from natural phenomena. The objectives of this mode are related to safety (structural, intrusion, etc.); thus, this work has monitored occupancy data (including access doors, corridors, private areas, etc.);
- Projective. One of the defining characteristics of humans is their ability to imagine what might happen and to invent reasons, myths, or question whether there is more to reality than what is perceived through the senses. Metaphysics, mythology, and religion suggest that existence on Earth has a purpose, a journey, or transcendence. Inhabiting the Earth is seen as temporary, a step in a process of transition and transformation. Humans build temples and monuments with meaning and purpose that transcend their mere functions or materials. The objectives of this mode are related to aesthetics, scale, and illumination; thus, this work has included metadata about comfort perception, user experience, and subjective relationship with spaces;
- Scientific. Scientific thought enables the calculation and prediction of the outcome of an action/process before it occurs. It relies on a reductionist analysis of parts to understand the whole. This reductionist establishes a division between body and mind. The world becomes a means to an end (abstract thought), making it possible to adapt any space to serve thought. Understanding the laws of nature allows for a mode of inhabiting “outside” of nature. The BE becomes a temporary passage for the mind. But now the mind is also a command centre for the body, from which to extend control over nature and extrapolate this dominion to the rest of the universe. The Cartesian concept also introduces the idea of isotropic and homogeneous space, enabling the understanding of territory as a limitless map for deploying thought. The objectives of this mode are related to rationality, order, circulation, proportion, and composition: thus, this work has categorised architectural spaces into zones (orientation, use, floor, etc.) and quantified different key parameters (area, volume, location, etc.);
- Thermodynamic. There are limits, processes are finite. Machines are built, composite materials are manufactured, and objects are moved but everything has a limit. Fossilised plant energy stored over aeons can be processed, and any space can be thermally conditioned regardless of external or local conditions. In other words, the act of inhabiting can be made thermally comfortable through energy (which is limited). Thus, the combination of an outdoor homogeneous space and the ability to make any indoor space habitable dissolves the notion of adapting to the environment, as the environment is instead adapted to the human being. Governed by energy consumption, this thermodynamic mode emphasises comfort and efficiency; thus, its objectives are related to energy consumption: so, this work has included monitoring of key parameters such as heating on/off times, building thermal inertia, building temperature, and its evolution in the architectural structure according to seasonal cycles;
- Subjective. A third interior habitation space emerges: subjectivity. This is an introspective perspective focused on building and inhabiting a strong sense of self. For this self, limits such as ageing and death remain, but advances in medicine improve living conditions regardless of where or how one inhabits. The identification of external pathogens capable of threatening the self-places emphasis on strengthening the immune system through isolation and hygiene. Consequently, inhabiting becomes homogeneous, enclosed, and hygienic, reinforcing separation from the outdoor. In other words, if any home can be adapted to thermally comfortable conditions and health can be improved through medication, this subjective mode (as a way of being in the world) becomes relative. Inhabiting (and therefore architecture) follows the criteria of subjectivity (influenced by fashion, opinion, or taste), with a focus shifting predominantly to the visual and aesthetic. The capacity of architecture to influence behaviour or provide protection becomes irrelevant. Thus, the objectives of this mode are related to isolation, filtering, control, regulation, and airtightness; so, the proposed methodology incorporates monitored data from several approaches: indoor temperature, CO2 levels, occupancy, and building temperature (from the built environment); outdoor temperature and meteorological conditions (from weather scope); and comfort, energy cost, and economic impact (from a user perspective);
- Complex. From individual boundaries, it becomes evident that humans are not isolated; every action affects both the individual and others. Every action has its reaction. This is a feedback-driven, interconnected reality (non-Newtonian) where concepts like cause and chance are replaced by patterns and uncertainties. In other words, reality is composed of patterns (not universal laws) that, in turn, depend on our ability to observe the world. Possibilities exist, not certainties. We belong to a network (life) filled with interconnections and interdependencies: between us and others, between the environment we inhabit and how we inhabit it. We adapt the environment to ourselves while simultaneously adapting ourselves to the environment in a feedback loop. Therefore, all habitation is identity, interconnection, and feedback, making it inherently a complex system. The objectives of this mode are related to interconnection (knowing when to open or close) and relationship (quantitative and qualitative) with the environment; thus, the proposed methodology correlates monitored data from several perspectives and, with specific results of this work, contributes with an economic quantification to show the savings potential.
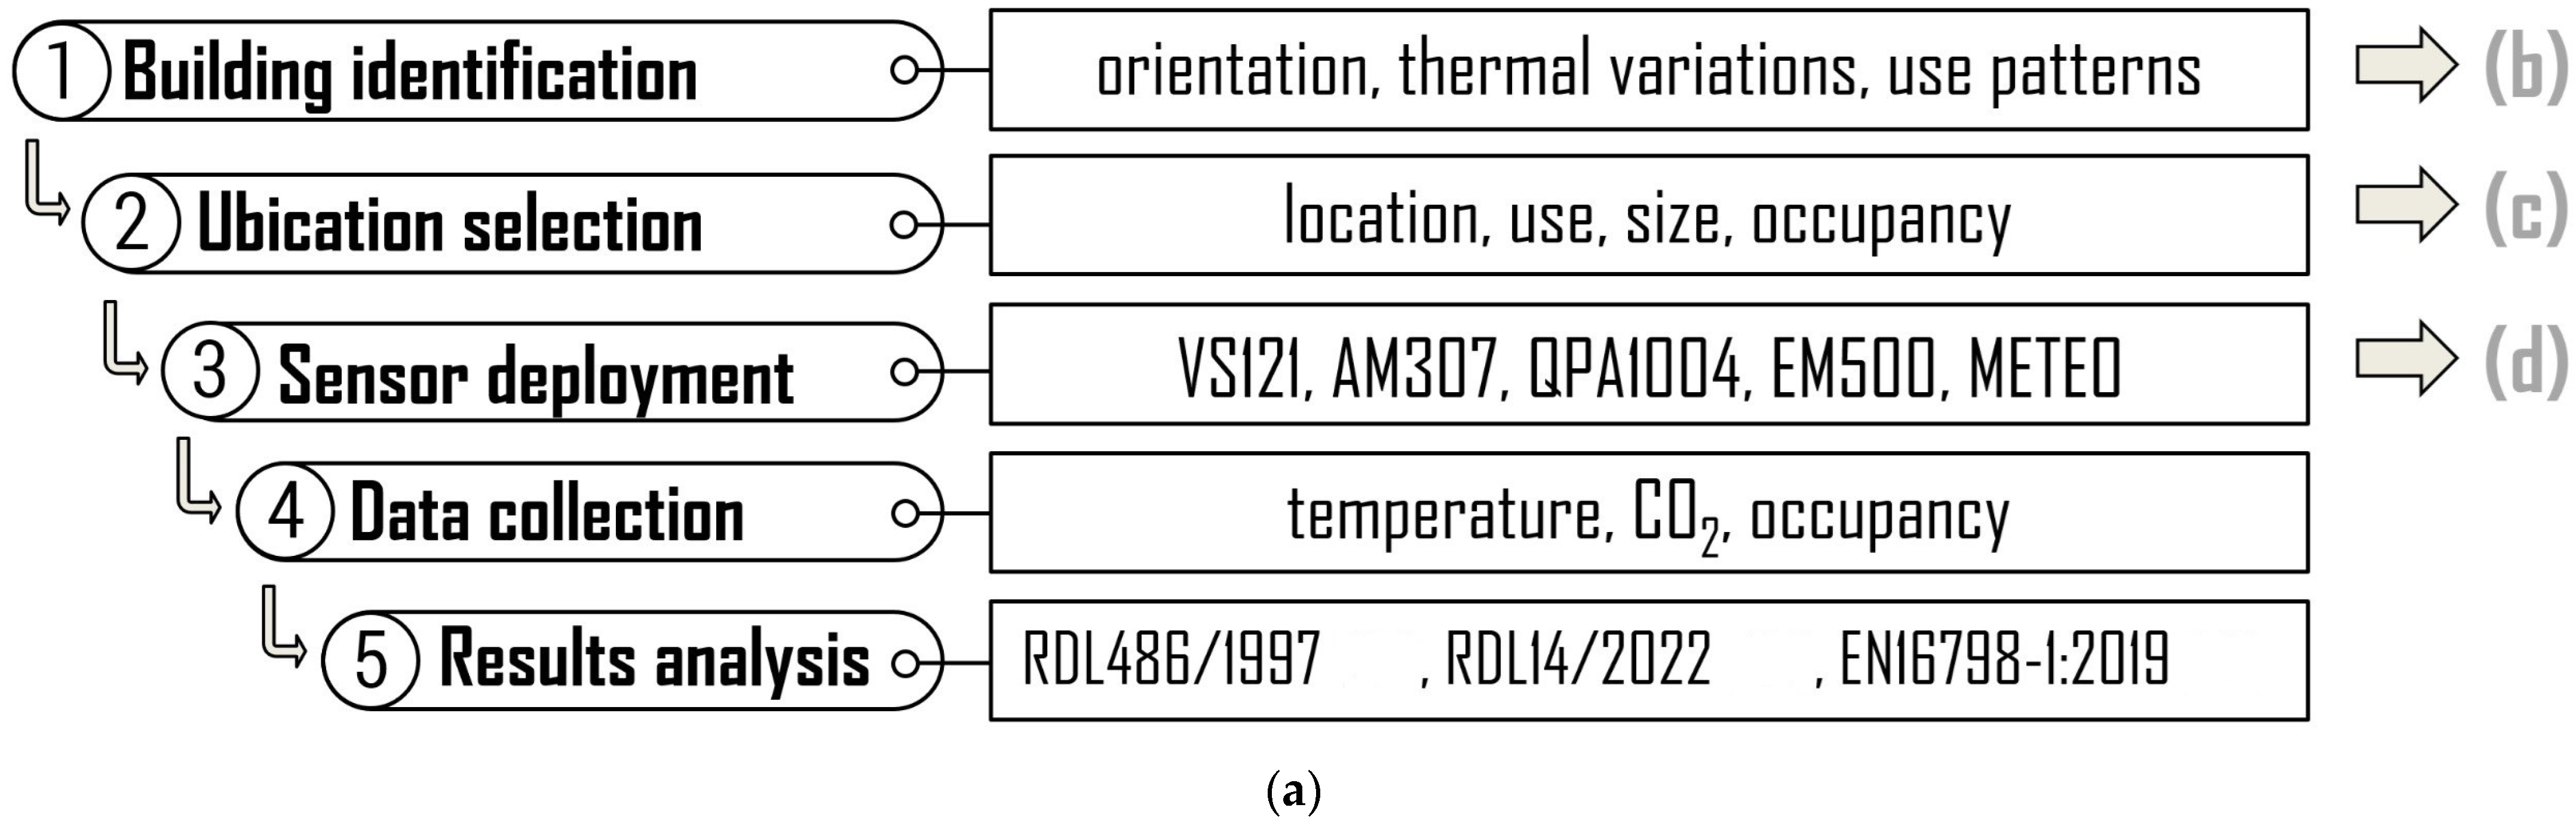
3.3. IoT-Driven Methodology
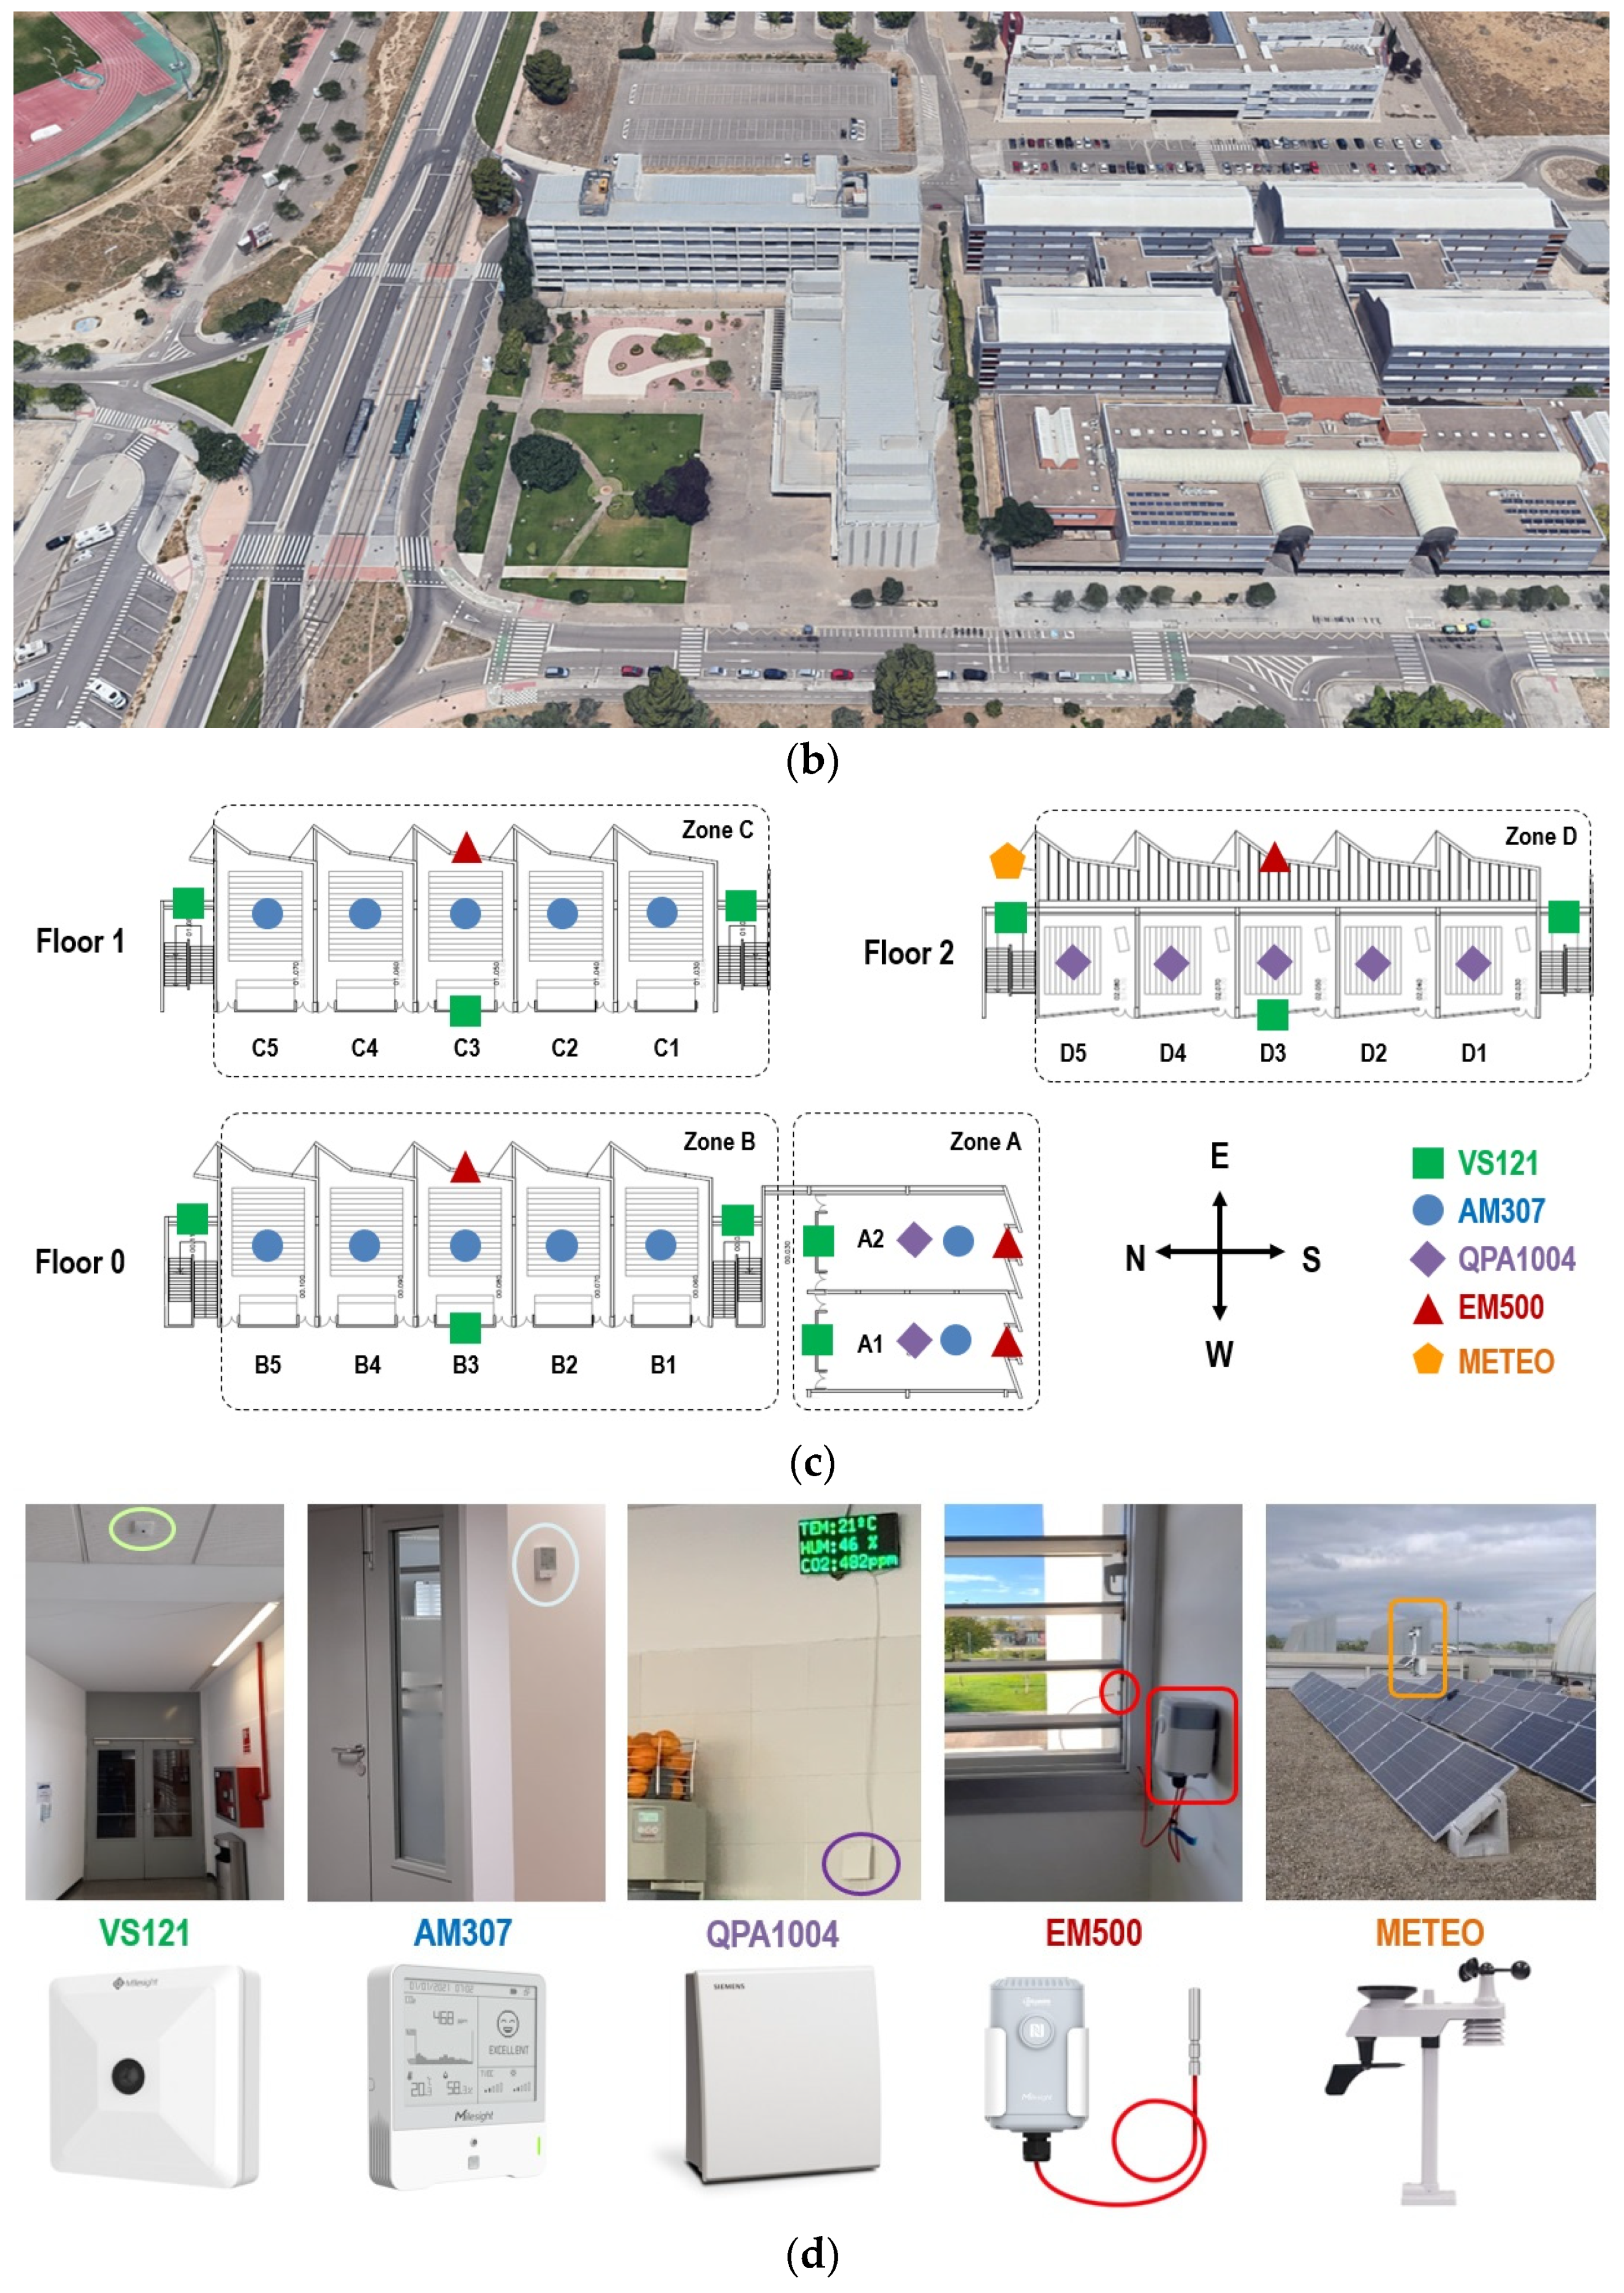
- Identification of buildings, regarding several key performances: orientation (north, south, east, and west), thermal variations, use of patterns (schedules, timetables), etc. Figure 2b shows smart campus, representative for extrapolating other SBE;
- Selection of ubications, see Figure 2c, following several key characteristics: location (floor, sector, building, campus), use (classroom, study room, office, laboratory, etc.), size (large, medium, small), occupancy (high, medium, low), among others.
- Deployment of sensor infrastructure. The IoT ecosystem of this work includes +200 geolocated wireless sensors that collect +1000 real-time measurements every hour. Figure 2d illustrates sensor examples with the following characteristics and metrics:
- VS121 www.milesight.com/iot/product/lorawan-sensor/vs121 (accessed on 20 December 2024): occupancy smart sensor for anonymous people counting data to monitor and understand space utilisation;
- AM307 www.milesight.com/iot/product/lorawan-sensor/am319 (accessed on 20 December 2024): Indoor Air Quality (IAQ) sensors to detect CO2 concentration, temperature, humidity, light, HCOH/O3 levels, TVOC, atmospheric pressure, PM 2.5, PM10 and motion;
- QPA1004 mall.industry.siemens.com/mall/es/es/Catalog/Product/S55720-S453 (accessed on 20 December 2024): room air quality sensor to detect CO2 concentration, temperature and humidity;
- EM500 www.milesight.com/iot/product/lorawan-sensor/em500-pt100 (accessed on 20 December 2024): industrial temperature equipment equipped with a high-precision PT100 sensor;
- Khomp Meteo www.khomp.com/iot/en/produto/endpoint-lora-station-meteorological (accessed on 20 December 2024), meteorological station that combine 7 sensors to capture temperature, humidity, rain, wind speed and direction, ultraviolet radiation and atmospheric pressure;
- 4.
- Acquisition of experimental measurements. The key IoT variables monitored in this work are as follows: temperature (indoor, building and outdoor), CO2, occupancy, humidity, light level, among others. This set is added to more external variables (to obtain SBE context-aware information) such as lecture schedule, weather conditions, architectural norms, heating on/off times, thermal thresholds, energy cost, among others;
- 5.
- Analysis of results. This step enables multidisciplinary studies; this work, within international directives about smart energy efficiency, follows the current legislation:
- RDL 486/1997 [49], which states that ‘indoor temperature in spaces where sedentary work typical of offices or similar activities is performed must be between 17 and 27 °C’. Thus, the minimum threshold is set at 17 °C; below 17 °C, it is mandatory to turn on the heating;
- RDL 14/2022 [50], which states that ‘the indoor temperature in heated spaces must not exceed 21 °C when conventional energy is required to generate heat through the heating system … the scope of application includes buildings for administrative use … and universities)’. Thus, the maximum threshold is set at 21 °C; above 21 °C, it is advisable to turn off the heating to promote energy savings;
- EN 16798-1:2019 [51], which states various tolerance ranges to fulfil adaptive thermal comfort, stating that ‘the indoor temperature should round 19° C’. Thus, the thermal comfort threshold is set at 19 °C by analysing ranges between 17 and 19 °C and 19 and 21 °C.
4. Results
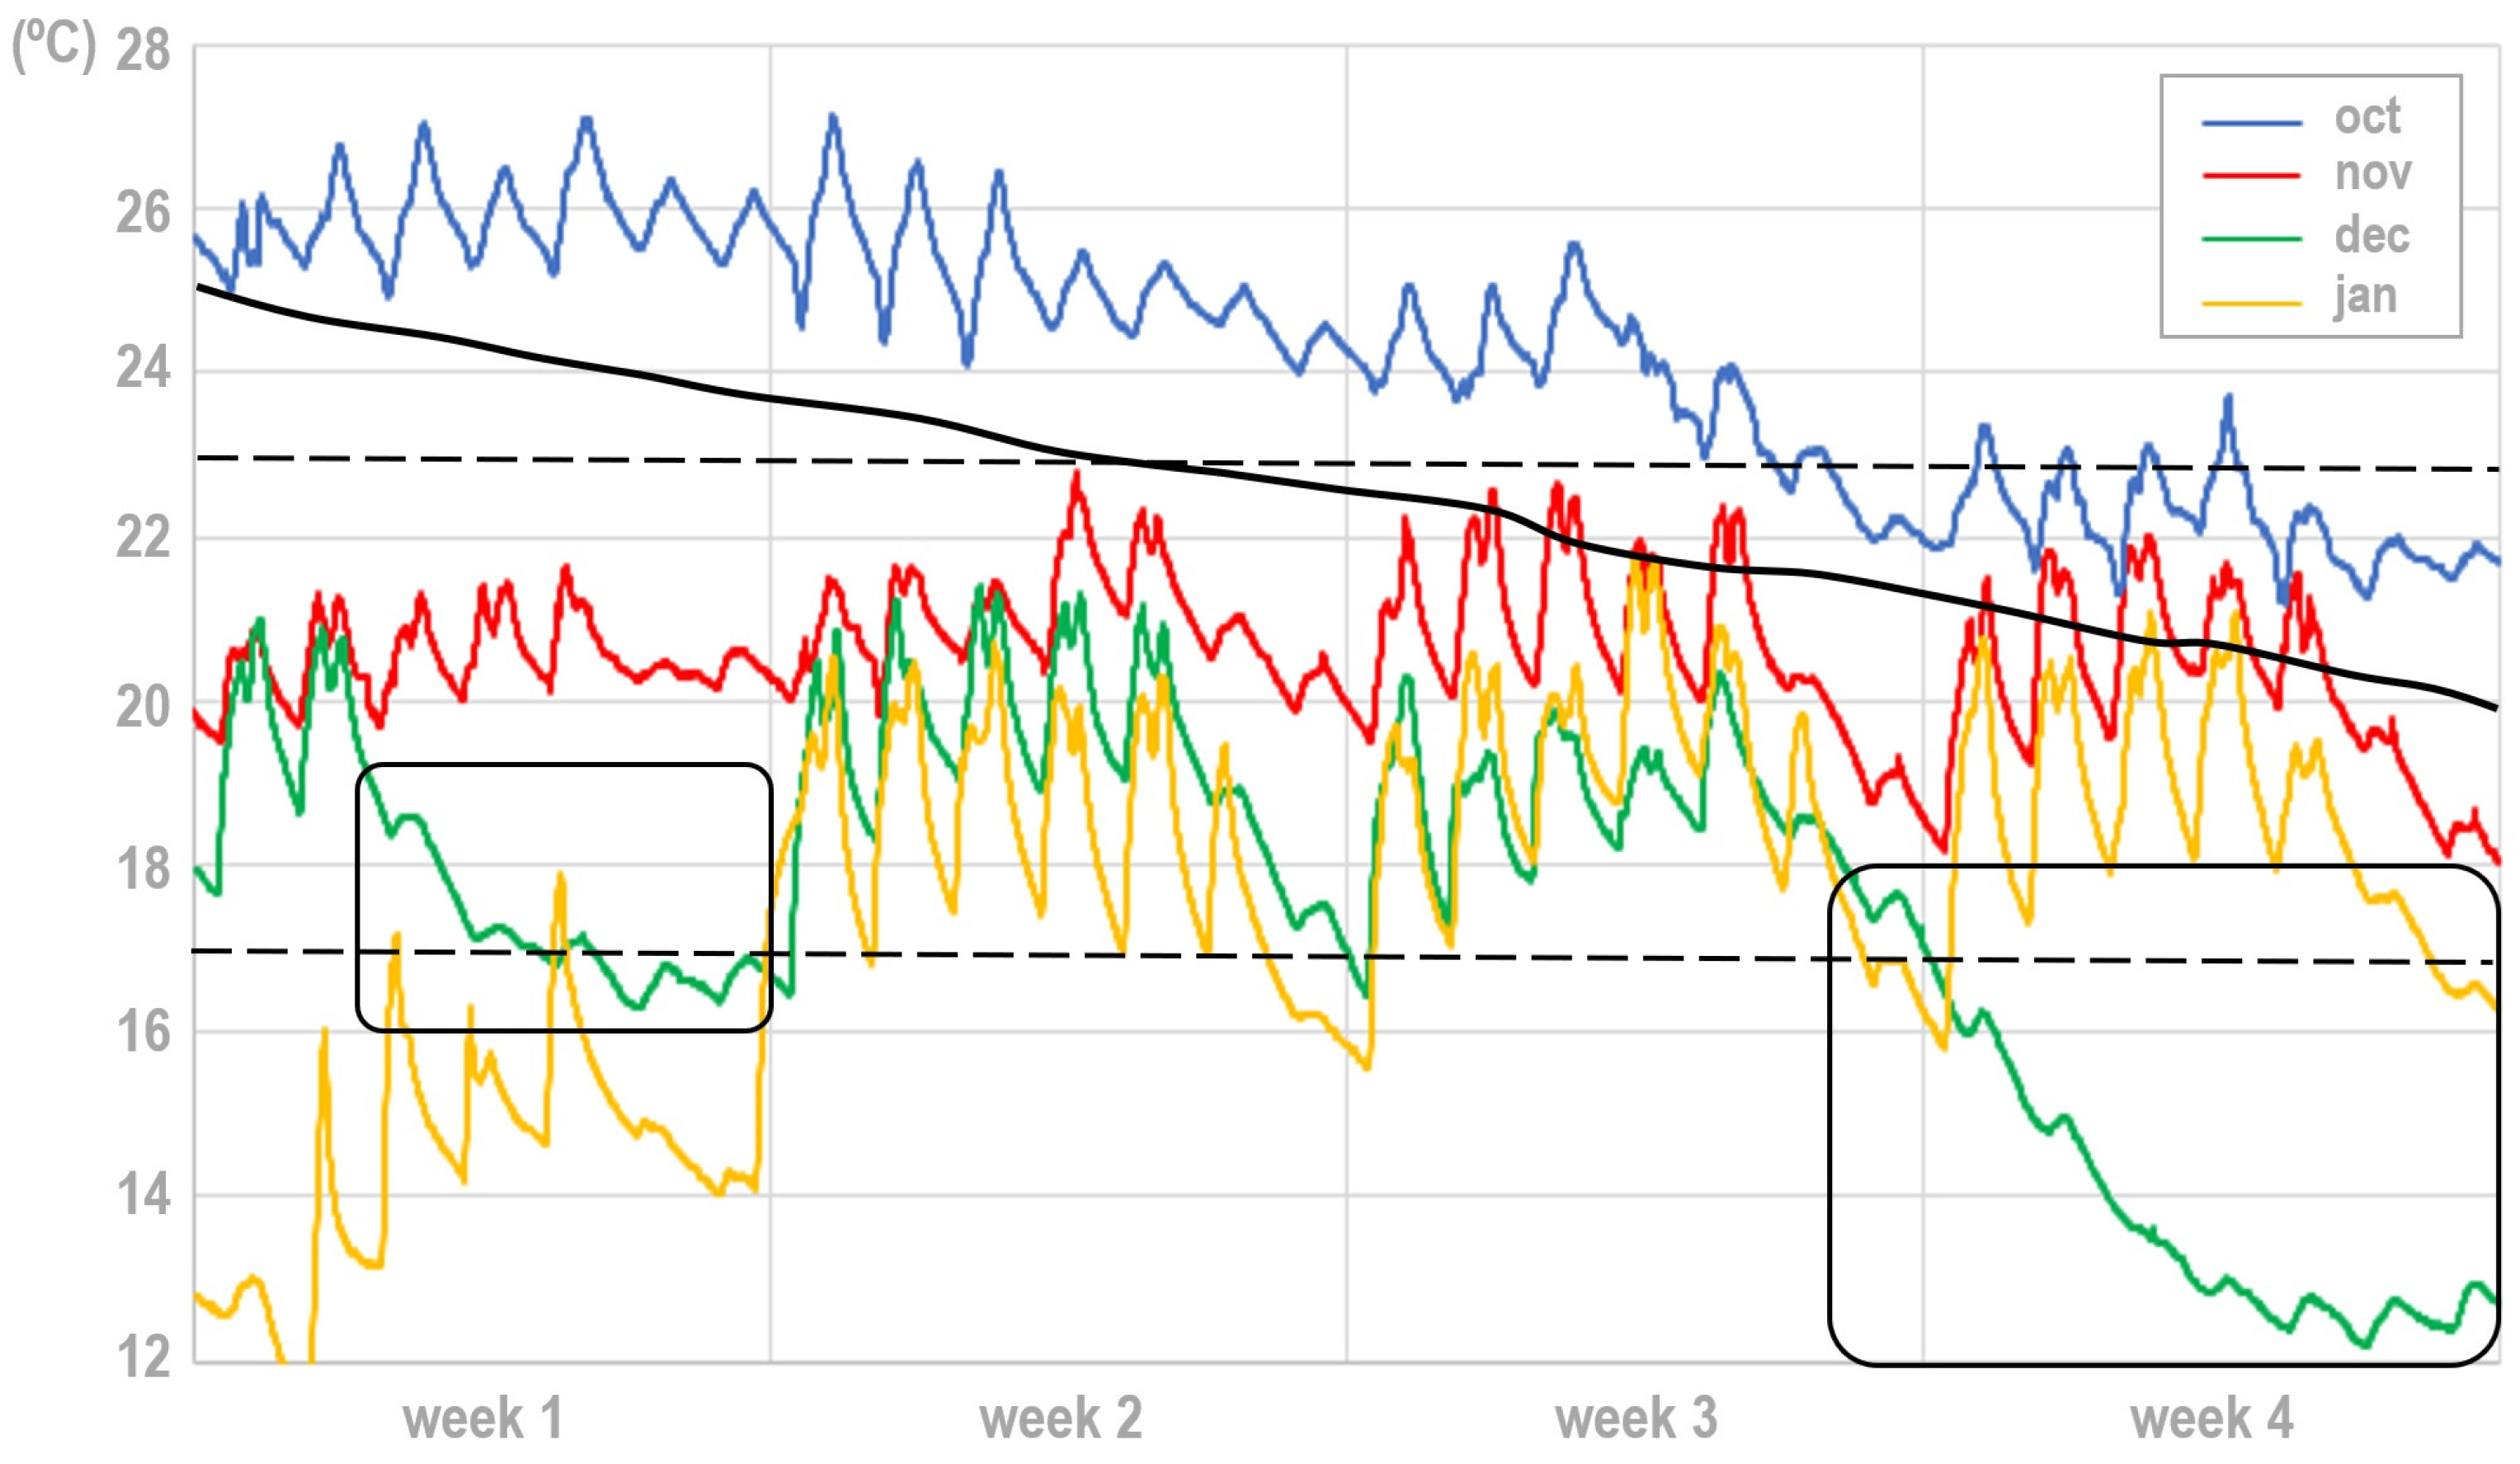
4.1. Analysis of Thermal Evolution
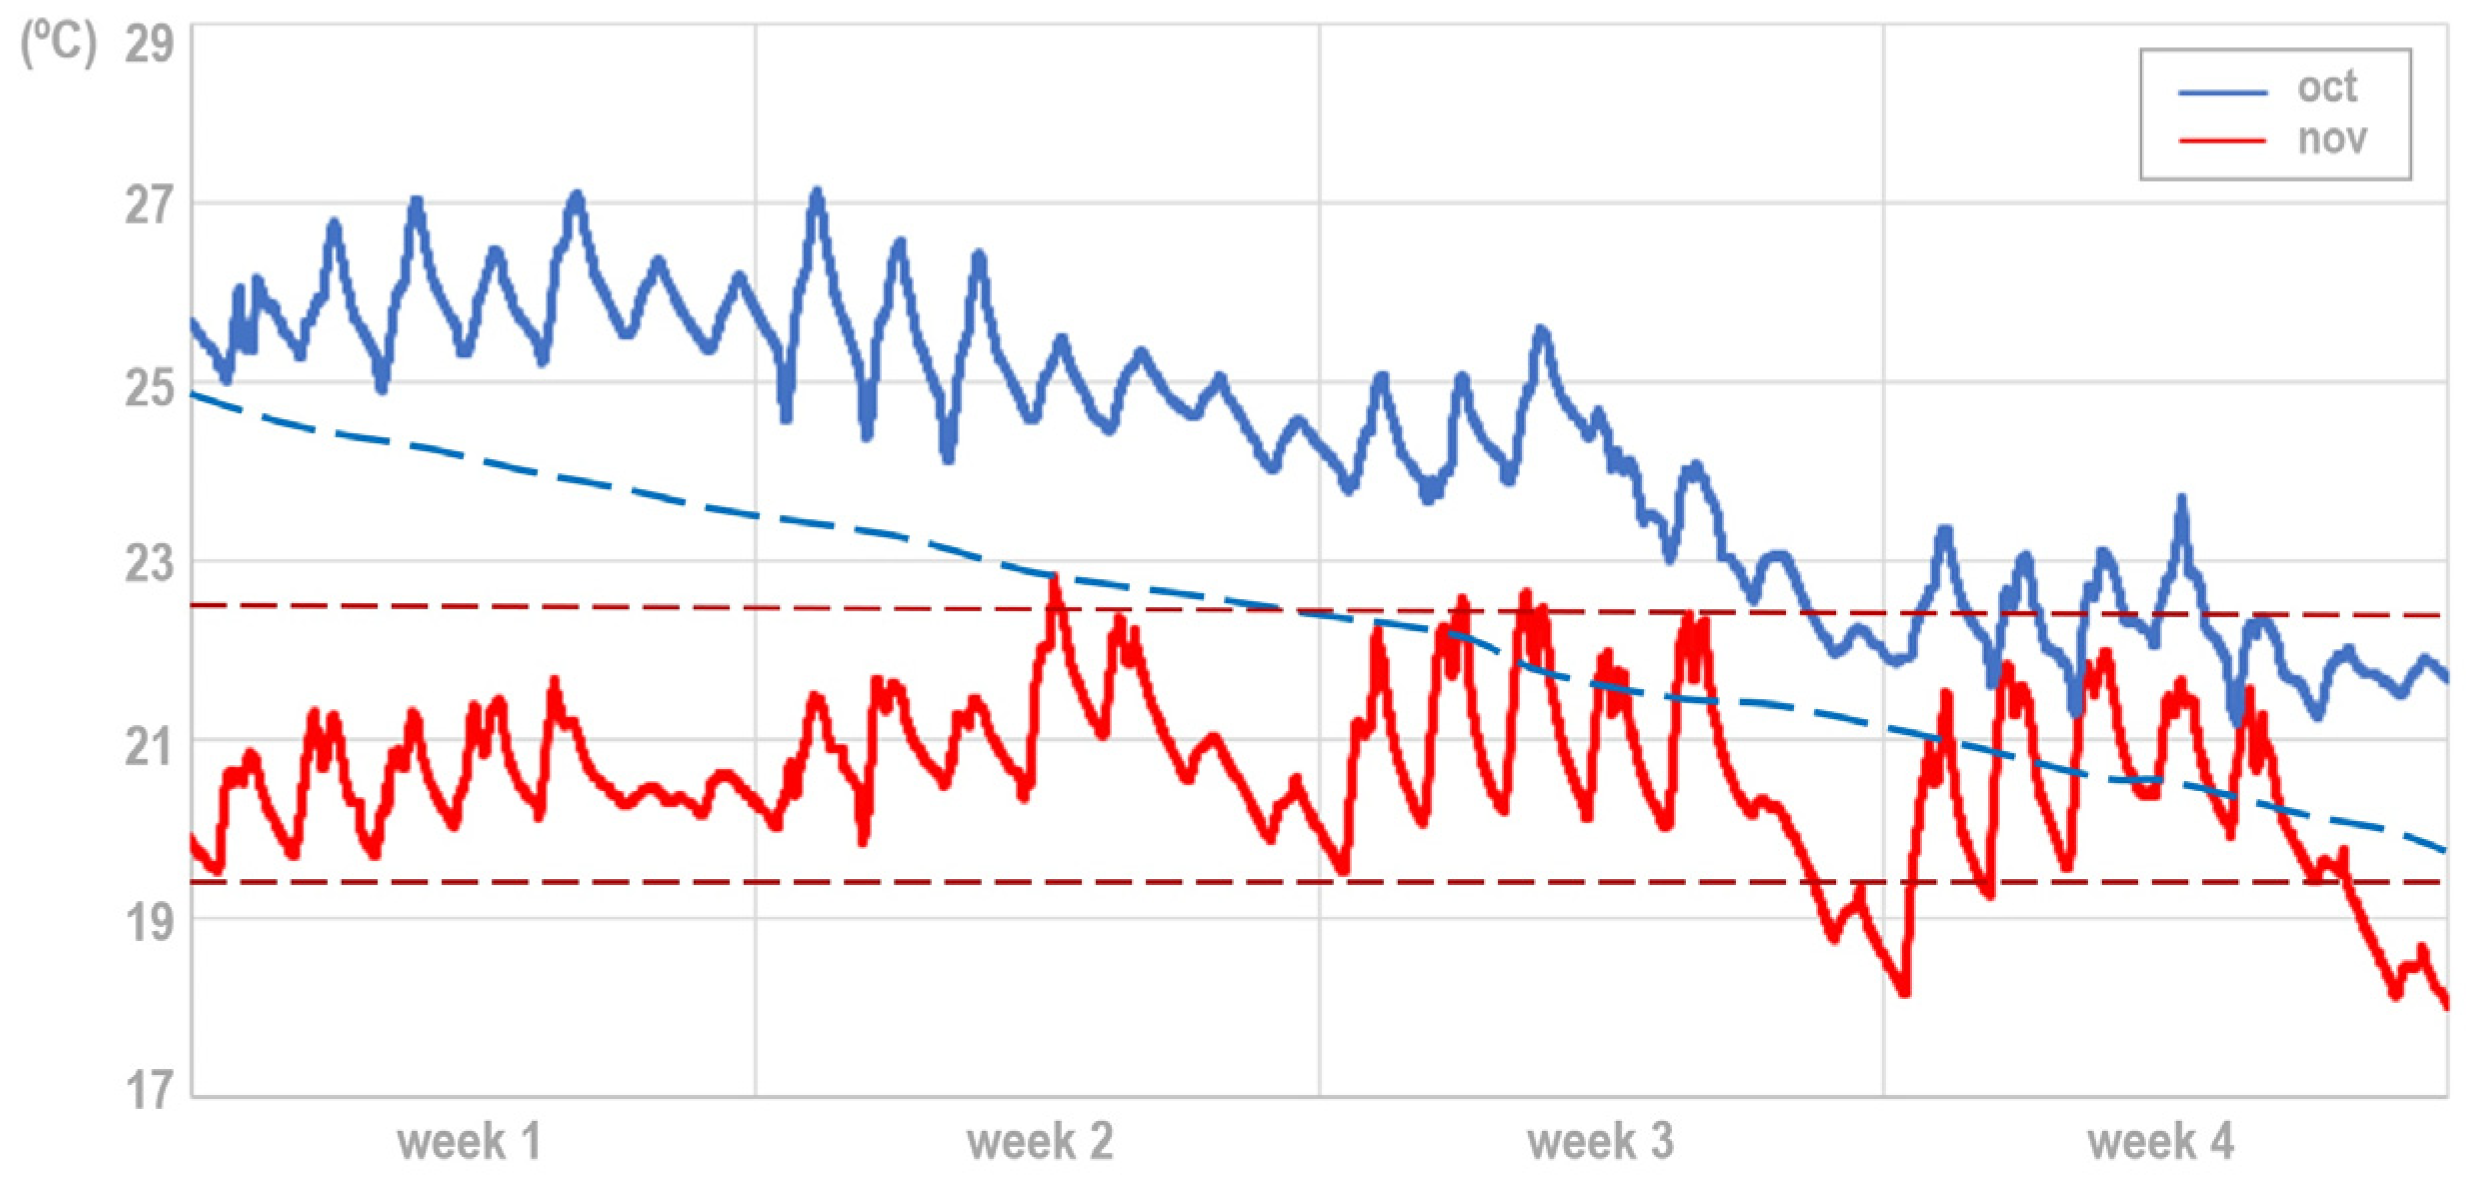
- October temperatures (solid blue curve) exceed 21 °C. This can be attributed to good weather conditions during this month (solid black line) [52], which can be quantified as an average thermal inertia of approximately 2–3 °C above outdoor temperatures;
- With these favourable temperatures, heating is not activated. Subsequently, Section 4.3 compares October (without heating) with the other months (with heating) to analyse the climate behaviour of the building. Furthermore, October (without heating) is chosen in Section 4.4 to analyse the behaviour (net, without heating influence) of indoor temperatures, their evolution, and their morphological characteristics;
- During the other months with heating (red, green, and yellow curves), compared to October without heating (blue curve), the behaviour is more uniform remaining within an approximate range of 6 °C (between 17 °C and 23 °C, the thresholds are marked by the dashed black lines). Additionally, in all cases, each day of the week follows a rise-and-fall pattern, which, weekly, defines a sawtooth behaviour. To understand this phenomenon, is key to study the thermal inertia of the building, see Section 4.2;
- During the months with heating, the drops in average temperatures reveal periods where heating is off. As outlined in black boxes (and analysed in detail in Section 4.2), these correspond to holidays periods (green curve), specifically in week 1 (6–8 December) and week 4 (23–31 December);
- Detailing months with heating, the average temperatures in November (red curve) are higher (by 1–2 °C) compared to December and January (green and yellow curves). As discussed in Section 4.2, this is due to better weather conditions in November;
- Several behaviours related to occupancy stand out (as analysed in Section 4.4). Week 1 of January (yellow curve), shows lower temperatures. This week is non-teaching but still a working period; thus, even though the heating is on, the thermal inertia must recover after many days without heating (since week 4 of December, green curve). This requires the entire week 1 in January to reach the average temperature range of the other months (from 17 °C). Additionally, January (yellow curve) shows the greatest variation between maximum and minimum temperatures. In this campus context, this is explained by the non-teaching period (exams season), which results in lower average occupancy and, consequently, daily temperature drops to lower minimums.
- to compare measurements of the current year with previous years to make experience-based decisions. In Mediterranean climates, the fall season usually alternates cold-dry with warm-wet periods; thus, the results of this work will serve as behaviour patterns on which to adjust pattern-based prediction models;
- to include new measurements (from season to season) into the IoT datasets to incorporate this knowledge into the prediction models and retraining them iteratively to obtain predictions adjusted to climate reality.
4.2. Analysis of Thermal Inertia
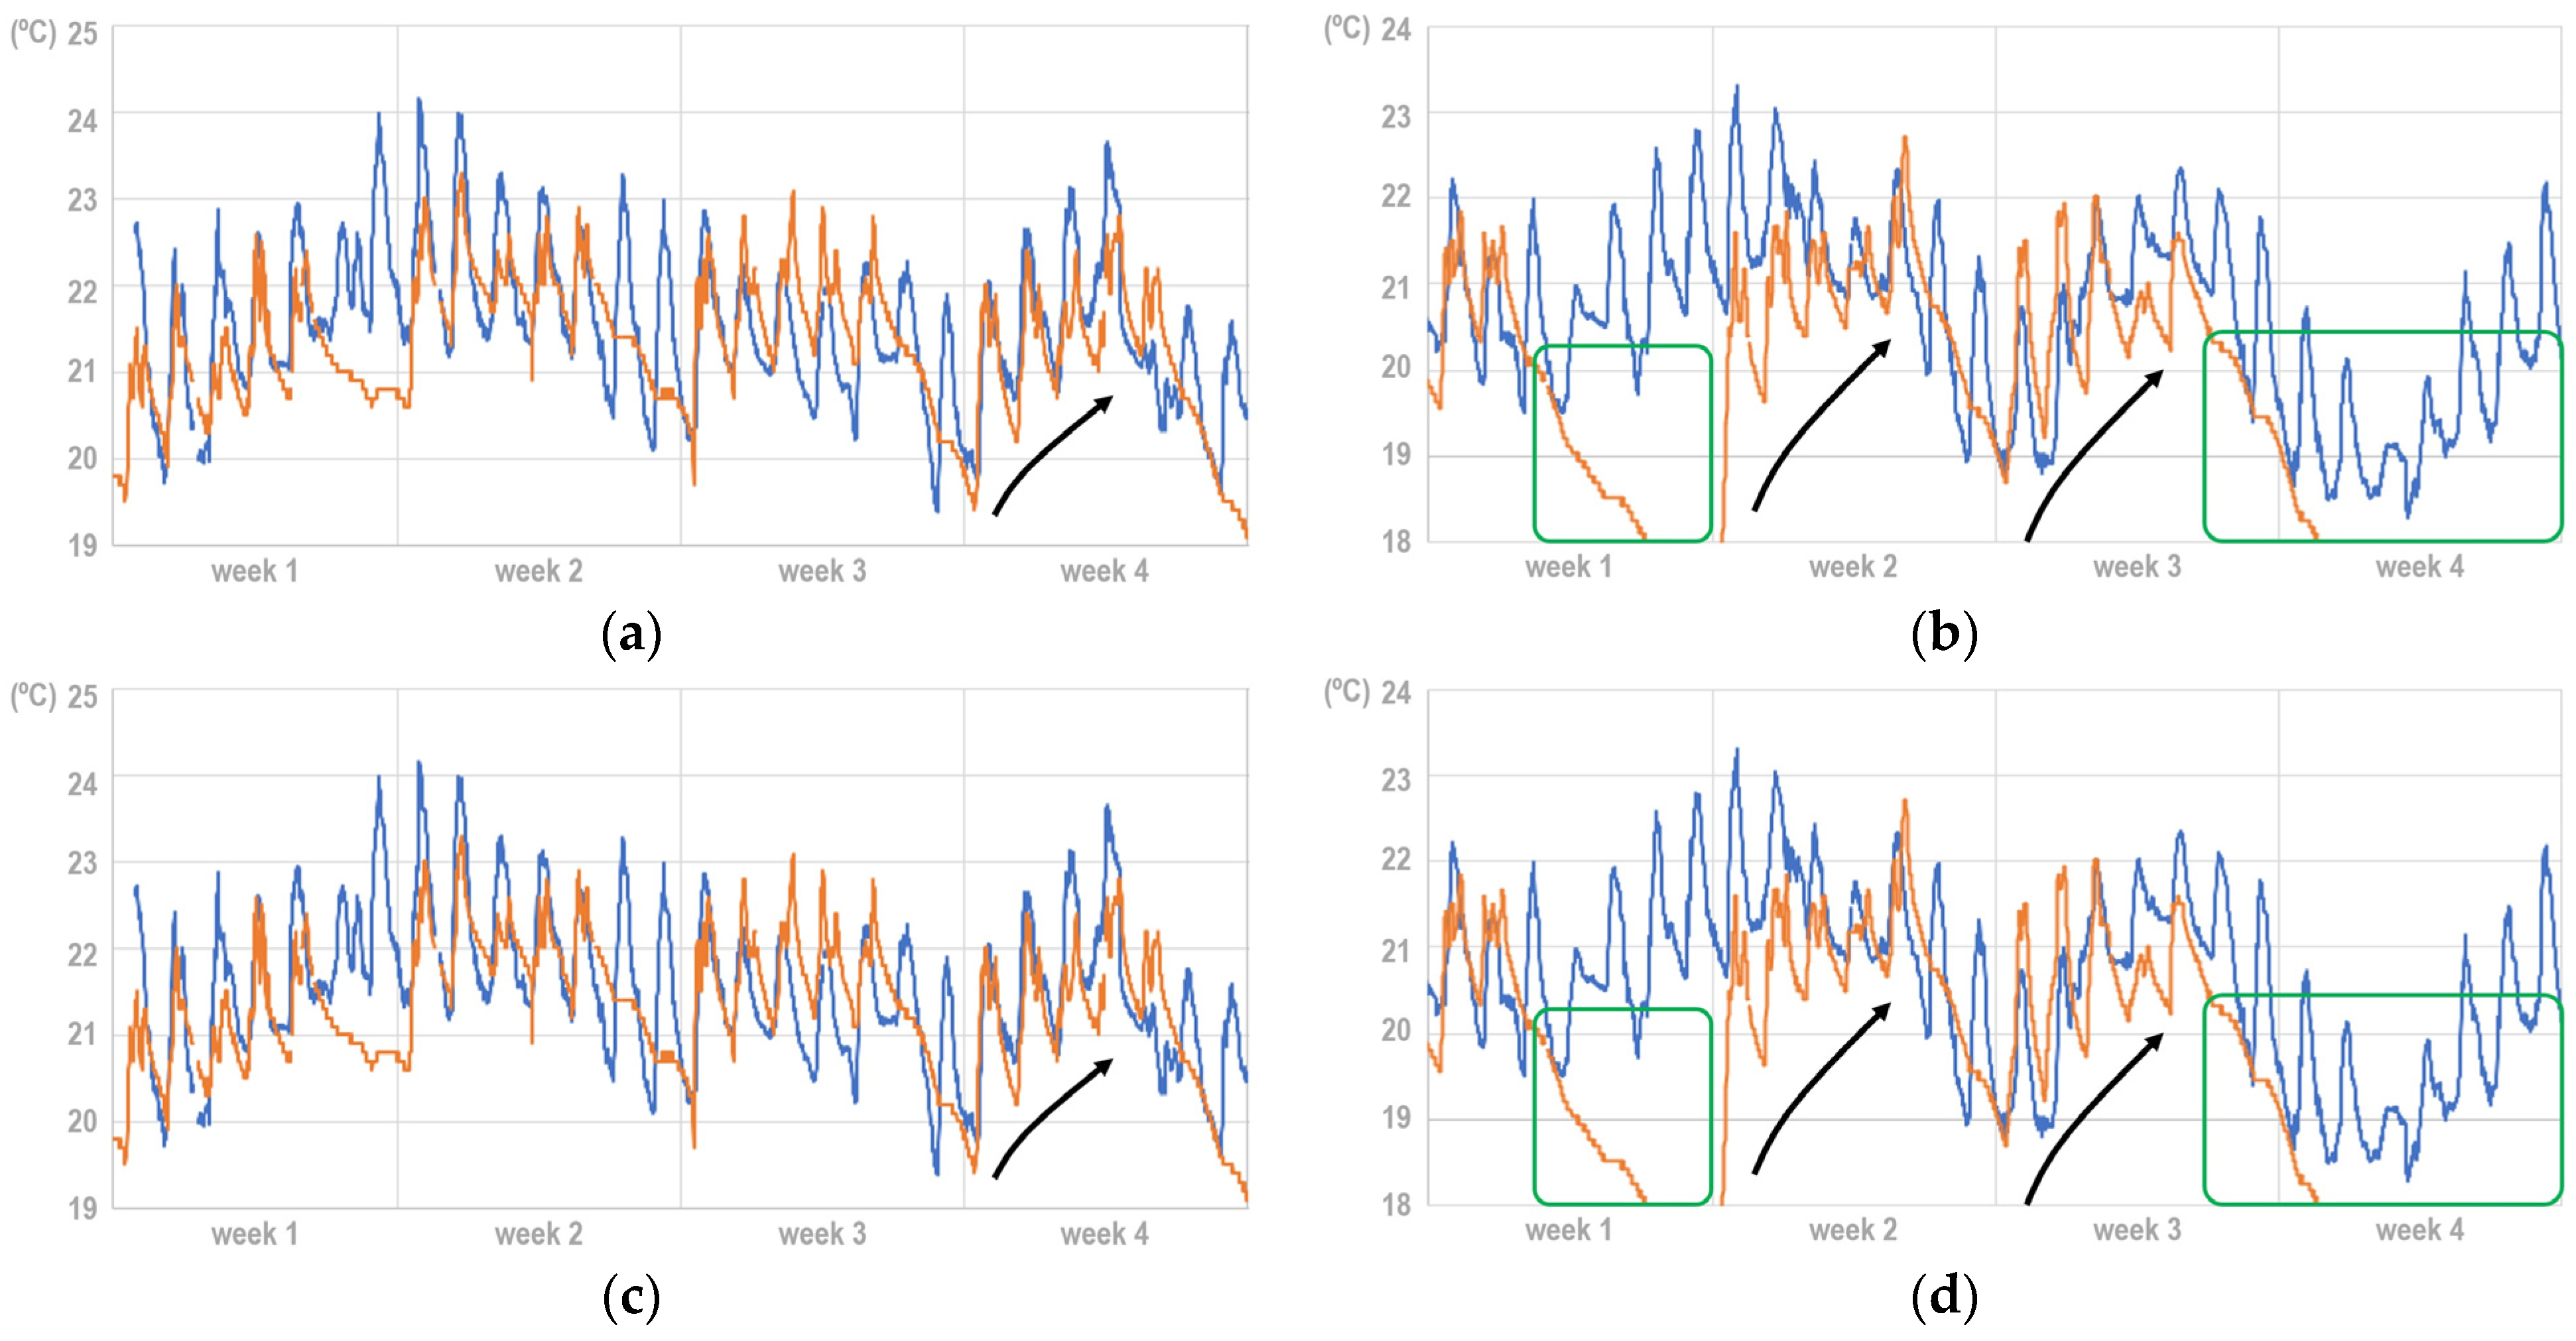
- In November, the weekday temperatures (Monday to Friday) for all weeks show a pattern similar to the evolution of the weather conditions. Over the weekends, the average temperature (orange curve) drops, due to the absence of occupancy and the heating being turned off;
- During week 2 of December, when the weather follows a progressive cooling trend (blue curve), the heating gradually increases the temperatures (orange curve). The predicted effect occurs (black arrows), where the temperatures toward the end of the week surpass those of earlier days due to the thermal inertia. This effect is also observed in week 3, especially in the evolution of minimum temperatures;
- Following this explanation, the sawtooth pattern of progressively rising temperatures as the week progresses is more noticeable when the weather also follows an upward trend, as seen in weeks 3 and 4 of January (black arrows);
- In February, this effect is also observed (black arrows), leading to the conclusion that regardless of weather conditions, heating causes a progressive rise in temperatures (Monday to Friday and cumulatively over the 4 weeks of the month), defined by a sawtooth pattern.
4.3. Analysis of Heating Influence
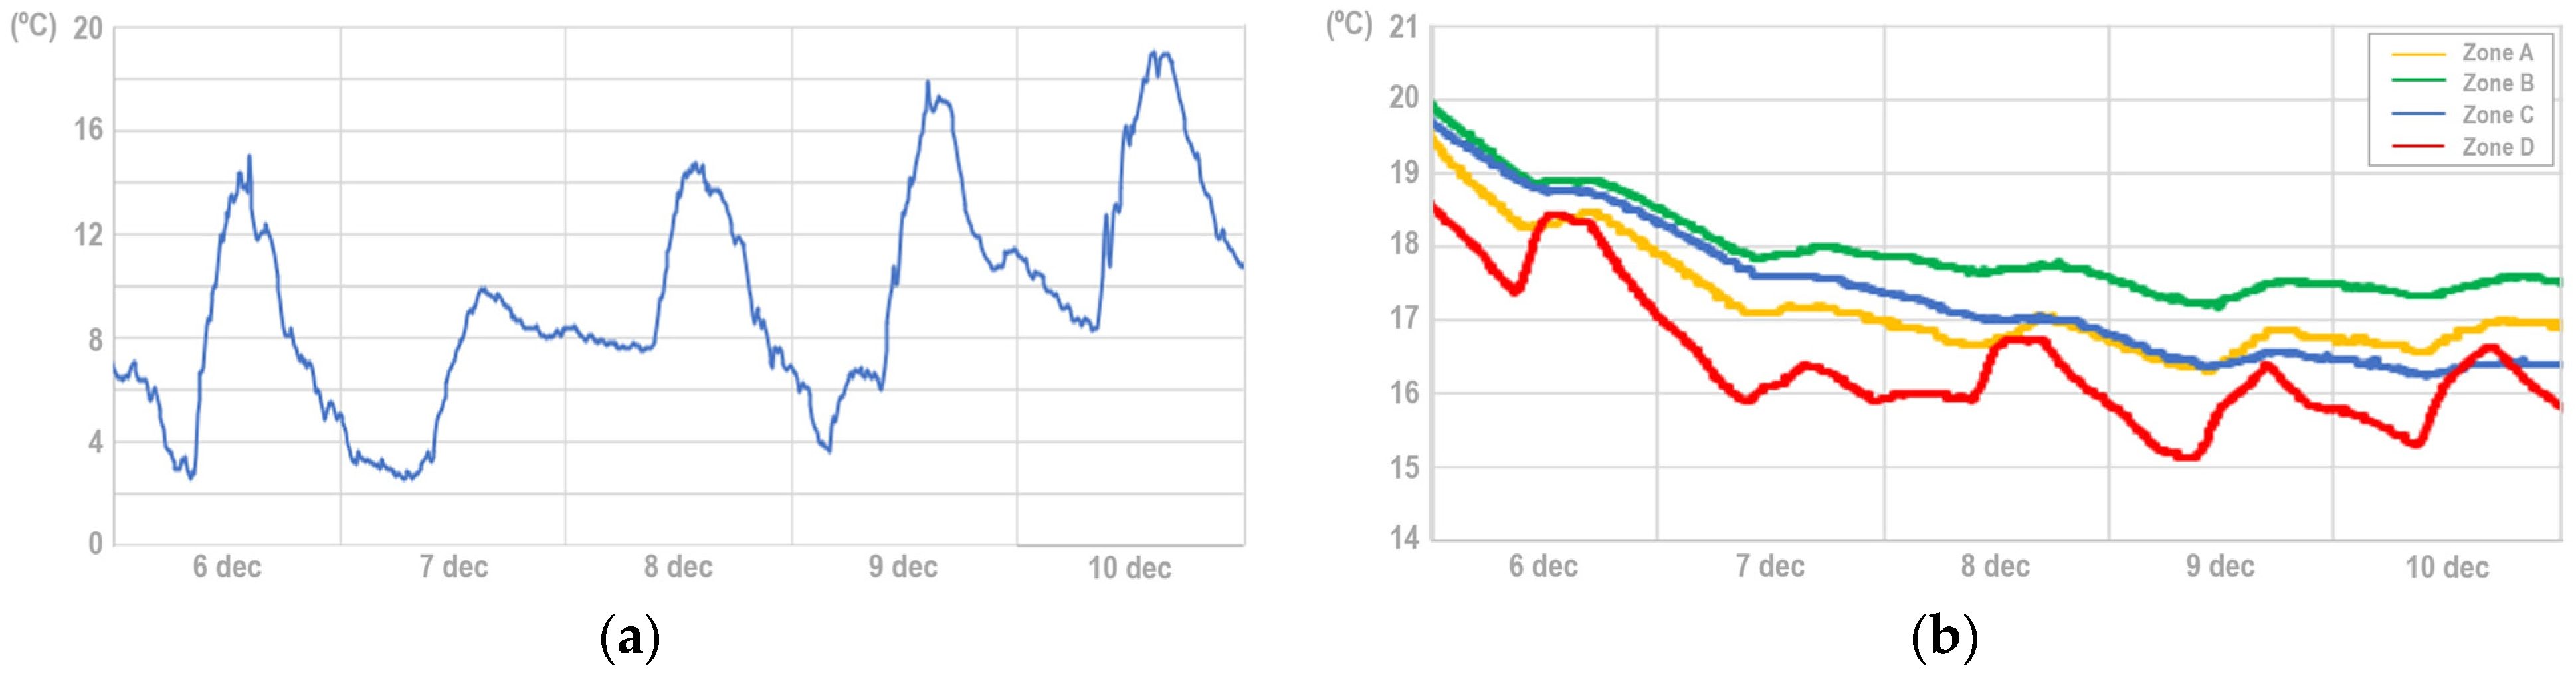
- In October (blue curve), the building temperatures proportionally decrease with the weather pattern (dashed blue curve), as analysed in Section 4.1. However, in November, the building remains within a uniform range between 19.5 and 22.5 °C (dashed red lines) because of heating. Furthermore, as discussed in Section 4.6, this range complies with recommended directives: in winter, indoor temperatures should be between 17 °C and 21 °C, considering thermal comfort to temperatures around 19 °C;
- In November (red curve), as indicated in Section 4.2, heating results in a uniform rise-and-fall pattern throughout a week. In October (blue curve), this pattern is less recognisable because weather conditions become the dominant influencing factor. This leads to an analysis of morphology of thermal behaviour, detailed in Section 4.4.
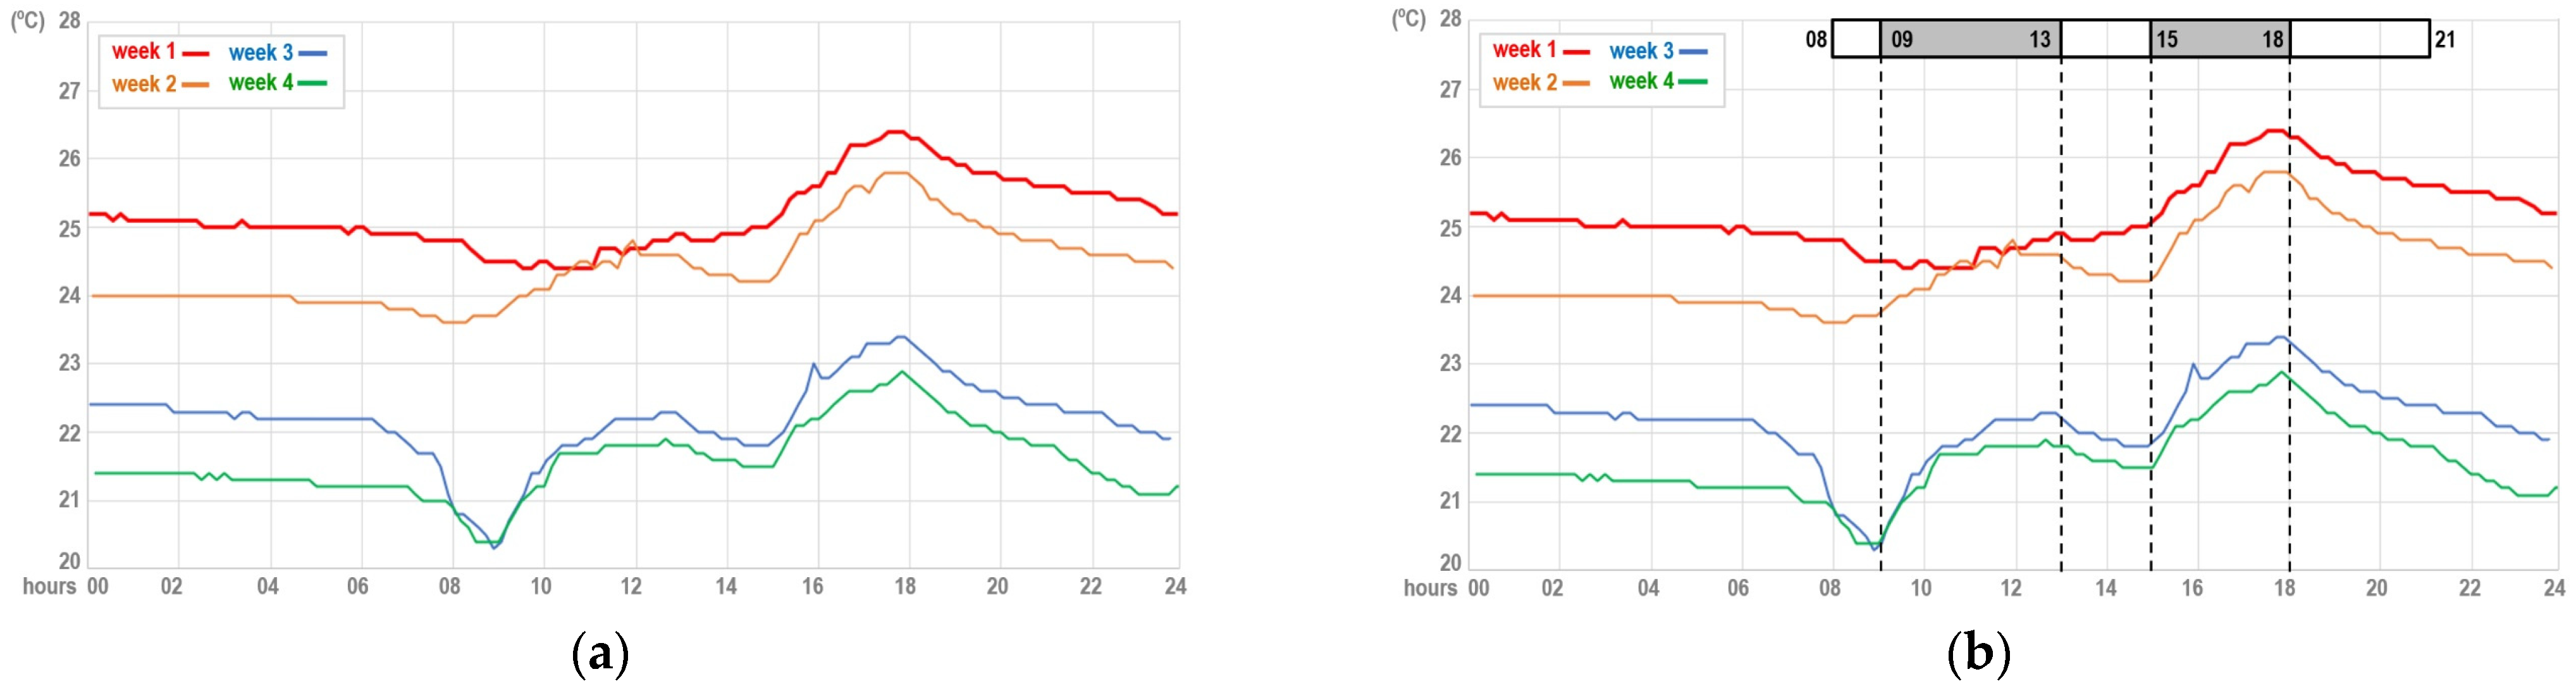
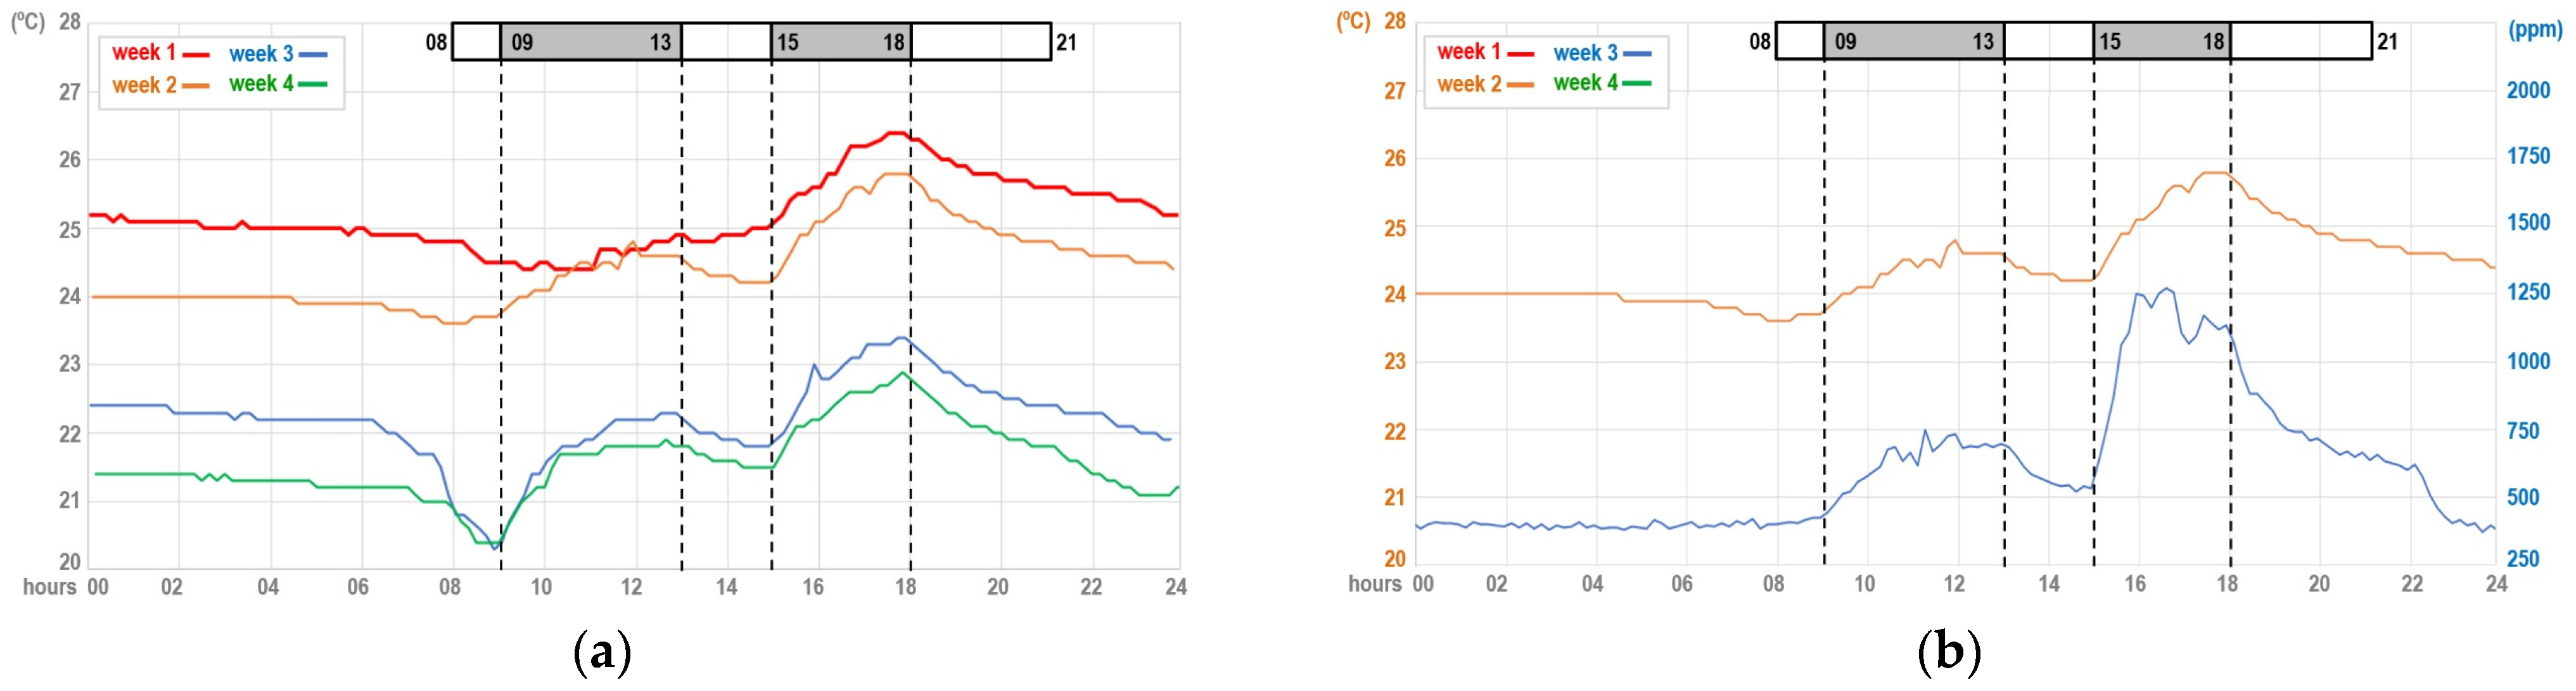
4.4. Analysis of Thermal Morphology
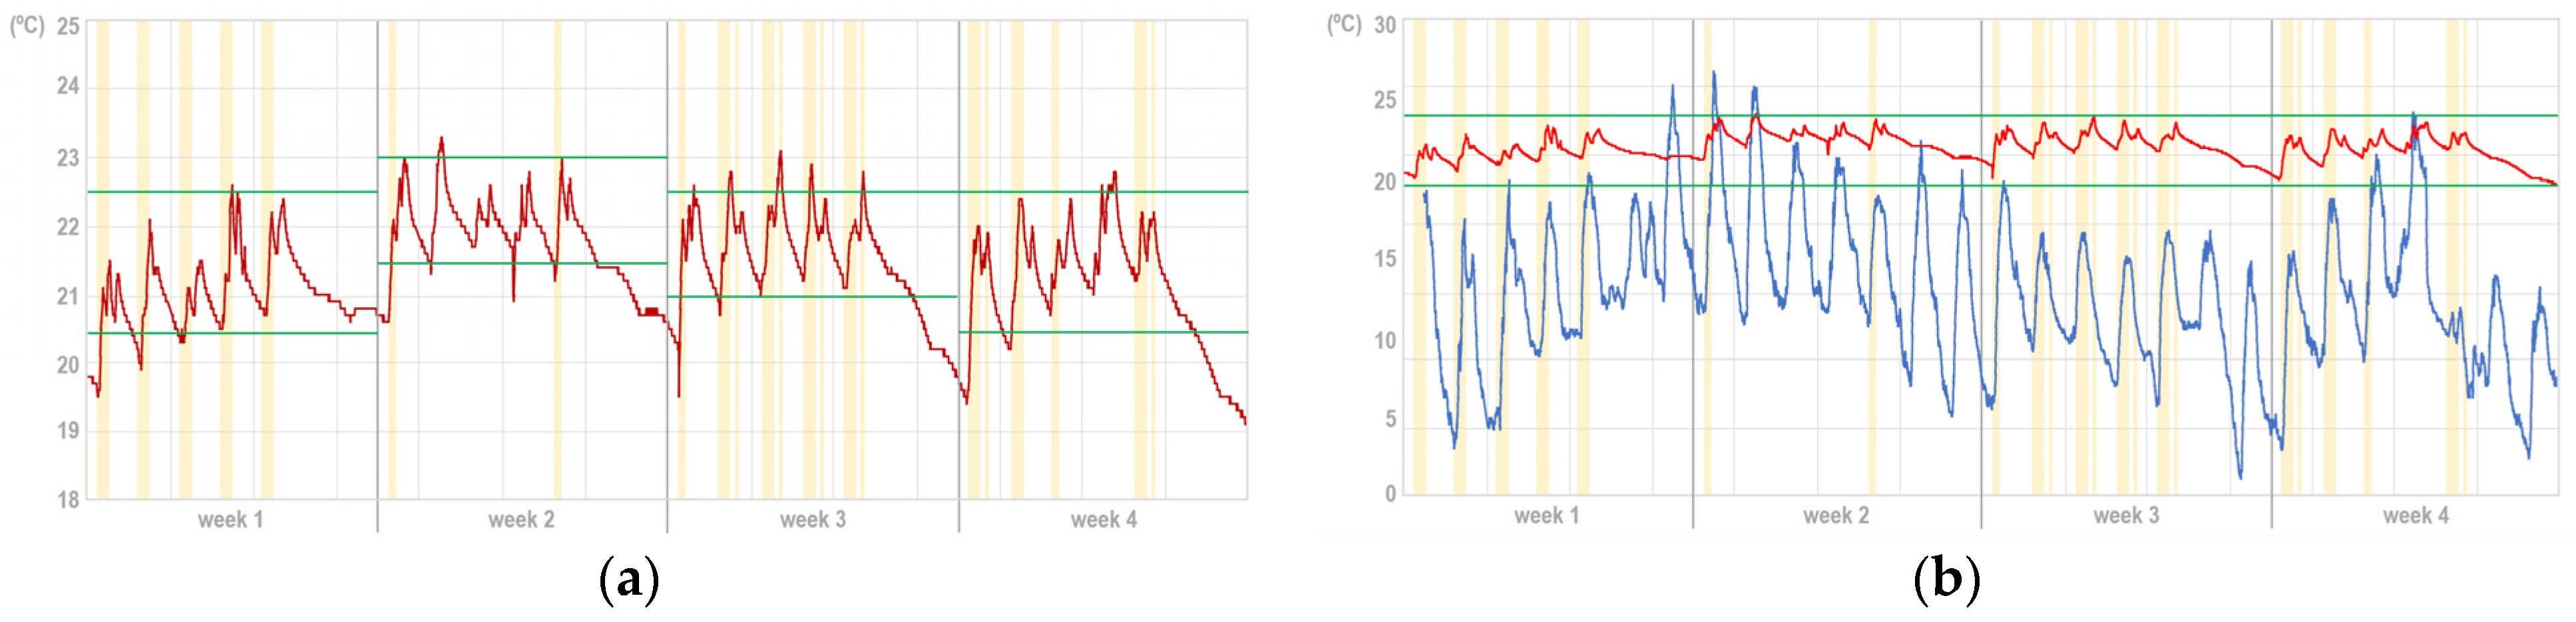
- Initial linear behaviour before the first grey band (start of classes at 9 h);
- Upward behaviour during grey bands (lectures schedule), due to occupancy;
- Downward behaviour after the last grey band (end of classes at 18 h), that stabilises at a level similar to the initial linear behaviour and start of the curve for the following day. The difference between initial and final daily temperatures is modulated by the average building temperature, which is conditioned by the weather conditions, as discussed in Section 4.2 and Section 4.3;
- Downward behaviour between grey bands (can be multiple on a day regarding schedule), related to absence of people. This will be discussed in Section 4.6 by including the relationship with other key variables, as evolution of CO2 levels;
- Several non-pattern behaviours (as downward level at the beginning of the day, previous of first classes), related to unpredictable situations: opening of windows or doors, presence of people out of their schedule, etc. This confirms the interest of understanding the complexity of the SBE, as contributed by this work.
4.5. Analysis of Potential Energy Savings
- Below 17 °C: range when heating should be turned on to achieve thermal comfort. Ideally, percentages should be close to 0%;
- Between 17 and 19 °C: range following EN 16798-1:2019 [51]. Due to comfort sensation rounds 19 °C, this is a restrictive threshold (for energy saving) that, ideally, should be around 50%;
- Between 19 and 21 °C: range of thermal comfort that, ideally, should be around 50%:
- Above 21 °C: range when heating should be turned off. Percentages above 0% mean potential energy savings, as be quantified and discussed in next Section 4.6.
- November shows good weather conditions (average of 9.8 °C). Thus, only D4 and D5 (blue background) remain below 17 °C for less than 5% of time. Most spaces (12 out of 17, bold grey background) comply with the recommended range (17–21°C) for over 40% of time. All spaces (17 out of 17, green/yellow background) exceed 19 °C for more than 50% of time, and more than half (8 out of 17, yellow background) exceeds 21 °C for over 50% of time. Since the comfort threshold (>19 °C) and the recommended threshold (>21 °C) are excessively exceeded, it could indicate an overheating, as will be analysed in Section 4.6;
- December shows cooler conditions (average of 8.2 °C) compared to November (9.8 °C), leading to more hours of heating. Consequently, only A2, D2, D4, and D5 (blue background) remain below 17 °C for less than 3% of time. Nearly all spaces (15 out of 17, bold grey background) comply with the 17–21 °C range for over 60% of time. Almost all spaces (16 out of 17, green/yellow background) exceed 19 °C for more than 50% of time, although only A1 and B2 (2 out of 17, yellow background) exceed 21 °C for over 50% of time. This suggests that heating in December was used more appropriately than in November, although it would be worthwhile to quantify its potential savings, as discussed in Section 4.6;
- January shows even cooler conditions (average of 7.4 °C) compared to December (8.2 °C) and November (9.8 °C), resulting in more spaces (9 out of 17, blue background) falling below 17 °C. Almost all spaces (14 out of 17, bold grey background) comply with the 17–21 °C range for over 75% of time. All spaces (17 out of 17, green/yellow background) exceed 19 °C for more than 50% of time; and, again, only A1 and B2 (2 out of 17, yellow background) exceed 21 °C for over 50% of time. January is also the first month where no spaces record 0% in the 17–19 °C range, meaning all spaces comply with the 17–21 °C range for most of the time (grey background). Overall, these January values are similar to those of December, which should be validated through the economic analysis in Section 4.6;
- February shows the warmest weather conditions (average of 10.3 °C), resulting in higher temperatures across all spaces. Very few spaces (only D2, D3, D4, and D5, and always less than 5%) fall below 17 °C (blue background). For most of the time (over 90%), all spaces are above 19 °C (green/yellow background). However, most of the time (only A1 exceeds 50%, bold grey background) it does not comply with the 17–21 °C range. Consequently, all spaces (17 out of 17, yellow background) exceed 21 °C for over 45% of time, with most (14 out of 17) over 60% of time. These results highlight the potential energy savings from heating management (turning it off during appropriate hours) and avoiding overheating on warmer days, as will be demonstrated in Section 4.6.
4.6. Analysis of Economic Impact
- From Table 3, the percentage of time in the bottom row (>21 °C) was converted into hours, completing the second column (time) of Table 4. This indicates the total hours above 21 °C (first row, yellow background) and provides a breakdown in 1 °C increments to estimate the potential savings with each additional degree due to heating;
- The IoT system monitored the energy consumed during each hour over 21 °C, and the cumulative value (MWh) is displayed in the third column (energy) of Table 4;
- Finally, the fifth column (economic cost) of Table 4 presents the result of multiplying the third and fourth columns, providing an estimate of the potential economic savings that could be achieved by managing the heating to comply with recommended threshold (not exceeding >21 °C, first row, yellow background).
- November. Temperatures exceed 21 °C (with heating on) for 29.9 h, where half (15.7 h) corresponds to the first degree (21–22 °C), monitored as 7.92 MWh. It means (estimating an average energy cost of 63.44 EUR/MWh) a potential savings of over EUR 500.
- December. Temperatures exceed 21 °C (with heating on) for 18.6 h, where the majority (12.3 h) corresponds to the first degree (21–22 °C), monitored as 5.13 MWh. It means (estimating an average energy cost of 72.19 EUR/MWh) a potential savings around EUR 370. As already noted in Section 4.5, in December, heating was used more appropriately (compared to November), as now quantitative demonstrated.
- January. Temperatures exceed 21 °C (with heating on) for 16.5 h, where majority (12.6 h) corresponds to the first degree (21–22 °C), monitored as 4.49 MWh. It means (estimating an average energy cost of 74.09 EUR/MWh) a potential savings around EUR 330. These values are similar to December, as noted in Section 4.5.
- February. Temperatures exceed 21 °C (with heating on) for 92.8 h, monitored as 25.08 MWh: the highest value, as noted in Section 4.5. However, the estimation in February of average energy cost decreased to 39.93 EUR/MWh, which represents an estimated economic cost around EUR 1000. Even so, it means a significant potential savings.
5. Discussion
- When the heating is off, evolution of temperatures directly depends on weather conditions, following a thermal inertia around 2–3 °C above outdoor temperatures.
- When the heating is on, the building behaviour remains uniform in a range of approx. 6 °C. Thus, analysis of thermal evolution allows for the characterisation of working days (by monitoring their up-down trends which define sawtooth patterns), and identification of festive periods (by identifying significant drops in temperatures), even detecting anomalous situations (such as the opening of windows or doors, typical of public buildings).
- Thermal performance exhibits a characteristic morphology (regarding occupancy) with: linear behaviour (before occupancy), upward behaviour (due to occupancy), downward behaviour (after occupancy, that stabilises at a level similar to the initial linear behaviour), downward behaviour (between occupancy schedule, related to absence of people), and several non-pattern behaviours (related to unpredictable situations, as presence of people out of their schedule, detected by increasing CO2 levels).
- Analysis of time percentages when temperatures fulfil the recommended thresholds (between 17, 19, and 21 °C) shows that majority of monitored spaces (out of 17; 12 in November, 15 in December, 14 in January) comply with the directives (17–21 °C) for most of the time (+40% in November, +60% in December, +75% in January). This is not the case in February since all spaces (17 of 17) exceed 21 °C more than 45% of the time (the majority, 14 of 17, +60%). This excess (>21 °C) is lower in previous months (out of 17, +50% of time: 8 in November, and only 2 in December and January).
6. Conclusions
Author Contributions
Funding
Institutional Review Board Statement
Informed Consent Statement
Data Availability Statement
Acknowledgments
Conflicts of Interest
References
- European Court of Auditors (ECA). Special Report. Energy Efficiency in Buildings: More Emphasis on Profitability. 2020. Available online: https://www.eca.europa.eu/Lists/ECADocuments/SR20_11/SR_Energy_efficiency_in_buildings_ES.pdf (accessed on 20 December 2024).
- EU Council. Executive Conclusions. Building a Sustainable Europe by 2030. Progress Thus Far and Next Steps. 2019. Available online: https://www.consilium.europa.eu/media/41693/se-st14835-en19.pdf (accessed on 20 December 2024).
- European Commission. Renovation Wave. In Renovating the EU Building Stock Will Improve Energy Efficiency While Driving the Clean Energy Transition; European Commission: Brussels, Belgium, 2020. Available online: https://energy.ec.europa.eu/topics/energy-efficiency/energy-efficient-buildings/renovation-wave_en (accessed on 20 December 2024).
- European Commission. Focus: Energy Efficiency in Buildings; European Commission: Brussels, Belgium, 2020. Available online: https://ec.europa.eu/info/news/focus-energy-efficiency-buildings-2020-lut-17_en (accessed on 20 December 2024).
- European Commission. Spanish Climate Neutrality Strategy. Available online: https://ec.europa.eu/clima/sites/lts/lts_es_es.pdf (accessed on 20 December 2024).
- United Nations. Climate Change. Kioto Protocol. Available online: https://unfccc.int/kyoto_protocol (accessed on 20 December 2024).
- European Commission. Energy, Climate Change and Environment. Paris Agreement. Available online: https://www.consilium.europa.eu/en/policies/paris-agreement-climate/ (accessed on 20 December 2024).
- European Union. Energy First Initiative. Available online: https://enefirst.eu/definitions/ (accessed on 20 December 2024).
- European Union. Directive 2002/91/EC of the European Parliament and of the Council 16 Dec 2002 on the Energy Performance of Buildings. Available online: https://eur-lex.europa.eu/legal-content/EN/ALL/?uri=CELEX%3A32002L0091 (accessed on 20 December 2024).
- European Union. Directive 2010/31/EU of the European Parliament and of the Council 19 May 2010 on the Energy Performance of Buildings (Recast). Available online: https://eur-lex.europa.eu/legal-content/EN/ALL/?uri=CELEX%3A32010L0031 (accessed on 20 December 2024).
- European Union. Directive 2012/27/EU of the European Parliament and of the Council 25 Oct 2012 on Energy Efficiency, Amending Directives 2009/125/EC and 2010/30/EU and Repealing Directives 2004/8/EC and 2006/32/EC. Available online: https://eur-lex.europa.eu/legal-content/EN/ALL/?uri=celex%3A32012L0027 (accessed on 20 December 2024).
- Spanish Government. Building Technical Code (in Spain, Código Técnico Edificación, CTE). Updated in 2009 Through RDL 1826/2009. Available online: https://www.boe.es/eli/es/rd/2009/11/27/1826/con (accessed on 20 December 2024).
- European Union. Directive 2024/1275/EU of the European Parliament and of the Council 24 Apr 2024 on the Energy Performance of Buildings (Recast). Available online: https://eur-lex.europa.eu/legal-content/ES/TXT/?uri=OJ%3AL_202401275 (accessed on 20 December 2024).
- UNE-EN ISO 52120-1:2022; Energy Performance of Buildings—Contribution of Building Automation, Controls and Building Management. ISO: Geneva, Switzerland, 2021. Available online: https://www.iso.org/standard/65883.html (accessed on 20 December 2024).
- UNE 178108:2017; Smart Cities. Requirements for the Application of UNE 178104 to Smart Buildings. UNE: Madrid, Spain, 2017. Available online: https://www.une.org/encuentra-tu-norma/busca-tu-norma/norma?c=N0059483 (accessed on 20 December 2024).
- UNE 178104:2017; Comprehensive Systems for a Smart City Management. Requirements of Interoperability for a Smart City Platform. UNE: Madrid, Spain, 2017. Available online: https://www.une.org/encuentra-tu-norma/busca-tu-norma/norma/?c=N0059471 (accessed on 20 December 2024).
- Cross, T.B.; Gouin, M.D. Intelligent Buildings: Strategies for Technology and Architecture; Dow Jones-Irwin: Homewood, IL, USA, 1986; 233p, ISBN 978-0870946677. [Google Scholar]
- IoT Business News. How IoT is Revolutionizing Building Management Systems. 2024. Available online: https://iotbusinessnews.com/2024/09/26/70780-how-iot-is-revolutionizing-building-management-systems/ (accessed on 20 December 2024).
- Vassiliades, C.; Vardopoulos, I.; Savvides, A.; Barone, G. Enhancing Energy Efficiency in Mediterranean Residential Buildings: The Role of Double Façades and Photovoltaic Systems. In Proceedings of the 2024 3rd International Conference on Energy Transition in the Mediterranean Area (SyNERGY MED), Limassol, Cyprus, 21–23 October 2024; pp. 1–6. [Google Scholar] [CrossRef]
- Abdul Mujeebu, M.; Bano, F. Integration of passive energy conservation measures in a detached residential building design in warm humid climate. Energy 2022, 255, 124587. [Google Scholar] [CrossRef]
- Cengiz, K. Optimizing Energy Efficiency in Smart Buildings Through Intelligent HVAC Control Systems. In Proceedings of the 8th International Symposium on Multidisciplinary Studies and Innovative Technologies (ISMSIT 2024), Ankara, Turkey, 7–9 November 2024. [Google Scholar] [CrossRef]
- Tang, J.; Sha, L.; Sun, H.; Zhang, W. Optimizing energy efficiency in buildings’ cold-water systems: A differential pressure control-based global approach. Energy Build. 2025, 327, 115108. [Google Scholar] [CrossRef]
- Citadini de Oliveira, C.; Catão Martins Vaz, I.; Ghisi, E. Retrofit strategies to improve energy efficiency in buildings: An integrative review. Energy Build. 2024, 321, 114624. [Google Scholar] [CrossRef]
- Arowoiya, V.A.; Moehler, R.C.; Fang, Y. Digital twin technology for thermal comfort and energy efficiency in buildings: A state-of-the-art and future directions. Energy Built Environ. 2024, 5, 641–656. [Google Scholar] [CrossRef]
- Bienvenido-Huertas, D.; Rubio-Bellido, C.; Pérez-Fargallo, A.; Pulido-Arcas, J.A. Energy saving potential in current and future world-built environments based on the adaptive comfort approach. J. Clean. Prod. 2020, 249, 119306. [Google Scholar] [CrossRef]
- Costa, M.L.; Freire, M.R.; Kiperstok, A. Strategies for thermal comfort in university buildings. Case of the faculty of architecture at the Federal University of Bahia, Brazil. J. Environ. Manag. 2019, 239, 114–123. [Google Scholar] [CrossRef] [PubMed]
- Sayed, A.; Himeur, Y.; Bensaali, F.; Amira, A. Artificial intelligence with IoT for energy efficiency in buildings. In Emerging Real-World Applications of Internet of Things; CRC Press: Boca Raton, FL, USA, 2022; pp. 233–252. [Google Scholar] [CrossRef]
- International Council for Research and Innovation in Building and Construction (CIB). Available online: https://cibworld.org/ (accessed on 20 December 2024).
- Steiner, P. C.S. Peirce and Artificial Intelligence: Historical Heritage and (New) Theoretical Stakes. In Philosophy and Theory of Artificial Intelligence; Springer: Berlin/Heidelberg, Germany, 2013; pp. 265–276. [Google Scholar] [CrossRef]
- Cornely, K.; Ascensão, G.; Ferreira, V.M. A Case Study on Integrating an Eco-Design Tool into the Construction Decision-Making Process. Appl. Sci. 2024, 14, 10583. [Google Scholar] [CrossRef]
- Abram, D. Depth Ecology. In The Encyclopedia of Religion and Nature; Taylor, B., Ed.; Continuum: London, UK, 2005. [Google Scholar] [CrossRef]
- Chen, Y.; Wu, W.; Li, J. Adaptive Attention-Enhanced Yolo for Wall Crack Detection. Appl. Sci. 2024, 14, 7478. [Google Scholar] [CrossRef]
- Giorio, M.; Paparella, R. A Methodology to Improve Energy Efficiency and Sustainability in Urban Environments. Appl. Sci. 2023, 13, 9745. [Google Scholar] [CrossRef]
- Alexander, C. A Pattern Language; Oxford University Press: Oxford, UK, 1980. [Google Scholar]
- Ingold, T. Building, dwelling, living: How animals and people make themselves at home in the world. In The Perception of the Environment; Routledge: London, UK, 2012; pp. 57–80, Shifting contexts. [Google Scholar]
- Serón, F.J. Cartografía de las Ideas Actuales Sobre las Máquinas Inteligentes; University Zaragoza Press: Zaragoza, Spain, 2023. [Google Scholar]
- Jordanous, A. Intelligence without Representation: A Historical Perspective. Systems 2020, 8, 31. [Google Scholar] [CrossRef]
- Brooks, R.A. Intelligence without representation. Artif. Intell. 1991, 47, 139–159. [Google Scholar] [CrossRef]
- Segundo-Ortin, M.; Calvo, P. Plant sentience? Between romanticism and denial: Science. Anim. Sentience 2023, 8, 1. [Google Scholar] [CrossRef]
- Wohlleben, P. The Hidden Life of Trees: What They Feel, How They Communicate; Penguin Allen Lane: London, UK, 2016. [Google Scholar]
- Sopory, S.K. Sensory Biology of Plants; Springer: Berlin/Heidelberg, Germany, 2019. [Google Scholar]
- Sternberg, R.J.; Chowkase, A.; Parra-Martinez, F.A.; Landy, J. Criterion-Referenced Assessment of Intelligence as Adaptation to the Environment: Is It Possible, Plausible, or Practical? J. Intell. 2022, 10, 57. [Google Scholar] [CrossRef] [PubMed]
- Trewavas, A. Green plants as intelligent organisms. Trends Plant Sci. 2005, 10, 413–419. [Google Scholar] [CrossRef] [PubMed]
- Baluška, F.; Lev-Yadun, S.; Mancuso, S. Swarm intelligence in plant roots. Trends Ecol. Evol. 2010, 25, 682–683. [Google Scholar] [CrossRef] [PubMed]
- Latour, B.; Schultz, M. On the Emergence of an Ecological Class: A Memo; Wiley: Hoboken, NJ, USA, 2022; ISBN 978-1-509-55507-9. [Google Scholar]
- Moe, K. Lnsulating Modernism Lsolated and Non-Isolated Thermodynamics in Architecture; Birkhäuser Verlag AG: Basel, Switzerland, 2014. [Google Scholar]
- Martínez, I.; Zalba, B.; Trillo-Lado, R.; Blanco, T.; Cambra, D.; Casas, R. Internet of Things (IoT) as Sustainable Development Goals (SDG) Enabling Technology towards Smart Readiness Indicators (SRI) for University Buildings. Sustainability 2021, 13, 7647. [Google Scholar] [CrossRef]
- Cano-Suñén, E.; Martínez, I.; Fernández, Á.; Zalba, B.; Casas, R. Internet of Things (IoT) in Buildings: A Learning Factory. Sustainability 2023, 15, 12219. [Google Scholar] [CrossRef]
- RDL 486/1997; Minimum Health and Safety Provisions in the Workplace. Ministry of Labour and Social Affairs: Madrid, Spain, 1997. Available online: https://www.boe.es/eli/es/rd/1997/04/14/486/con (accessed on 20 December 2024).
- RDL 14/2022; Directive for Economic Sustainability, Savings, and Energy Efficiency. Ministry of Labour and Social Affairs: Madrid, Spain, 2022. Available online: https://www.boe.es/eli/es/rdl/2022/08/01/14/con (accessed on 20 December 2024).
- David Bienvenido-Huertas, D.; Sánchez-García, D.; Rubio-Bellido, C.; Pulido-Arcas, J.A. Influence of the Improvement in Thermal Expectation Levels with Adaptive Setpoint Temperatures on Energy Consumption (including EN 16798-1:2019). Appl. Sci. 2020, 10, 5282. [Google Scholar] [CrossRef]
- AEMET. Meteorological Agency Spanish Government. Available online: https://www.aemet.es (accessed on 20 December 2024).
- University Green Office. Switching Times for Heating and Cooling Installations. Criteria. Available online: https://oficinaverde.unizar.es/horarios-de-encendido-de-las-instalaciones-generales-de-fr%C3%ADo-y-calor (accessed on 20 December 2024).
- University Schedule. Available online: https://reservadeaulas.unizar.es (accessed on 20 December 2024).
- European Commission. Nominated Electricity Market Operators (NEMO). Available online: https://www.nemo-committee.eu (accessed on 20 December 2024).


| Mode | Description | Key Objectives |
|---|---|---|
| Defensive | Buildings as shelters from a hostile world, focusing on safety (structural, fire, intrusion). | Safety (structural, fire, intrusion) |
| Projective | Human imagination and transcendence, creating structures with aesthetic and symbolic purposes (e.g., temples, monuments). | Aesthetics, scale, illumination |
| Scientific | Rational analysis and prediction, with objectives of rationality, order, and control over nature. | Rationality, order, circulation, proportion, composition |
| Thermodynamic | Focus on thermal comfort and efficiency through energy consumption, adapting the environment to humans. | Energy consumption, comfort, efficiency |
| Subjective | Isolation and hygiene to protect the self, with emphasis on aesthetic and visual appeal in architecture. | Isolation, filtering, control, regulation, airtightness |
| Complex | Interconnected systems adapting to and influencing the environment, emphasising feedback and identity. | Interconnection, relationship, feedback |
| Day | 08–09 | 09–10 | 10–11 | 11–12 | 12–13 | 13–14 | 14–15 | 15–16 | 16–17 | 17–18 | 18–19 | 19–20 | 20–21 |
|---|---|---|---|---|---|---|---|---|---|---|---|---|---|
| Oct. 03 | class | class | class | ||||||||||
| Oct. 17 | class | class | class | class | class | class | class | ||||||
| Oct. 24 | class | class | class | class | class | class | class | ||||||
| Oct. 31 | class | class | class | class | class | class | class |
| (a) | |||||||||||||||||
| A1 | A2 | B1 | B2 | B3 | B4 | B5 | C1 | C2 | C3 | C4 | C5 | D1 | D2 | D3 | D4 | D5 | |
| % <17 °C | 0 | 0 | 0 | 0 | 0 | 0 | 0 | 0 | 0 | 0 | 0 | 0 | 0 | 0 | 0 | 4.5 | 4.8 |
| % 17–19 °C | 0 | 0 | 0 | 49.9 | 0.7 | 0.5 | 0 | 0 | 1.8 | 6.4 | 1.8 | 0 | 1.0 | 2.3 | 11.6 | 20.0 | 24.3 |
| % 19–21 °C | 3.2 | 90.8 | 18.6 | 1.3 | 76.1 | 31.1 | 43.3 | 23.3 | 45.8 | 66.6 | 32.9 | 74.0 | 46.2 | 96.2 | 83.6 | 54.8 | 70.9 |
| % 17–21 °C | 3.2 | 90.8 | 18.6 | 51.2 | 76.8 | 31.6 | 43.3 | 23.3 | 47.6 | 73.0 | 34.7 | 74.0 | 47.2 | 98.5 | 95.2 | 74.8 | 95.2 |
| % >21 °C | 96.8 | 9.2 | 81.4 | 48.8 | 23.2 | 68.4 | 56.7 | 76.7 | 52.4 | 27.0 | 65.3 | 26.0 | 52.8 | 1.5 | 4.8 | 20.7 | 0 |
| (b) | |||||||||||||||||
| A1 | A2 | B1 | B2 | B3 | B4 | B5 | C1 | C2 | C3 | C4 | C5 | D1 | D2 | D3 | D4 | D5 | |
| % <17 °C | 0 | 2.8 | 0 | 0 | 0 | 0 | 0 | 0 | 0 | 0 | 0 | 0 | 0 | 2.9 | 0 | 0.7 | 0.3 |
| % 17–19 °C | 8.6 | 63.1 | 0 | 0.4 | 0.2 | 0 | 4.8 | 3.3 | 23.2 | 32.2 | 19.0 | 11.4 | 10.9 | 35.8 | 39.4 | 30.9 | 38.1 |
| % 19–21 °C | 20.4 | 34.1 | 71.3 | 31.3 | 98.1 | 61.4 | 65.3 | 70.0 | 54.6 | 67.4 | 60.8 | 70.9 | 77.9 | 61.3 | 52.0 | 60.6 | 61.6 |
| % 17–21 °C | 29.0 | 97.2 | 71.3 | 31.7 | 98.3 | 61.4 | 70.1 | 73.3 | 77.8 | 99.6 | 79.8 | 82.3 | 88.8 | 97.1 | 91.4 | 91.5 | 99.7 |
| % >21 °C | 71.0 | 0 | 28.7 | 68.3 | 1.7 | 38.6 | 29.9 | 26.7 | 22.2 | 0.4 | 20.2 | 17.7 | 11.2 | 0 | 8.6 | 7.8 | 0 |
| (c) | |||||||||||||||||
| A1 | A2 | B1 | B2 | B3 | B4 | B5 | C1 | C2 | C3 | C4 | C5 | D1 | D2 | D3 | D4 | D5 | |
| % <17 °C | 0 | 2.3 | 0 | 0 | 0 | 0 | 0 | 0 | 2.8 | 0.3 | 0 | 2.8 | 2.9 | 4.8 | 6.0 | 10.3 | 11.6 |
| % 17–19 °C | 18.1 | 35.9 | 18.1 | 5.4 | 3.7 | 5.8 | 9.7 | 20.4 | 27.6 | 43.1 | 20.3 | 20.2 | 22.5 | 60.5 | 46.5 | 22.8 | 42.9 |
| % 19–21 °C | 30.2 | 52.3 | 72.5 | 35.4 | 91.2 | 71.3 | 86.8 | 59.8 | 51.7 | 49.0 | 62.4 | 75.2 | 69.9 | 34.7 | 43.8 | 42.1 | 45.5 |
| % 17–21 °C | 55.3 | 88.2 | 90.6 | 40.8 | 94.9 | 77.1 | 96.5 | 80.2 | 79.3 | 92.1 | 82.7 | 95.4 | 92.4 | 95.2 | 90.3 | 64.9 | 88.4 |
| % >21 °C | 51.7 | 9.4 | 9.4 | 59.2 | 5.1 | 22.9 | 3.5 | 19.8 | 17.9 | 7.6 | 17.3 | 1.8 | 4.7 | 0 | 3.7 | 24.8 | 0 |
| (d) | |||||||||||||||||
| A1 | A2 | B1 | B2 | B3 | B4 | B5 | C1 | C2 | C3 | C4 | C5 | D1 | D2 | D3 | D4 | D5 | |
| % <17 °C | 0 | 0 | 0 | 0 | 0 | 0 | 0 | 0 | 0 | 0 | 0 | 0 | 0 | 0.2 | 3.1 | 4.9 | 1.3 |
| % 17–19 °C | 5.3 | 3.6 | 1.0 | 0 | 0.2 | 0 | 0.1 | 0.8 | 0.8 | 1.4 | 1.7 | 0.6 | 2.4 | 3.4 | 4.8 | 7.1 | 6.0 |
| % 19–21 °C | 49.1 | 30.6 | 17.3 | 6.0 | 10.4 | 4.1 | 12.8 | 16.0 | 12.5 | 20.3 | 39.1 | 12.3 | 34.3 | 30.8 | 27.3 | 23.5 | 41.9 |
| % 17–21 °C | 54.4 | 34.2 | 18.3 | 6.0 | 10.6 | 4.1 | 12.9 | 16.8 | 13.3 | 21.7 | 40.8 | 12.9 | 36.7 | 34.2 | 32.1 | 30.6 | 47.9 |
| % >21 °C | 45.6 | 65.8 | 81.7 | 94.0 | 89.4 | 95.9 | 87.1 | 83.2 | 86.7 | 78.3 | 59.2 | 87.1 | 63.3 | 65.6 | 64.8 | 64.5 | 50.8 |
| (a) | ||||
| Intervals | Time (hours) | Energy (MWh) | Energy Cost (EUR/MWh) | Economic Cost (EUR) |
| >21 °C | 29.9 | 7.92 | 63.44 | 501.97 |
| 21–22 °C | 15.7 | 4.15 | 63.44 | 263.21 |
| 22–23 °C | 8.8 | 2.32 | 63.44 | 147.26 |
| >23 °C | 5.4 | 1.44 | 63.44 | 91.51 |
| (b) | ||||
| Intervals | time (hours) | energy (MWh) | energy cost (EUR/MWh) | economic cost (EUR) |
| >21 °C | 18.6 | 5.13 | 72.19 | 370.91 |
| 21–22 °C | 12.3 | 3.40 | 72.19 | 246.00 |
| 22–23 °C | 4.7 | 1.30 | 72.19 | 94.07 |
| >23 °C | 1.6 | 0.43 | 72.19 | 30.82 |
| (c) | ||||
| Intervals | time (hours) | energy (MWh) | energy cost (EUR/MWh) | economic cost (EUR) |
| >21 °C | 16.5 | 4.49 | 74.09 | 331.79 |
| 21–22 °C | 12.6 | 3.41 | 74.09 | 252.74 |
| 22–23 °C | 3.5 | 0.95 | 74.09 | 70.73 |
| >23 °C | 0.4 | 0.13 | 74.09 | 9.32 |
| (d) | ||||
| Intervals | time (hours) | energy (MWh) | energy cost (EUR/MWh) | economic cost (EUR) |
| >21 °C | 92.8 | 25.08 | 39.93 | 1001.31 |
| 21–22 °C | 34.3 | 9.25 | 39.93 | 369.39 |
| 22–23 °C | 33.0 | 8.92 | 39.93 | 356.21 |
| >23 °C | 25.5 | 6.90 | 39.93 | 275.71 |
Disclaimer/Publisher’s Note: The statements, opinions and data contained in all publications are solely those of the individual author(s) and contributor(s) and not of MDPI and/or the editor(s). MDPI and/or the editor(s) disclaim responsibility for any injury to people or property resulting from any ideas, methods, instructions or products referred to in the content. |
© 2025 by the authors. Licensee MDPI, Basel, Switzerland. This article is an open access article distributed under the terms and conditions of the Creative Commons Attribution (CC BY) license (https://creativecommons.org/licenses/by/4.0/).
Share and Cite
Martínez Ruiz, I.; Cano Suñén, E.; Marco Marco, Á.; Fernández Cuello, Á. IoB Internet of Things (IoT) for Smart Built Environment (SBE): Understanding the Complexity and Contributing to Energy Efficiency; A Case Study in Mediterranean Climates. Appl. Sci. 2025, 15, 1724. https://doi.org/10.3390/app15041724
Martínez Ruiz I, Cano Suñén E, Marco Marco Á, Fernández Cuello Á. IoB Internet of Things (IoT) for Smart Built Environment (SBE): Understanding the Complexity and Contributing to Energy Efficiency; A Case Study in Mediterranean Climates. Applied Sciences. 2025; 15(4):1724. https://doi.org/10.3390/app15041724
Chicago/Turabian StyleMartínez Ruiz, Ignacio, Enrique Cano Suñén, Álvaro Marco Marco, and Ángel Fernández Cuello. 2025. "IoB Internet of Things (IoT) for Smart Built Environment (SBE): Understanding the Complexity and Contributing to Energy Efficiency; A Case Study in Mediterranean Climates" Applied Sciences 15, no. 4: 1724. https://doi.org/10.3390/app15041724
APA StyleMartínez Ruiz, I., Cano Suñén, E., Marco Marco, Á., & Fernández Cuello, Á. (2025). IoB Internet of Things (IoT) for Smart Built Environment (SBE): Understanding the Complexity and Contributing to Energy Efficiency; A Case Study in Mediterranean Climates. Applied Sciences, 15(4), 1724. https://doi.org/10.3390/app15041724