Author Contributions
Conceptualization, A.A.; methodology, C.P., A.F., J.M., E.G. and A.A.; software, C.P., A.F., J.M. and E.G.; validation, C.P.; formal analysis, C.P., A.F. and A.A.; investigation, C.P., A.F., J.M., E.G. and A.A.; resources, A.A.; data curation, C.P.; writing—original draft, C.P.; writing—review and editing, A.F., J.M., E.G. and A.A.; visualization, C.P., A.F., J.M., E.G. and A.A.; supervision, A.A.; project administration, A.A.; funding acquisition, A.A. All authors have read and agreed to the published version of the manuscript.
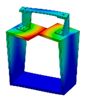
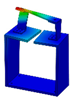
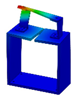
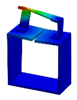
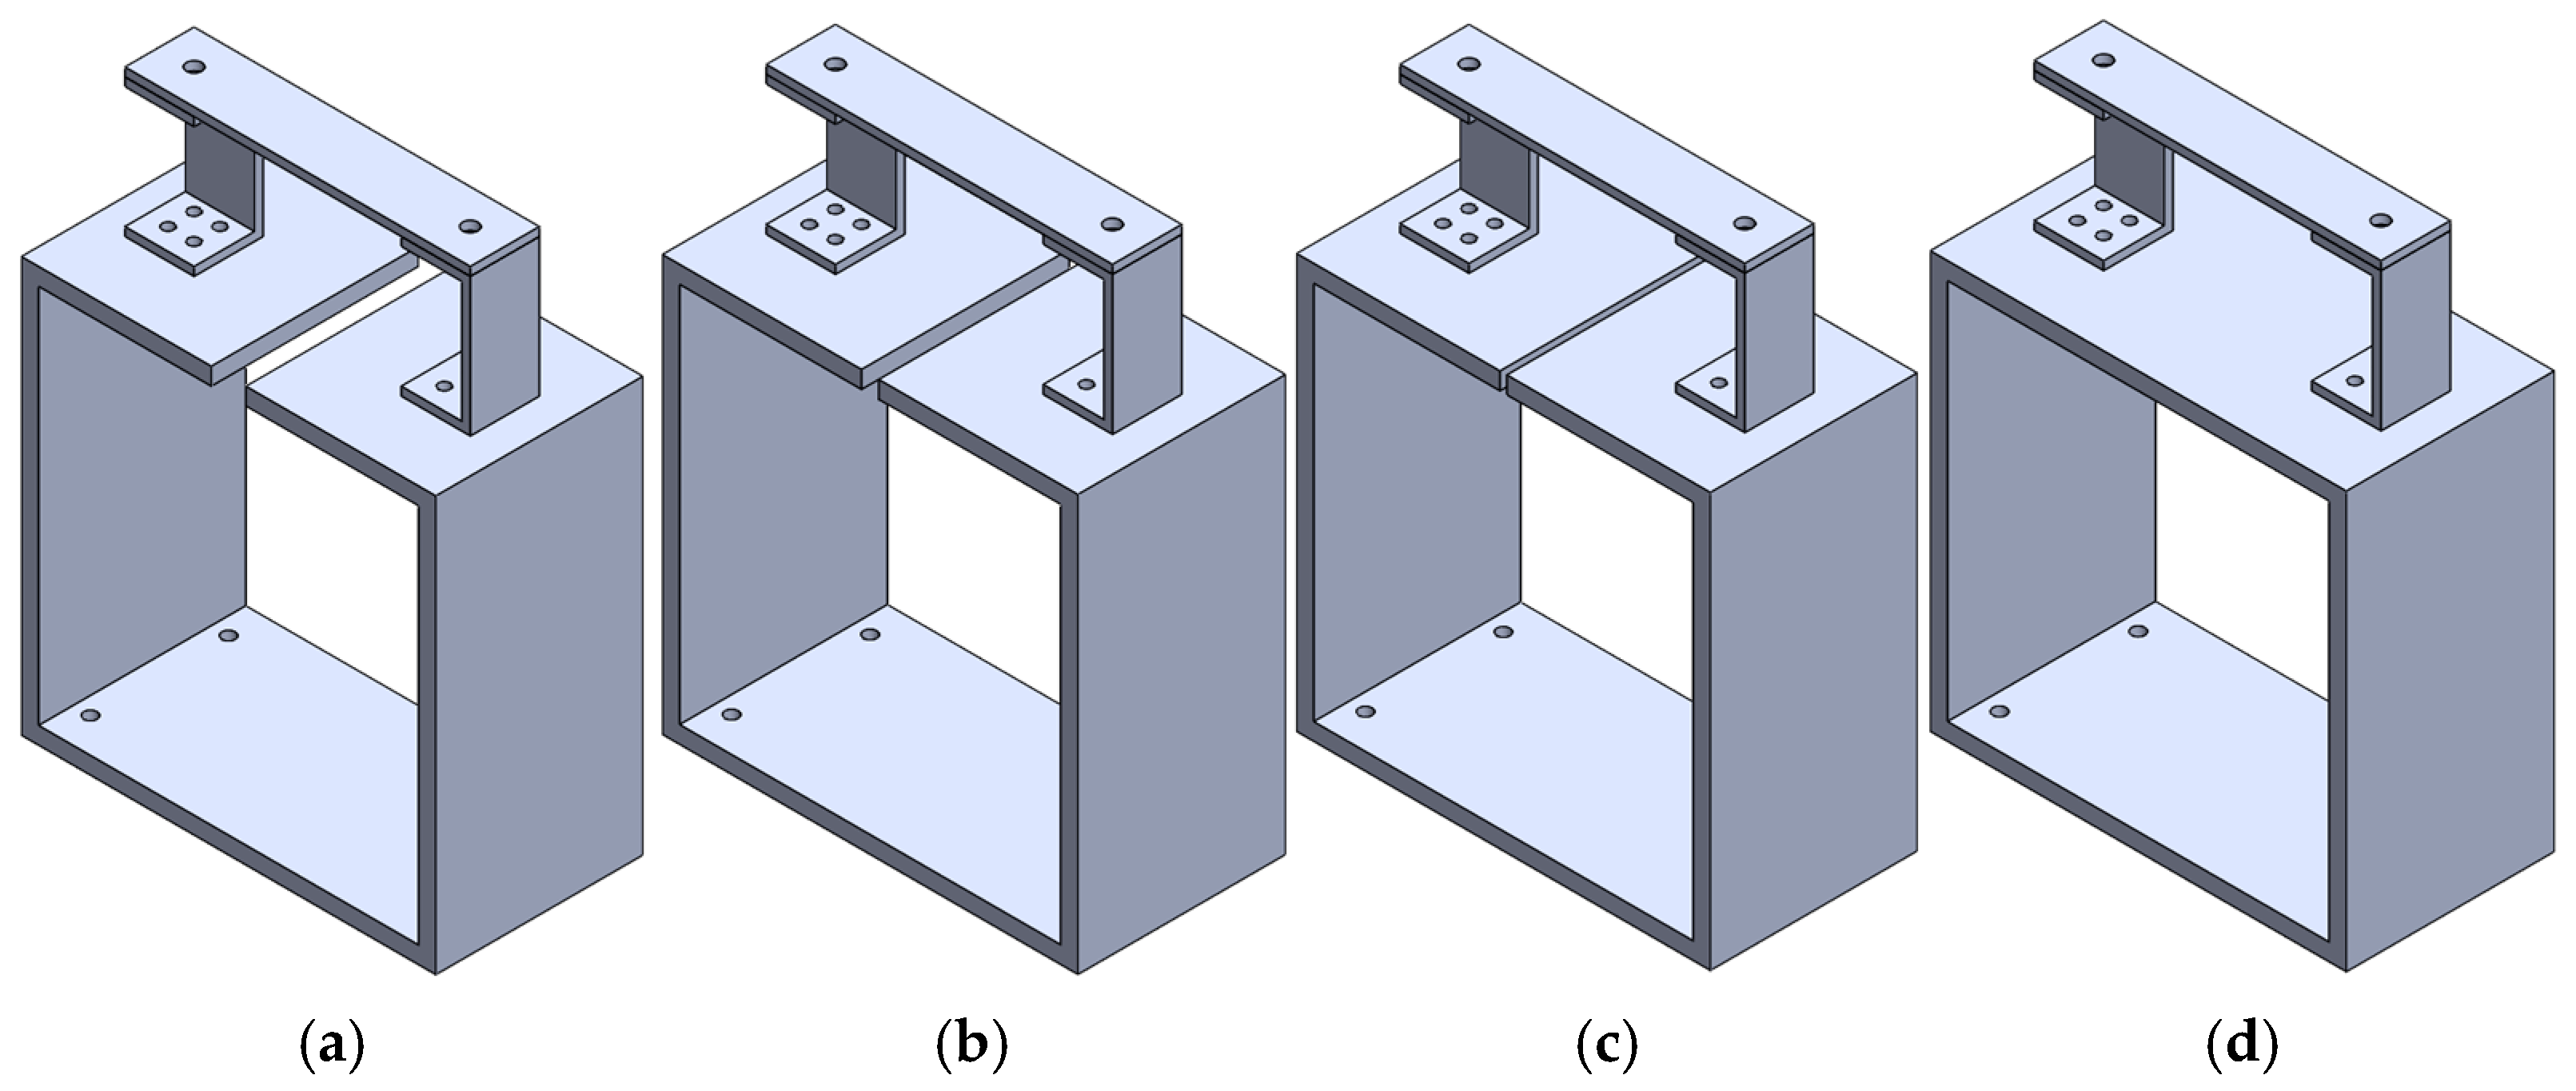
Figure 1.
Computer-aided design (CAD) models of each BARC system: (a) 0.5″ cut, (b) 0.25″ cut, (c) 0.1″ cut, and (d) no cut.
Figure 1.
Computer-aided design (CAD) models of each BARC system: (a) 0.5″ cut, (b) 0.25″ cut, (c) 0.1″ cut, and (d) no cut.
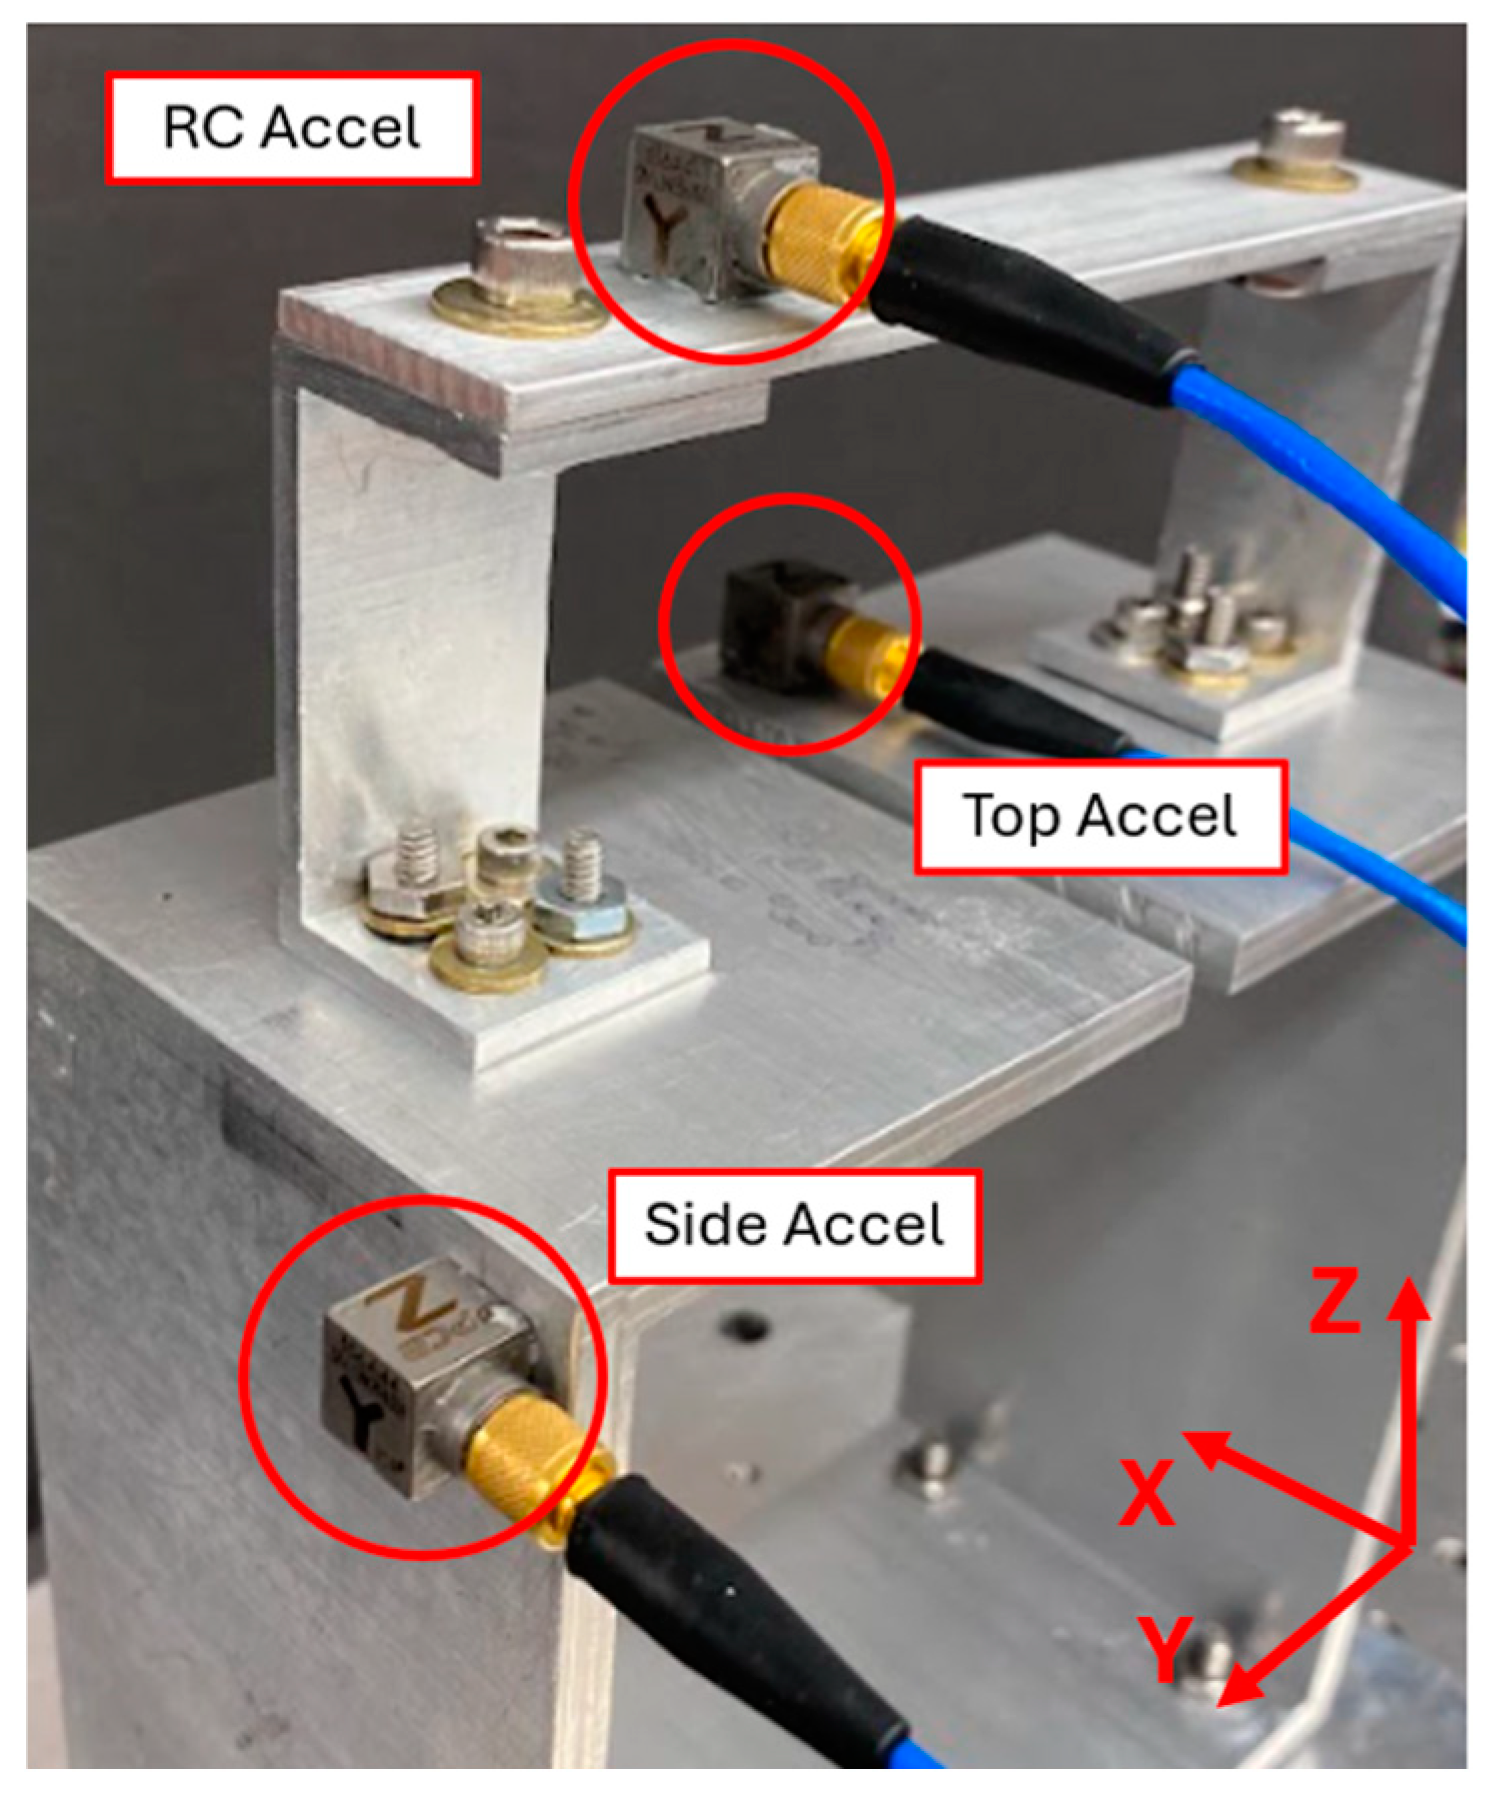
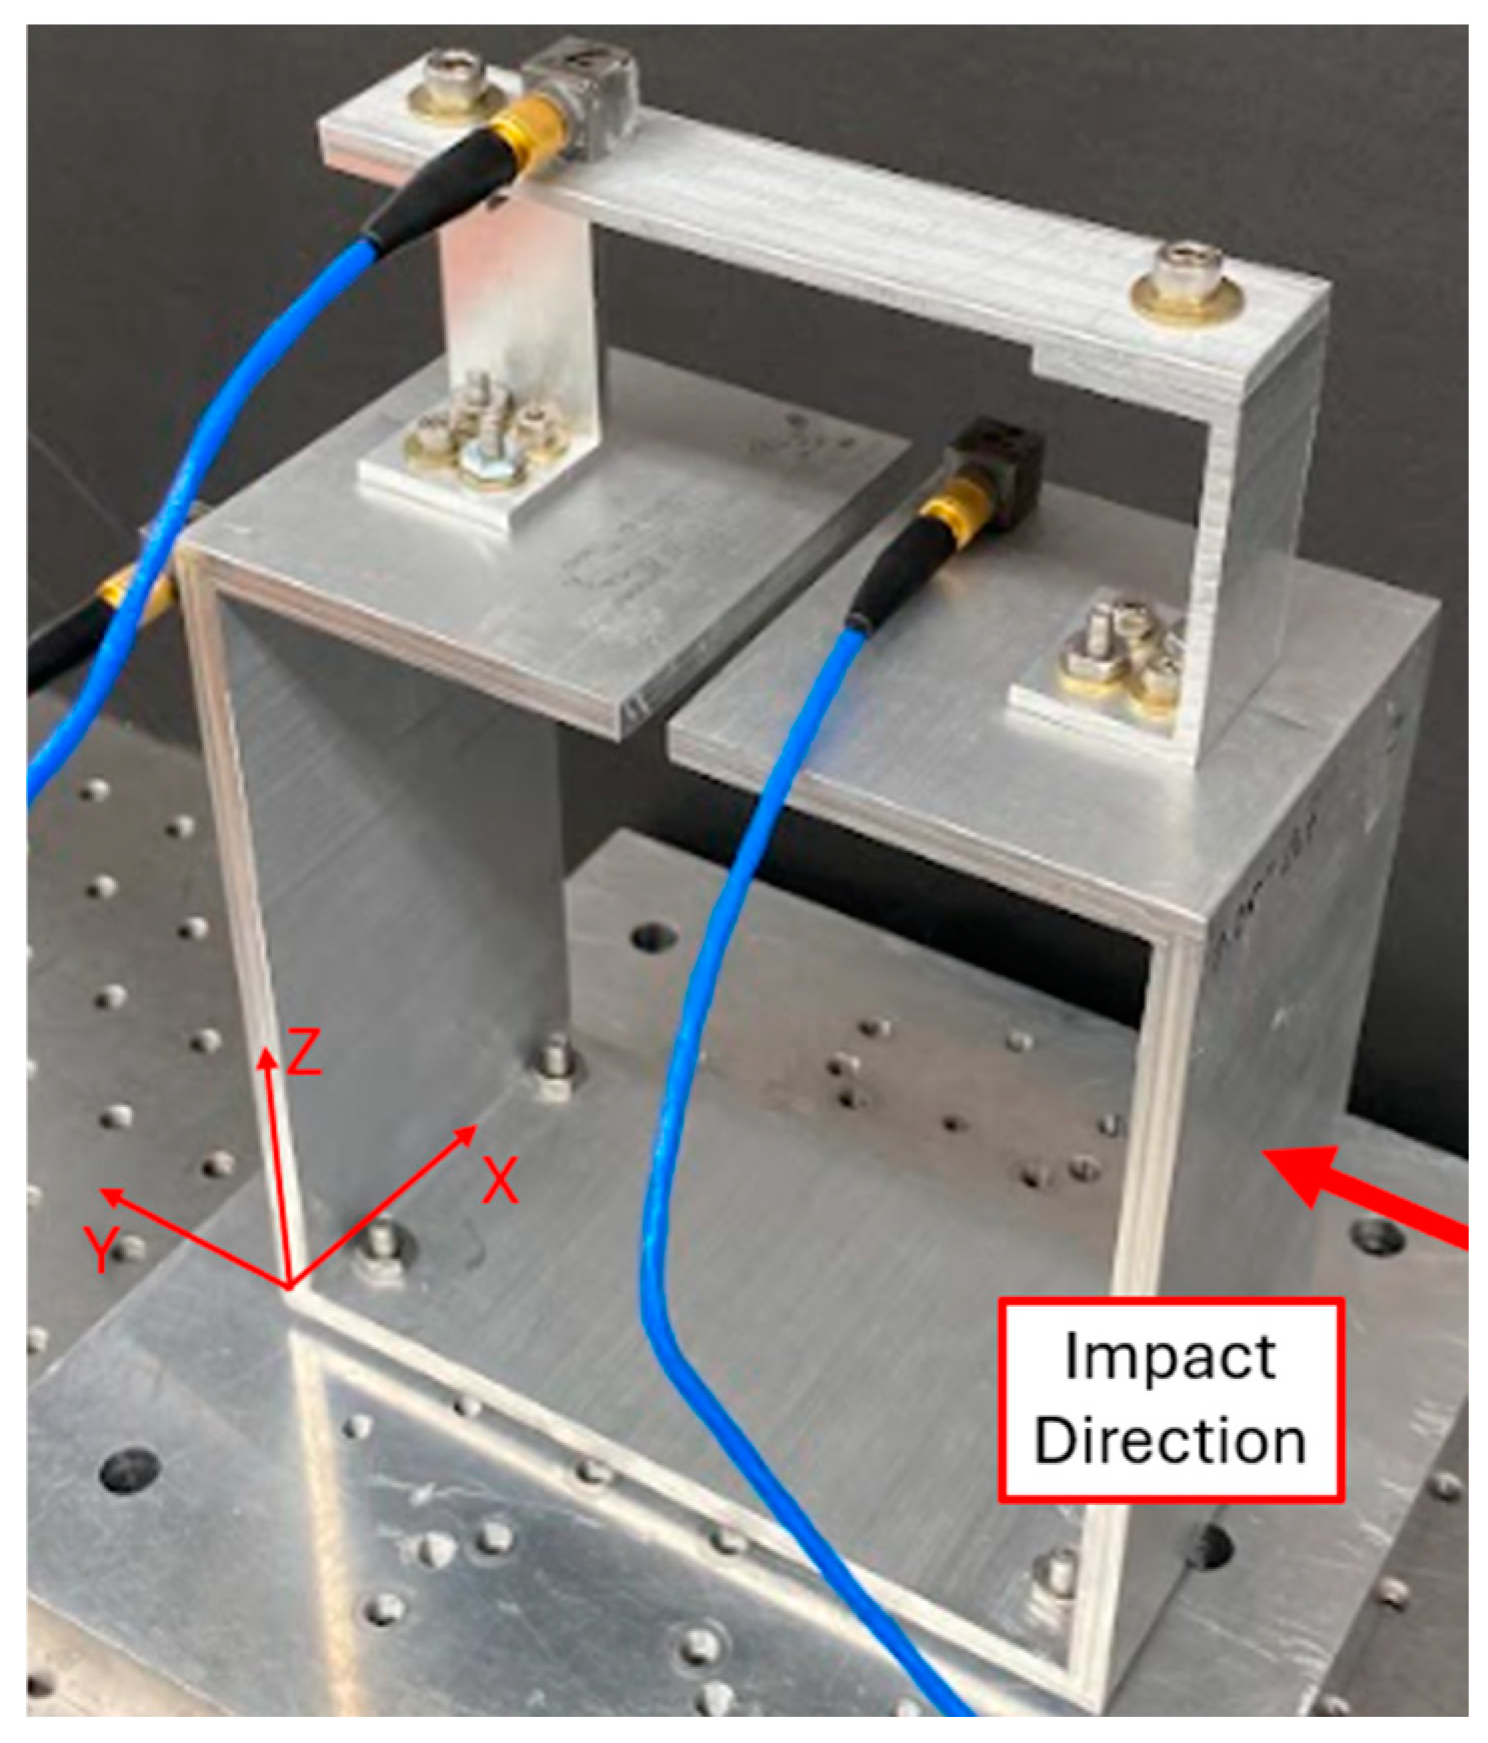
Figure 2.
Accelerometers’ locations on the BARC system.
Figure 2.
Accelerometers’ locations on the BARC system.
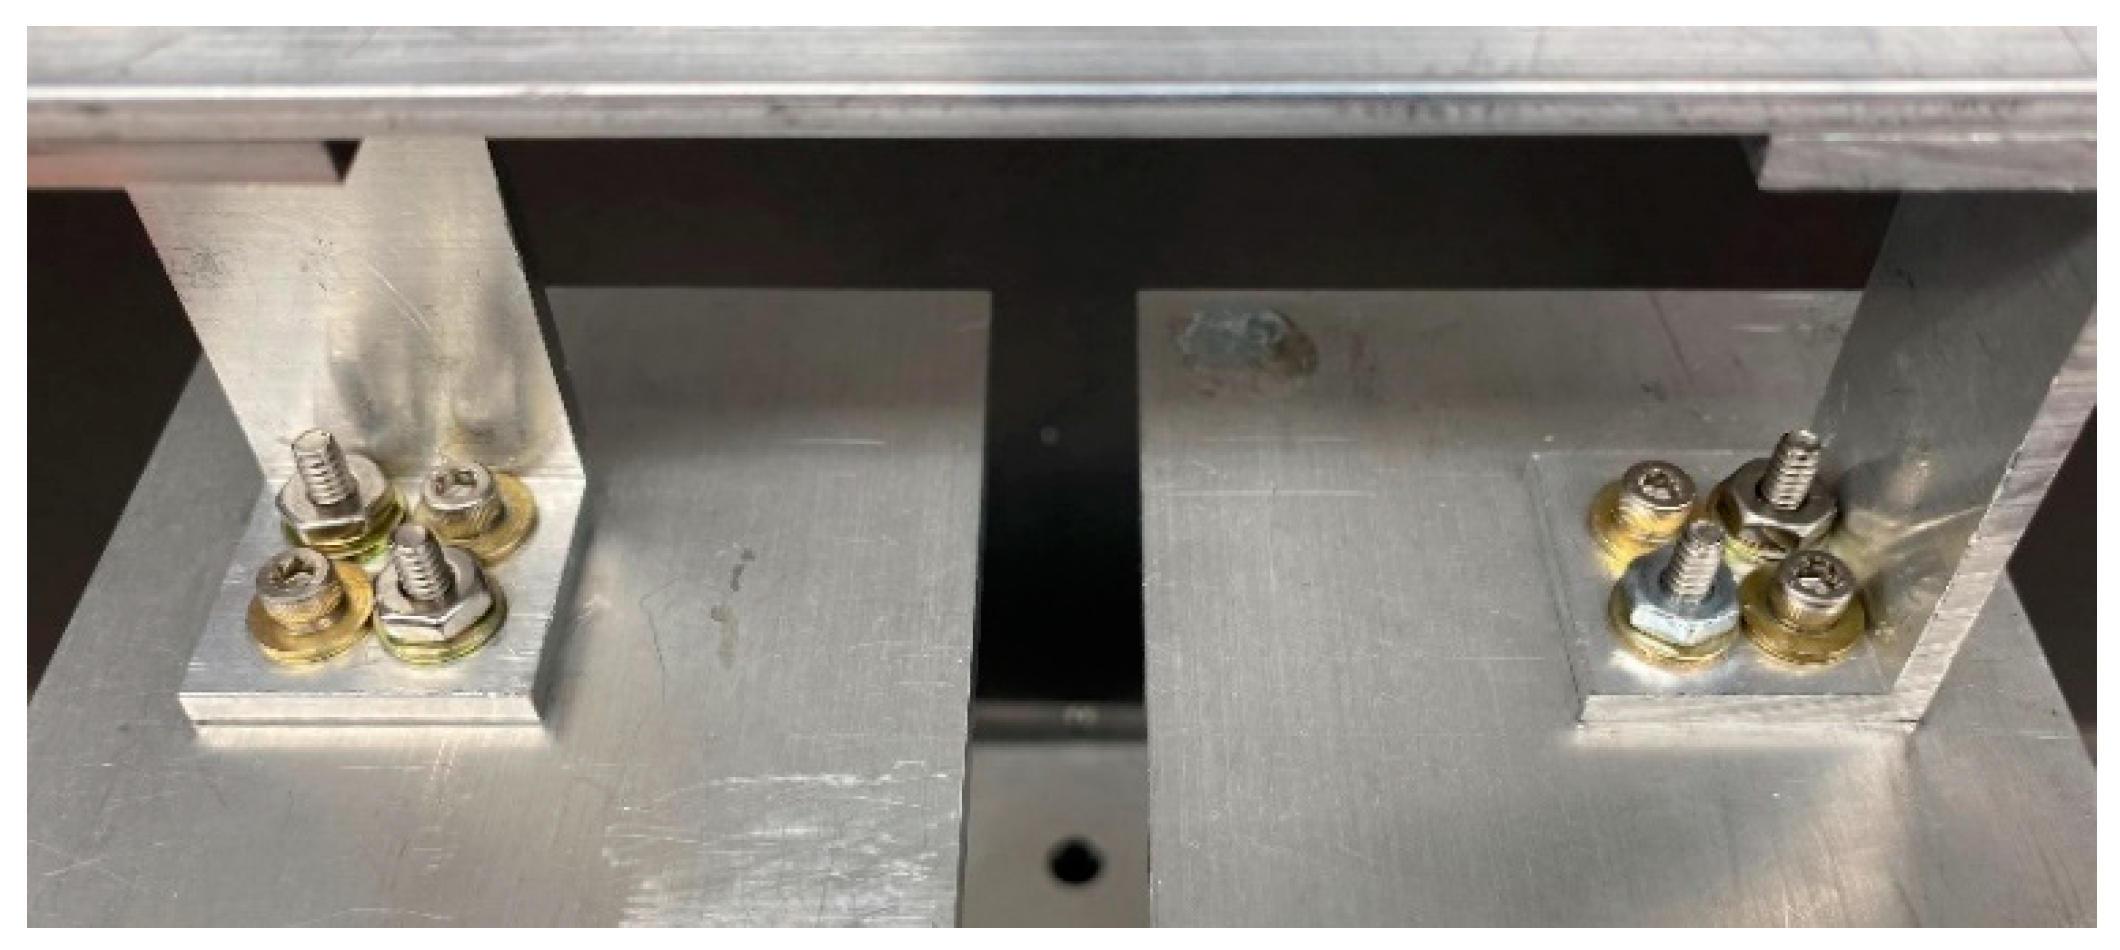
Figure 3.
Alternating screw pattern for the removable component.
Figure 3.
Alternating screw pattern for the removable component.
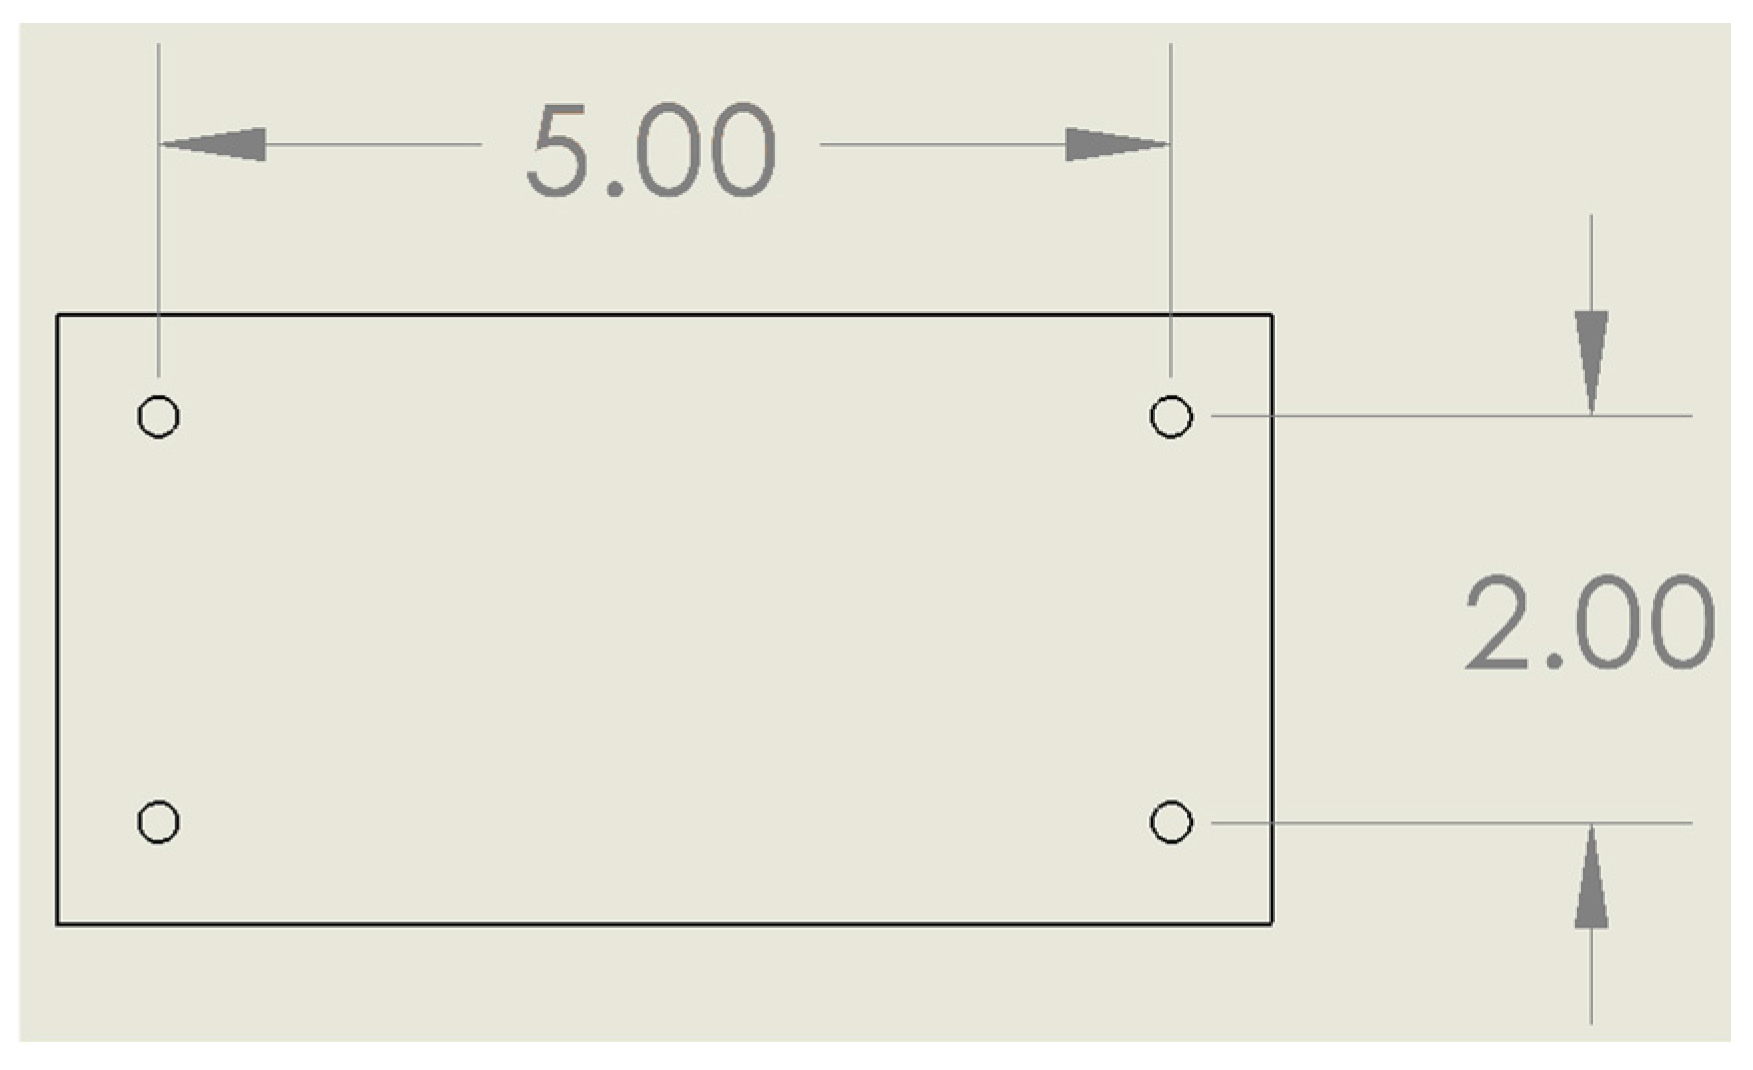
Figure 4.
BARC base hole pattern.
Figure 4.
BARC base hole pattern.
Figure 5.
The impact testing setup for the BARC system.
Figure 5.
The impact testing setup for the BARC system.
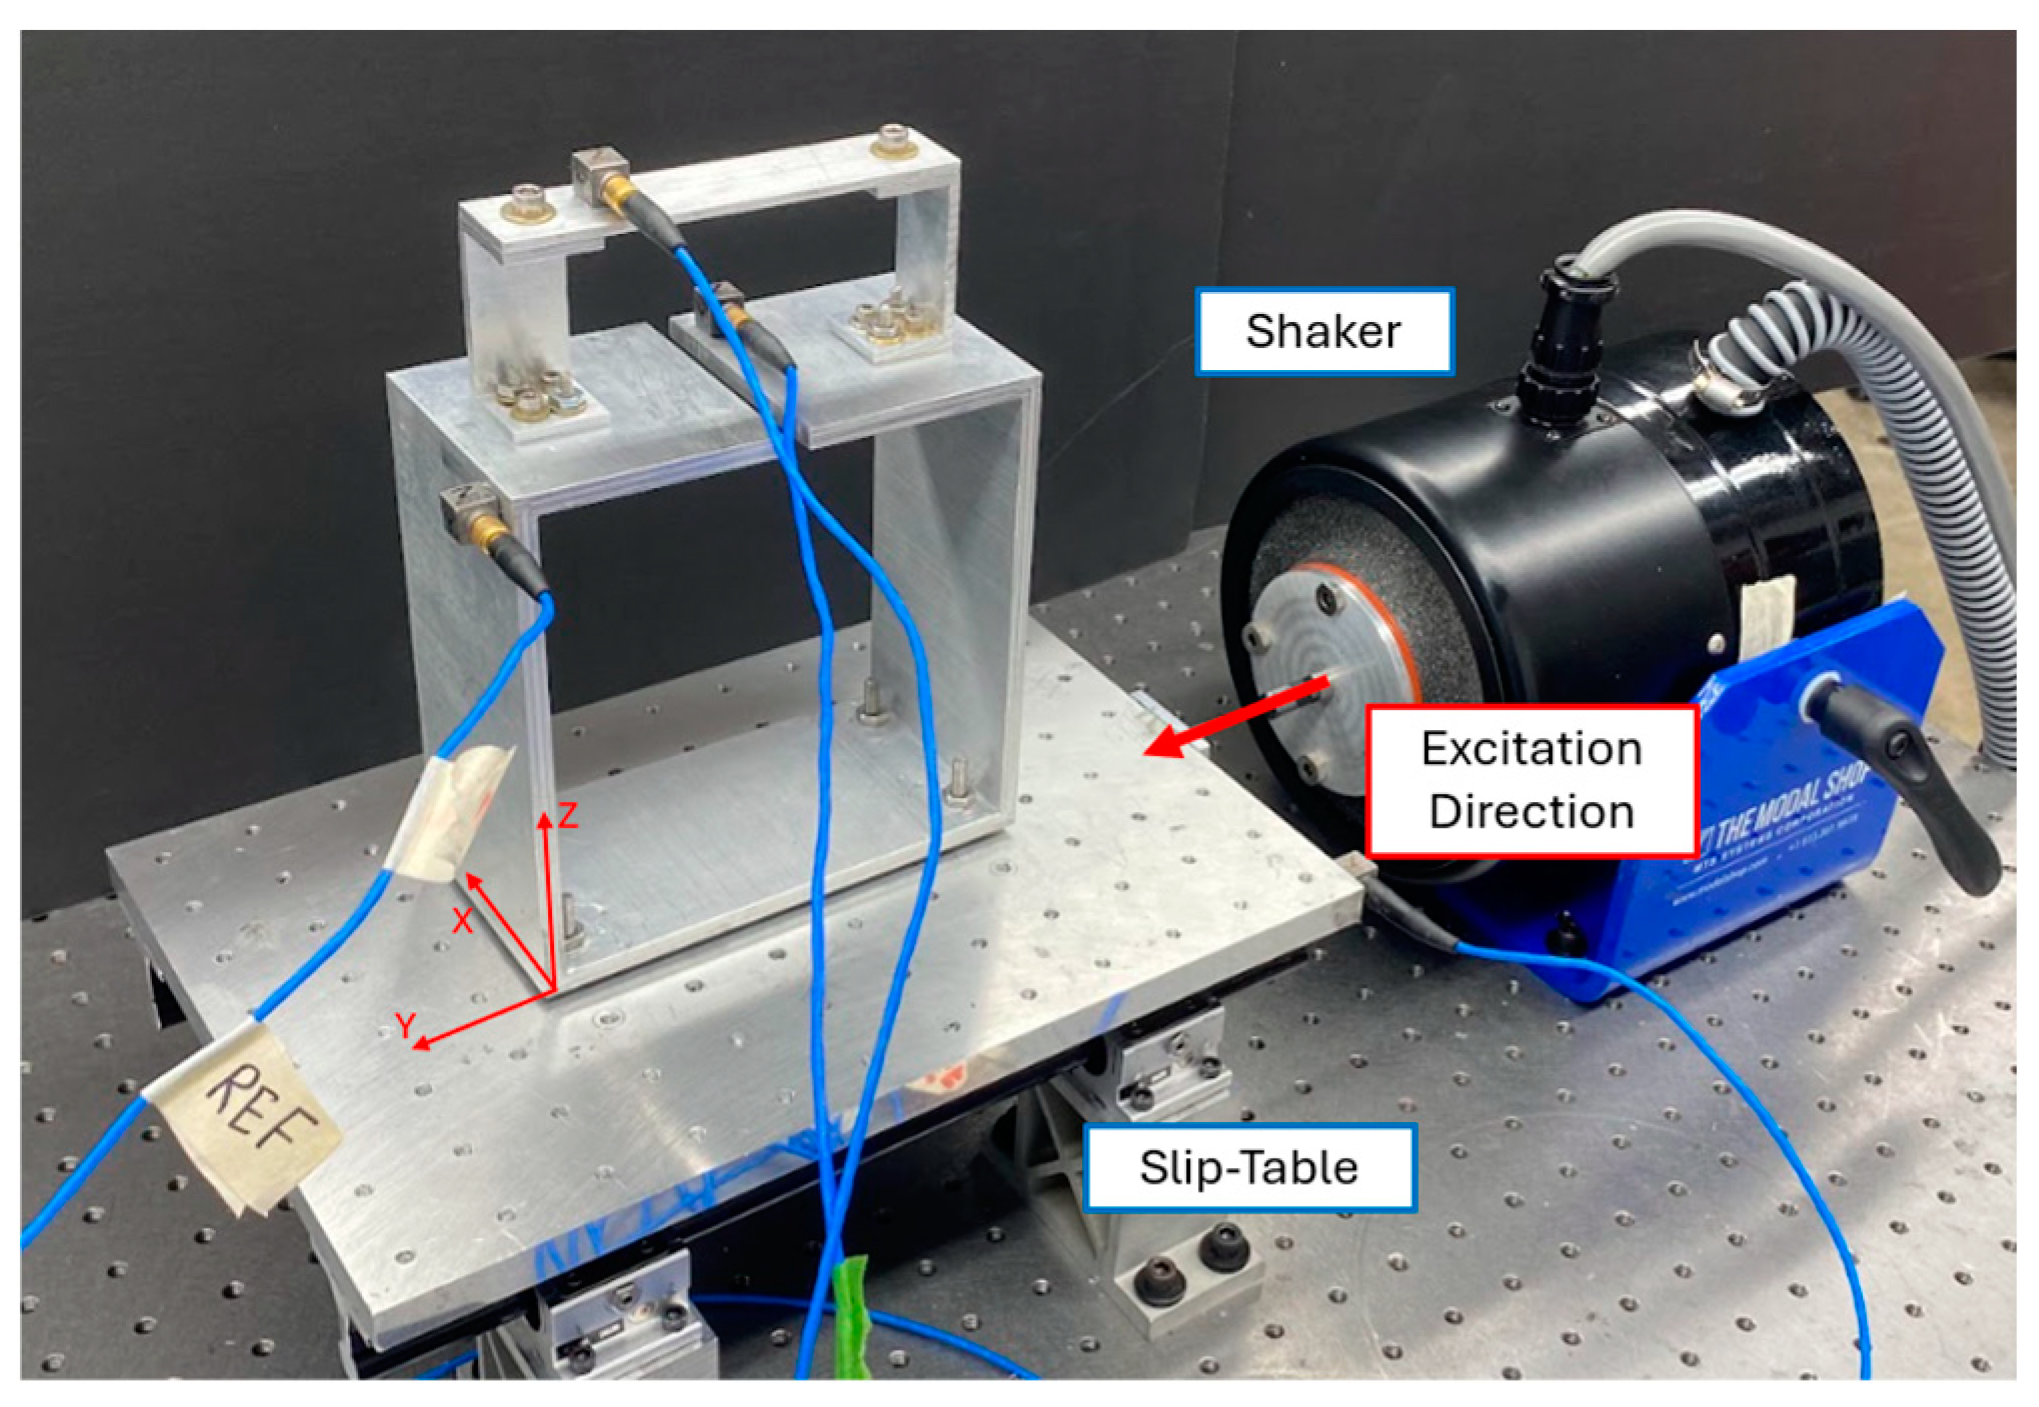
Figure 6.
Random vibration and harmonic vibration testing setup utilizing a slip-table setup for testing of the BARC system.
Figure 6.
Random vibration and harmonic vibration testing setup utilizing a slip-table setup for testing of the BARC system.
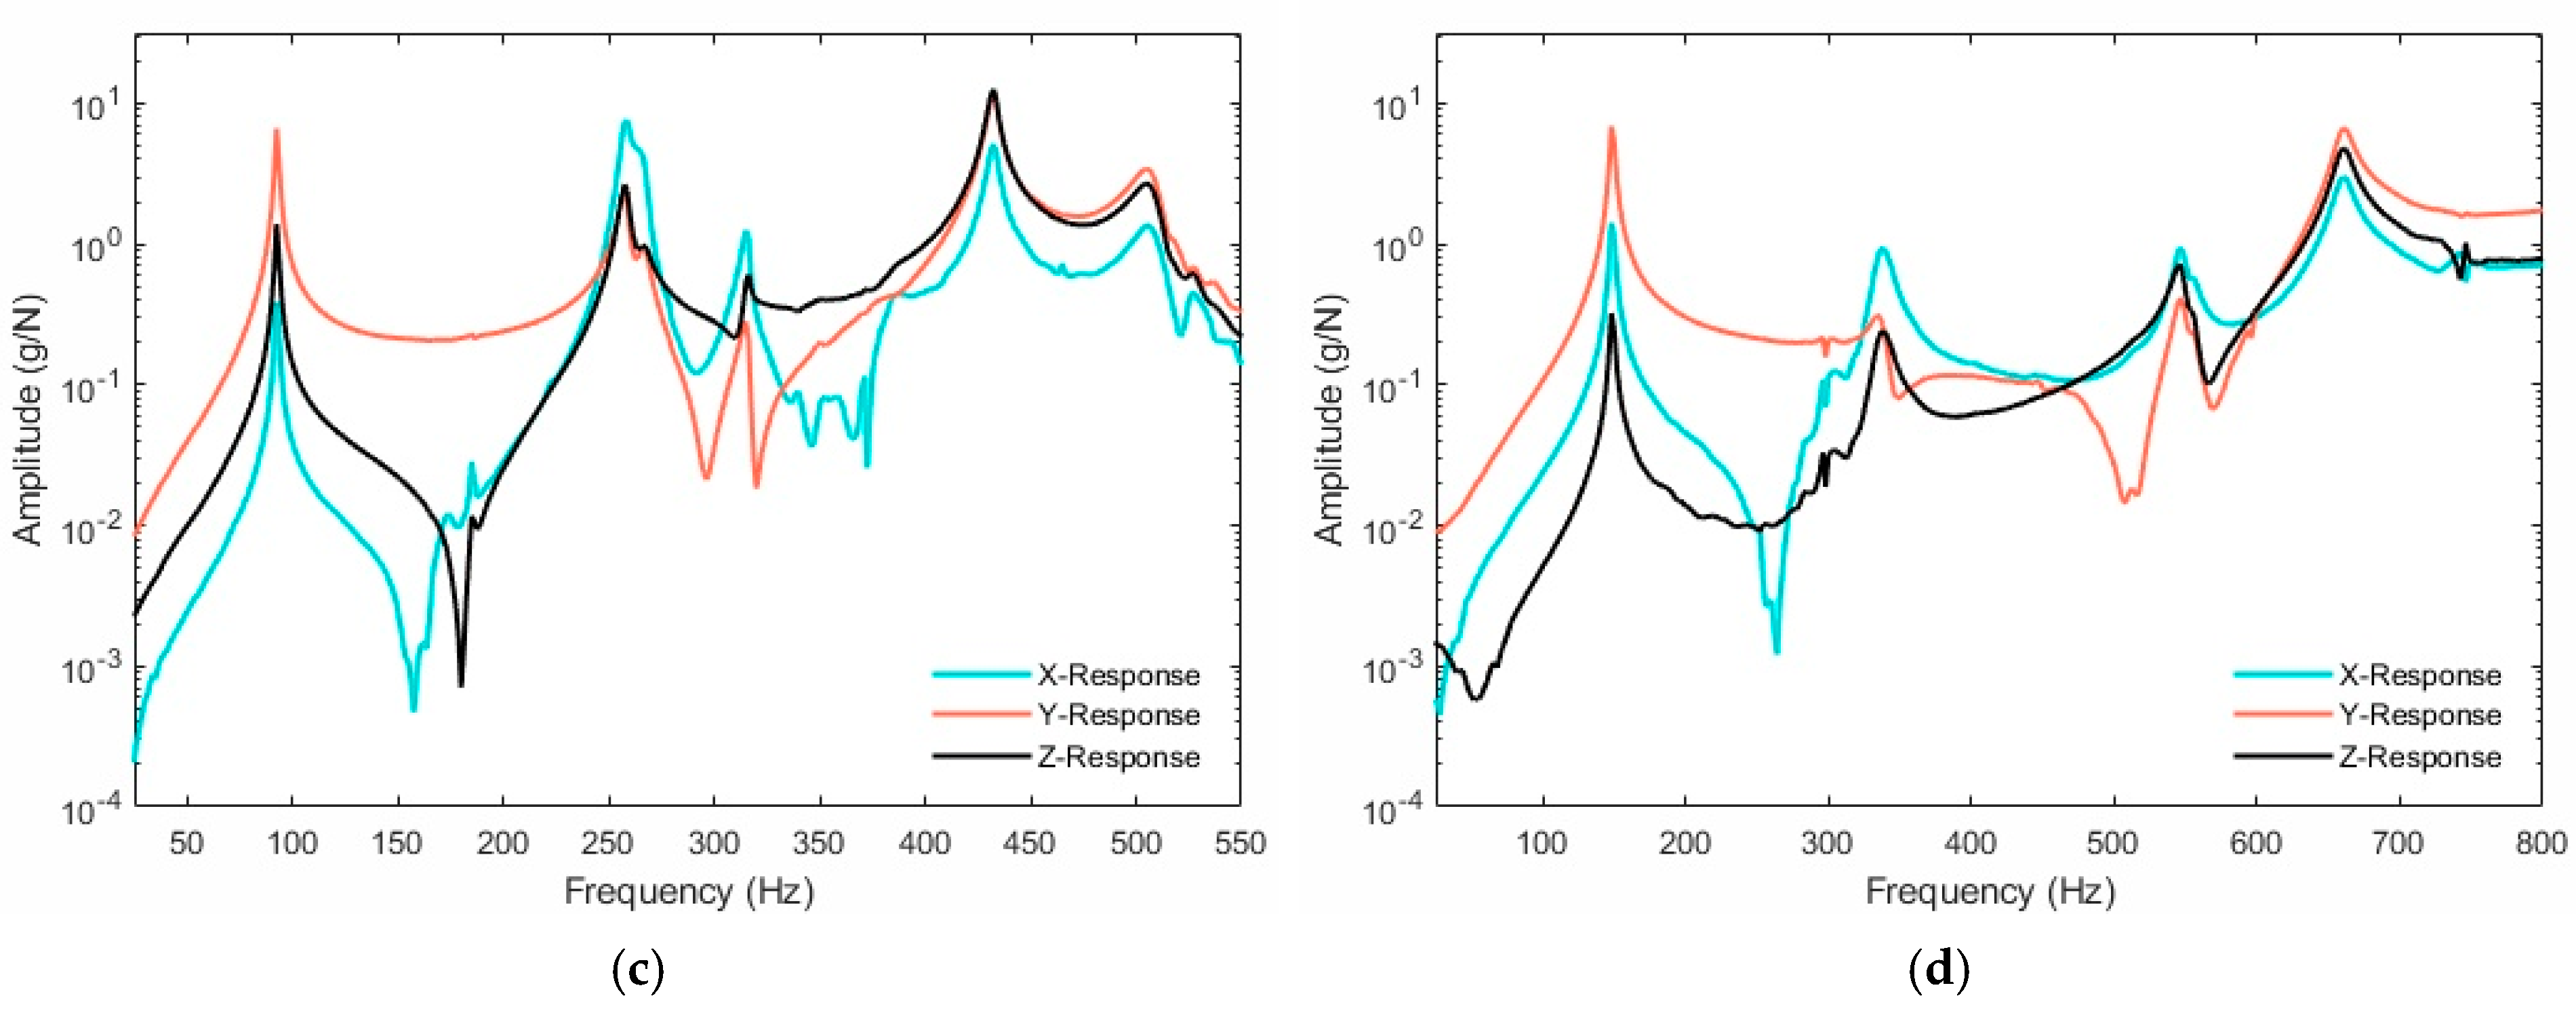
Figure 7.
Impact testing results from the side accelerometer: (a) 0.5″ cut, (b) 0.25″ cut, (c) 0.1″ cut, and (d) no-cut BARC systems.
Figure 7.
Impact testing results from the side accelerometer: (a) 0.5″ cut, (b) 0.25″ cut, (c) 0.1″ cut, and (d) no-cut BARC systems.
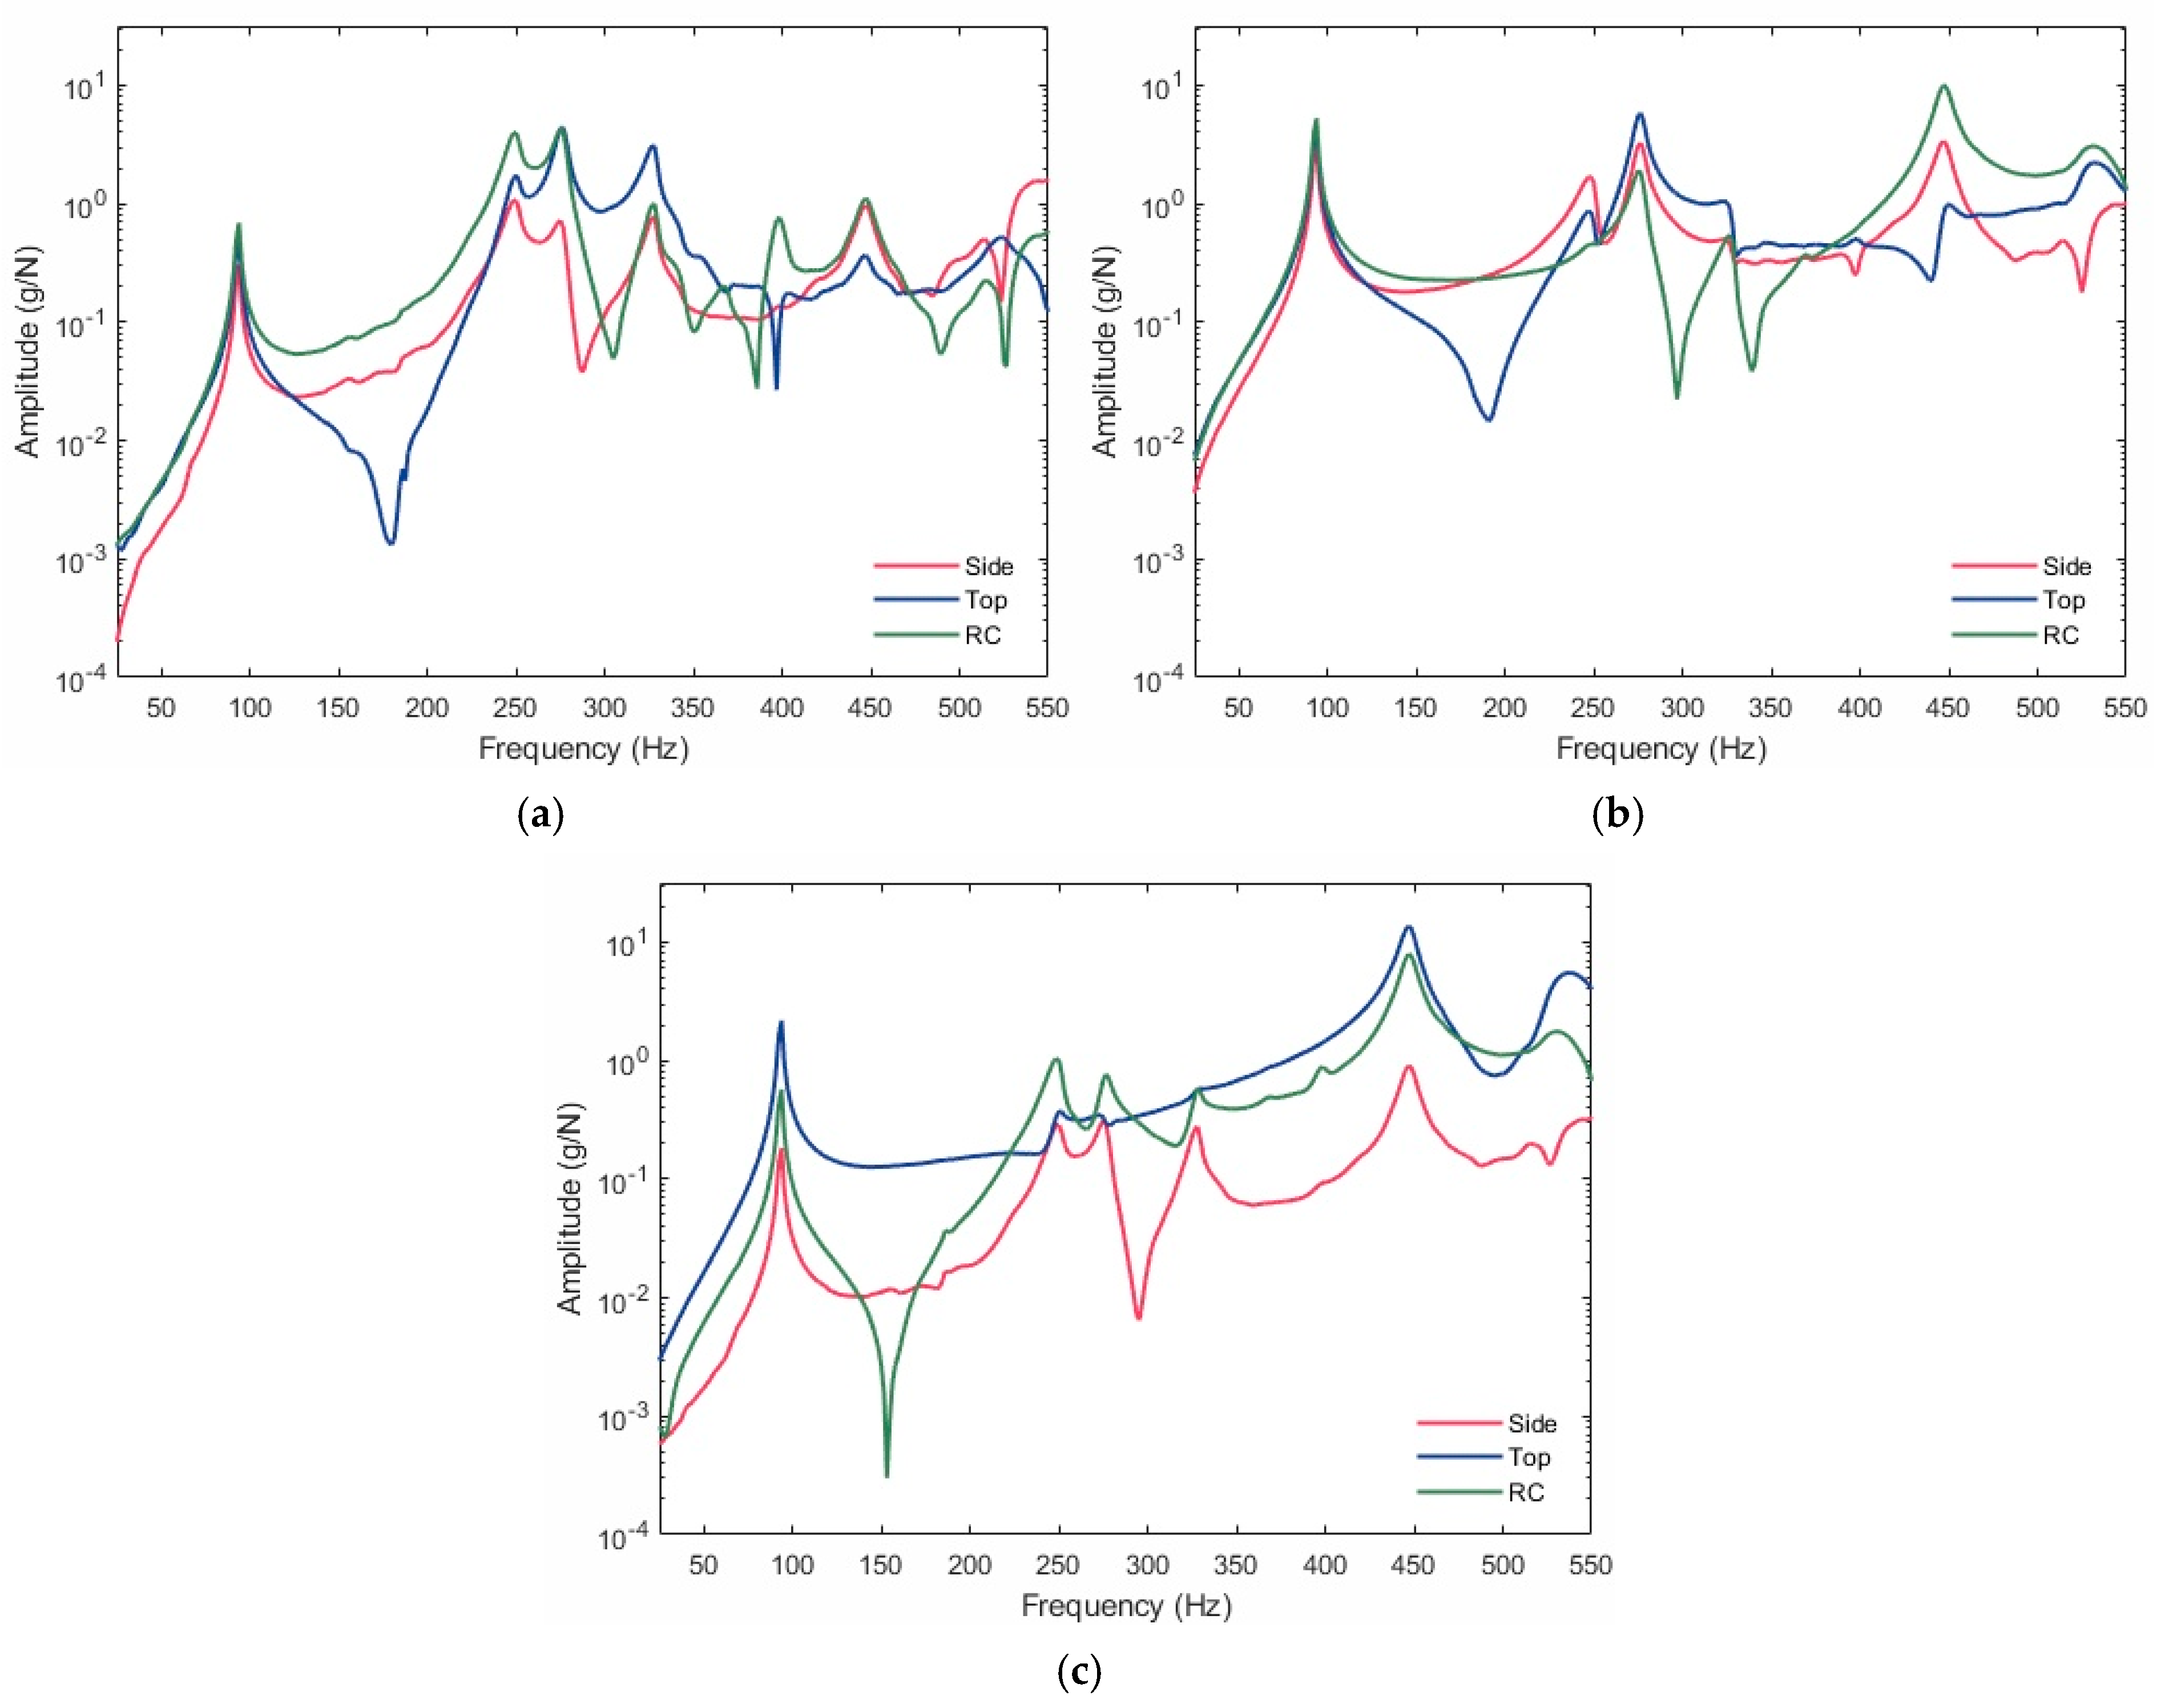
Figure 8.
Impact testing results from the RC accelerometer: (a) 0.5″ cut, (b) 0.25″ cut, (c) 0.1″ cut, and (d) no-cut BARC systems.
Figure 8.
Impact testing results from the RC accelerometer: (a) 0.5″ cut, (b) 0.25″ cut, (c) 0.1″ cut, and (d) no-cut BARC systems.
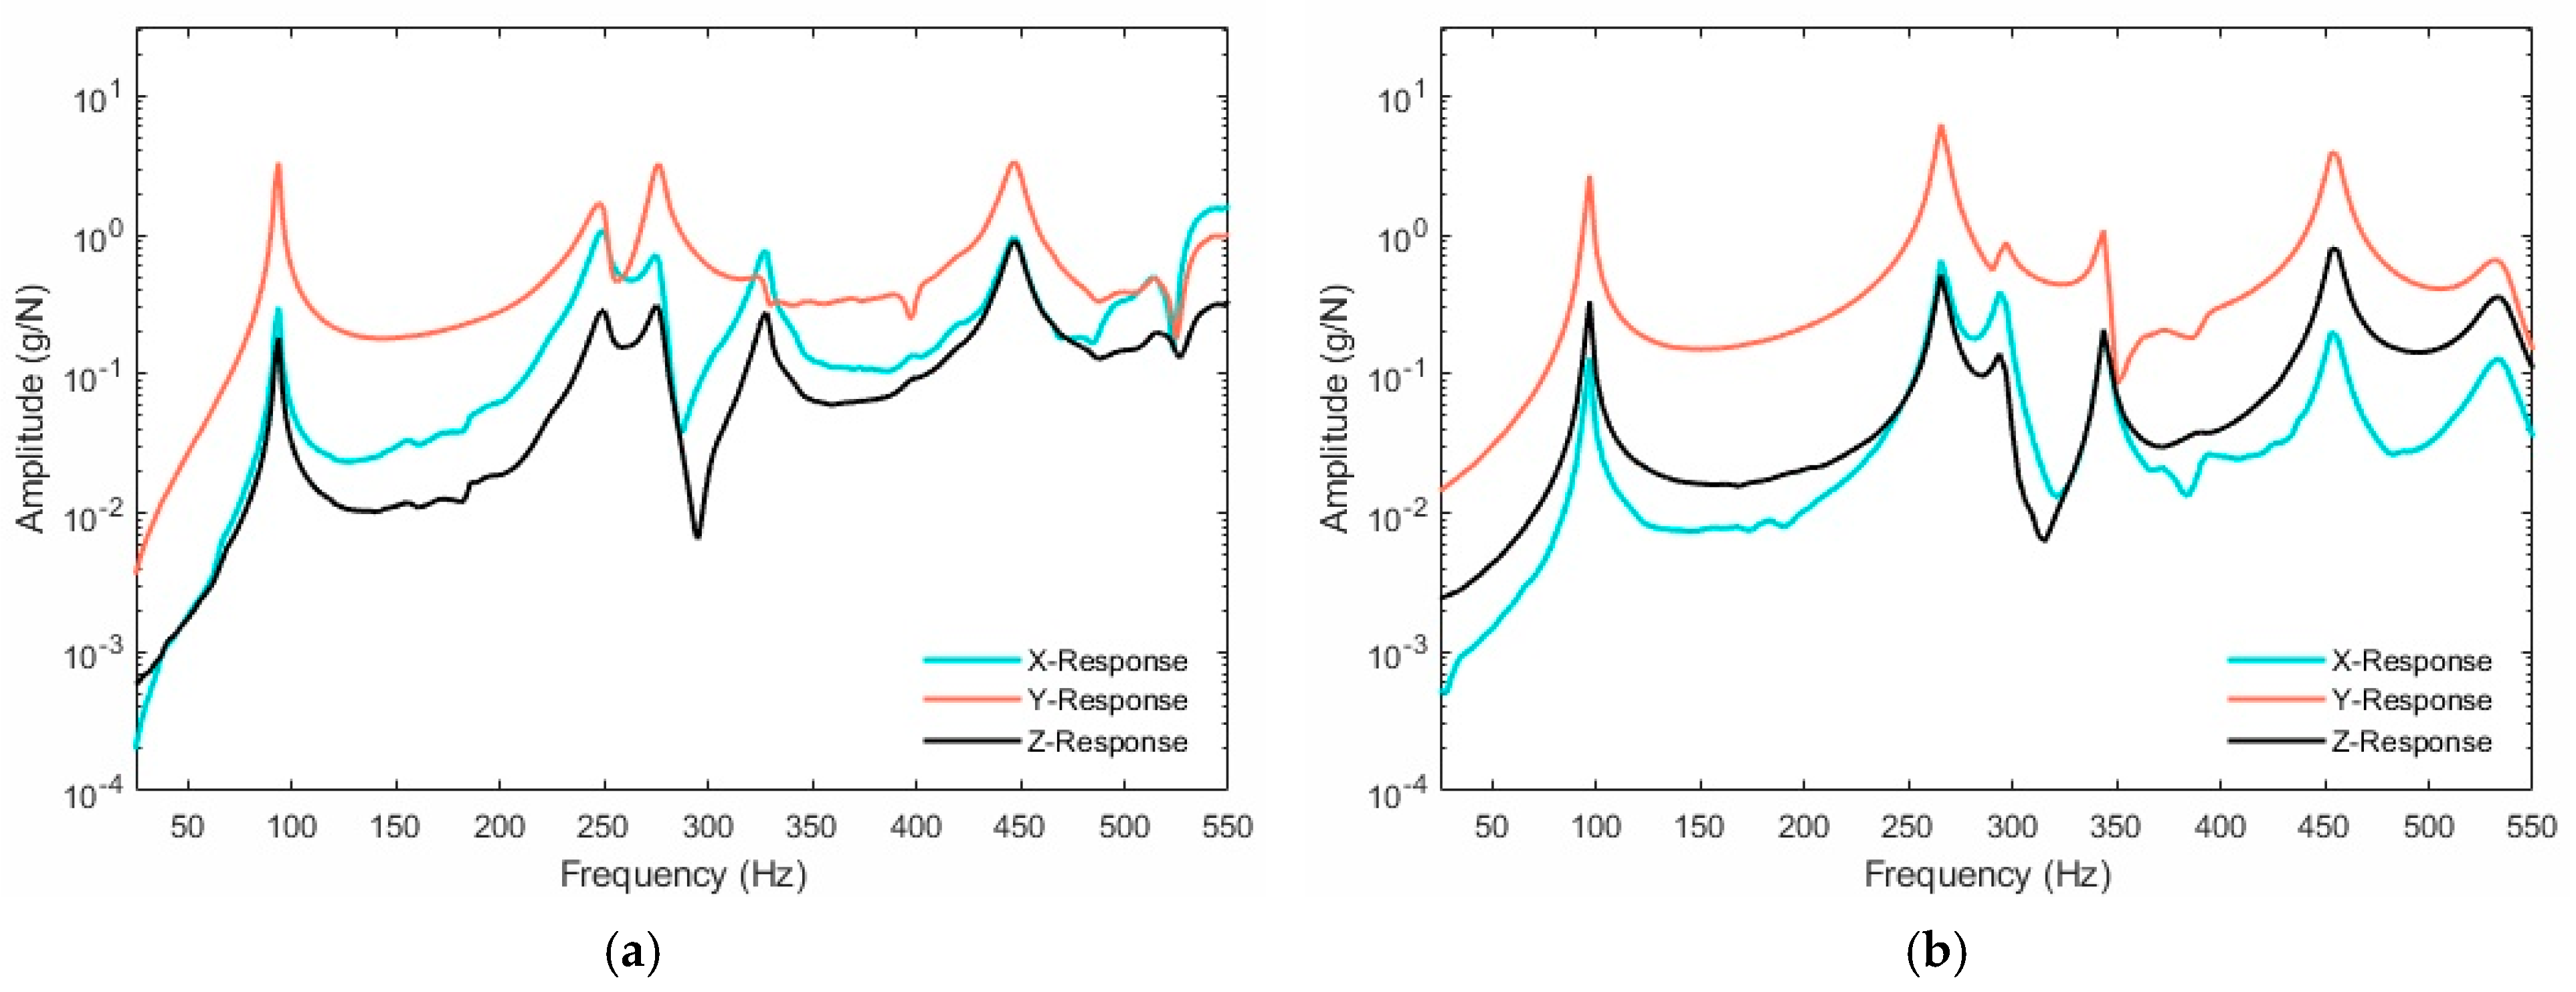
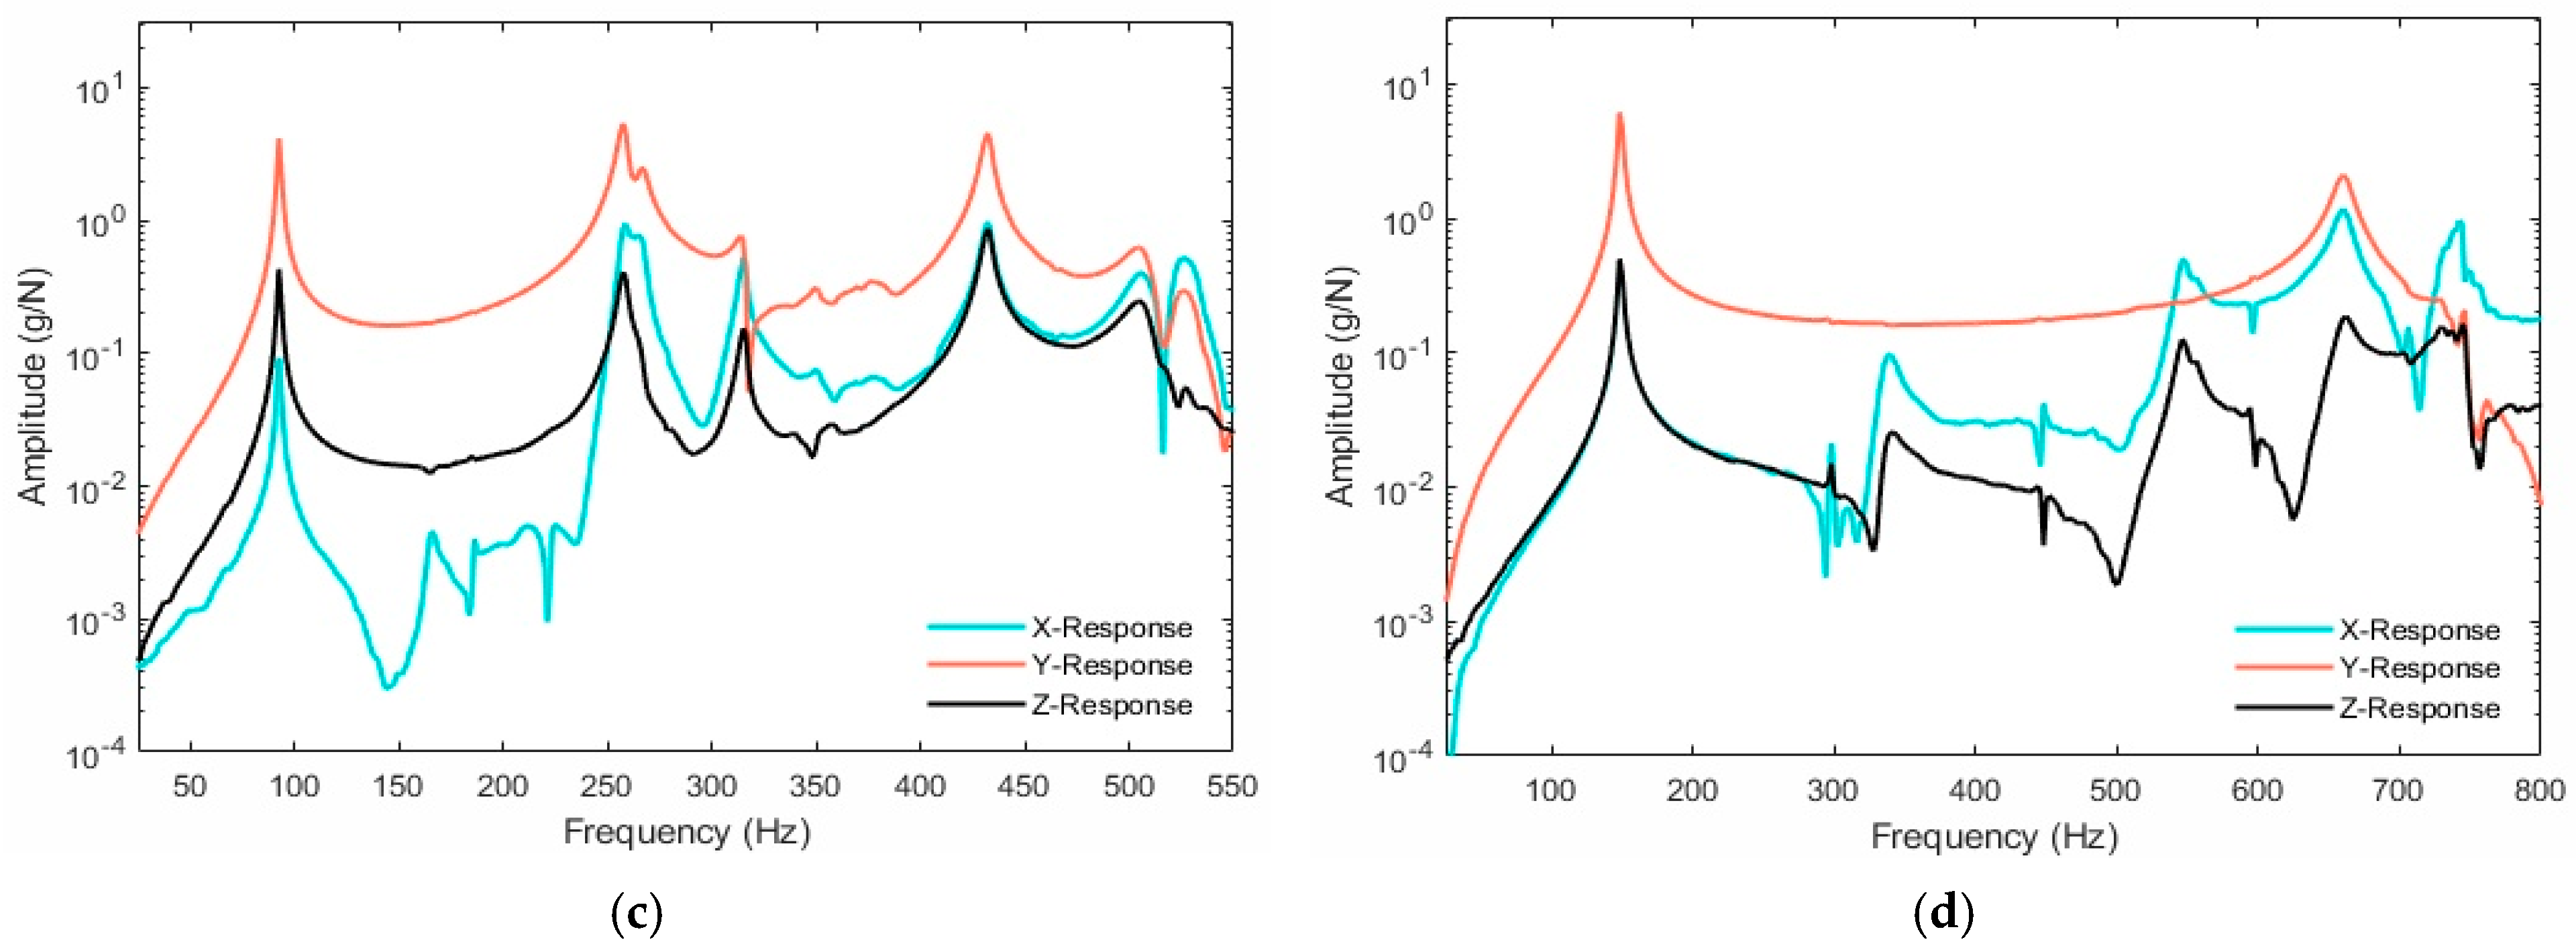
Figure 9.
Impact vibration testing comparing (a) X-direction, (b) Y-direction, and (c) Z-direction responses from different accelerometers for the 0.5″ cut BARC system.
Figure 9.
Impact vibration testing comparing (a) X-direction, (b) Y-direction, and (c) Z-direction responses from different accelerometers for the 0.5″ cut BARC system.
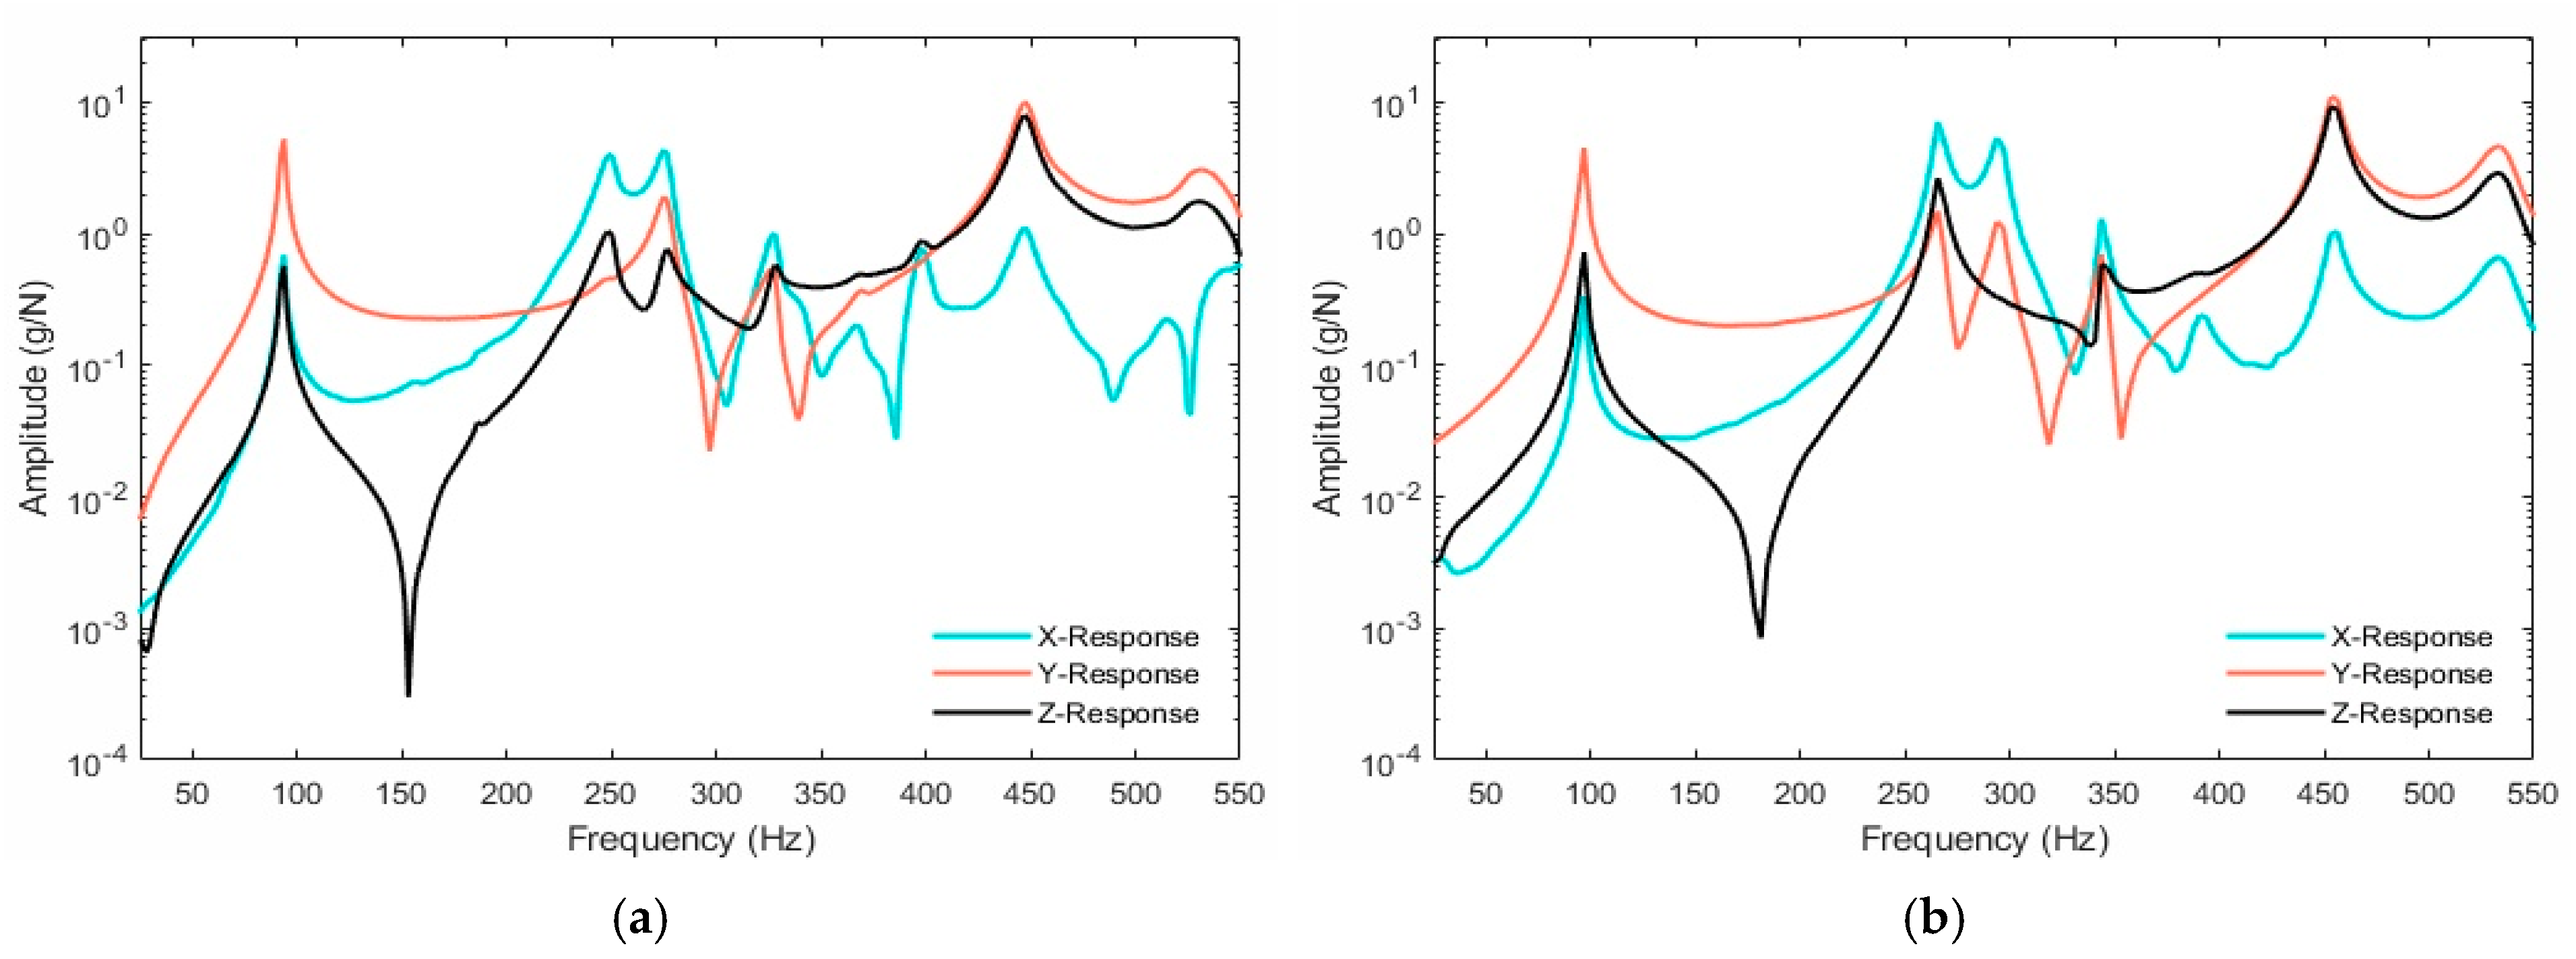
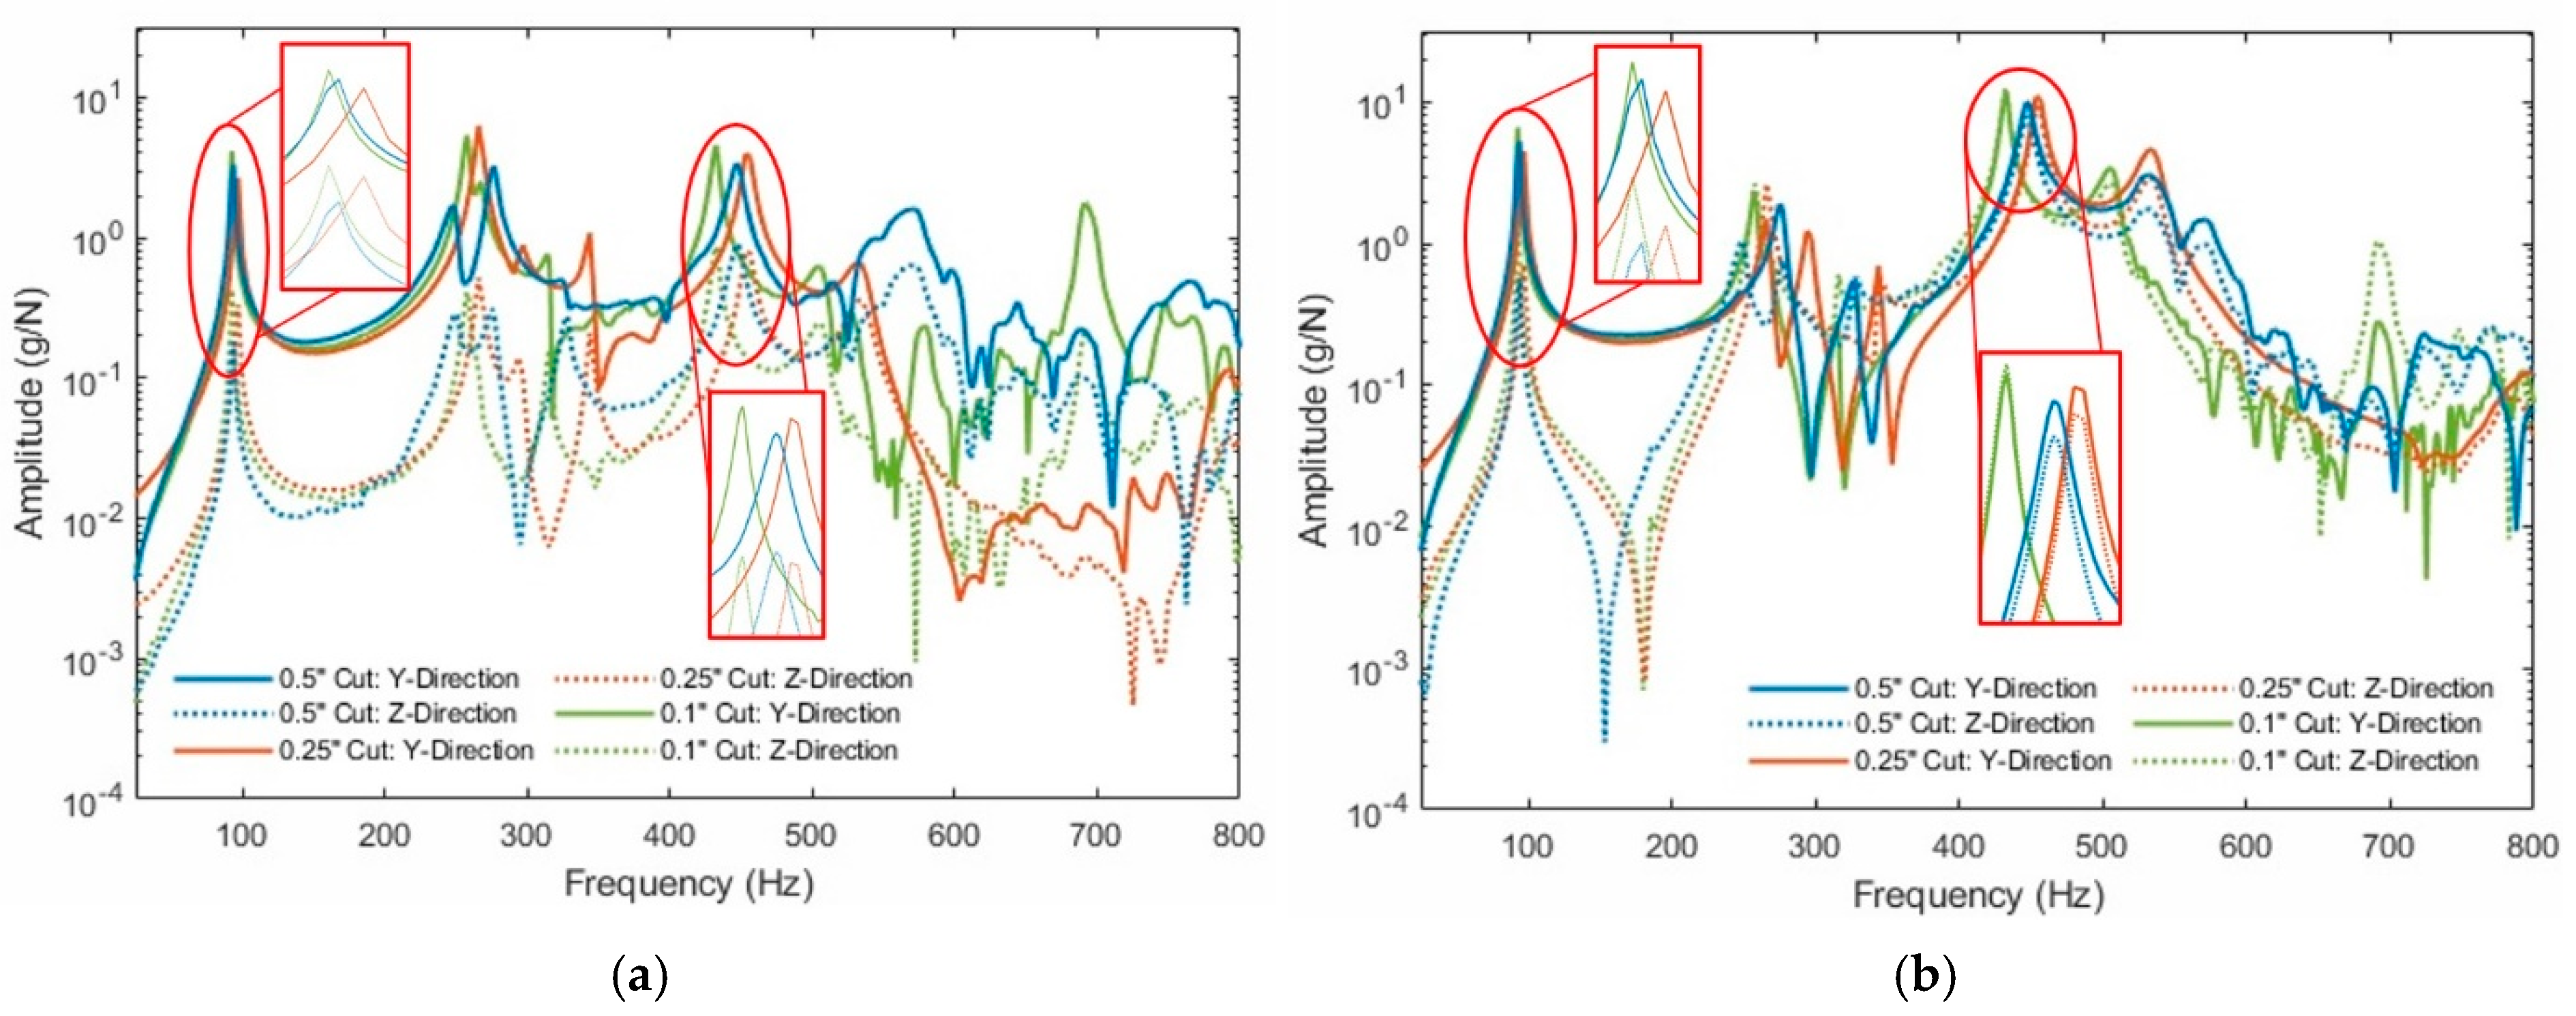
Figure 10.
A comparison of impact results using (a) the side accelerometer and (b) the RC accelerometer.
Figure 10.
A comparison of impact results using (a) the side accelerometer and (b) the RC accelerometer.
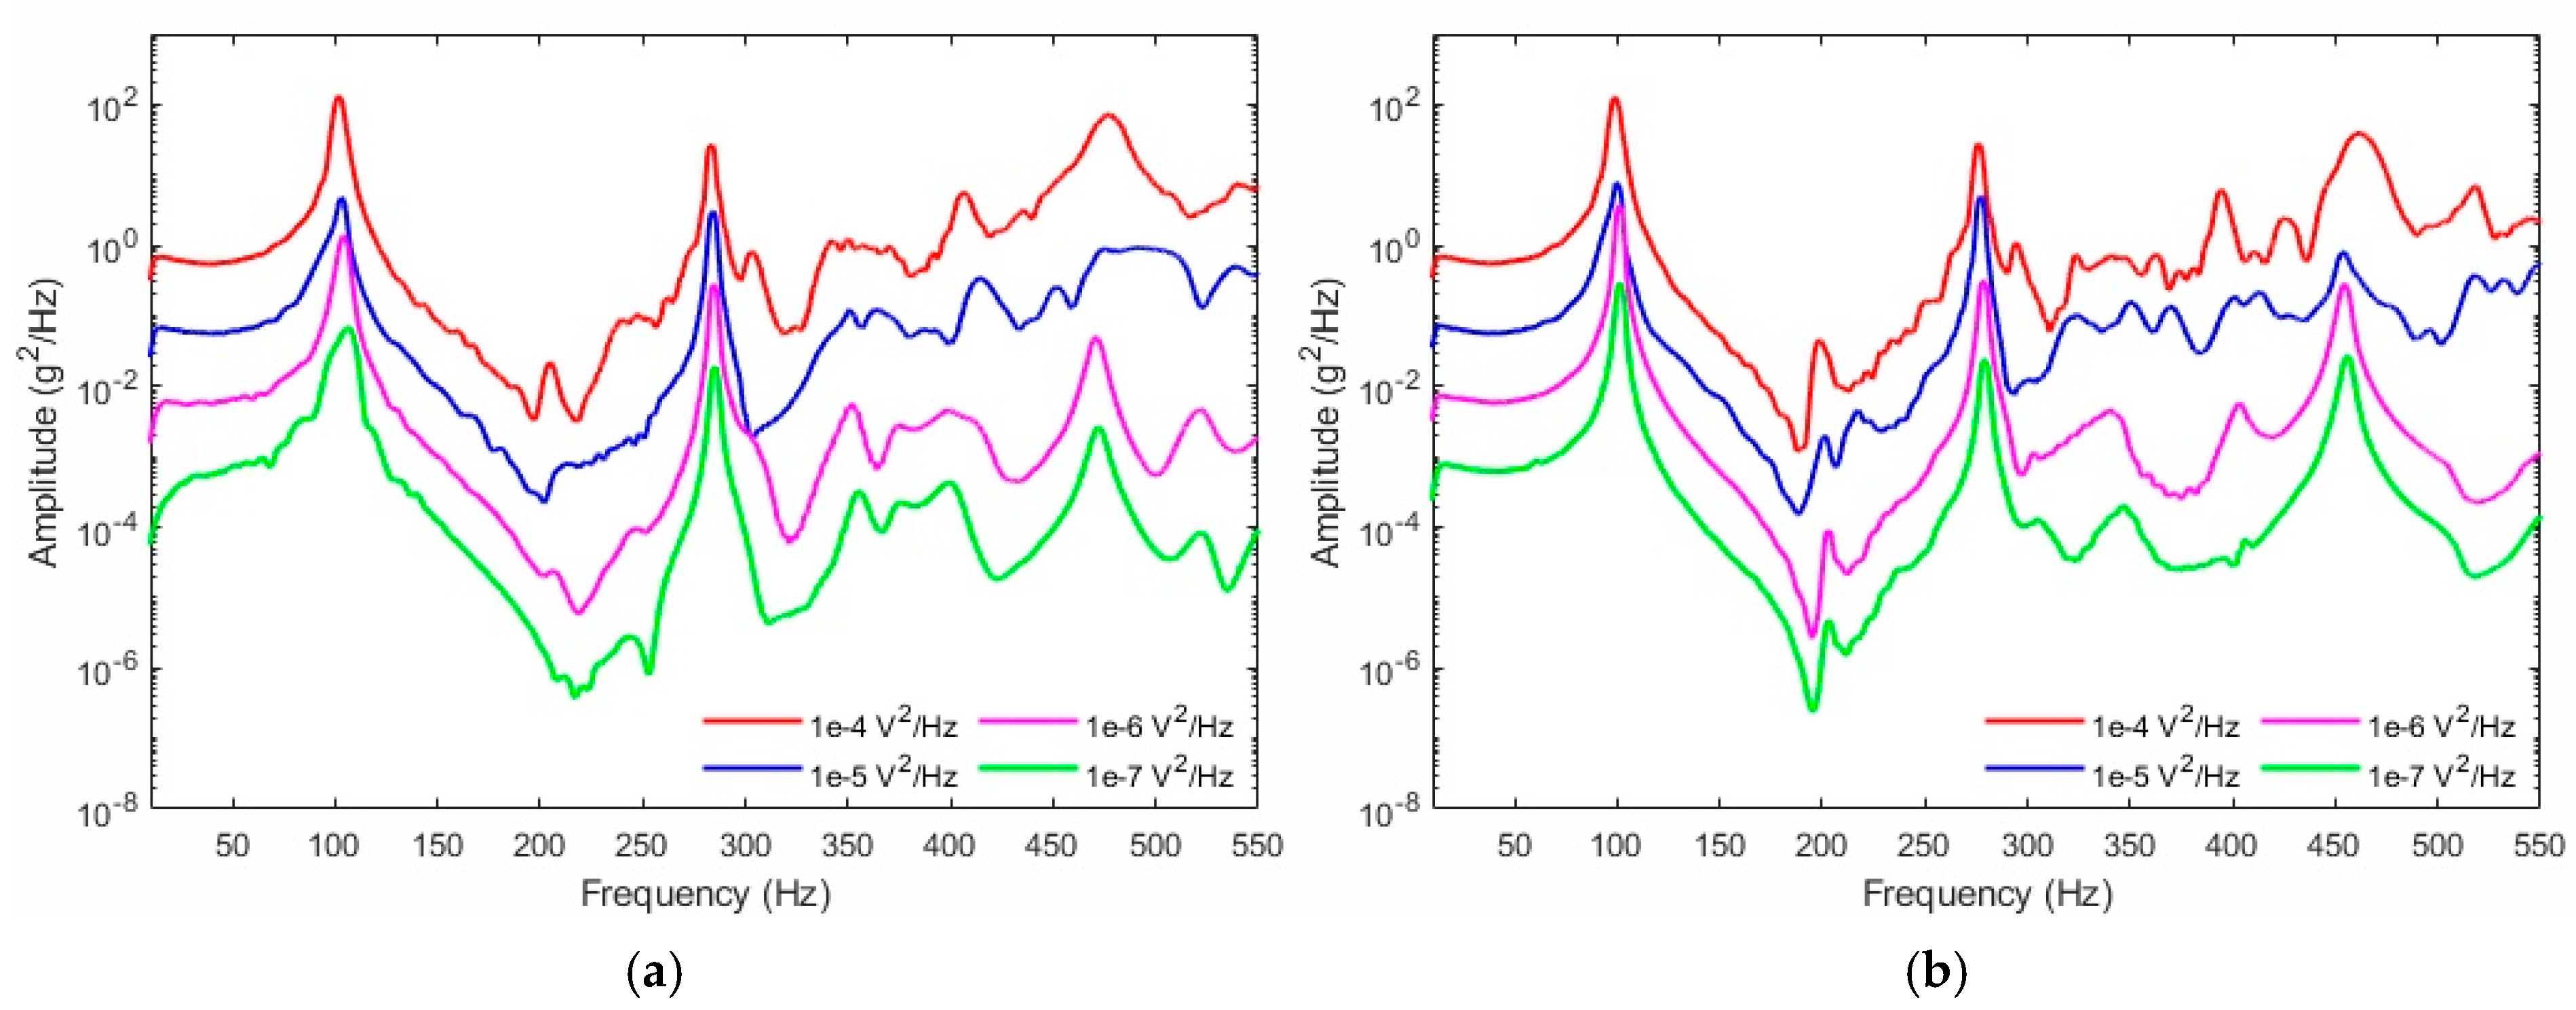
Figure 11.
Random vibration results from the Y-direction of the side accelerometer: (a) 0.5″ cut, (b) 0.25″ cut, (c) 0.1″ cut, and (d) no-cut BARC systems.
Figure 11.
Random vibration results from the Y-direction of the side accelerometer: (a) 0.5″ cut, (b) 0.25″ cut, (c) 0.1″ cut, and (d) no-cut BARC systems.
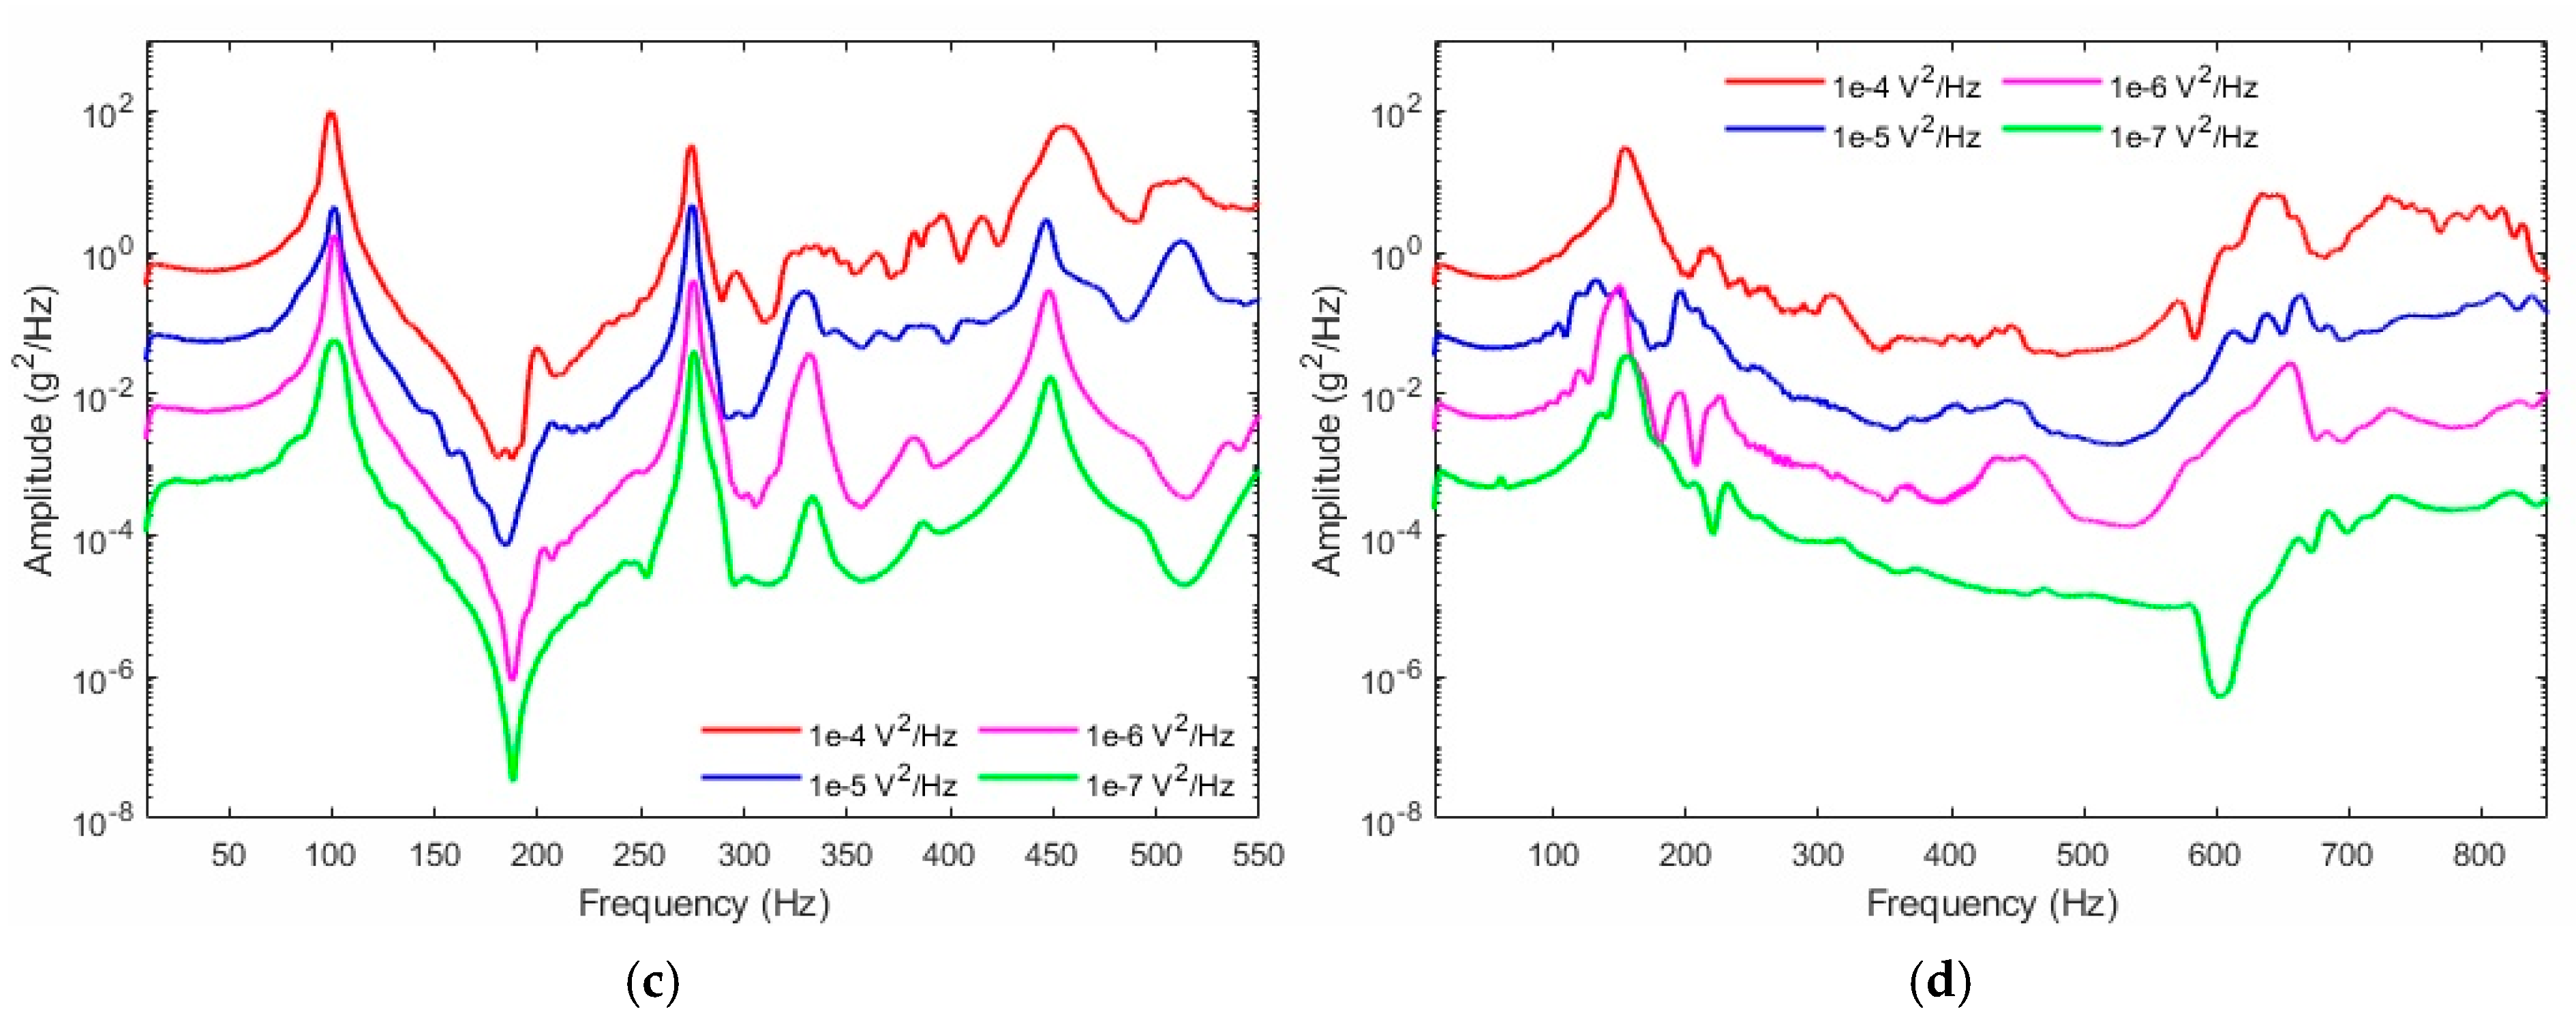
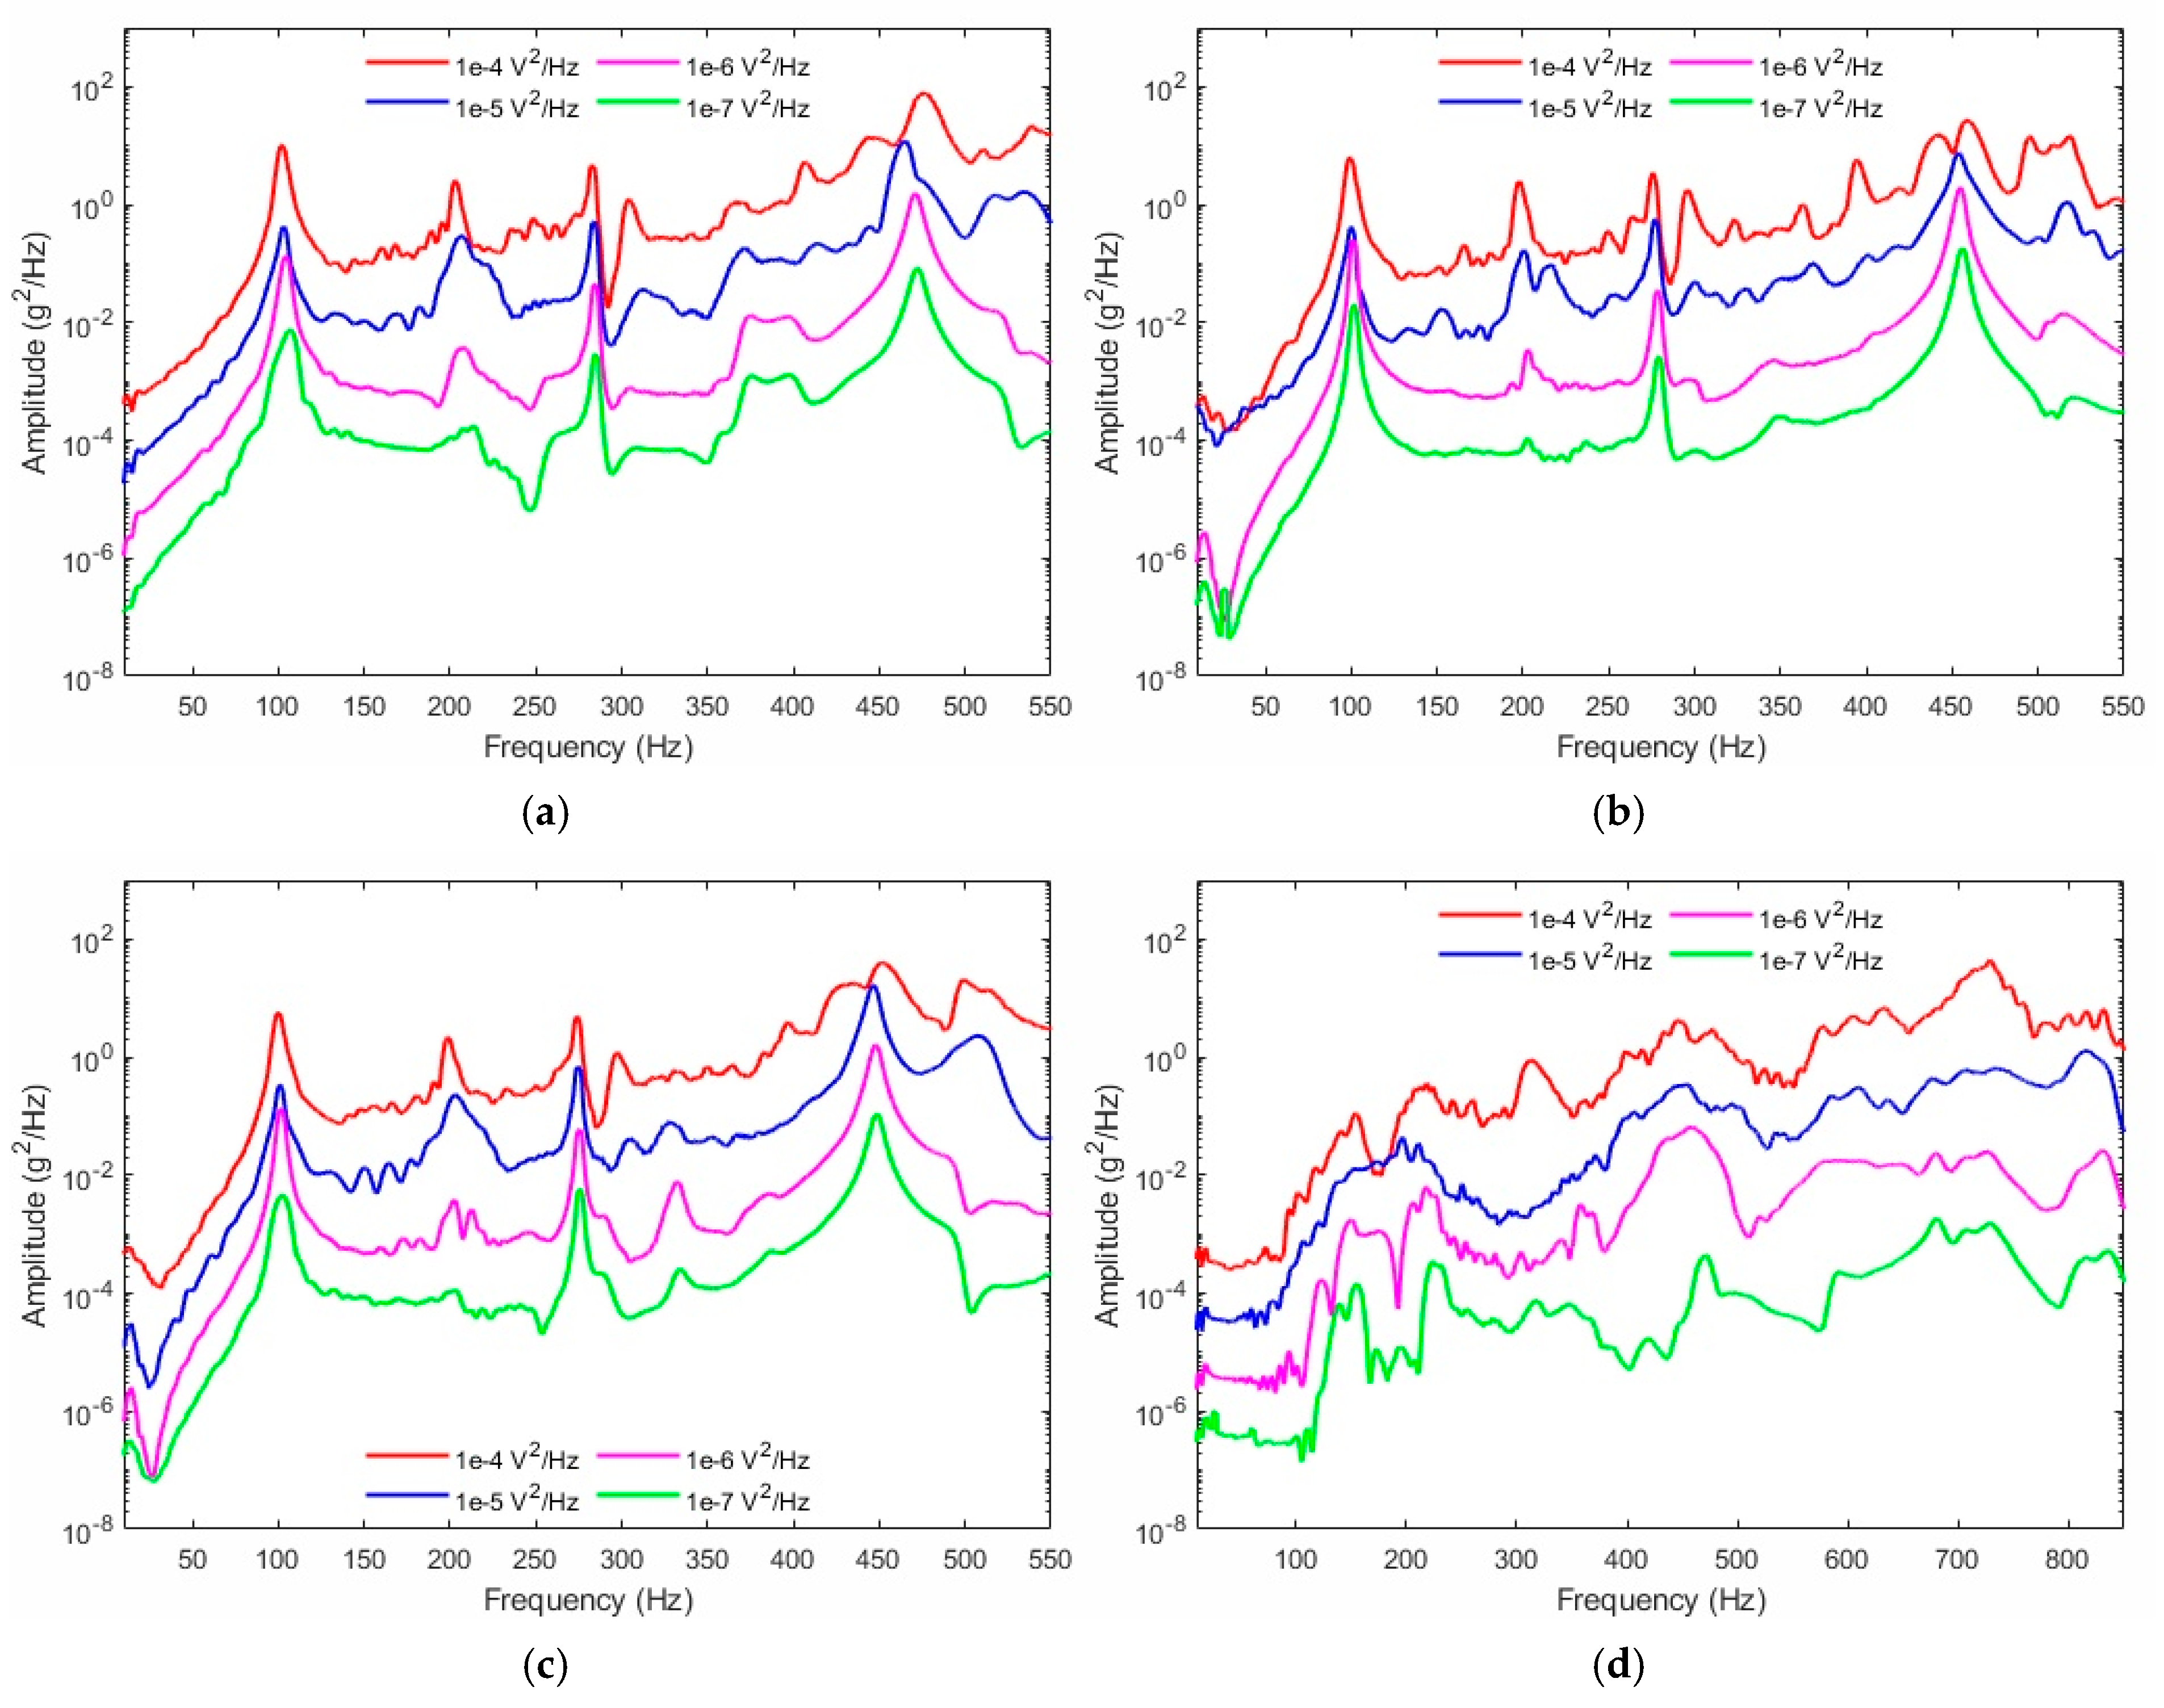
Figure 12.
Random vibration results from the RC accelerometer in the Y-direction: (a) 0.5″ cut, (b) 0.25″ cut, (c) 0.1″ cut, and (d) no-cut BARC systems.
Figure 12.
Random vibration results from the RC accelerometer in the Y-direction: (a) 0.5″ cut, (b) 0.25″ cut, (c) 0.1″ cut, and (d) no-cut BARC systems.
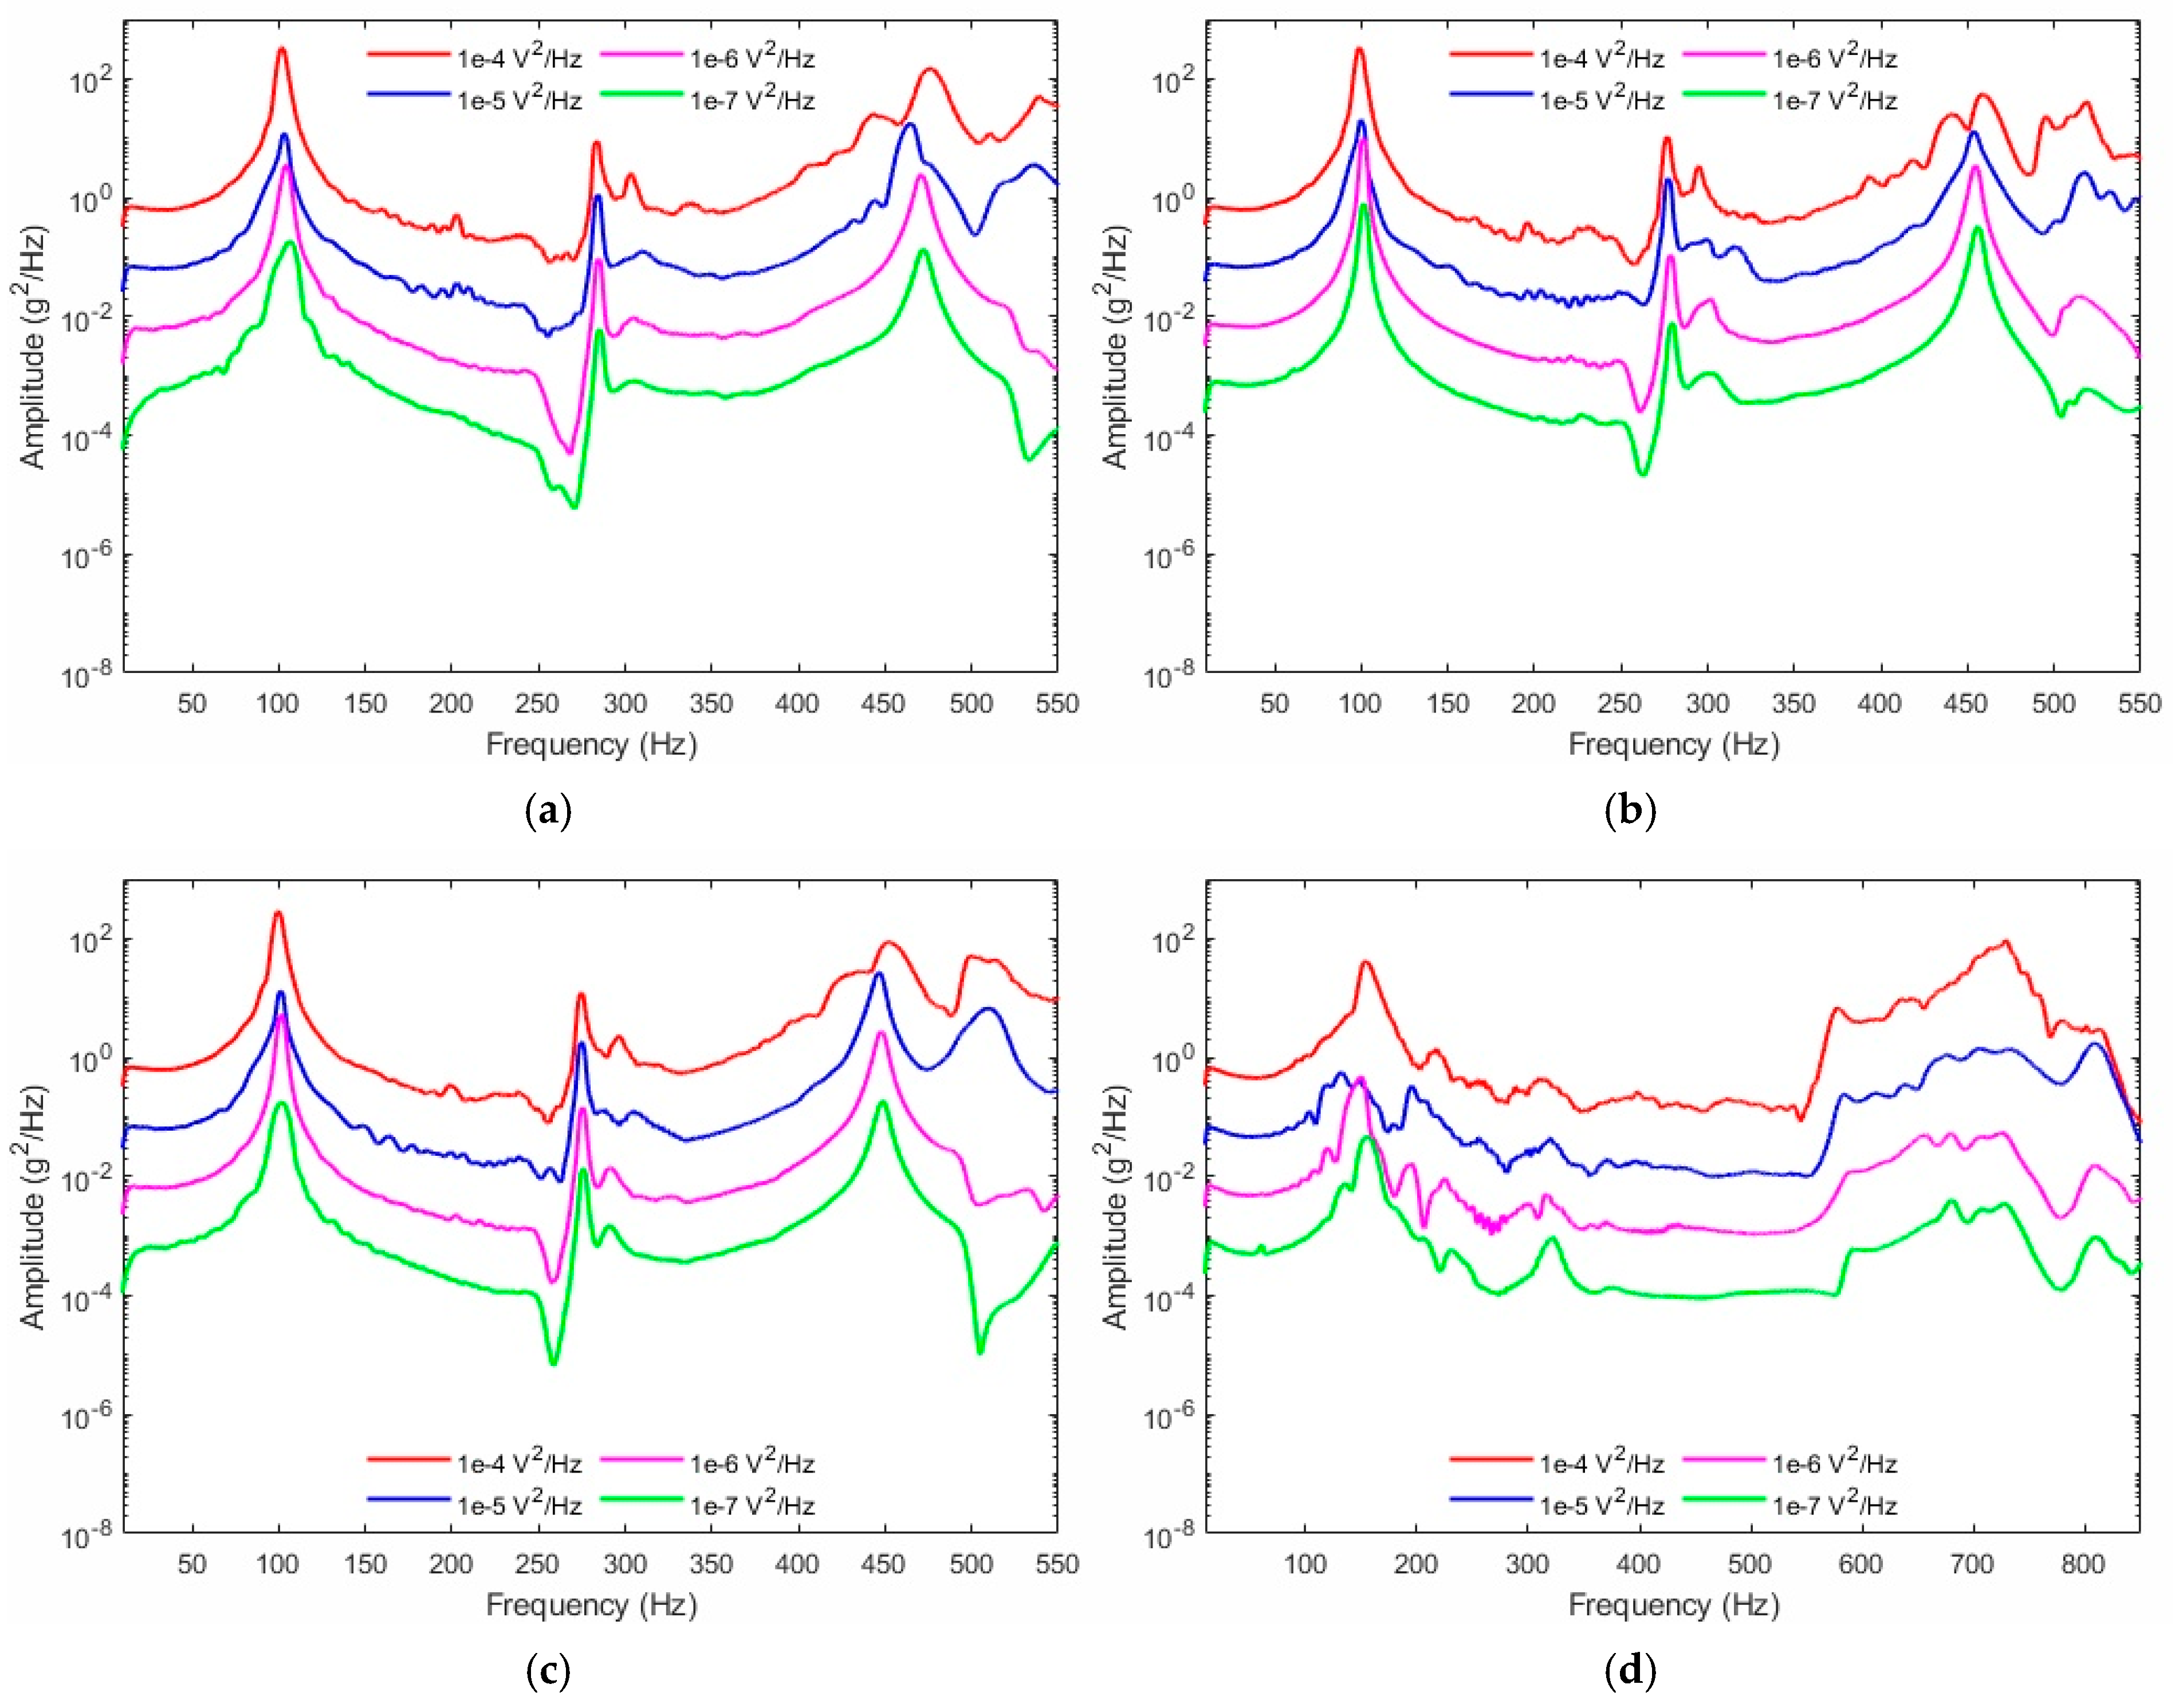
Figure 13.
Random vibration results using the RC accelerometer in the Z-direction: (a) 0.5″ cut, (b) 0.25″ cut, (c) 0.1″ cut, and (d) no-cut BARC systems.
Figure 13.
Random vibration results using the RC accelerometer in the Z-direction: (a) 0.5″ cut, (b) 0.25″ cut, (c) 0.1″ cut, and (d) no-cut BARC systems.
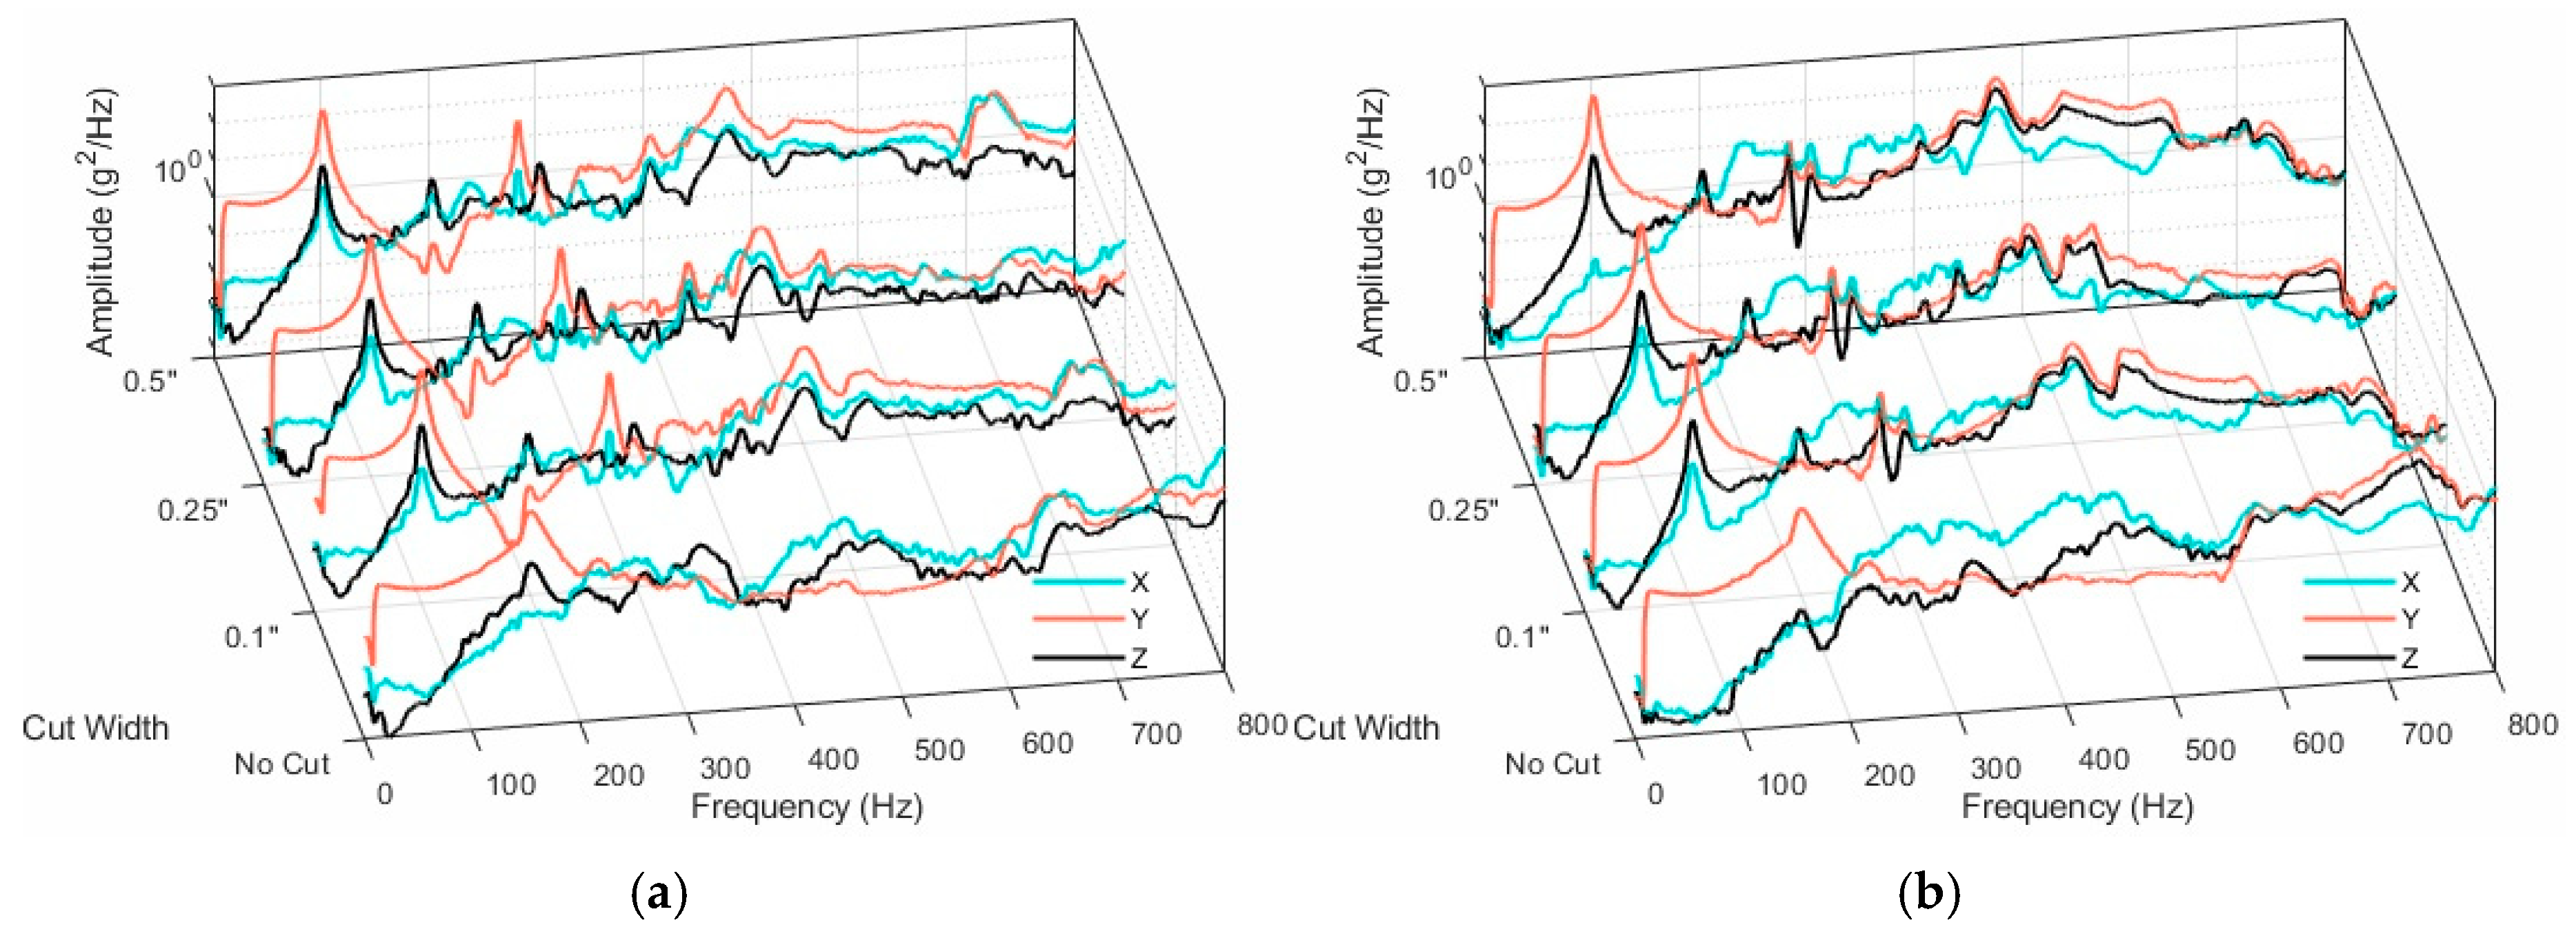
Figure 14.
A 3-D comparison of all cut widths for the (a) side and (b) RC accelerometers using data from the 1 × 10⁻⁴ V2/Hz excitation.
Figure 14.
A 3-D comparison of all cut widths for the (a) side and (b) RC accelerometers using data from the 1 × 10⁻⁴ V2/Hz excitation.
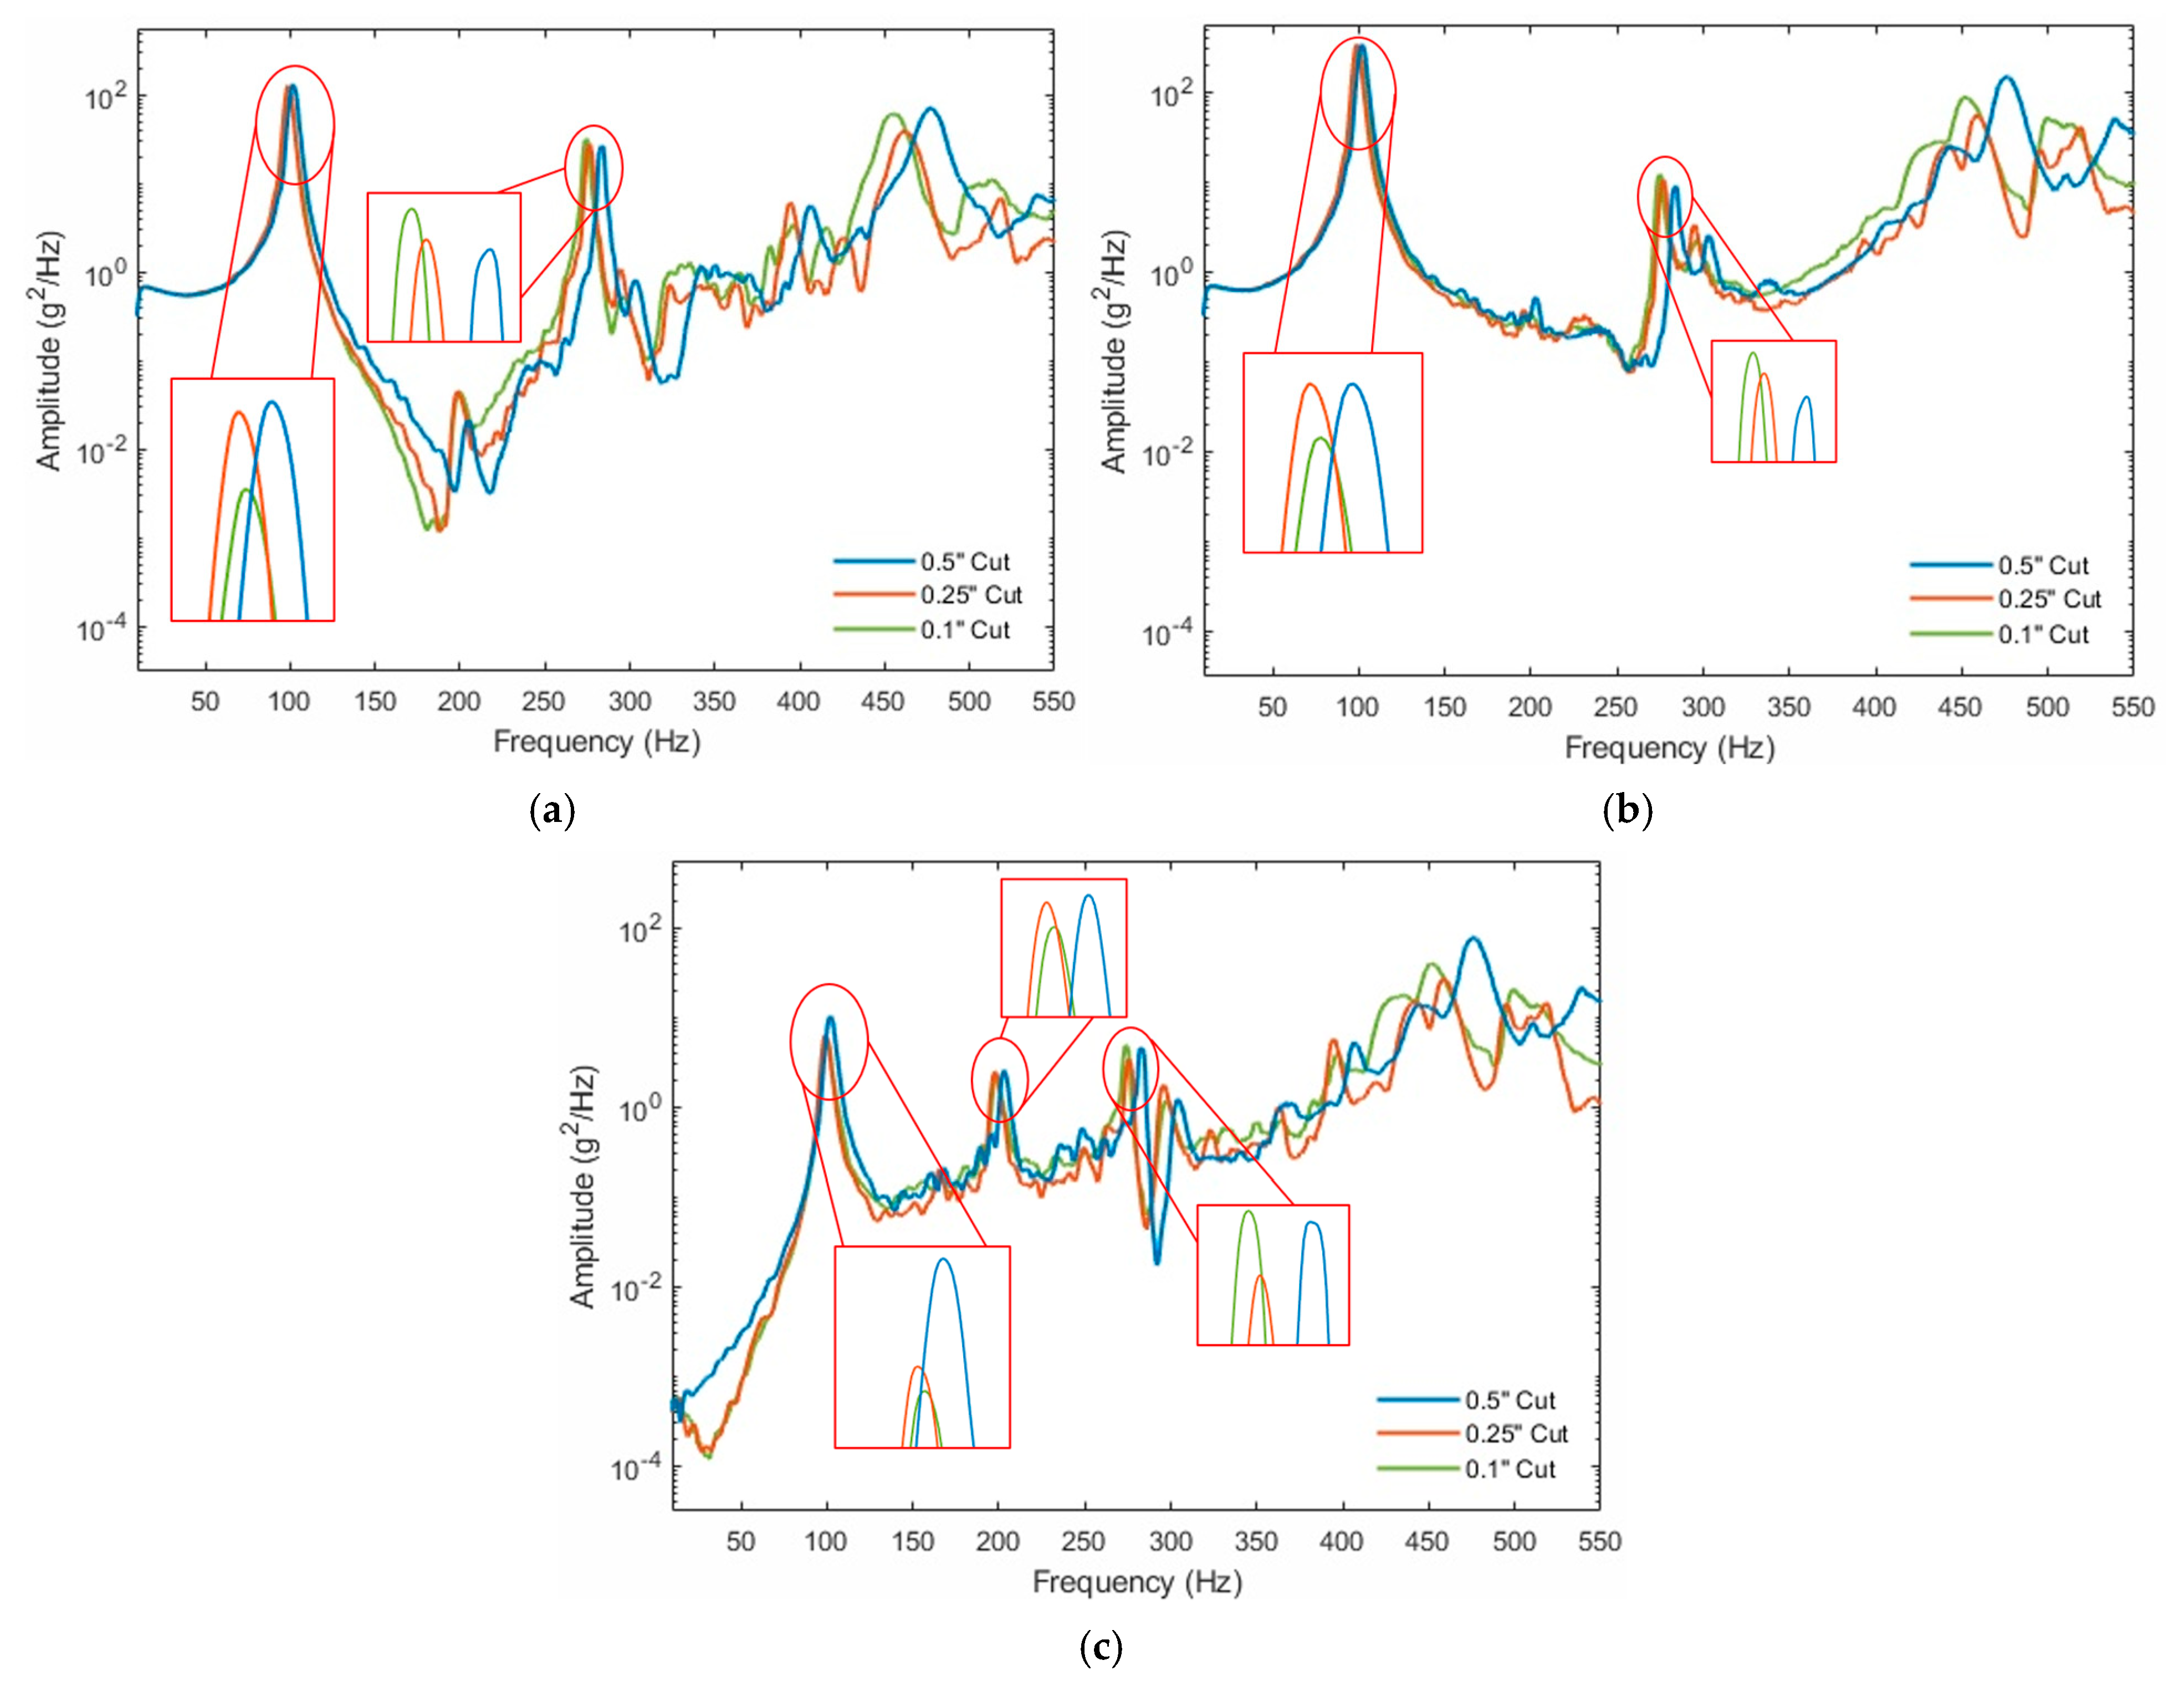
Figure 15.
A comparison of BARC central-cut width configurations using random vibration testing from the (a) side Y, (b) RC Y, and (c) RC Z accelerometers at 1 × 10⁻⁴ V2/Hz excitation.
Figure 15.
A comparison of BARC central-cut width configurations using random vibration testing from the (a) side Y, (b) RC Y, and (c) RC Z accelerometers at 1 × 10⁻⁴ V2/Hz excitation.
Figure 16.
Harmonic vibration results from the Y-direction of the side accelerometer: (a) 0.5″ cut, (b) 0.25″ cut, (c) 0.1″ cut, and (d) no-cut BARC systems.
Figure 16.
Harmonic vibration results from the Y-direction of the side accelerometer: (a) 0.5″ cut, (b) 0.25″ cut, (c) 0.1″ cut, and (d) no-cut BARC systems.
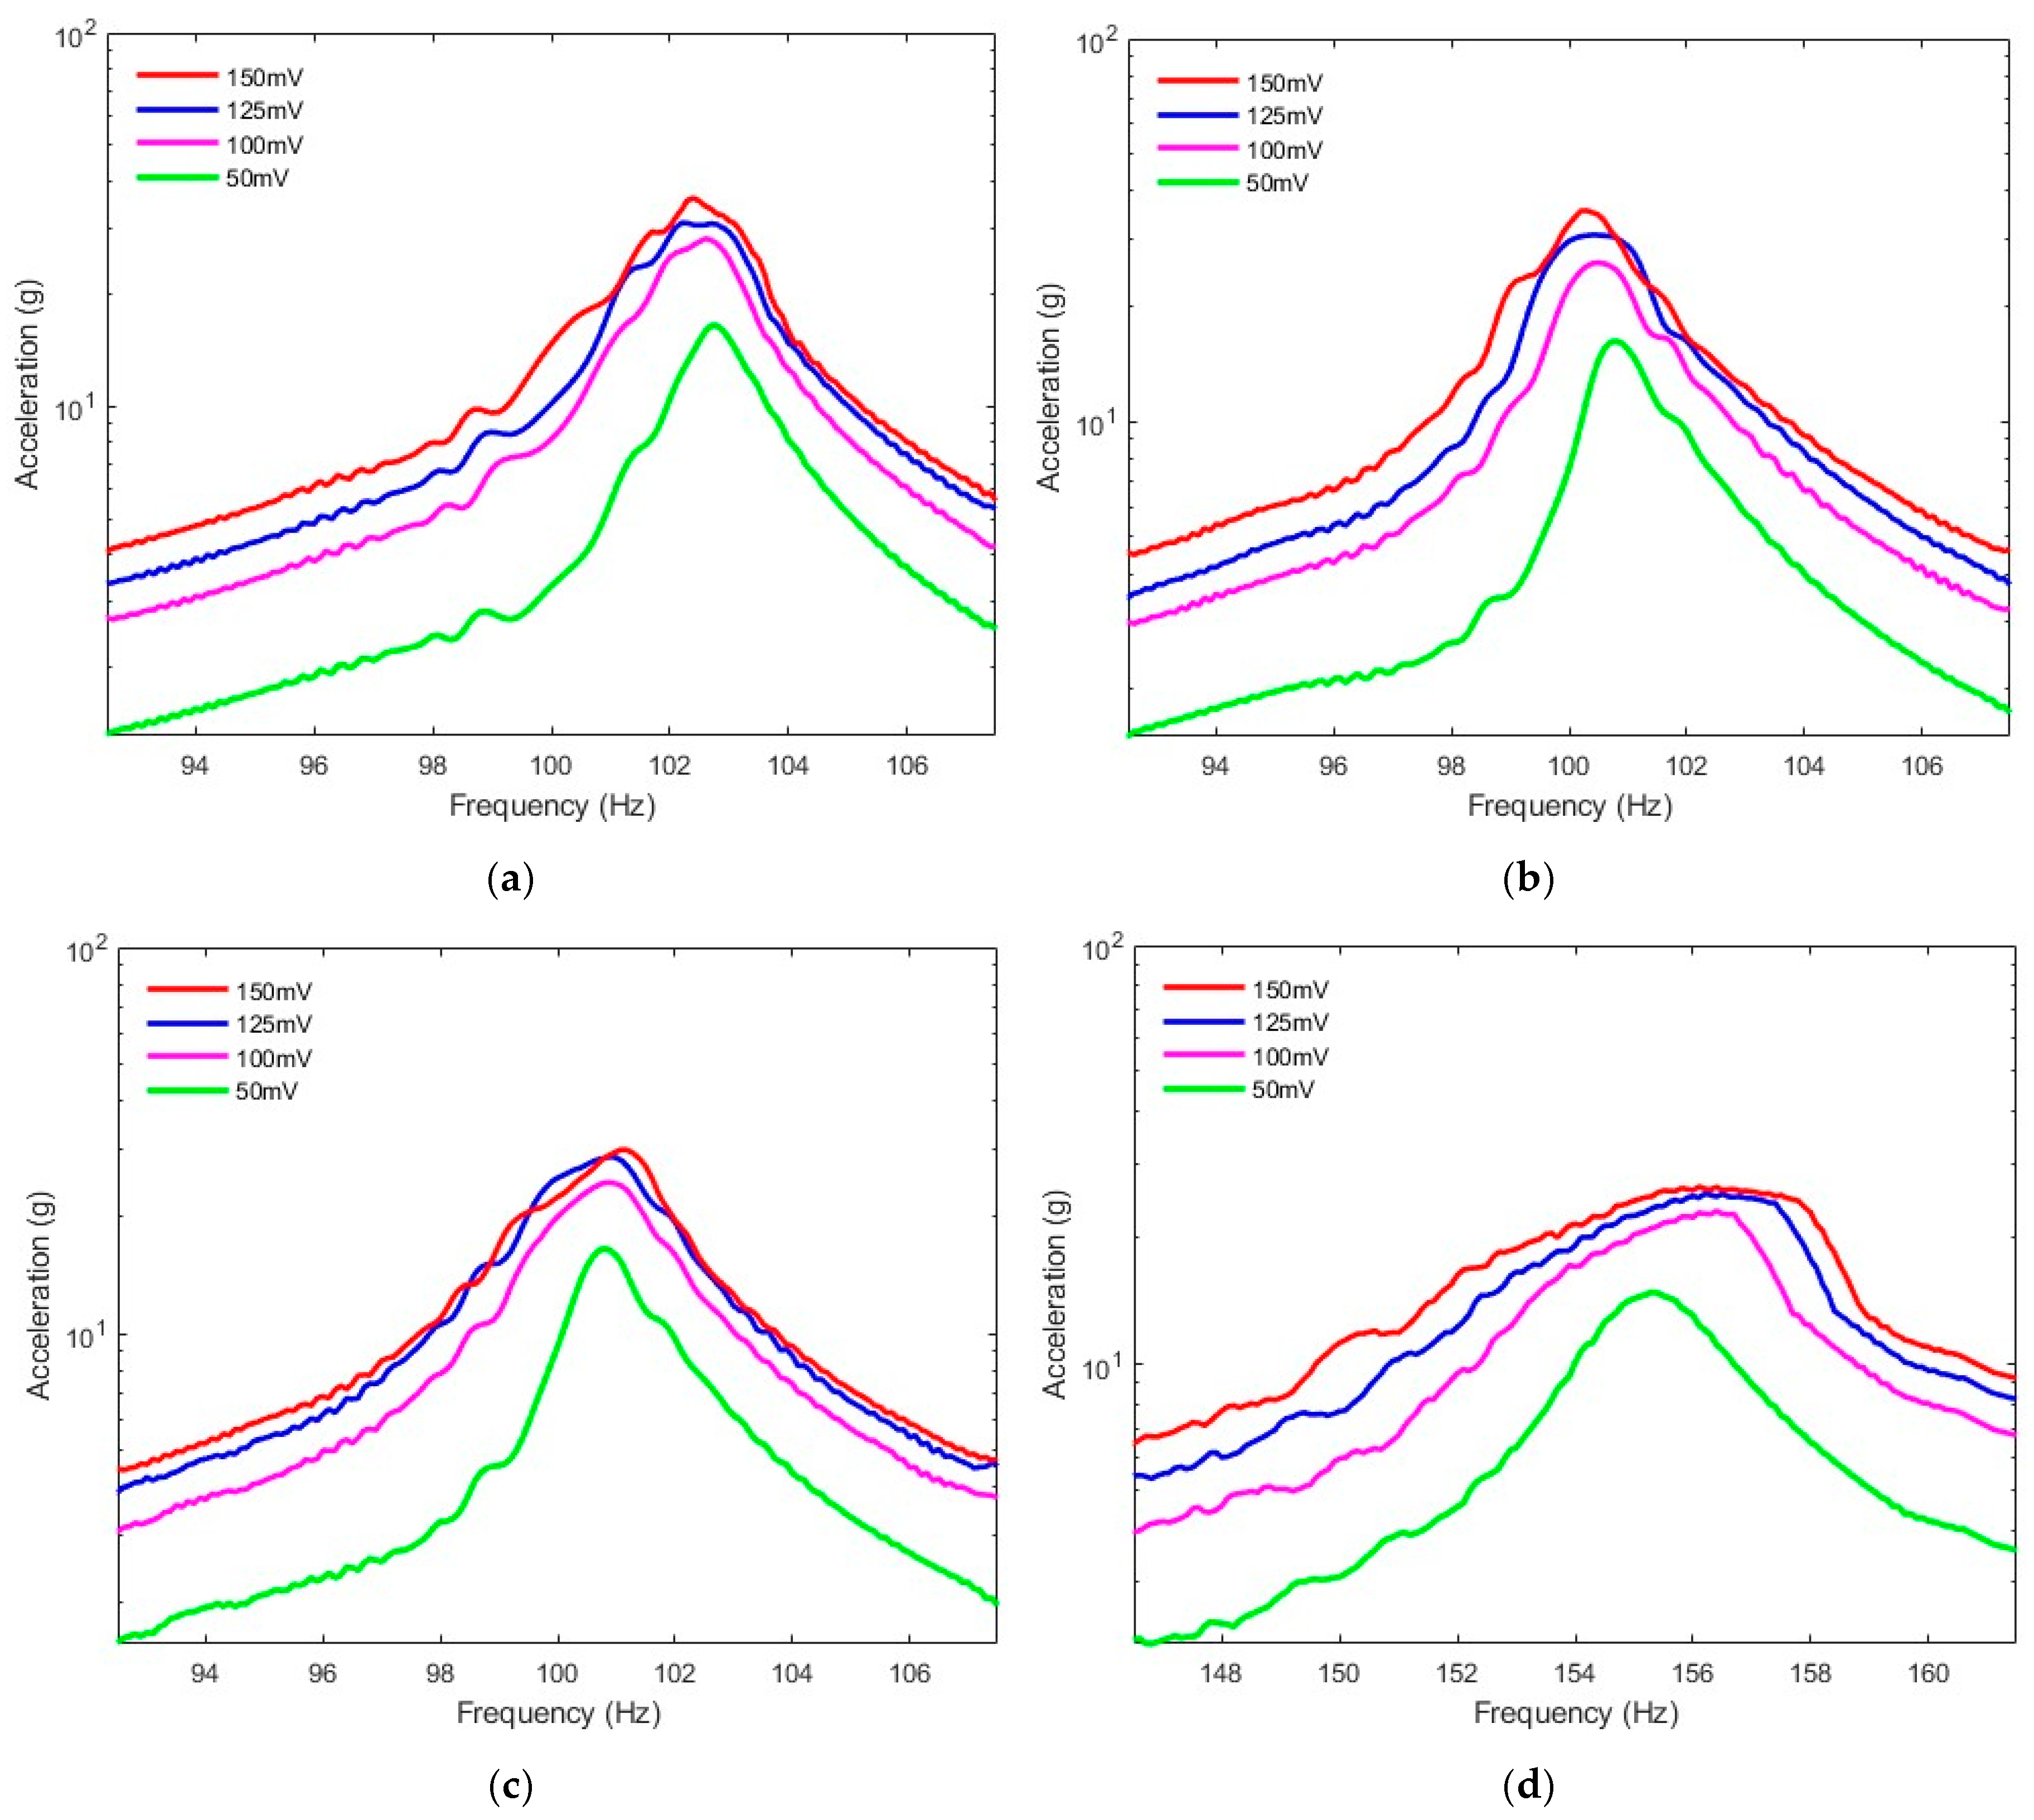
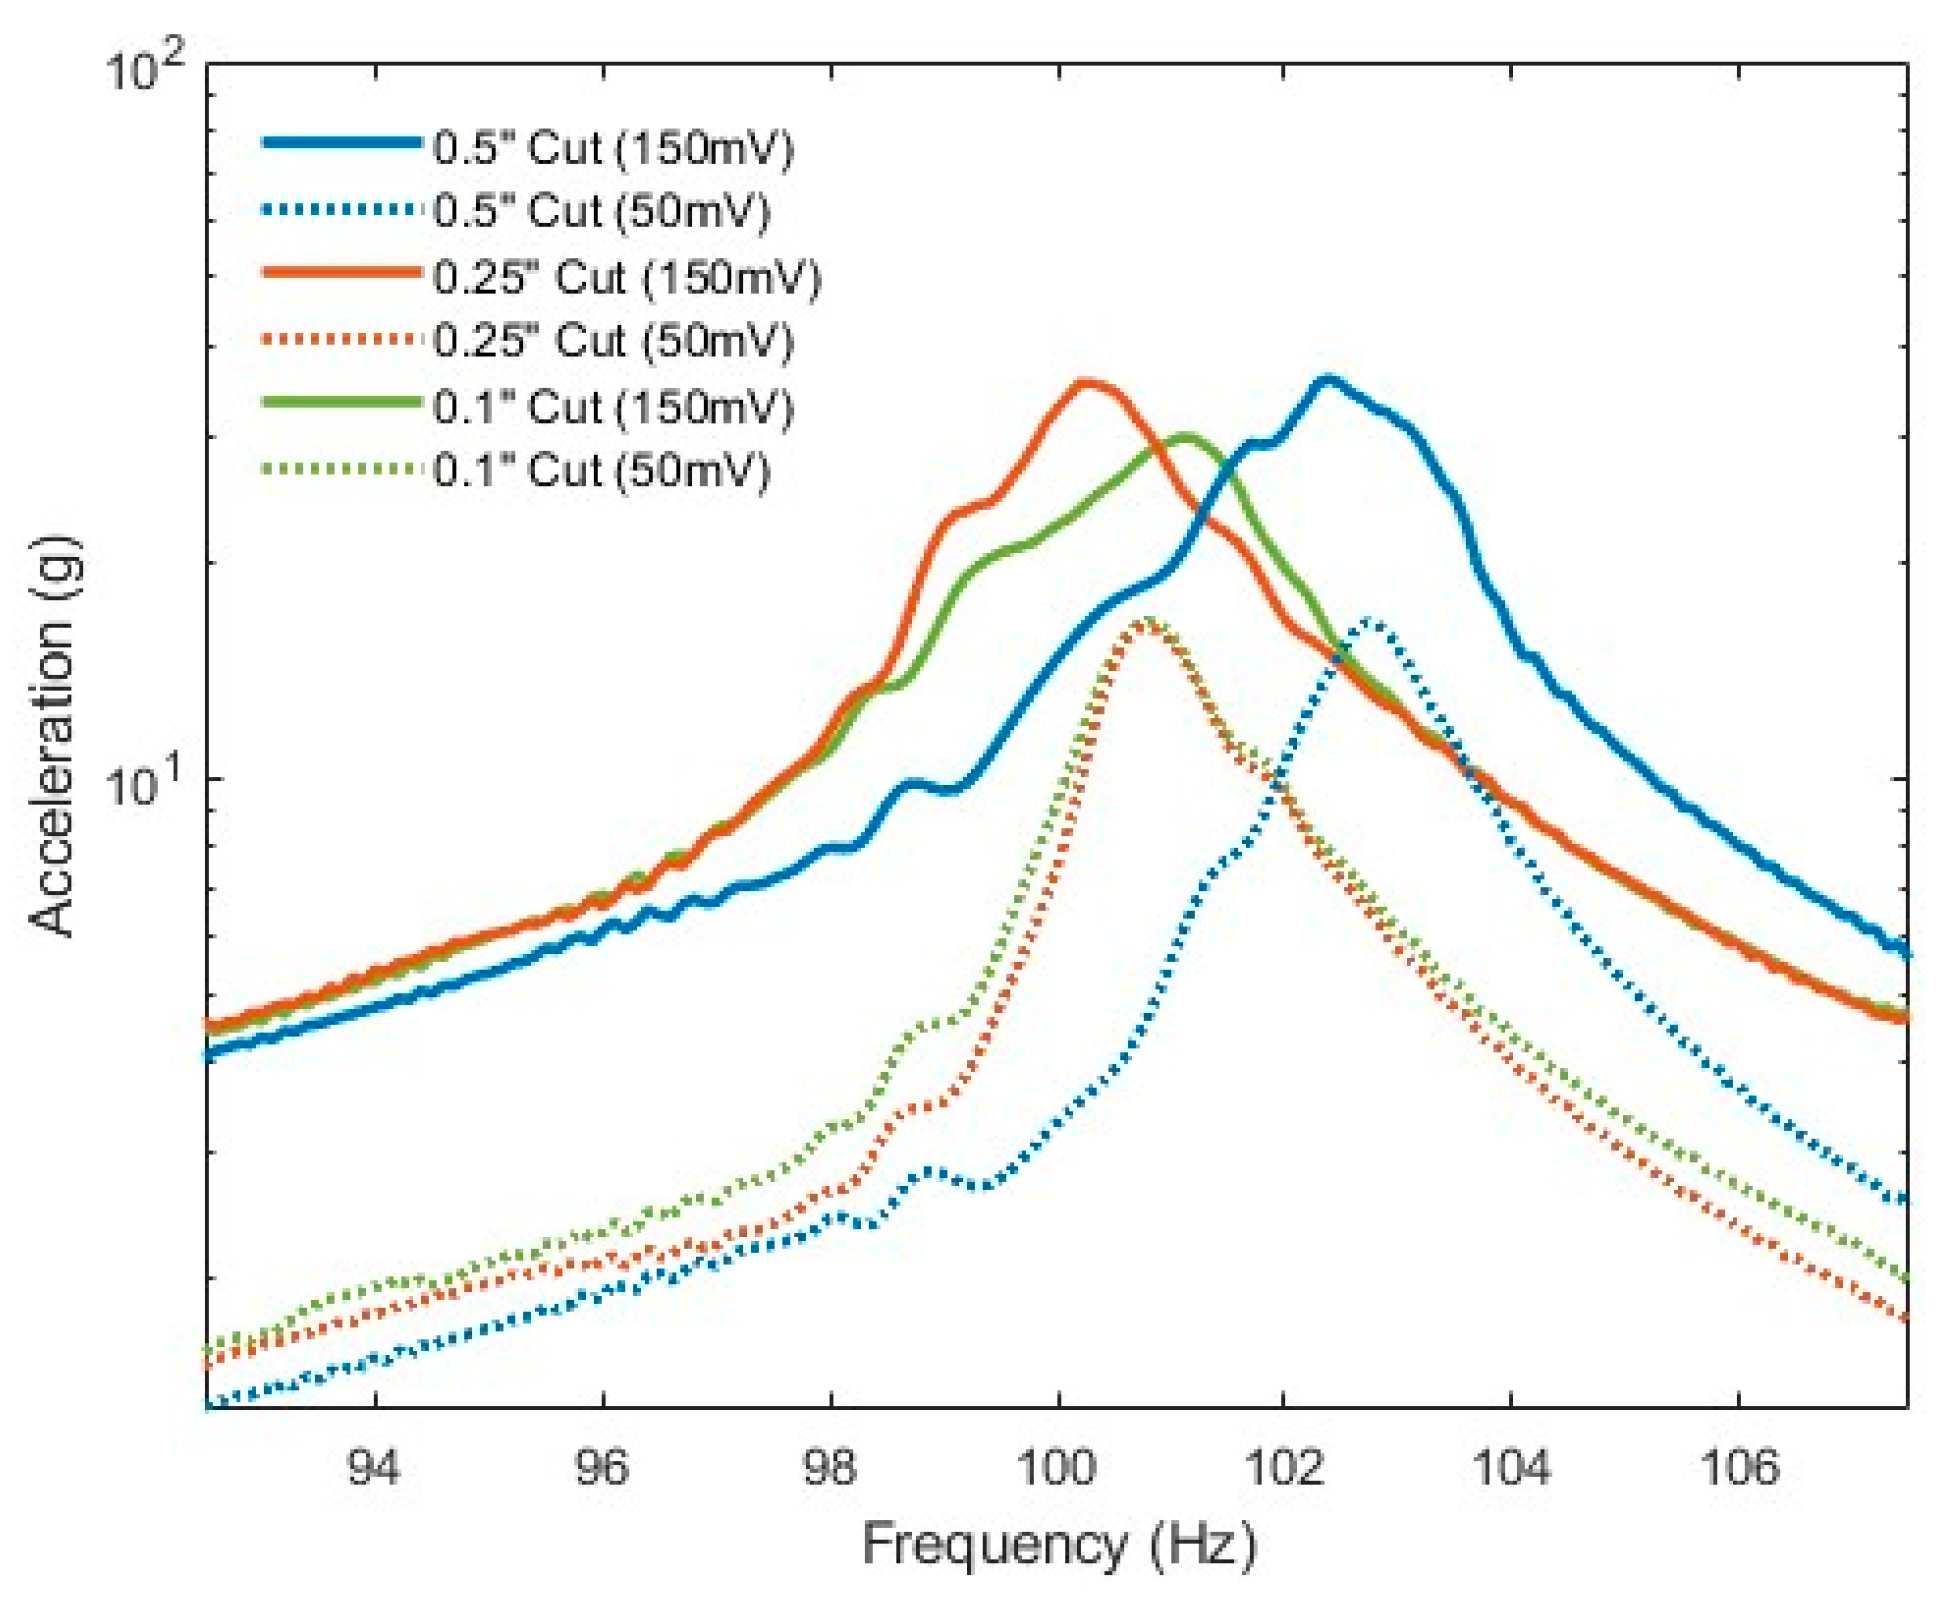
Figure 17.
A comparison of central-cut width configurations using the side accelerometer in the Y-direction for the 50 mV and 150 mV input excitation levels.
Figure 17.
A comparison of central-cut width configurations using the side accelerometer in the Y-direction for the 50 mV and 150 mV input excitation levels.
Figure 18.
Harmonic vibration results from the RC Y-direction accelerometer from the (a) 0.5″ cut, (b) 0.25″ cut, (c) 0.1″ cut, and (d) no-cut BARC systems.
Figure 18.
Harmonic vibration results from the RC Y-direction accelerometer from the (a) 0.5″ cut, (b) 0.25″ cut, (c) 0.1″ cut, and (d) no-cut BARC systems.
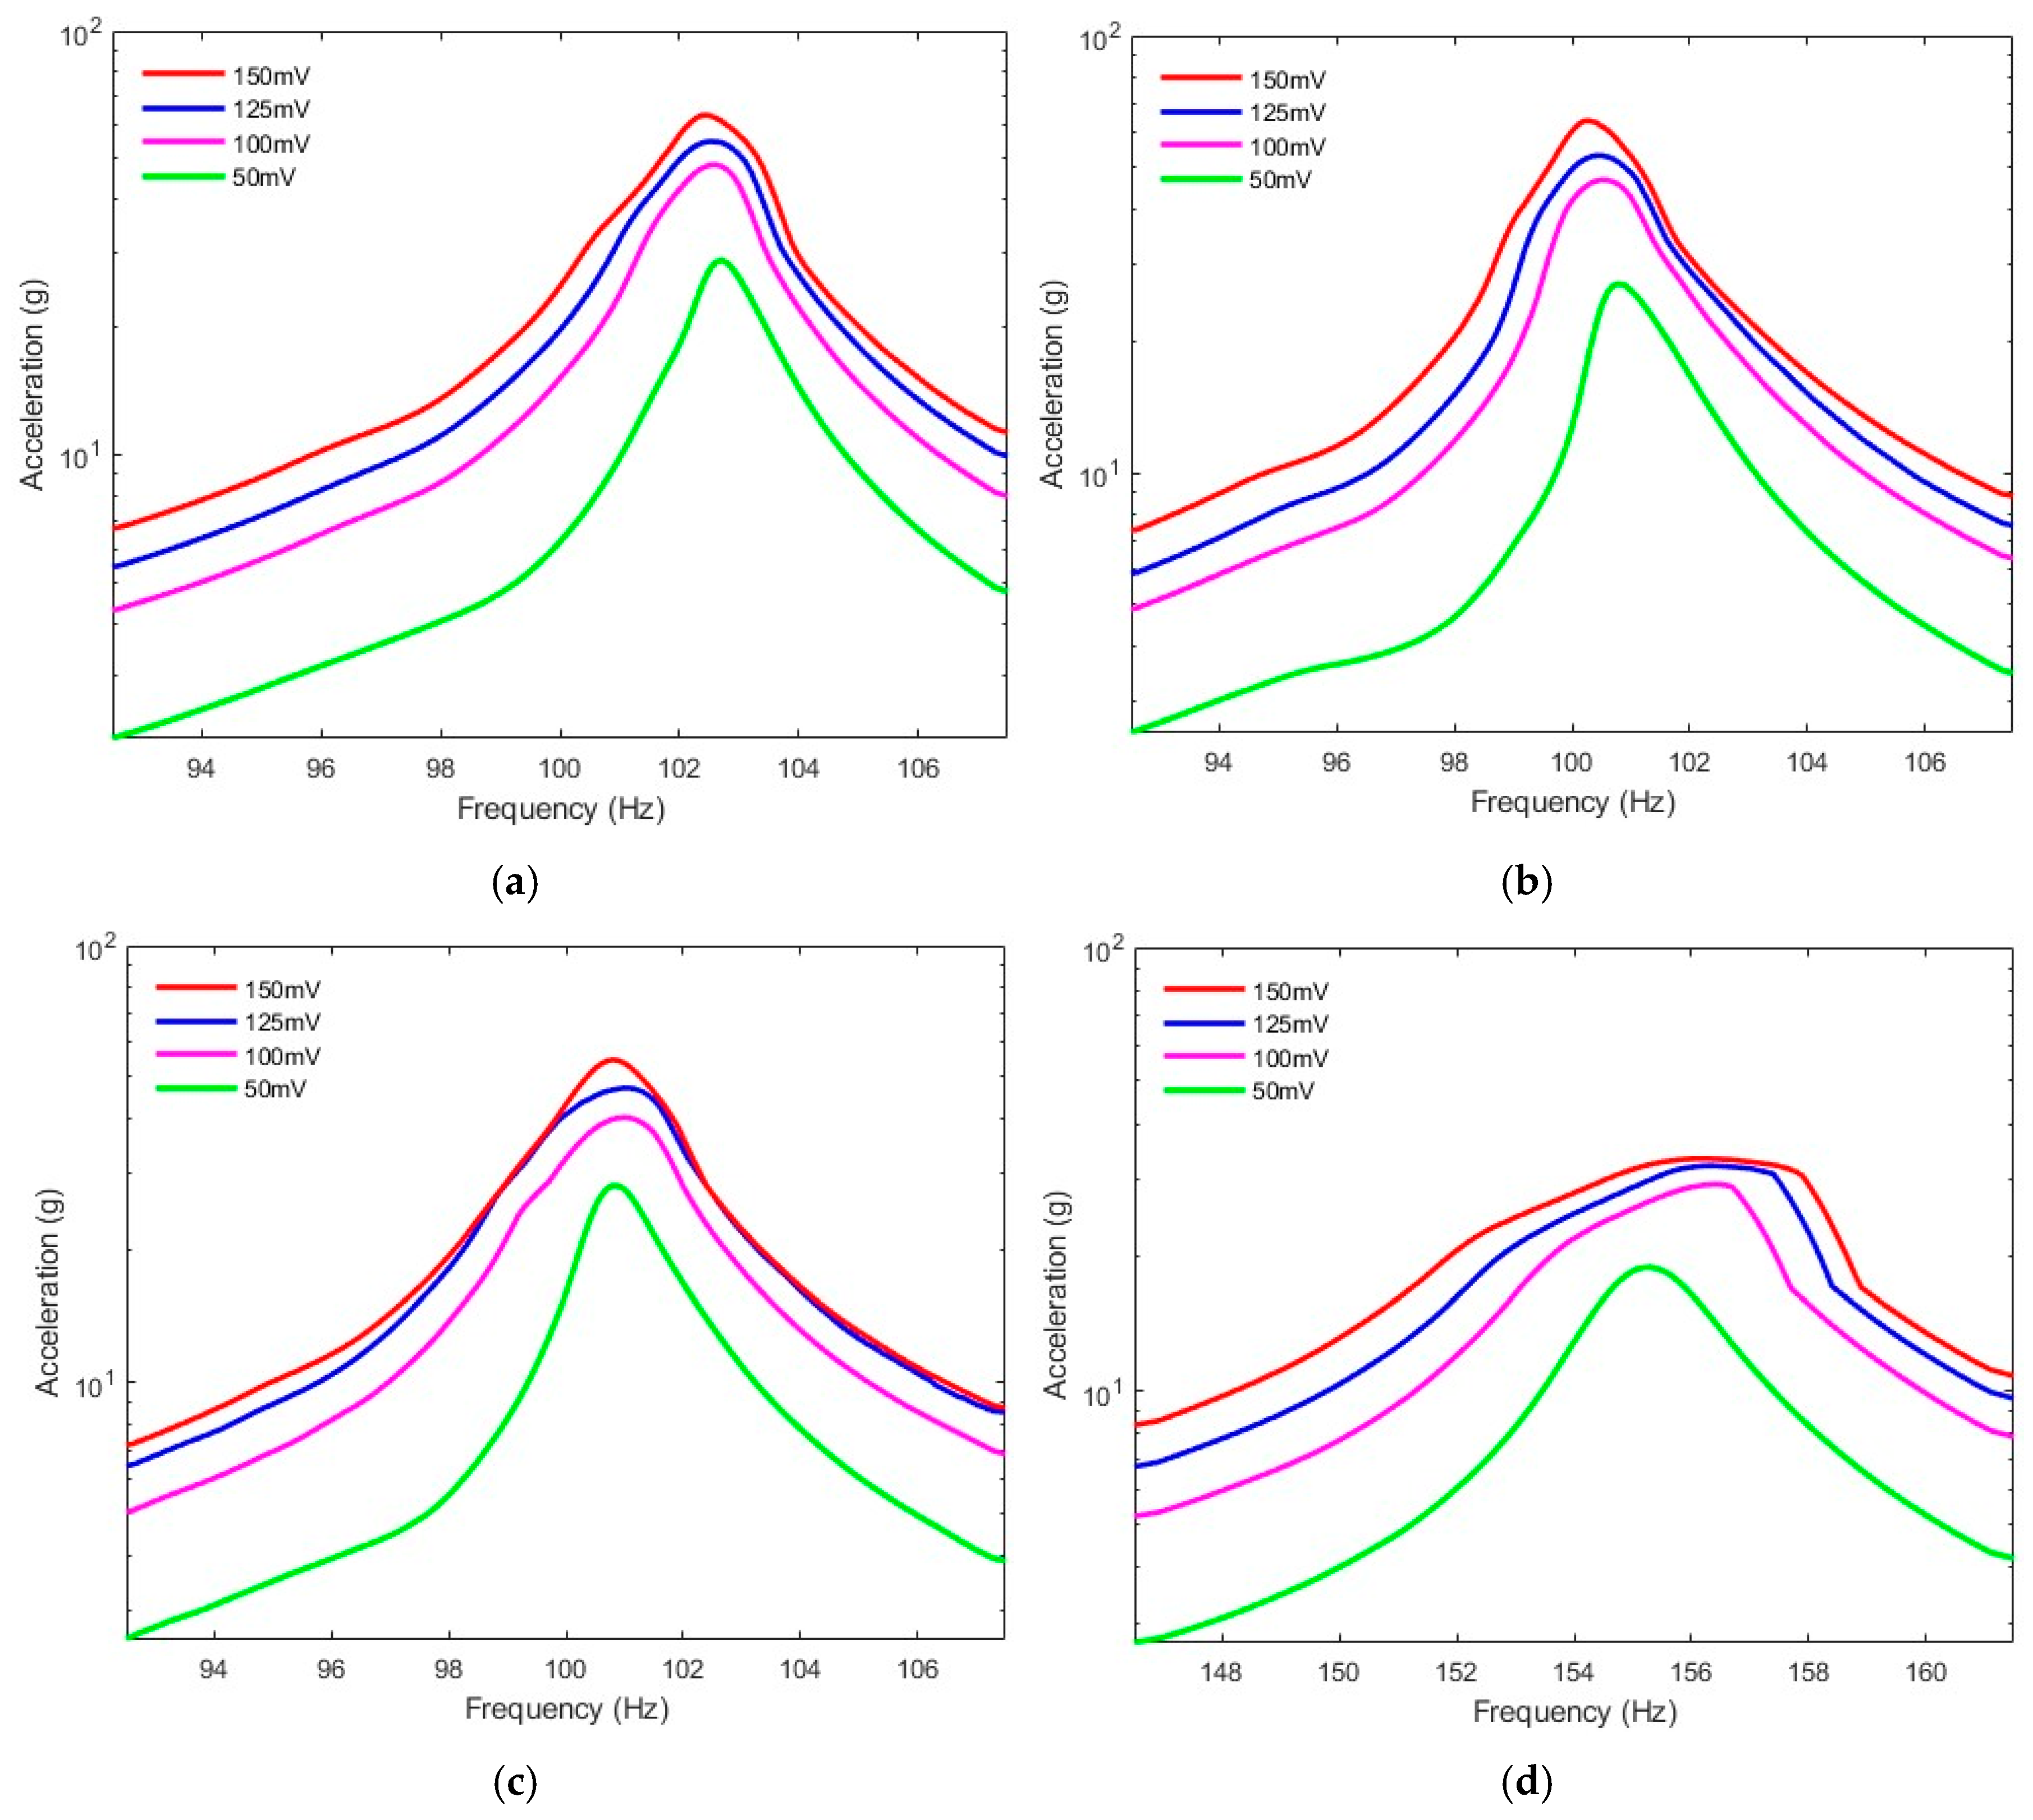
Figure 19.
A comparison of central-cut width configurations using the RC accelerometer in the Y-direction for the 50 mV and 150 mV input levels of excitation.
Figure 19.
A comparison of central-cut width configurations using the RC accelerometer in the Y-direction for the 50 mV and 150 mV input levels of excitation.
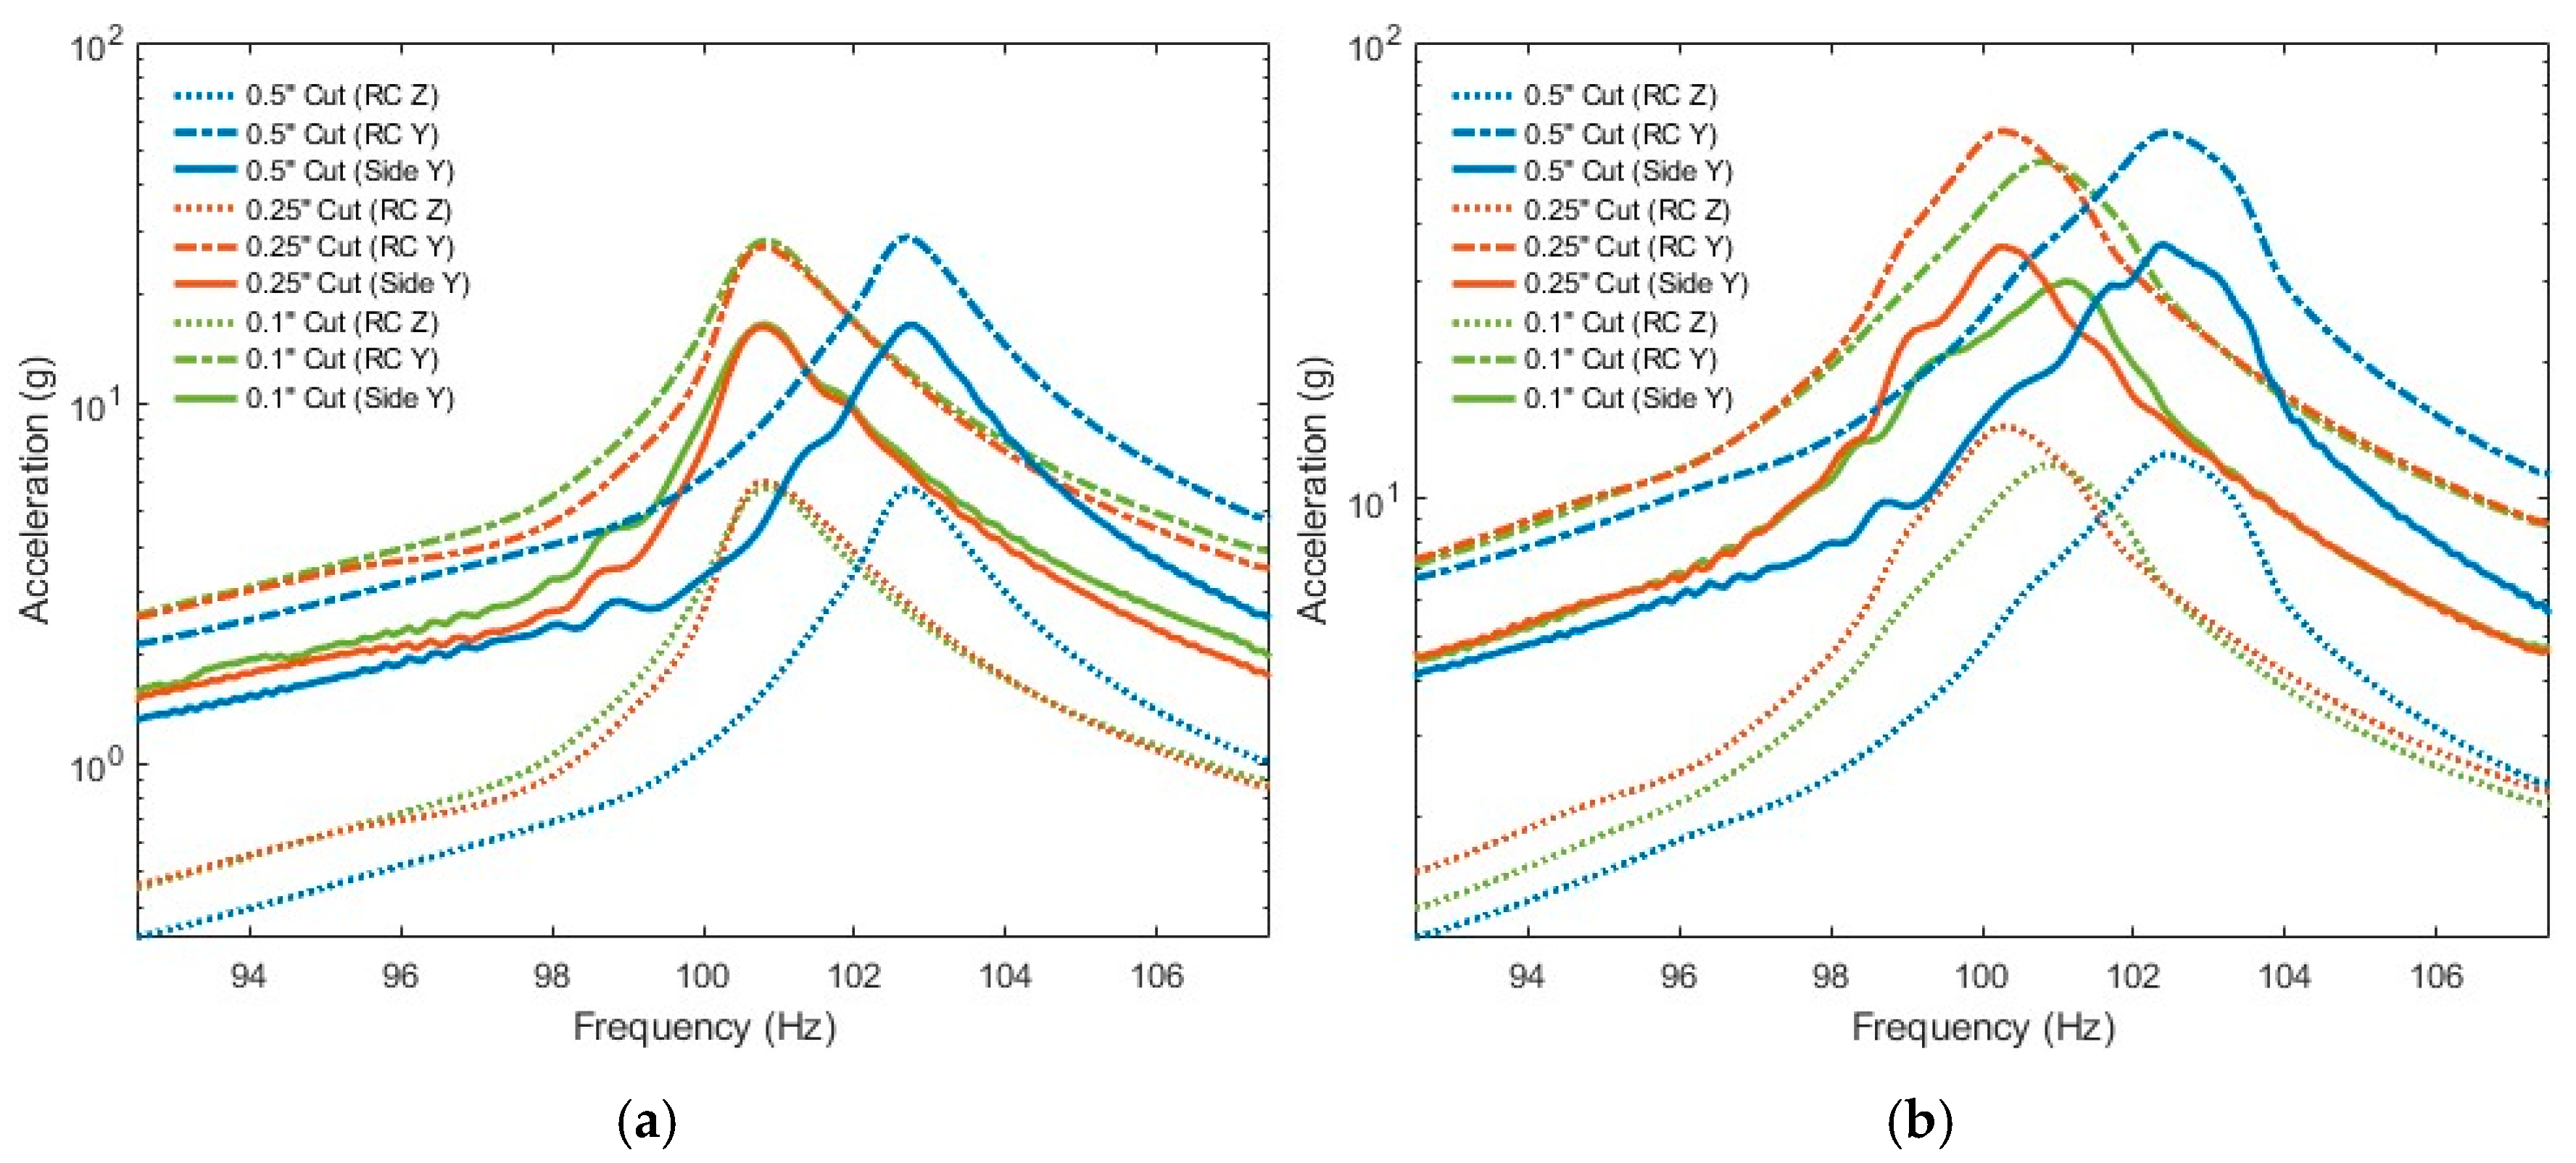
Figure 20.
A comparison using the Y-direction data from the side and RC accelerometers and Z-direction data from the RC accelerometer using the (a) 50 mV and (b) 150 mV harmonic excitation data.
Figure 20.
A comparison using the Y-direction data from the side and RC accelerometers and Z-direction data from the RC accelerometer using the (a) 50 mV and (b) 150 mV harmonic excitation data.
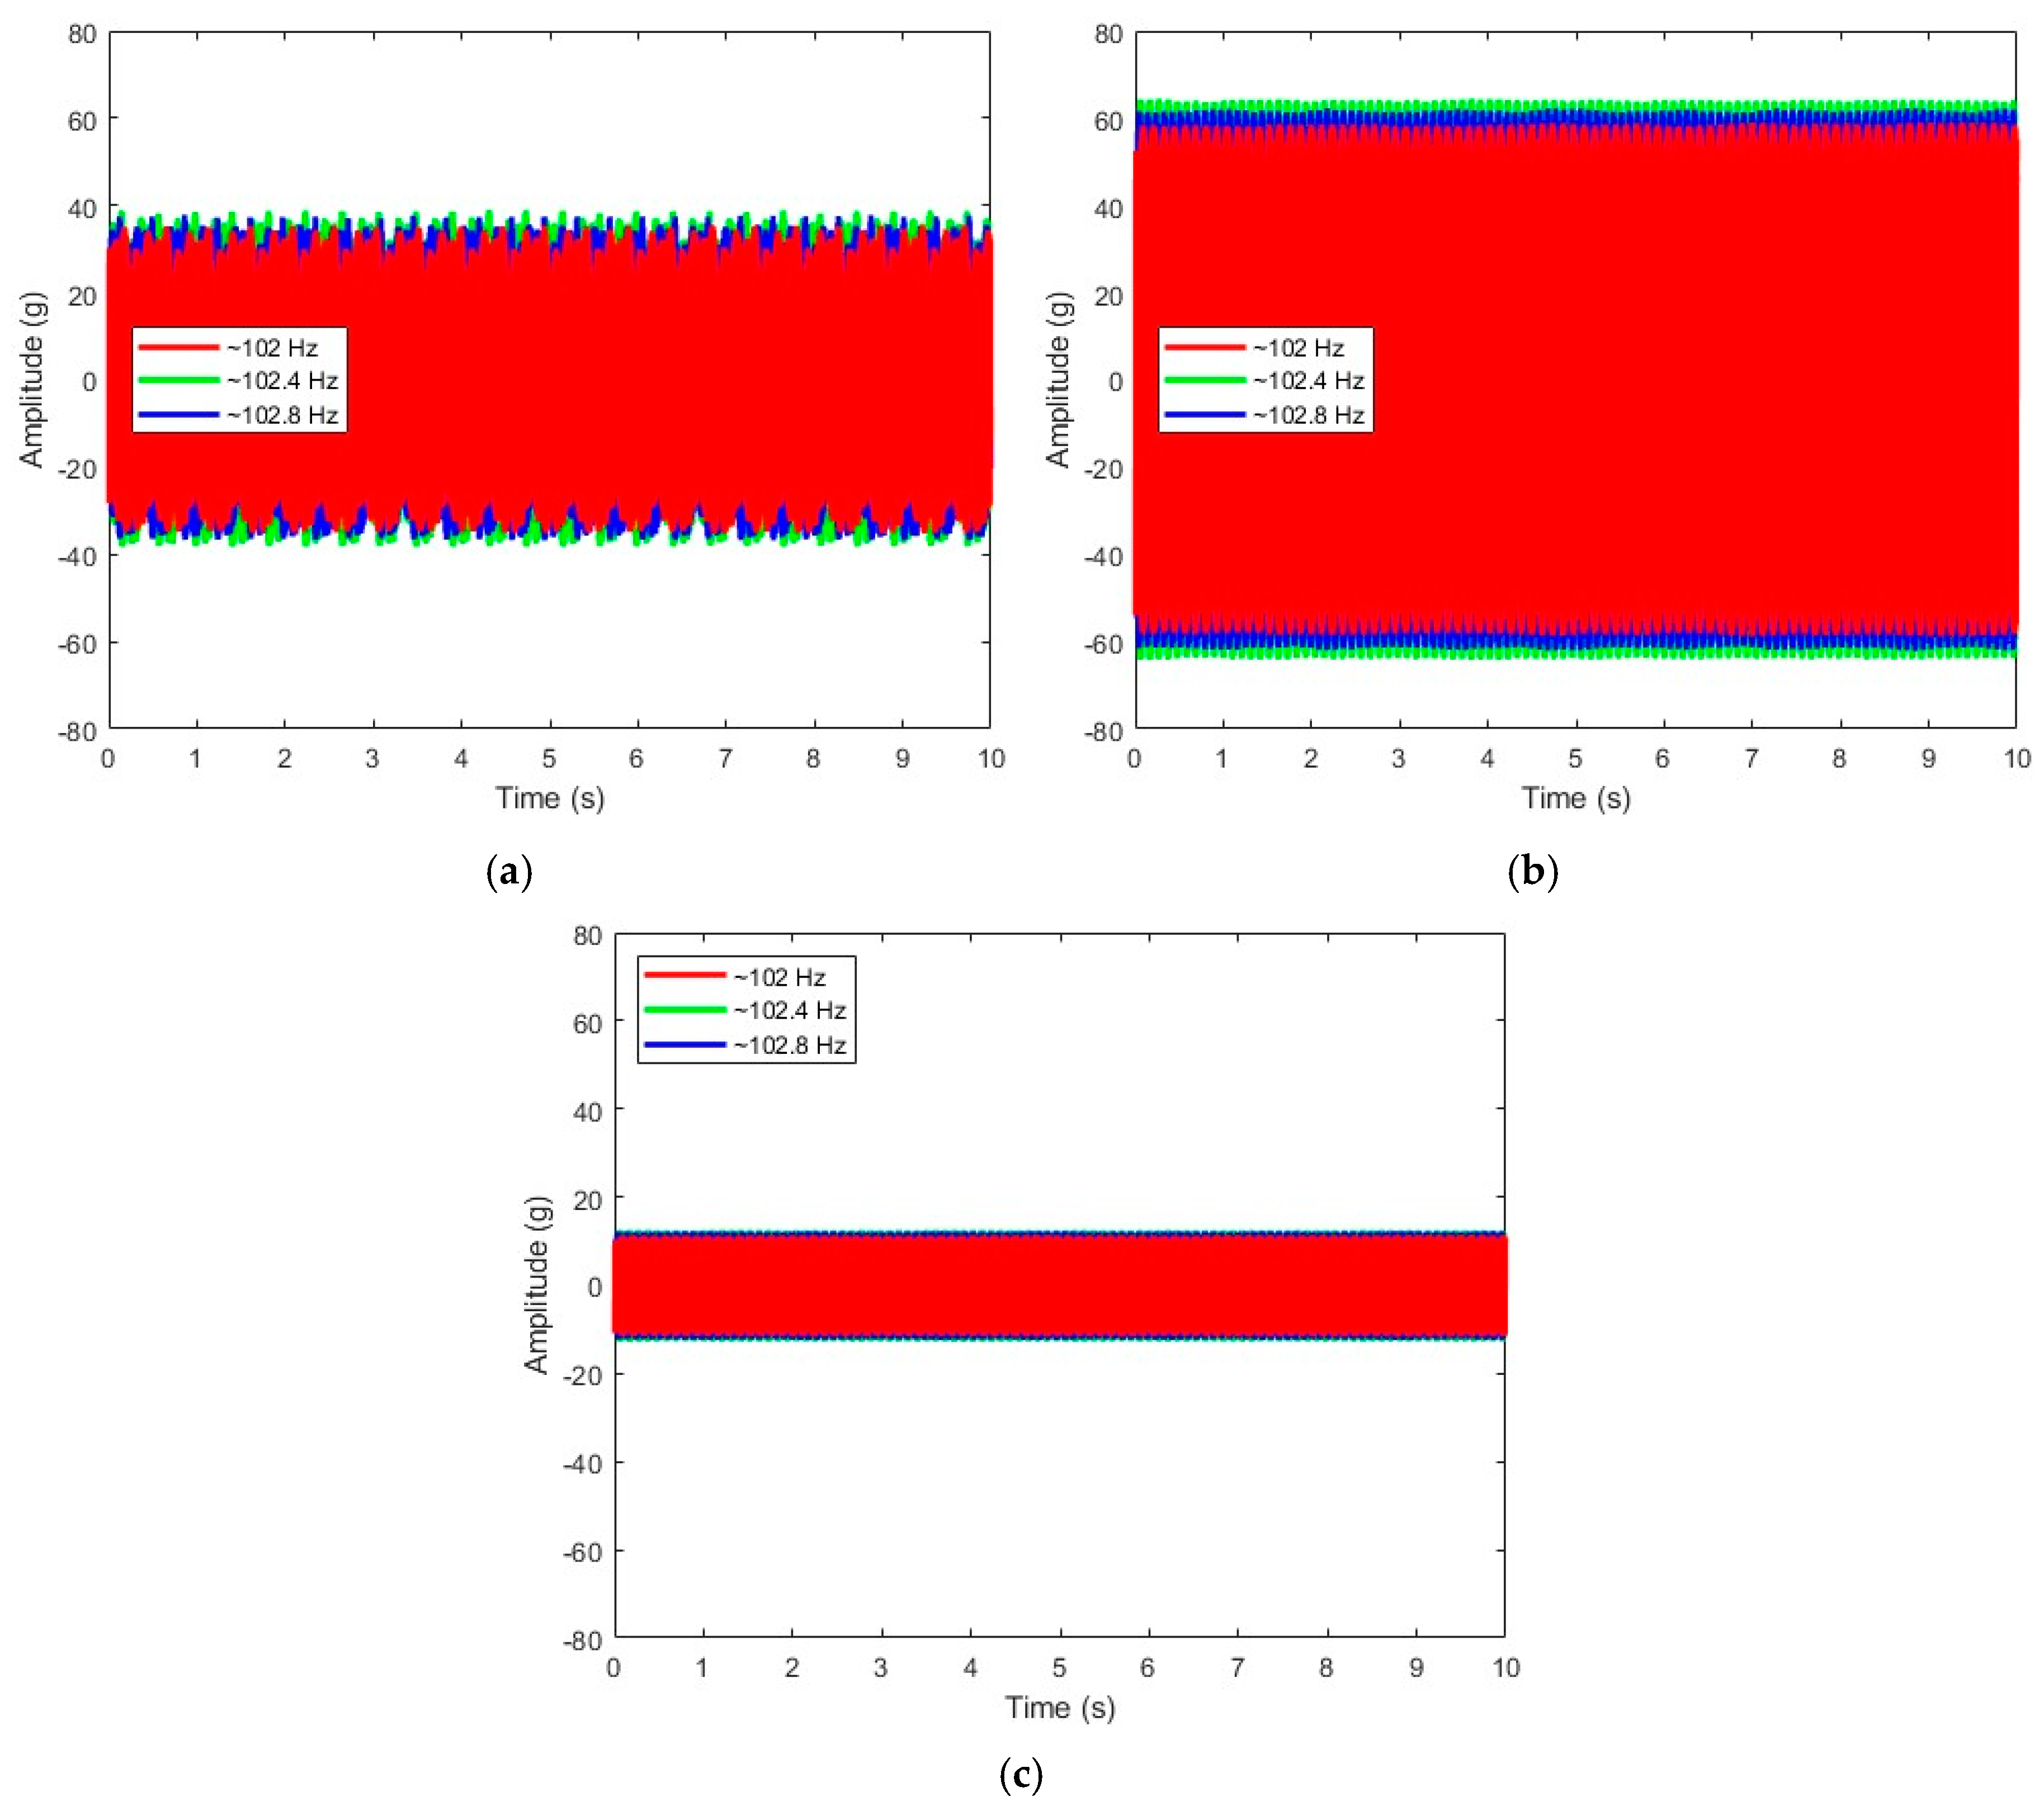
Figure 21.
Time histories found around resonance from harmonic testing for the 0.5″ cut configuration with 150 mV excitation for the (a) side accelerometer and (b) RC accelerometer in the Y-direction and (c) RC accelerometer in the Z-direction.
Figure 21.
Time histories found around resonance from harmonic testing for the 0.5″ cut configuration with 150 mV excitation for the (a) side accelerometer and (b) RC accelerometer in the Y-direction and (c) RC accelerometer in the Z-direction.
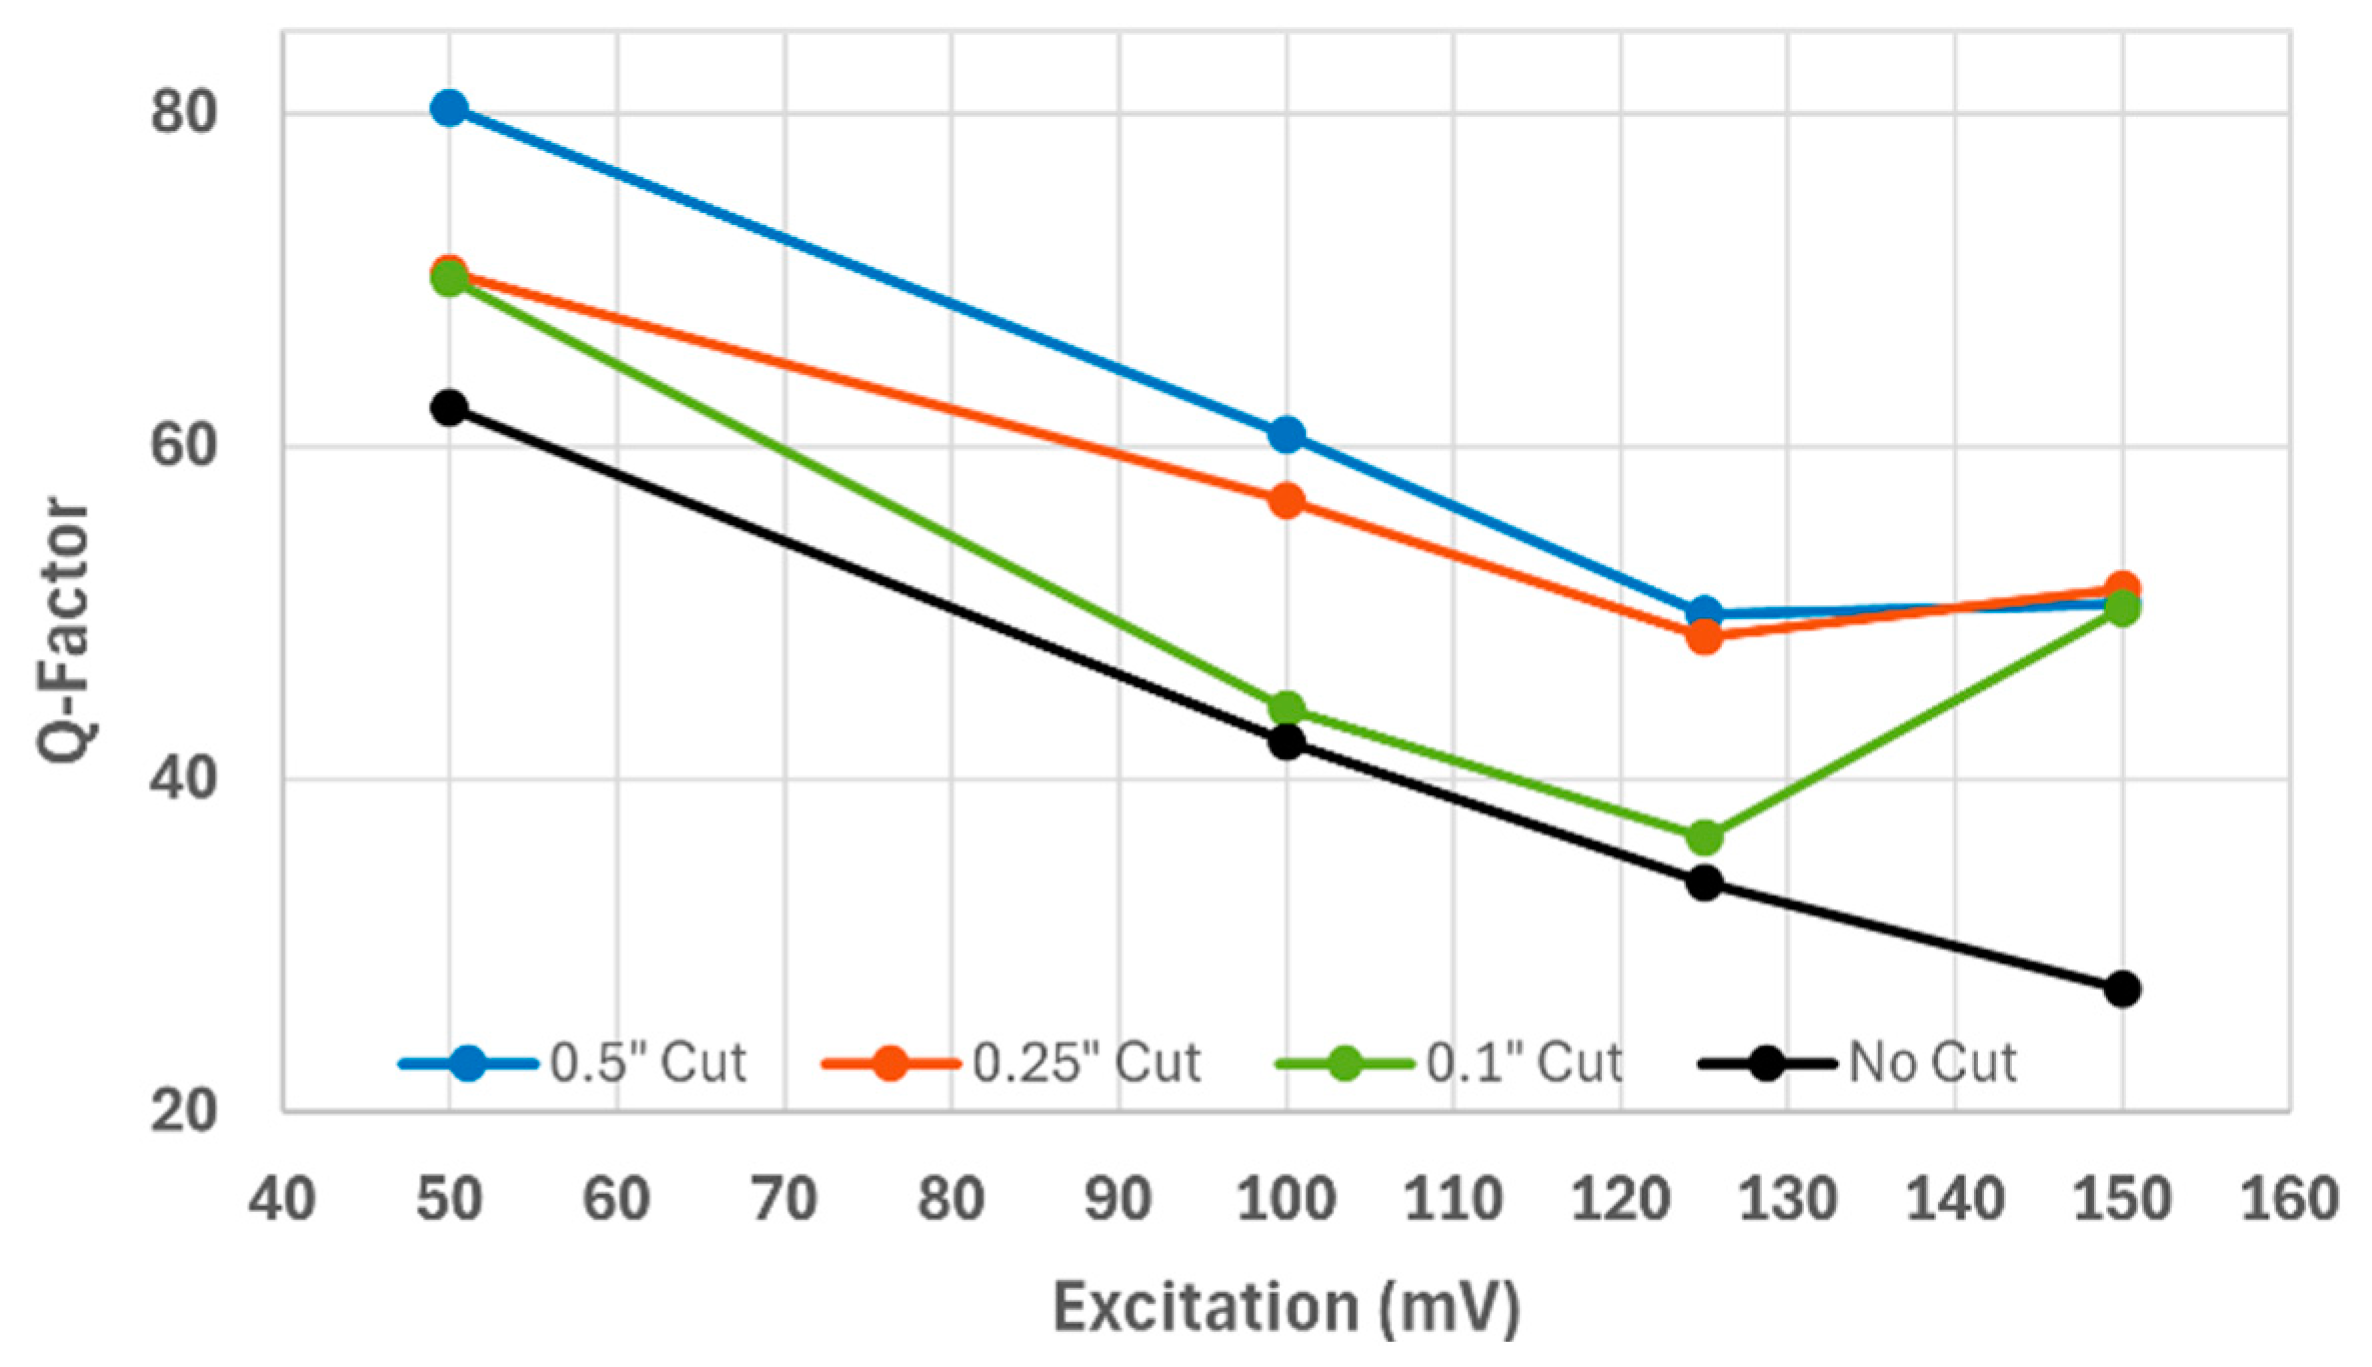
Figure 22.
Q-Factor plot for the RC accelerometer in the Y-direction.
Figure 22.
Q-Factor plot for the RC accelerometer in the Y-direction.
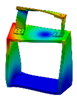
Table 1.
Mode shapes of BARC systems without accelerometers.
Table 2.
Mode shapes of BARC systems in the presence of accelerometers.
Table 3.
Natural frequencies of BARC systems without accelerometers and with accelerometers found through FEA. * Only computationally determined, no experimentation performed.
Table 3.
Natural frequencies of BARC systems without accelerometers and with accelerometers found through FEA. * Only computationally determined, no experimentation performed.
| | 0.5″ Cut | * 0.375″ Cut | 0.25″ Cut | * 0.125″ Cut | 0.1″ Cut | No Cut |
|---|
| Accel | w/o | w/ | w/o | w/ | w/o | w/ | w/o | w/ | w/o | w/ | w/o | w/ |
| Mode 1 | 109.31 | 106.89 | 108.58 | 106.37 | 107.94 | 105.63 | 107.20 | 104.93 | 106.97 | 104.7 | 168.94 | 165.29 |
| Mode 2 | 297.51 | 290.87 | 295.69 | 289.34 | 293.97 | 287.58 | 292.06 | 285.71 | 291.54 | 284.38 | 444.69 | 395.39 |
| Mode 3 | 348.08 | 331.63 | 342.44 | 327.22 | 337.04 | 322.34 | 331.35 | 317.34 | 330.0 | 314.27 | 670.77 | 649.25 |
| Mode 4 | 387.36 | 379.11 | 379.19 | 371.78 | 371.34 | 364.30 | 363.58 | 356.97 | 361.91 | 353.82 | 749.49 | 728.92 |
| Mode 5 | 500.98 | 450.47 | 498.27 | 446.98 | 495.72 | 443.71 | 493.36 | 440.83 | 492.70 | 438.09 | 865.83 | 846.72 |
| Mode 6 | 525.11 | 511.62 | 516.03 | 502.85 | 507.03 | 493.46 | 497.57 | 483.86 | 495.45 | 480.92 | 1103.0 | 1073.2 |
| Avg. % decrease | 4.79% | 4.69% | 4.75% | 4.75% | 5.12% | 4.82% |
Table 4.
A comparison of dominant frequencies found using FEA and impact testing.
Table 4.
A comparison of dominant frequencies found using FEA and impact testing.
| | 0.5″ Cut | 0.25″ Cut | 0.1″ Cut | No Cut |
|---|
| Impact | FEA | Impact | FEA | Impact | FEA | Impact | FEA |
|---|
| Mode 1 | 93.75 | 106.89 | 96.875 | 105.63 | 92.5 | 104.7 | 148.03 | 165.29 |
| Mode 2 | 248.44 | 290.87 | 265.63 | 287.58 | 257.5 | 284.38 | 337.99 | 395.39 |
| Mode 3 | 275.0 | 331.63 | 293.75 | 322.34 | 266.25 | 314.27 | 544.0 | 649.25 |
| Mode 4 | 328.13 | 379.11 | 343.75 | 364.3 | 315.0 | 353.89 | 660.04 | 728.92 |
| Mode 5 | 398.44 | 450.47 | 390.63 | 443.72 | 386.25 | 438.09 | 742.97 | 846.72 |
| Mode 6 | 448.44 | 511.62 | 453.13 | 493.46 | 431.25 | 480.92 | - | 1073.2 |
Table 5.
Dominant peaks found from mode 1 and mode 2 of the side accelerometer through random vibration testing in the Y-direction.
Table 5.
Dominant peaks found from mode 1 and mode 2 of the side accelerometer through random vibration testing in the Y-direction.
| | 0.5″ Cut (Hz) | 0.25″ Cut (Hz) | 0.1″ Cut (Hz) | No Cut (Hz) |
|---|
| Mode 1 | Mode 2 | Mode 1 | Mode 2 | Mode 1 | Mode 2 | Mode 1 |
|---|
| 1 × 10⁻⁷ V2/Hz | 106.25 | 285.156 | 101.562 | 279.297 | 101.172 | 275.781 | 155.078 |
| 1 × 10⁻⁶ V2/Hz | 104.297 | 284.766 | 101.172 | 278.516 | 101.562 | 275.391 | 149.609 |
| 1 × 10⁻⁵ V2/Hz | 103.125 | 283.984 | 99.609 | 277.344 | 101.172 | 274.609 | 148.047 |
| 1 × 10⁻⁴ V2/Hz | 101.562 | 283.594 | 98.828 | 276.172 | 99.609 | 274.609 | 153.516 |
| % Change | 4.41% | 0.55% | 2.69% | 1.12% | 1.54% | 0.42% | 1.01% |
Table 6.
Dominant peaks found from mode 1 and mode 2 of the RC accelerometer through random vibration testing in the Z-direction.
Table 6.
Dominant peaks found from mode 1 and mode 2 of the RC accelerometer through random vibration testing in the Z-direction.
| | 0.5″ Cut (Hz) | 0.25″ Cut (Hz) | 0.1″ Cut (Hz) | No Cut (Hz) |
|---|
| Mode 1 | Mode 2 | Mode 1 | Mode 2 | Mode 1 | Mode 2 | Mode 1 |
|---|
| 1 × 10⁻⁷ V2/Hz | 106.641 | 284.766 | 101.562 | 278.906 | 102.344 | 275.781 | 154.688 |
| 1 × 10⁻⁶ V2/Hz | 104.297 | 284.375 | 101.172 | 278.125 | 101.562 | 275.391 | 150.0 |
| 1 × 10⁻⁵ V2/Hz | 103.125 | 283.594 | 99.609 | 276.953 | 100.781 | 274.219 | 153.516 |
| 1 × 10⁻⁴ V2/Hz | 101.172 | 281.641 | 99.219 | 275.0 | 100.0 | 273.828 | 153.906 |
| % Change | 5.13% | 1.10% | 2.31% | 1.40% | 2.29% | 0.71% | 0.51% |
Table 7.
Comparative study between FEA and random vibration testing using excitation of 1 × 10⁻⁷ V2/Hz.
Table 7.
Comparative study between FEA and random vibration testing using excitation of 1 × 10⁻⁷ V2/Hz.
| | 0.5″ Cut | 0.25″ Cut | 0.1″ Cut | No Cut |
|---|
| Random | FEA | Random | FEA | Random | FEA | Random | FEA |
|---|
| Mode 1 | 106.25 | 106.89 | 101.56 | 105.63 | 101.17 | 106.89 | 155.08 | 165.29 |
| Mode 2 | 285.16 | 290.87 | 279.3 | 287.58 | 275.781 | 290.87 | - | 395.39 |
| Mode 3 | 304.69 | 331.63 | 300.39 | 322.34 | 286.72 | 331.63 | 591.8 | 649.25 |
| Mode 4 | 373.438 | 379.11 | 346.48 | 364.3 | 333.98 | 379.11 | 728.125 | 728.92 |
| Mode 5 | 398.438 | 450.47 | 406.25 | 443.72 | 386.33 | 450.47 | 834.766 | 846.72 |
| Mode 6 | 471.875 | 511.62 | 455.86 | 493.46 | 448.05 | 511.62 | - | 1073.2 |
Table 8.
Resonant frequencies found from mode 1 through harmonic vibration testing using the side accelerometer in the Y-direction.
Table 8.
Resonant frequencies found from mode 1 through harmonic vibration testing using the side accelerometer in the Y-direction.
| | 0.5″ Cut (Hz) | 0.25″ Cut (Hz) | 0.1″ Cut (Hz) | No Cut (Hz) |
|---|
| 50 mV | 102.7 | 100.8 | 100.8 | 155.3 |
| 100 mV | 102.6 | 100.5 | 100.9 | 156.4 |
| 125 mV | 102.5 | 100.4 | 101 | 156.5 |
| 150 mV | 102.4 | 100.2 | 101.1 | 156.6 |
| % Change | 0.29% | 0.60% | −0.30% | −0.84% |
Table 9.
Dominant frequencies found from mode 1 through harmonic vibration testing using the RC accelerometer in the Y-direction.
Table 9.
Dominant frequencies found from mode 1 through harmonic vibration testing using the RC accelerometer in the Y-direction.
| | 0.5″ Cut (Hz) | 0.25″ Cut (Hz) | 0.1″ Cut (Hz) | No Cut (Hz) |
|---|
| 50 mV | 102.7 | 100.8 | 100.8 | 155.2 |
| 100 mV | 102.6 | 100.5 | 101 | 1556.4 |
| 125 mV | 102.5 | 100.4 | 101 | 156 |
| 150 mV | 102.4 | 100.2 | 100.8 | 156.1 |
| % Change | 0.29% | 0.60% | 0.00% | −0.58% |


