
Effect of Carbonization Pressure on CO2 Sequestration and Rheological Properties of Coal Gangue-Based Backfilling Slurry

 ,
,  ,
, 
Abstract
1. Introduction
2. Materials and Methods
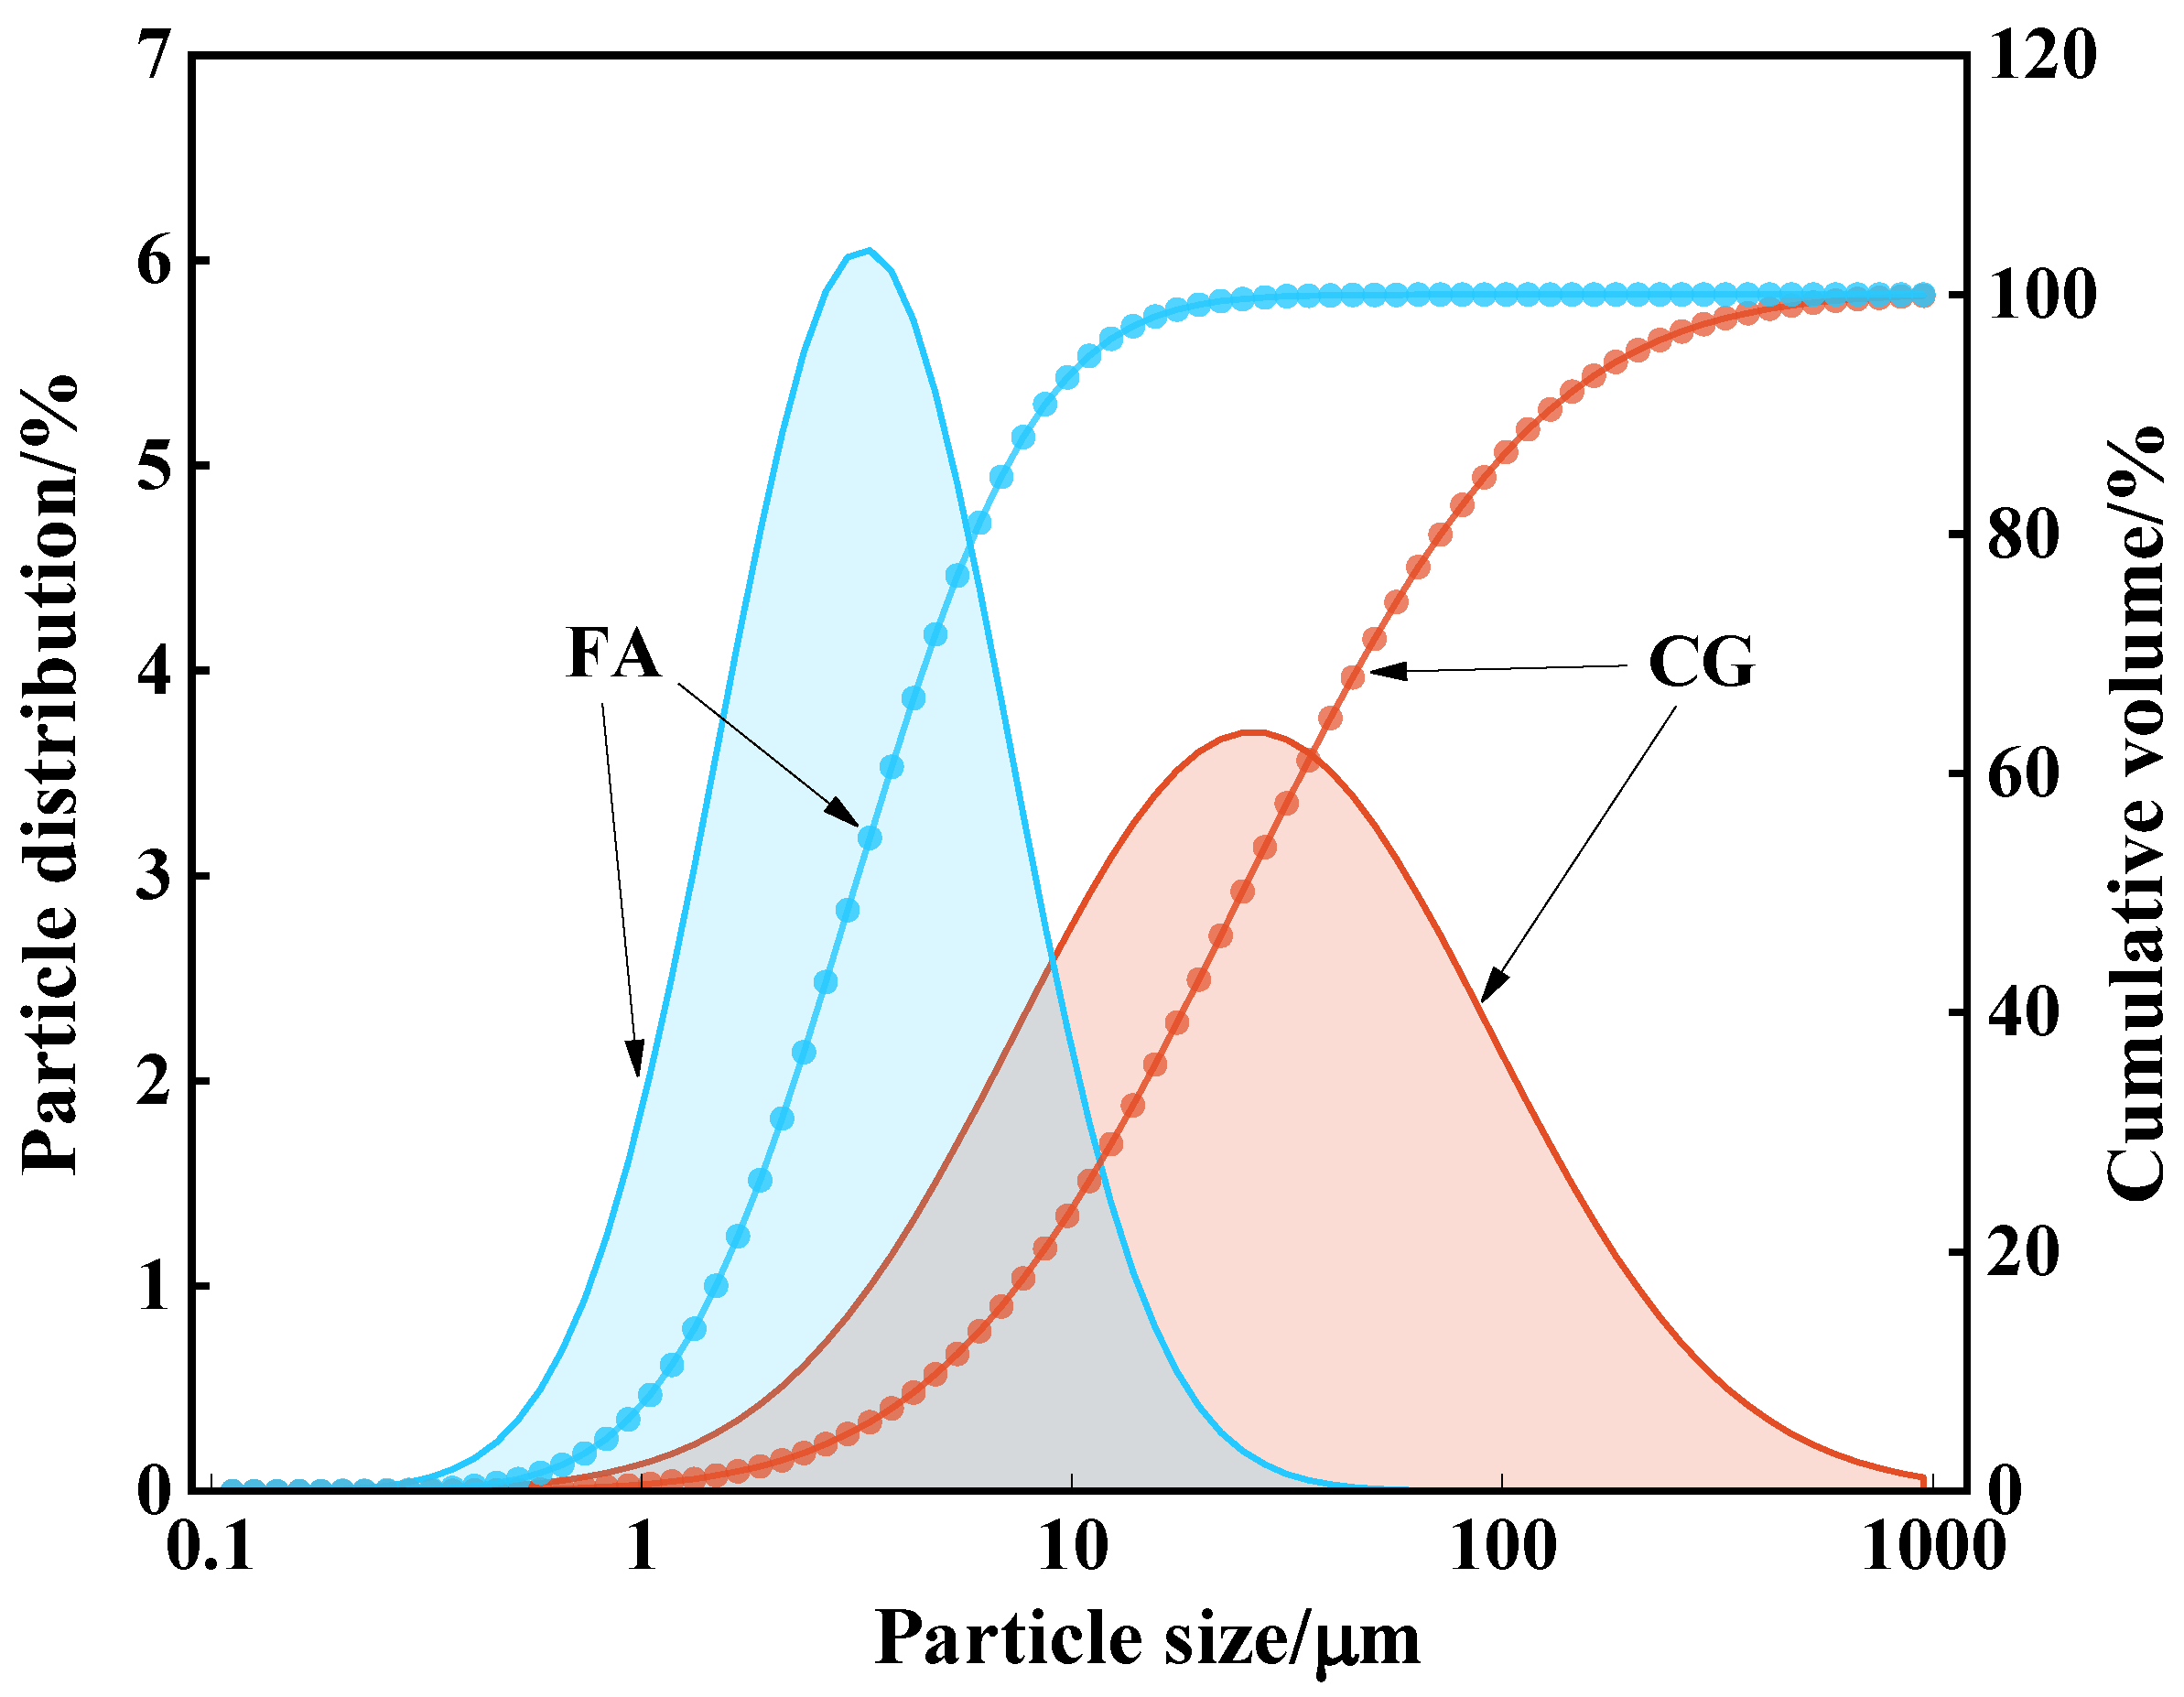
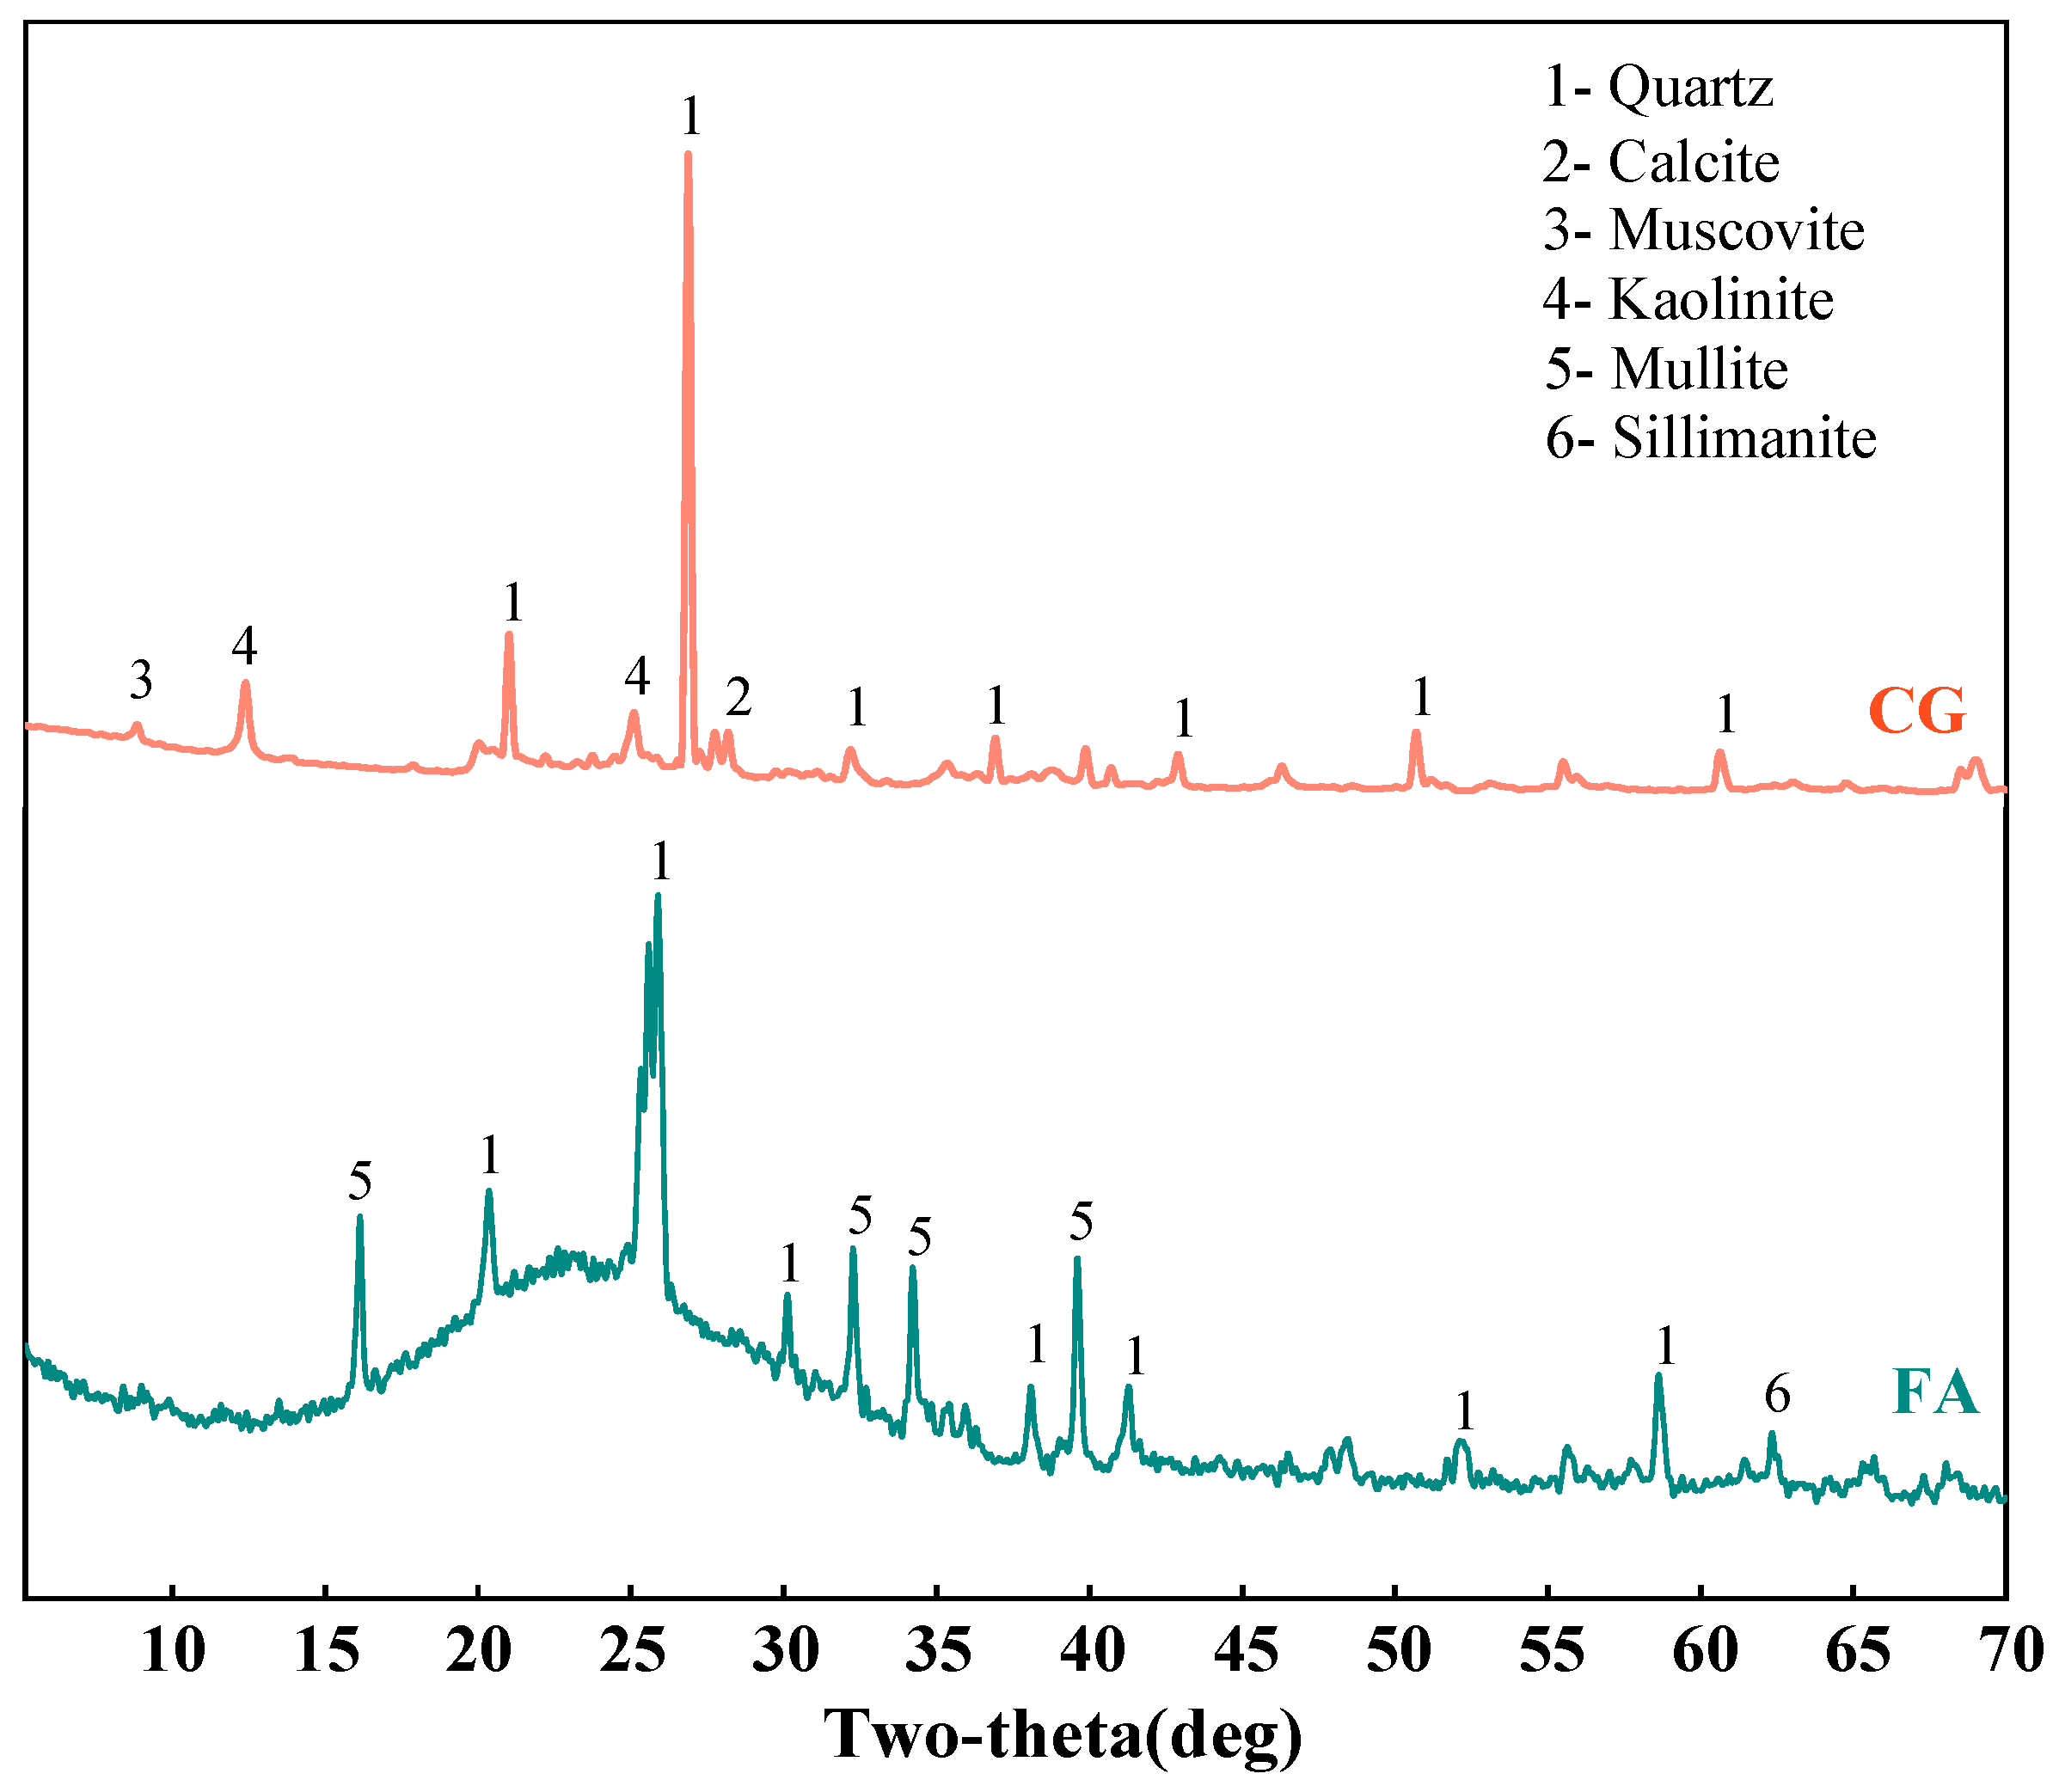
2.1. Raw Materials
2.2. Experimental Method
2.2.1. Slurry Preparation and CO2 Sequestration
2.2.2. CO2 Sequestration Capacity
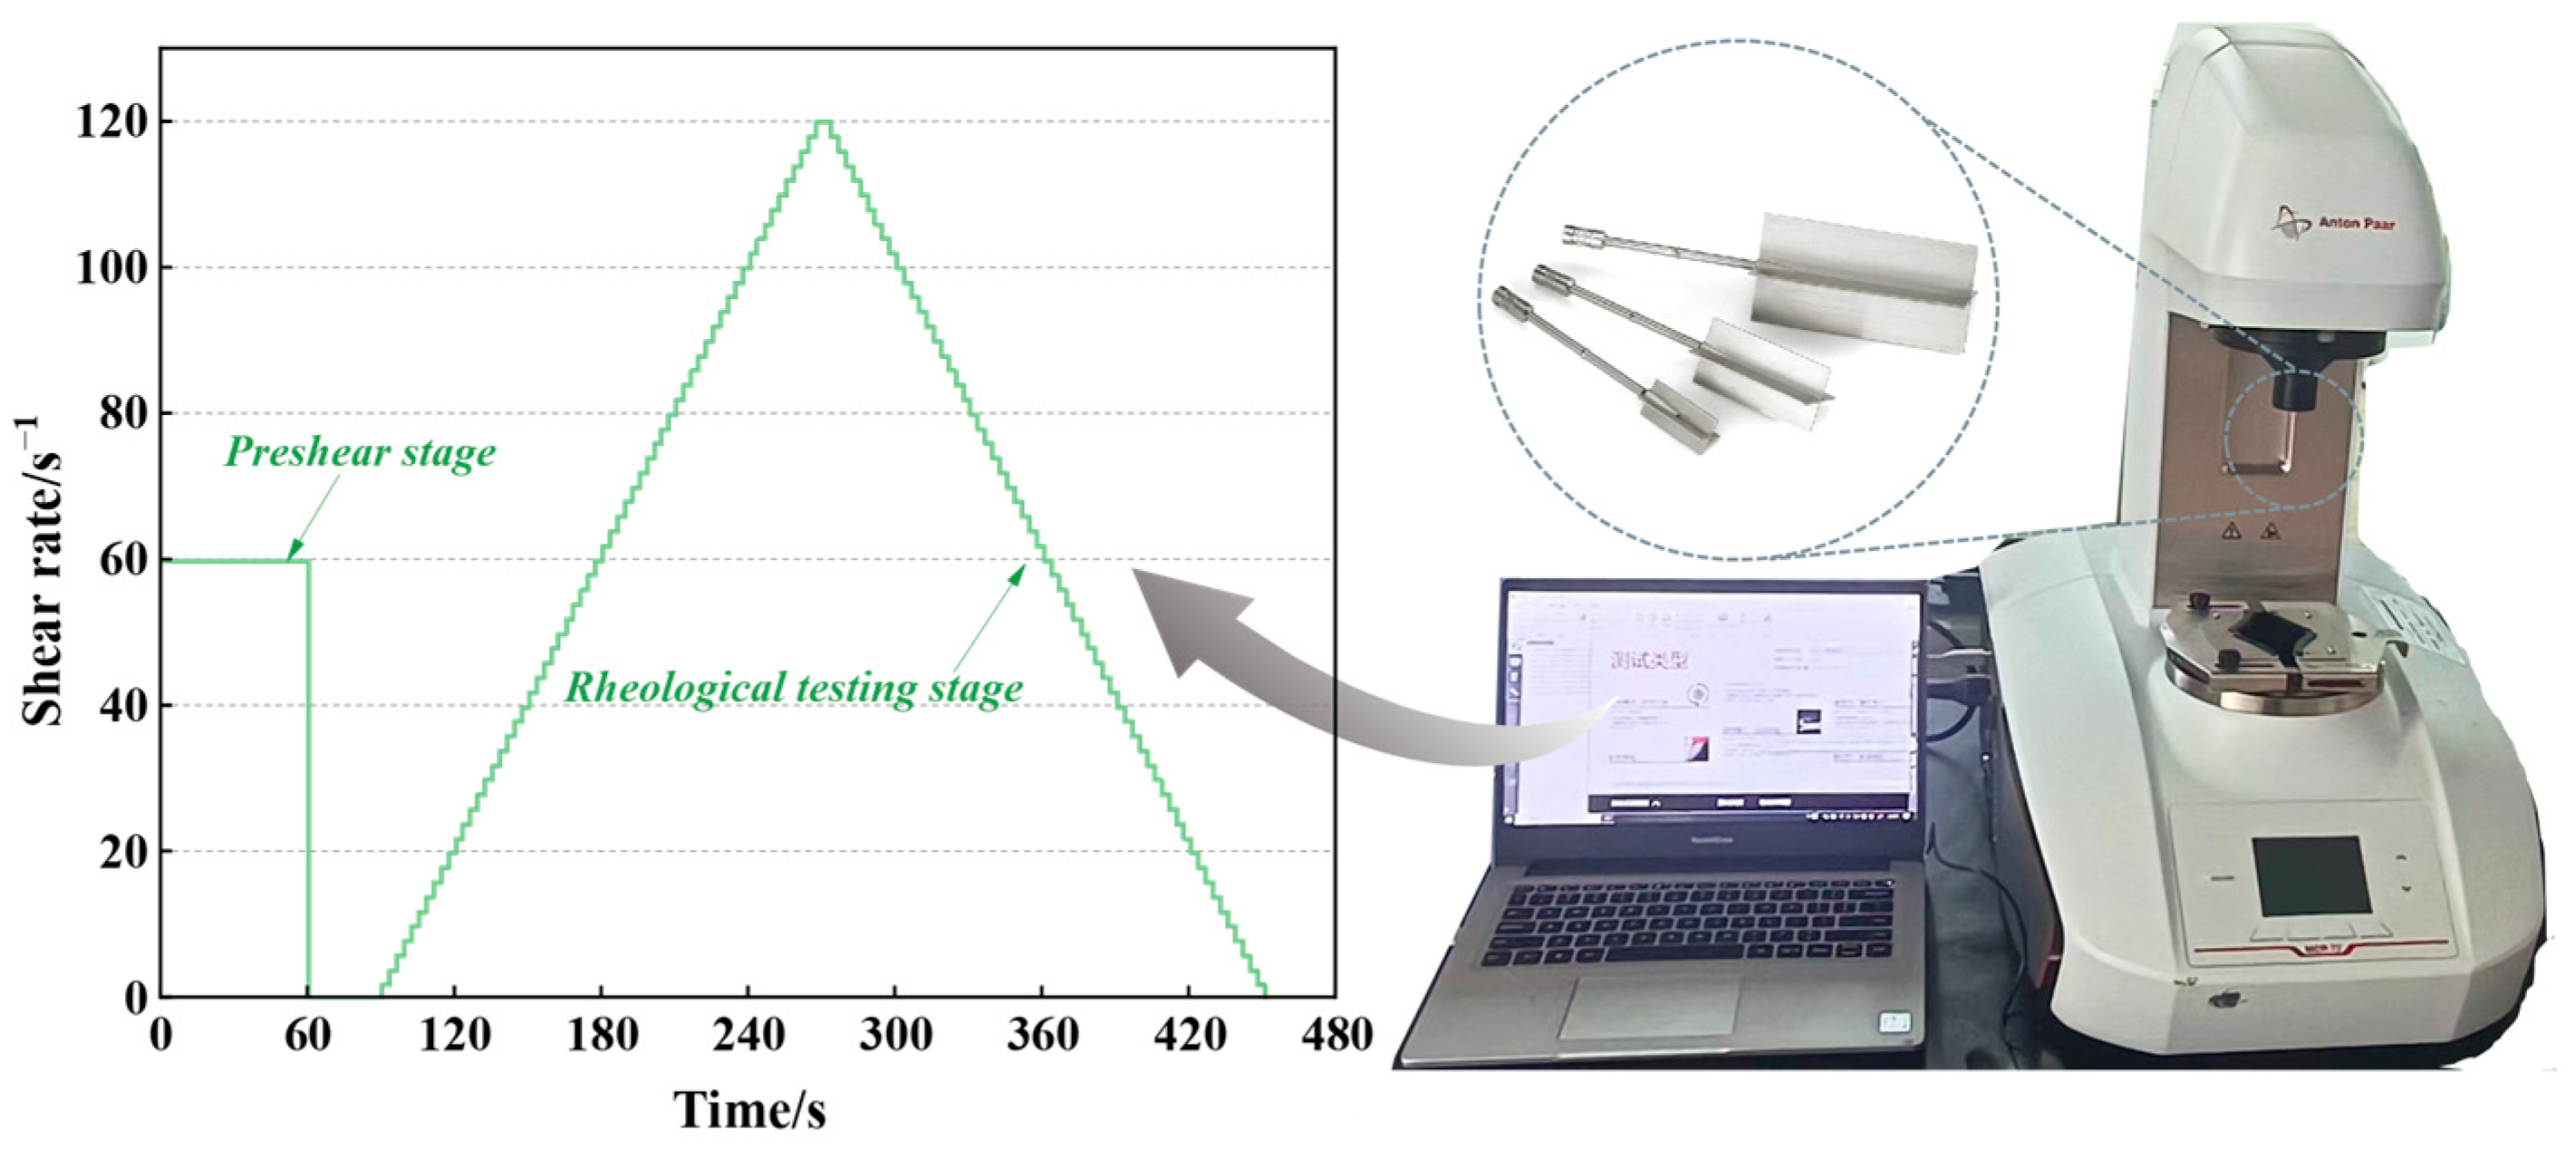
2.2.3. Rheological Test
2.2.4. XRD Test
2.2.5. BET Test
2.2.6. SEM Test
3. Results and Discussion
3.1. Effect of Carbonization Pressure on CO2 Sequestration and Rheological Properties of CGBS
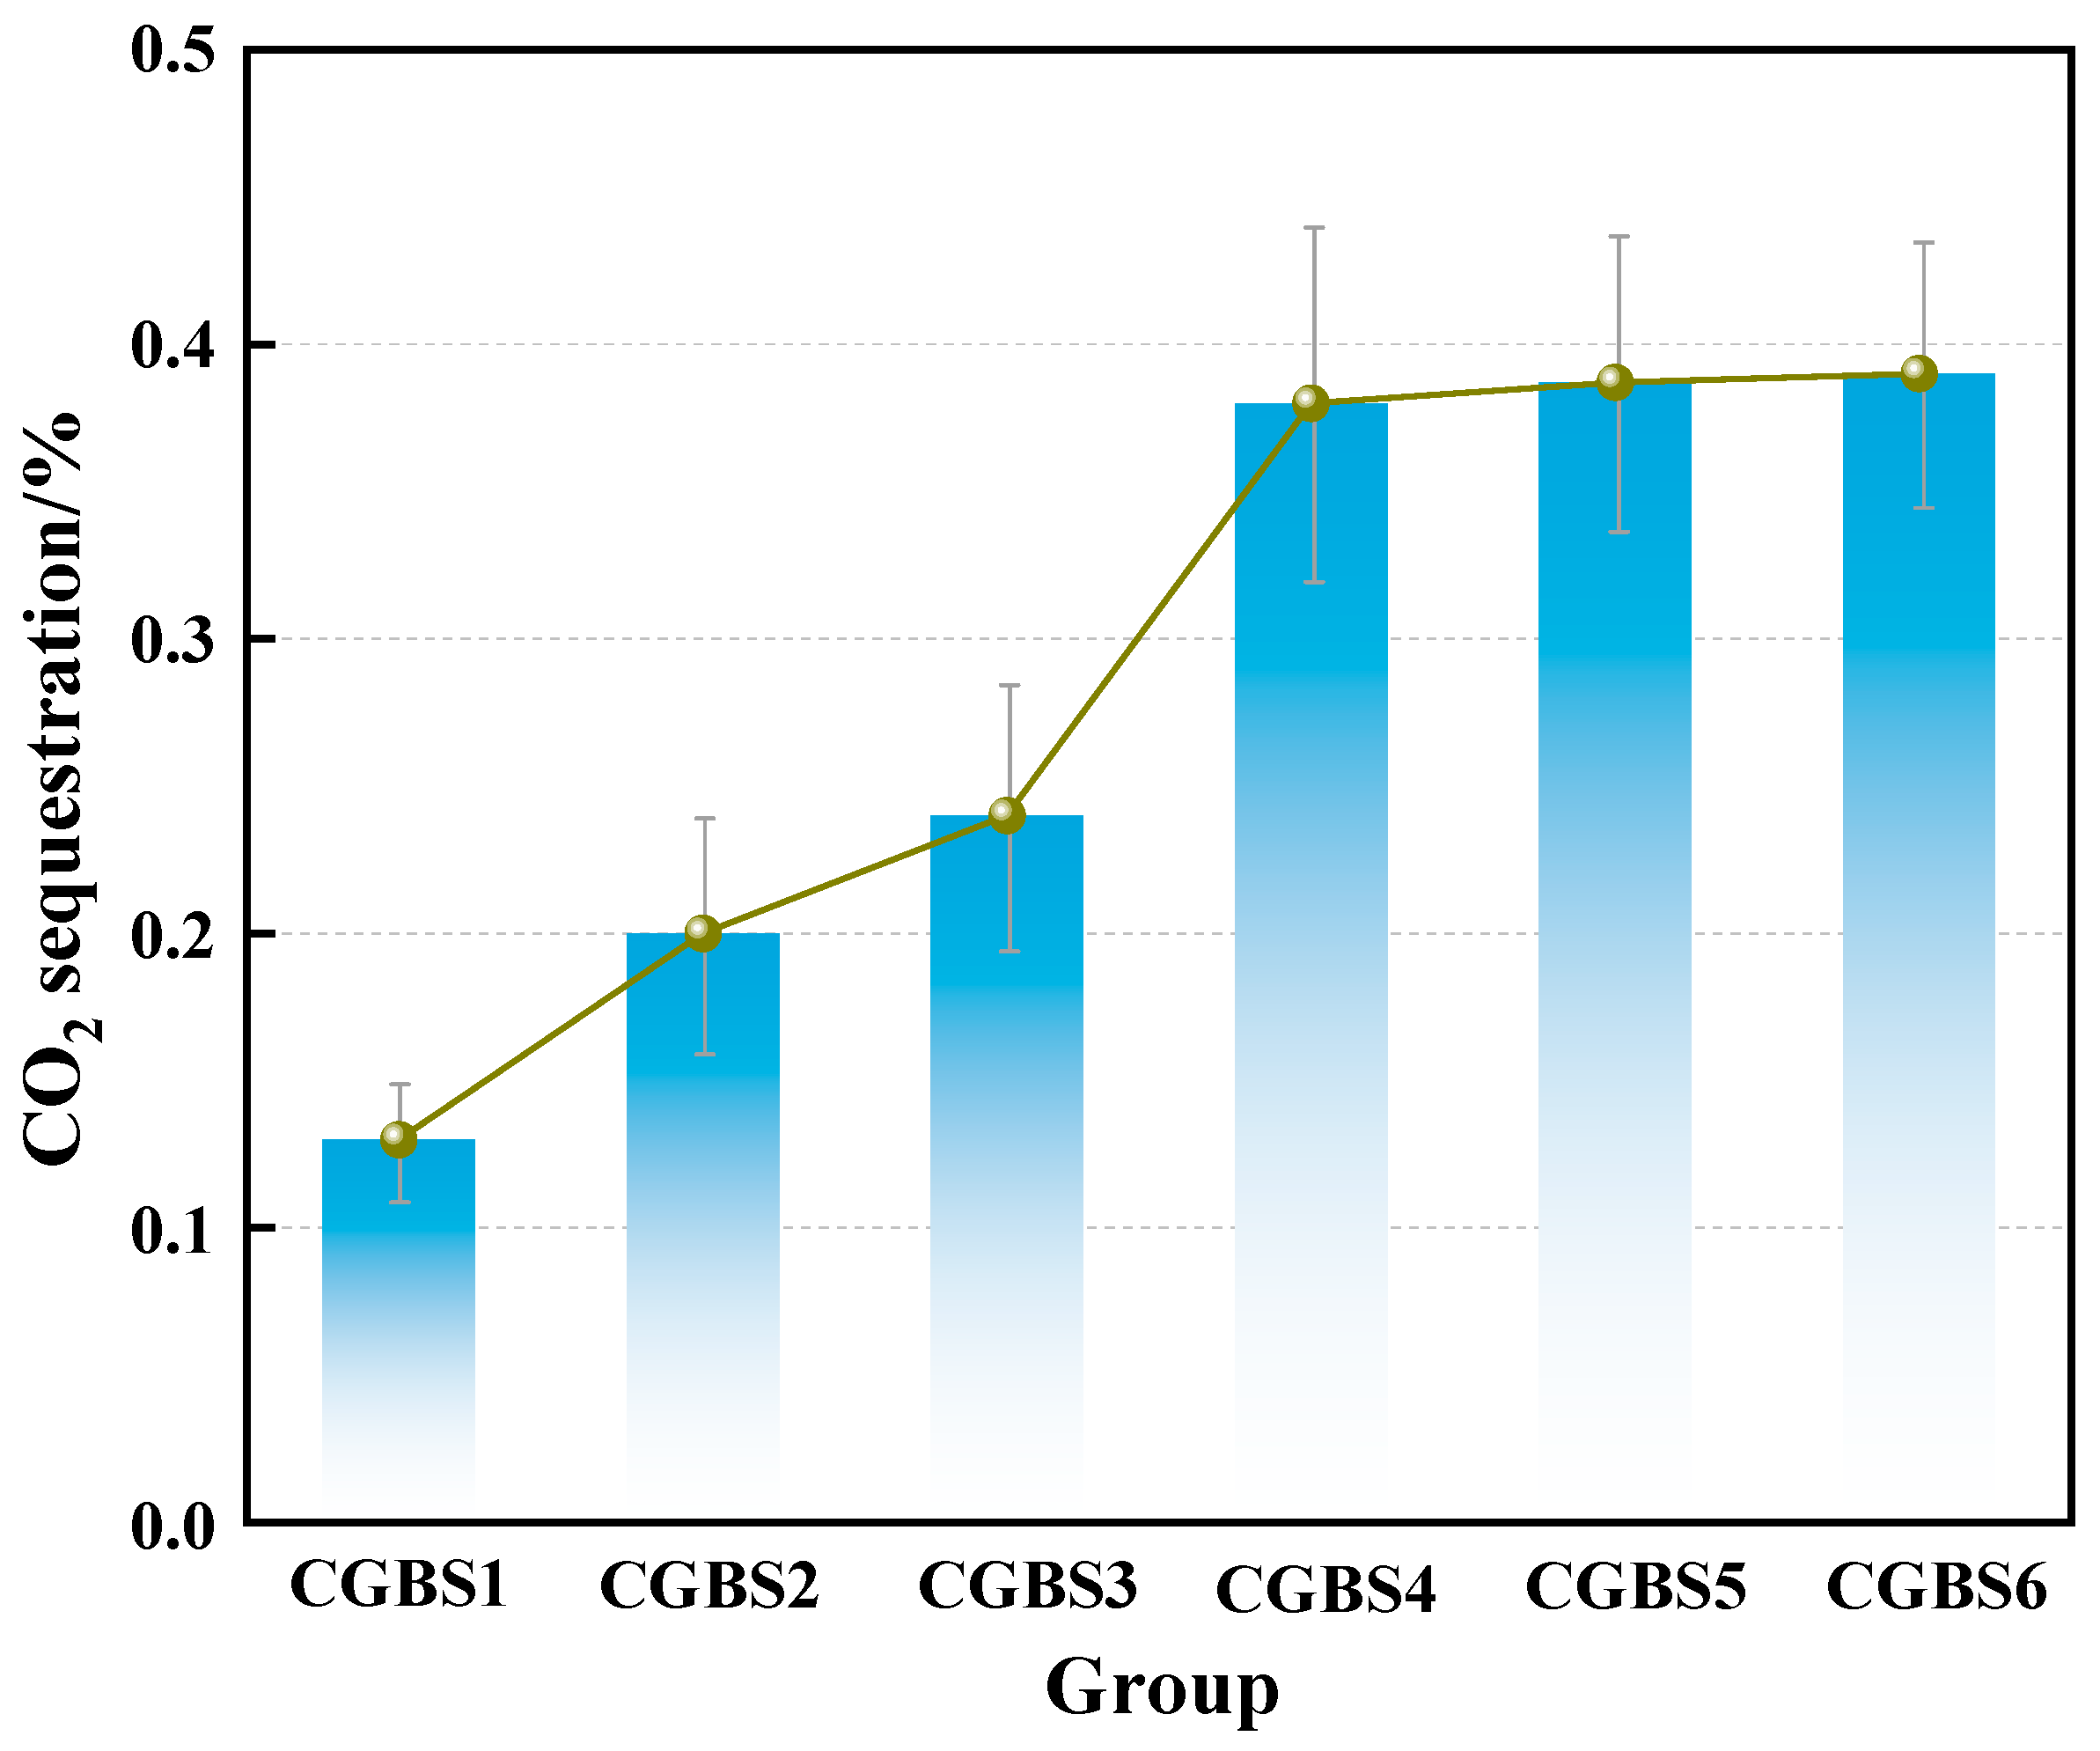
3.1.1. Effect of Carbonization Pressure on CO2 Sequestration Performance of CGBS
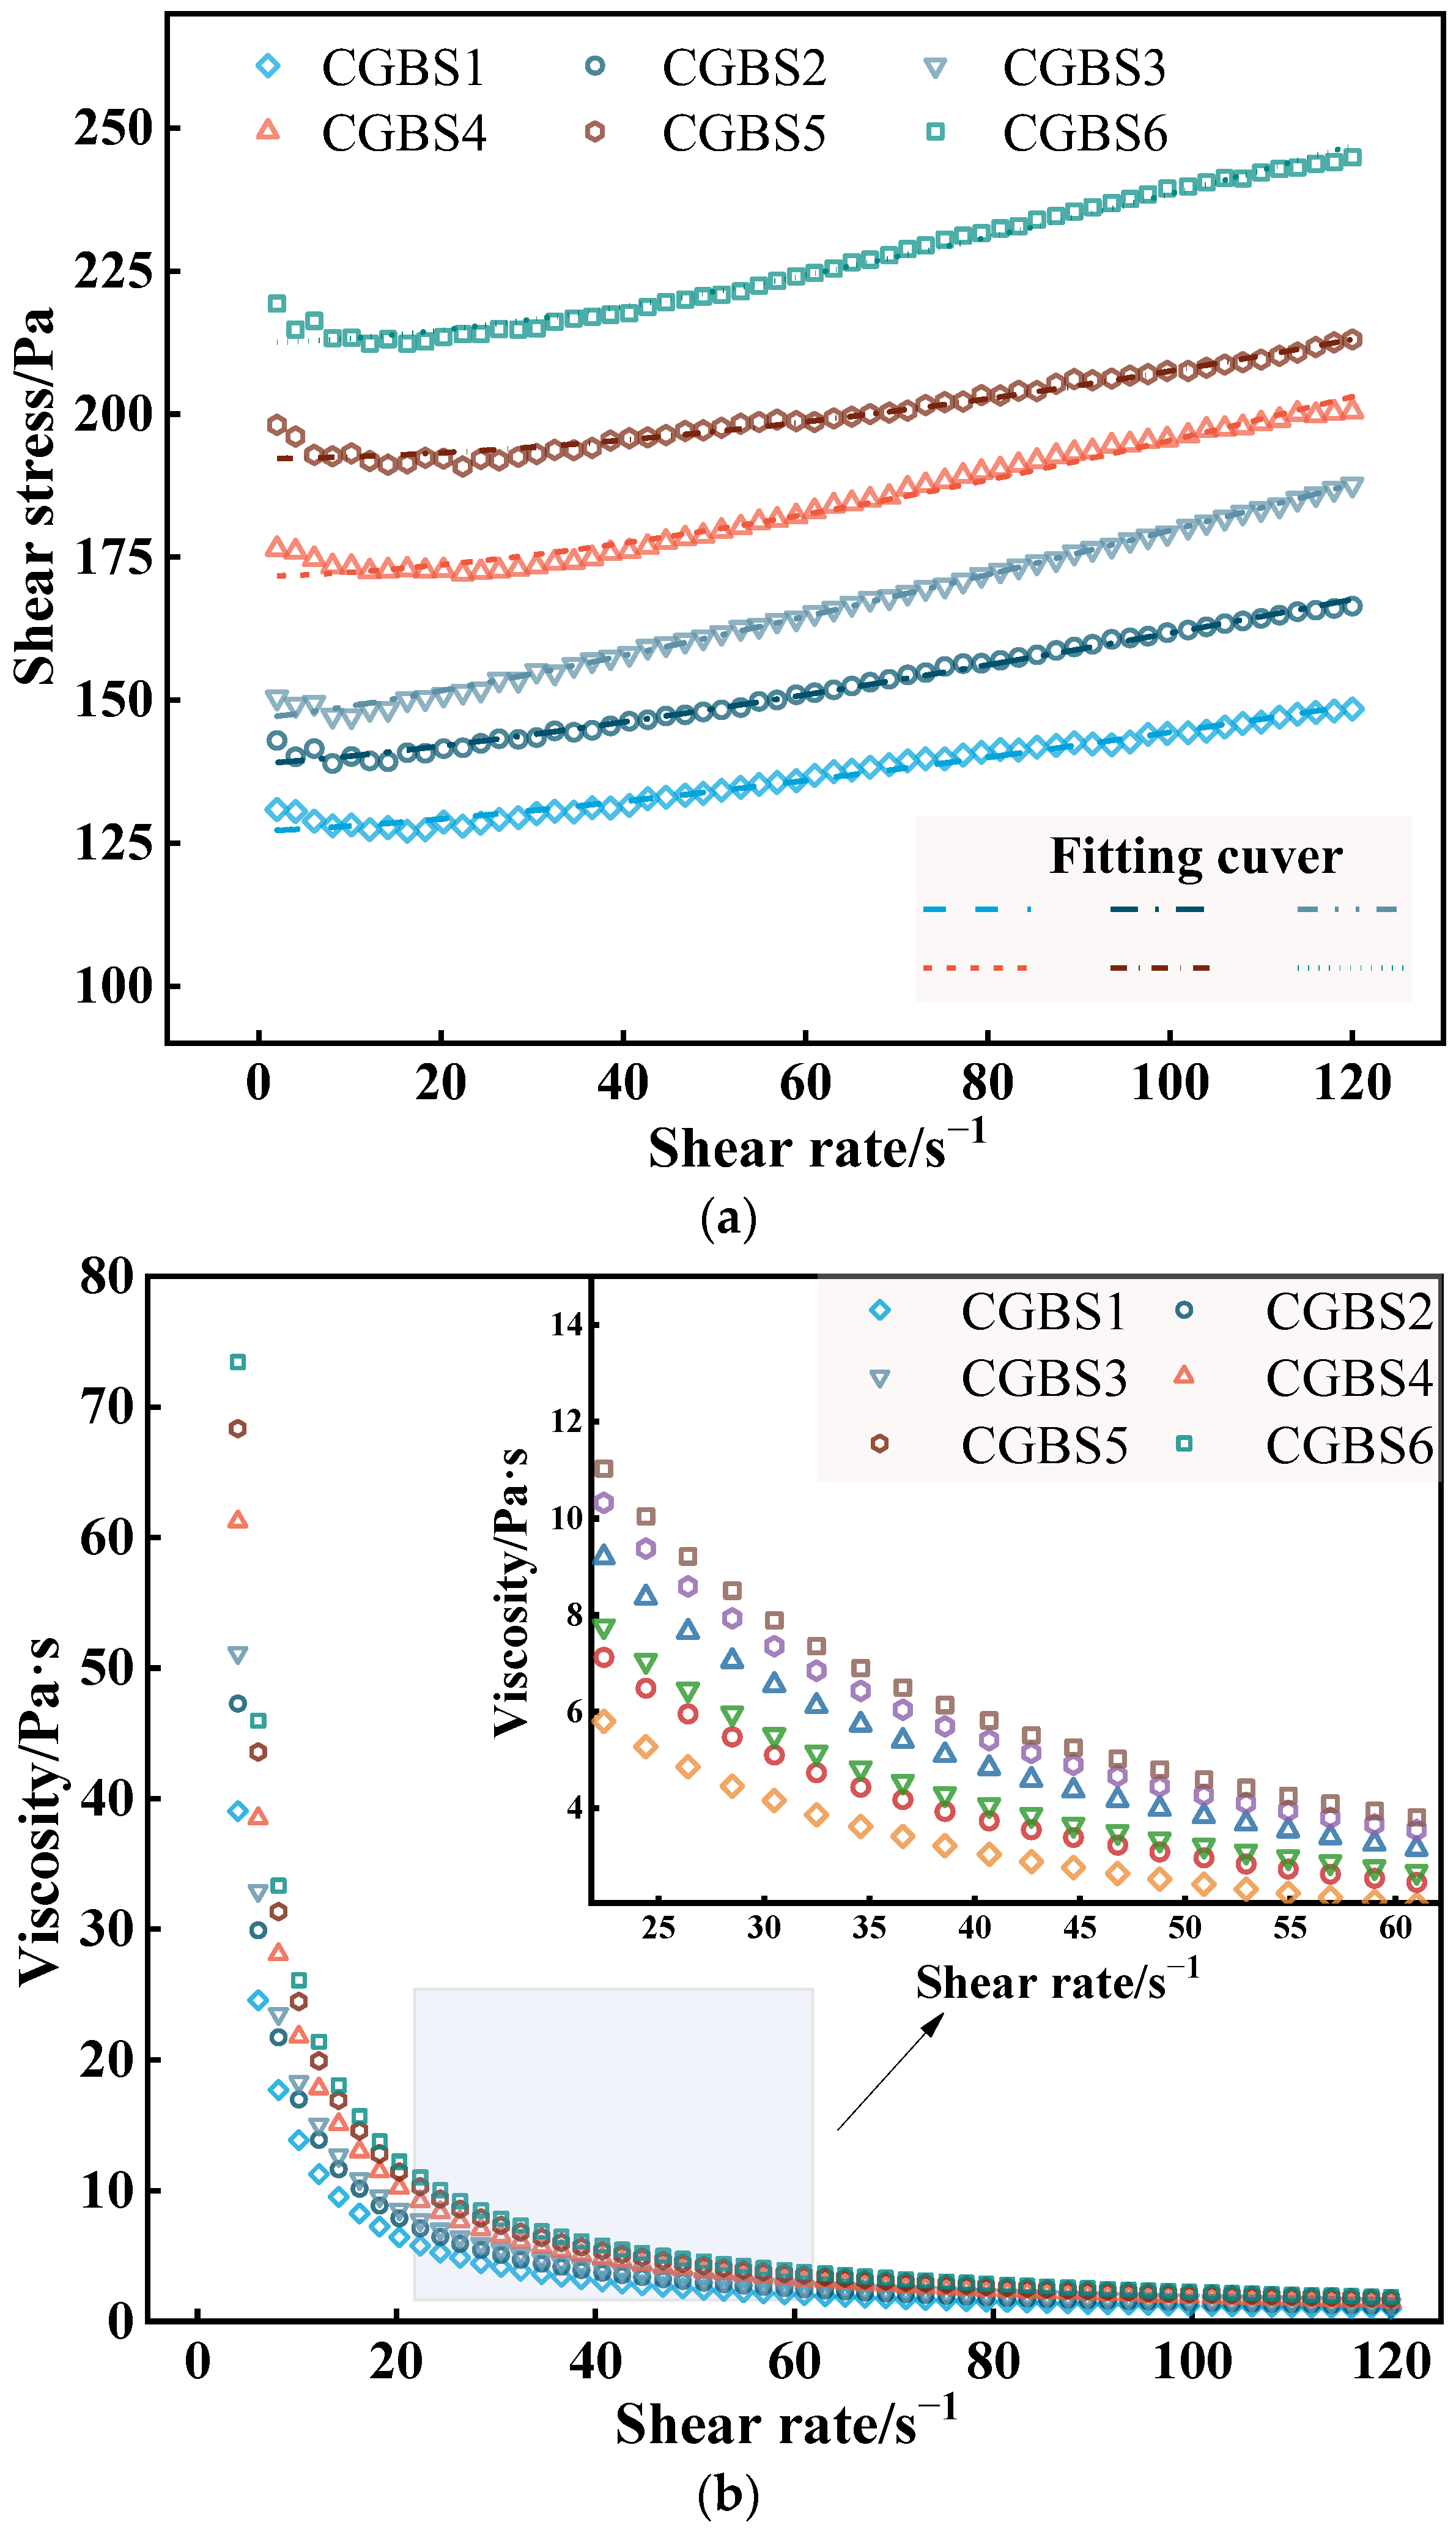
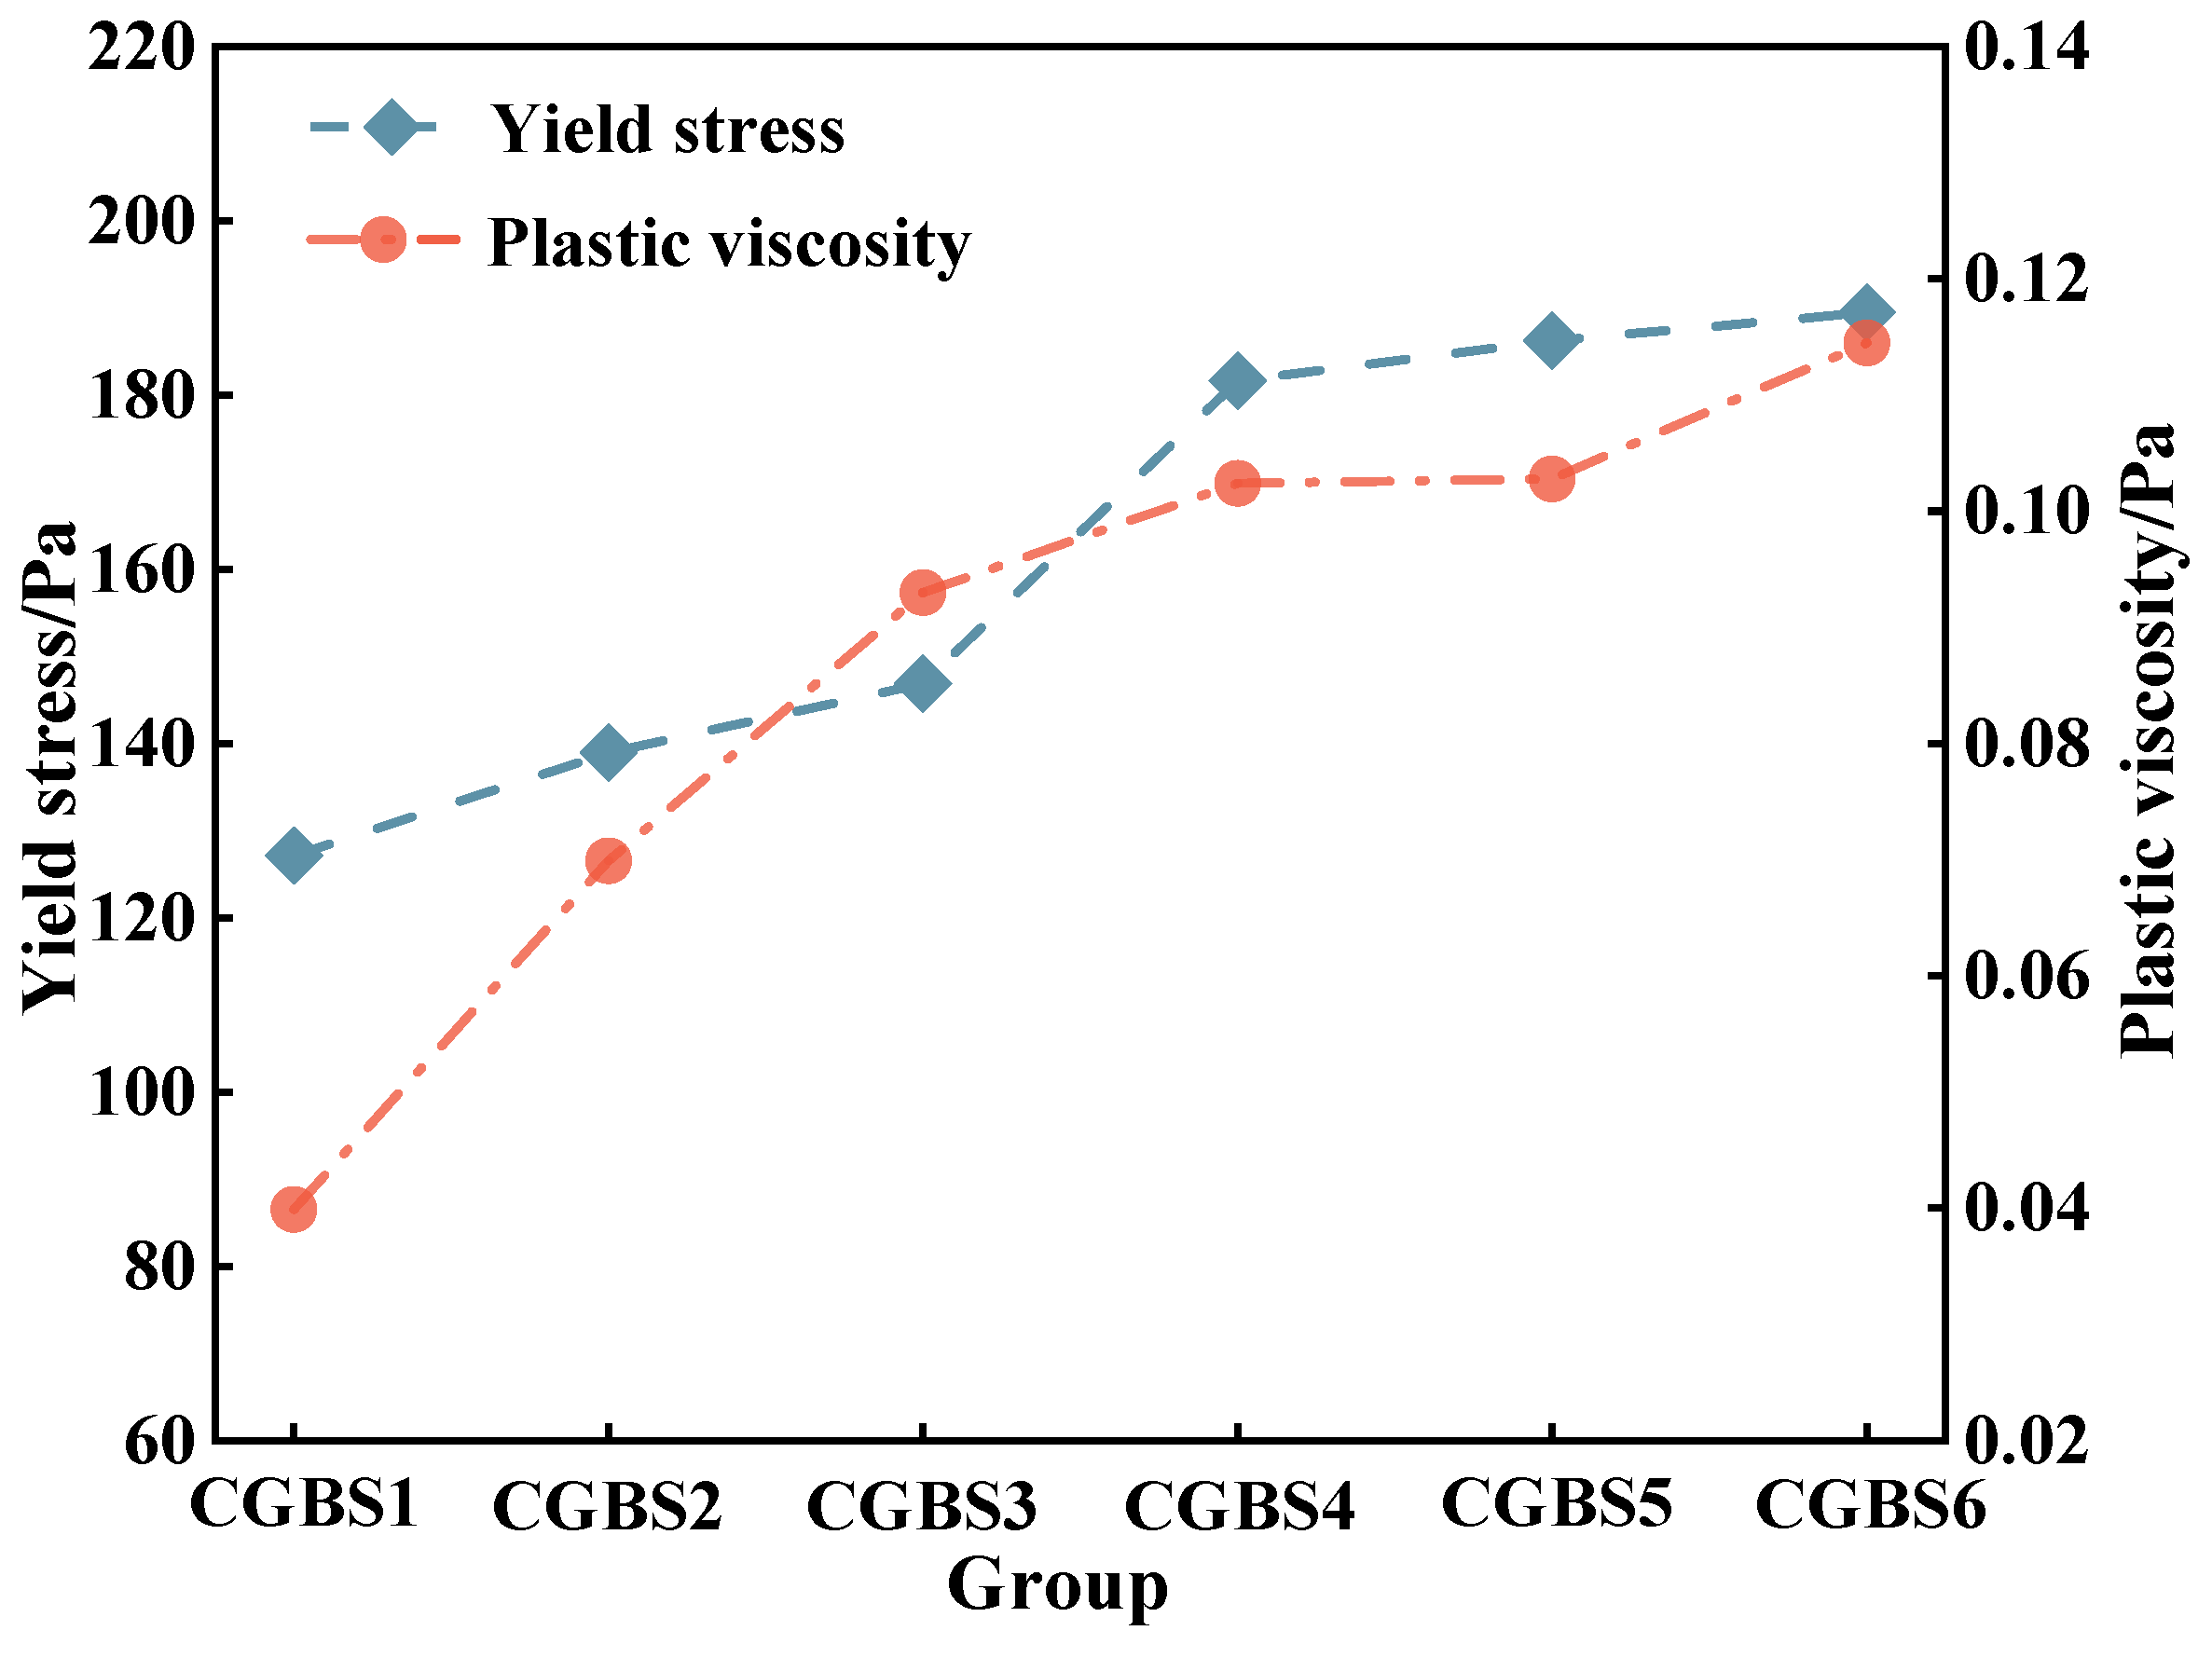
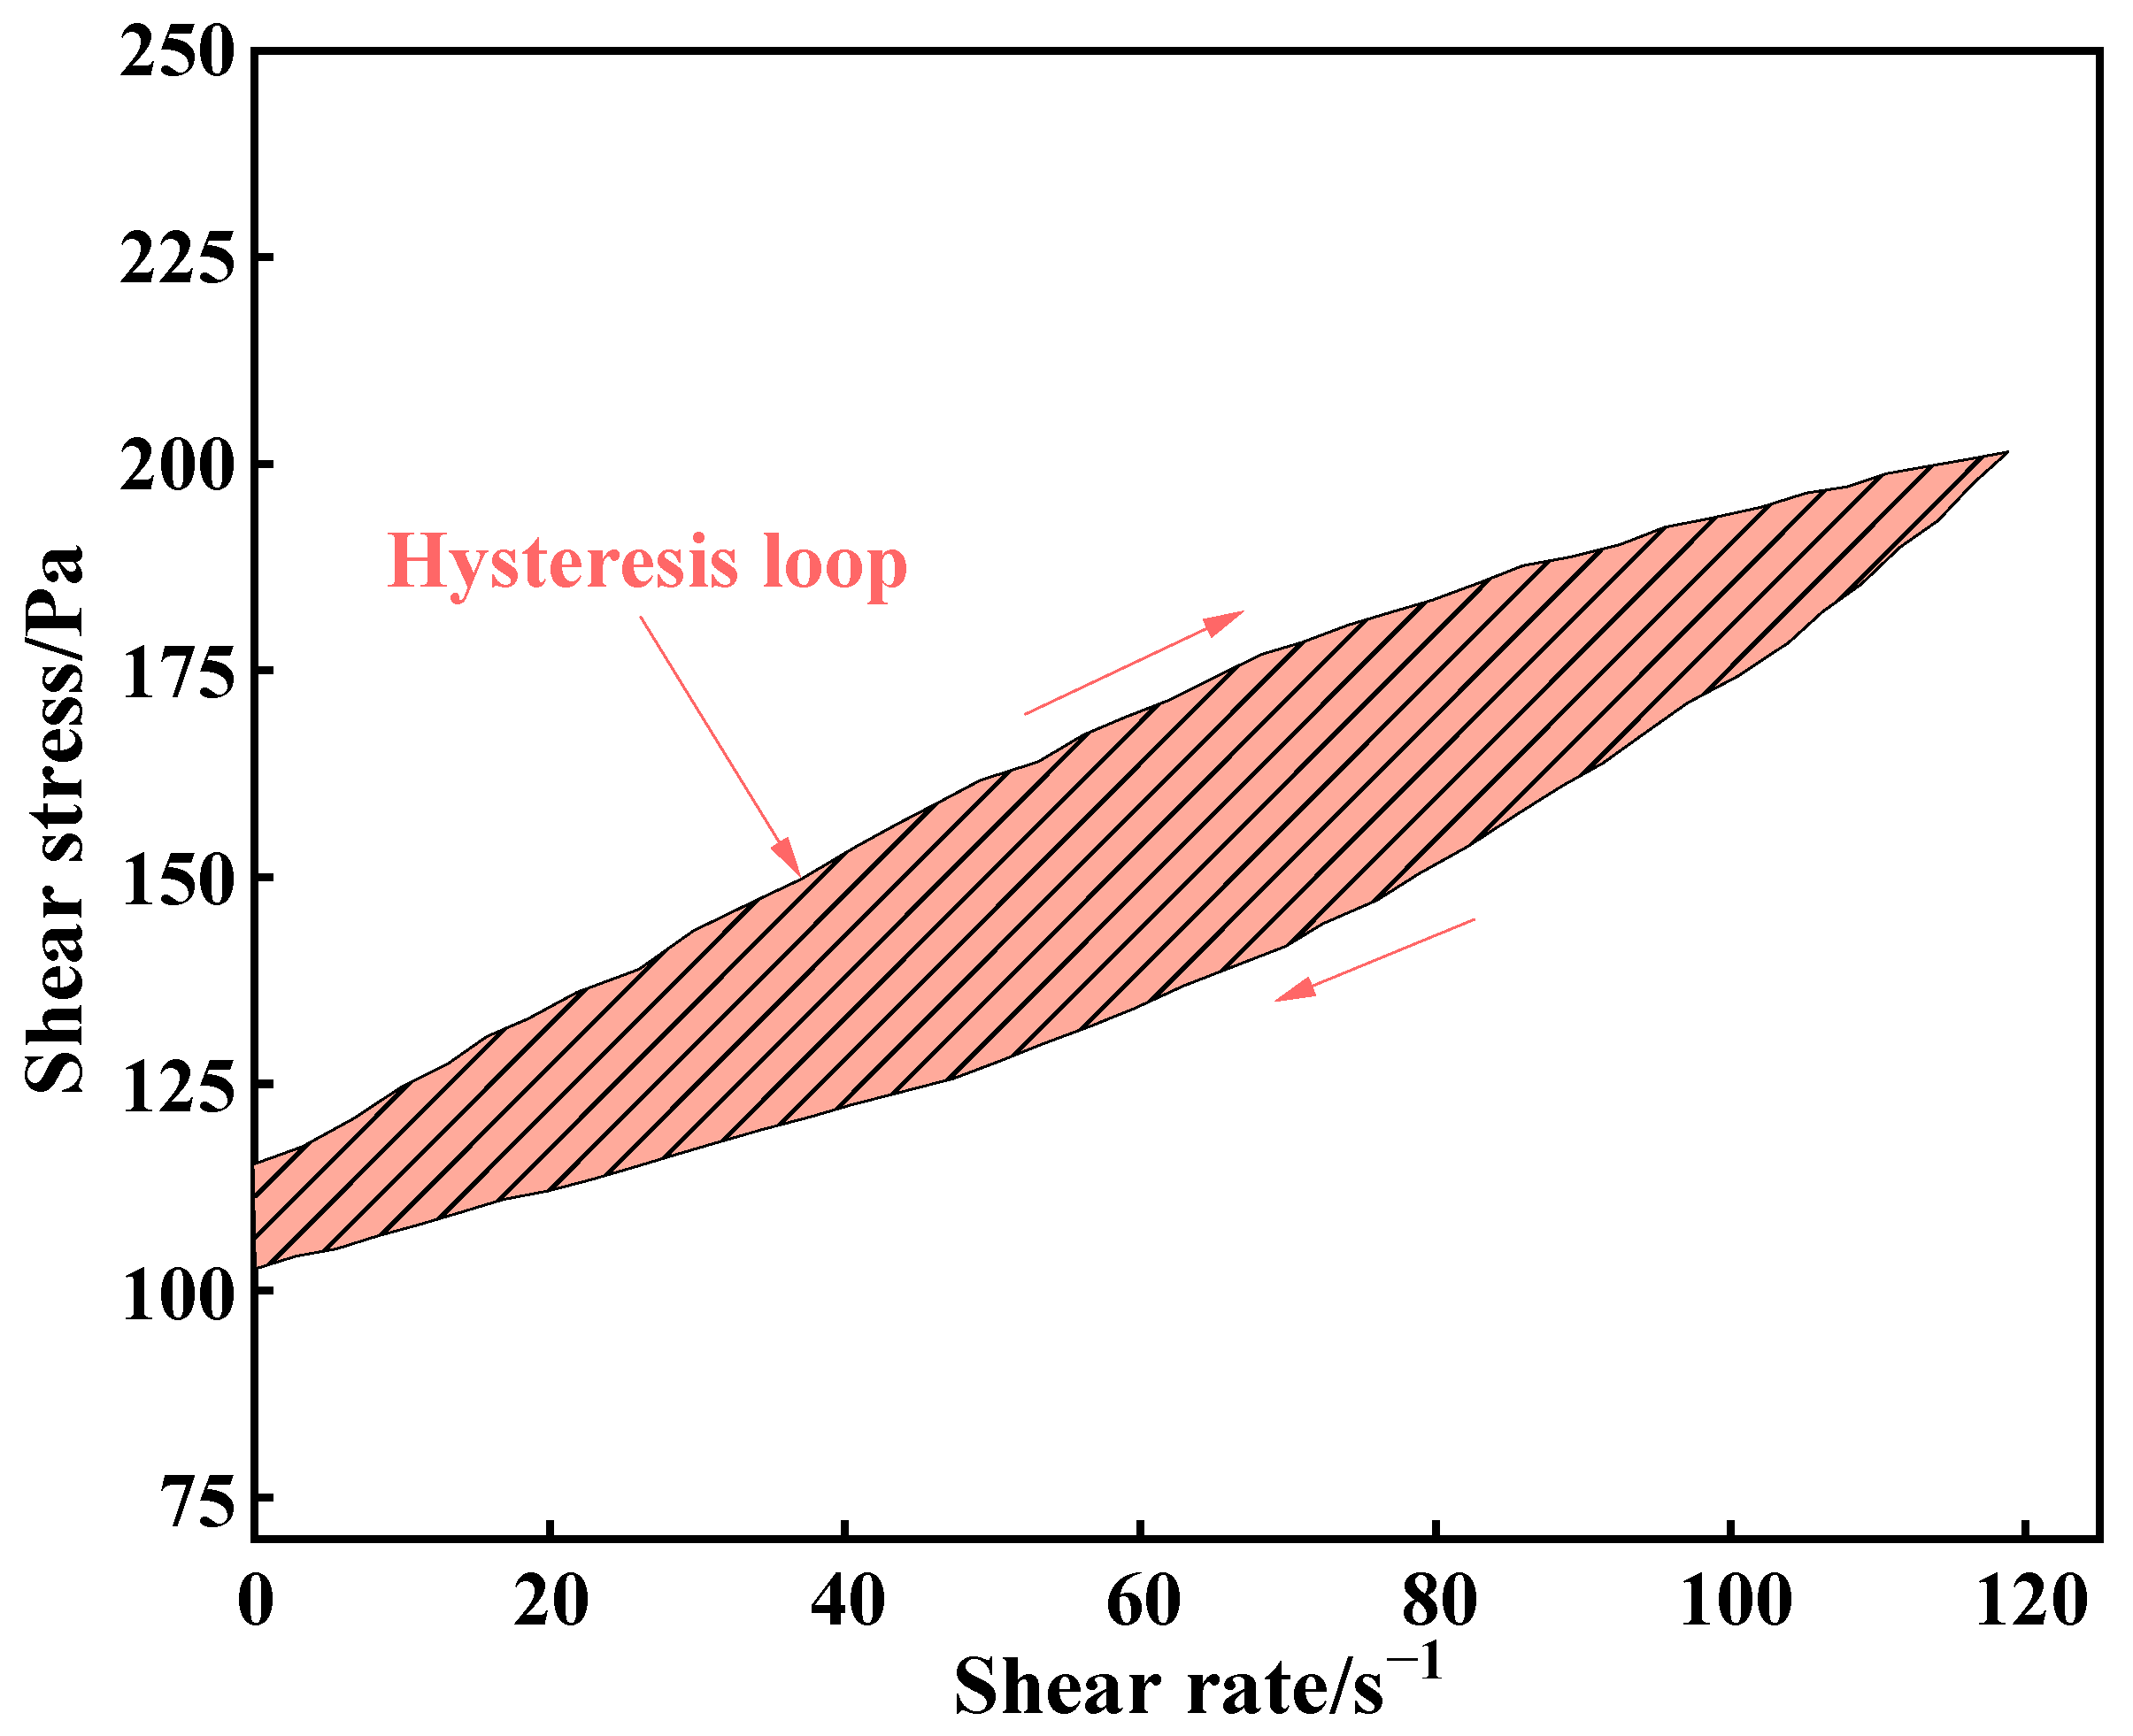
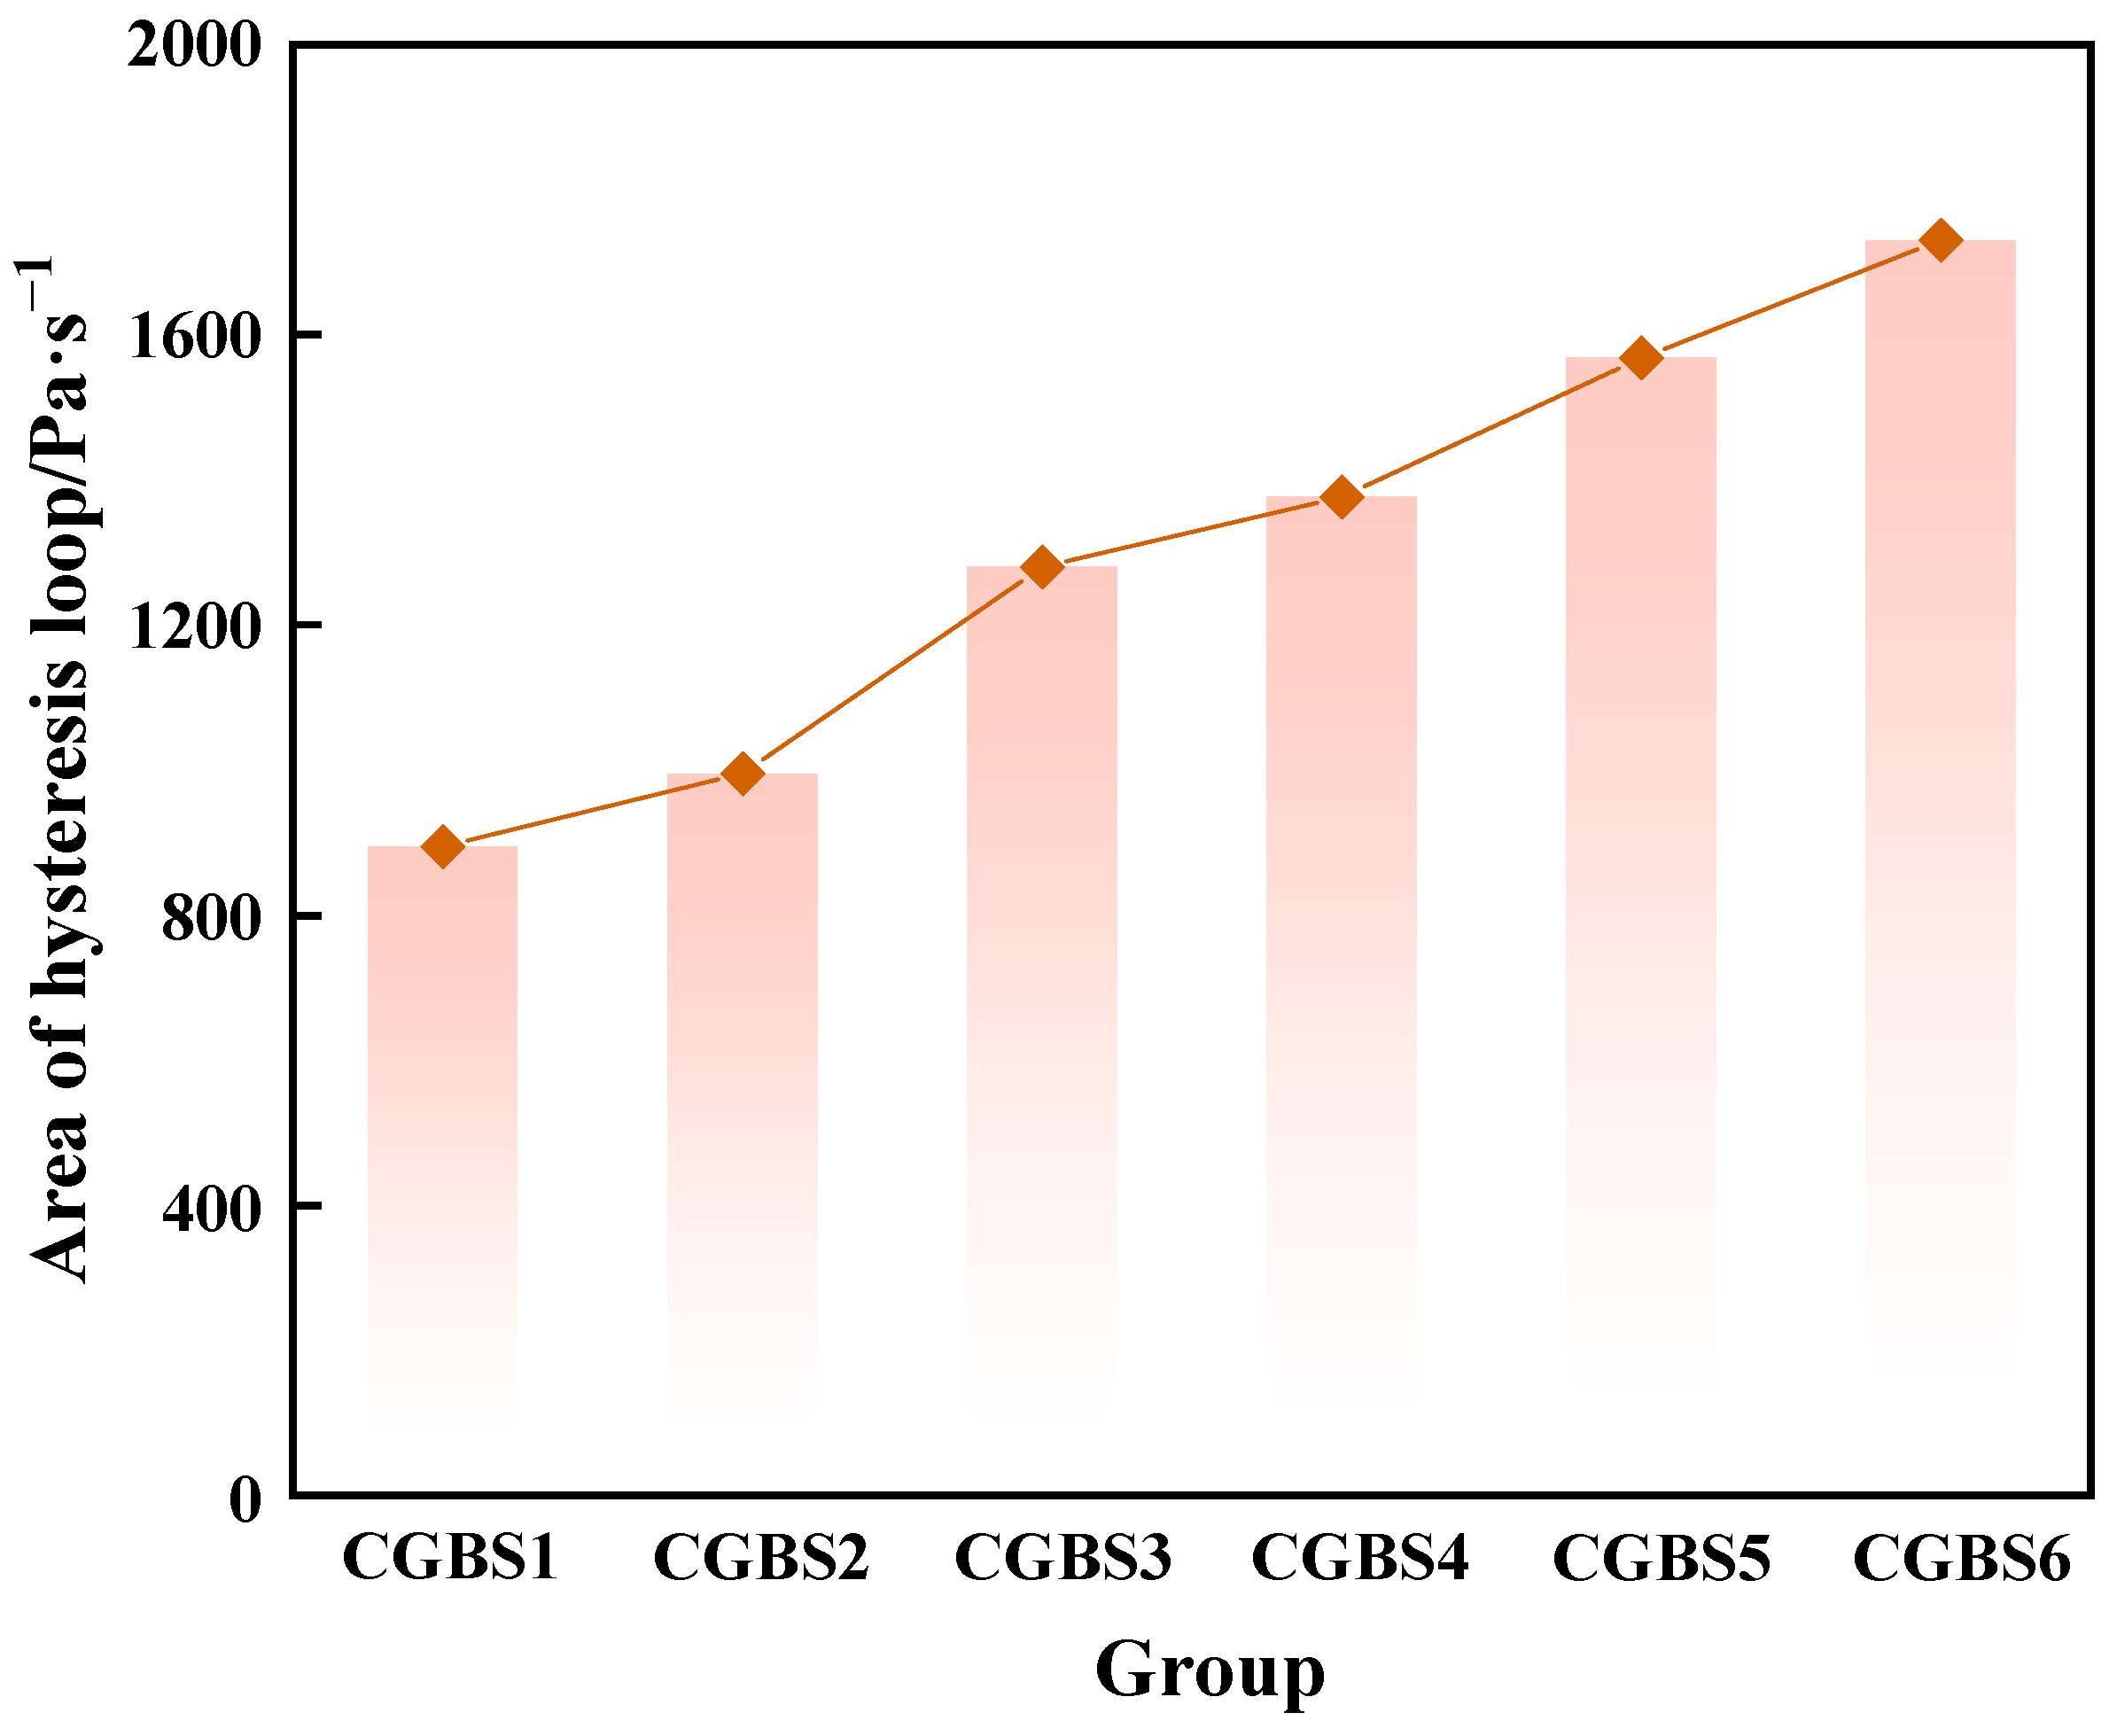
3.1.2. Effect of Carbonization Pressure on Rheological Parameters of CGBS
3.2. Effect of Carbonization Pressure on Composition and Microstructure of CGBS
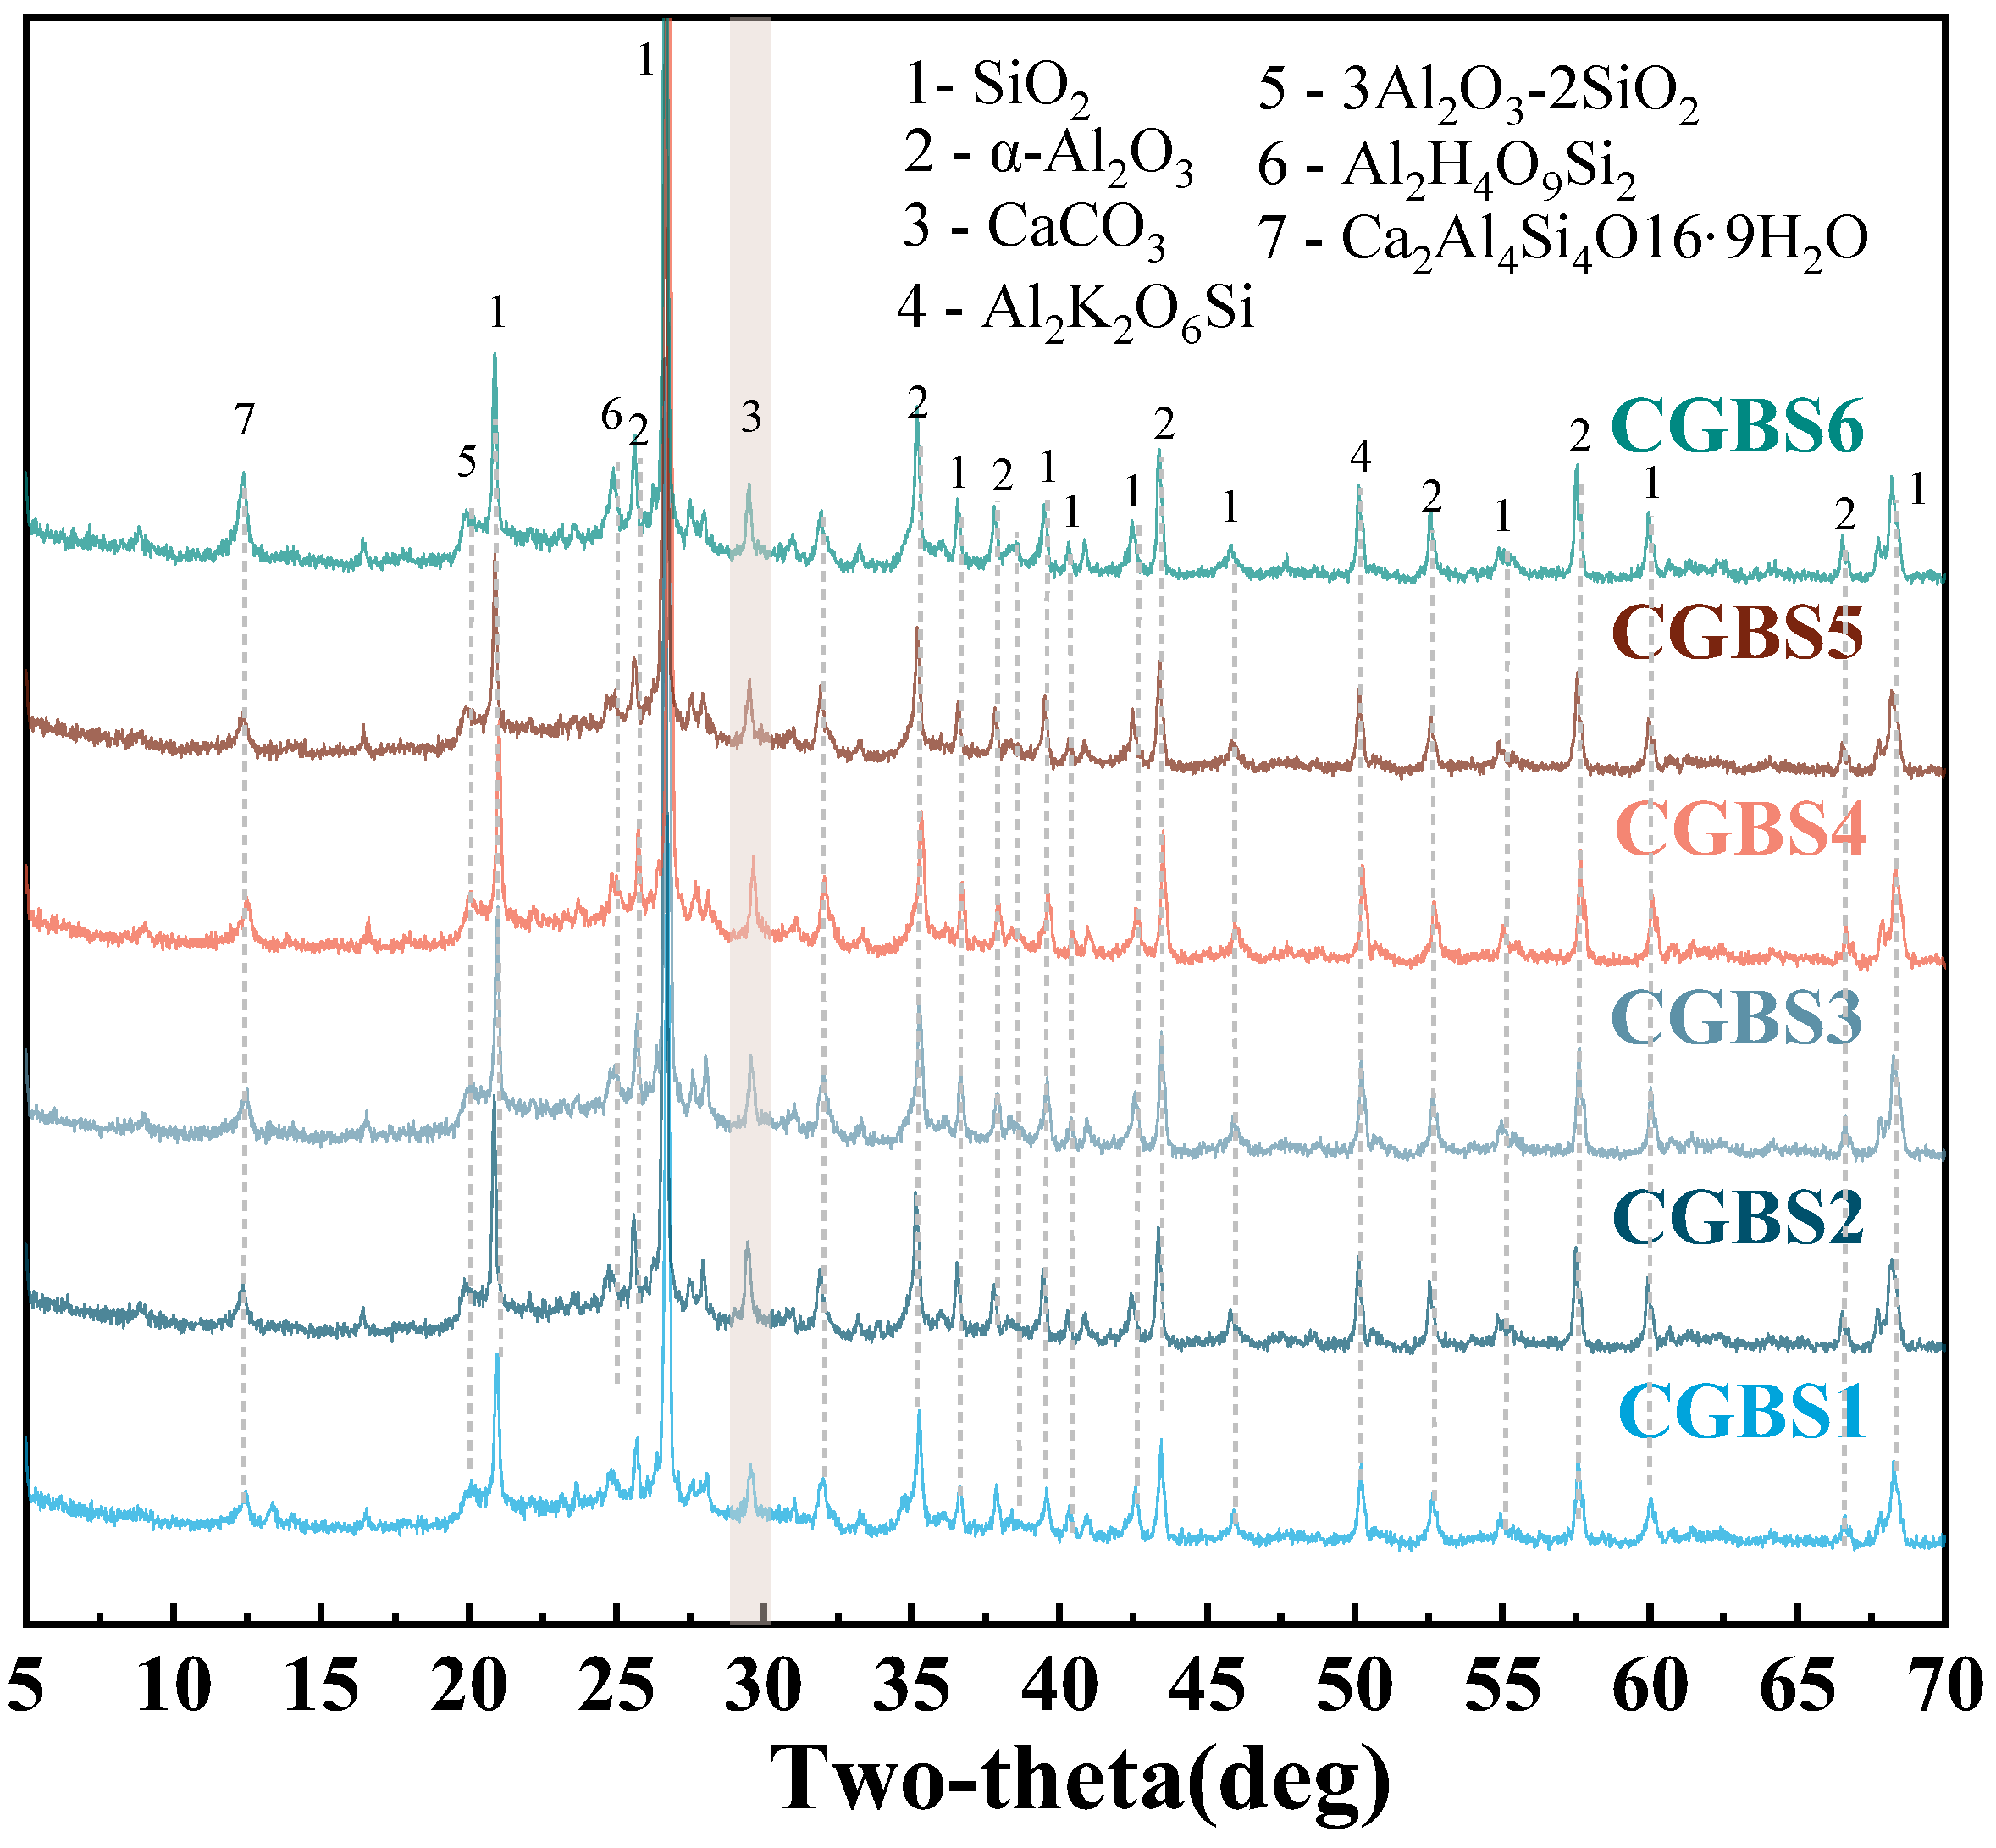
3.2.1. XRD
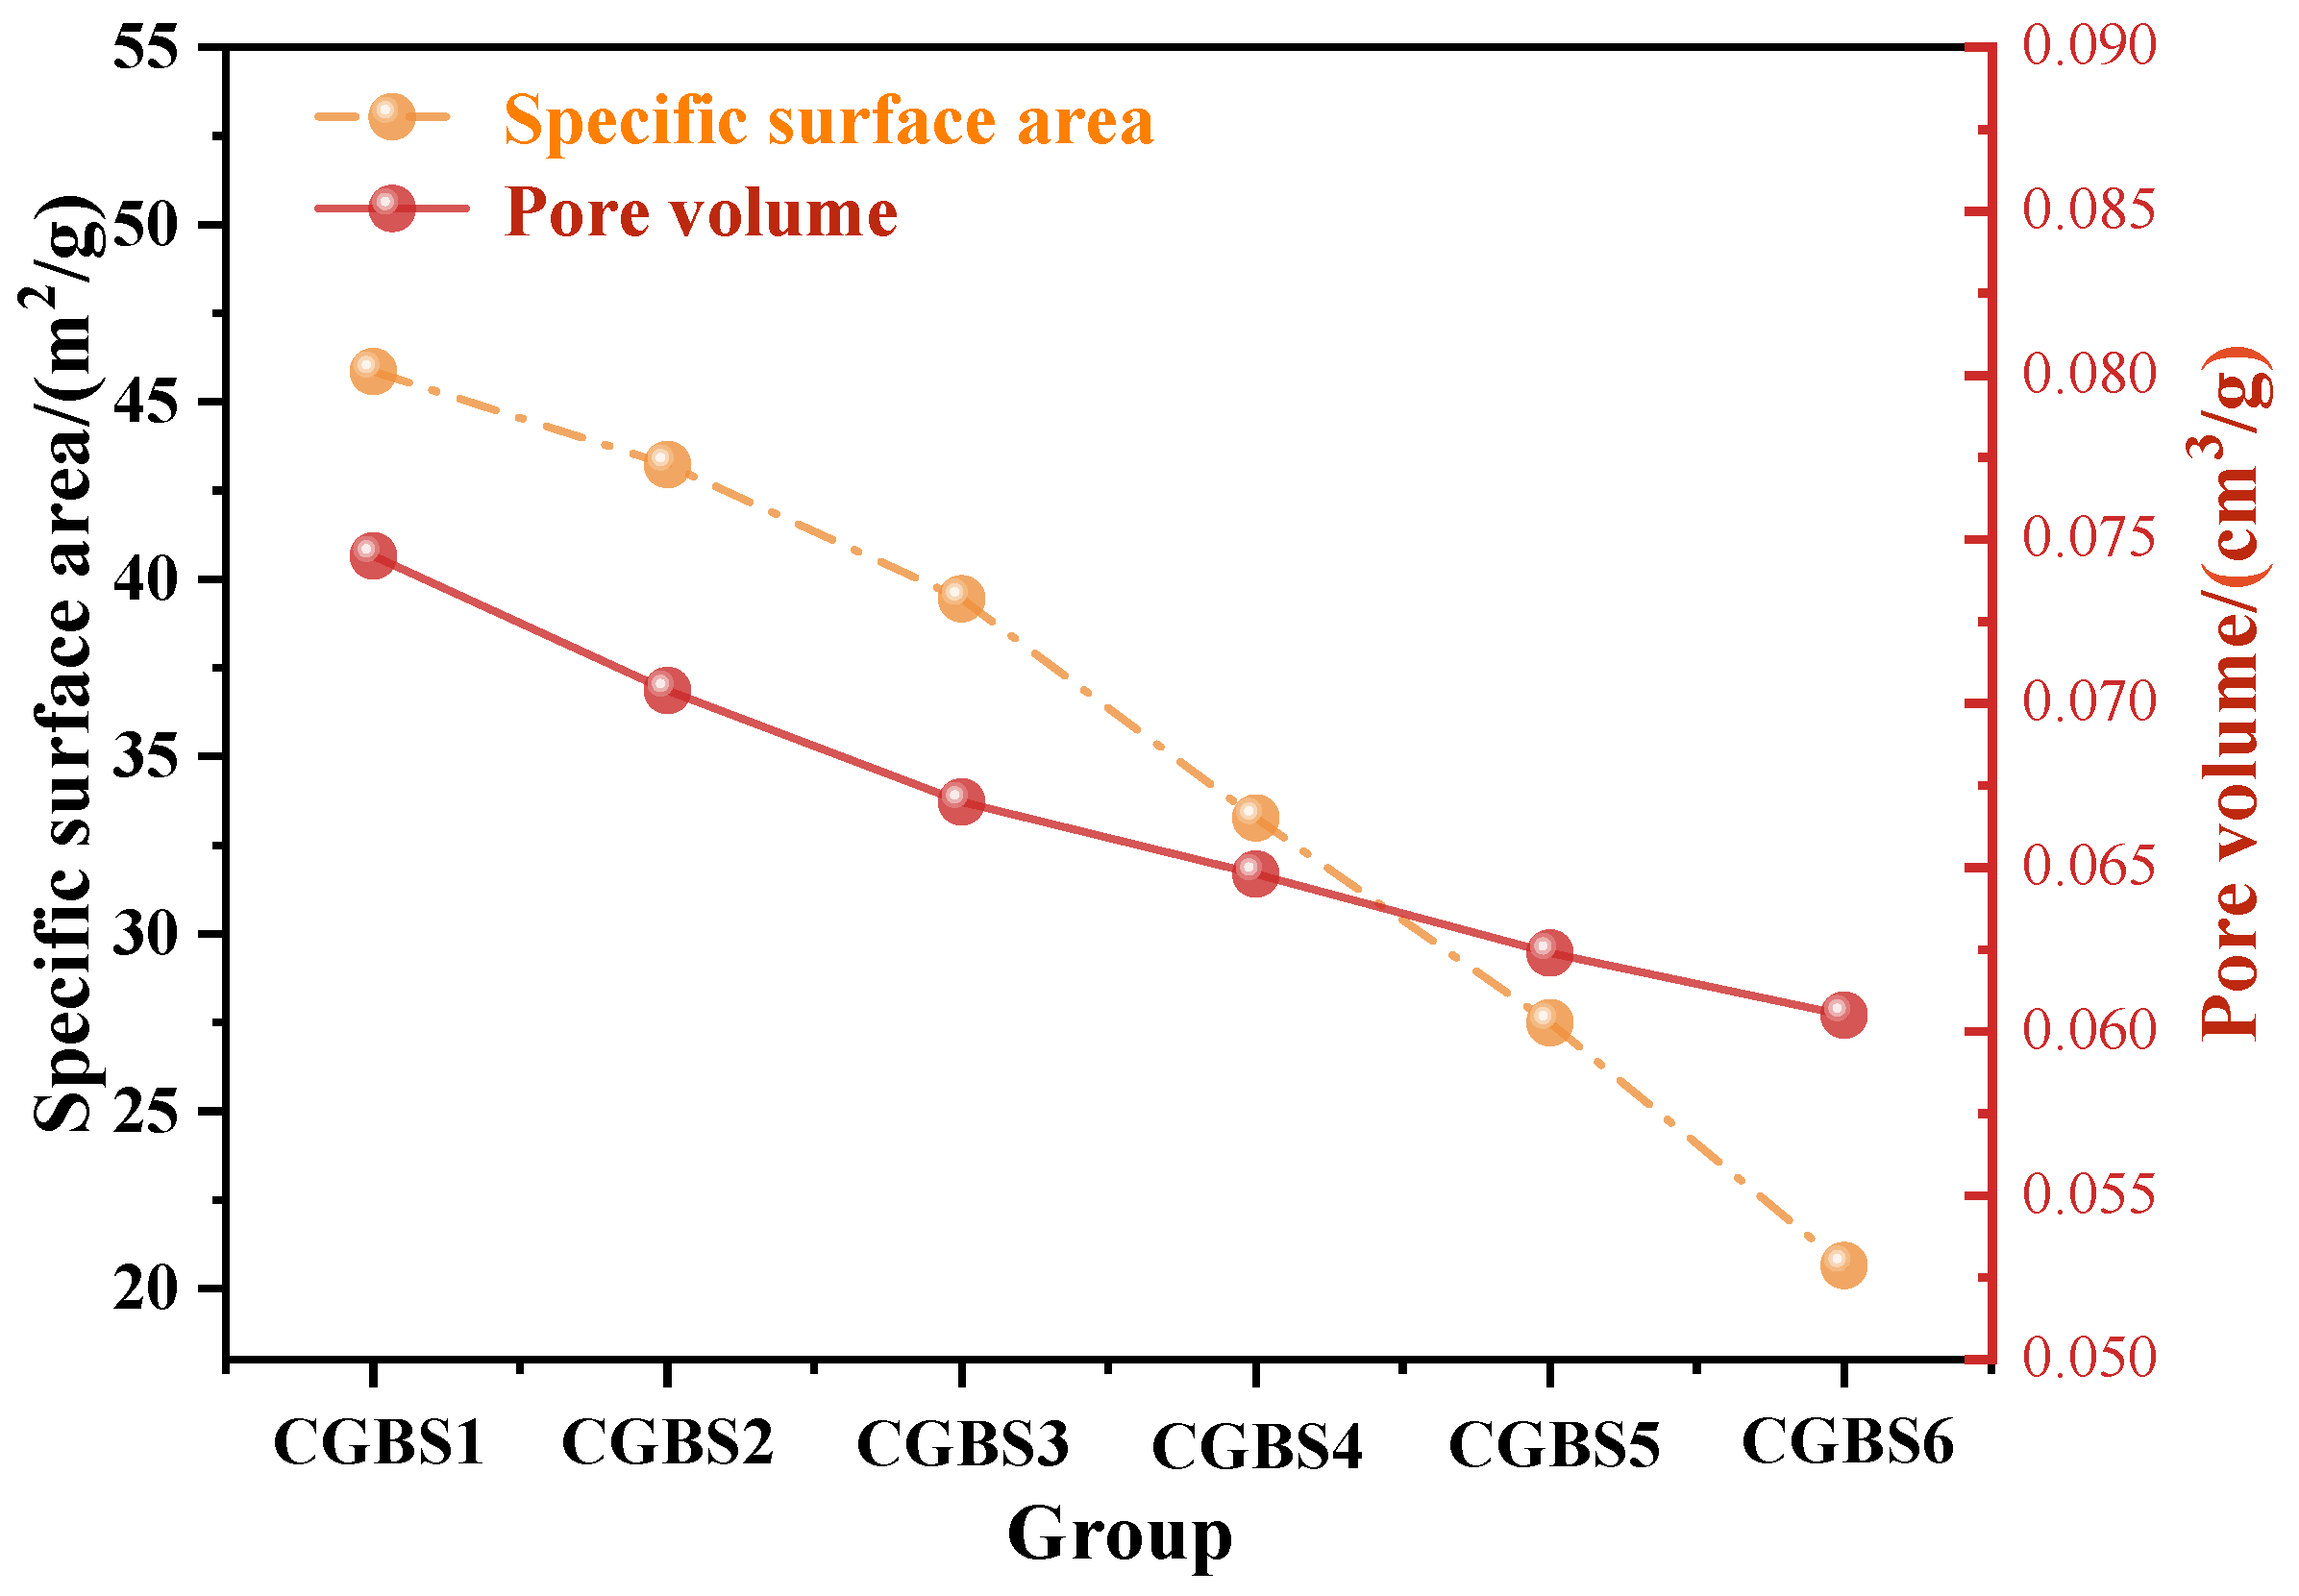
3.2.2. BET
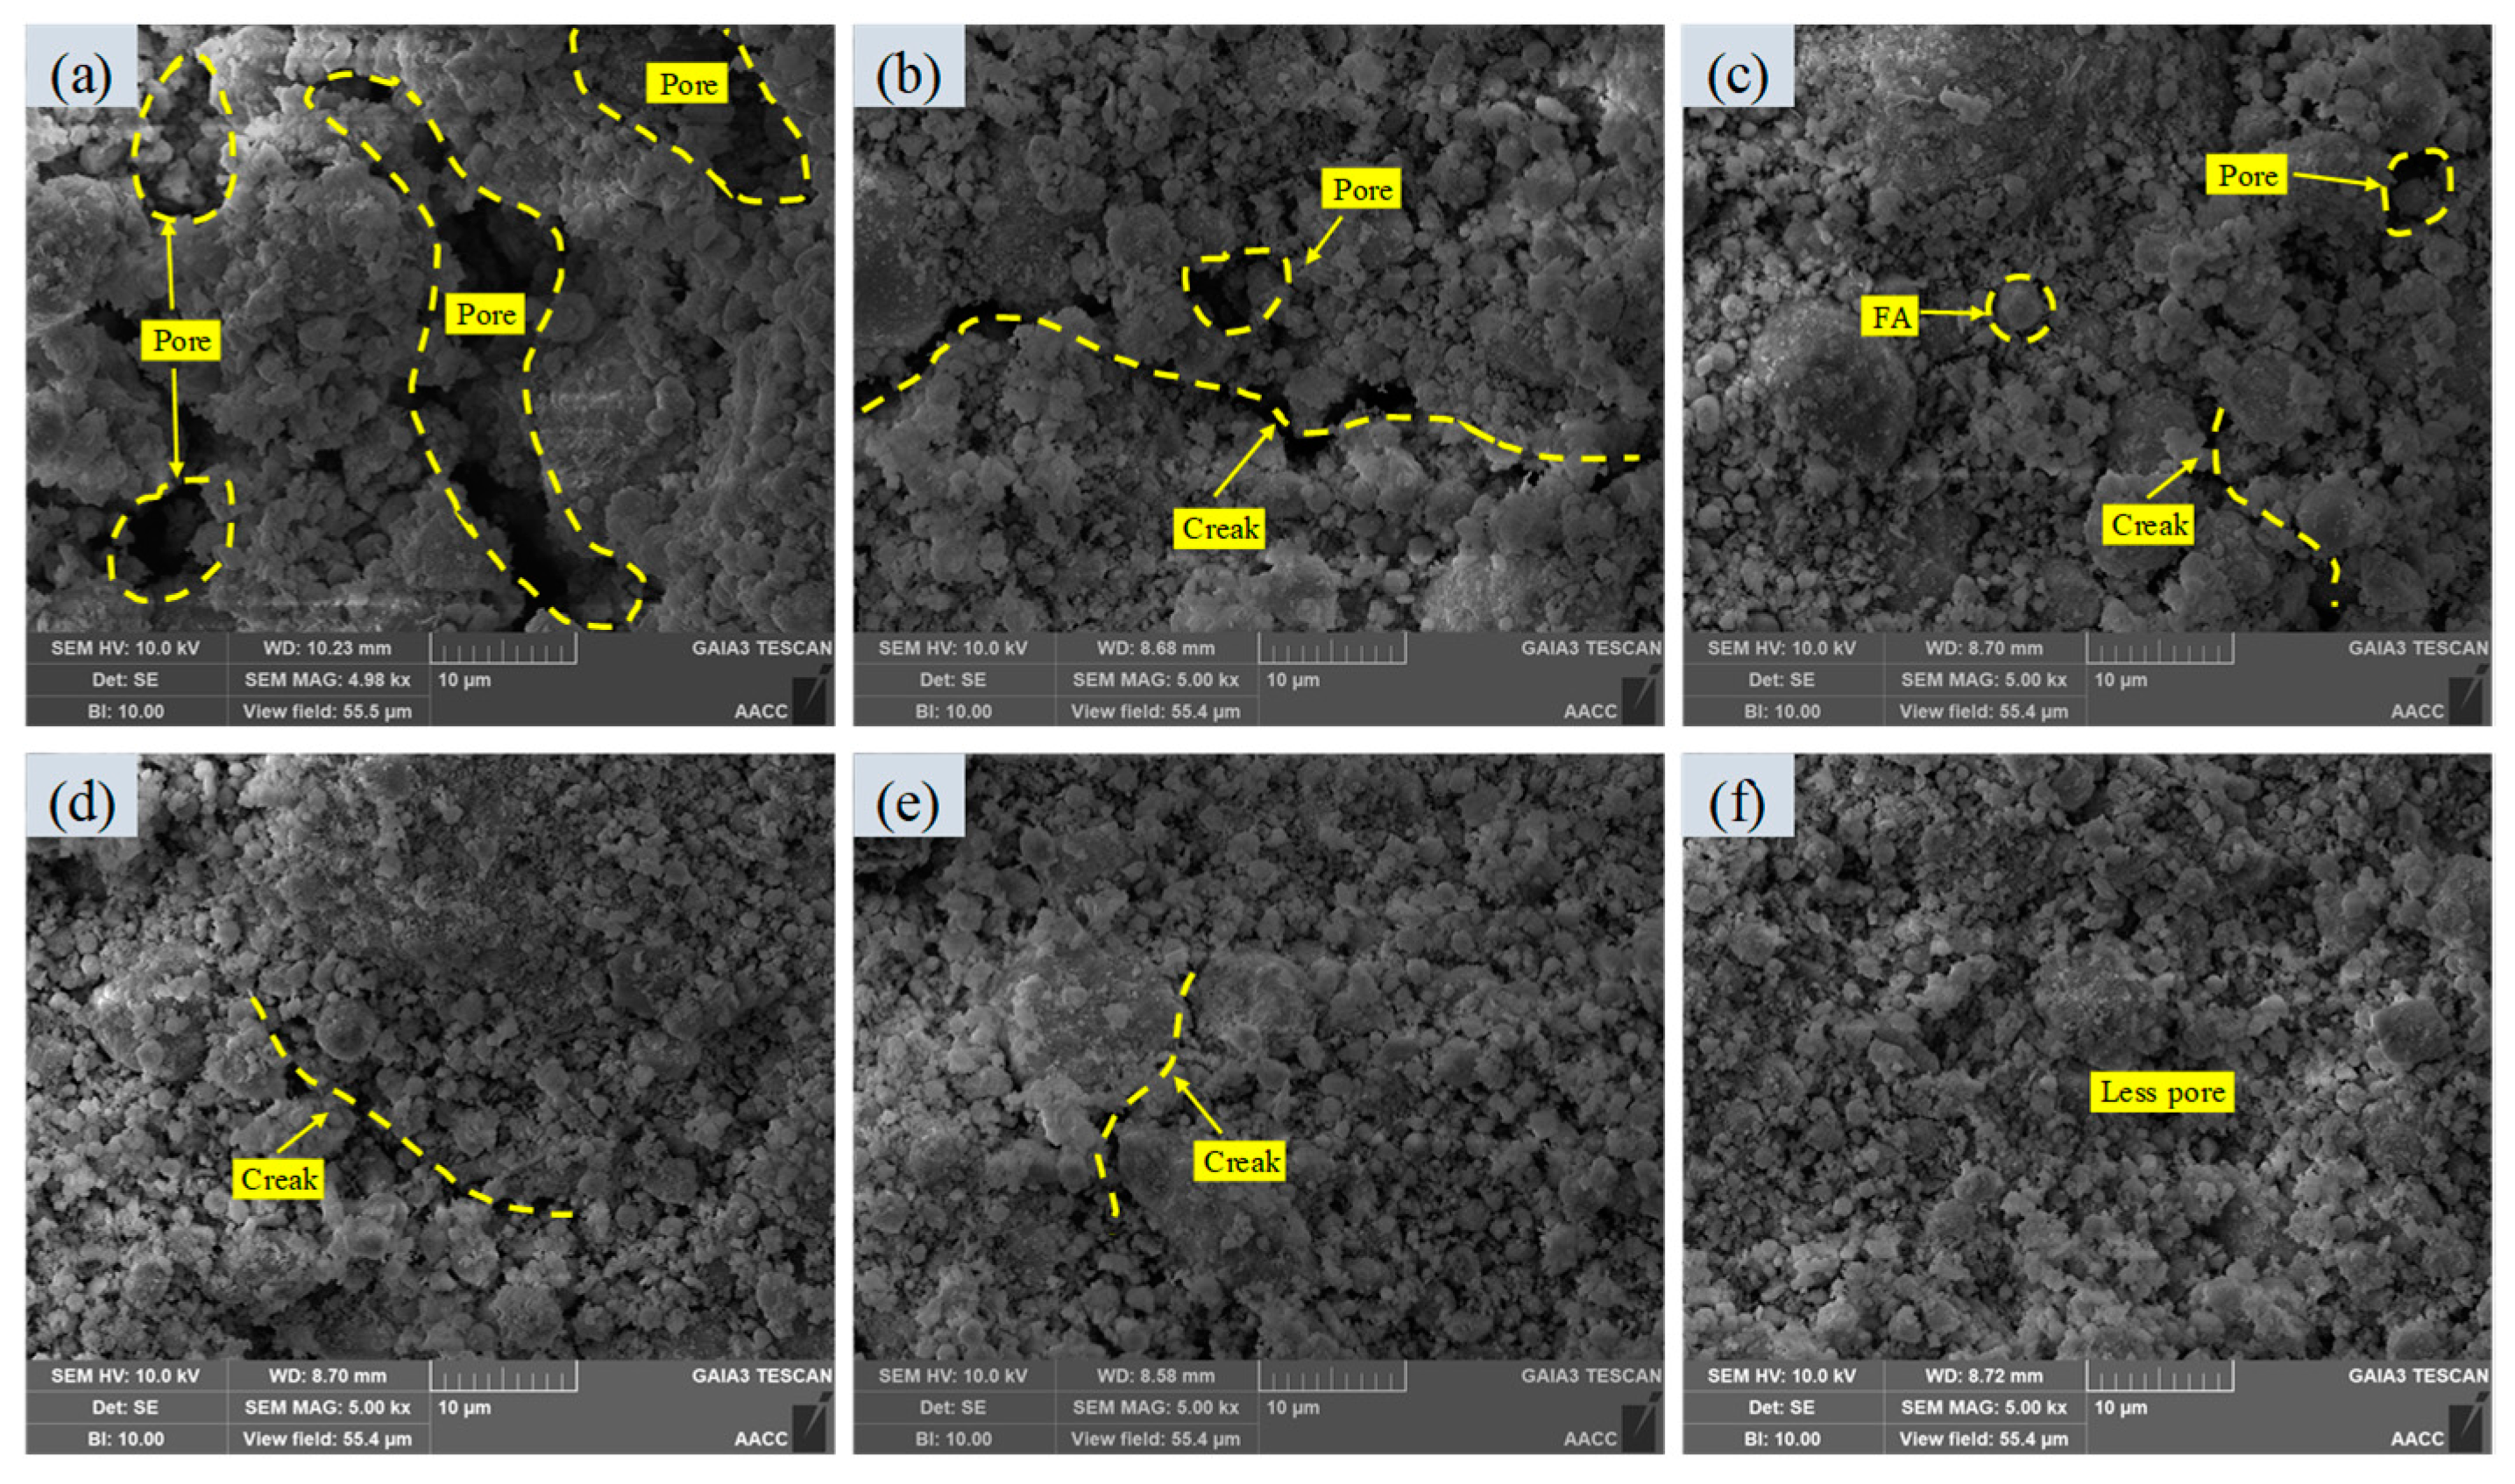
3.2.3. Morphology and Microstructure
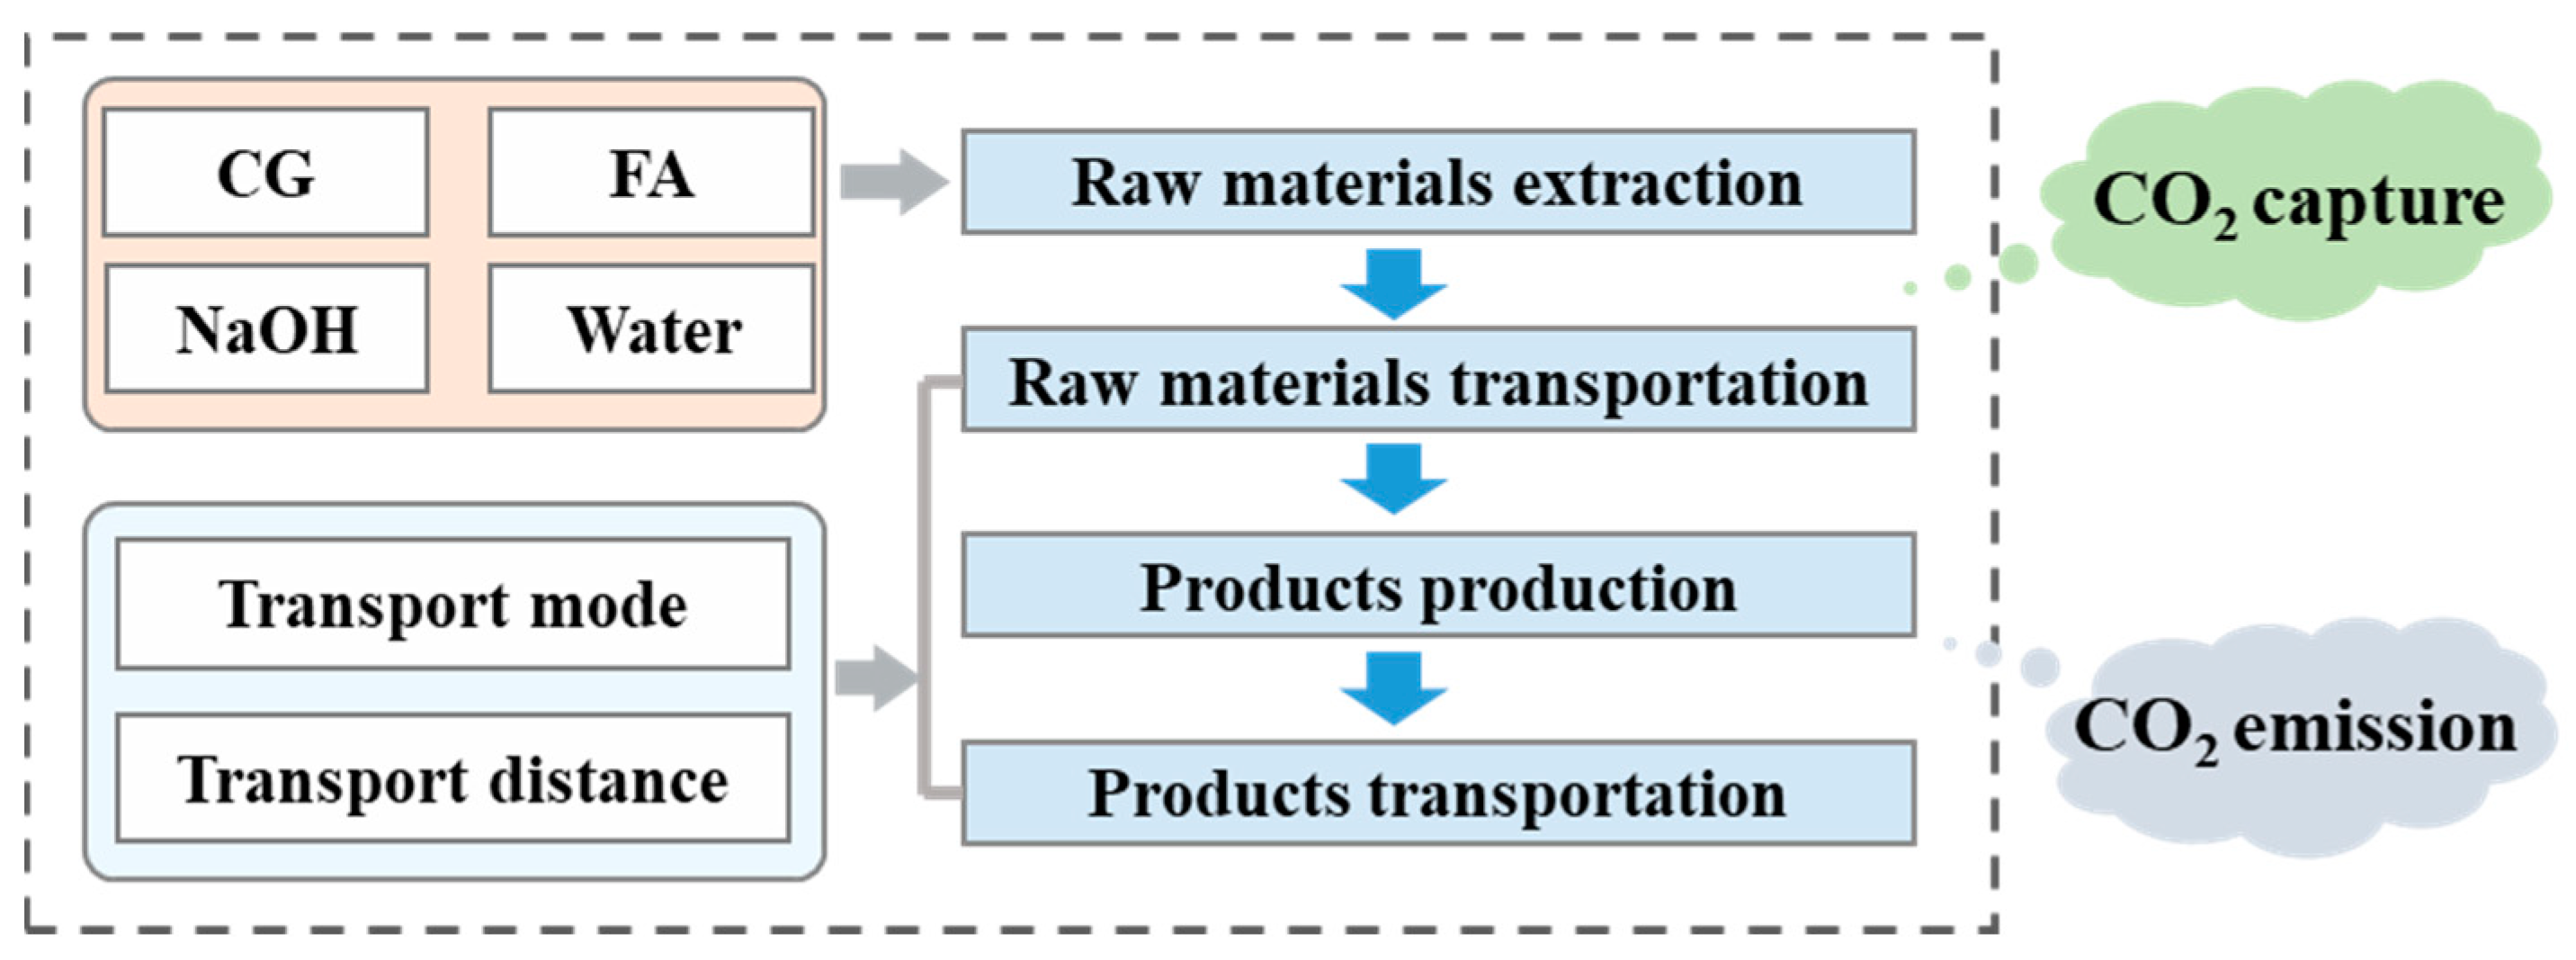
4. Carbon Footprint Calculation and Analysis
5. Conclusions
- (1)
- Increasing the carbonization pressure in the reactor can increase the CO2 sequestration capacity of CGBS. When the carbonization pressure is 0.7 MPa, the CO2 sequestration capacity is 0.38%. When the carbonization pressure is further increased, the CO2 sequestration capacity tends to be stable.
- (2)
- After increasing the carbonization pressure, the calcium carbonate produced will make the slurry structure dense, resulting in the deterioration of the rheological properties of CGBS. Combined with the CO2 sequestration capacity, 0.7 MPa can be used as the optimal carbonization pressure.
- (3)
- When the carbonization pressure is 0.7 MPa, the yield stress, plastic viscosity and hysteresis loop area of CGBS are 181.66 Pa, 0.1024 Pa·s and 1376 Pa/s, respectively.
- (4)
- After increasing the carbonization pressure, the calcium carbonate and hydration products produced fill the pores of the sample, which reduces the specific surface area and pore volume of CGBS and makes the microstructure denser.
Author Contributions
Funding
Institutional Review Board Statement
Informed Consent Statement
Data Availability Statement
Conflicts of Interest
Abbreviations
| CGBS | coal gangue-based backfilling slurry |
| CG | coal gangue |
| FA | fly ash |
| XRF | X-ray fluorescence |
| XRD | X-ray diffraction |
| BET | Brunauer–Emmett–Teller |
| SEM | scanning electron microscope |
References
- Gao, S.; Zhao, G.; Guo, L.; Zhou, L.; Yuan, K. Utilization of coal gangue as coarse aggregates in structural concrete. Constr. Build. Mater. 2021, 268, 121212. [Google Scholar] [CrossRef]
- Zhao, Y.; Qiu, J.; Ma, Z.; Sun, X. Eco-friendly treatment of coal gangue for its utilization as supplementary cementitious materials. J. Clean. Prod. 2021, 285, 124834. [Google Scholar] [CrossRef]
- Chao, X.; Zhang, T.A.; Lv, G.; Zhao, Q.; Cheng, F.; Guo, Y. Sustainable application of coal fly ash: One-step hydrothermal cleaner production of silicon-potassium mineral fertilizer synergistic alumina extraction. J. Clean. Prod. 2023, 426, 139110. [Google Scholar] [CrossRef]
- Wang, N.; Sun, X.; Zhao, Q.; Yang, Y.; Wang, P. Leachability and adverse effects of coal fly ash: A review. J. Hazard. Mater. 2020, 396, 122725. [Google Scholar] [CrossRef]
- Sun, Y.Q.; Xiao, K.; Wang, X.D.; Lv, Z.H.; Mao, M. Evaluating the distribution and potential ecological risks of heavy metal in coal gangue. Environ. Sci. Pollut. Res. 2021, 28, 18604–18615. [Google Scholar] [CrossRef]
- Guo, Q.; Huo, B.; Yu, K.; Xiong, Y.; Li, B. Using acetic acid as a preconditioner to optimize rheology of alkali-activated coal gasification slag based backfill pastes. Miner. Eng. 2024, 218, 109040. [Google Scholar] [CrossRef]
- Liu, R.; Fang, Y.R.; Peng, S.; Benani, N.; Wu, X.; Chen, Y.; Yang, P. Study on factors influencing carbon dioxide emissions and carbon peak heterogenous pathways in Chinese provinces. J. Environ. Manag. 2024, 365, 121667. [Google Scholar] [CrossRef]
- Hao, J.; Gao, F.; Fang, X.; Nong, X.; Zhang, Y.; Hong, F. Multi-factor decomposition and multi-scenario prediction decoupling analysis of China’s carbon emission under dual carbon goal. Sci. Total Environ. 2022, 841, 156788. [Google Scholar] [CrossRef]
- Ngo, I.; Ma, L.; Sajib, M.H.; Zhang, H.; Zhao, Z.; Yu, K.; Peng, C. Examination of the use of binderless zeolite blend as backfill materials to enhance CO2 adsorption in coal mine working face. Case Stud. Constr. Mater. 2024, 21, e03699. [Google Scholar] [CrossRef]
- Chen, Q.; Zhu, L.; Wang, Y.; Chen, J.; Qi, C. The carbon uptake and mechanical property of cemented paste backfill carbonation curing for low concentration of CO2. Sci. Total Environ. 2022, 852, 158516. [Google Scholar] [CrossRef]
- Power, I.M.; Paulo, C.; Long, H.; Lockhart, J.A.; Stubbs, A.R.; French, D.; Caldwell, R. Carbonation, cementation, and stabilization of ultramafic mine tailings. E Environ. Sci. Technol. 2021, 55, 10056–10066. [Google Scholar] [CrossRef]
- De Brito, J.; Kurda, R. The past and future of sustainable concrete: A critical review and new strategies on cement-based materials. J. Clean. Prod. 2021, 281, 123558. [Google Scholar]
- Huo, B.; Zhang, J.; Li, M.; Zhou, N.; Qiu, X.; Fang, K.; Wang, X. Effect of CO2 mineralization on the composition of alkali-activated backfill material with different coal-based solid wastes. Sustainability 2023, 15, 4933. [Google Scholar] [CrossRef]
- Xu, Y.; Ma, L. Characteristics of overburden migration under continuous extraction and continuous backfill mining method with CO2 mineralized filling materials. J. Clean. Prod. 2024, 440, 140920. [Google Scholar] [CrossRef]
- Sun, W.; Liu, L.; Fang, Z.; Xie, G.; He, W.; Gao, Y. Experimental study on the production of carbon-absorbing backfill material from freshly mixed modified magnesium slag slurry. Geomech. Geophys. Geo-Energy Geo-Resour. 2024, 10, 10. [Google Scholar] [CrossRef]
- Park, S.; Moon, H.; Kim, J.H.; Lee, M.; Chung, C.W. Reaction of hydrated cement paste with supercritical carbon dioxide. Constr. Build. Mater. 2021, 281, 122615. [Google Scholar] [CrossRef]
- Liu, L.; Xia, L.; Fang, Z.Y.; Jia, Q.F.; Gao, Y.H.; He, W.; Liu, Z.Z. Performance study of modified magnesium-coal based solid waste negative carbon backfill material: Strength characteristics and carbon fixation efficiency. J. Environ. Chem. Eng. 2024, 12, 113281. [Google Scholar] [CrossRef]
- Shao, C.; Liu, L.; Zhang, X.; Xie, L. Influence of internal and external factors on the fluidity of modified magnesium slag-based backfill materials. J. Environ. Chem. Eng. 2024, 12, 111867. [Google Scholar] [CrossRef]
- Mo, L.; Zhang, F.; Deng, M.; Panesar, D.K. Effectiveness of using CO2 pressure to enhance the carbonation of Portland cement-fly ash-MgO mortars. Cem. Concr. Compos. 2016, 70, 78–85. [Google Scholar] [CrossRef]
- Rostami, V.; Shao, Y.X.; Boyd, A.J.; He, Z. Microstructure of cement paste subject to early carbonation curing. Cem. Concr. Res. 2012, 42, 186–193. [Google Scholar] [CrossRef]
- Yao, D.; Zhao, H.; Chen, Z.; Liu, H. Preparation of high concentration coal water slurry with good fluidity based on only modified fine particles under bimodal distribution using the second fluid and the second particle. Fuel 2022, 317, 123461. [Google Scholar] [CrossRef]
- Yan, Z.; Yin, S.; Chen, X.; Wang, L. Rheological properties and wall-slip behavior of cemented tailing-waste rock backfill (CTWB) paste. Constr. Build. Mater. 2022, 324, 126723. [Google Scholar] [CrossRef]
- Gao, R.; Zhou, K.; Zhou, Y.; Yang, C. Research on the fluid characteristics of cemented backfill pipeline transportation of mineral processing tailings. Alexandria Eng. J. 2020, 59, 4409–4426. [Google Scholar] [CrossRef]
- Gulmus, S.A.; Yilmazer, U. Effect of volume fraction and particle size on wall slip in flow of polymeric suspensions. J. Appl. Polym. Sci. 2005, 98, 439–448. [Google Scholar] [CrossRef]
- Xia, L.; Liu, L.; Fang, Z.; Jia, Q.; He, W.; Gao, Y. The effect of different process parameters on the flowability of modified magnesium-coal based solid waste carbon fixation backfill slurry rich in dicalcium silicate. Environ. Earth Sci. 2024, 83, 460. [Google Scholar] [CrossRef]
- Feng, H.; Pan, L.; Zheng, Q.; Li, J.; Xu, N.; Pang, S. Effects of molecular structure of polycarboxylate superplasticizers on their dispersion and adsorption behavior in cement paste with two kinds of stone powder. Constr. Build. Mater. 2018, 170, 182–192. [Google Scholar] [CrossRef]
- Jiang, H.; Fall, M.; Yilmaz, E.; Li, Y.; Yang, L. Effect of mineral admixtures on flow properties of fresh cemented paste backfill: Assessment of time dependency and thixotropy. Powder Technol. 2020, 372, 258–266. [Google Scholar] [CrossRef]
- Wang, S.; Li, Y.; Yang, R.; Xu, B.; Lu, B. Rheological behavior with time dependence and fresh slurry liquidity of cemented aeolian sand backfill based on response surface method. Constr. Build. Mater. 2023, 371, 130768. [Google Scholar] [CrossRef]
- Qiu, J.; Guo, Z.; Yang, L.; Jiang, H.; Zhao, Y. Effects of packing density and water film thickness on the fluidity behaviour of cemented paste backfill. Powder Technol. 2020, 359, 27–35. [Google Scholar] [CrossRef]
- Huo, B.B.; Zhang, J.X.; Zhou, N.; Li, M.; Guo, Q. Effect of sodium dodecyl sulfate on the CO2 sequestration and rheological properties of alkali-activated coal gasification slag backfill pastes. J. Min. Saf. Eng. 2024, 41, 1279–1288. [Google Scholar]
- Wang, X.L.; Wang, H.J.; Wu, A.X.; Jiang, H.Q.; Peng, Q.S.; Zhang, X. Evaluation of time-dependent rheological properties of cemented paste backfill incorporating superplasticizer with special focus on thixotropy and static yield stress. J. Cent. South Univ. 2022, 29, 1239–1249. [Google Scholar] [CrossRef]
- Fang, Z.; Gao, Y.; He, W.; Zhu, M.; Xia, L.; Yang, P.; Liu, D.; He, J. Carbonation curing of magnesium-coal slag solid waste backfill material: Study on properties of flow, mechanics and carbon sequestration. Case Stud. Constr. Mater. 2024, 20, e03204. [Google Scholar] [CrossRef]
- Wang, P.; Mao, X.; Chen, S.E. CO2 sequestration characteristics in the cementitious material based on gangue backfilling mining method. Int. J. Min. Sci. Technol. 2019, 29, 721–729. [Google Scholar] [CrossRef]
- Li, D.; Wang, D.; Ren, C.; Rui, Y. Investigation of rheological properties of fresh cement paste containing ultrafine circulating fluidized bed fly ash. Constr. Build. Mater. 2018, 188, 1007–1013. [Google Scholar] [CrossRef]
- Wu, H.; Liu, Y.; Li, H.; Wang, K.; Guo, Y. Effects of carbonization on gangue-cemented paste backfill properties. Int. J. Green Energy. 2021, 18, 282–296. [Google Scholar] [CrossRef]
- Guo, X.; Li, Y.; Shi, H.; She, A.; Guo, Y. Carbon reduction in cement industry-An indigenized questionnaire on environmental impacts and key parameters of life cycle assessment (LCA) in China. J. Clean. Prod. 2023, 426, 139022. [Google Scholar] [CrossRef]
- Huo, B.; Zhang, Y.; Wang, D. Optimizing CO2 capture property of alkali-activated ladle slag materials with sodium dodecyl sulfate. Powder Technol. 2025, 449, 120388. [Google Scholar] [CrossRef]


| No. | SiO2 | Al2O3 | Fe2O3 | CaO | K2O | MgO | Na2O | TiO2 | SO3 |
|---|---|---|---|---|---|---|---|---|---|
| CG | 55.87 | 22.46 | 10.15 | 1.08 | 4.56 | 2.02 | 1.45 | 1.20 | 1.03 |
| FA | 54.04 | 31.44 | 4.84 | 3.08 | 2.18 | 1.07 | 0.74 | 1.26 | 1.35 |
| Croup | CG, g | FA, g | Water, g | Carbonization Pressure, MPa |
|---|---|---|---|---|
| CGBS1 | 70 | 30 | 60 | 0.1 |
| CGBS2 | 0.3 | |||
| CGBS3 | 0.5 | |||
| CGBS4 | 0.7 | |||
| CGBS5 | 0.9 | |||
| CGBS6 | 1.1 |
| Source | Test Methods | F | p |
|---|---|---|---|
| Carbonization pressure | Mauchly’s Test for Sphericity | 19,385.7 | *** |
| Greenhouse–Geisser | 19,385.7 | *** | |
| Huynh–Feldt | 19,385.7 | *** |
| No. | Rheological Model | Fitting Results | τ0/Pa | η/Pa·s | n | R2 |
|---|---|---|---|---|---|---|
| CGBS1 | H-B | τ = 127.16 + 0.0399γ1.32 | 127.16 | 0.0399 | 1.32 | 0.9995 |
| CGBS2 | τ = 138.95 = 0.0596γ1.26 | 138.95 | 0.0596 | 1.26 | 0.9990 | |
| CGBS3 | τ = 146.88 = 0.0685γ1.23 | 146.88 | 0.0685 | 1.23 | 0.9992 | |
| CGBS4 | τ = 171.66 = 0.0998γ1.54 | 171.66 | 0.0998 | 1.54 | 0.9994 | |
| CGBS5 | τ = 192.24 = 0.1028γ1.70 | 192.24 | 0.1028 | 1.70 | 0.9995 | |
| CGBS6 | τ = 212.49 = 0.1145γ1.54 | 212.49 | 0.1145 | 1.54 | 0.9996 |
| NO. | Ce | Ct | Cp | Cr | Ca | C |
|---|---|---|---|---|---|---|
| CGBS1 | 38.72 | 85.40 | 1.26 | −92.17 | 0 | 33.21 |
| CGBS4 | 38.72 | 85.40 | 1.26 | −92.17 | −33.85 | −0.64 |
Disclaimer/Publisher’s Note: The statements, opinions and data contained in all publications are solely those of the individual author(s) and contributor(s) and not of MDPI and/or the editor(s). MDPI and/or the editor(s) disclaim responsibility for any injury to people or property resulting from any ideas, methods, instructions or products referred to in the content. |
© 2025 by the authors. Licensee MDPI, Basel, Switzerland. This article is an open access article distributed under the terms and conditions of the Creative Commons Attribution (CC BY) license (https://creativecommons.org/licenses/by/4.0/).
Share and Cite
Zhu, L.; Liu, Z.; Guo, Q.; Huo, B.; Zhou, N.; Zhou, Y.; Li, M.; Gu, W. Effect of Carbonization Pressure on CO2 Sequestration and Rheological Properties of Coal Gangue-Based Backfilling Slurry. Appl. Sci. 2025, 15, 1656. https://doi.org/10.3390/app15031656
Zhu L, Liu Z, Guo Q, Huo B, Zhou N, Zhou Y, Li M, Gu W. Effect of Carbonization Pressure on CO2 Sequestration and Rheological Properties of Coal Gangue-Based Backfilling Slurry. Applied Sciences. 2025; 15(3):1656. https://doi.org/10.3390/app15031656
Chicago/Turabian StyleZhu, Lei, Zhicheng Liu, Qiang Guo, Binbin Huo, Nan Zhou, Yuejin Zhou, Meng Li, and Wenzhe Gu. 2025. "Effect of Carbonization Pressure on CO2 Sequestration and Rheological Properties of Coal Gangue-Based Backfilling Slurry" Applied Sciences 15, no. 3: 1656. https://doi.org/10.3390/app15031656
APA StyleZhu, L., Liu, Z., Guo, Q., Huo, B., Zhou, N., Zhou, Y., Li, M., & Gu, W. (2025). Effect of Carbonization Pressure on CO2 Sequestration and Rheological Properties of Coal Gangue-Based Backfilling Slurry. Applied Sciences, 15(3), 1656. https://doi.org/10.3390/app15031656