Abstract
To address the issue of declining prediction accuracy caused by the lack of data in newly constructed wind and solar power stations, this paper introduces a transfer learning-based forecasting approach for wind and photovoltaic power. The method incorporates sensitive meteorological feature selection and utilizes a Temporal Convolutional Network–Attention–Long Short-Term Memory (TCN-ATT-LSTM) model. Spearman’s rank correlation, mutual information entropy, and Pearson correlation are employed to investigate the relationship between meteorological features and power output. Through evidence theory, meteorological features with a cumulative contribution exceeding 85% are selected as inputs for the wind and solar power forecasting model. The TCN-ATT-LSTM network is pre-trained to extract common knowledge, and transfer learning is applied to fine-tune (FT) the model through network parameter adjustments. This enables the adaptive model to be quickly constructed for target wind and solar power stations with limited data, improving the prediction accuracy. Finally, the effectiveness of the proposed method is validated through its application to data from a projected wind and solar power station planned for a region in northwestern China. The proposed method not only enhances forecasting accuracy for emerging wind and solar power stations with limited data but also has significant implications for the renewable energy industry.
1. Introduction
With the depletion of fossil fuels and the increasing severity of environmental pollution, the development of renewable energy has become an urgent task. Wind and solar energy, as green and pollution-free renewable energy sources, have seen a continuous rise in grid penetration [1,2,3]. To effectively combat the climate change and energy crisis, countries around the world are vigorously advancing the low-carbon, clean, and sustainable transformation of energy systems to address global climate change, environmental pollution, and energy strategies [4]. In this context, generating time-series power curves for wind and solar energy based on meteorological characteristics under natural conditions is essential for providing reliable data support for power grid planning [5].
In the current research on wind and solar power forecasting, effectively utilizing Numerical Weather Prediction (NWP) data is key to improving prediction accuracy [6,7,8]. NWP data provide various meteorological data including wind direction, wind speed, and so on, but not all the features are useful for forecasting. Therefore, it is necessary to extract, select, and optimize sensitive meteorological features from NWP data to improve prediction accuracy and reduce model complexity. Feature selection methods can be categorized as the following two types [9]: the first directly selects important features for model construction without altering the feature data, and the second maps features into a lower-dimensional space based on data relationships, which is more suited for large datasets with strong correlations. However, due to the significant variation in NWP data features, it can introduce noise, ultimately hindering prediction accuracy. Reference [10] presented a method for ultra-short-term wind speed correction based on NWP data. Reference [11] introduced a short-term wind power forecasting method that improved prediction accuracy by detecting and correcting errors within NWP data, thereby enhancing the reliability of short-term wind power forecasts. Reference [12] utilized the information entropy-based feature selection principle to effectively select meteorological features that significantly impact power output. Most current studies on feature selection rely on single correlation evaluation metrics, such as Pearson, Spearman, or information entropy. However, using a single metric may introduce biases, leading to errors in feature selection.
Current research on modeling time series power curves for solar and wind energy is typically classified into two primary categories: mechanism-driven methods and data-driven methods [13]. Mechanism-driven methods are based on the fundamental principles of wind and solar power generation, calculating output power through physical formulas and key meteorological parameters such as wind speed and solar radiation [1]. However, the complexities of actual operations are always overlooked by these methods, resulting in smoother simulated curves that differ significantly from real conditions. On the other hand, data-driven methods utilize artificial intelligence techniques to uncover the complex nonlinear relationships between meteorological features and power output from measured data, generating power curves that are more reflective of reality [14,15]. Nevertheless, data-driven methods require a large amount of historical data, and their performance is limited when data are scarce.
To address this issue, transfer learning is introduced by migrating a pre-trained wind and solar power output model, developed using data-rich sites, to newly established sites with similar characteristics but limited data availability. This approach not only mitigates the problem of data scarcity and enhances prediction accuracy but also significantly accelerates model training [16]. Reference [17] first employed a pre-trained model to learn the power and error characteristics of a source-domain photovoltaic power station, then applied the learned features during model fine-tuning to achieve rapid transfer and to compensate for the insufficient data volume of newly established photovoltaic power stations. Reference [18] proposed a two-stage transfer learning method for short-term wind power forecasting. By constructing temporal features and scenario matching, the forecasted wind speed was preliminarily corrected from both spatial and temporal dimensions, improving prediction accuracy. However, most of the existing research has focused on transfer learning among wind and solar stations that are geographically close and limited in historical power data. Moreover, these studies have been confined to a single type of power station, lacking investigation into the features of combined wind and solar power output curves. When there is a considerable geographical distance between source and target domains, it results in differences in meteorological data distribution. To ensure the quality of the transfer, it becomes necessary to extract comprehensive meteorological information features from both domains during the transfer process.
To address the above issue, this paper proposes a TCN-ATT-LSTM transfer learning method for wind and solar power forecasting that incorporates sensitive meteorological feature selection. This approach resolves the challenge of rapidly constructing adaptive models in data-scarce target wind and solar power sites while significantly improving prediction accuracy. The remaining structure of this paper is organized as follows. In Section 2, the overall framework of the proposed model is introduced. In Section 3, the selection method for sensitive meteorological feature factors and feature extraction by TCN-ATT-LSTM pretrained network are demonstrated. Case studies are given in Section 4, and the conclusions are presented in Section 5.
2. Overall Framework of the Model
The proposed method is divided into three main stages, as illustrated in Figure 1.
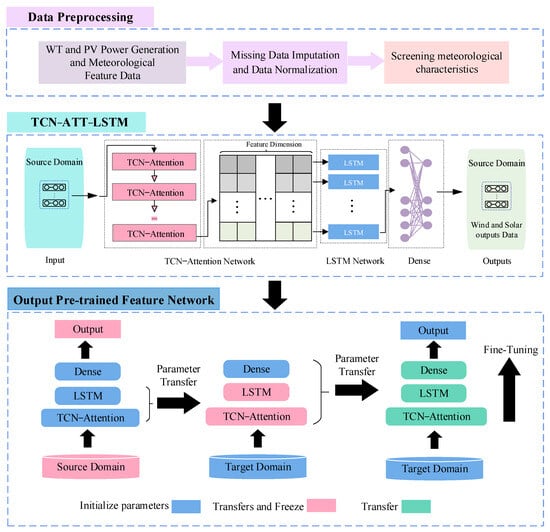
Figure 1.
Framework of the transfer learning modeling process.
Stage 1 involves the selection of sensitive meteorological features from the source domain NWP data. The correlation between meteorological features and wind–solar power output is calculated using the Pearson correlation coefficient, Spearman correlation coefficient, and mutual information theory. The evidence-based optimization theory is then applied to select meteorological features with a cumulative contribution rate of over 85%.
Stage 2 is the extraction of power generation features. In this stage, the preprocessed NWP data from the source domain serves as input for the TCN-ATT-LSTM model, with historical power data serving as the output. Initially, the attention-based TCN model is employed to extract deep, significant temporal feature vectors from the NWP data for wind and solar power forecasting. Subsequently, the output vectors are transformed into time series inputs for the LSTM network, capturing both short- and long-term dependencies in the time series data. Finally, the standard deviation (SD) of the training error is introduced as an optimization objective for the prediction system.
Stage 3 involves network knowledge transfer, which is the core of the algorithm. The pre-trained weights and bias parameters of the TCN-ATT-LSTM model from the source domain are preserved, and the shallow network parameters of the target domain model are frozen to match those of the source domain, without further training. The target domain TCN-ATT-LSTM model is then re-trained with target domain data, allowing fine-tuning of the unfrozen layers’ weights. After training is complete, all network layers are unfrozen, and the model undergoes a final round of fine-tuning using a very low learning rate.
3. Features Selection and TCN-ATT-LSTM Transfer Learning
3.1. Selection Method for Sensitive Meteorological Features
In this study, Pearson’s correlation coefficient, mutual information entropy, and Spearman’s rank correlation coefficient are employed as indicators for selecting sensitive meteorological feature factors [19]. The respective formulas for these indices are shown in Equations (1)–(3):
where represents the Pearson correlation coefficient. A value closer to 1 indicates a stronger positive correlation between the two datasets, while a value nearer to −1 signifies a stronger negative correlation. S denotes the meteorological feature sequence, while X represents the wind and solar power output sequence. n is the dimension of the corresponding sequence, and and are the mean values of the two sequences, respectively.
H represents information entropy. Mutual information entropy reflects the degree of association between two variables. The smaller the association, the lower the mutual information entropy. When two variables are completely independent, the mutual information entropy is minimized (equal to zero).
represents the value level of the i-th dimension in the meteorological feature sequence, and represents the value level of the i-th dimension in the wind–solar power sequence. represents the mean value level of the meteorological feature sequence, and represents the mean value level of the wind–solar power sequence. The value of ρ ranges from −1 to 1. A higher value indicates a stronger correlation between the parameters.
The three evaluation metrics mentioned above each possess the ability to measure the relationship between NWP data and power output. However, relying on a single metric cannot fully capture the complexity of this relationship. Therefore, this study employs evidence-based optimization theory to combine these metrics, resulting in a final composite confidence score given by Equation (4), as follows:
where represents the trust function, which calculates the correlation between NWP data and power output based on the Pearson correlation coefficient, mutual information entropy, and the Spearman correlation coefficient.
The dual optimization combination is shown in Equation (5), as follows:
On this basis, the optimized combination confidence scores of the meteorological features are ranked in descending order. Then, NWP features with a cumulative contribution rate exceeding 85% are selected [20], thereby achieving the selection of key meteorological features. And its flowchart is shown in Figure 2.
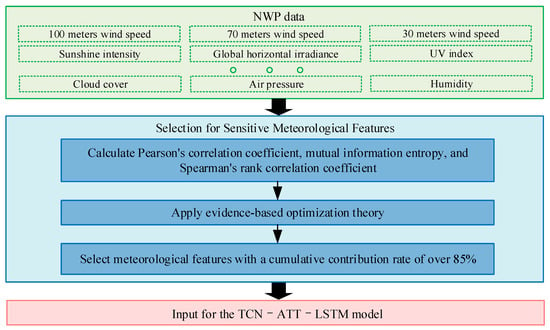
Figure 2.
Flowchart for selecting sensitive meteorological features.
3.2. Feature Extraction TCN-ATT-LSTM Pretrained Network
3.2.1. TCN-ATT-LSTM Network
The output power of wind and photovoltaic clusters is a typical complex time-series structure, characterized by long temporal spans. In predicting the output power at each time step, only the power information from previous time steps should be considered. To address this, this paper introduces the Temporal Convolutional Network (TCN), which integrates dilated causal convolution layers and residual connections [21]. In designing the pre-trained network, the TCN layer is first used to extract the wind and solar output features from the source domain. The structure of the dilated causal convolution in TCN is shown in Figure 3, with the dilated convolution calculated as shown in Equation (6) below:
where x represents the input sequence of meteorological features, u is the position in the dilated convolution, f is the convolution kernel, denotes the convolution operation, d is the dilation factor, and is the size of the convolution kernel.
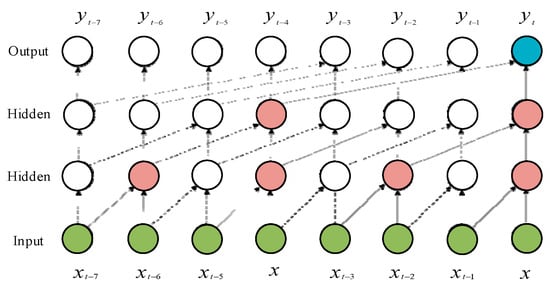
Figure 3.
Dilated causal convolution structure of TCN.
The self-attention mechanism can dynamically learn information between data points to update weights, allowing the model to focus more on important input information and improve predictive performance. To improve the model’s robustness and accelerate convergence, this paper incorporates the attention mechanism into the TCN. The residual unit of the TCN model, enhanced by the attention mechanism, is illustrated in Figure 4.
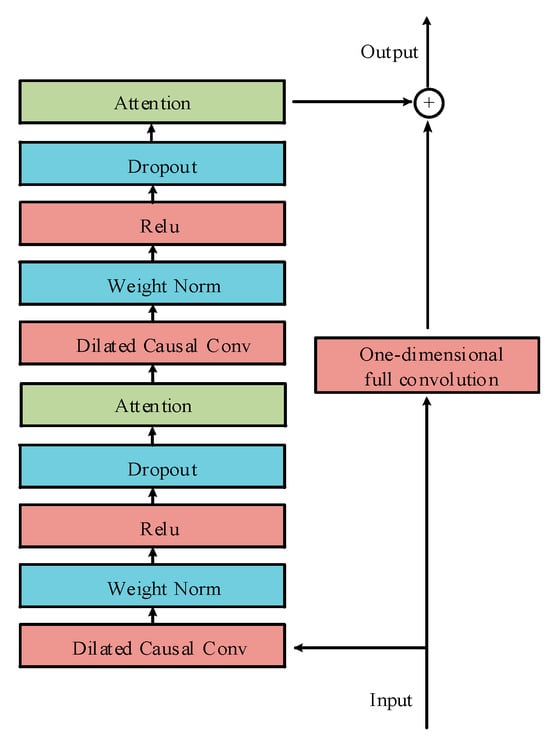
Figure 4.
Structure diagram of TCN with attention mechanism.
The modeling of wind and solar power is a time-series problem, where there is temporal correlation between adjacent time scales. The Long Short-Term Memory (LSTM) neural network can effectively handle long-period time series by preserving historically relevant information that aligns with the sequence characteristics [22]. Therefore, this paper integrates an LSTM layer into the pre-trained network model to capture and predict both short- and long-term dependencies within the time series. The LSTM structure is illustrated in Figure 5.
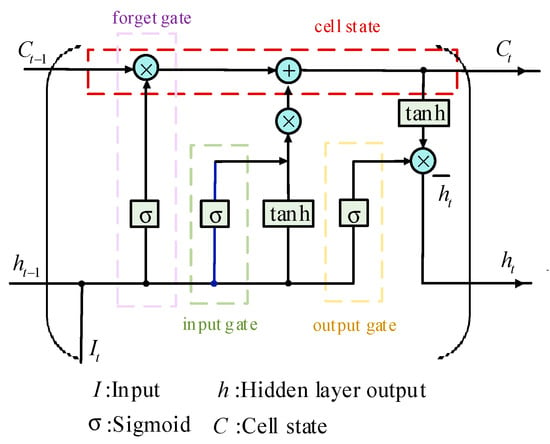
Figure 5.
Structure diagram of LSTM.
3.2.2. Optimization Objective for the Combined Network
To address the randomness in the prediction results of the combined model, the standard deviation of training errors is introduced as the optimization objective for the prediction system. The expression for the optimization objective is shown in Equation (7) below:
where N represents the total number of samples in the prediction dataset, Pi represents the validation data of the dataset, represents the predicted data, and is the mean of the training errors.
3.3. Knowledge Transfer via Network Parameter FT
In this study, to achieve the transfer of common knowledge about power generation patterns, the TCN-ATT-LSTM feature extraction network and the rich meteorological data from the wind and solar power databases in the source domain are used. The structure of the target domain transfer model is kept consistent with that of the source domain model to improve the training efficiency of the transfer model.
The optimization objective function for the network parameters in the target domain includes minimizing the power generation prediction error for wind and solar clusters, as well as minimizing the representation divergence between the source and target domain models. The formula is shown in Equation (8) as follows:
where XT represents the input set in the target domain, is the predicted power generation value in the target domain, is the actual power generation value in the target domain, and represents the network parameters of the target domain model during the l-th training iteration.
Equation (8) serves as an additional objective function for network training, with the goal of preserving as much of the common knowledge as possible. By retraining the dense layer, the network effectively captures the distinctive characteristics of wind and solar power output in the target domain, thereby obtaining the optimal frozen pretrained network parameters. A smaller learning rate is set for the feature extraction layer to minimize changes in the parameters of the TCN–Attention and LSTM layers, ensuring effective fine-tuning of the pretrained network parameters.
4. Case Study and Analysis
The wind–solar data used in this study are derived from the projected wind and solar power output from a planned power station in a region in northwestern China for the year 2030. Specifically, data from a photovoltaic (PV) plant (Plant A) and a wind farm (Plant B) located in a desert area are used as examples. Given the limited availability of historical data, the source domain historical dataset consists of actual power generation and meteorological factor data collected over three years. The target domain dataset includes actual power generation and meteorological factor data for the Kubbei (PV) and Hangjin (wind) regions, covering the period from 1 March 2024 to 30 March 2024. The sampling interval is 1 h, and the dataset is split 7:3 for training and testing. The specific TCN-ATT-LSTM hyperparameter settings are shown in Table 1. In this context, the kernel size refers to the dimensions of the convolutional kernel, the stride denotes the step size during the sliding process, and dilation represents the spatial gap between the convolution and the input data [23].

Table 1.
The hyperparameters for the TCN-ATT-LSTM model.
4.1. Results of the Sensitive Meteorological Feature Selection Strategy
Table 2 presents the NWP feature selection results from the source domain. For wind power meteorological features, wind speed has the largest contribution, while large-scale precipitation has the smallest. For solar power features, sunshine intensity contributes the most, while air pressure contributes the least, indicating that the selection strategy results are reasonable. This is because wind speed has a cubic relationship with wind turbine power generation, while precipitation has minimal impact, only indirectly affecting equipment like turbines or sensors. Solar power generation is determined by sunshine intensity—the stronger the sunlight, the higher the power generation. However, changes in air pressure usually accompany the movement of weather systems, and while low-pressure areas may be associated with more clouds or rain, the direct impact of air pressure on solar power generation is minimal, thus resulting in a lower contribution.

Table 2.
Result of source domain NWP feature filtering.
In addition, meteorological features contributing over 85% to wind and solar power generation, as shown in the tables, were selected as inputs for the subsequent prediction models. The analysis shows that, by selecting key meteorological features, this approach not only reduces the complexity of input features but also ensures the preservation of critical information, thereby reducing the model training time to a certain extent.
4.2. Analysis of TCN-ATT-LSTM Network Transfer Learning Prediction Results
After preprocessing the source domain data, the TCN-ATT-LSTM combined neural network is used for pretraining. The pretrained feature network is then fine-tuned using one month of target domain data, resulting in a transfer learning prediction network adapted to the target domain. Figure 6 illustrates the prediction results for wind and solar power using the transfer learning method. To evaluate the accuracy of the model’s transfer performance, the differences between the predicted wind and solar power curves and the actual power curves in the target domain are calculated using metrics such as Root Mean Square Error (RMSE), Mean Absolute Error (MAE), and the coefficient of determination (R-square, R2). The relevant calculation formulas are shown in Equations (9)–(11), as follows:
where the number of prediction points is denoted by I, actual values of wind and solar power are represented by yi, and the predicted values of WT and PV power are represented by .
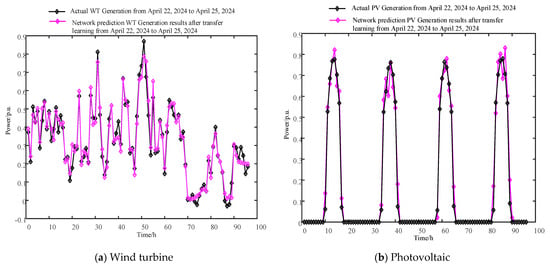
Figure 6.
Wind and solar power prediction results by TCN−ATT−LSTM transfer learning model.
For the wind power test set, the MAE, RMSE, and R2 errors are 0.0811, 0.1114, and 0.8895, respectively. For the solar power test set, the MAE, RMSE, and R2 errors are 0.0184, 0.0379, and 0.9771, respectively. The errors mainly occur during steep rises or drops in the power generation curve. The analysis indicates that the transfer learning model performs well in predictions, not only accurately capturing the overall trend but also achieving high prediction accuracy at most precise time points. Overall, the validation results are satisfactory.
4.3. Comparison of Transfer Learning Method with Other Methods
To highlight the advantages of the transfer learning method and its effectiveness in handling the challenge of limited historical data, it is compared with other traditional prediction methods. The results are shown in Figure 7.
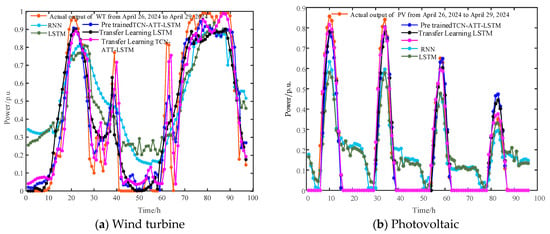
Figure 7.
Comparison of transfer learning method with traditional prediction methods.
From Table 3, the following can be safely concluded:

Table 3.
Comparison of prediction performance of each method.
- (1)
- Under conditions of limited historical data, the prediction performance of traditional deep learning models decreases significantly. Both the RNN and LSTM models show negative R2 values for the wind and solar power test sets, indicating underfitting. In contrast, models using transfer learning exhibit significantly lower errors when generating wind and solar power curves, without signs of underfitting. This demonstrates the effectiveness of the transfer learning approach.
- (2)
- Compared to the pre-trained method, the proposed model reduces the MAE of wind and solar power curves by an average of 21.19% and 42.5%, respectively, while reducing RMSE by 24.11% and 37.25%. The R2 values increase by 12.5% and 4.97%. This analysis shows that, while the pre-trained network effectively captures the complex spatiotemporal mapping relationships between meteorological data and renewable energy output characteristics in the source domain, it is still unable to achieve efficient prediction when directly applied to the target domain. Target domain-specific feature data adjustments are required.
- (3)
- Compared to the LSTM model after transfer learning, the proposed method reduces the MAE by an average of 32.81% for wind power and 34.75% for solar power, while RMSE decreases by 31.45% and 28.89%. The R2 values increase by 16.47% and 25.82%. This analysis indicates that the LSTM method cannot fully extract and process all the features from the source domain. However, by incorporating the TCN-ATT module, the model’s prediction performance is significantly enhanced.
5. Conclusions
The study proposes a wind and solar power prediction method based on the selection of sensitive meteorological features and TCN-ATT-LSTM transfer learning. By using evidence-based optimization theory, the model effectively refines the selection discrepancies from various evaluation metrics. Through knowledge transfer, source domain power generation features are adapted to target domain tasks, enabling accurate wind and solar power forecasting. Validated using data from the wind and solar power station planning in northwestern China, the main conclusions are as follows:
- The model improves transfer learning efficiency by performing NWP feature selection prior to transfer, selecting meteorological features with a cumulative contribution of over 85% as input, enhancing the efficiency compared to single evaluation methods;
- The TCN-ATT-LSTM model accurately predicts wind and solar power output in both overall trends and most specific time points, effectively addressing the issue of limited historical data for power forecasting. Compared to traditional deep learning models without transfer learning, pre-trained TCN-ATT-LSTM, and transfer learning with LSTM, this method demonstrates superior performance with significantly higher accuracy in real-world cases;
- As new wind and solar power stations collect more operational data, the target domain dataset for transfer learning will expand, enhancing forecasting accuracy. With improved data completeness, the proportion of target domain samples in the training set will increase, gradually transitioning the approach to deep learning methods.
Author Contributions
Conceptualization, Y.W. and J.Y.; methodology, Y.B.; software, Y.G. and X.L.; validation, Y.Y. and W.S.; formal analysis, Y.B.; data curation, Y.G. and W.S.; writing—original draft preparation, J.Y.; writing—review and editing, Y.W. All authors have read and agreed to the published version of the manuscript.
Funding
This research was funded by Inner Mongolia Electric Power (Group) Co., Ltd., with its flagship project, 2024-4-67.
Institutional Review Board Statement
Not applicable.
Informed Consent Statement
Not applicable.
Data Availability Statement
Due to the confidentiality requirements of the State Grid company, the research data cannot be disclosed.
Conflicts of Interest
The author Yuan Yu is employed by the company Inner Mongolia Electric Power (Group) Co., Ltd. The remaining authors declare that the research was conducted in the absence of any commercial or financial relationships that could be construed as a potential conflict of interest.
References
- Lin, W.-H.; Wang, P.; Chao, K.-M.; Lin, H.-C.; Yang, Z.-Y.; Lai, Y.-H. Wind Power Forecasting with Deep Learning Networks: Time-Series Forecasting. Appl. Sci. 2021, 11, 10335. [Google Scholar] [CrossRef]
- Yin, D.; Zhao, L.; Zhai, K.; Zheng, J. Short-Term Wind Power Prediction Based on Feature-Weighted and Combined Models. Appl. Sci. 2024, 14, 7698. [Google Scholar] [CrossRef]
- Xing, F.; Gao, Y.; Kang, L.; Zhang, M.; Qin, C. KAN-Transformer Model for UltraShort-Term Wind Power Prediction Based on EWMA Data Processing. Appl. Sci. 2024, 14, 9630. [Google Scholar] [CrossRef]
- Yang, T.; Yang, Z.; Li, F.; Wang, H. A short-term wind power forecasting method based on multivariate signal decomposition and variable selection. Appl. Energy 2024, 360, 122759. [Google Scholar] [CrossRef]
- Sun, Y.; Li, Z.; Yu, X.; Li, B.; Yang, M. Research on ultra-short-term wind power prediction considering source relevance. IEEE Access 2020, 8, 147703–147710. [Google Scholar] [CrossRef]
- Yang, M.; Dong, H. Short-term wind power interval prediction based on wind speed of numerical weather prediction and monte Carlo method. Autom. Electr. Power Syst. 2021, 45, 79–85. [Google Scholar] [CrossRef]
- Ye, W.; Yang, D.; Tang, C.; Wang, W.; Liu, G. Combined prediction of wind power in extreme weather based on time series adversarial generation networks. IEEE Access 2024, 12, 102660–102669. [Google Scholar] [CrossRef]
- Chang, Y.; Yang, H.; Chen, Y.; Zhou, M.; Yang, H.; Wang, Y. A hybrid model for long-term wind power forecasting utilizing NWP subsequence correction and multi-scale deep learning regression methods. IEEE Trans. Sustain. Energy 2024, 15, 263–275. [Google Scholar] [CrossRef]
- Lu, P.; Ye, L.; Zhao, Y.-G. Review of meta-heuristic algorithms for wind power prediction: Methodologies, applications and challenges. Appl. Energy 2021, 301, 117446. [Google Scholar] [CrossRef]
- Zheng, H.; Wu, Y. A XGBoost Model with Weather Similarity Analysis and Feature Engineering for Short-Term Wind Power Forecasting. Appl. Sci. 2019, 9, 3019. [Google Scholar] [CrossRef]
- Camacho, M.; Maldonado-Correa, J.; Torres-Cabrera, J.; Martín-Martínez, S.; Gómez-Lázaro, E. Short-Medium-Term Solar Irradiance Forecasting with a CEEMDAN-CNN-ATT-LSTM Hybrid Model Using Meteorological Data. Appl. Sci. 2025, 15, 1275. [Google Scholar] [CrossRef]
- Wu, C.; Zhu, G.-P.; Qian, M.-H. Impact of historical data selection on accuracy of ultra-short-term wind power prediction based on prediction information entropy. Power Syst. Technol. 2021, 45, 1767–1772. [Google Scholar] [CrossRef]
- Nuño, E.; Maule, P.; Hahmann, A.; Cutululis, N.; Sørensen, P.; Karagali, I. Simulation of transcontinental wind and solar PV generation time series. Renew. Energy 2018, 118, 425–436. [Google Scholar] [CrossRef]
- Zhao, M.; Zhou, X. Multi-Step short-term wind power prediction model based on CEEMD and improved snake optimization algorithm. IEEE Access 2024, 12, 50755–50778. [Google Scholar] [CrossRef]
- Yang, Z.; Peng, X.; Song, J.; Duan, R.; Jiang, Y.; Liu, S. Short-term wind power prediction based on multi-parameters similarity wind process matching and weighed-voting-based deep learning model selection. IEEE Trans. Power Syst. 2024, 39, 2129–2142. [Google Scholar] [CrossRef]
- Yin, H.; Ou, Z.; Fu, J.; Cai, Y.; Chen, S.; Meng, A. A novel transfer learning approach for wind power prediction based on a serio-parallel deep learning architecture. Energy 2021, 234, 121271. [Google Scholar] [CrossRef]
- Zhang, T.-Y.; Liao, Q.-F.; Tang, F. Wide-area distributed photovoltaic power forecast method based on meteorological resource interpolation and transfer learning. Proc. CSEE 2023, 43, 7929–7940. [Google Scholar]
- Ma, Z.-Y.; Wang, B.; Yang, M. Two-stage transfer learning short-term wind power prediction based on two-dimensional wind speed correction and multiple integration. High Volt. Eng. 2024, 9, 3934–3943. [Google Scholar] [CrossRef]
- Yang, M.; Huang, X. Ultra-short-term prediction of photovoltaic power based on periodic extraction of PV energy and LSH algorithm. IEEE Access 2018, 6, 51200–51205. [Google Scholar] [CrossRef]
- Xu, W.-F.; Liu, P.; Cheng, L. Multistep wind speed prediction by combining a WRF simulation and an error correction strategy. Renew. Energy 2021, 163, 772–782. [Google Scholar] [CrossRef]
- Zhang, Y.; Zhang, L.; Sun, D.; Jin, K.; Gu, Y. Short-Term Wind Power Forecasting Based on VMD and a Hybrid SSA-TCN-BiGRU Network. Appl. Sci. 2023, 13, 9888. [Google Scholar] [CrossRef]
- Liu, Y.; Guan, L.; Hou, C.; Han, H.; Liu, Z.; Sun, Y.; Zheng, M. Wind Power Short-Term Prediction Based on LSTM and Discrete Wavelet Transform. Appl. Sci. 2019, 9, 1108. [Google Scholar] [CrossRef]
- Tang, Y.; Zhang, S.; Zhang, Z. A privacy-preserving framework integrating federated learning and transfer learning for wind power forecasting. Energy 2024, 286, 129639. [Google Scholar] [CrossRef]
Disclaimer/Publisher’s Note: The statements, opinions and data contained in all publications are solely those of the individual author(s) and contributor(s) and not of MDPI and/or the editor(s). MDPI and/or the editor(s) disclaim responsibility for any injury to people or property resulting from any ideas, methods, instructions or products referred to in the content. |
© 2025 by the authors. Licensee MDPI, Basel, Switzerland. This article is an open access article distributed under the terms and conditions of the Creative Commons Attribution (CC BY) license (https://creativecommons.org/licenses/by/4.0/).