
Distribution of Operating Costs Along the Value Chain of an Open-Pit Copper Mine

 , ,
, ,  and
and
Abstract
1. Introduction
2. Materials and Methods
2.1. The Open-Pit Mine
2.2. Research Methodology
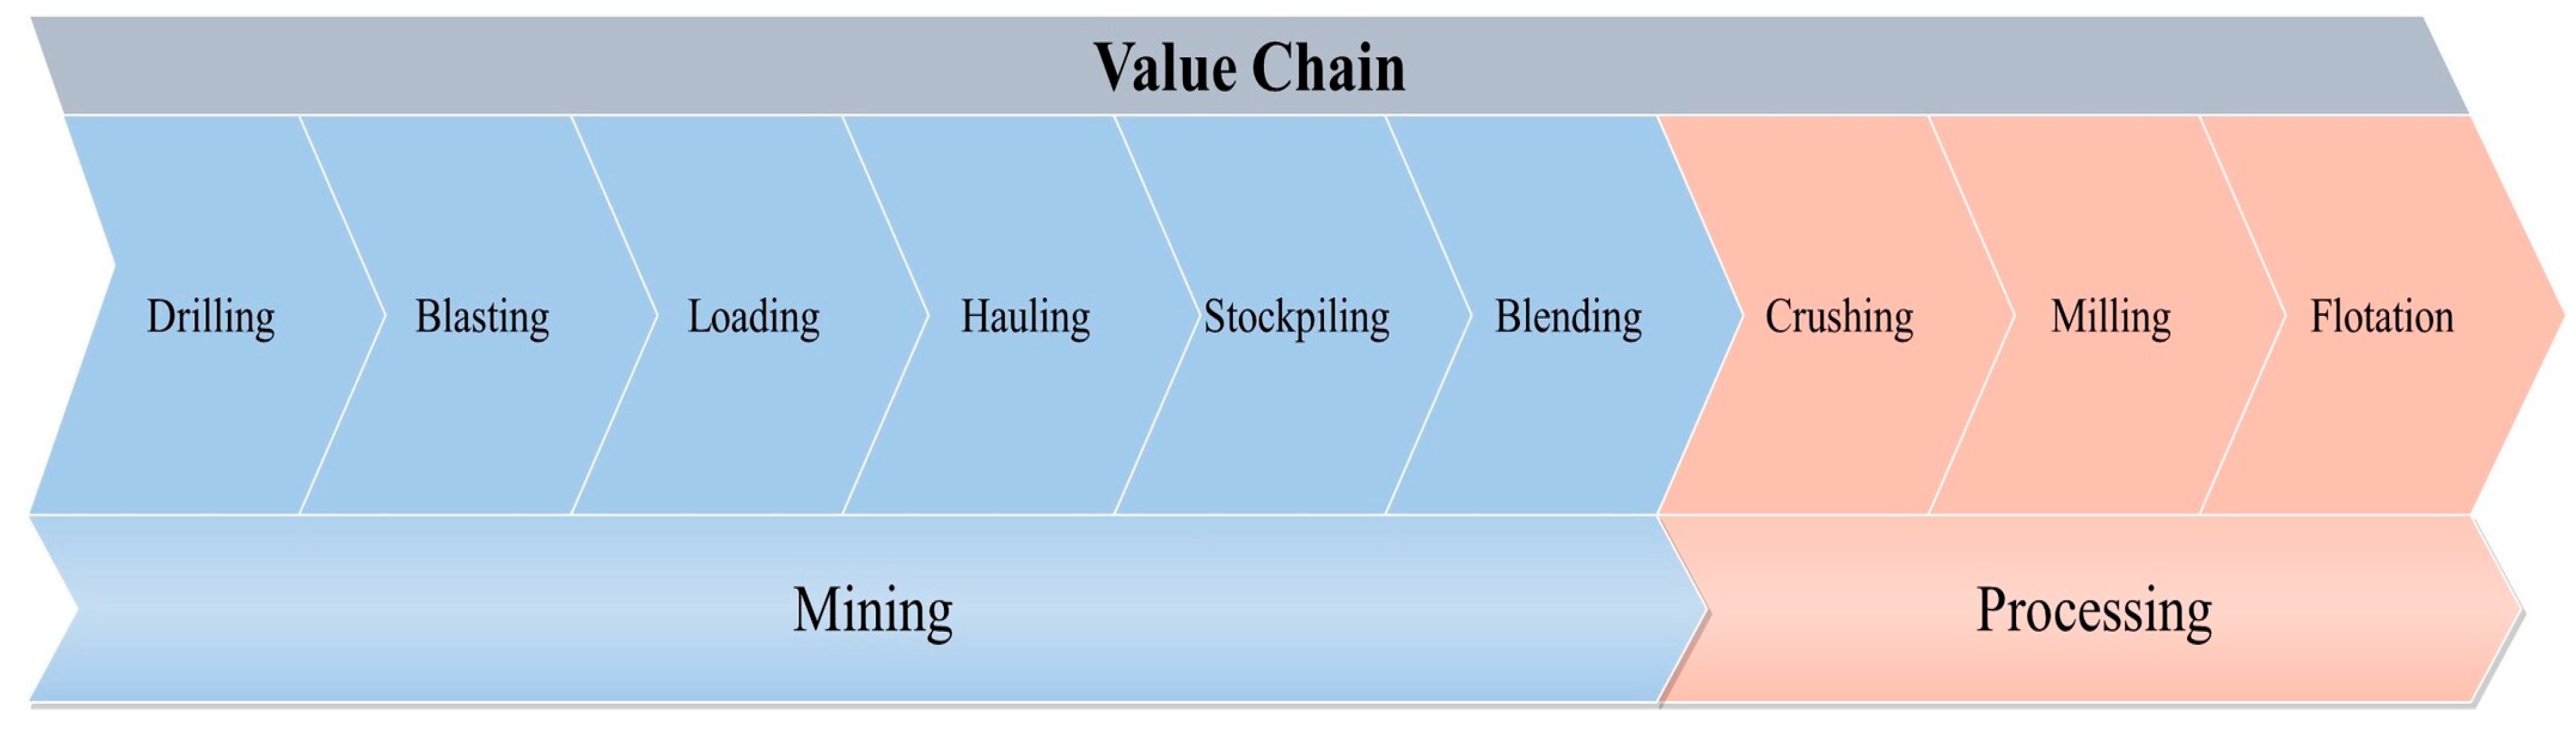
- In the context of this study, the mine value chain was first segmented into mining and processing. Mining operations or units included drilling, blasting, loading, hauling, stockpiling, and blending. Processing operations, on the other hand, encompassed comminution and flotation. Each operation represented a distinct phase of the value chain, with costs being tracked individually for each unit. Figure 1 provides an overview of the different units across the value chain as defined in this study;
- Costs were then accumulated for each unit over one year. Cost accumulation included equipment depreciation, labor expenses, fuel and energy consumption, maintenance and repair costs, consumables such as explosives, flotation reagents, wear parts and other chemicals, and contingency funds (10%) for unexpected expenses. This step ensured that all relevant costs were comprehensively captured for each operational unit, providing a clear view of their individual contribution to the financial performance of the value chain;
- Once the costs were accumulated, the average operating cost per unit was calculated by dividing the total accumulated costs by the metric tons extracted or processed over a one-year period;
- In the final step, the average operating costs per unit in the entire mine value chain were summed up to determine the total operating cost. This provided insights into the overall cost structure for mining and processing a metric ton of material. By aggregating costs across all units, from extraction to final processing, the holistic assessment of total operating expenses could highlight areas for potential cost reduction.
2.3. Data Presentation
2.4. Estimation of Operating Costs
2.4.1. Drilling
2.4.2. Blasting
2.4.3. Loading
2.4.4. Hauling
2.4.5. Stockpiling
2.4.6. Blending
2.4.7. Comminution
2.4.8. Flotation
3. Results
3.1. Distribution of Operating Cost Components
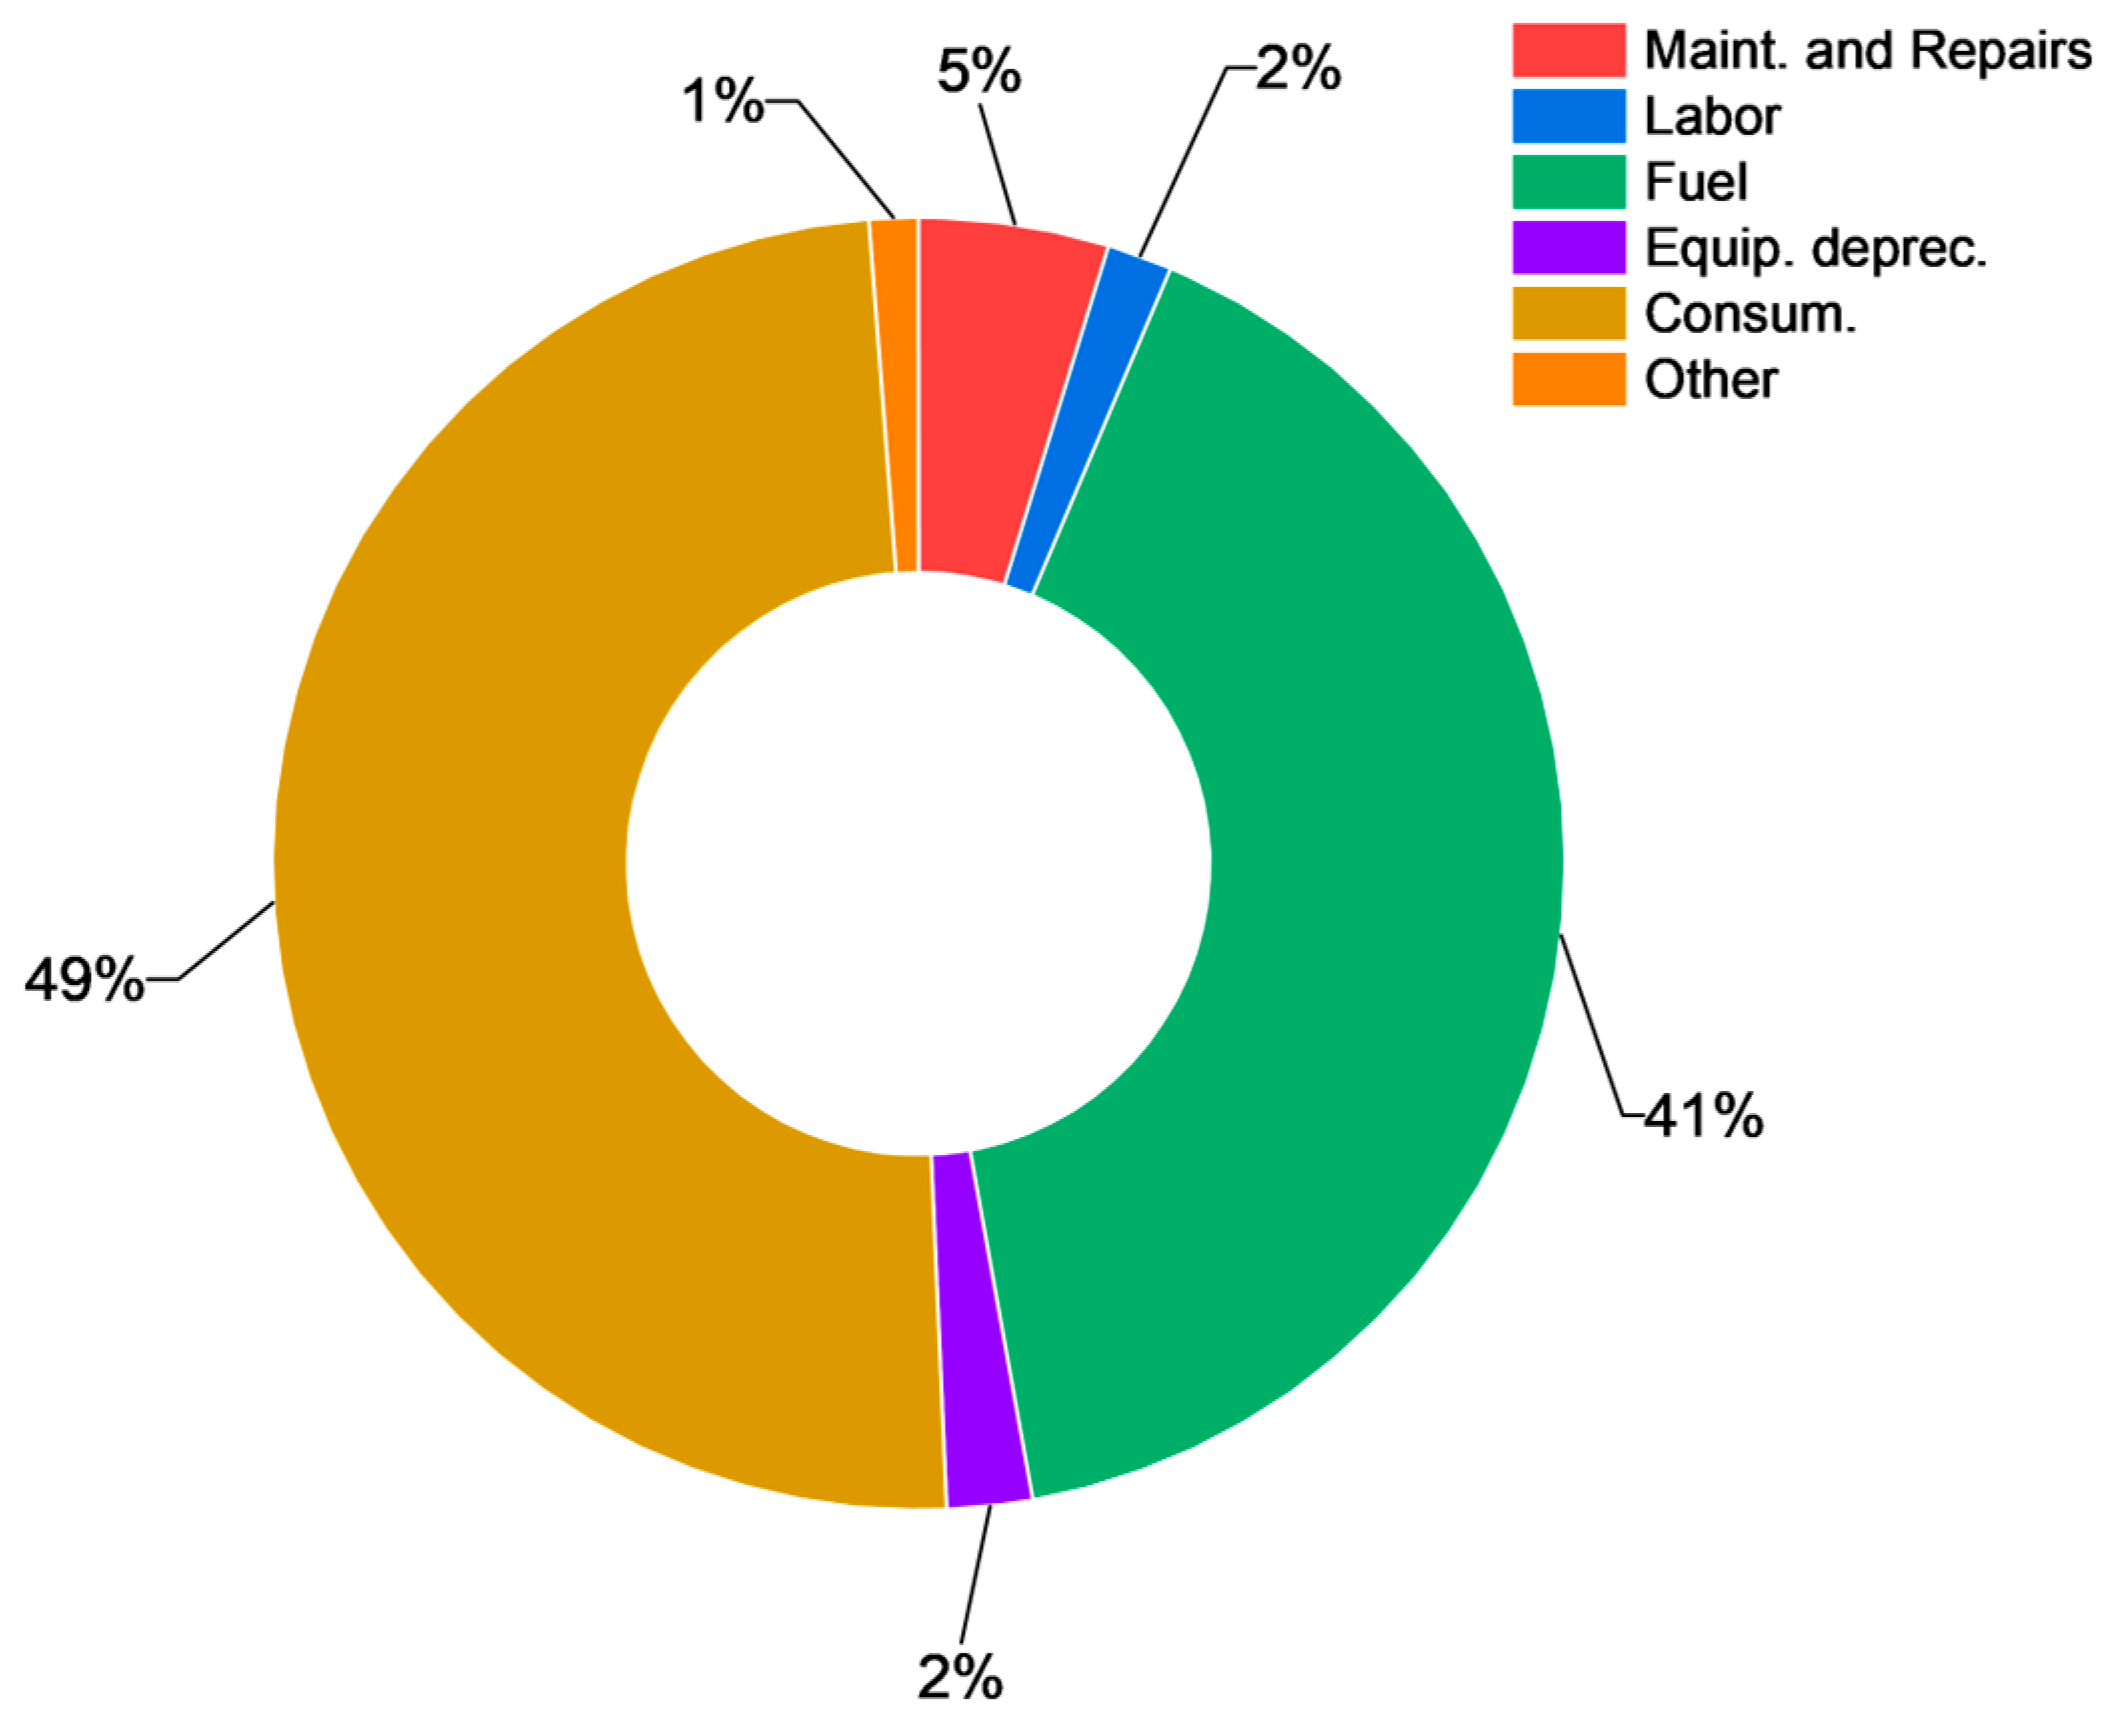
3.1.1. Drilling
3.1.2. Blasting
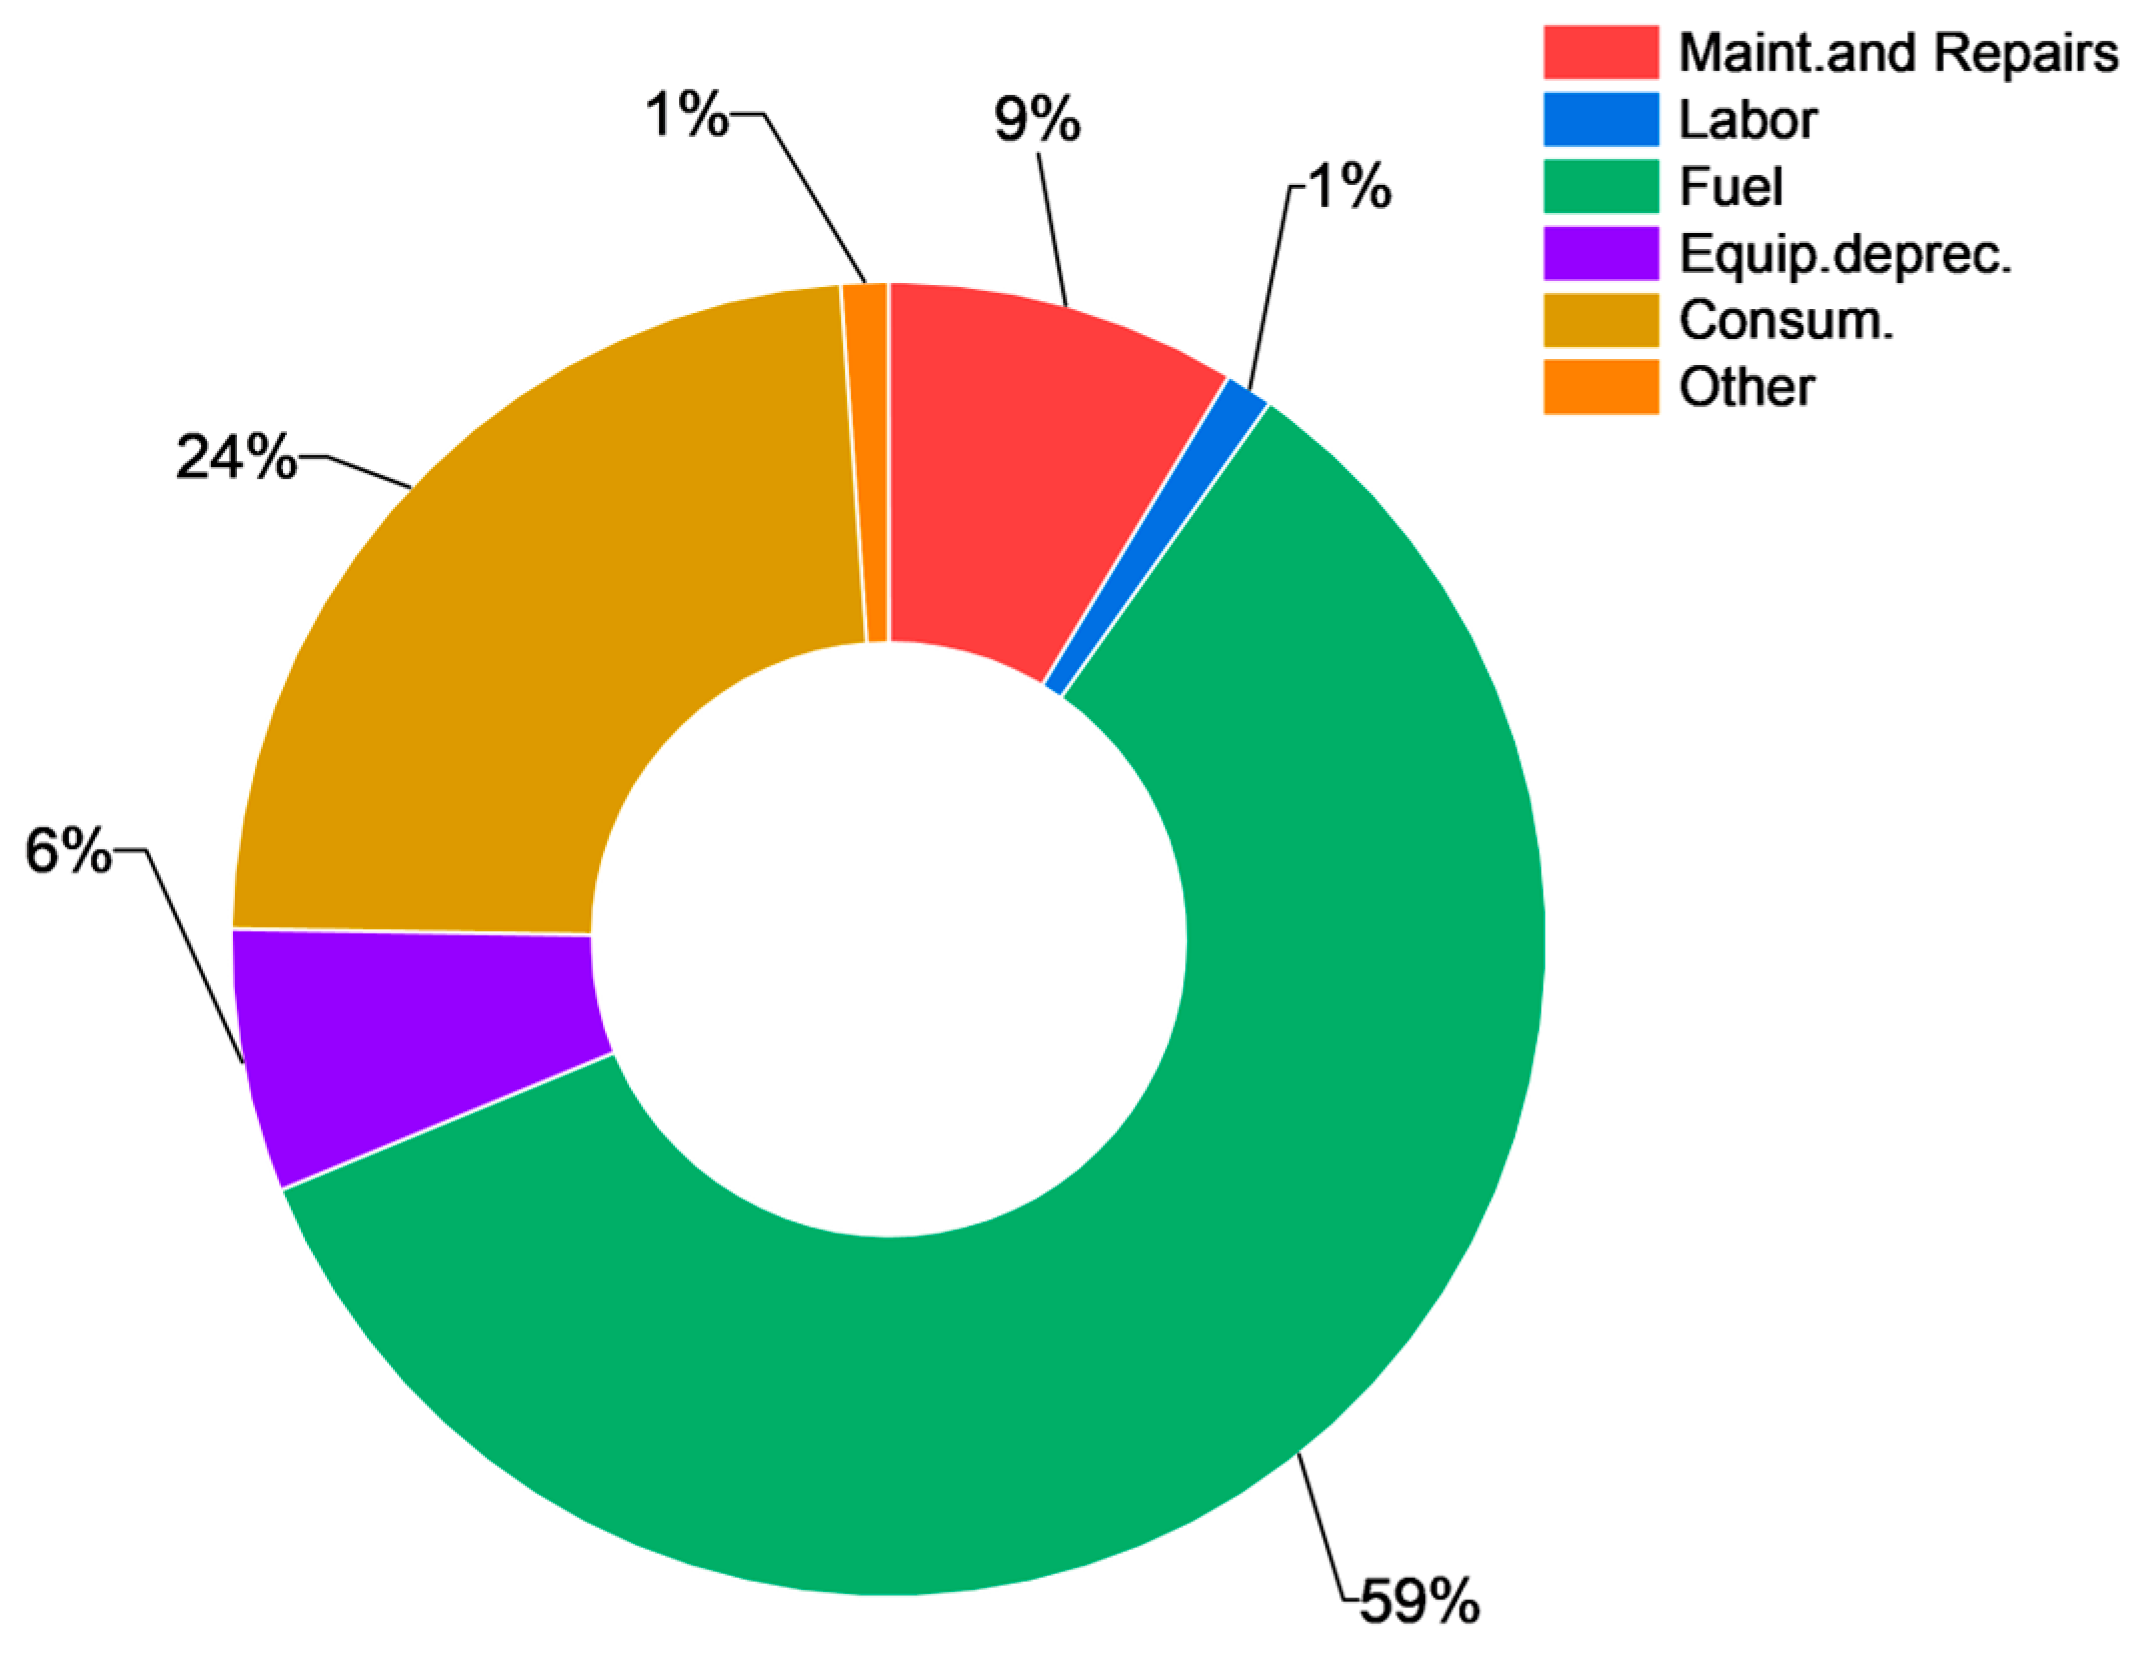
3.1.3. Loading
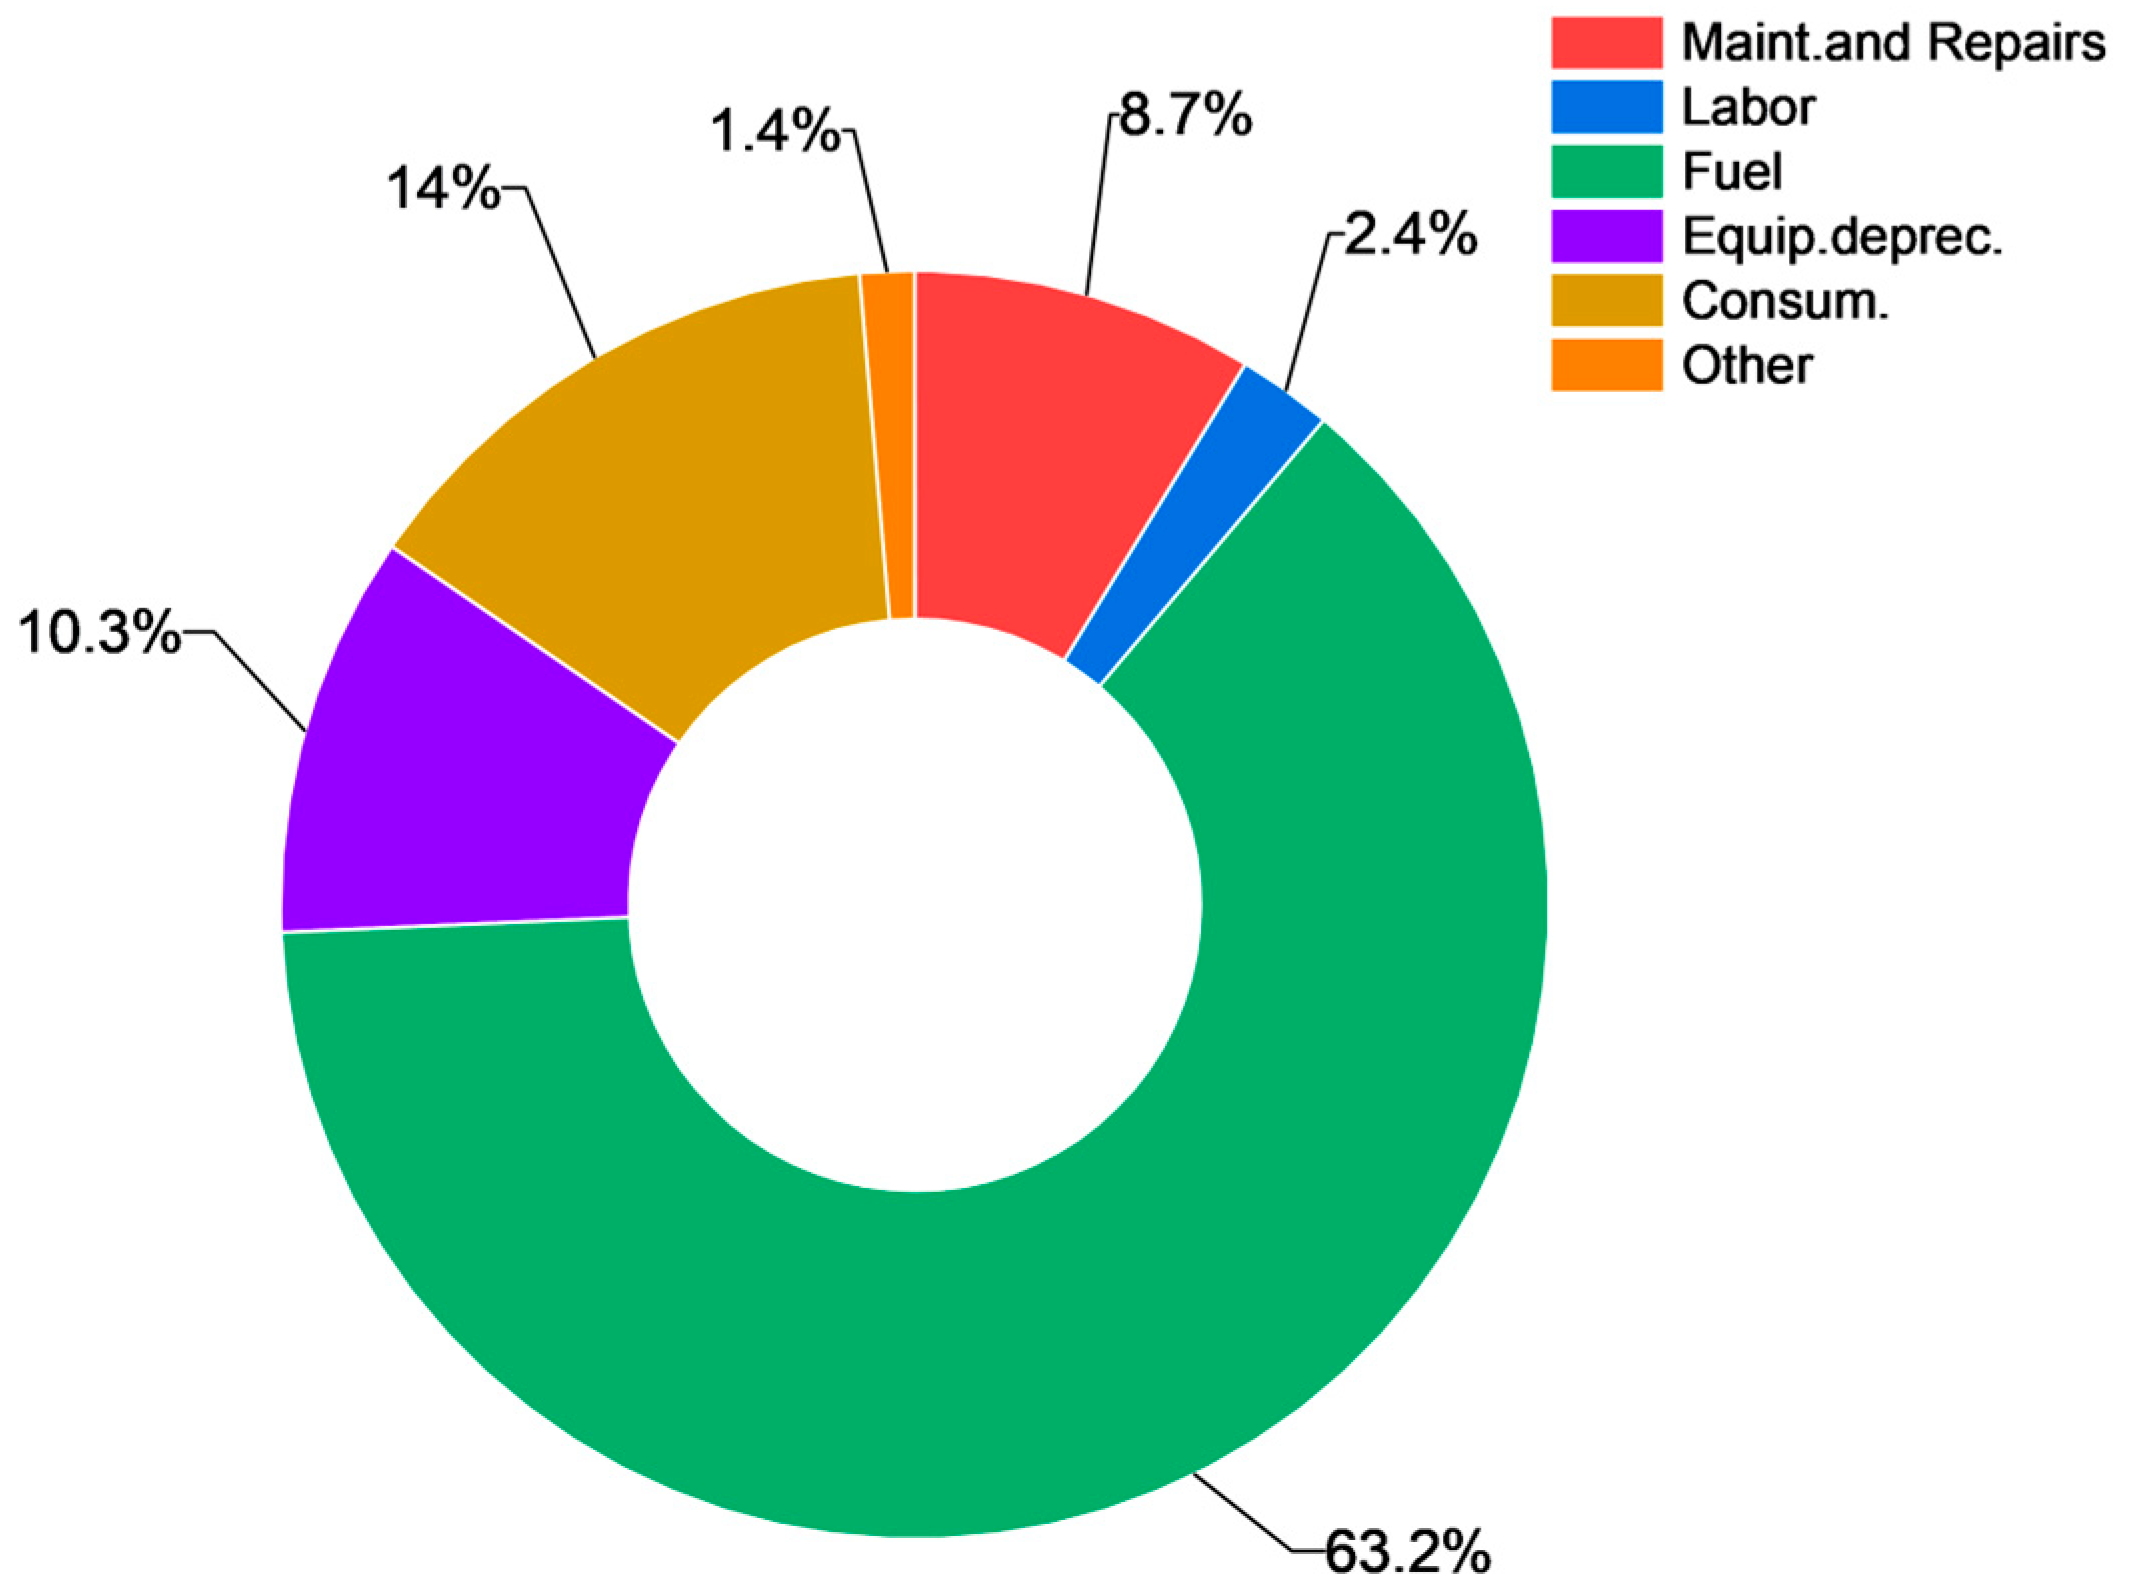
3.1.4. Hauling
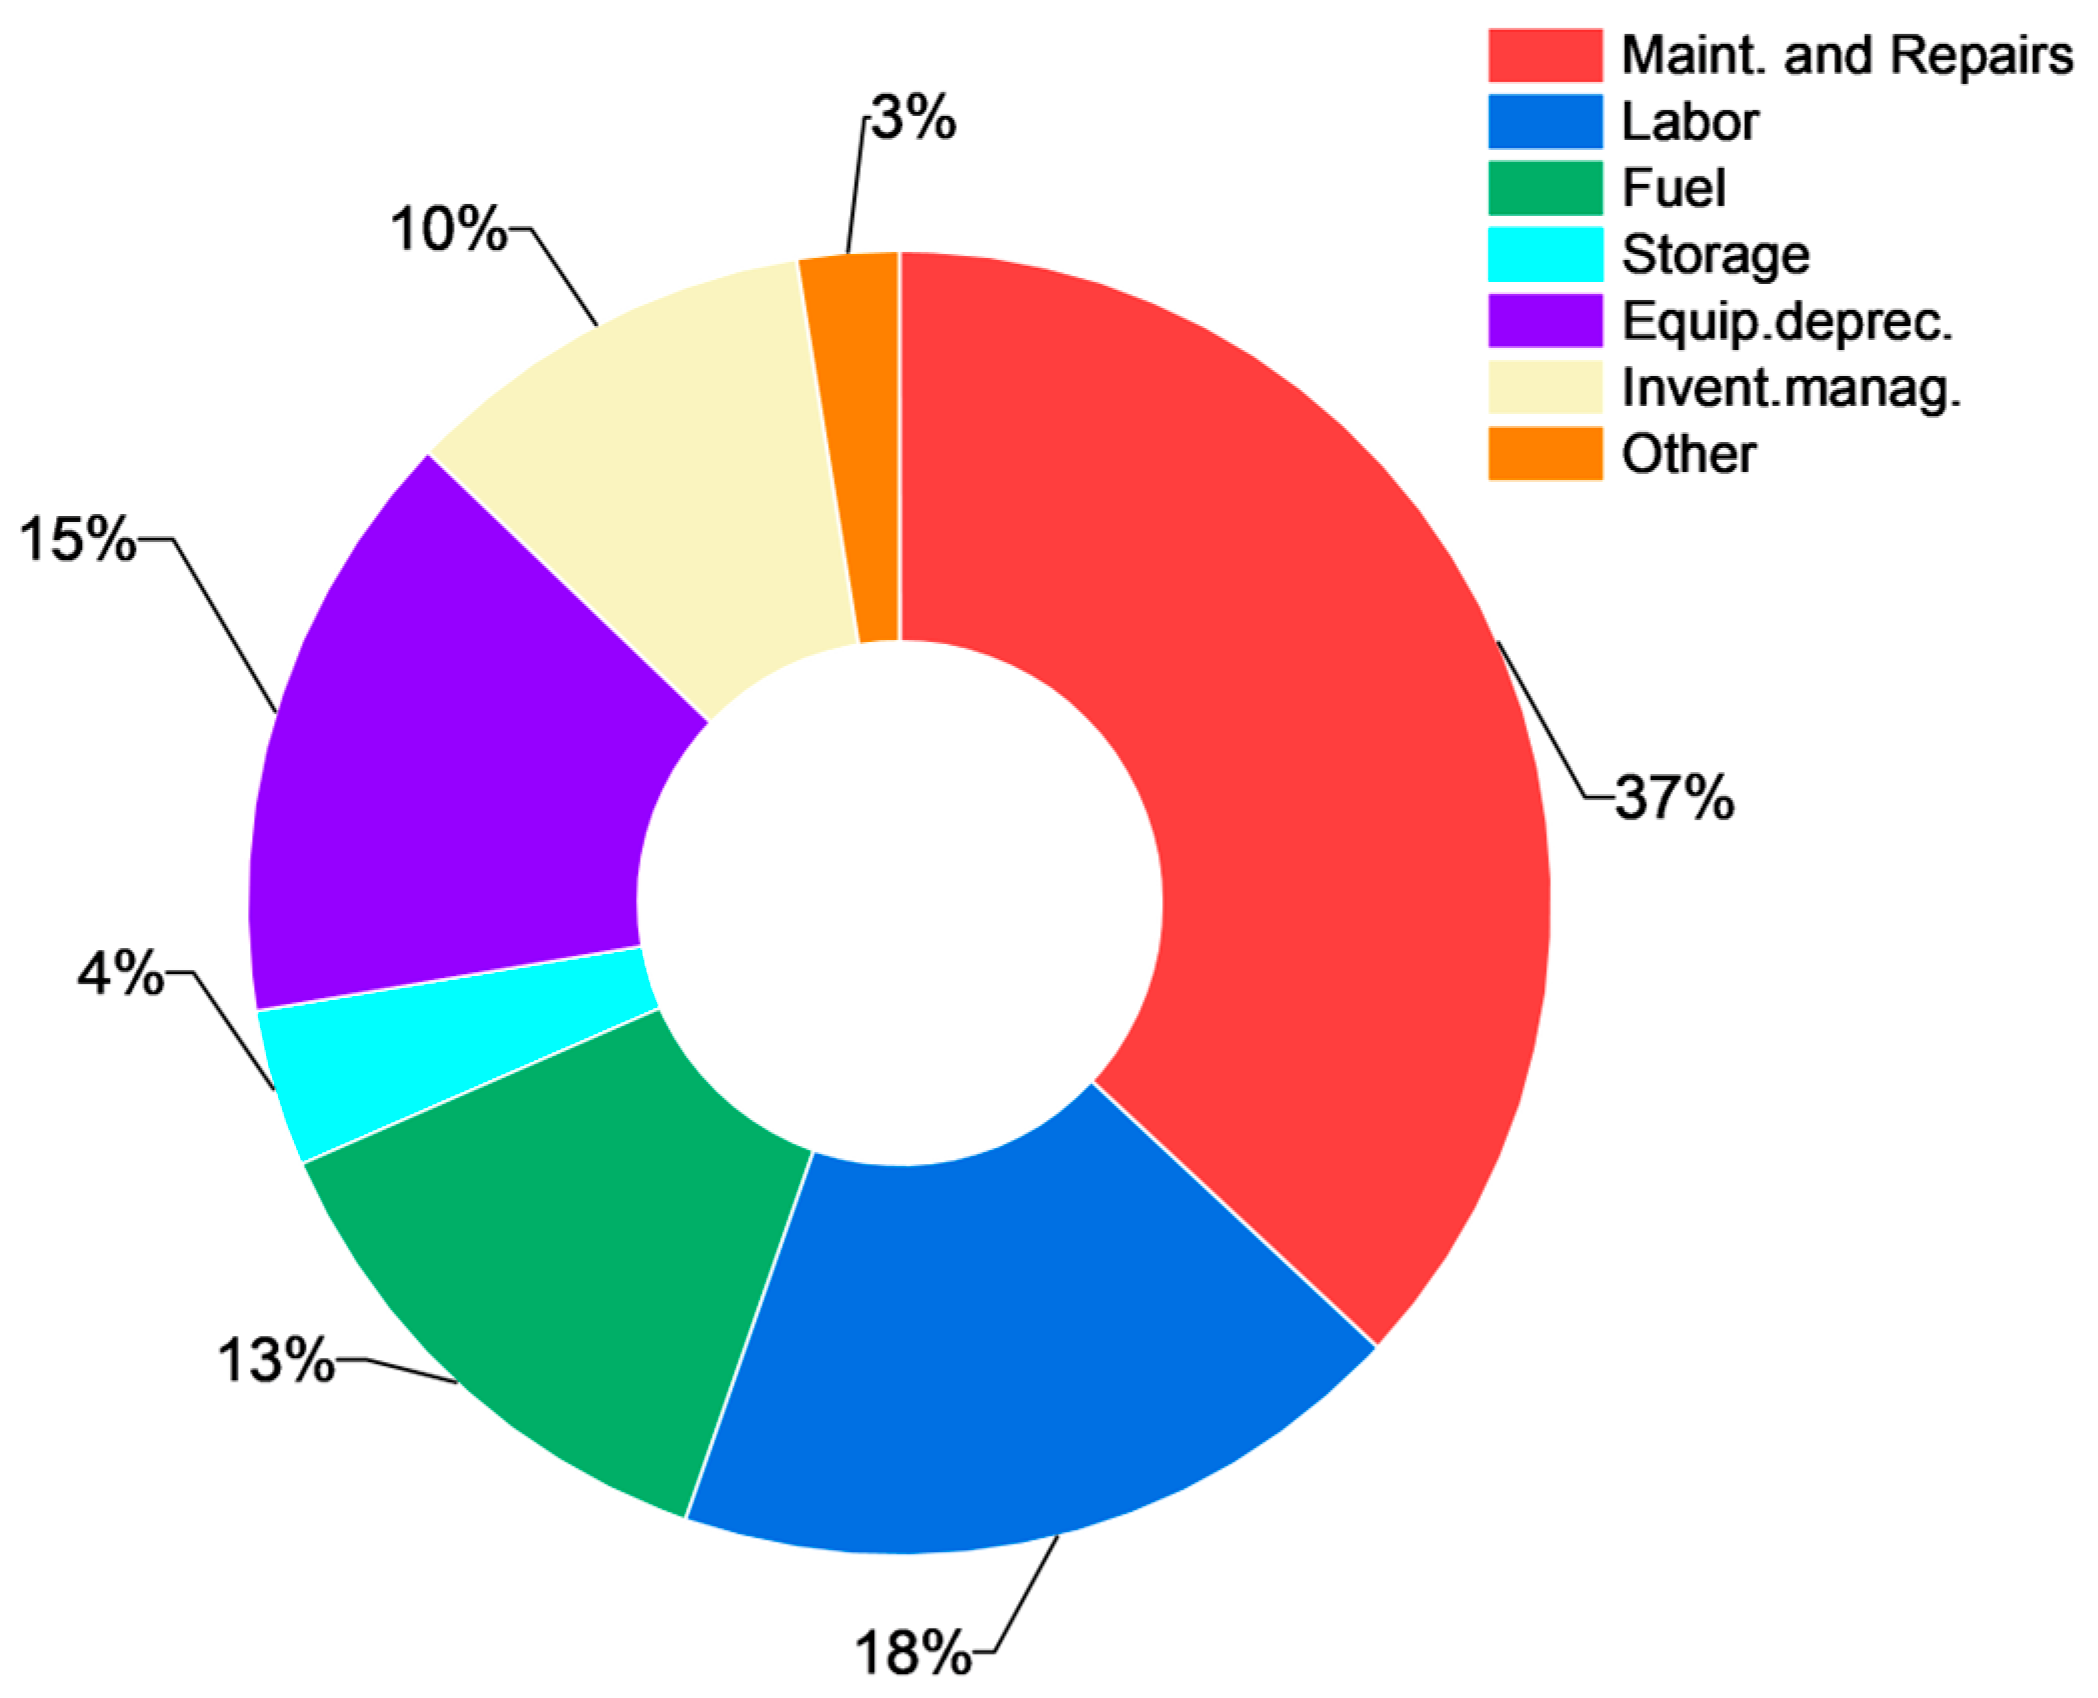
3.1.5. Stockpiling
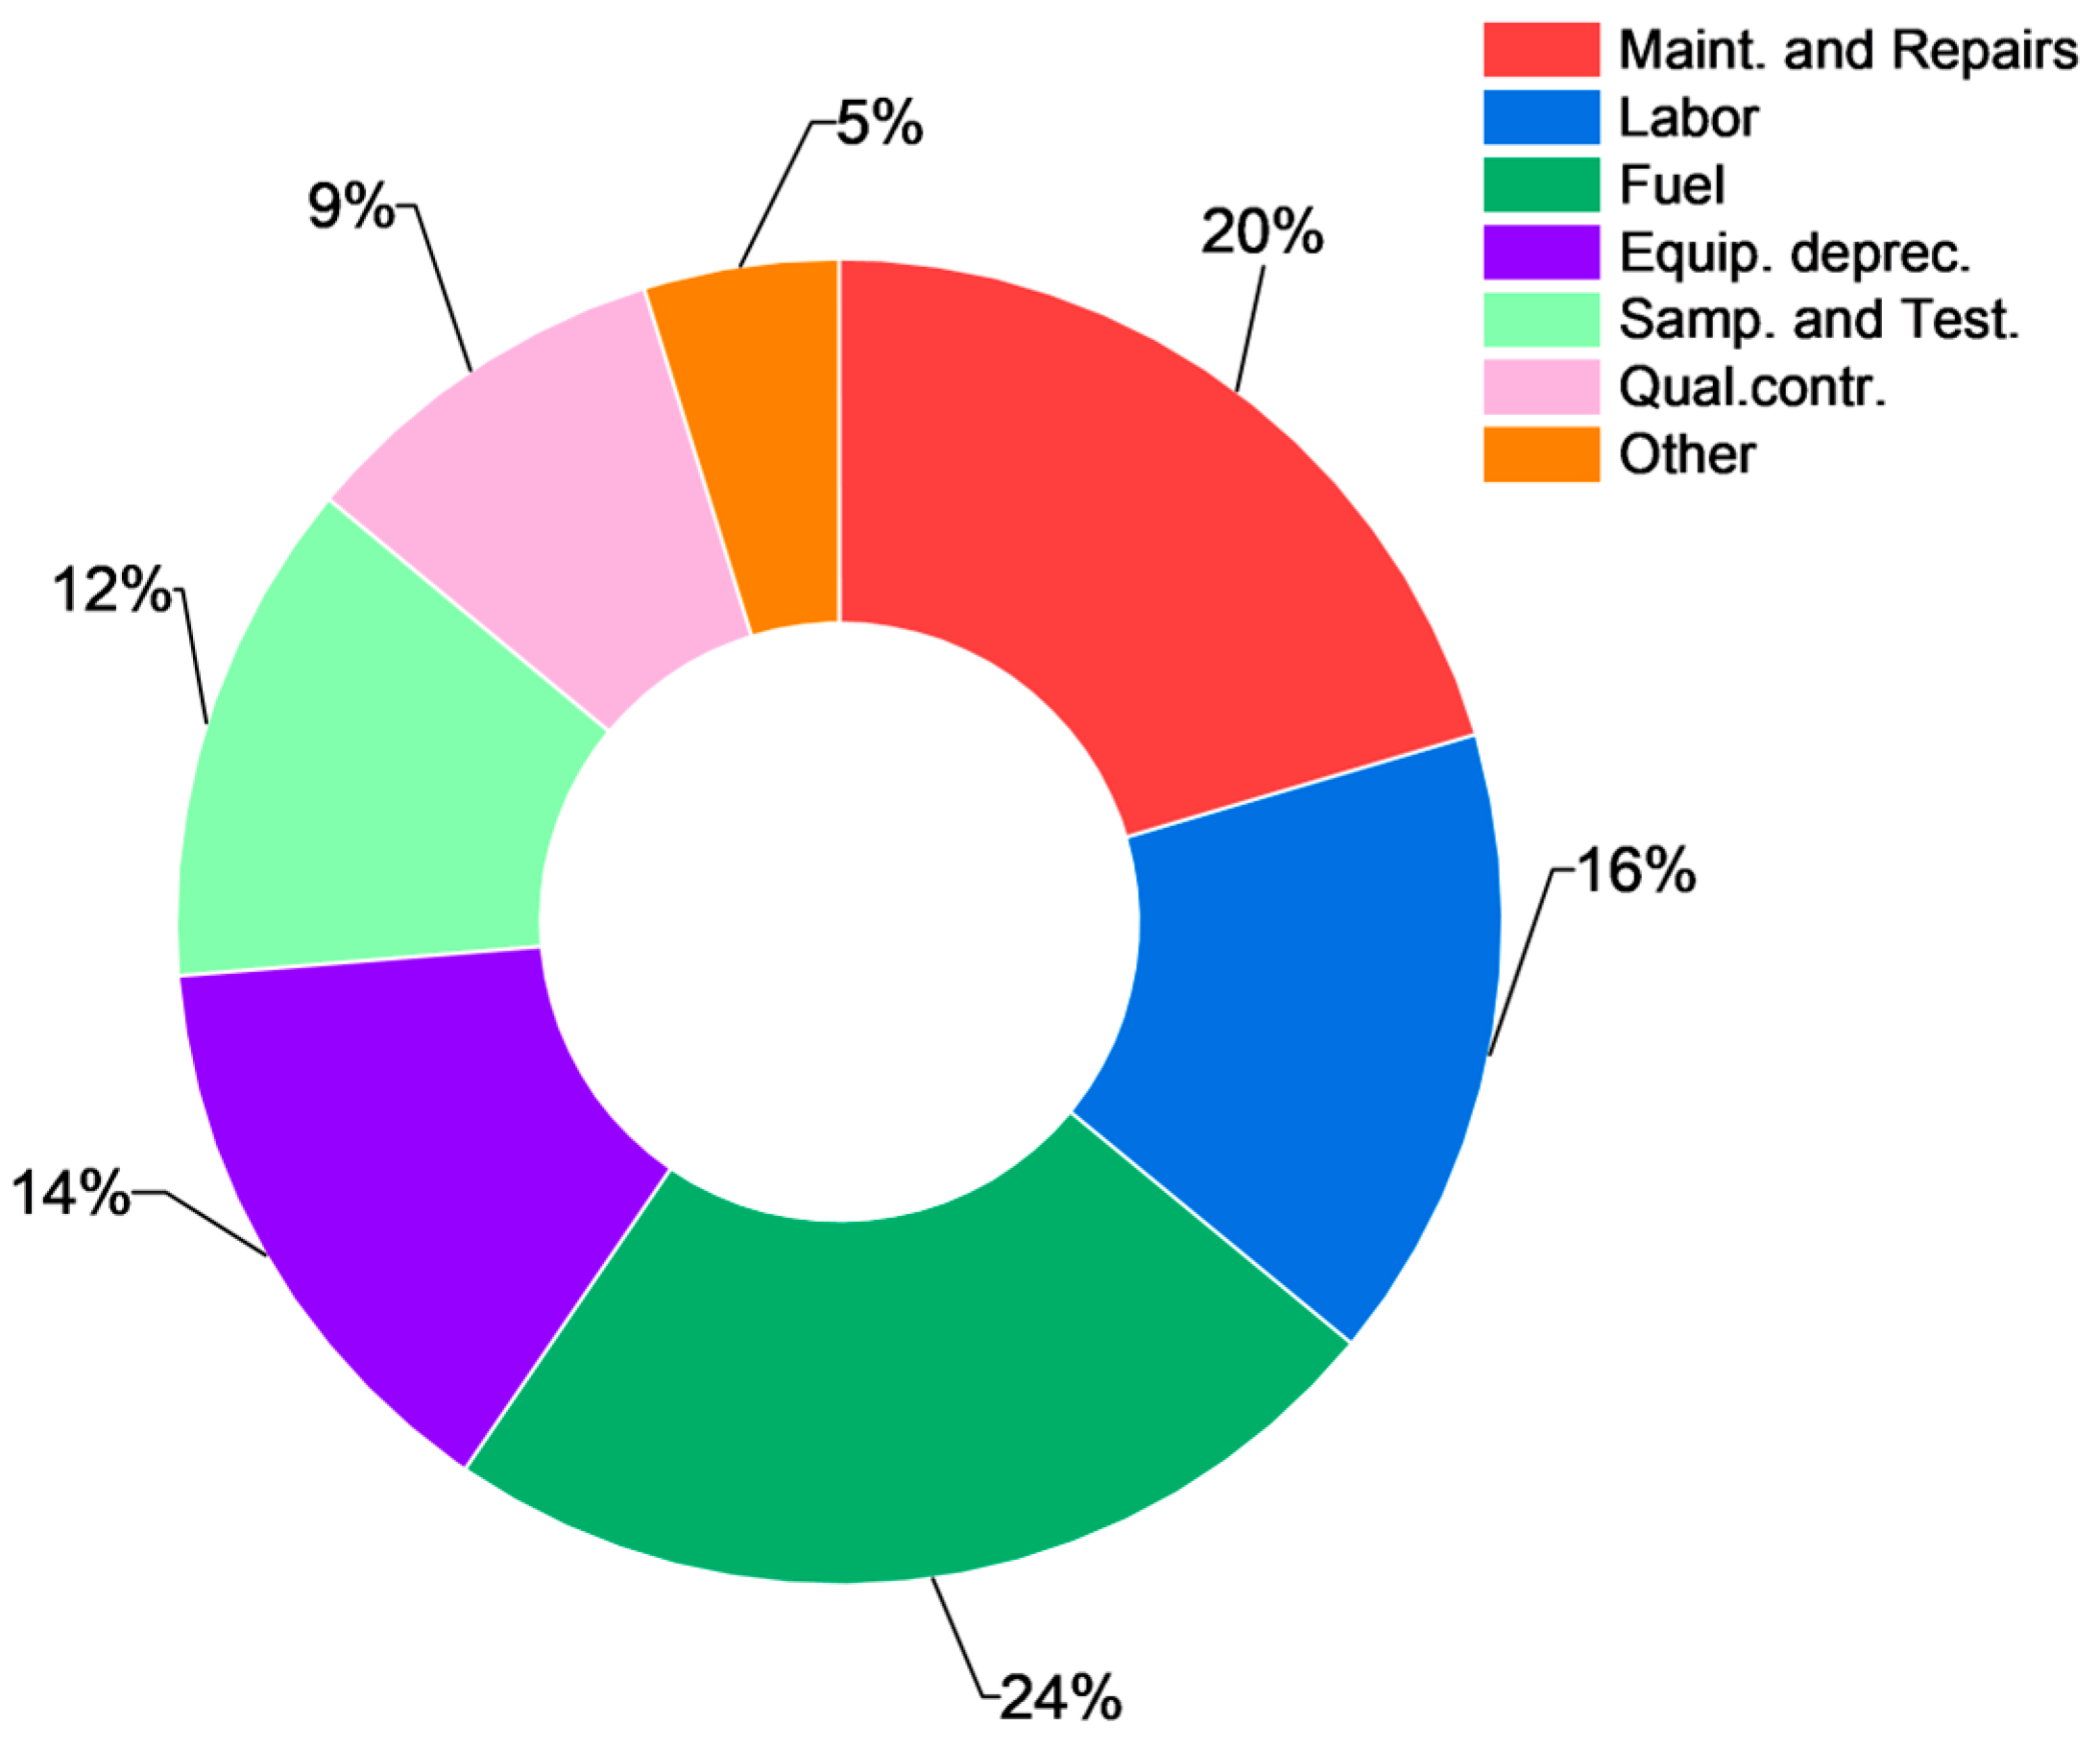
3.1.6. Blending
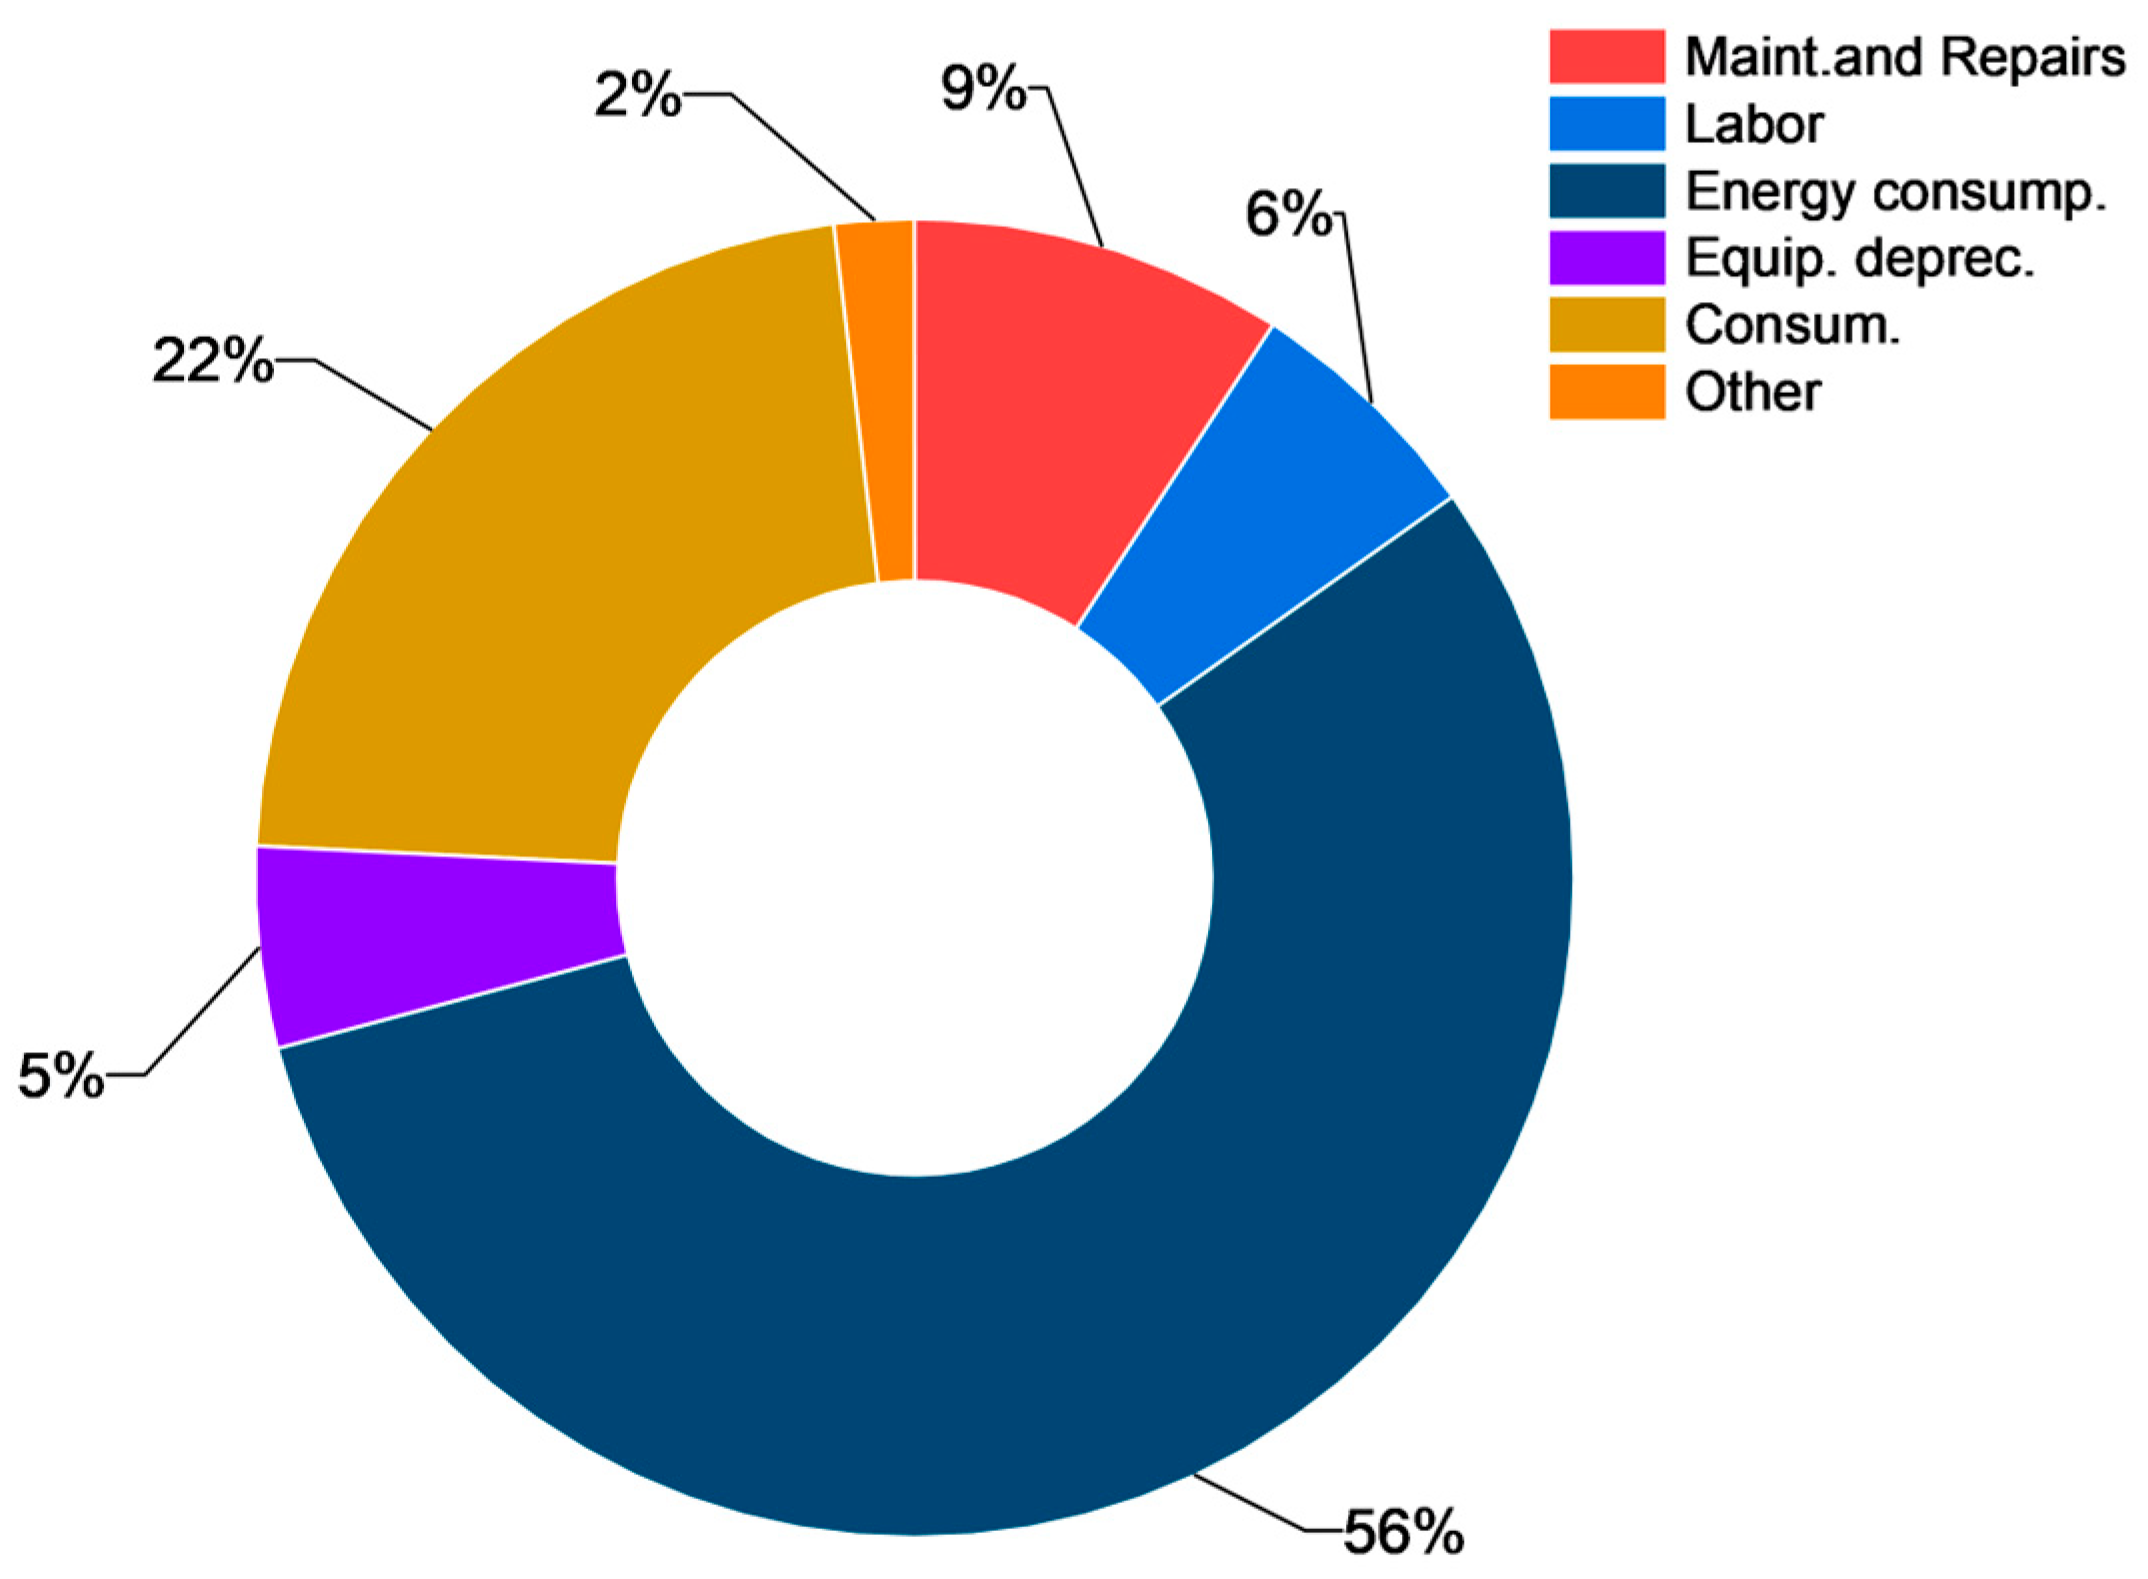
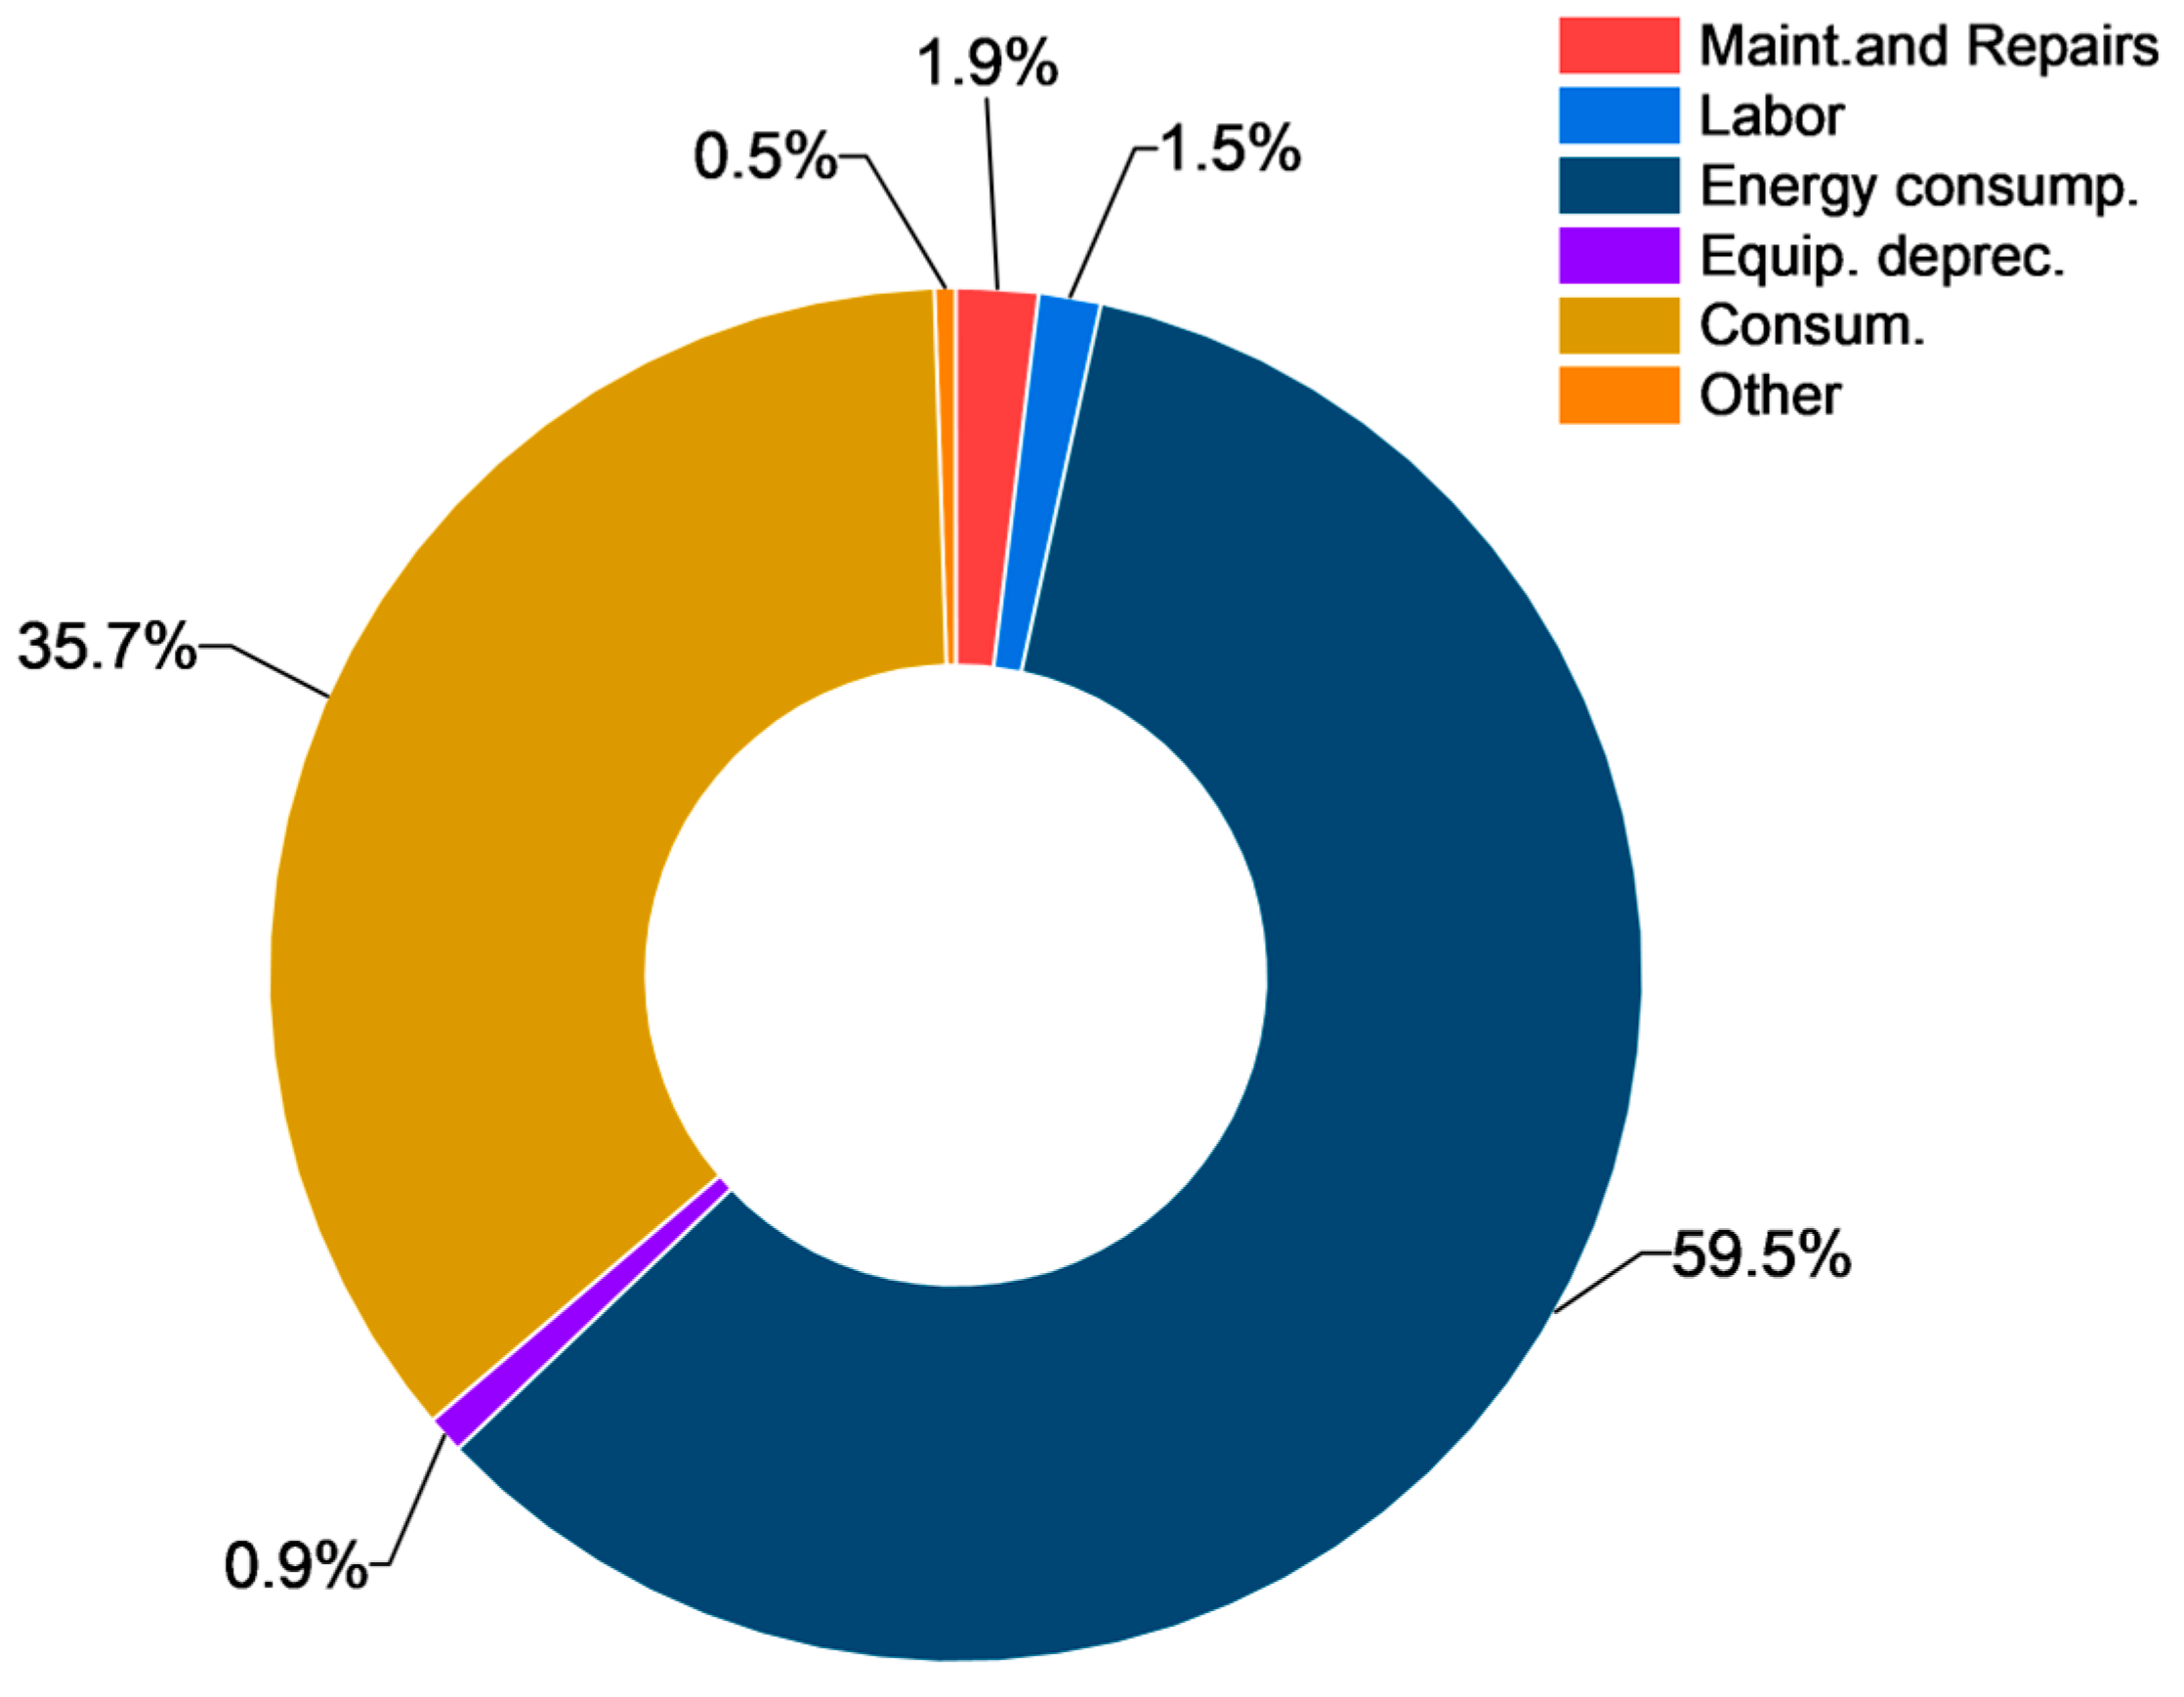
3.1.7. Comminution
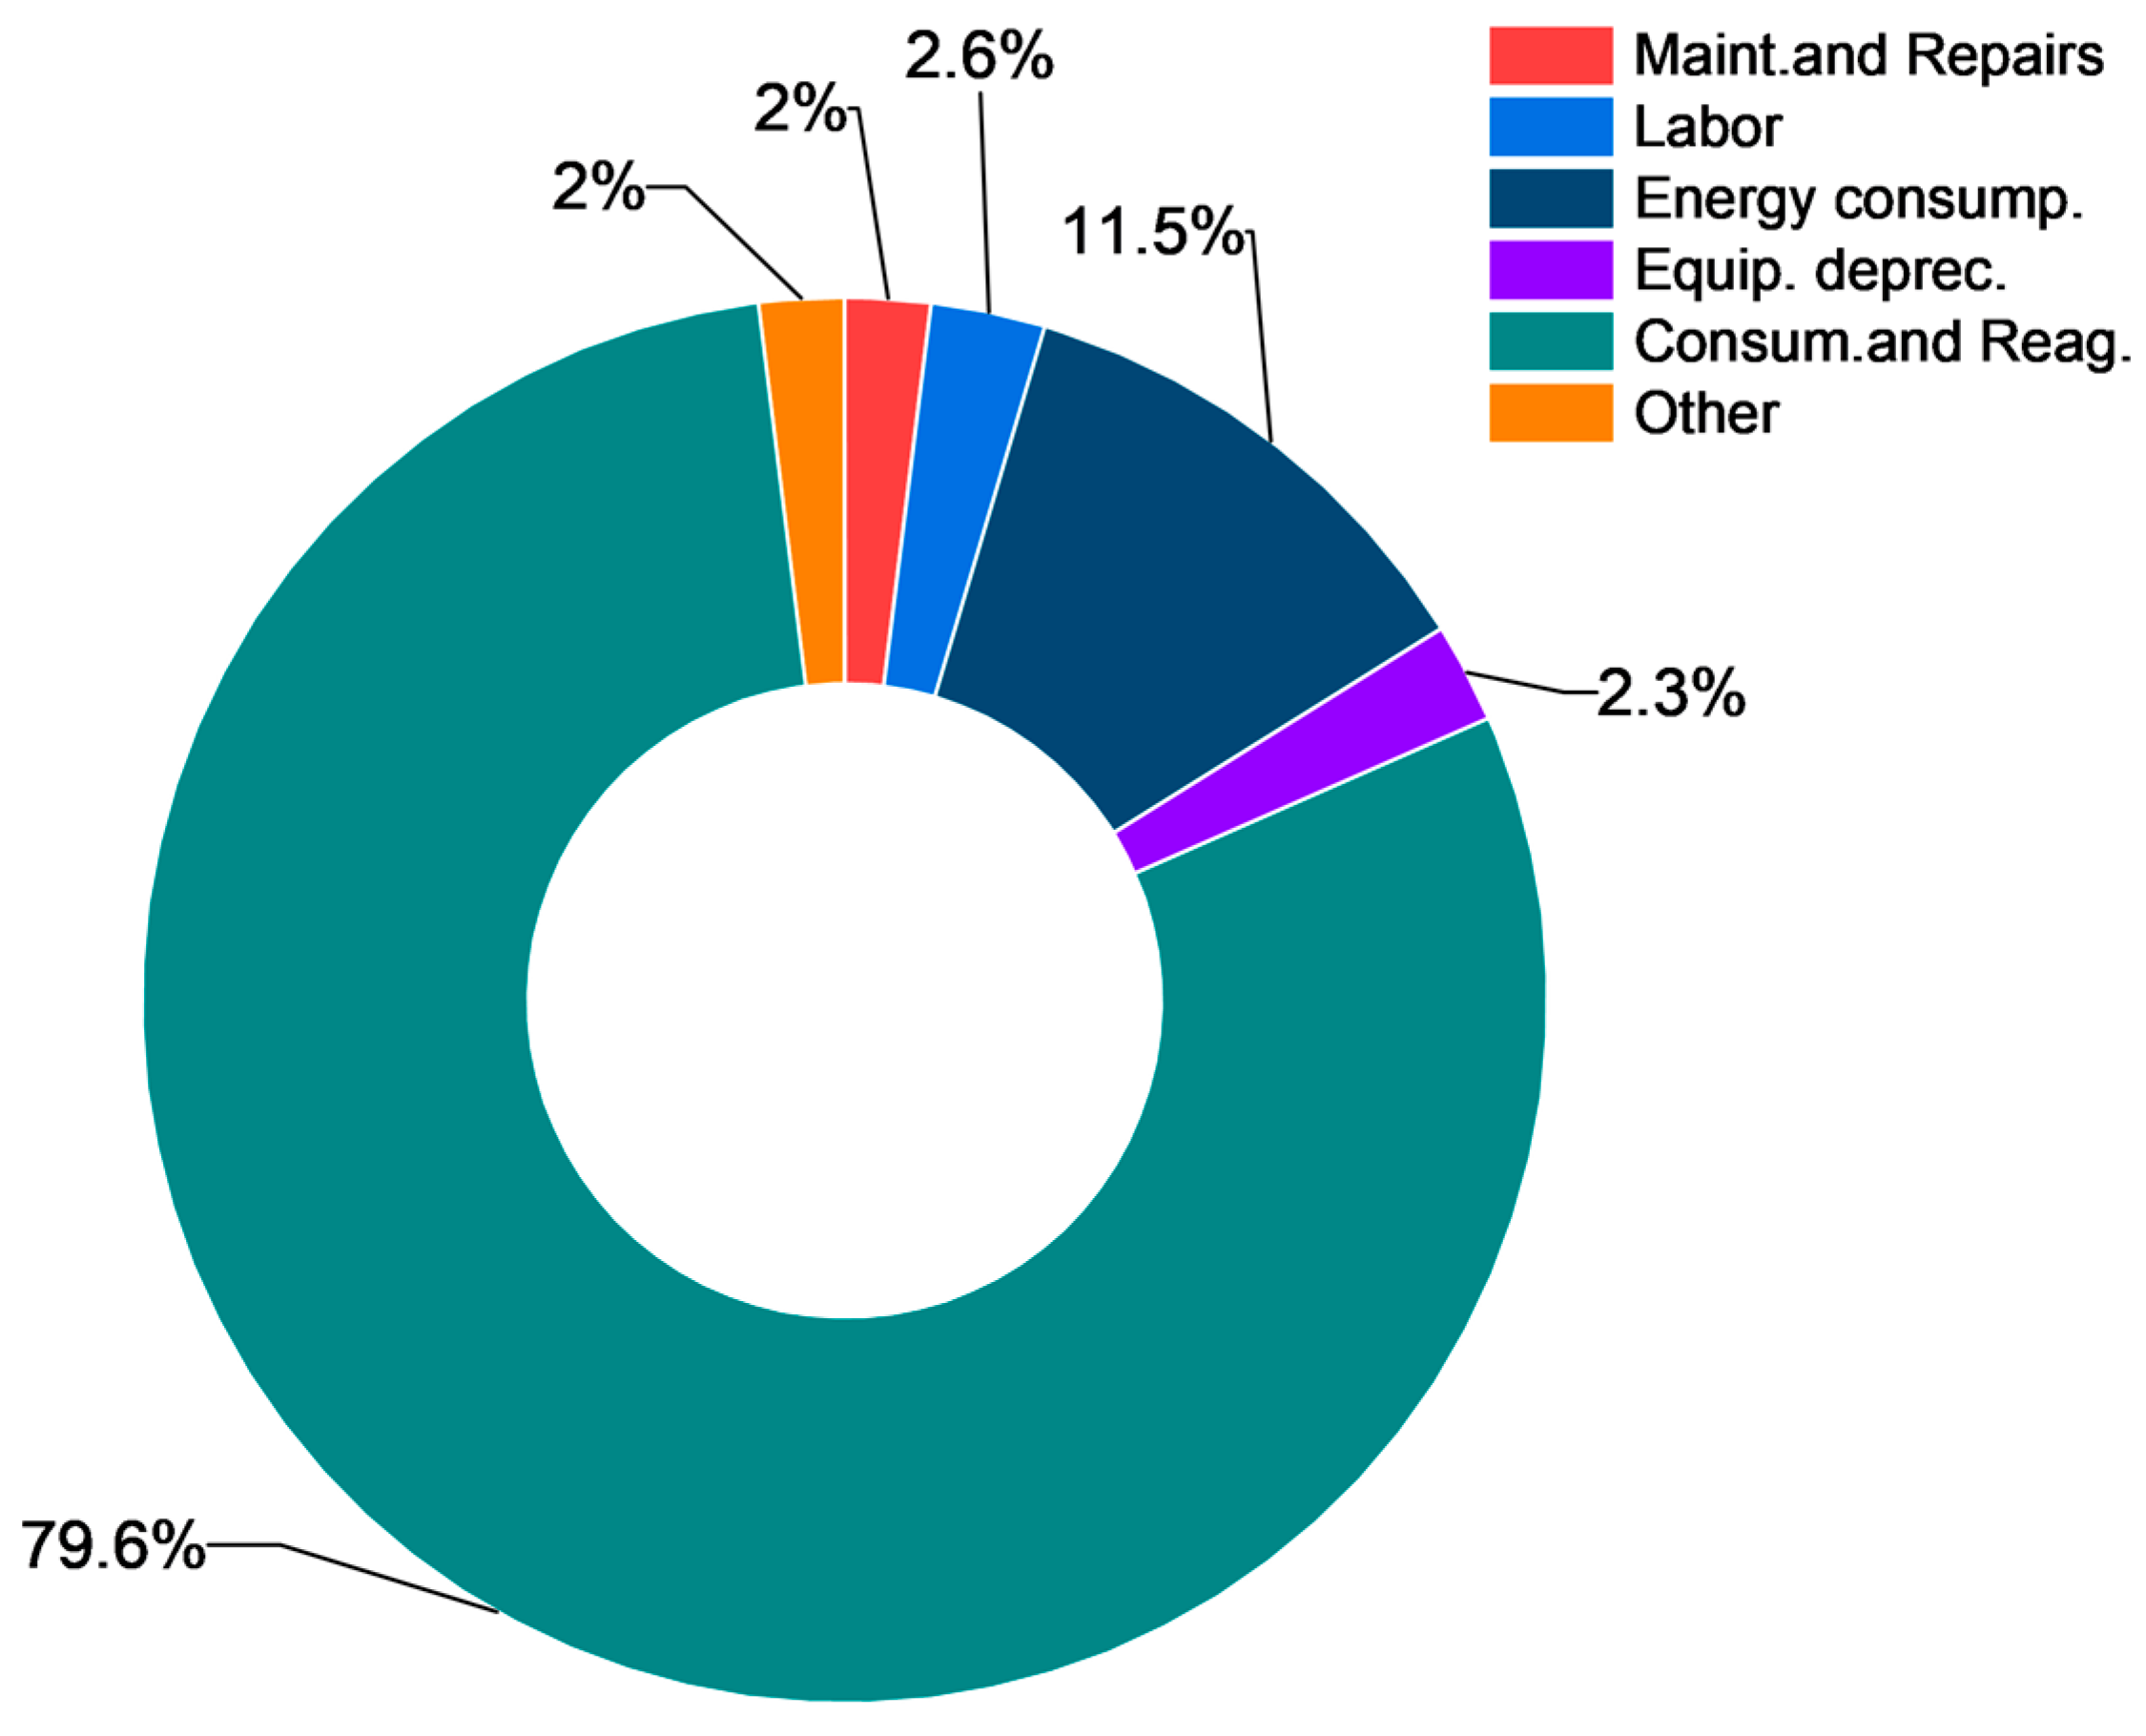
3.1.8. Flotation
3.2. Estimation of Operating Costs
3.3. Distribution of Operating Costs
4. Discussion
5. Conclusions
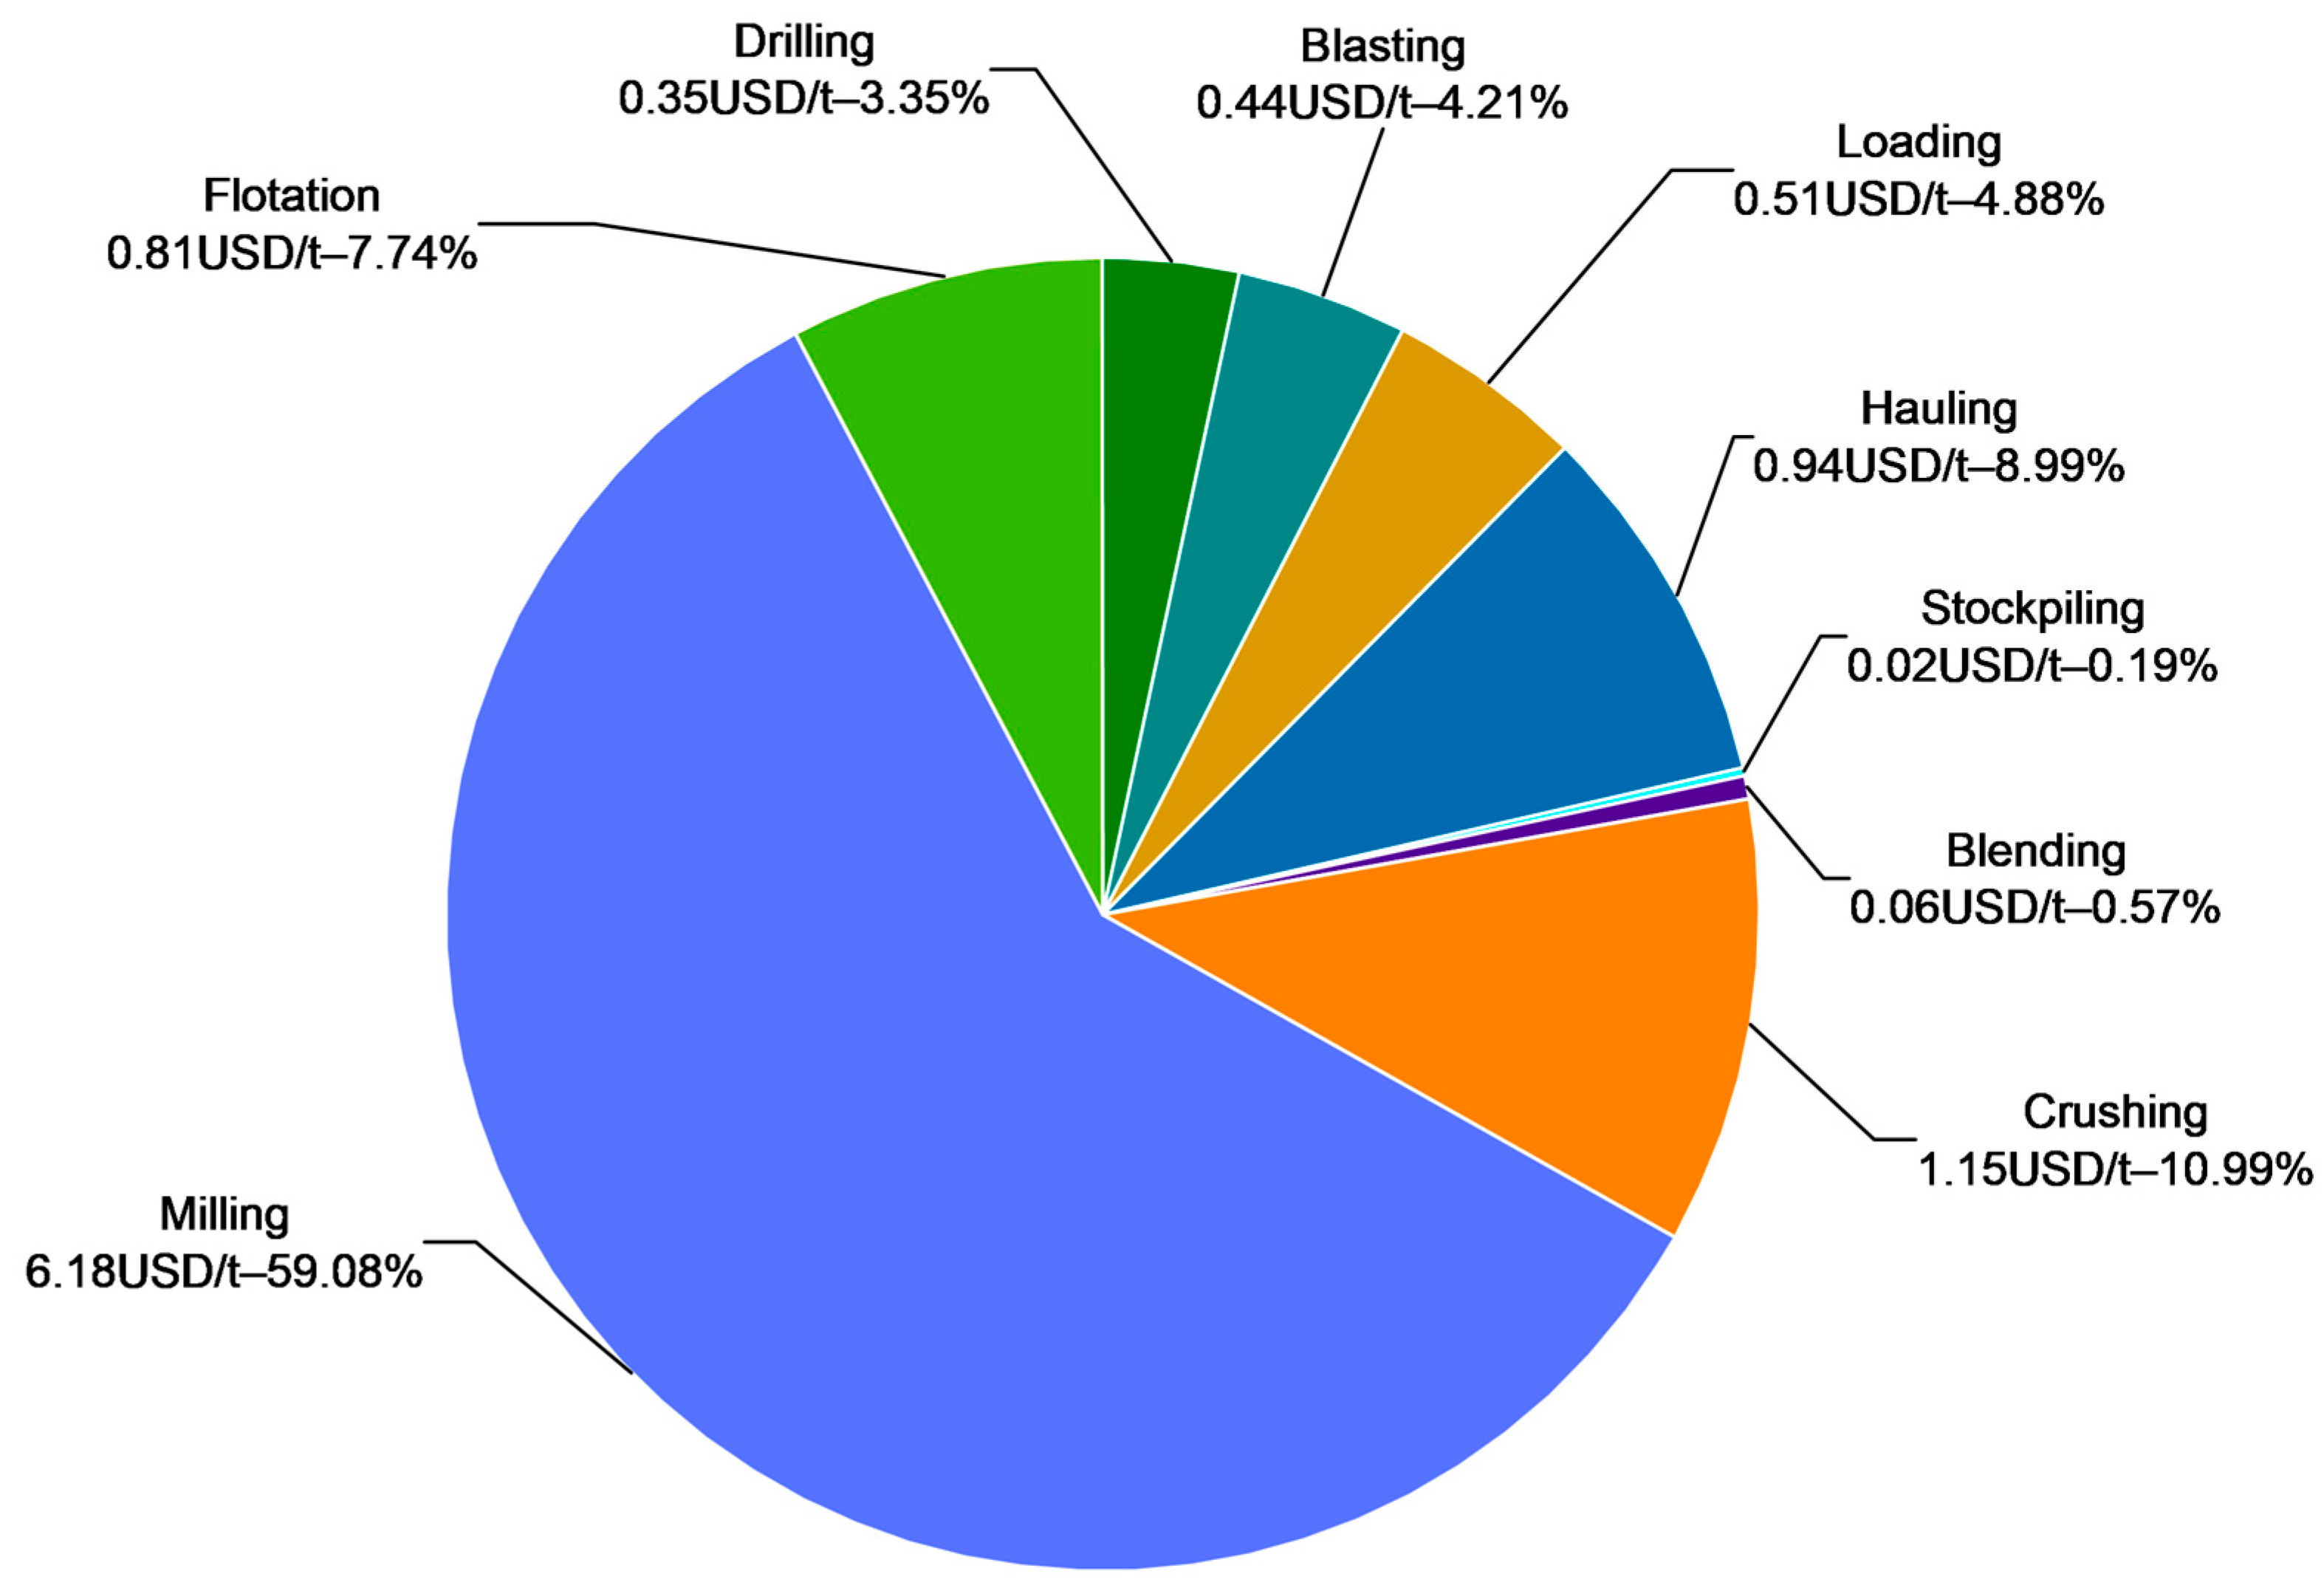
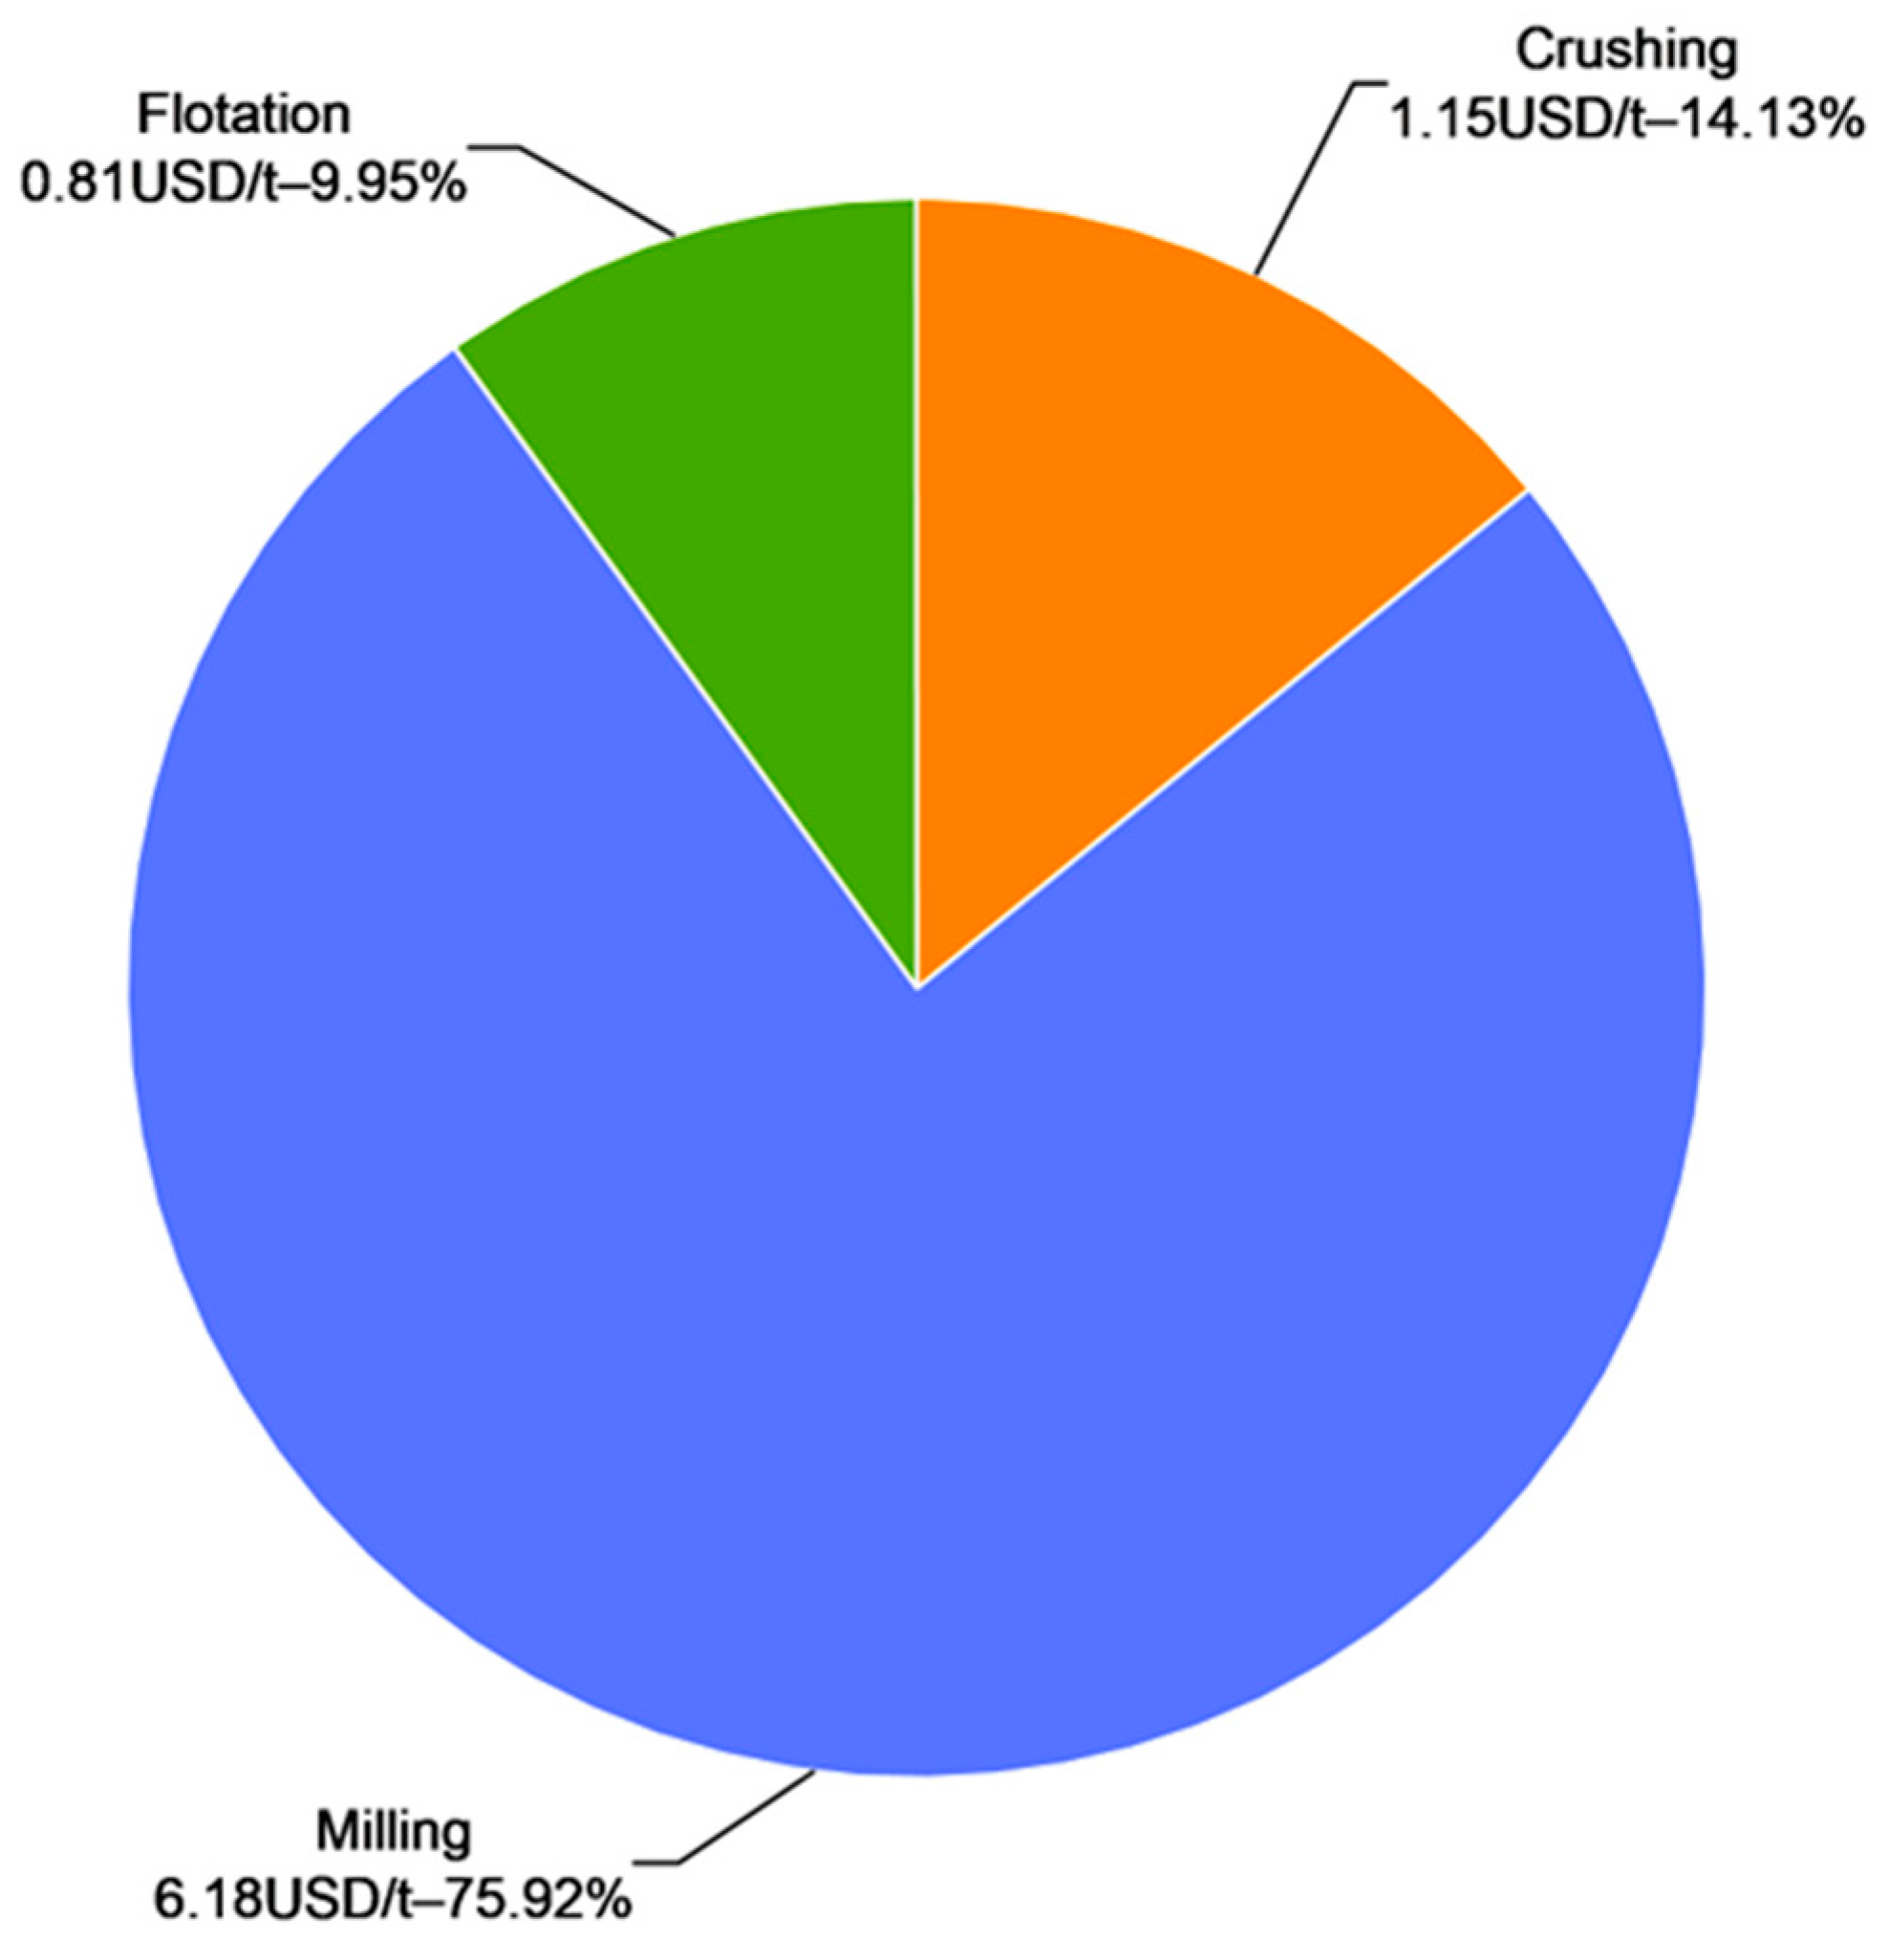
- Comminution, particularly milling, accounted for 59.08% of total OPEX, with crushing representing an additional 10.99%. Together, these units accounted for nearly 70% of total OPEX, highlighting comminution as one of the most energy-intensive and costly operations in mining. Furthermore, flotation accounted for 7.74% of total OPEX and 9.95% of mineral processing OPEX;
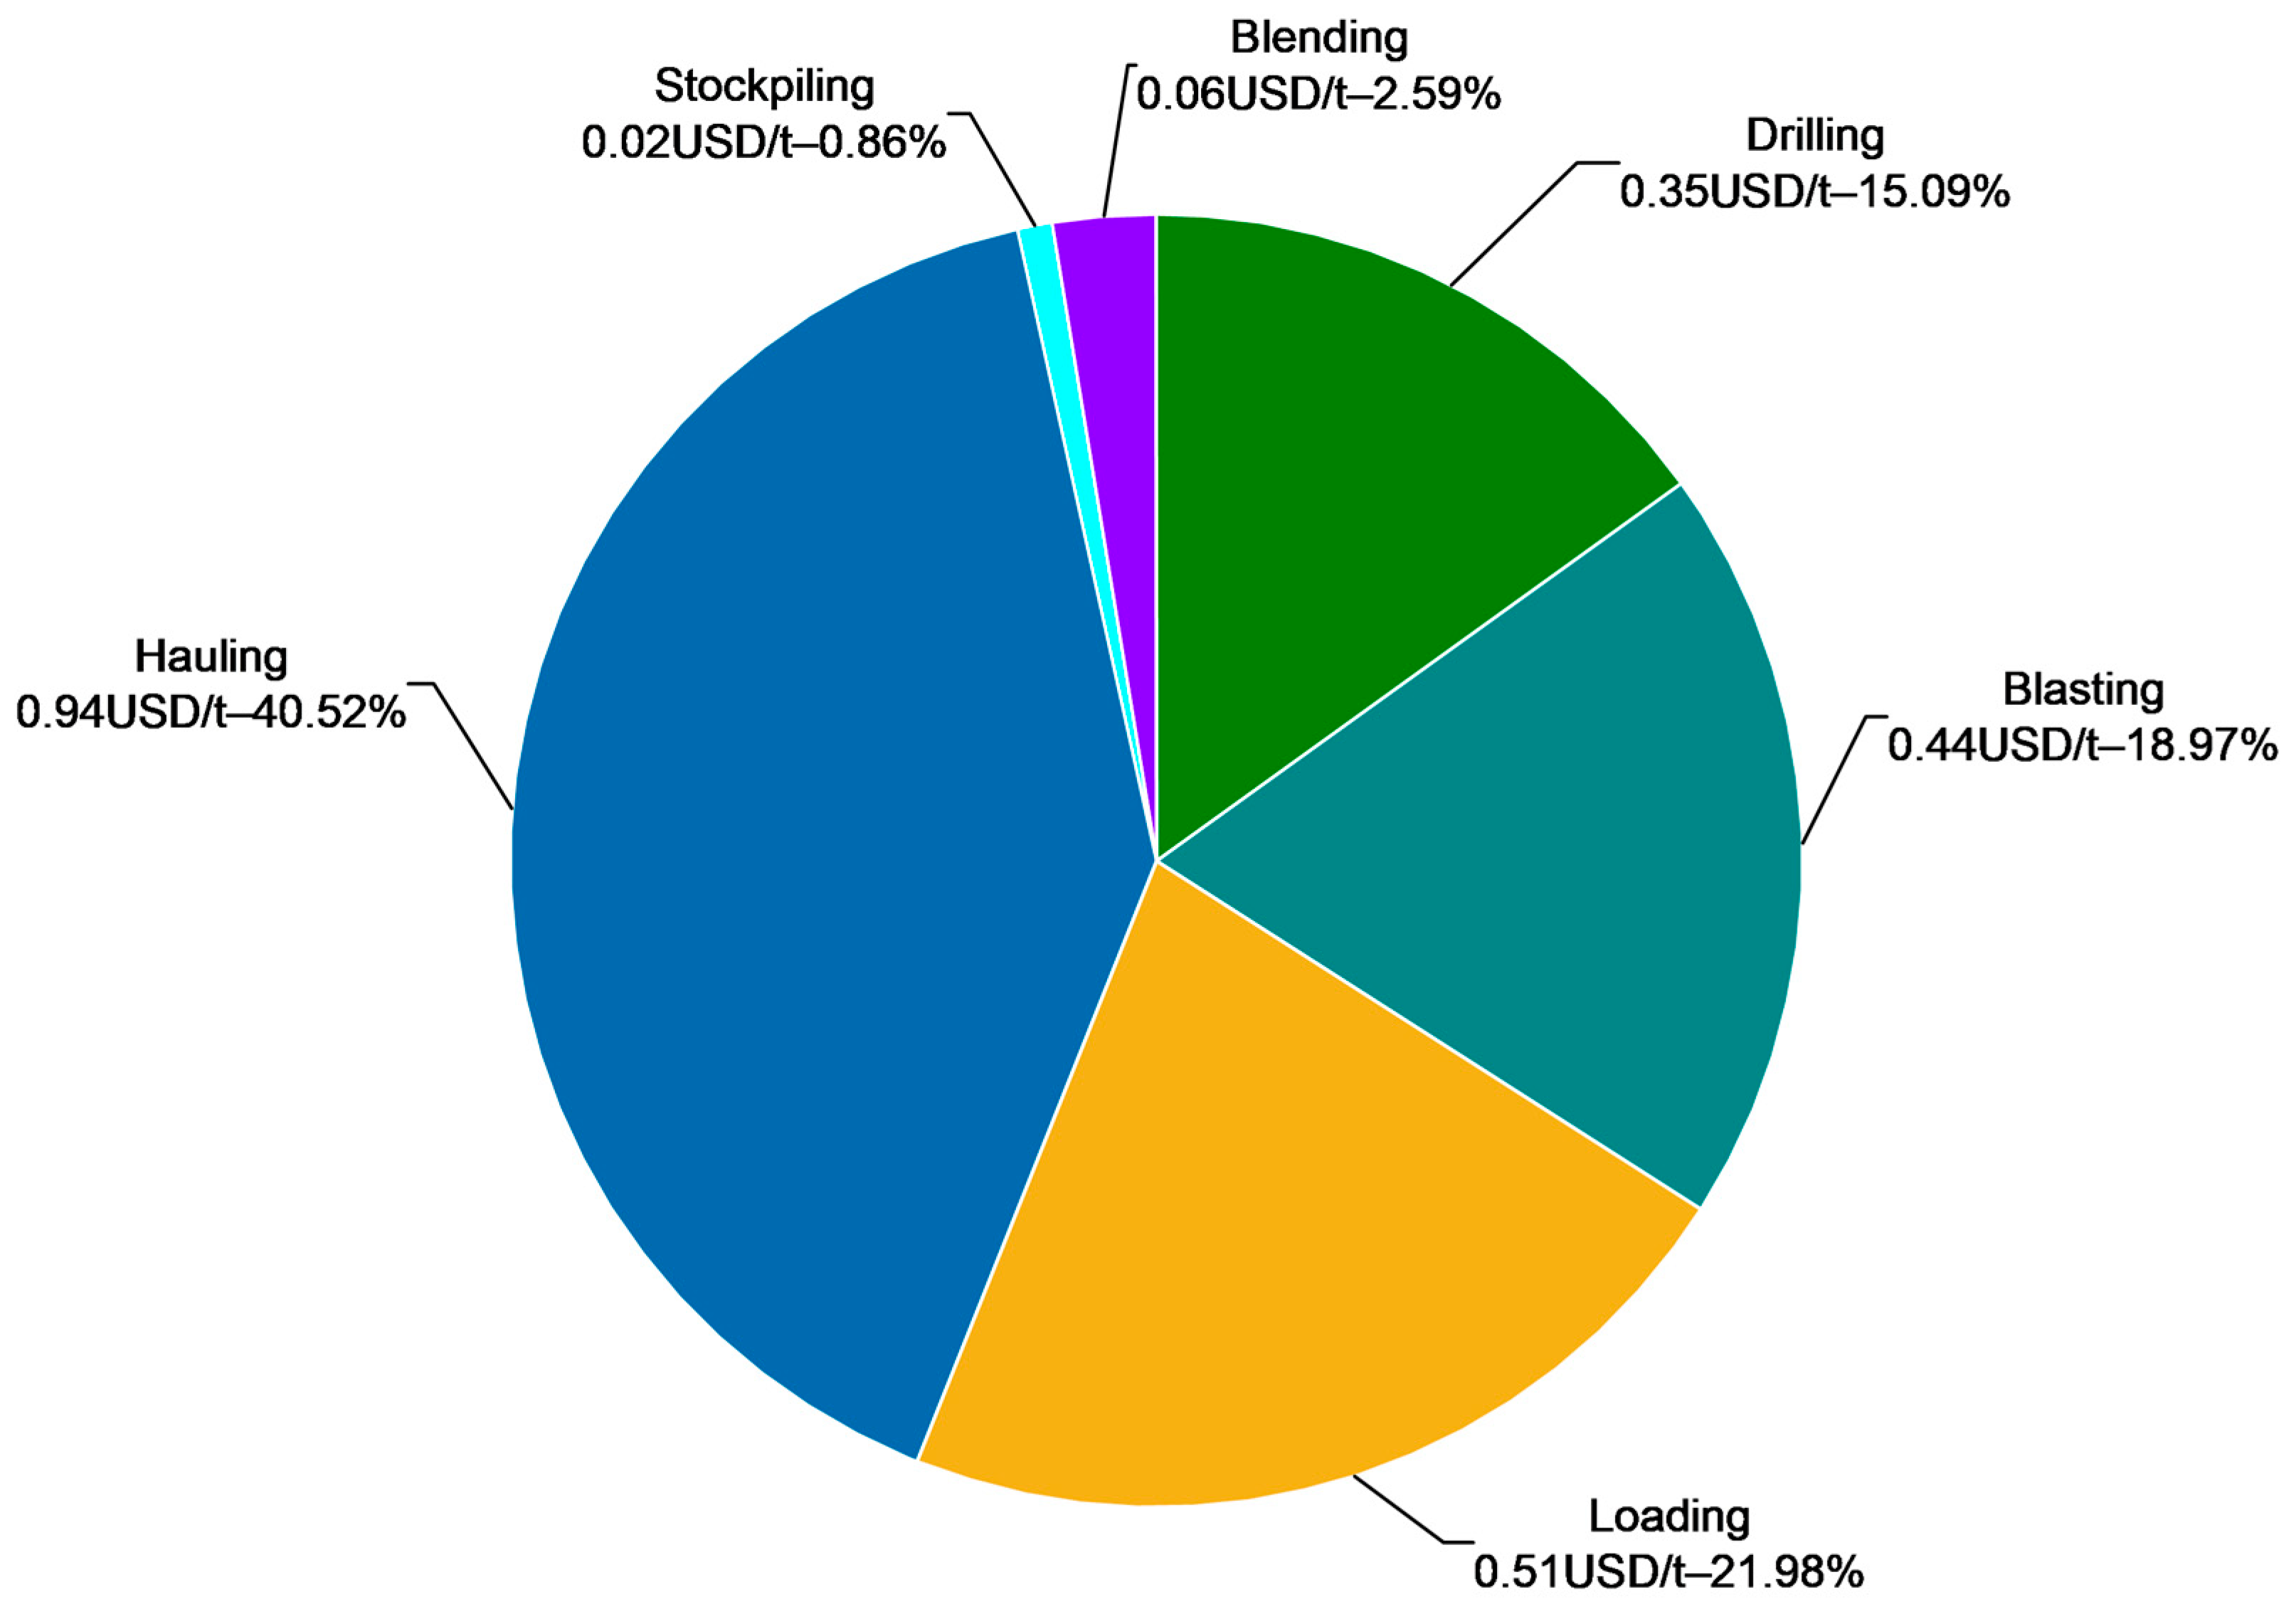
- Drilling and blasting contributed 3.35% and 4.21% to total OPEX, respectively. Additionally, drilling accounted for 15.09% of total mining OPEX, and blasting OPEX was notably high, representing 18.97% of total mining operating costs, exceeding the industry benchmark associated with blasting OPEX, primarily due to the significant expenses related to explosives and accessories;
- Hauling accounted for 8.99% of total OPEX. In addition, it represented 40.52% of total mining OPEX, slightly lower than the typical industry benchmark range for surface mining operations unlikely due to short transport distances between mine and processing facilities, resulting in lower fuel consumption and maintenance costs. In contrast, loading represented 4.88% of total OPEX and 21.98% of total mining OPEX;
- Other mining operations, such as stockpiling, accounted for 0.19% of total OPEX and 0.86% of mining OPEX. Blending contributed 0.57% of total OPEX and 2.59% of total mining OPEX.
- Incorporating additional mineral processing units, such as dewatering, tailings disposal, and extractive metallurgy, as well as external factors like transportation, environmental management, and reclamation for a more comprehensive description of costs along the value chain;
- Conducting a sensitivity analysis on energy costs, equipment efficiency, and production rates to enhance the robustness of the current findings, especially under varying operational and market conditions;
- Extending the analysis to other commodities and geographical locations for a generalized profile of cost structures available in various surface mining operations;
- Exploring the potential impact of renewable energy integration, automation, and mine-to-mill optimization strategies on cost structures to identify new avenues for enhanced operational efficiency and reduced costs.
Author Contributions
Funding
Institutional Review Board Statement
Informed Consent Statement
Data Availability Statement
Acknowledgments
Conflicts of Interest
References
- Runge, I.C. Mining Economics and Strategy; Society for Mining, Metallurgy, and Exploration, Inc.: Littleton, CO, USA, 1998; pp. 9–15. [Google Scholar]
- Budeba, M.D.; Joubert, J.W.; Webber-Youngman, R.C.W. A proposed approach for modelling competitiveness of new surface coal mines. J. S. Afr. Inst. Min. Metall. 2015, 115, 1057–1064. [Google Scholar] [CrossRef]
- Curry, J.A.; Ismay, M.J.L.; Jameson, G.J. Mine operating costs and the potential impacts of energy and grinding. Miner. Eng. 2014, 56, 70–80. [Google Scholar] [CrossRef]
- O’Neil, T.J. Mine Valuation. In SME Mining Engineering Handbook, 2nd ed.; Hartman, H.L., Britton, S.G., Eds.; Society for Mining, Metallurgy, and Exploration, Inc.: Littleton, CO, USA, 1992; Volume 1, pp. 390–392. [Google Scholar]
- Akbari, A.D.; Osanloo, M. An updated and modified O’Hara cost estimating model based on World and Iran economic conditions. In Proceedings of the 32nd International Symposium on the Application of Computers and Operations Research in the Mineral Industry (APCOM), Tuscon, AZ, USA, 30 March–1 April 2005. [Google Scholar]
- Botín, J.A.; Vergara, M.A. A cost management model for economic sustainability and continuous improvement of mining operations. Resour. Policy 2015, 46, 212–218. [Google Scholar] [CrossRef]
- Nourali, H.; Osanloo, M. A regression-tree-based model for mining capital cost estimation. Int. J. Min. Reclam. Environ. 2018, 34, 88–100. [Google Scholar] [CrossRef]
- Inthavongsa, I.; Drebenstedt, C.; Bongaerts, J. Cost estimation for open pit mines: Tackling cost uncertainties. In Proceedings of the Innovative Und Research, Freiberg, Germany, 7–11 June 2015. [Google Scholar]
- Guo, H.; Nguyen, H.; Vu, D.A.; Bui, X.N. Forecasting mining capital cost for open-pit mining projects based on artificial neural network approach. Resour. Policy 2021, 74, 101474. [Google Scholar] [CrossRef]
- Costa Lima, G.A.; Suslick, S.B. Estimating the volatility of mining projects considering price and operating cost uncertainties. Resour. Policy 2006, 31, 86–94. [Google Scholar] [CrossRef]
- Dehghani, H.; Ataee-pour, M. Determination of the effect of operating cost uncertainty on mining project evaluation. Resour. Policy 2012, 37, 109–117. [Google Scholar] [CrossRef]
- Savolainen, J. Real options in metal mining project valuation: Review of literature. Resour. Policy 2016, 50, 49–65. [Google Scholar] [CrossRef]
- Al-Bakri, A.Y.; Ahmed, H.A.M.; Ahmed, H.M.; Hefni, M.A. Evaluation studies of the new mining projects. Open Geosci. 2023, 15, 20220466. [Google Scholar] [CrossRef]
- Patyk, M.; Bodziony, P.; Kasztelewicz, Z. Analysis of quarrying equipment operating cost structure. Inz. Miner. 2019, 21, 311–318. [Google Scholar] [CrossRef]
- Kecojevic, V.; Vukotic, I.; Komljenovic, D. Production, consumption and cost of energy for surface mining of bituminous coal. Min. Eng. 2014, 66, 51–57. [Google Scholar]
- Dhekne, P.; Kishore, N.; Mishra, R. Minimisation of surface mining costs using Artificial Neural Network. Int. J. Res. Chem. Metall. Civ. Eng. 2017, 4, 156–160. [Google Scholar] [CrossRef]
- Demir, E.; Karpuz, C.; Demirel, N. Design and implementation of a multimodal transportation cost analysis model for domestic lignite supply in Turkey. J. S. Afr. Inst. Min. Metall. 2012, 112, 993–998. [Google Scholar]
- Hajarian, A.; Osanloo, M. A new developed model to determine waste dump site selection in open pit mines: An approach to minimize haul road construction cost. Int. J. Eng. 2020, 33, 1413–1422. [Google Scholar] [CrossRef]
- Malli, T.; Mizrak Ozfirat, P.; Yetkin, M.E.; Ozfirat, M.K. Truck selection with the Fuzzy-WSM method in transportation systems of open pit mines. Teh. Vjesn. 2021, 28, 58–64. [Google Scholar] [CrossRef]
- Stenin, D. On possible changes in the calculation of parameters of transport technology of open pit mining with the use of autonomous heavy platforms. In Proceedings of the VIth International Innovative Mining Symposium, Kemerovo, Russia, 20–22 October 2021. [Google Scholar]
- Zhao, Z.; Bi, L. A new challenge: Path planning for autonomous truck of open-pit mines in the last transport section. Appl. Sci. 2020, 10, 6622. [Google Scholar] [CrossRef]
- Ozdemir, B.; Kumral, M. A system-wide approach to minimize the operational cost of bench production in open-cast mining operations. Int. J. Coal Sci. Technol. 2019, 6, 84–94. [Google Scholar] [CrossRef]
- Shafiee, S.; Nehring, M.; Topal, E. Estimating average total cost of open pit coal mines in Australia. In Proceedings of the Australian Mining Technology Conference, Brisbane, Australia, 27–28 October 2009. [Google Scholar]
- Segura-Salazar, J.; Santos, N.d.S.L.; Tavares, L.M. Holistic pre-feasibility study of comminution routes for a Brazilian itabirite ore. Minerals 2021, 11, 894. [Google Scholar] [CrossRef]
- Navarro Torres, V.F.; Figueiredo, J.R.; De La Hoz, R.C.; Botaro, M.; Chaves, L.S. A Mine-to-crusher model to minimize costs at a truckless open-pit iron mine in Brazil. Minerals 2022, 12, 1037. [Google Scholar] [CrossRef]
- Marinin, M.; Marinina, O.; Wolniak, R. Assessing of losses and dilution impact on the cost chain: Case study of gold ore deposits. Sustainability 2021, 13, 3830. [Google Scholar] [CrossRef]
- Knights, P.F.; Oyanader, P. Best-in-class maintenance benchmarks in Chilean open pit mines. CIM Bull. 2005, 98, 1088. [Google Scholar]
- Fernandez, V. Copper mining in Chile and its regional employment linkages. Resour. Policy 2021, 70, 101173. [Google Scholar] [CrossRef]
- González, A.; Sánchez, F.; Castillo, E. The nationalization of the large-scale copper mines in Chile: Successful investment or financial failure? Miner. Econ. 2024, 37, 787–807. [Google Scholar] [CrossRef]
- Navarro Torres, V.F.; Ferreira, F.V.; de Carvalho, V.A.; Veras, E.; Sitônio, F.F. Application of blast-pile image analysis in a mine-to-crusher model to minimize overall costs in a large-scale open-pit mine in Brazil. Mining 2024, 4, 983–993. [Google Scholar] [CrossRef]
- Bakhshandeh Amnieh, H.; Hakimiyan Bidgoli, M.; Mokhtari, H.; Aghajani Bazzazi, A. Application of simulated annealing for optimization of blasting costs due to air overpressure constraints in open-pit mines. J. Min. Environ. 2019, 10, 903–916. [Google Scholar] [CrossRef]
- Howe, S.; Pan, J. Application of Enterprise Optimisation considering ultra-high intensity blasting strategies. In Proceedings of the Complex Orebodies Conference, Brisbane, Australia, 19–21 November 2018. [Google Scholar]
- Zhang, Y.; Zhao, Z.; Bi, L.; Wang, L.; Gu, Q. Determination of truck-shovel configuration of open-pit mine: A simulation method based on mathematical model. Sustainability 2022, 14, 12338. [Google Scholar] [CrossRef]
- Rodovalho, E.d.C.; Lima, H.M.; de Tomi, G. New approach for reduction of diesel consumption by comparing different mining haulage configurations. J. Environ. Manag. 2016, 172, 177–185. [Google Scholar] [CrossRef] [PubMed]
- Bodziony, P.; Patyk, M. The influence of the mining operation environment on the energy consumption and technical availability of truck haulage operations in surface mines. Energies 2024, 17, 2654. [Google Scholar] [CrossRef]
- Cao, X.G.; Zhang, M.Y.; Gong, Y.R.; Jia, X.L.; Zhang, R.Y. Maintenance decision method considering inspection of mining equipment. Int. J. Metrol. Qual. Eng. 2021, 12, 21. [Google Scholar] [CrossRef]
- Arteaga, F.; Nehring, M.; Knights, P. The equipment utilisation versus mining rate trade-off in open pit mining. Int. J. Min. Reclam. Environ. 2017, 32, 495–518. [Google Scholar] [CrossRef]
- Shengo, M.L.; Kime, M.B.; Mambwe, M.P.; Nyembo, T.K. A review of the beneficiation of copper-cobalt-bearing minerals in the Democratic Republic of Congo. J. Sustain. Min. 2019, 18, 226–246. [Google Scholar] [CrossRef]
- Igor Azeuda Ndonfack, K.; Yang, Z.; Zhang, J.; Whattam, S.A.; Xie, Y. Geology, geochemistry, and exploration of the Central African Copperbelt: A review. Int. Geol. Rev. 2024, 1–34. [Google Scholar] [CrossRef]
- Gokhale, B.V. Rotary Drilling and Blasting in Large Surface Mines; CRC Press/Balkema: Leiden, The Netherlands, 2011; pp. 389–390. [Google Scholar]
- Tutton, D.; Streck, W. The application of mobile in-pit crushing and conveying in large, hard rock open pit mines. In Proceedings of the Mining Magazine Congress, Johannesburg, South Africa, 24–26 October 2011. [Google Scholar]
- Paricheh, M.; Osanloo, M. Determination of the optimum in-pit crusher location in open-pit mining under production and operating cost uncertainties. In Proceedings of the 16th International Conference on Computer Applications in the Mineral Industries, Istanbul, Turkey, 5–7 October 2016. [Google Scholar]
- Tadubana, G.; Sigweni, B.; Suglo, R. Case-based reasoning system for prediction of fuel consumption by haulage trucks in open–pit mines. Int. J. Electr. Comput. Eng. 2020, 11, 3129–3136. [Google Scholar] [CrossRef]
- Moradi-Afrapoli, A.; Upadhyay, S.; Askari-Nasab, H. Truck dispatching in surface mines—Application of fuzzy linear programming. J. S. Afr. Inst. Min. Metall. 2021, 121, 505–512. [Google Scholar] [CrossRef]
- Kuznetsov, D.; Kosolapov, A. Dynamic of performance of open-pit dump trucks in ore mining in severe climatic environment. Transp. Res. Procedia 2022, 63, 1042–1048. [Google Scholar] [CrossRef]
- Huayanca, D.; Bujaico, G.; Delgado, A. Application of discrete-event simulation for truck fleet estimation at an open-pit copper mine in Peru. Appl. Sci. 2023, 13, 4093. [Google Scholar] [CrossRef]
- Rakhmangulov, A.; Burmistrov, K.; Osintsev, N. Multi-criteria system’s design methodology for selecting open pits dump trucks. Sustainability 2024, 16, 863. [Google Scholar] [CrossRef]
- CostMine. Available online: https://www.costmine.com/mining-cost-service/ (accessed on 21 January 2025).
- de Werk, M. Trade-Off Between Cost and Performance in Chevron Bed-Blending. Master’s Thesis, McGill University, Montreal, Quebec, June 2017. [Google Scholar]
- Wills, B.A. Comminution in the minerals industry—An overview. Miner. Eng. 1990, 3, 3–5. [Google Scholar] [CrossRef]
- Wenzheng, L. Comminution for large concentrator. Trans. N. F. Soc. 1991, 1, 85–88. [Google Scholar]
- Foggiatto, B.; Bueno, M.; Lane, G.; McLean, E.; Chandramohan, R. The economics of large scale ore sorting. In Proceedings of the XXVIIth International Mineral Processing Council (IMPC), Santiago, Chile, 20–24 October 2014. [Google Scholar]
- Wills, B.A.; Napier-Munn, T. Wills’ Mineral Processing Technology: An Introduction to the Practical Aspects of Ore Treatment and Mineral Recovery, 7th ed.; Elsevier Science & Technology Books: Amsterdam, The Netherlands, 2006; pp. 1–14. [Google Scholar]
- Arfania, S.; Sayadi, A.R.; Khalesi, M.R. Cost modelling for flotation machines. J. S. Afr. Inst. Min. Metall. 2017, 11, 89–96. [Google Scholar] [CrossRef]
- Ahmed, A.A.M. Development of an Integrated Mining and Processing Optimization System. Ph.D. Thesis, Technische Universität Bergakademie Freiberg, Freiberg, Germany, April 2013. [Google Scholar]
- Whittle, D.; Wooller, R. Maximising the economic performance of your comminution circuit through cut-off optimization. Int. J. Surf. Min. Reclam. Environ. 1999, 13, 147–153. [Google Scholar] [CrossRef]
- Zhang, Z.X.; Sanchidrián, J.A.; Ouchterlony, F.; Luukkanen, S. Reduction of fragment size from mining to mineral processing: A review. Rock. Mech. Rock. Eng. 2023, 56, 747–778. [Google Scholar] [CrossRef]
- Adewuyi, S.O.; Ahmed, H.A.M.; Ahmed, H.M.A. Methods of ore pretreatment for comminution energy reduction. Minerals 2020, 10, 423. [Google Scholar] [CrossRef]
- Tromans, D. Mineral comminution: Energy efficiency considerations. Miner. Eng. 2008, 21, 613–620. [Google Scholar] [CrossRef]
- Saramak, D.; Leśniak, K. Impact of HPGR operational pressing force and material moisture on energy consumption and crushing product fineness in high-pressure grinding processes. Energy 2024, 302, 131908. [Google Scholar] [CrossRef]
- Shi, F.; Morrison, R.; Cervellin, A.; Burns, F.; Musa, F. Comparison of energy efficiency between ball mills and stirred mills in coarse grinding. Miner. Eng. 2009, 22, 673–680. [Google Scholar] [CrossRef]
- Nikolić, V.; Ferradal, P.S.; Medina Pierres, J.; Menéndez-Aguado, J.M.; Trumić, M. Methods for Estimating the Bond Work Index for ball mills. Minerals 2024, 14, 1264. [Google Scholar] [CrossRef]
- Choi, Y.; Song, J. Review of photovoltaic and wind power systems utilized in the mining industry. Renew. Sust. Energy Rev. 2017, 75, 1386–1391. [Google Scholar] [CrossRef]
- Vyhmeister, E.; Muñoz, C.A.; Miquel, J.M.B.; Moya, J.P.; Guerra, C.F.; Mayor, L.R.; Godoy-Faúndez, A.; Higueras, P.; Clemente-Jul, C.; Valdés-González, H.; et al. A combined photovoltaic and novel renewable energy system: An optimized techno-economic analysis for mining industry applications. J. Clean. Prod. 2017, 149, 999–1010. [Google Scholar] [CrossRef]
- Nasirov, S.; Agostini, C.A. Mining experts’ perspectives on the determinants of solar technologies adoption in the Chilean mining industry. Renew. Sust. Energy Rev. 2018, 95, 194–202. [Google Scholar] [CrossRef]
- Behar, O.; Peña, R.; Kouro, S.; Kracht, W.; Fuentealba, E.; Moran, L.; Sbarbaro, D. The use of solar energy in the copper mining processes: A comprehensive review. Clean. Eng. Technol. 2021, 4, 100259. [Google Scholar] [CrossRef]
- Igogo, T.; Awuah-Offei, K.; Newman, A.; Lowder, T.; Engel-Cox, J. Integrating renewable energy into mining operations: Opportunities, challenges, and enabling approaches. Appl. Energy 2021, 300, 117375. [Google Scholar] [CrossRef]
- Lu, F.; Gui, W.; Yang, C.; Wang, X. Two-step optimal-setting control for reagent addition in froth flotation based on belief rule base. Processes 2022, 10, 1933. [Google Scholar] [CrossRef]


| Operation | Components | Cost (USD/Year) | % |
|---|---|---|---|
| Maintenance and Repairs | 663,600 | 5 | |
| Labor | 227,700 | 2 | |
| Drilling | Fuel | 5,702,400 | 41 |
| Equipment Depreciation | 298,620 | 2 | |
| Consumables | 6,912,000 | 49 | |
| Other | 172,800 | 1 | |
| Explosives and Accessories | 21,600,000 | 97.9 | |
| Labor | 72,450 | 0.3 | |
| Blasting | Fuel | 103,680 | 0.5 |
| Permits and Regulatory | 200,000 | 0.9 | |
| Other | 86,400 | 0.4 | |
| Maintenance and Repairs | 2,112,000 | 9 | |
| Labor | 289,800 | 1 | |
| Loading | Fuel | 14,400,000 | 59 |
| Equipment Depreciation | 1,584,000 | 6 | |
| Consumables | 5,760,000 | 24 | |
| Other | 288,000 | 1 | |
| Maintenance and Repairs | 3,583,140 | 8.7 | |
| Labor | 993,600 | 2.4 | |
| Hauling | Fuel | 25,920,000 | 63.2 |
| Equipment Depreciation | 4,209,213.46 | 10.3 | |
| Consumables | 5,760,000 | 14 | |
| Other | 576,000 | 1.4 | |
| Maintenance and Repairs | 282,417.15 | 37 | |
| Labor | 140,760 | 18 | |
| Fuel | 100,500 | 13 | |
| Stockpiling | Storage | 29,668.80 | 4 |
| Equipment Depreciation | 113,213.09 | 15 | |
| Inventory Management | 79,000 | 10 | |
| Other | 19,351.77 | 3 | |
| Maintenance and Repairs | 71,500 | 20 | |
| Labor | 54,280 | 16 | |
| Fuel | 82,500 | 24 | |
| Blending | Equipment Depreciation | 49,500 | 14 |
| Sampling and Testing | 43,051.11 | 12 | |
| Quality Control | 32,288.33 | 9 | |
| Other | 16,655.98 | 5 | |
| Maintenance and Repairs | 990,000 | 9 | |
| Labor | 653,329.01 | 6 | |
| Crushing | Energy Consumption | 6,024,942 | 56 |
| Equipment Depreciation | 534,600 | 5 | |
| Consumables | 2,409,976.80 | 22 | |
| Other | 212,256.96 | 2 | |
| Maintenance and Repairs | 1,123,200 | 1.9 | |
| Labor | 846,654.77 | 1.5 | |
| Milling | Energy Consumption | 34,620,750 | 59.5 |
| Equipment Depreciation | 522,578.57 | 0.9 | |
| Consumables | 20,772,450 | 35.7 | |
| Other | 289,428.17 | 0.5 | |
| Maintenance and Repairs | 415,170 | 2 | |
| Labor | 554,663.85 | 2.6 | |
| Flotation | Energy Consumption | 2,430,594 | 11.5 |
| Equipment Depreciation | 483,634.17 | 2.3 | |
| Consumables and Reagents | 16,783,240 | 79.6 | |
| Other | 413,346.04 | 2 |
| Category | Operation | Parameter | Cost (USD/Year) | OPEX (USD/t) | % |
|---|---|---|---|---|---|
| KDt | 13,977,120 | ||||
| Drilling | Contingency | 1,397,712 | 0.35 | 3.35 | |
| KDtc | 15,374,832 | ||||
| KBt | 22,062,530 | ||||
| Blasting | Contingency | 2,206,253 | 0.44 | 4.21 | |
| KBtc | 24,268,783 | ||||
| KLt | 24,433,800 | ||||
| Loading | Contingency | 2,443,380 | 0.51 | 4.88 | |
| KLtc | 26,877,180 | ||||
| KHt | 41,041,953.46 | ||||
| Mining | Hauling | Contingency | 4,104,195.35 | 0.94 | 8.99 |
| KHtc | 45,146,148.81 | ||||
| KSt | 764,910.81 | ||||
| Stockpiling | Contingency | 76,491.08 | 0.02 | 0.19 | |
| KStc | 841,401.89 | ||||
| KBdt | 349,775.42 | ||||
| Blending | Contingency | 34,977.54 | 0.06 | 0.57 | |
| KBdtc | 384,752.96 | ||||
| Total | 2.32 | ||||
| KCt | 10,825,104.77 | ||||
| Crushing | Contingency | 1,082,510.48 | 1.15 | 10.99 | |
| KCtc | 11,907,615.25 | ||||
| KCt | 58,175,061.51 | ||||
| Processing | Milling | Contingency | 5,817,506.15 | 6.18 | 59.08 |
| KCtc | 63,992,567.66 | ||||
| KFt | 21,080,648.06 | ||||
| Flotation | Contingency | 2,108,064.81 | 0.81 | 7.74 | |
| KFtc | 23,188,712.87 | ||||
| Total | 8.14 | ||||
| Total OPEX | 10.46 | 100 |
| Category | Operation | OPEX | Benchmarks (%) | References | |
|---|---|---|---|---|---|
| (USD/t) | (%) | ||||
| Drilling | 0.35 | 15.09 | 8–15 | [31,40,41] | |
| Blasting | 0.44 | 18.97 | 10 | [31,42] | |
| Mining | Loading | 0.51 | 21.98 | 9–16 | [25,30,41,42,43] |
| Hauling | 0.94 | 40.52 | 43–70 | [30,41,44,45,46,47] | |
| Stockpiling | 0.02 | 0.86 | 0.05–0.25 | [48] | |
| Blending | 0.06 | 2.59 | 0.5–3 | [48,49] | |
| Total | 2.32 | 100 | |||
| Comminution | 7.33 | 90.05 | 40–50 | [50,51] | |
| Processing | Flotation | 0.81 | 9.95 | 15–20 | [52,53,54,55] |
| Total | 8.14 | 100 | |||
| Total OPEX | 10.46 | ||||
Disclaimer/Publisher’s Note: The statements, opinions and data contained in all publications are solely those of the individual author(s) and contributor(s) and not of MDPI and/or the editor(s). MDPI and/or the editor(s) disclaim responsibility for any injury to people or property resulting from any ideas, methods, instructions or products referred to in the content. |
© 2025 by the authors. Licensee MDPI, Basel, Switzerland. This article is an open access article distributed under the terms and conditions of the Creative Commons Attribution (CC BY) license (https://creativecommons.org/licenses/by/4.0/).
Share and Cite
Losaladjome Mboyo, H.; Huo, B.; Mulenga, F.K.; Mabe Fogang, P.; Kaunde Kasongo, J.K. Distribution of Operating Costs Along the Value Chain of an Open-Pit Copper Mine. Appl. Sci. 2025, 15, 1602. https://doi.org/10.3390/app15031602
Losaladjome Mboyo H, Huo B, Mulenga FK, Mabe Fogang P, Kaunde Kasongo JK. Distribution of Operating Costs Along the Value Chain of an Open-Pit Copper Mine. Applied Sciences. 2025; 15(3):1602. https://doi.org/10.3390/app15031602
Chicago/Turabian StyleLosaladjome Mboyo, Hervé, Bingjie Huo, François K. Mulenga, Pieride Mabe Fogang, and Jimmy Kalenga Kaunde Kasongo. 2025. "Distribution of Operating Costs Along the Value Chain of an Open-Pit Copper Mine" Applied Sciences 15, no. 3: 1602. https://doi.org/10.3390/app15031602
APA StyleLosaladjome Mboyo, H., Huo, B., Mulenga, F. K., Mabe Fogang, P., & Kaunde Kasongo, J. K. (2025). Distribution of Operating Costs Along the Value Chain of an Open-Pit Copper Mine. Applied Sciences, 15(3), 1602. https://doi.org/10.3390/app15031602