Article

Research on Grouting Pressure of Earth–Rock Dams Reinforced by Polymer Based on Discrete Elements

1
College of Hydraulic and Civil Engineering, Xinjiang Agricultural University, Urumqi 830052, China
2
Xinjiang Key Laboratory of Hydraulic Engineering Security and Water Disasters Prevention, Xinjiang Agricultural University, Urumqi 830052, China
*
Author to whom correspondence should be addressed.
Appl. Sci. 2025, 15(3), 1574; https://doi.org/10.3390/app15031574
Submission received: 7 January 2025 / Revised: 1 February 2025 / Accepted: 3 February 2025 / Published: 4 February 2025

Abstract

:

Featured Application

Grouting reinforcement of the top part of earth-rock dam.

Abstract

As a novel seismic reinforcement measure for earth–rock dams, the PFA-reinforced rockfill materials technology lacks comprehensive investigation into both its reinforcement efficacy and the underlying mechanisms. In this study, we establish a fluid–solid coupling model of PFA-reinforced rockfill materials utilizing the matrix discrete element software MatDEM3.24, developed independently by Nanjing University. The model simulates the dynamic process of polymer grouting within the rockfill body and analyzes the impact of slurry diffusion patterns and various grouting pressures on polymer grouting. Our findings reveal that the diffusion of polymer foam in rockfill occurs in three distinct stages, which are characteristic of penetration grouting. Moreover, we observed that grouting pressure had a significant effect on the diffusion range of the slurry, with greater sensitivity noted in the Z direction. Additionally, we observed a decrease in porosity with increasing grouting pressure, and stress augmentation exhibited an approximately linear relationship with grouting pressure, but the stress augmentation in different directions was different. These research outcomes offer valuable insights into the practical implementation and optimization of PFA-reinforced rockfill materials technology, bearing considerable engineering implications.

1. Introduction

With the implementation of the development of the western region in China, most dams constructed or under construction in Western China are of the earth–rock dam types, such as Shuangjiangkou, Nuozhadu, and Changheba. However, seismic activity in the western region of China is frequent and characterized by high intensity. Therefore, the influence of seismic action must be considered in the construction of water conservancy facilities in this region. Kong et al. [1] suggested that deformation of the upper portion of the dam (typically above 4/5 of the dam height) increases during earthquakes, resulting in a “whipping sheath” effect. Consequently, it is essential to focus on the overall stability of the rockfill body at the dam crest, implementing seismic reinforcement measures in this area to enhance the seismic resilience of the earth–rock dam. Most of the existing seismic reinforcement measures [2] employ planar techniques such as geotechnical grids, steel meshes, and concrete frame beams to fortify the rockfill zone atop dams, aiming to enhance their seismic resilience. However, the inclusion of frame beams may amplify the seismic response in the dam crest region. Furthermore, these planar reinforcement strategies offer limited efficacy in deterring shallow landslides and in mitigating the loosening and displacement of rockfill materials in this area, rendering them unsuitable for bolstering the seismic resilience of extant or rehabilitated earth–rock dams. Addressing these deficiencies, Liu et al. [3] introduced PFA (polyurethane foam adhesive)-reinforced rockfill materials technology and investigated its seismic performance. Leveraging the favorable material properties of polyurethane-based non-aqueous reactive polymer materials, PFA-reinforced rockfill materials technology holds promise for enhancing the material integrity, strength, deformation resistance, and seismic robustness of dams. Consequently, it presents significant potential for widespread application in bolstering the earthquake resistance of earth–rock dams and reinforcing rockfill structures.
Currently, in the domain of PFA-reinforced rockfill materials technology research, Bodi et al. [4] utilized polyurethane for rockfill grouting, investigating the morphology of the resultant composite material and categorizing it into eight types. Fang et al. [5] conducted laboratory tests on polymer grouting and three-dimensional finite element model analyses of high-speed railway subgrade settlement, concluding that polymer grouting repairs effectively mitigate the impact of uneven subgrade settlement on high-speed railway operations. Liu et al. [6] examined the static characteristics of PFA-reinforced rockfill materials, while Xiao et al. [7] conducted large-scale drained triaxial compression tests to explore the volume-change properties of polymer-cemented rockfill materials. Liu et al. [8] investigated the seismic performance and dynamic residual deformation characteristics of PFA-reinforced rockfill materials. Nonetheless, the intricacies of grouting technology remain veiled in the application process, leading to significant randomness and obscurity regarding actual outcomes and technical investigations. Moreover, field tests often lack comprehensive analyses of the reinforcement effect and mechanisms of PFA-reinforced rockfill materials, whereas numerical simulations can vividly and accurately depict the continuous process of slurry diffusion.
Regarding numerical simulation, Hao et al. [9] employed the finite volume method (FVM) and the fluid volume method (VOF) to compute the diffusion radius, pressure distribution, and velocity field of polymer grouting, predicting its diffusion within fractures. Liang et al. [10] constructed a three-dimensional numerical model of polymer grouting grounded in reaction kinetics theory, simulating grouting processes within complex cracks and examining the impact of crack medium parameters on polymer diffusion. Zhu et al. [11] devised a simulation approach for the grouting process, integrating fluid–solid coupling considerations, and assessed the grouting performance at a hydropower station. Nonetheless, scant research exists on numerical simulation studies of PFA-reinforced rockfill materials technology, particularly those based on discrete elements.
Therefore, the rockfill zone at the crest of an earth–rock dam demands particular attention, yet the existing seismic reinforcement measures exhibit notable shortcomings. The PFA-reinforced rockfill materials technology presents a promising application prospect. Owing to the concealed nature of grouting, this study employs discrete element numerical simulation to delve into the reinforcement mechanisms of polymer-grouted materials in rockfill, aiming to provide an in-depth analysis of their efficacy. The numerical model of PFA-reinforced rockfill materials was developed using the matrix discrete element software MatDEM, developed independently by Nanjing University. Initially, circular particles were utilized to simulate the gravitational deposition of rockfill particles, followed by the establishment of the fundamental discrete element accumulation model post-compaction. Subsequently, the grouting process was simulated by excavating grouting holes and employing the fluid–solid coupling method to establish the model. This research simulated the dynamic process of polymer grouting in rockfill bodies and analyzed the slurry diffusion patterns and the effects caused by different grouting pressures. The research findings provide valuable references for the practical application and optimization of construction techniques of PFA-reinforced rockfill materials technology, possessing certain engineering significance.

2. PFA-Reinforced Rockfill Materials Technology

2.1. Technical Principles

When using PFA-reinforced rockfill materials technology for grouting reinforcement, a high-pressure grouting system and grouting catheter are used to inject a polymer into the dam crest and specific areas below the dam slope. These polymers can rapidly expand and solidify after the chemical reaction. The key to this technology is that the polymer material can fill the pores in the rockfill so that the rockfill particles can be effectively cemented together without increasing the overall size of the dam. This cementation increases the resistance of particle redistribution so that the rock-fill particles can form a tightly bonded composite material, which significantly improves the integrity and stability of the dam. It is worth mentioning that this polymer material exhibits flexible characteristics after curing. The special structure formed by this polymer and rockfill particles gives the dam a unique ability to consume seismic energy through its deformation. This ability is particularly important for earth–rock dams located in seismically active areas. In addition, the flexibility of the polymer can also make the dam adapt to a certain degree of deformation, to maintain good stability during long-term operation.

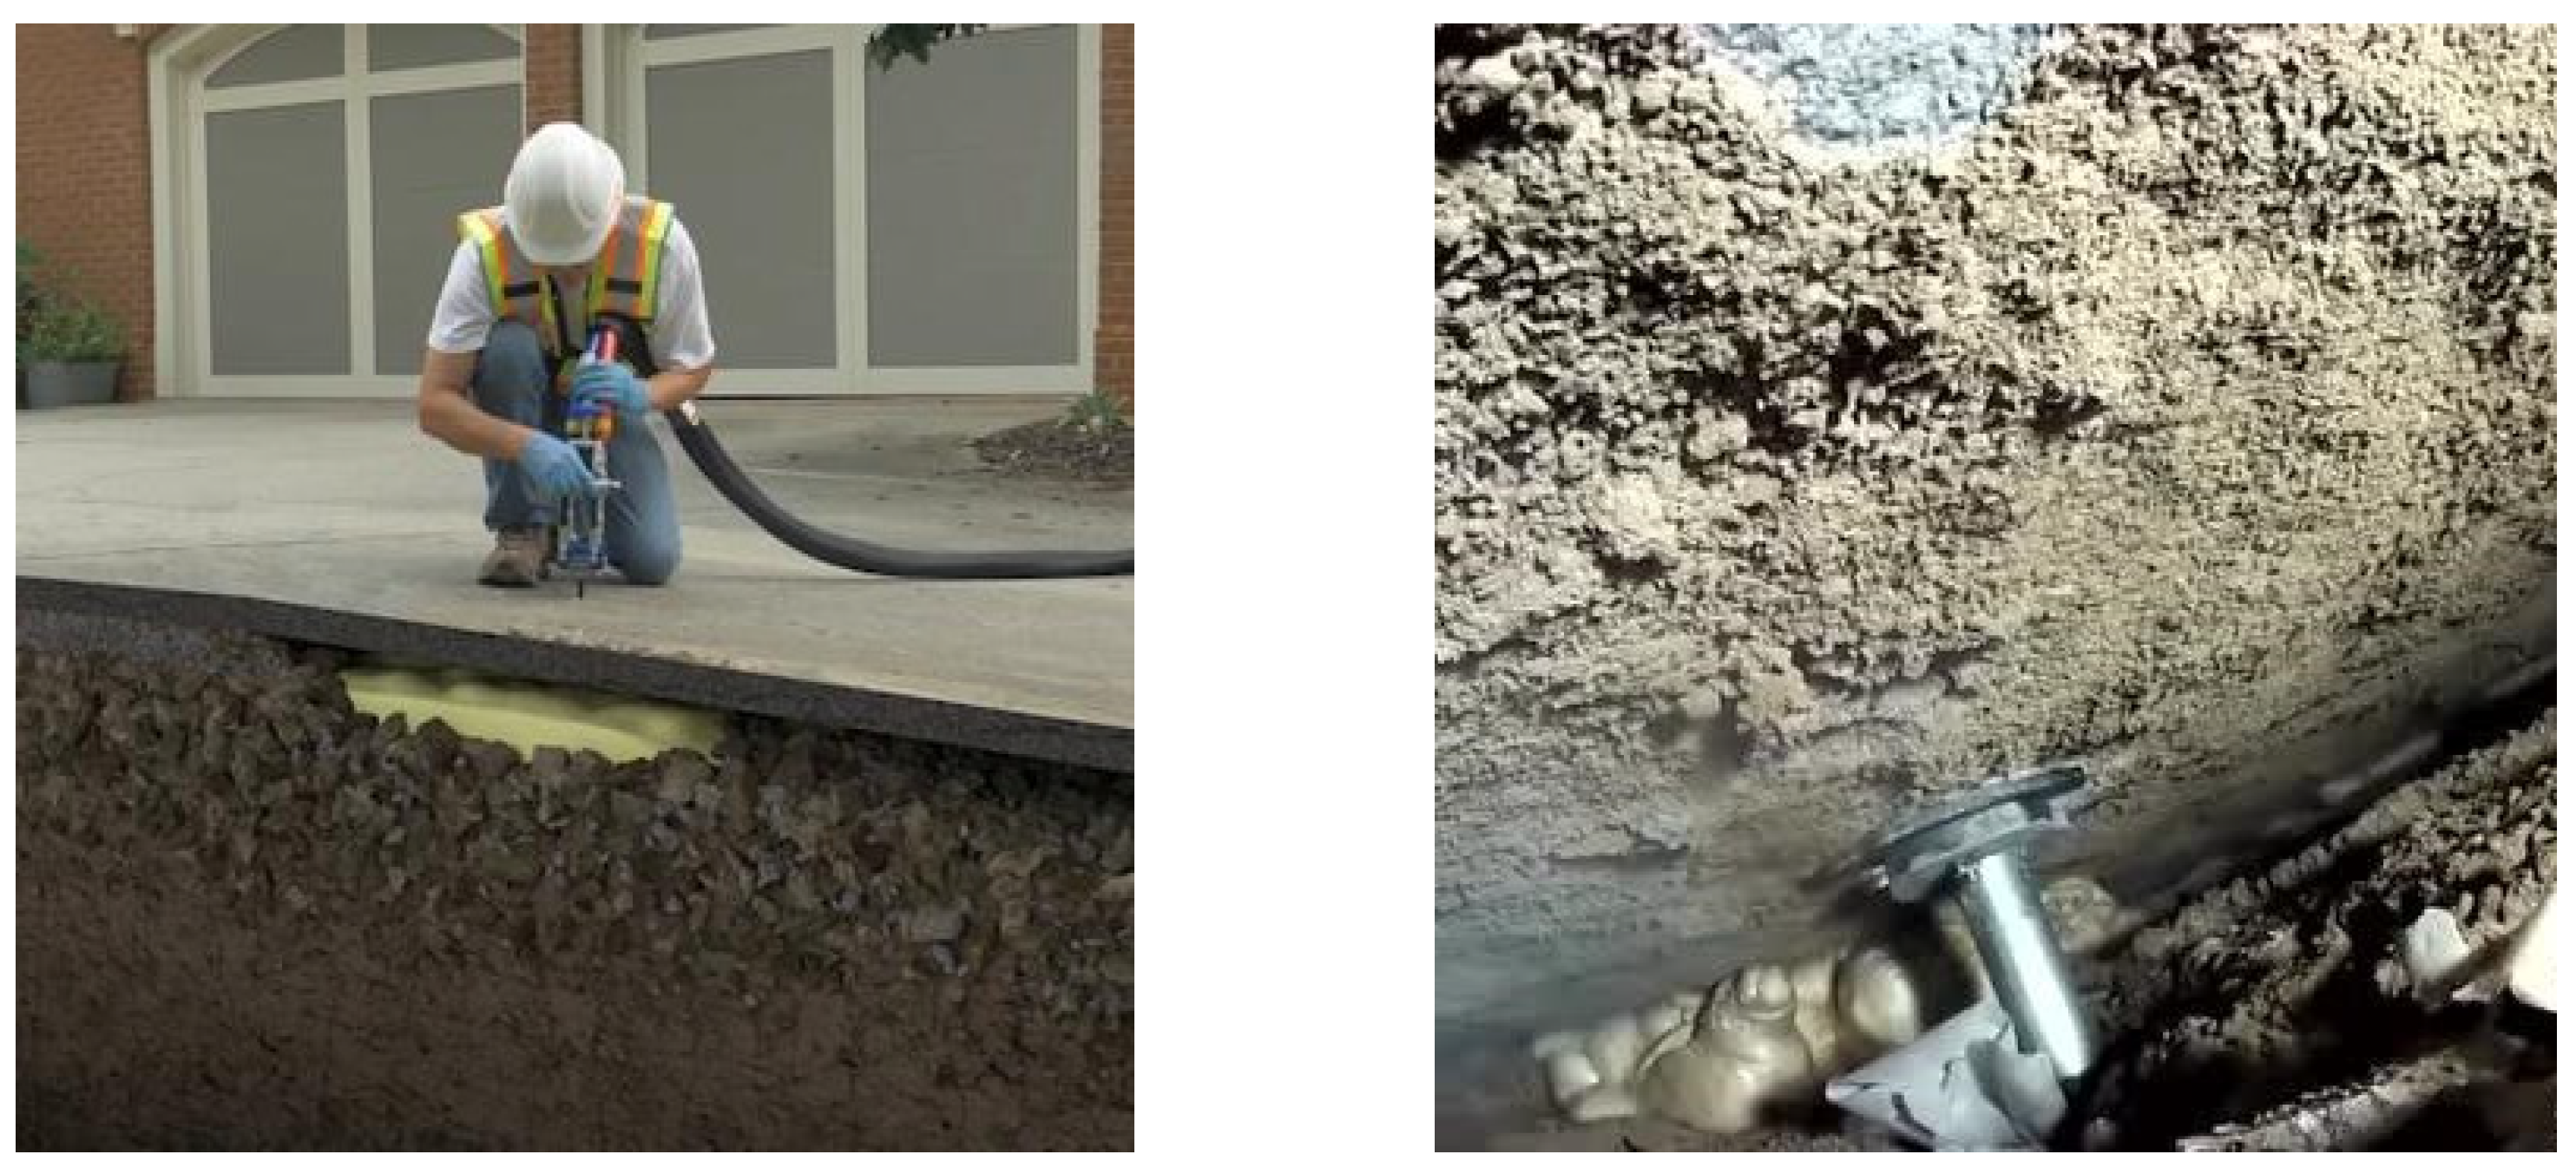
2.2. Construction Process

In current engineering applications, clear construction specifications and processes for grouting reinforcement of PFA-reinforced rockfill materials in dam crest areas are lacking. Consequently, there is a need to consolidate the construction technology for grouting reinforcement of earth–rock dam crests using polymer cementitious materials. This consolidation should draw from engineering applications of polymer grouting for pavement settlement repairs [12] and integrate findings from existing research [13] (Figure 1).
The specific construction requirements and steps are outlined as follows:
  • Preparation of polymer cementitious materials: The polymer cementitious material is primarily divided into two parts. Before grouting, it is blended and subjected to tests for density, viscosity, gel time, coagulation time, foaming rate, and compressive strength to determine the optimal material ratio.
  • Preparation before grouting: Per the seismic design requirements of earth–rock dams, seismic reinforcement measures are implemented for rockfill materials in the upper portion of the dam body (within the dam height range of 3/4~4/5). For new earth–rock dams, polymer grouting reinforcement is conducted concurrently with the layer-wise filling of the dam body. To minimize construction period disruption, reinforcement construction and dam filling construction are carried out separately in different areas. For earthquake-damaged earth–rock dams, visual inspection, leveling measurement, core drilling, and ultrasonic tomography are utilized to identify dam cracks, subsidence, and landslide instability.
  • Grouting hole setting: Before excavating grouting holes, the construction site is cleaned to ensure debris-free, clean positions for the holes. For new earth–rock dams, grouting holes are arranged in square or triangular patterns, with adjacent filling layer holes staggered. Hole spacing within each layer is set at 4 m, with a minimum hole diameter of 40 mm. Hole depth should be a multiple of the filling height of each layer, with specific construction adjusted based on actual conditions. For earthquake-damaged earth–rock dams, adjustments are made based on the location, extent, and slurry diffusion radius of the damage.
  • Grouting: Necessary polymer and grouting equipment is prepared, and grouting pipes are inserted into boreholes, ensuring tight connection with equipment pre-loaded with mixed polymer. Grouting is conducted by injecting the material components into the holes under pressure. Grouting duration is determined by porosity and slurry diffusion radius. Grouting ceases upon reaching the preset time, ensuring each hole is grouted in one session.
  • Hole detection and sealing post-grouting: Upon completion of grouting, grouting effectiveness is assessed via coring. Once testing confirms satisfactory results, holes are sealed with thin mortar or a protective coating layer.

3. Principle of Fluid–Solid Coupling Model

3.1. Mathematical Model of Polymers

To establish the discrete element model for subsequent analysis, understanding the chemical reaction mechanism of the polymer and establishing the requisite mathematical model is necessary. Given the complexity of the actual chemical reaction, and the inherent limitations of the discrete element model, this study focuses on the primary raw materials and key reaction processes, extracting and numerically simulating the key parameters. The grouting material under investigation herein is a two-component polyurethane polymer, undergoing gel and foaming reactions concurrently, which collectively determine its final structure and properties. Initially, the foaming process yields minimal foam, with the primary body remaining liquid and exhibiting high fluidity; as the reaction progresses, viscosity increases, transforming the liquid into a foam colloid. Subsequently, the foam expands to fill the rockfill pores, followed by further gelation. In this study, the polymer foaming expansion process is simplified as fluid seepage, necessitating parameter determination to describe the flow dynamics. As per regulations, the polymer must have a density not less than 1 g/cm3 and a viscosity not exceeding 1000 mPa·s.
  • Rheological property
Polymer fluid is called complex fluid. Because the main performance of polymer after a chemical reaction is to produce foam and expand, when the foam size is small enough, the foam can be regarded as a diluted foam suspension. It can be regarded as a generalized Newtonian fluid [14]. The characteristic flow velocity is 0.05 m/s, the fluid density is 1000 kg/m3. The corresponding Reynolds number Re is shown in Equation (1):
Re = ρ vL μ = 1000 × 0.05 × 1 0.05 = 1000
In the formula, ρ is the fluid density, μ is the kinetic viscosity, v is the characteristic flow velocity, and L is the characteristic length. At this time, the expansion process of polymer foam can be regarded as laminar flow.
2.
Viscosity
The viscosity of polymer is not only affected by the shear rate, but also by the elastic deformation. Such fluid is called viscoelastic fluid. In order to accurately simulate the expansion process of polymer foams, the Castro–Macosko model [15] is used to characterize the viscosity uf, both η and Eη/Rg are polymer coefficients, C* represents the polymer conversion rate, and C g * denotes the polymer gel conversion rate. The variables a, b, and c are all coefficients of the viscosity model, see Equation (2):
u f = η e ( E η R g T ) · ( C g * C g * C * ) a + b C * + c C * ^ 2
3.
Thermal conductivity.
The thermal conductivity of polymers is often very small. According to the empirical formula [16], the thermal conductivity k of polymers is only related to the density ρ. When the polymer density is greater than 48 kg/m3, see Equation (3):
k = 8.7006 × 10 8 ρ 2 + 8.4674 × 10 5 ρ + 1.16 × 10 2

3.2. Fluid–Solid Coupled Model

The DEM is a simulation method specially used to solve the problem of discontinuous media. The discrete element model is composed of a series of particle units that follow Newton’s second law of motion (Figure 2a). The model particles of the most basic linear elastic model are connected by breakable springs, and the force only appears at the contact points between adjacent particles (Figure 2b,c).
The normal force Fn and the tangential force Fs between the unit particles are realized by the interaction of the spring force, where the normal force Fn is obtained from Equation (4) [17], and the tangential force Fs is obtained from Equation (5) [18].
F n = K n r R , r < r 0   normal   connection ,   a K n r R , r < R   connecting   fracture ,   b 0 ,     r R   connecting   fracture ,   c
In the formula, Kn is the normal spring stiffness, R is the equilibrium distance between particles (the sum of the radius of the two particles), r0 is the fracture threshold, and r is the current distance between particles. When the distance between particles r is less than r0 (Equation (4a)), the particles are normally connected and subjected to tension or pressure; when the distance between particles r is greater than r0 but less than R, the connection is broken, the tension disappears, and there is only a pressure effect (Equation (4b)). When the particle distance r is greater than R, the spring breaks, but when the two particles return to the compressed contact state, the pressure still exists (Equation (4c)).
F s = K s X s
In the formula, Ks is the shear spring stiffness, and Xs is the tangential relative displacement. The tangential force and shear deformation between particles are simulated by a tangential spring perpendicular to the normal spring. Between normally connected particles, the maximum tangential force Fsmax determined by the Mohr–Coulomb criterion is
F smax = F s 0 μ p F n
In the formula, Fs0 is the shear resistance inside the particle, and μp is the friction coefficient. When the tangential external force on the particles is greater than the maximum tangential force Fsmax, the connection between the particles will break. The tangential force Fs is limited to less than or equal to the maximum tangential force Fsmax. Therefore, when the particle connection is broken, Fs should be less than or equal to the limit friction:
F smax =   μ p F n
When the tangential external force is greater than the ultimate friction force F s m a x , the two particles begin to slide relatively, and the sliding friction force is equal to F s m a x . If the two particles are separated by fracture, all the forces between them will become 0.
In MatDEM, particles are usually given five macromechanical properties of materials: Young’s modulus E, Poisson’s ratio v, compressive strength Cu, tensile strength Tu, and internal friction coefficient μ. According to the macro–micromechanical transformation formula [19] in MatDEM, the micromechanical parameters of the material can be determined, such as the positive stiffness Kn, the tangential stiffness Ks, the fracture displacement Xb, the initial shear force Fs0, and the friction coefficient μp, see Equations (8)–(13).
K n = 2 Ed 4 1 2 ν
K s = 2 1 5 v Ed 4 1 + v 1 2 ν
X b = 3 K n + K s 6 2 K n K n + K s T u d 2
F s 0   = 1 2 μ p 6 C u d 2
μ p = 2 2 + 2 I 2 + 2 I
I   = [ ( 1 + μ i ) 1 2 + μ i ] 2
MatDEM uses a multi-field fluid–solid coupling method based on the DEM-PNM—Pore density flow model. The basic step is to first stack a basic discrete element model (Figure 3a) and then identify the pores (gaps between discrete particle systems, also known as fluid domains) and pore throats (channels connecting pores) in the discrete element model. Pores and pore throats form a pore network (Figure 3b), and finally, the divided pore network is applied to the fluid–solid coupling model (Figure 3c).
In the fluid–solid coupling model, fluid and solid particles interact. The displacement of particles occurs due to differences in fluid pressure, which alters the state of pores, their throat areas, and certain permeability coefficients. These changes, in turn, influence the fluid’s condition. The coupling process is segmented into three phases: the effect of fluid on solid particles, the impact of solid particles on fluid, and the reorganization of the pore network. Surrounding solid particle D, four pores, P1 to P4, exist. By assessing these pores’ pressures, the resultant force F exerted by the fluid on solid particles can be determined. Initially, the force on the particle element, including F, is calculated, allowing the determination of particle velocity and displacement. As particles move due to fluid forces, each pore’s volume is recalculated. An increase in fluid pressure in P1 to P3 causes particle D to move toward the lower right, driven by F. This movement results in modifications to the pore network, affecting fluid density and pressure. Specifically, as particle D shifts to the lower right, the volume of P4 reduces, and the density and pressure of the fluid in the pore increase. Conversely, the volumes of P1 to P3 expand, and the fluid pressure in the pores decreases. Each iteration alters the distances between solid particles, leading to the disappearance of some pore throats and the formation of new ones. Consequently, the original pore network is segmented and reassembled; pores P1 to P3 merge into P5, while pore P4 is divided into P6 and P7 (Figure 4).

4. Establishment of Fluid–Solid Coupling Model

4.1. Simulation Method

The simulation of grouting in dam construction is divided into two main stages. The first stage involves simulating the rockfill body at the dam’s crest. Utilizing the theory of porous media, the grouting process is conceptualized as diffusion within porous materials. These materials are defined as solids containing numerous pores, which may be interconnected, partially closed, or entirely isolated. In the rockfill body, the initial aggregation of stones or particles creates spaces that form the structure of the porous medium, thus classifying the rockfill as such. The second stage focuses on simulating the injection process of polymer foam grouting. This stage emphasizes the expansion and filling of pores by polymer foam post-foaming. The numerical model primarily replicates the flow and filling behavior of polymer foam within the rockfill’s pores post-expansion. For simplification in numerical simulation, the foam is assumed to be a homogeneous fluid, discounting the heterogeneity arising from the incomplete blending of different material components. There is no prefabricated model of the rockfill bodies and the high polymer model in MatDEM, so the model-building process requires secondary coding based on the operational functions in MatDEM.

4.1.1. Rockfill Materials Accumulation Part

Rockfill bodies are a typical granular material. To further study its properties, an idealized rockfill bodies model is constructed. In the proposed model, each particle within the rockfill body is treated as an ideal rigid body. Circular particles of varying sizes are randomly generated within a specified radius range, with no consideration given to particle fragmentation. The interaction between these particles is governed by a linear elastic contact model. Moreover, the model restricts particle contacts to a limited area and permits slight overlap at the contact points to enhance simulation accuracy. To mitigate the effects of varying compaction levels on the macroscopic strength and deformation characteristics of the material, a relative density control method is employed during model preparation, ensuring that the model’s relative density achieves 90%. The macroscopic mechanical properties of the rockfill materials are selected based on actual engineering data, and the corresponding micromechanical parameters are derived from the material training module of MatDEM. Both macro and micro parameters are calibrated to accurately represent the primary mechanical characteristics of rockfill, as detailed in Table 1.

4.1.2. Fluid–Solid Coupling Part

The model mainly simulates the flow expansion process of the polymer foam. After the generation of the grouting hole model in the previous section, its model data are imported and the grouting simulation of the polymer is carried out using the pore density flow method. Using programming language, the polymer parameters are set first, followed by constructing the pore system to turn on the fluid–solid coupling, subsequently applying the grouting pressure and grouting time, and then setting the required data to be acquired, and finally starting the cycle for simulation. Initially, the polymer is in a fluid state. The initial state of the polymer is a flowing liquid. After being sprayed out, it reacts with the water in the air to form a uniform foam and expands rapidly. Finally, it relates to form a semi-rigid structure. In the simulation, the process of displacing the air with polymer foam is simplified to air replacement. Furthermore, during the diffusion process, the permeability coefficient of the rockfill is crucial. The permeability characteristics are linked to the diameter of the pore throats, which are represented in the pore density flow model. The seepage coefficient for the rockfill body is given by Equation (14):
k = 106 n 3 d 20 2
In the formula, n is the porosity and d20 is the equivalent diameter of the rockfill bodies. For the definition of the polymer material parameters, the density of the polymer is not less than 1 g/cm3 and the viscosity is not greater than 1000 mPa·s.

4.2. Calculation Scheme

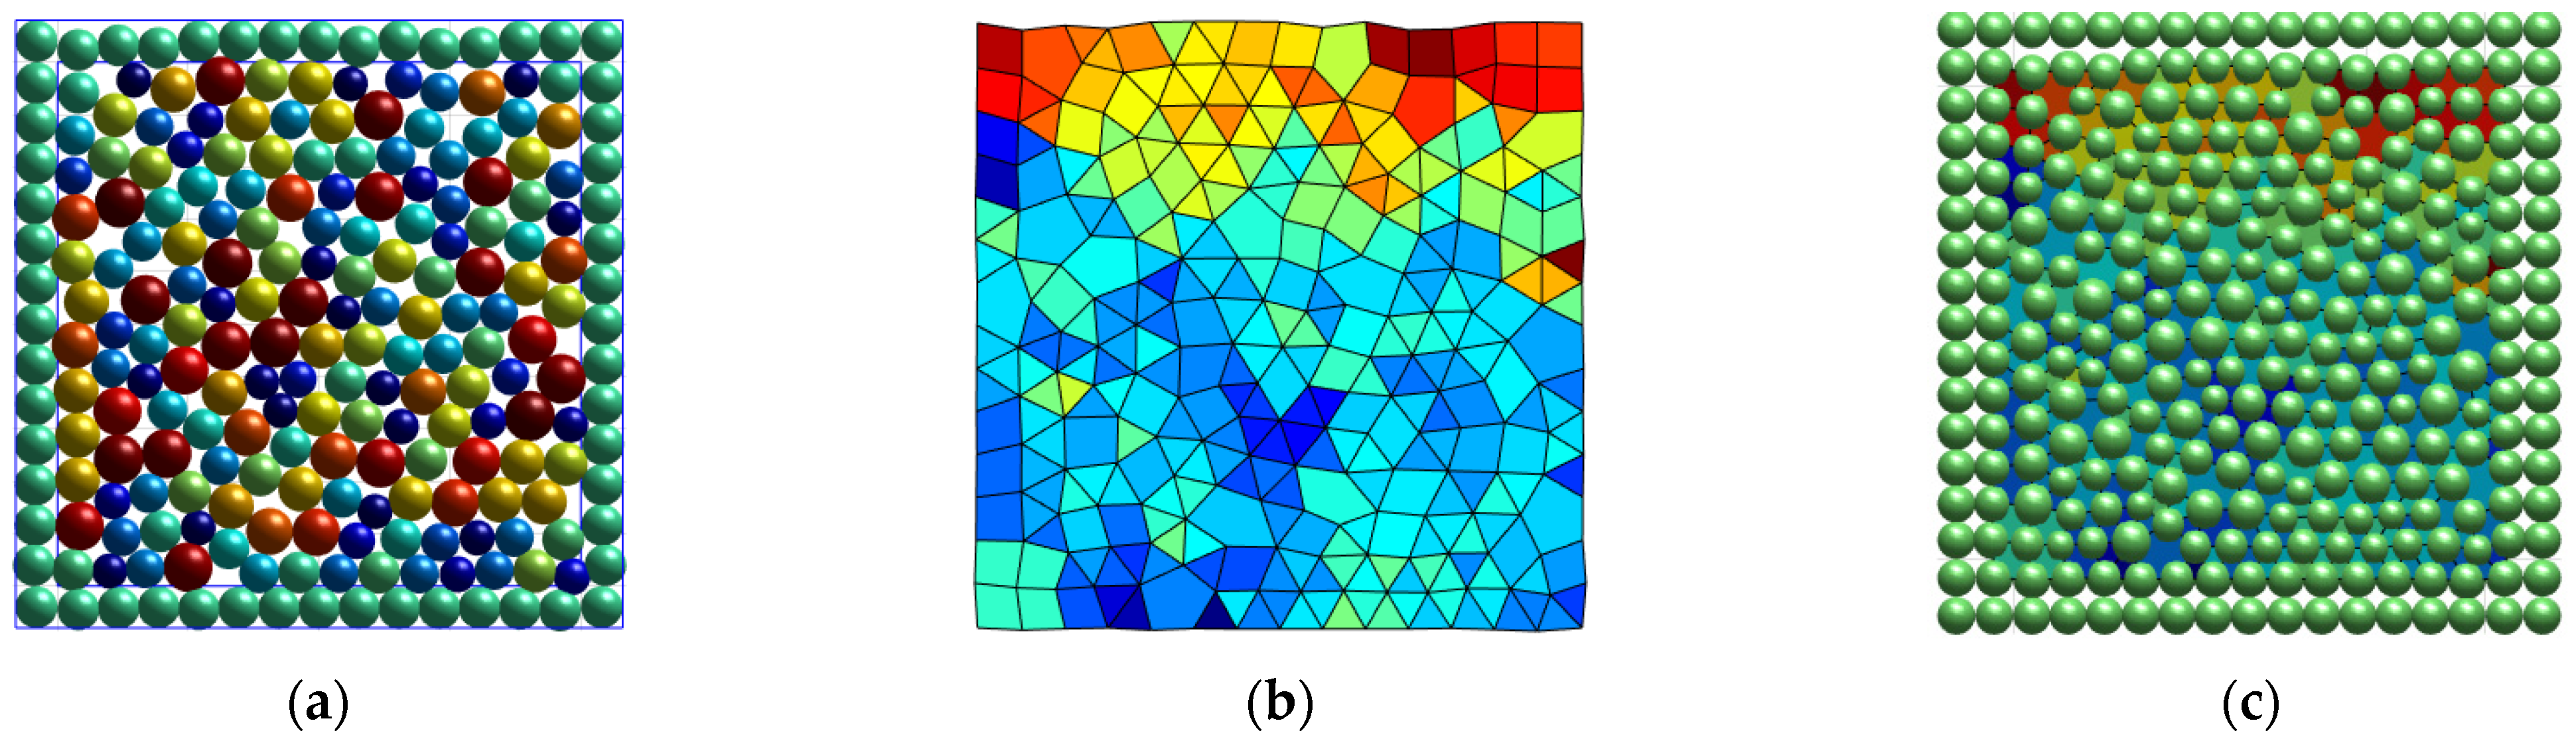
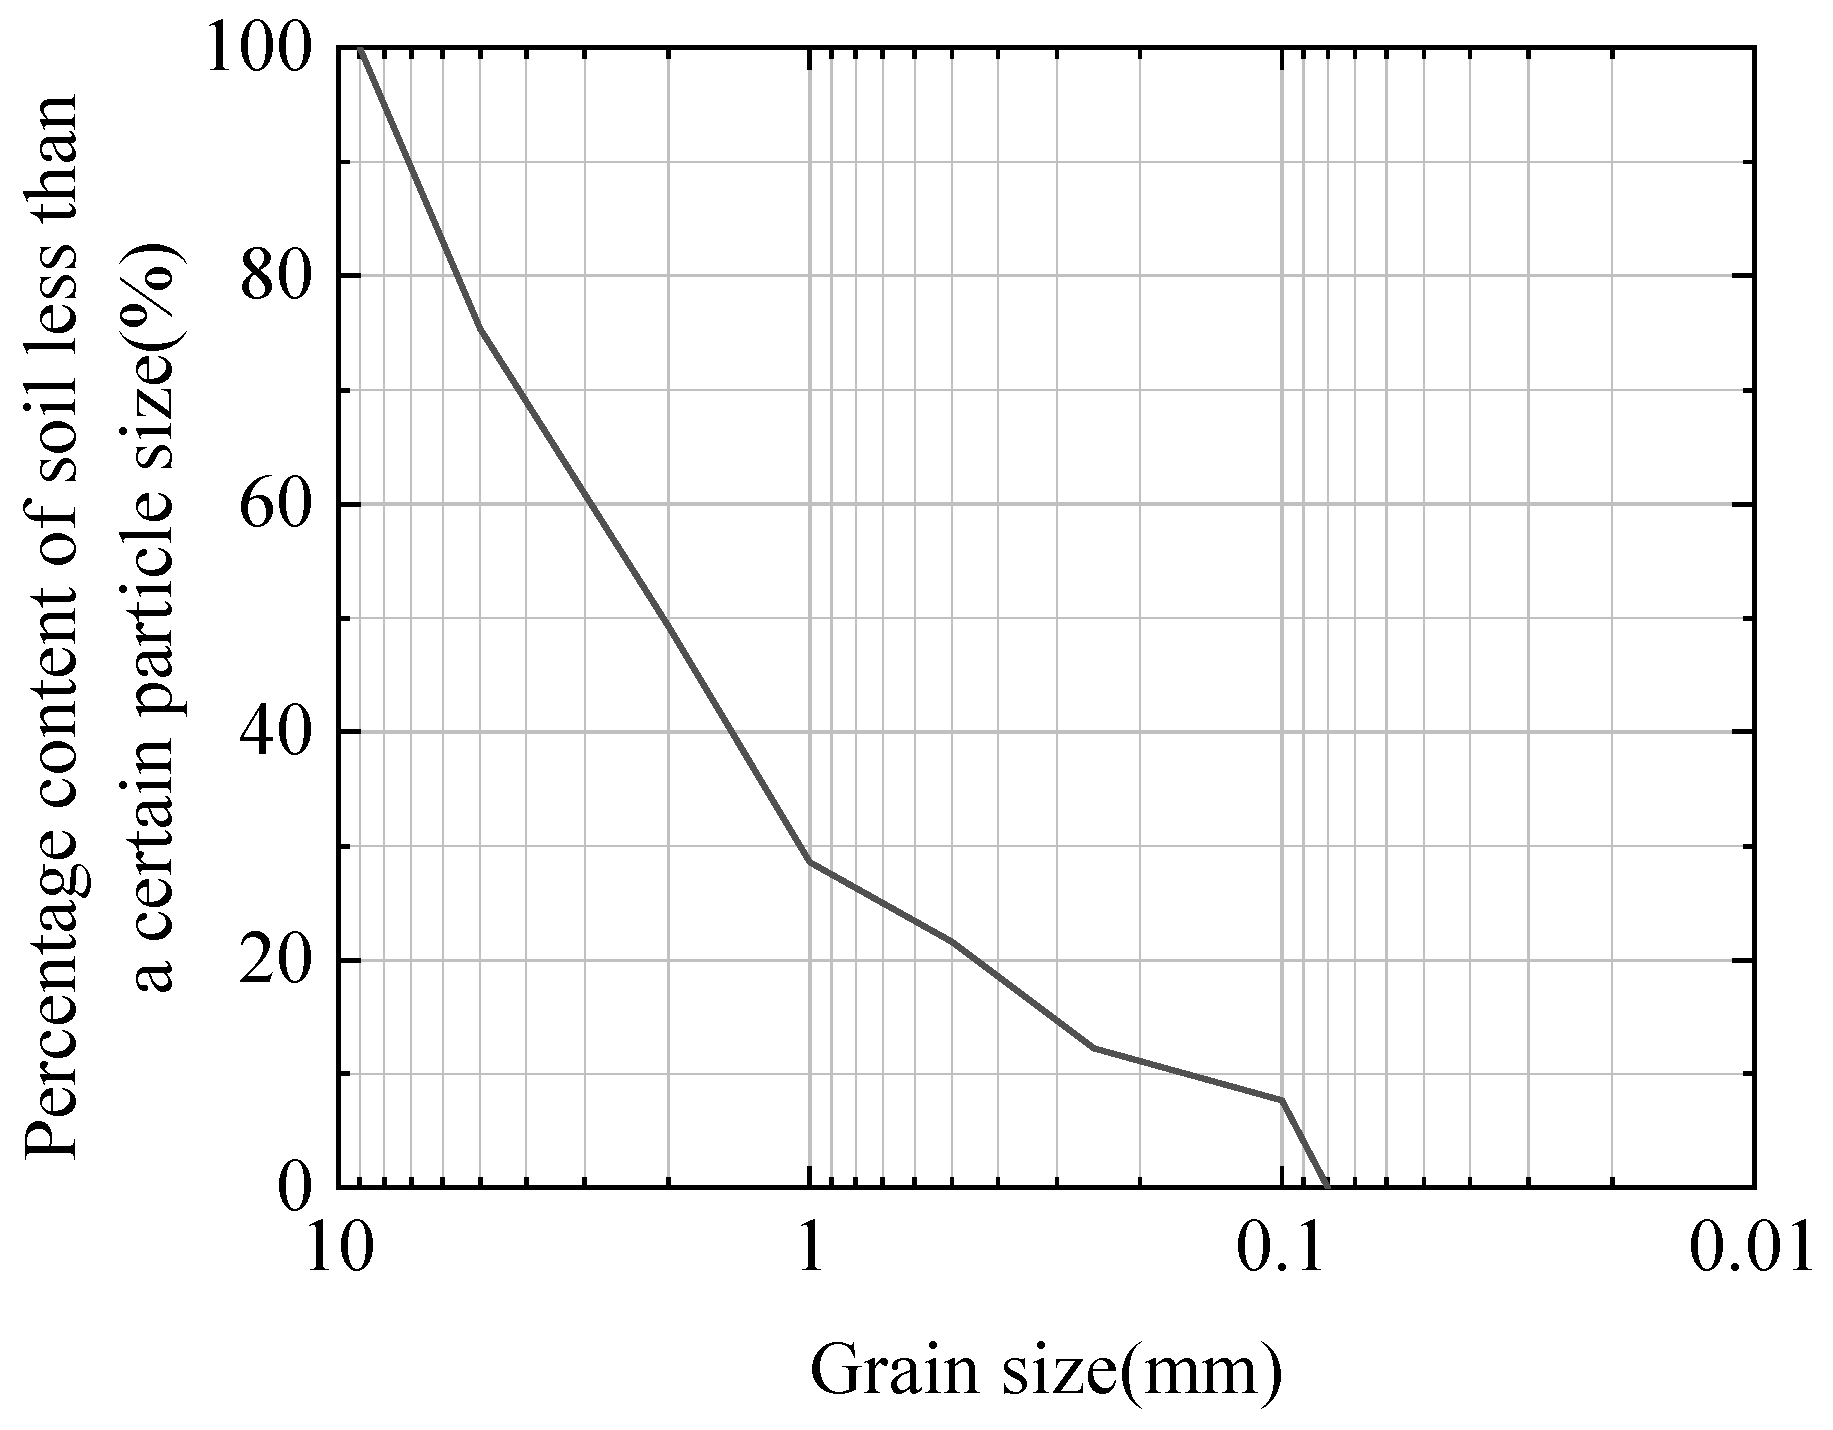
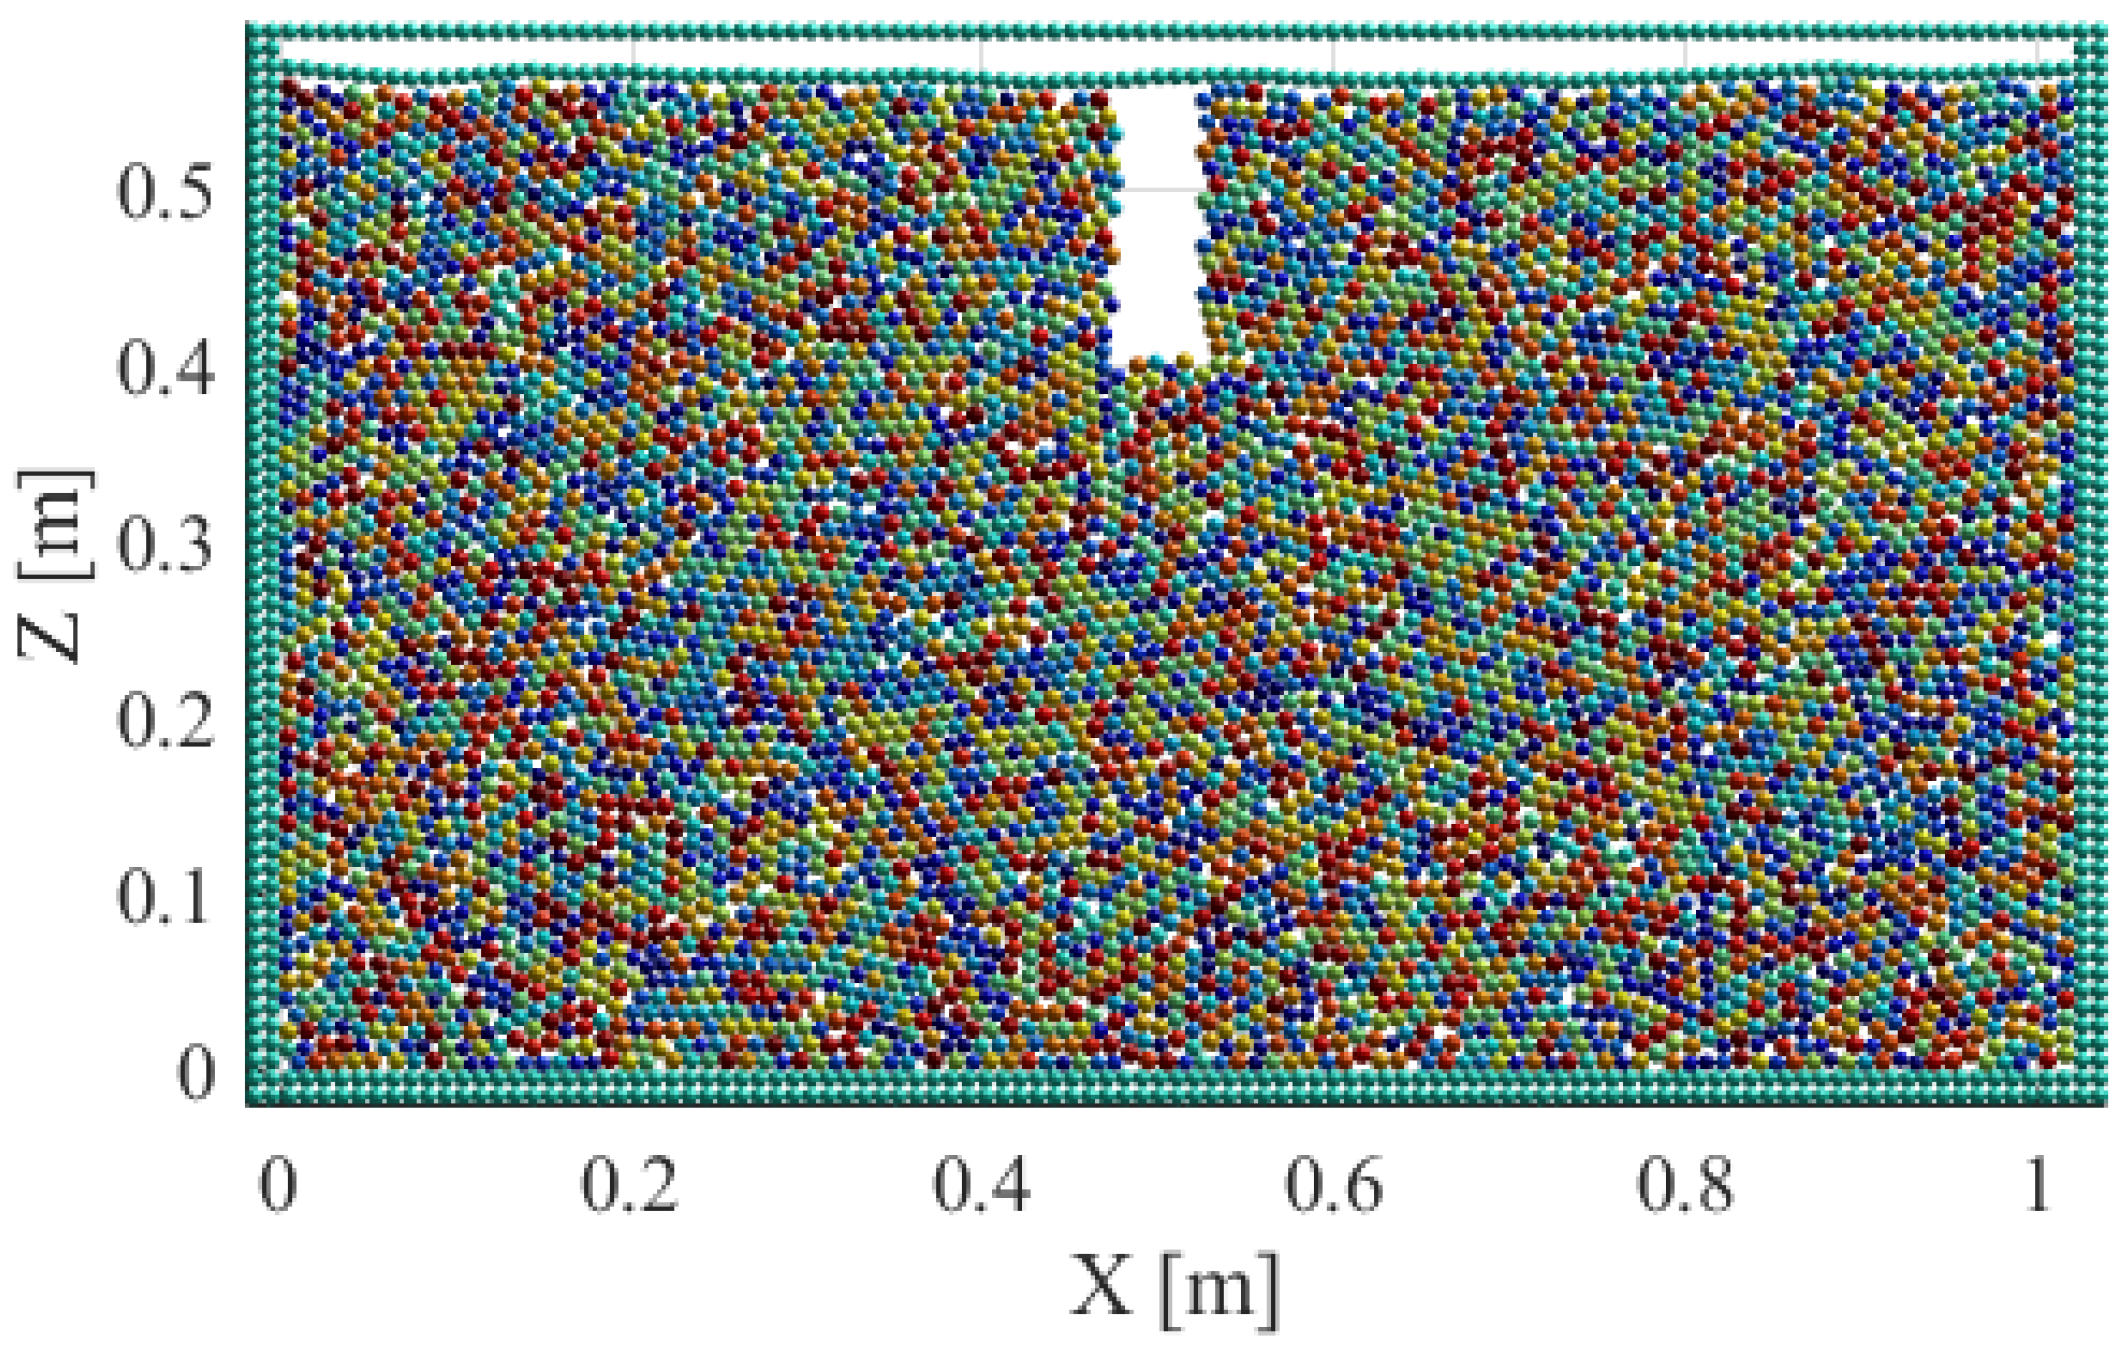
  • Model Box and Particle Generation: The model box uses boundary particles instead of boundaries to limit the particles within the model, apply boundary conditions, and construct the fluid domain. The thickness is, by default, two average unit particles. All degrees of freedom of the left boundary, right boundary, and lower boundary particles of the model box are constrained to simulate the real state of the model box. Subsequently, surrounding pressure is applied to the upper boundary to simulate the rolling process of rockfill materials. In the discrete element numerical simulation of the rockfill body, it is crucial to select an appropriate particle size range, as the minimum stable time step decreases significantly with smaller particle sizes. For this simulation, a model box measuring 1000 mm × 600 mm was created. The average particle size is set at 5 mm, with a particle diameter dispersion coefficient of 9, leading to a maximum particle size of 9 mm and a minimum of 0.09 mm. A total of 6581 rockfill particles were generated, with fine particle content under 5%, a non-uniformity coefficient (Cu) of 18.75, and a curvature coefficient (Cc) of 2.3, classifying the gravel as well-graded (GW). The gradation curve of the rockfill material is depicted in Figure 5.
The particle diameter dispersion coefficient can be obtained from Equation (15):
r max r min = 1 + rate 2
In the formula, rmax is the maximum particle diameter, rmin is the minimum particle diameter, and the rate is the particle diameter dispersion coefficient.
2.
Compaction Deposition Process: To achieve a random distribution of particle units within the simulation box, particles are initially subjected to random velocities before the compaction process to ensure a natural layout. Subsequently, gravity is applied, allowing the particles to naturally accumulate under its influence. Finally, 10 periods of gravity compaction were carried out to complete the whole compaction deposition process and ensure the close accumulation of particle units.
3.
Preparation for Simulation: before assigning material parameters, the model’s unit gravity is incrementally reduced, divided by 10 in each step, and the system is balanced 200 times, followed by an additional balance, before finally saving the model data (Figure 6).
4.
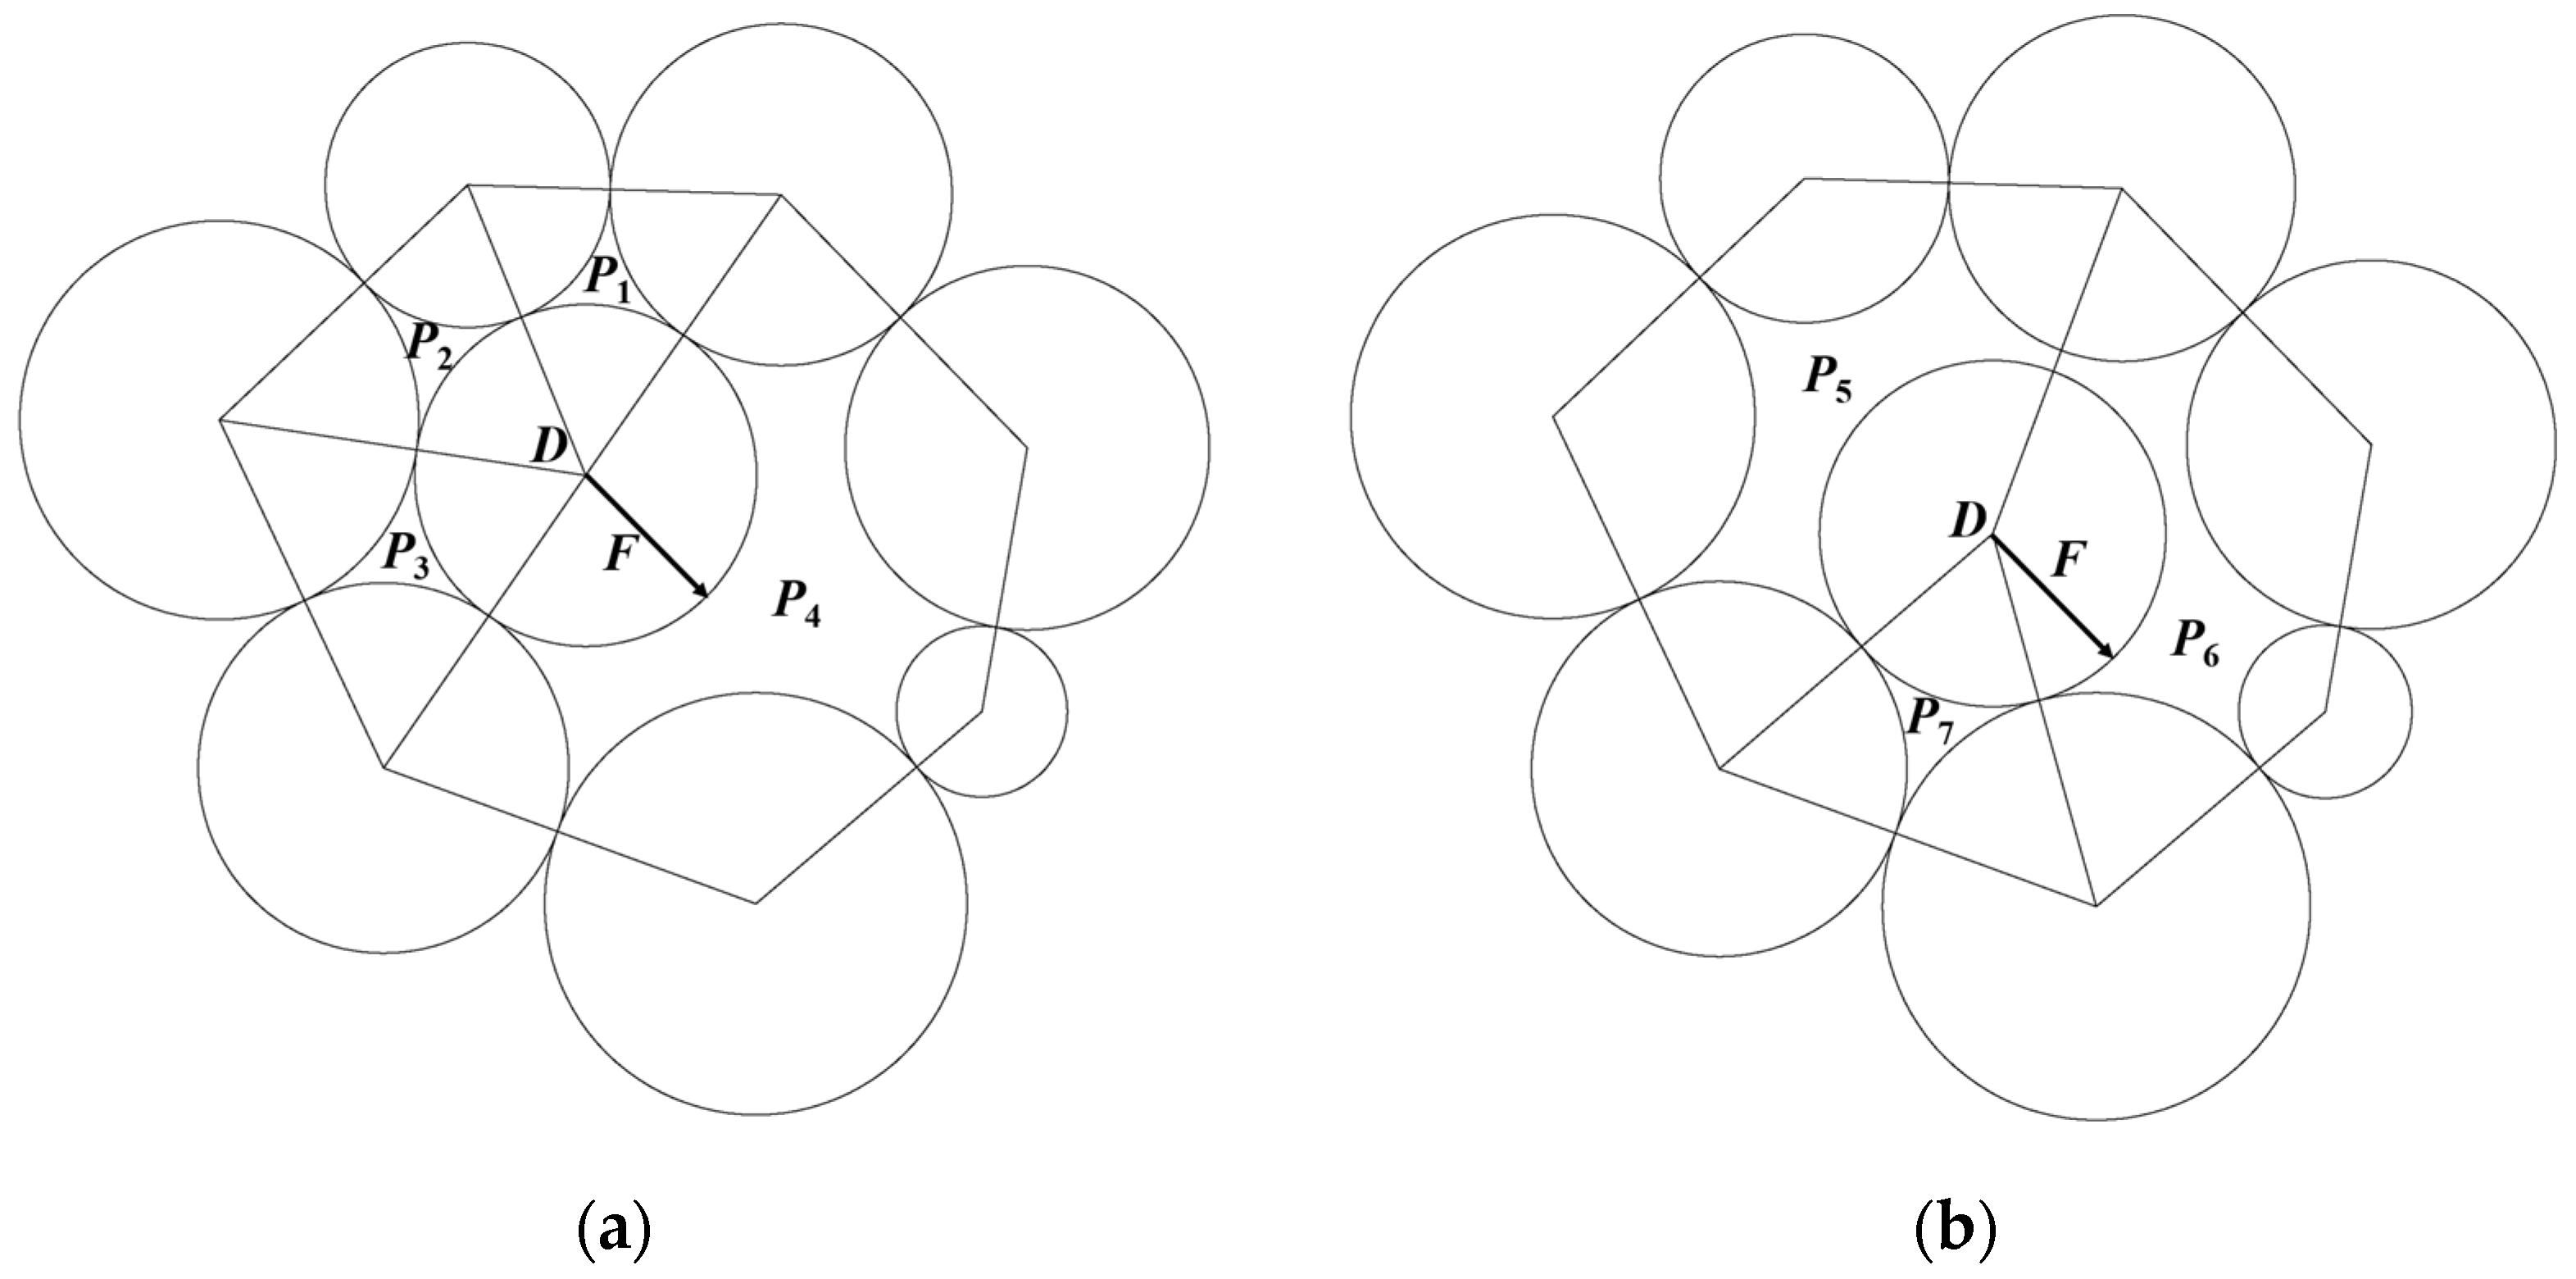
Creation of the Grouting Hole: Post-import of the basic accumulation model data, coordinates of rockfill particles are documented. Particles within specified ranges (mZ > 0.4 m, 0.48 m < mX < 0.52 m) are filtered and removed to establish a grouting hole measuring 40 mm in diameter and 15 mm in depth. Subsequently, material parameters are set for the rockfill model, and the ‘breakGroup’ function is employed to sever all particle connections, rendering the model a granular body. The ‘addFixId’ function is then utilized to filter and secure particles within a specific range, simulating the section of the grouting pipe inserted into the grouting hole. Model data are then saved (Figure 7).
5.
Polymer Grouting Simulation: Inside the grouting hole, polymer grouting simulation is initiated with the polymer set at a density of 1000 kg/m3 and a viscosity of 0.9 Pa·s. The area is subjected to a consistent grouting pressure of approximately 1 MPa. The model’s computational timestep is set at 1 × 10⁻⁶ s, with each cycle iterating 1000 times. The loading cycle is 0.001 s, repeated ten times, totaling a simulation time of 0.01 s. Based on the principle of similarity, a real-time grouting period of approximately 10 s is simulated by scaling 0.01 s by a factor of 1000 to achieve 10 s.

5. Feasibility Verification of the Model

To evaluate the feasibility of the MatDEM software for numerical simulation, this analysis will verify the stress–strain characteristics of rockfill materials before and after incorporating polymers and the diffusion pattern and range of polymer grout separately:
  • Stress–strain characteristics: utilizing parameters from an indoor static triaxial test [13] (Table 2), we examined the stress–strain curves of rockfill materials before and after adding polymers under 100 kPa confining pressure, compared the simulation results with the results of indoor tests, and verified the rationality of the model. (Figure 8).
After the addition of polymer, the deviatoric stress increased with the increase of axial strain and then tended to be stable. At the same time, the addition of polymer changed the shape of the stress–strain curve of rockfill materials. After comparison, the stress–strain curve obtained from the model is more consistent with the change rule of the stress–strain curve of the indoor test, although there is still a part of the error; considering the existence of the error of the numerical model, it can still be a better verification of the reasonableness of the model.
2.
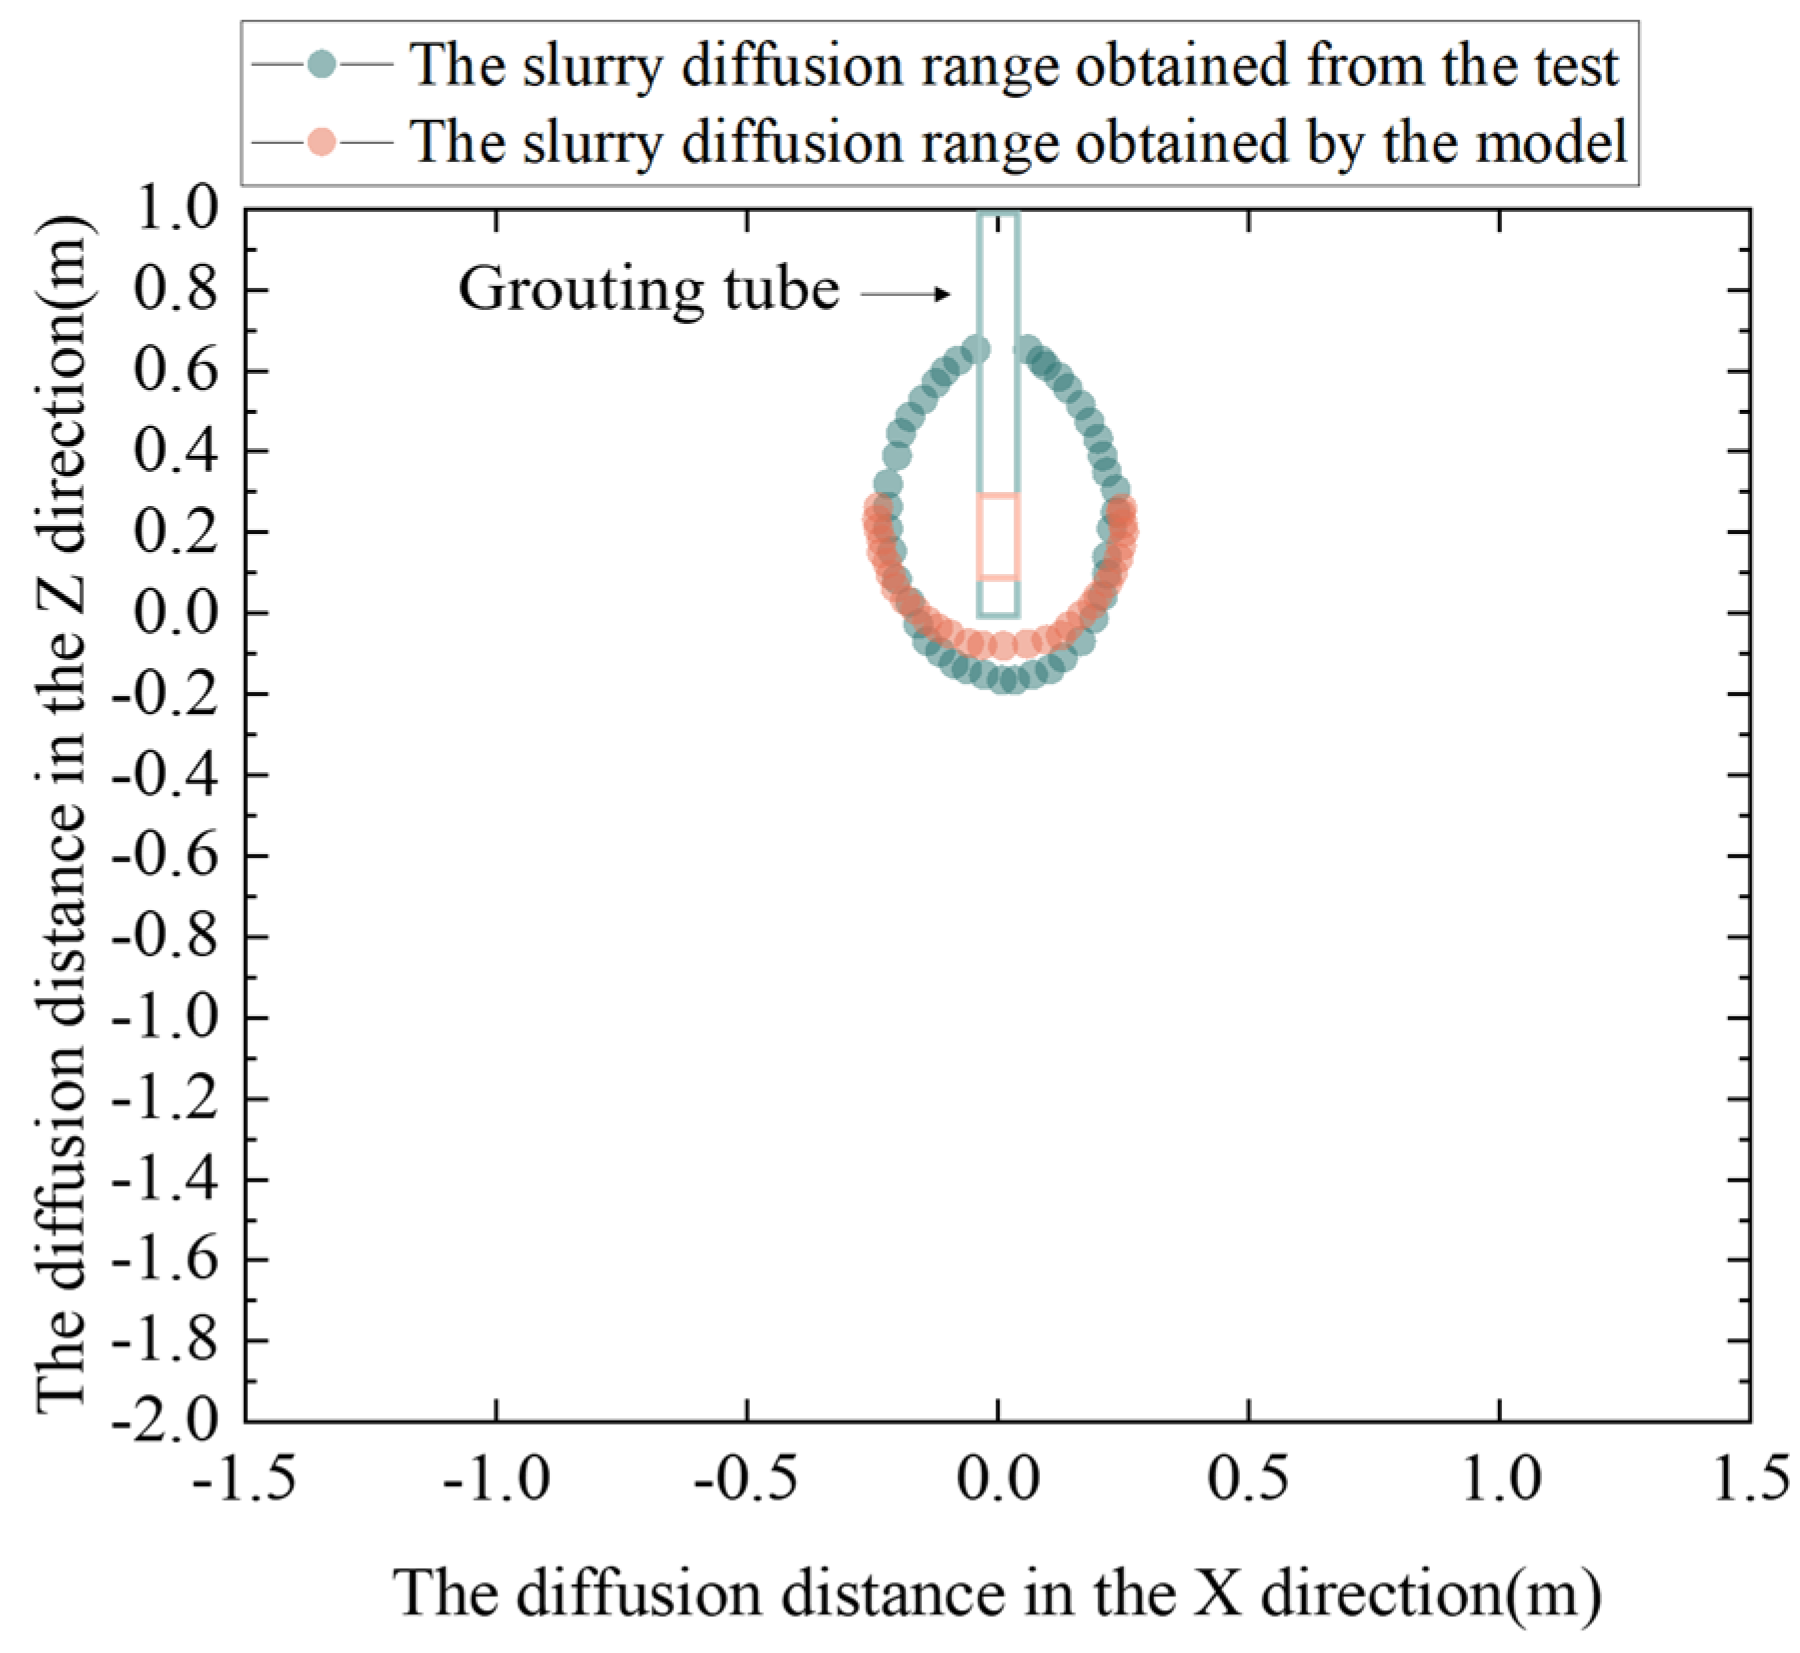
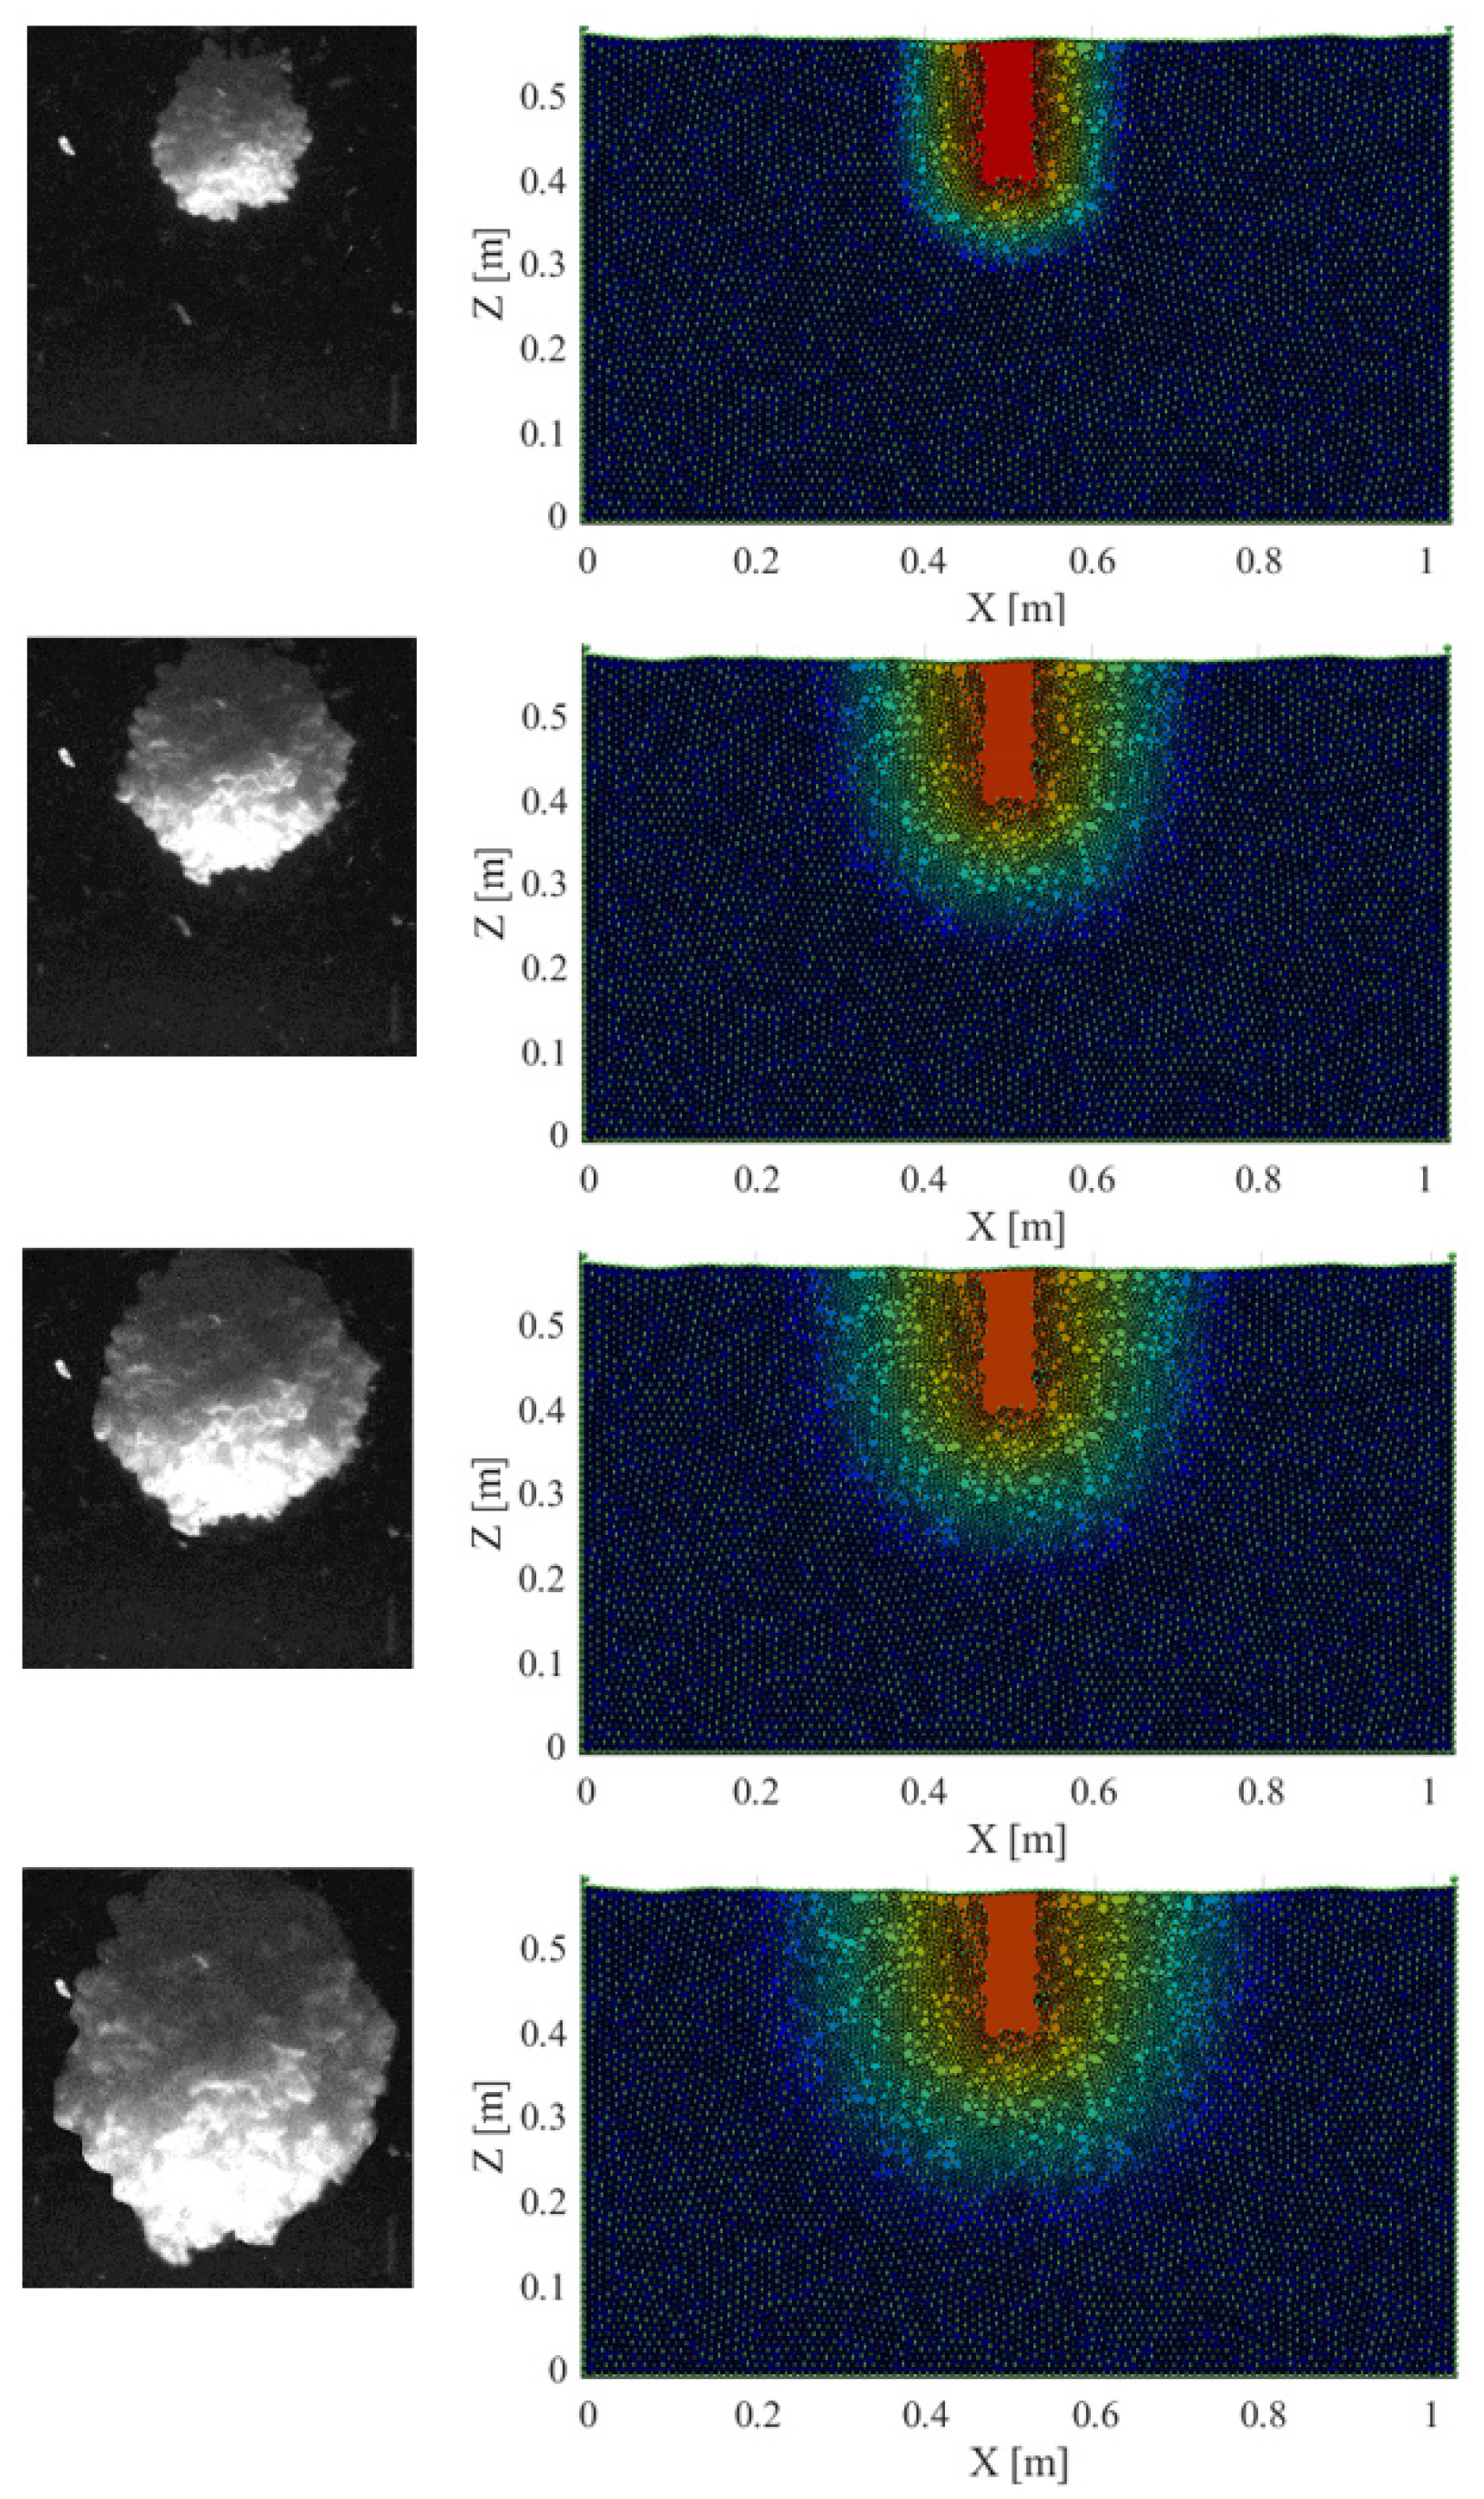
Slurry diffusion form and scope: Because there is no polymer direct grouting rockfill materials test, the simulation was carried out according to the parameters of an indoor polymer grouting transparent soil test [20] (Table 3). The slurry diffusion range and slurry diffusion form obtained by the model were compared with the test results to verify the rationality of fluid–solid coupling (Figure 9 and Figure 10).
Through comparison, it can be concluded that the slurry diffusion range simulated by the fluid–solid coupling model is similar to the slurry diffusion range obtained by the test in the X direction and there is a slight difference in the Z direction, but it can still verify its rationality well. Meanwhile, the slurry diffusion pattern obtained from the model simulation is similar to that obtained from the test, both exhibiting a “U” shape whose width in the middle expands over time while the lower portion of the slurry spreads outward. This behavior is consistent with the diffusion characteristics of polymer grouting, thereby affirming the accuracy of the numerical simulation method.

6. Simulation Result Analysis

6.1. Analysis of Slurry Diffusion Morphology

Taking a grouting pressure of 1 MPa as an example, this study analyzes the dynamic grouting process of polymer in a rockfill from a vertical profile perspective (Figure 11). The diffusion of polymer foam within the rockfill is categorized into three stages:
  • At 1 s, the slurry predominantly gathers near the grouting hole, forming a nascent “U” shape. Initially, under the influence of grouting pressure, the slurry fills the grouting hole and adjacent voids. At this stage, diffusion is restricted, primarily influenced by the grouting hole diameter and pressure.
  • Between 2 and 6 s, as grouting progresses, the slurry diffusion range rapidly expands, creating a pronounced “U” shape. This expansion suggests an acceleration in the slurry’s diffusion rate within the rockfill body. In the X direction, diffusion is notably more extensive near the surface, likely due to the looser structure and higher porosity at the surface, which facilitate easier slurry movement.
  • From 7 to 10 s, in the later stages of grouting, the rate of slurry diffusion gradually decreases and eventually stabilizes. This deceleration indicates that the available voids within the rockfill are becoming filled, limiting further diffusion. Nonetheless, the inherent permeability and diffusivity of polymer foam allow it to maintain a consistent diffusion rate even as the process nears completion.
In conclusion, the diffusion of polymer foam in rockfill exemplifies a typical infiltration grouting process. The slurry initially forms a small “U” shape at the grouting hole, then rapidly expands to create a large, opening “U” shape, and maintains a stable diffusion rate in later stages. This behavior aligns with infiltration grouting theory and enhances our understanding of polymer foam diffusion dynamics within rockfill.

6.2. Influence of Different Grouting Pressures

To examine the effects of various grouting pressures on polymer grouting, changes in slurry diffusion range (areas X1 to X5), porosity (areas X1 to X5), regional porosity (areas X1 to X5), and regional stress (areas X1 to X3) before and after grouting were analyzed under five distinct constant grouting pressures: 0.1, 0.3, 0.5, 0.7, and 0.9 MPa (Figure 12).

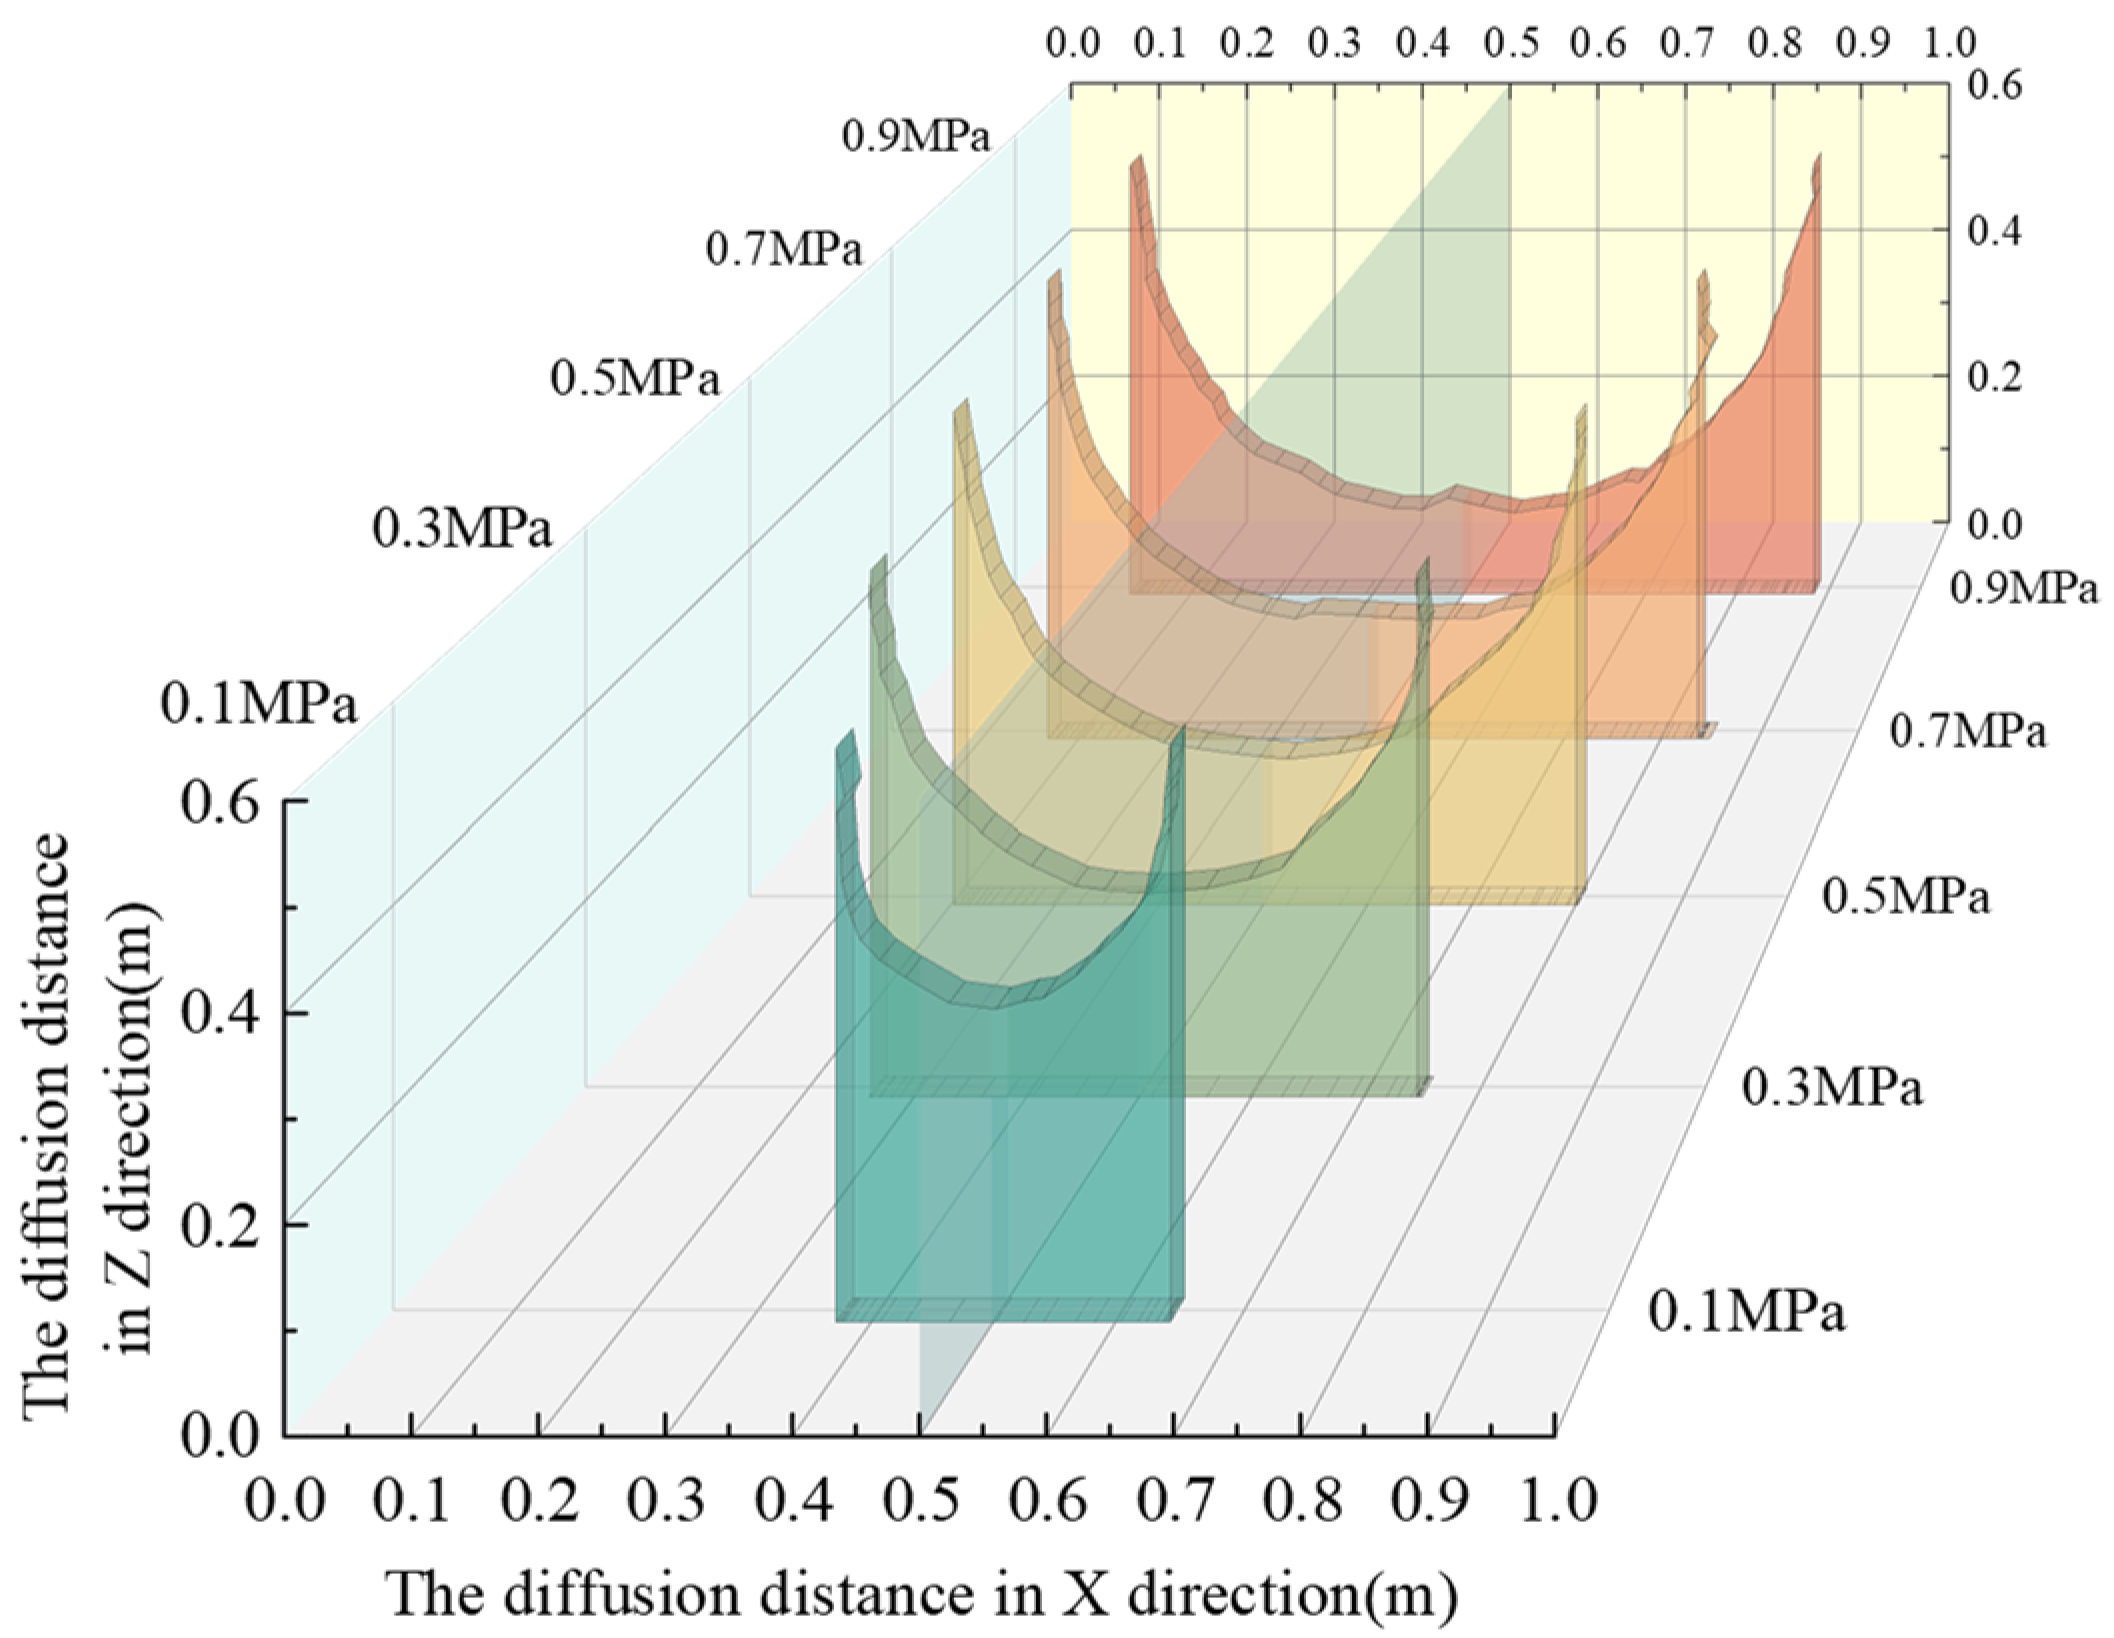
6.2.1. Variation of Slurry Diffusion Range

Under different grouting pressures, the diffusion range of the slurry is affected variably.
Analysis of Figure 13 reveals that at a constant grouting pressure, the diffusion range in the Z direction exceeds that in the X direction. As grouting pressure increases, changes in the Z direction are more pronounced than in the X direction, and this difference becomes increasingly significant. Specifically, when grouting pressure rises from 0.1 MPa to 0.3 MPa, the expansion in both the X and Z directions becomes more noticeable, with an enhanced “U” shaped opening in the X direction. This increase in grouting pressure can overcome internal resistance within the rockfill body, facilitating slurry diffusion over greater distances.
However, as grouting pressure escalates from 0.3 MPa to 0.7 MPa, the change in slurry diffusion range stabilizes. During this phase, although the increase in grouting pressure continues to positively affect slurry diffusion, the degree of influence gradually diminishes. This is because, as grouting pressure increases, the voids within the rockfill body are progressively filled, and the pathways for slurry diffusion become restricted.
Further increase in grouting pressure from 0.7 MPa to 0.9 MPa results in a diminished change in the slurry diffusion range, especially below the grouting hole where the effect is minimal. In this high-pressure stage, the additional grouting pressure has a limited impact on diffusion range expansion. At this point, most gaps within the rockfill body have been filled, and the channels for slurry diffusion are further restricted, leading to less pronounced changes in diffusion range.
In summary, at lower pressures, the slurry diffusion range increases significantly with rising pressure; under medium pressures, the change in the slurry diffusion range tends to stabilize; and under higher pressures, the expansion of the slurry diffusion range becomes limited. Additionally, experimental results also indicate that the diffusion range in the Z direction is larger than in the X direction, and changes in the Z direction are more sensitive to variations in grouting pressure.

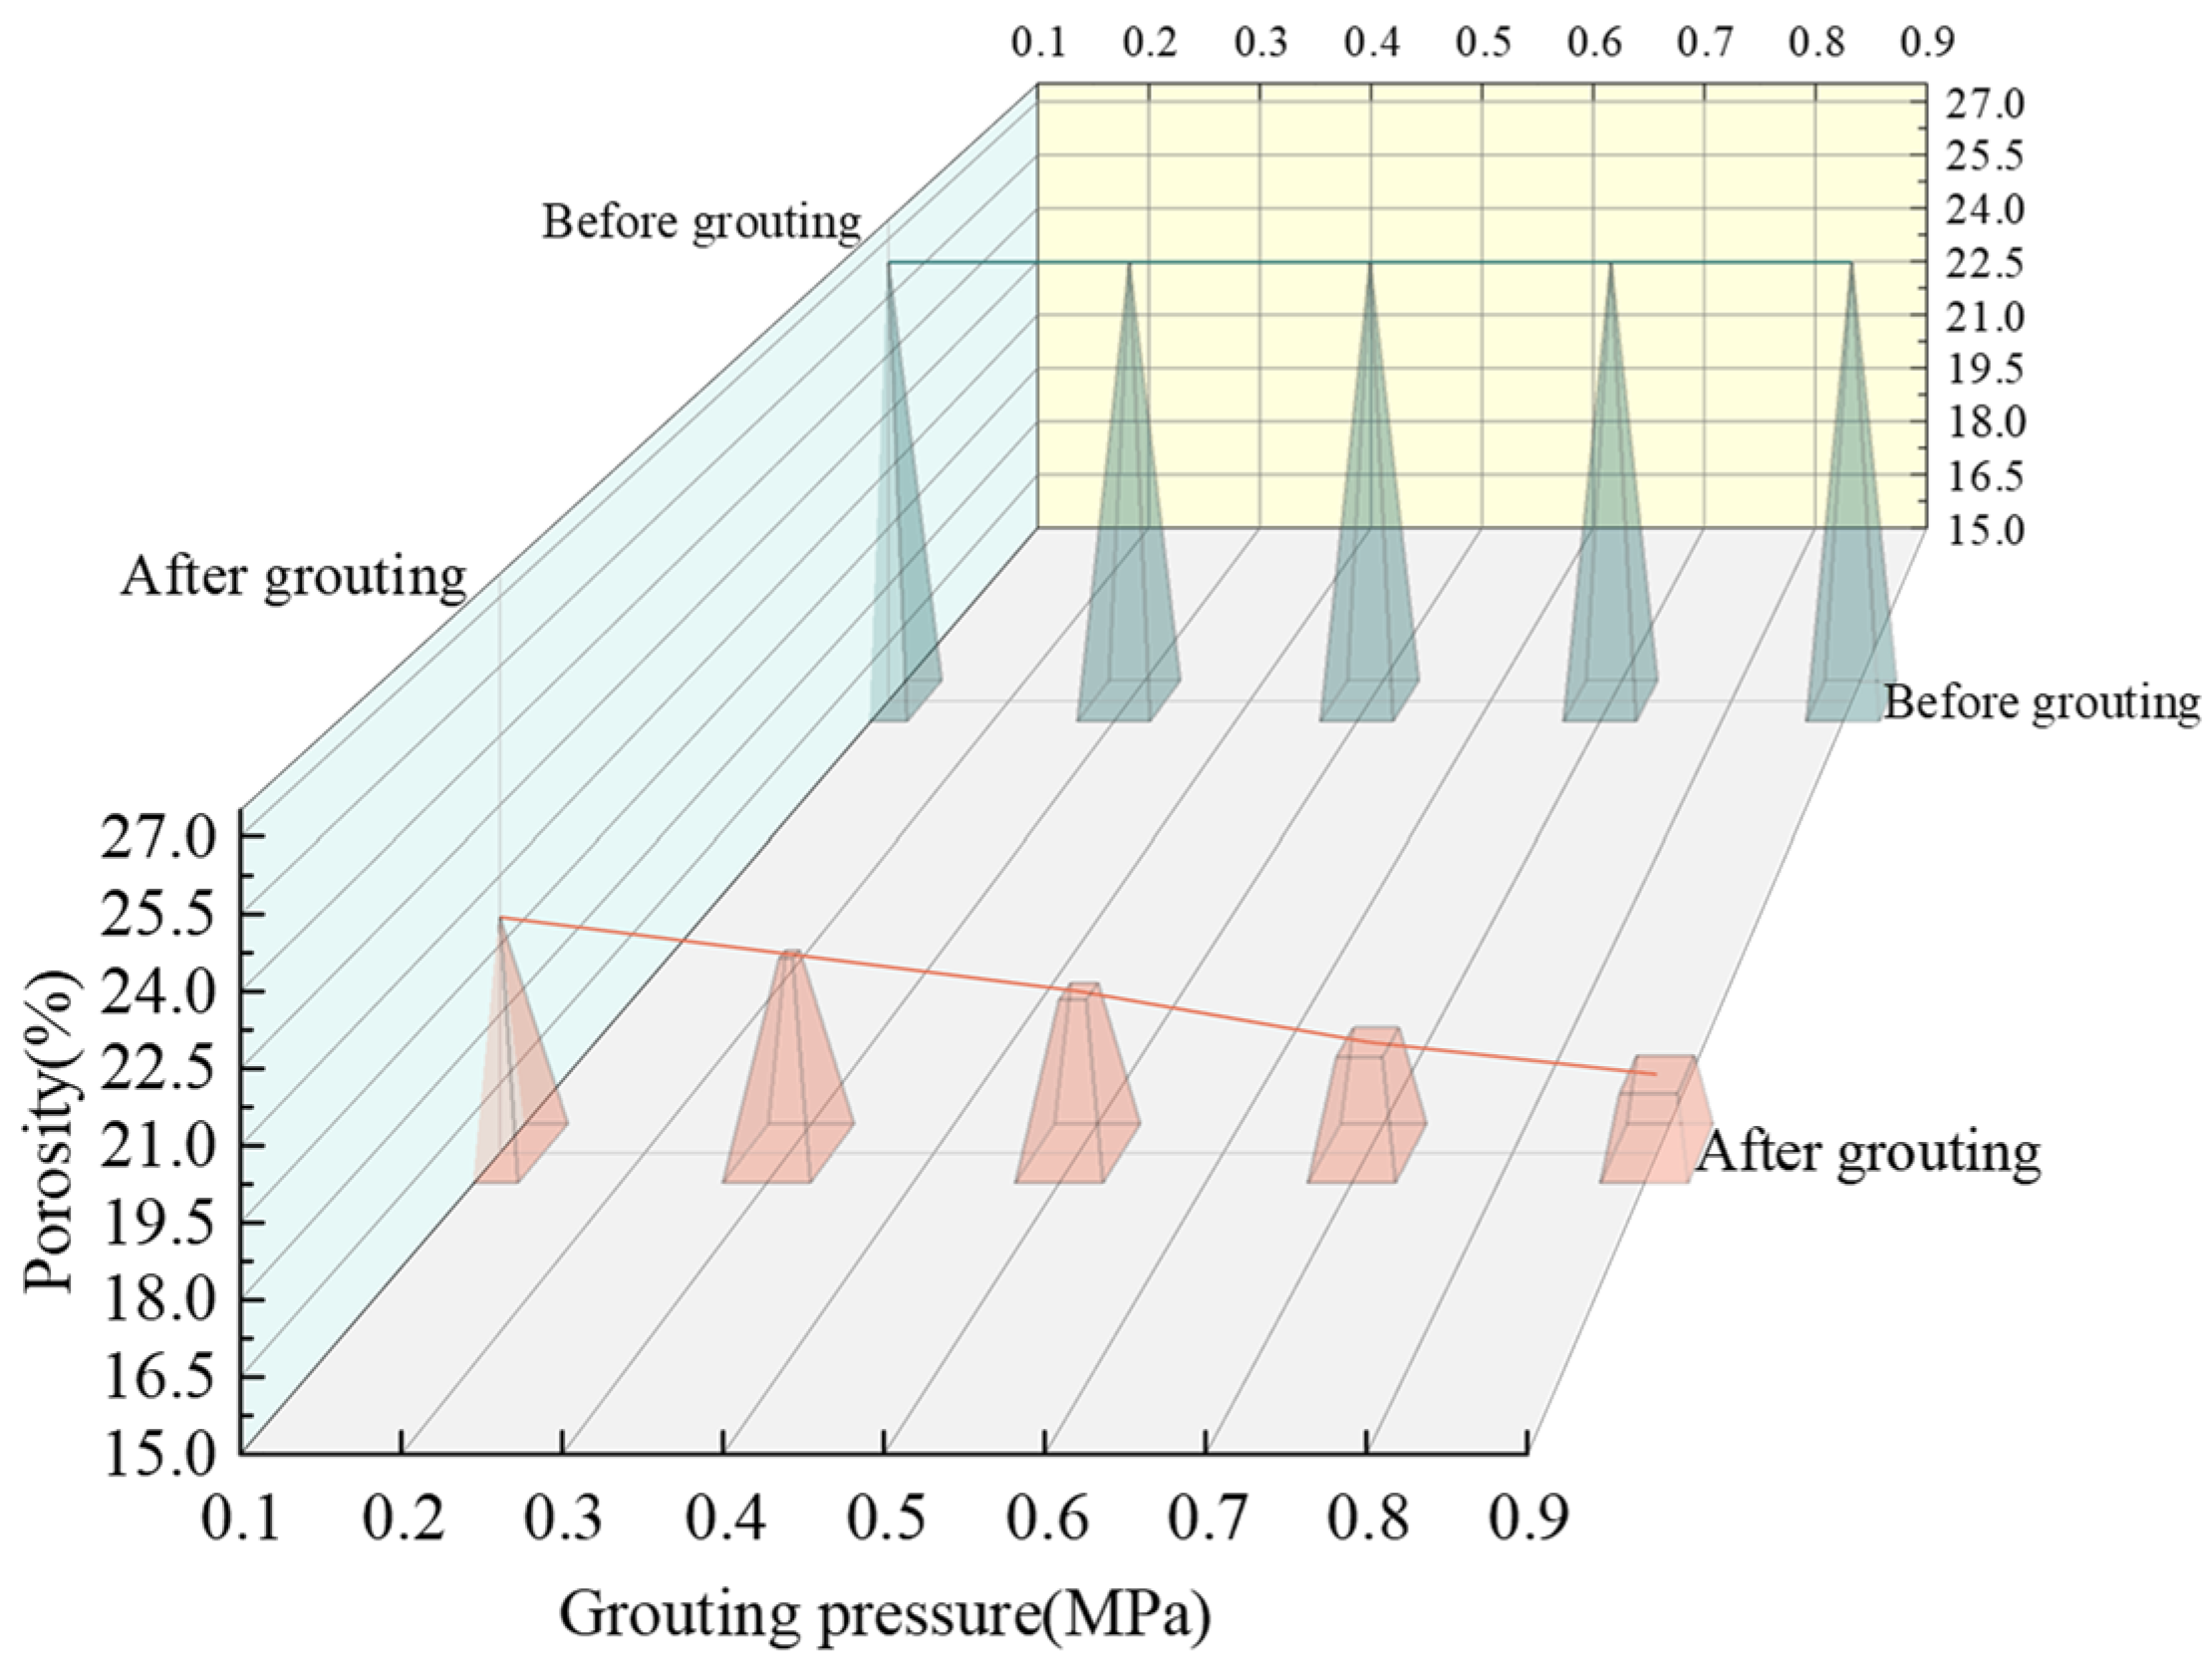
6.2.2. Changes in Overall Porosity

The change in porosity during the grouting process reflects both the slurry’s ability to fill pores and the resulting compactness of the material post-grouting.
From the above figure (Figure 14), it can be seen that the porosity under different grouting pressures after grouting is reduced. The porosity decreases by 6.3% before and after grouting under a pressure of 0.1 MPa, by 7.1% under 0.3 MPa, by 7.9% under 0.5 MPa, by 9.0% under 0.7 MPa, and by 9.7% under 0.9 MPa. Analyzing the results reveals a direct correlation between grouting pressure and porosity changes. As grouting pressure progressively increases, there is a corresponding rise in the degree of porosity reduction. At a lower grouting pressure, such as 0.1 MPa, the decrease in porosity is relatively modest because this pressure level does not provide sufficient force to propel the slurry deeper into smaller pores. However, with higher grouting pressures, the slurry can penetrate more effectively into the finer pores of the rockfill, leading to a more significant reduction in porosity.

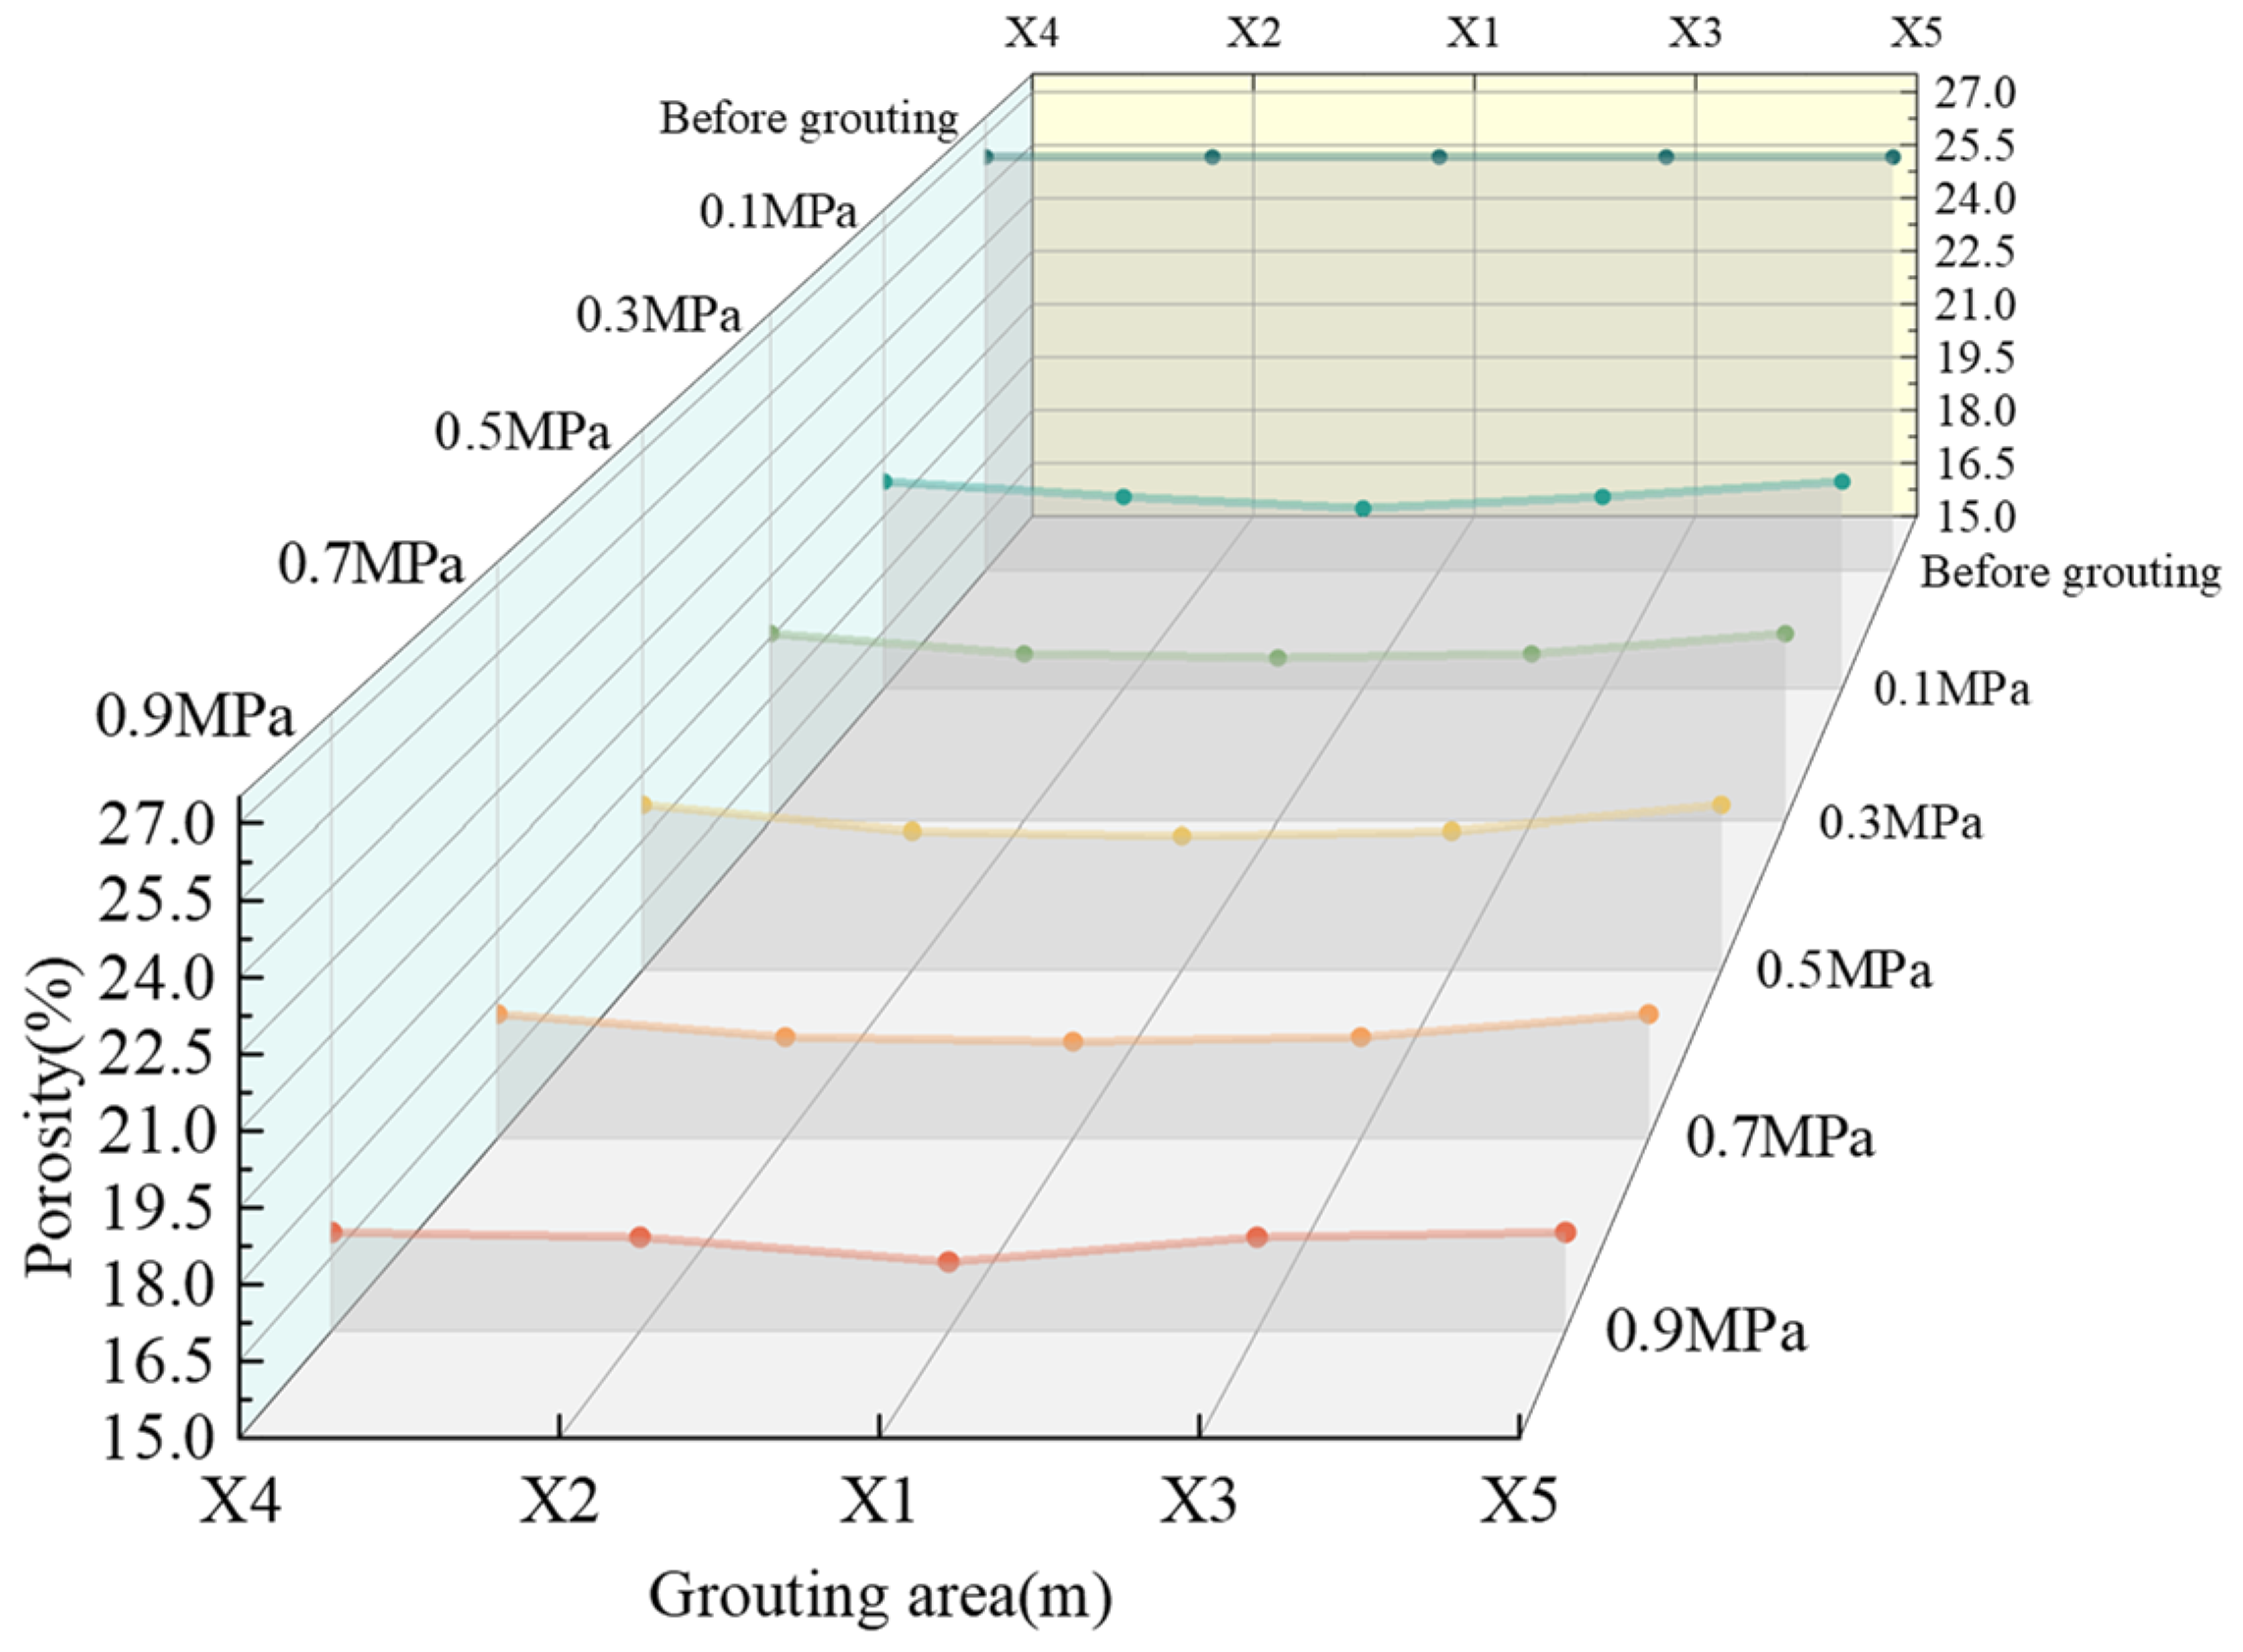
6.2.3. The Change in Regional Porosity

Under varying grouting pressures, the changes in porosity before and after grouting across five regions (X1, X2, X3, X4, and X5) are depicted in Figure 15.
The data illustrate that as grouting pressure increases, the porosity reduction in each region generally trends upward. This suggests that higher grouting pressures enhance the polymer’s ability to penetrate and fill the pores, thus improving the compactness of the rockfill body. Under a grouting pressure of 0.1 MPa, the X1 area experiences a reduction of 6.7%, while the X2 and X3 areas see a reduction of 6.4%, and the X4 and X5 areas show a reduction of 6%. At a grouting pressure of 0.3 MPa, the reduction values are 7.4% for X1, 7.3% for X2 and X3, and 6.8% for X4 and X5. When the grouting pressure is increased to 0.5 MPa, the reduction values become 8.3% for X1, 8.2% for X2 and X3, and 7.6% for X4 and X5. Further increasing the pressure to 0.7 MPa leads to reductions of 9.3% for X1, 9.2% for X2 and X3, and 8.7% for X4 and X5. Finally, at a grouting pressure of 0.9 MPa, the reduction values are 10% for X1, 9.5% for X2 and X3, and 9.4% for X4 and X5.
Region X1, where the grouting hole is located, serves as the focal point for this analysis. From X1 outward, under consistent grouting pressure, the porosity reduction diminishes with increasing distance from the grouting hole. This trend indicates that the uniformity of polymer distribution decreases as the distance from the injection point increases. This phenomenon is attributed to the rising resistance encountered by the polymer foam as it flows, resulting in less slurry reaching areas far from the grouting hole.
Moreover, the reduction in porosity generally escalates with increasing grouting pressure across all regions. However, at a grouting pressure of 0.9 MPa, the trend of the porosity change in regions X2 and X3 alters, showing a reduced decrease in porosity compared to other pressures. This reduced change suggests that the polymer distribution within these two regions has reached a balance, rendering any further increase in grouting pressure less effective in reducing porosity.

6.2.4. Stress Changes Before and After Grouting

Under different grouting pressures, the stress increases in different directions are different.
Analysis of data from Table 4, which compares stress changes in regions X1, X2, and X3 before and after grouting, reveals distinct patterns as grouting pressure varies.
  • At a grouting pressure of 0.1 MPa, stress increases by 3.42% in the X direction and 3.73% in the Z direction.
  • At 0.3 MPa, the increases are 5.90% and 6.69% in the X and Z directions, respectively.
  • At 0.5 MPa, these values rise to 8.50% and 9.27%.
  • At 0.7 MPa, stress increases to 10.48% in the X direction and 10.89% in the Z direction.
  • Finally, at 0.9 MPa, the increases are 12.59% and 12.13%, respectively.
From a grouting pressure of 0.1 MPa to 0.9 MPa, the stress increment in the X direction progressively increases from 3.42% to 12.59%. Similarly, in the Z direction, it rises from 3.73% to 12.13%. These trends suggest that stress in both the X and Z directions escalates with increasing grouting pressure, exhibiting an approximately linear relationship between stress increase and grouting pressure. Notably, while both directions show stress increases, there is a discernible difference between them. At lower pressures (e.g., 0.1 MPa and 0.3 MPa), the increase in the Z direction slightly exceeds that in the X direction, whereas at higher pressures (e.g., 0.9 MPa), the pattern reverses.
In conclusion, the stress in both the X and Z directions consistently rises with increasing grouting pressure, maintaining an approximately linear relationship. Additionally, the magnitude of stress increase differs between the X and Z directions depending on the grouting pressure applied.

7. Conclusions

The technology of PFA-reinforced rockfill materials is of great significance in the reinforcement of rockfill bodies. This study aims to elucidate the reinforcement mechanisms of this technology and to assess the impact of varying grouting pressures on the effectiveness of polymer grouting. Utilizing the DEM, a fluid–solid coupling model for PFA-reinforced rockfill materials was developed. This model simulates the dynamic grouting process and analyzes the slurry diffusion patterns, the extent of slurry diffusion under different grouting pressures, changes in overall and regional porosity, and regional stress variations. The key findings are as follows:
  • The diffusion of polymer foam within the rockfill body progresses through three distinct stages: the initial slurry is concentrated near the grouting hole, then diffuses rapidly, and finally, the diffusion rate slows down and tends to be stable. During the intermediate phase of grouting, the relatively loose structure and higher porosity of the rockfill surface facilitate easier diffusion of the grout. As grouting progresses to the later stages, the voids available for grout diffusion within the rockfill gradually diminish, imposing certain limitations on the spread of the grout. However, due to the excellent permeability and diffusivity of polymeric foam, a consistent rate of diffusion can still be maintained. This progression exhibits the characteristic features of seepage grouting in polymer foams, aligning with established seepage grouting theories and aiding in understanding the polymer diffusion dynamics within rockfill structures. In practical engineering applications, it is essential to select grouting materials judiciously based on the specific conditions of the rockfill and the reinforcement requirements to achieve optimal grouting and consolidation outcomes;
  • Variations in grouting pressure significantly influence the diffusion extent of the slurry. At low pressures, the diffusion range noticeably increases with rising pressure. The range stabilizes under medium pressure and changes minimally at high pressures. Additionally, the vertical (Z-axis) diffusion consistently exceeds the horizontal (X-axis) diffusion, with the former being more responsive to changes in grouting pressure;
  • There is a direct correlation between grouting pressure and porosity reduction. As grouting pressure increases, the porosity decrease becomes more pronounced, suggesting that higher pressures more effectively compel the slurry to occupy finer pores, thus enhancing material compactness. Across different regions, increasing grouting pressure typically reduces porosity, with the reduction diminishing with distance from the grouting point. At a grouting pressure of 0.9 MPa, the decrease in porosity in regions X2 and X3 is less pronounced, indicating a more uniform polymer distribution and limited pressure influence;
  • The relationship between stress increase and grouting pressure is approximately linear. Both the X and Z directional stresses rise with increasing grouting pressure, exhibiting a linear trend. However, the rate of increase differs between directions, with stress in the Z direction slightly surpassing that in the X direction at lower pressures, and vice versa at higher pressures.
These research results can provide a reference for the seismic resistance of earth and rock dams and the reinforcement of rockfill materials, which has certain engineering significance. Meanwhile, because the chemical reaction of polymers is a highly complex process, there are still many difficulties in numerical simulation. Due to the limitations of experimental conditions, research methods, and research tools, there are still many problems that need to be further researched and explored, which can be followed up by further simulations closer to the actual dimensions, the establishment of a more detailed three-dimensional model, and a more comprehensive consideration of the spatial effects of the dam and the flow characteristics of the grouting material.

Author Contributions

Conceptualization, Y.L. and J.W.; methodology, Y.L.; software, Y.L.; validation, Y.L., J.W., H.L. and J.Z.; formal analysis, Y.L.; investigation, Y.L.; data curation, Y.L.; writing—original draft preparation, Y.L.; writing—review and editing, Y.L.; visualization, Y.L.; supervision, H.L., J.Z. and J.W.; project administration, J.W.; funding acquisition, J.W. All authors have read and agreed to the published version of the manuscript.

Funding

This research was funded by the 2019 Tianchi Doctoral Program of the Autonomous Region, grant number 390000017, and the Project of Xinjiang Agricultural University High level Talent Research and Cultivation Program Project in 2020, grant number 2521GCCRC.

Institutional Review Board Statement

Not applicable.

Informed Consent Statement

Not applicable.

Data Availability Statement

The original contributions presented in this study are included in the article.

Acknowledgments

All authors would like to acknowledge the financial support from the 2019 Tianchi Doctoral Program of the Autonomous Region (390000017) and the Project of Xinjiang Agricultural University High level Talent Research and Cultivation Program Project in 2020 (2521GCCRC).

Conflicts of Interest

The authors declare no conflicts of interest.

References

  1. Kong, X.; Zhu, T.; Han, G. Effects of measures for enhancing dynamic stability of concrete-faced rockfill dam. J. Jpn. Soc. Dam Eng. 2000, 10, 93–101. [Google Scholar] [CrossRef]
  2. Liu, J.; Liu, F.; Kong, X.; Yu, L. Large-scale shaking table model tests of aseismic measures for concrete faced rock-fill dams. Soil Dyn. Earthq. Eng. 2014, 61, 152–163. [Google Scholar] [CrossRef]
  3. Liu, H.L.; Fei, K.; Yang, G.; Liu, P. Use of polyurethane foam adhesive-reinforced rockfill material to improve seismic behavior of earth-rockfill dam. Adv Sci Technol Water Resour. 2016, 36, 60–65+70. (In Chinese) [Google Scholar]
  4. Bodi, J.; Bodi, Z.; Scucka, J.; Martinec, P. Polyurethane Grouting Technologies; Croatia INTECH Open Access Publisher: Rijeka, Croatia, 2012. [Google Scholar]
  5. Fang, H.; Su, Y.; Du, X.; Wang, F.; Li, B. Experimental and numerical investigation on repairing effect of polymer grouting for settlement of high-speed railway unballasted track. Appl. Sci. 2019, 9, 4496. [Google Scholar] [CrossRef]
  6. Liu, P.; Liu, H.L.; Yang, X.; Gui, Y. Experimental research on mechanical properties of PFA-reinforced rockfill materials. Rock Soil Mech. 2015, 36, 749–754. (In Chinese) [Google Scholar]
  7. Xiao, Y.; Liu, H.; Desai, C.S. New method for improvement of rockfill material with polyurethane foam adhesive. J. Geotech. Geoenvironmental Eng. 2015, 141, 02814003. [Google Scholar] [CrossRef]
  8. Liu, H.L.; Liu, P.; Yang, G. Experimental investigations on dynamic residual deformation behaviors of PFA-reinforced rockfill materials. Rock Soil Mech 2017, 38, 1863–1868+1886. (In Chinese) [Google Scholar]
  9. Hao, M.; Wang, F.; Li, X.; Zhang, B.; Zhong, Y. Numerical and experimental studies of diffusion law of grouting with expansible polymer. J. Mater. Civ. Eng. 2018, 30, 04017290. [Google Scholar] [CrossRef]
  10. Liang, J.; Du, X.; Fang, H.; Li, B.; Zhao, X.; Xue, B.; Zhai, K.; Wang, S. Numerical manifold simulation and medium-parameter analysis of the polymer grouting process in three-dimensional rock fractures. Comput. Geotech. 2024, 169, 106191. [Google Scholar] [CrossRef]
  11. Zhu, Y.; Wang, X.; Deng, S.; Chen, W.; Shi, Z.; Xue, L.; Lv, M. Grouting process simulation based on 3D fracture network considering fluid-structure interaction. Appl. Sci. 2019, 9, 667. [Google Scholar] [CrossRef]
  12. Kamal, I.; Bas, Y. Materials and technologies in road pavements-an overview. Mater. Today Proc. 2021, 42, 2660–2667. [Google Scholar] [CrossRef]
  13. Liu, P. Experimental Study on Static and Dynamic Characteristics of PFA-Reinforced Rockfill Materials and Seismic Evaluation on its Application on High Earth Rockfill Dam. Ph.D. Thesis, Hohai University, Nanjing, China, 2015. (In Chinese). [Google Scholar]
  14. Seo, D.; Youn, J.R. Numerical analysis on reaction injection molding of polyurethane foam by using a finite volume method. Polymer 2005, 46, 6482–6493. [Google Scholar] [CrossRef]
  15. Castro, J.M.; Macosko, C.W. Studies of mold filling and curing in the reaction injection molding process. AIChE J. 1982, 28, 250–260. [Google Scholar] [CrossRef]
  16. Rojas, A.J.; Marciano, J.H.; Williams, R.J. Rigid polyurethane foams: A model of the foaming process. Polym. Eng. Sci. 1982, 22, 840–844. [Google Scholar] [CrossRef]
  17. Hardy, S.; Finch, E. Discrete element modeling of the influence of cover strength on basement-involved fault-propagation folding. Tectonophysics 2006, 415, 225–238. [Google Scholar] [CrossRef]
  18. Hardy, S.; McClay, K.; Muñoz, J.A. Deformation and fault activity in space and time in high-resolution numerical models of doubly vergent thrust wedges. Mar. Pet. Geol. 2009, 26, 232–248. [Google Scholar] [CrossRef]
  19. Zhu, Y.; Liu, C.; Liu, H.; Kou, Y.-D.; Shi, B. A multi-field and fluid-solid coupling method for porous media based on DEM-PNM. Comput. Geotech. 2023, 154, 105118. [Google Scholar] [CrossRef]
  20. Gao, Y. Experimental Investigations on the Mechanisms of Chemical Grouting in Transparent Soil. Ph.D. Thesis, China University of Mining and Technology, Xuzhou, China, 2016. (In Chinese). [Google Scholar]
Figure 1. Schematic diagram of polymer grouting reinforcement.
Applsci 15 01574 g001
Figure 2. Schematic diagram of the discrete element particle model: (a) particle packing model; (b) normal force between particles; (c) tangential force between particles.
Applsci 15 01574 g002
Figure 3. Pore density flow model: (a) basic discrete accumulation model; (b) pore network; (c) fluid–solid coupling model.
Applsci 15 01574 g003
Figure 4. The interaction between fluid and solid particles: (a) initial state; (b) after fluid–solid coupling effect.
Applsci 15 01574 g004
Figure 5. Gradation curve of rockfill material.
Applsci 15 01574 g005
Figure 6. Basic discrete accumulation model.
Applsci 15 01574 g006
Figure 7. Grouting hole model. (Like Figure 6, the color represents the particle size).
Applsci 15 01574 g007
Figure 8. Comparison of stress–strain curves at 100 kPa: (a) before incorporation; (b) after incorporation.
Applsci 15 01574 g008
Figure 9. Comparison of slurry diffusion range.
Applsci 15 01574 g009
Figure 10. Comparison of slurry diffusion morphology.
Applsci 15 01574 g010
Figure 11. Slurry diffusion process at different times. (Different colors represent different diffusion ranges).
Applsci 15 01574 g011
Figure 12. Detection zoning. (Like Figure 6, the color represents the particle size).
Applsci 15 01574 g012
Figure 13. Diffusion range of slurry under different grouting pressures.
Applsci 15 01574 g013
Figure 14. The overall porosity changes under different grouting pressures.
Applsci 15 01574 g014
Figure 15. The changes of regional porosity under different grouting pressure.
Applsci 15 01574 g015
Table 1. Macro- and micromechanical parameters of materials.
Macromechanical Properties of MaterialsMicromechanical Parameters of Materials
Rock MassNumerical ValueRock MassNumerical Value
Young’s modulus (E/Pa)6.3 × 1010Positive stiffness (Kn/N·m−1)1.2 × 108
Poisson’s ratio (v)0.34Tangential stiffness (Ks/N·m−1)9.6 × 107
Internal friction coefficient (μ)1.469Friction coefficient (μp)0.5
Density (ρ/kg·m−3)2600Damping coefficient0.1
Table 2. Parameters of an indoor static triaxial test [13].
ExperimentationSpecimen Height (H/cm)Specimen Diameter (D/cm)Coefficient of Uniformity (Cu)Coefficient of Curvature (Cc)Axial Strain Loading Rate (ε/mm·min−1)
Indoor static triaxial test201021.942.530.6
Table 3. Experimental parameters of indoor polymer grouting test [20].
ExperimentationSlurry Density (ρc/kg·m−3)Slurry Viscosity (μc/Pa·s)Maximum Grouting Pressure (Fm/MPa)Length of Grouting pipe (L/mm)Grouting Pipe Inner Diameter (d/mm)
Indoor polymer grouting test15000.020.864
Table 4. Stress changes in different directions after grouting under different grouting pressures.
Grouting Pressure (MPa)Variations in the X DirectionVariations in the Z Direction
Before Grouting (Pa)After Grouting (Pa)Increase Amplitude (%)Before Grouting (Pa)After Grouting (Pa)Increase Amplitude (%)
0.1−218,150−225,6103.42−238,390−247,3003.73
0.3−218,150−231,0205.90−238,390−254,3406.69
0.5−218,150−236,6908.50−238,390−260,5009.27
0.7−218,150−241,02010.48−238,390−264,34010.89
0.9−218,150−245,61012.59−238,390−267,30012.13
Disclaimer/Publisher’s Note: The statements, opinions and data contained in all publications are solely those of the individual author(s) and contributor(s) and not of MDPI and/or the editor(s). MDPI and/or the editor(s) disclaim responsibility for any injury to people or property resulting from any ideas, methods, instructions or products referred to in the content.

