Author Contributions
Conceptualization, H.S.H., M.G. and S.S.; methodology, H.S.H.; software, H.S.H.; validation, H.S.H., M.G. and S.S.; formal analysis, H.S.H.; investigation, H.S.H.; resources, M.G.; data curation, H.S.H.; writing—original draft preparation, H.S.H.; writing—journal paper preparation, M.G.; writing—review and editing, S.S.; visualization, H.S.H.; supervision, M.G.; project administration, S.S.; guidance and submission planning, S.S. All authors have read and agreed to the published version of the manuscript.
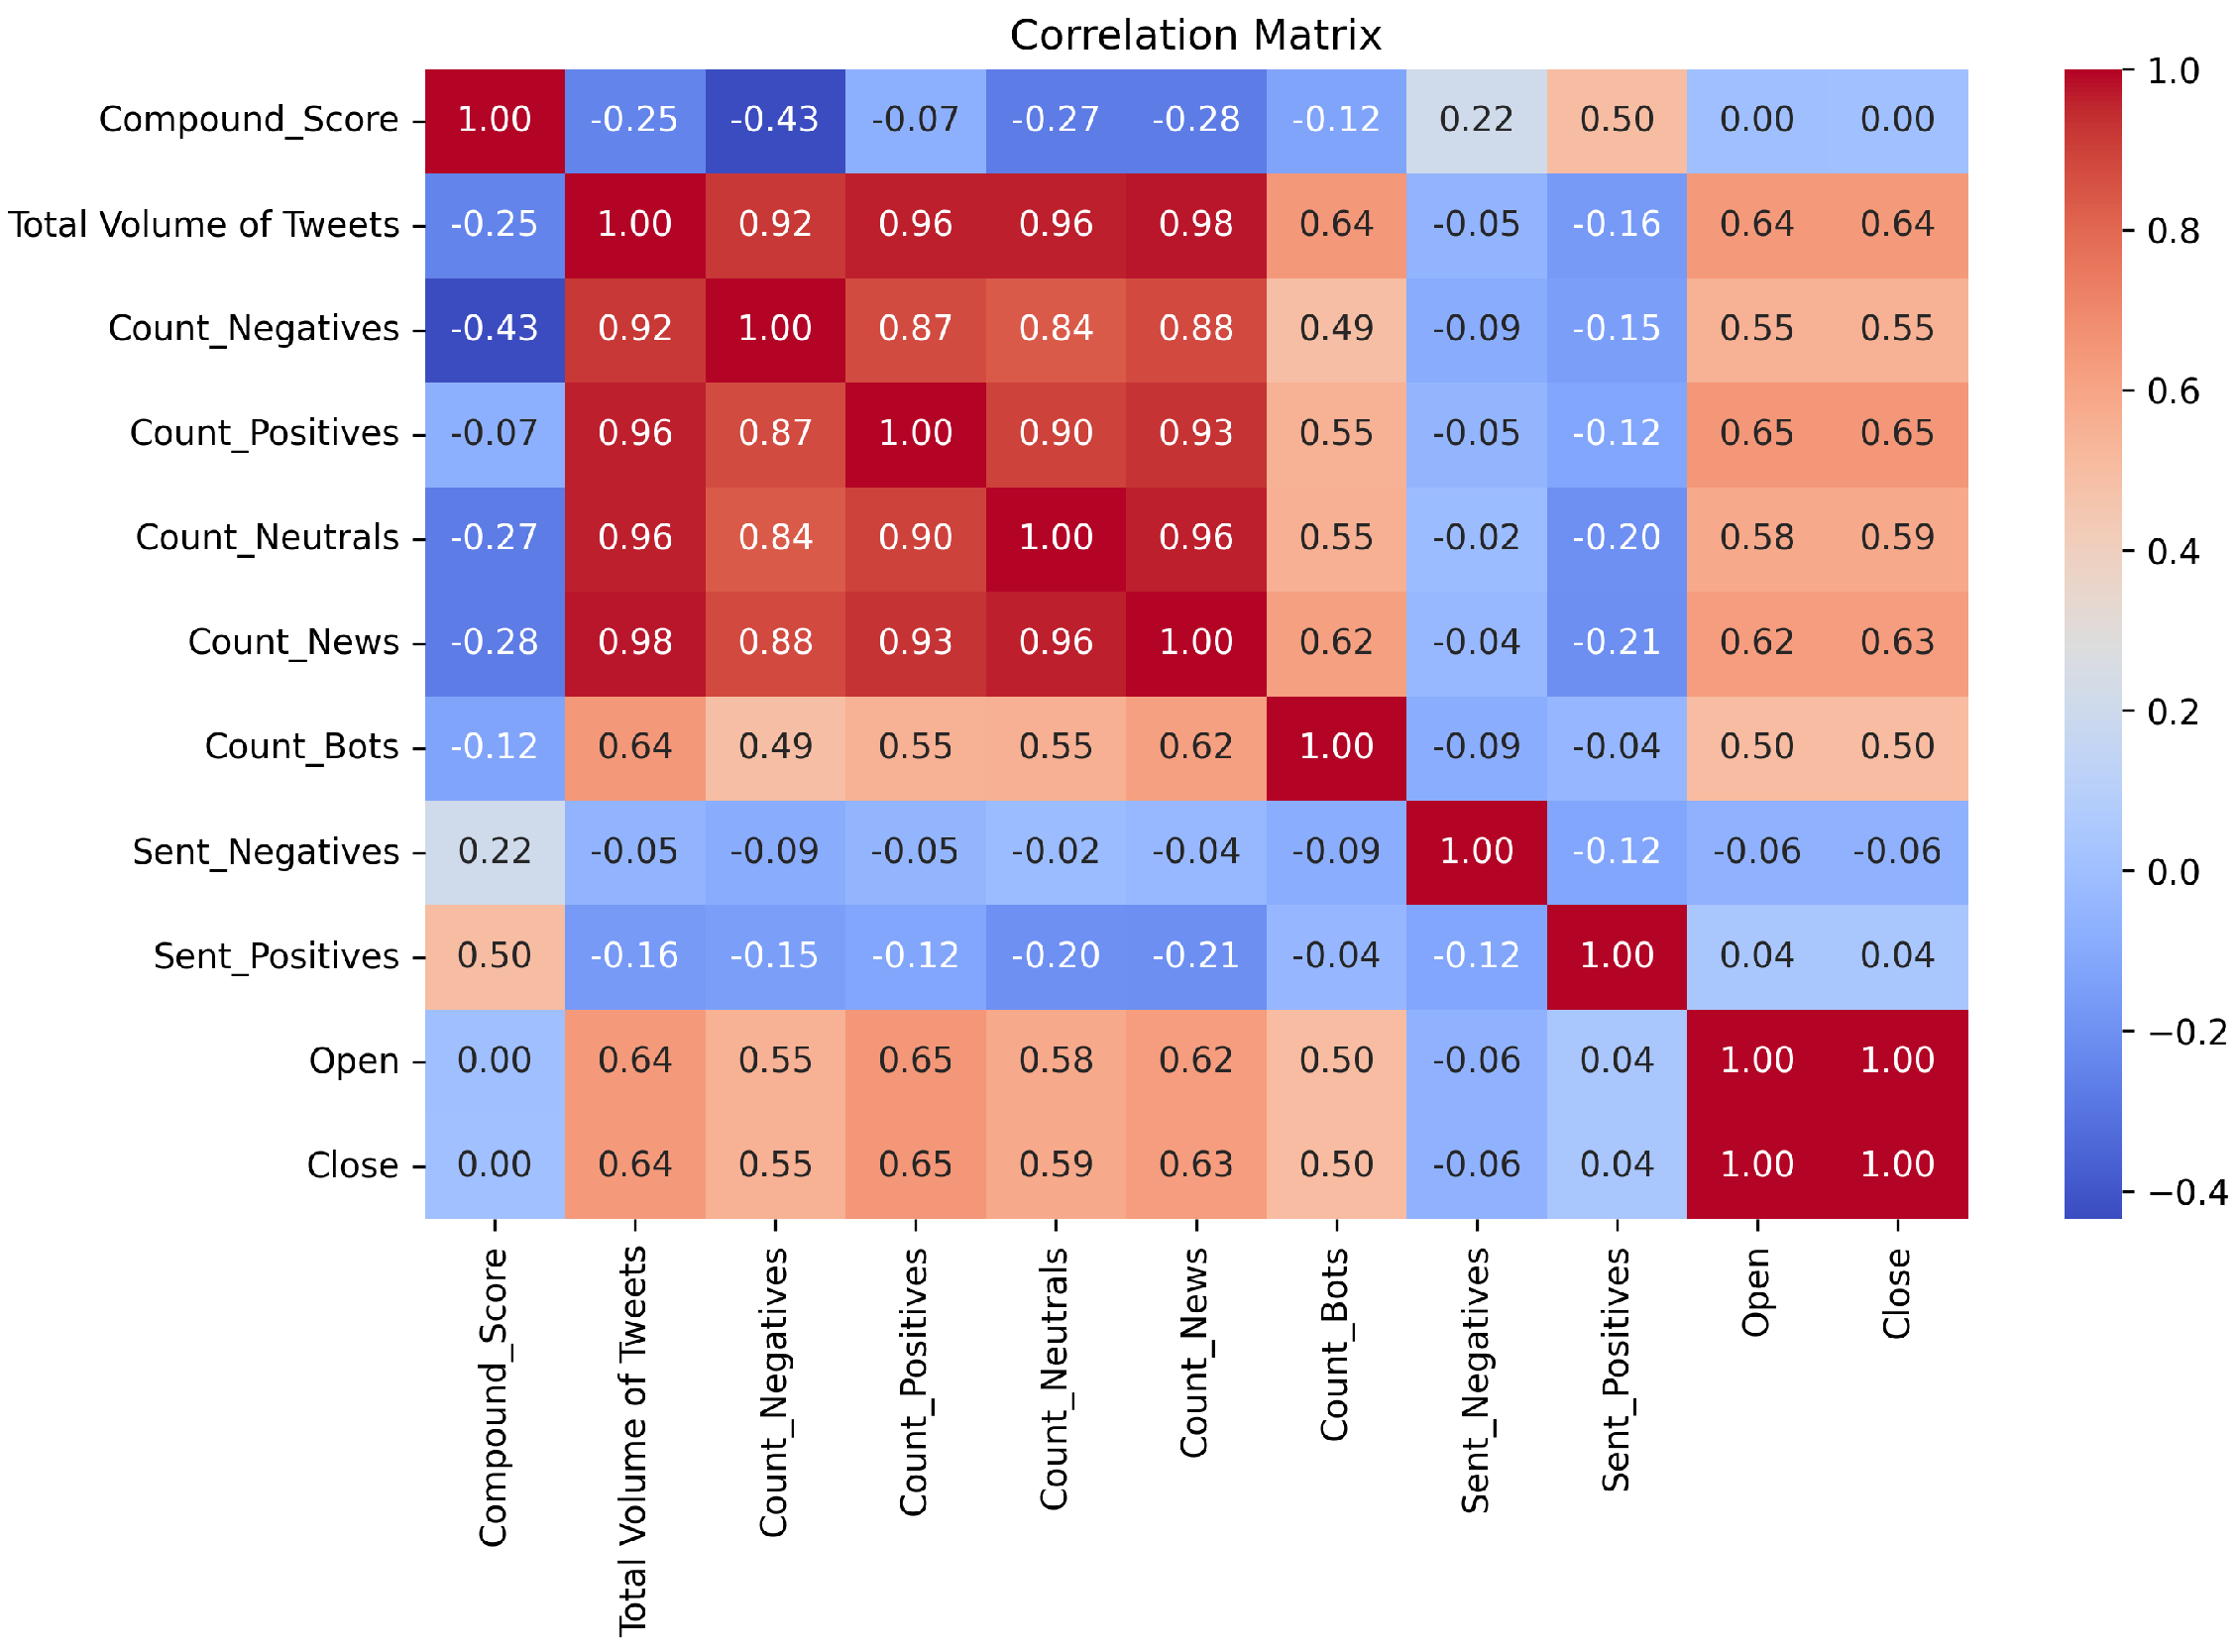
Figure 1.
Correlation heatmap illustrating the relationships between features. Values range from −1 to 1, with −1 indicating a strong negative correlation and 1 indicating a strong positive correlation.
Figure 1.
Correlation heatmap illustrating the relationships between features. Values range from −1 to 1, with −1 indicating a strong negative correlation and 1 indicating a strong positive correlation.
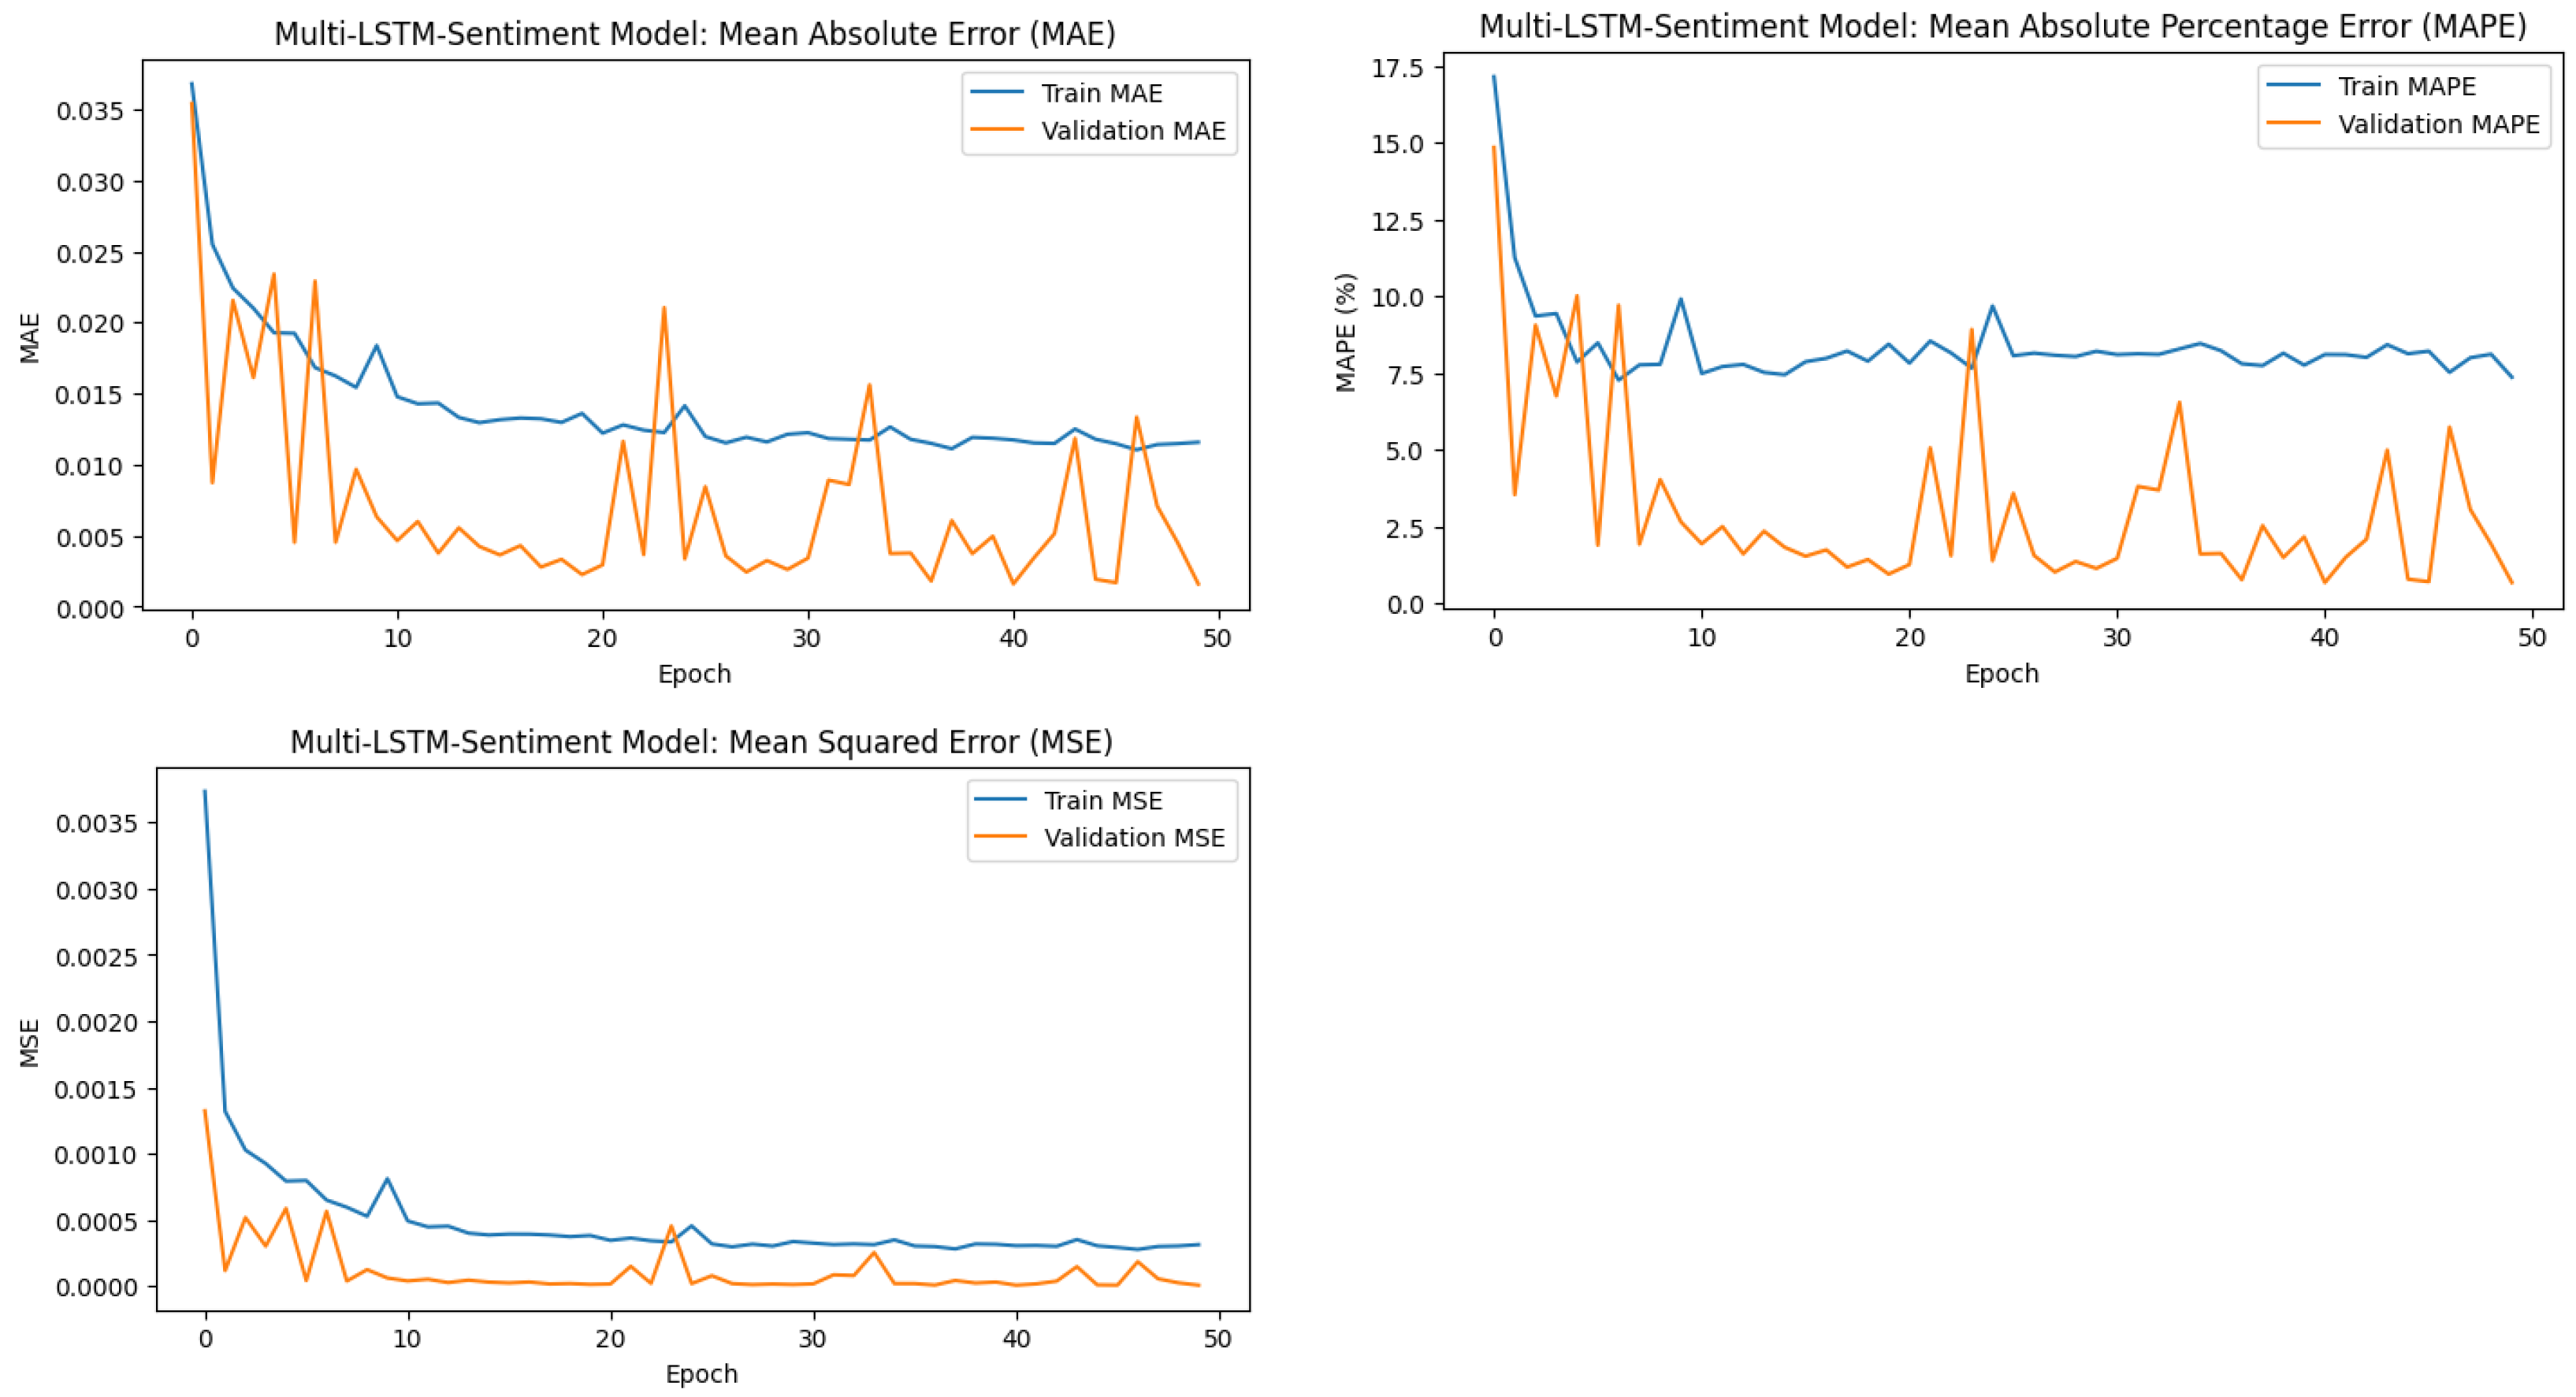
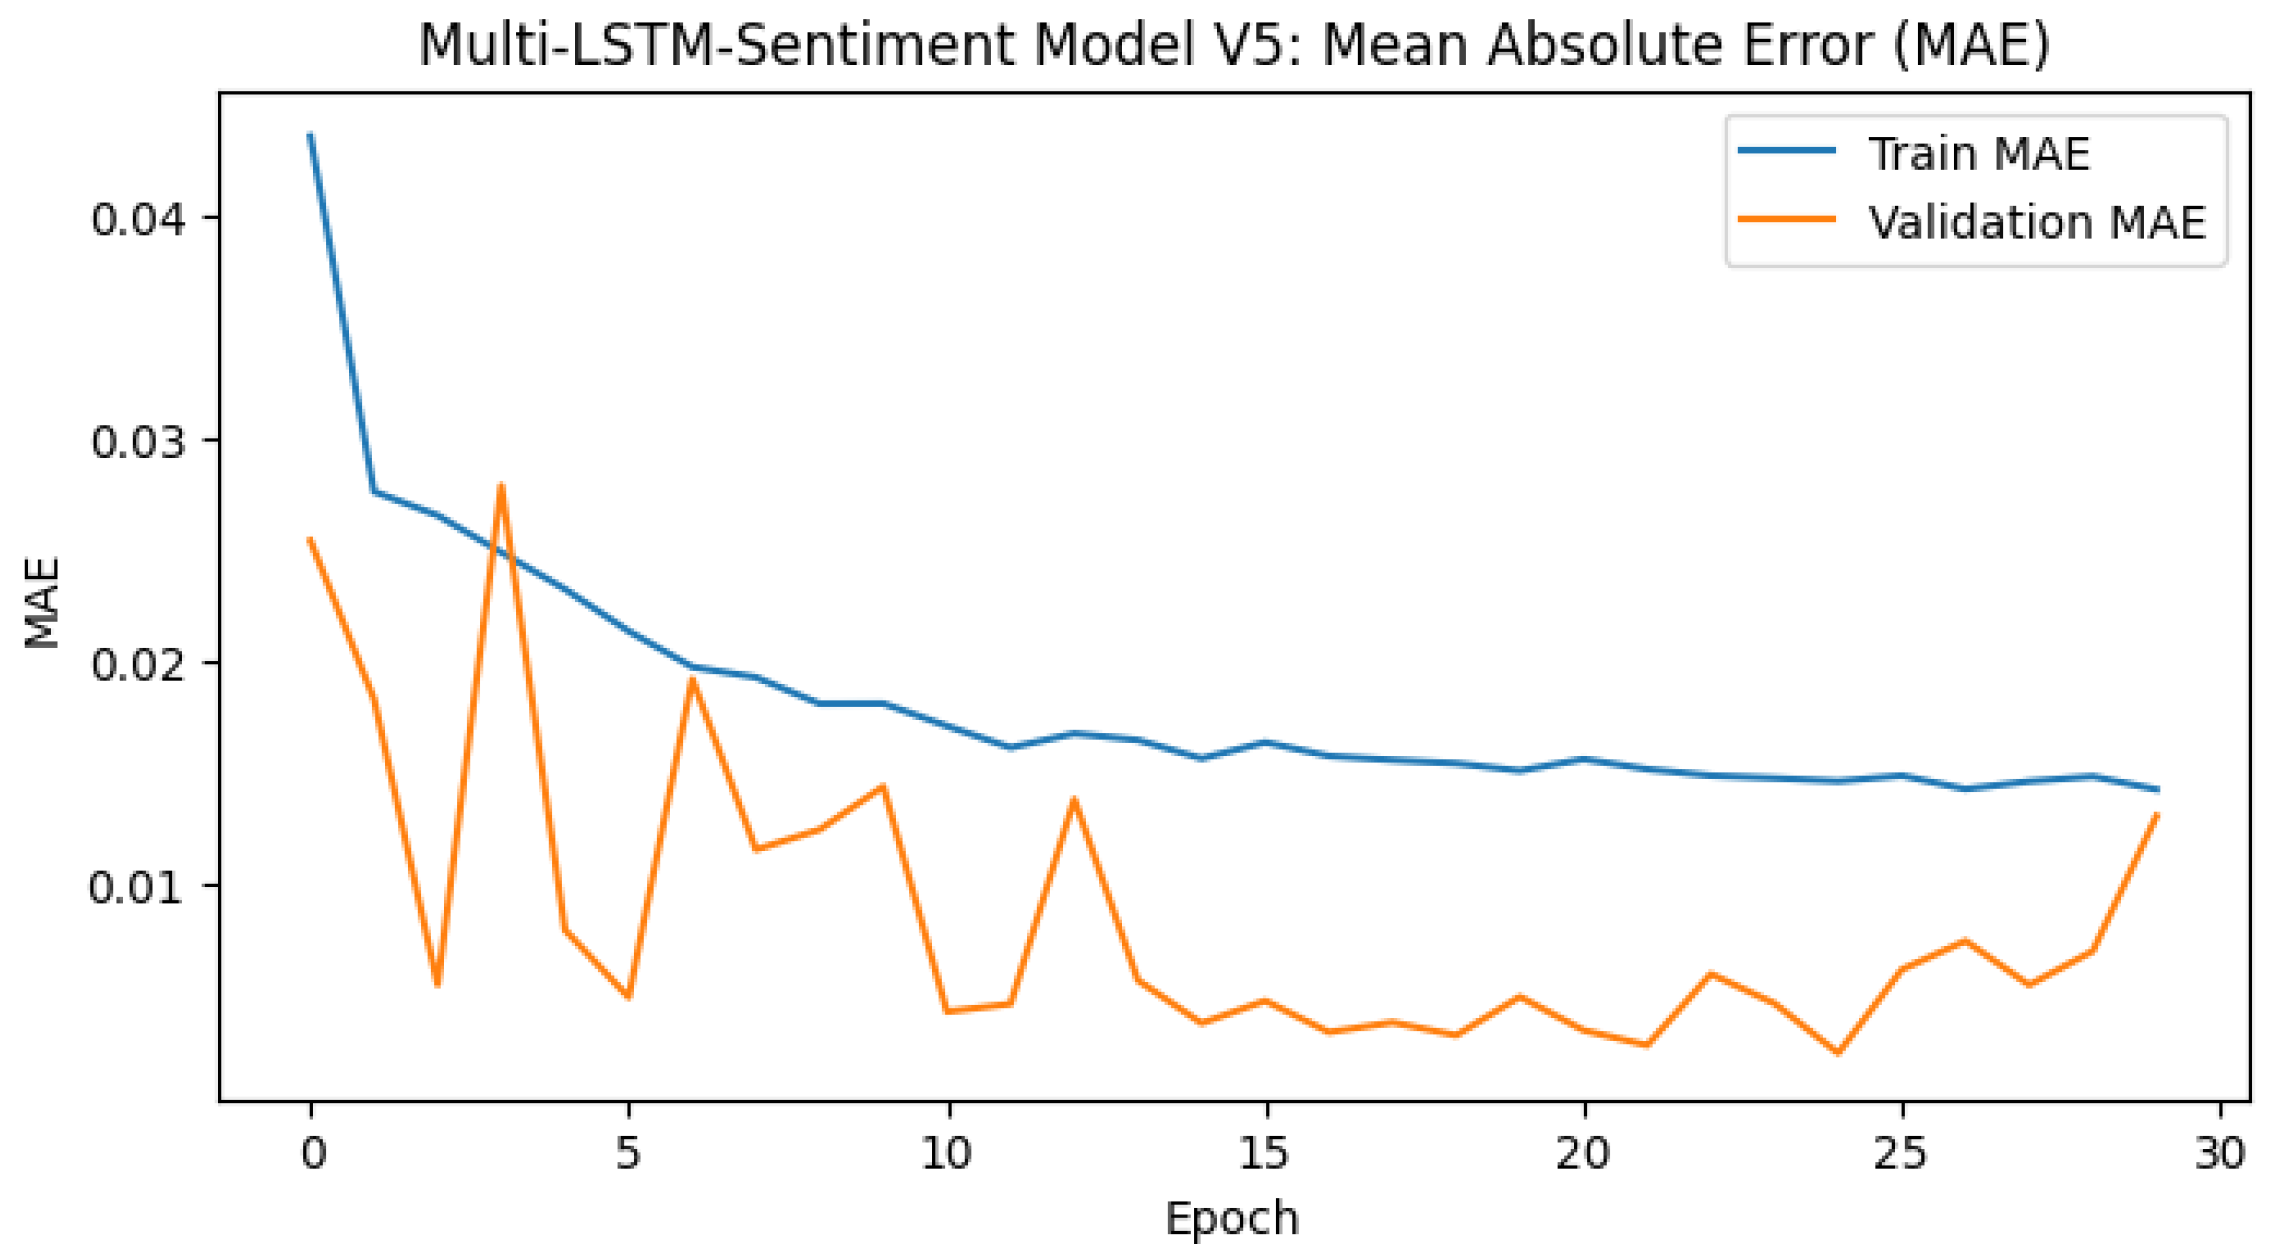
Figure 2.
Training and validation error trends for the Multi-LSTM-Sentiment model across metrics: MSE, MAE, and MAPE. The decreasing trends indicate effective learning and generalisation.
Figure 2.
Training and validation error trends for the Multi-LSTM-Sentiment model across metrics: MSE, MAE, and MAPE. The decreasing trends indicate effective learning and generalisation.
Figure 3.
Training and validation error trends for the tuned Multi-LSTM-Sentiment model across metrics: MSE, MAE, and MAPE. Tuning resulted in a consistent reduction in errors and improved generalisation.
Figure 3.
Training and validation error trends for the tuned Multi-LSTM-Sentiment model across metrics: MSE, MAE, and MAPE. Tuning resulted in a consistent reduction in errors and improved generalisation.
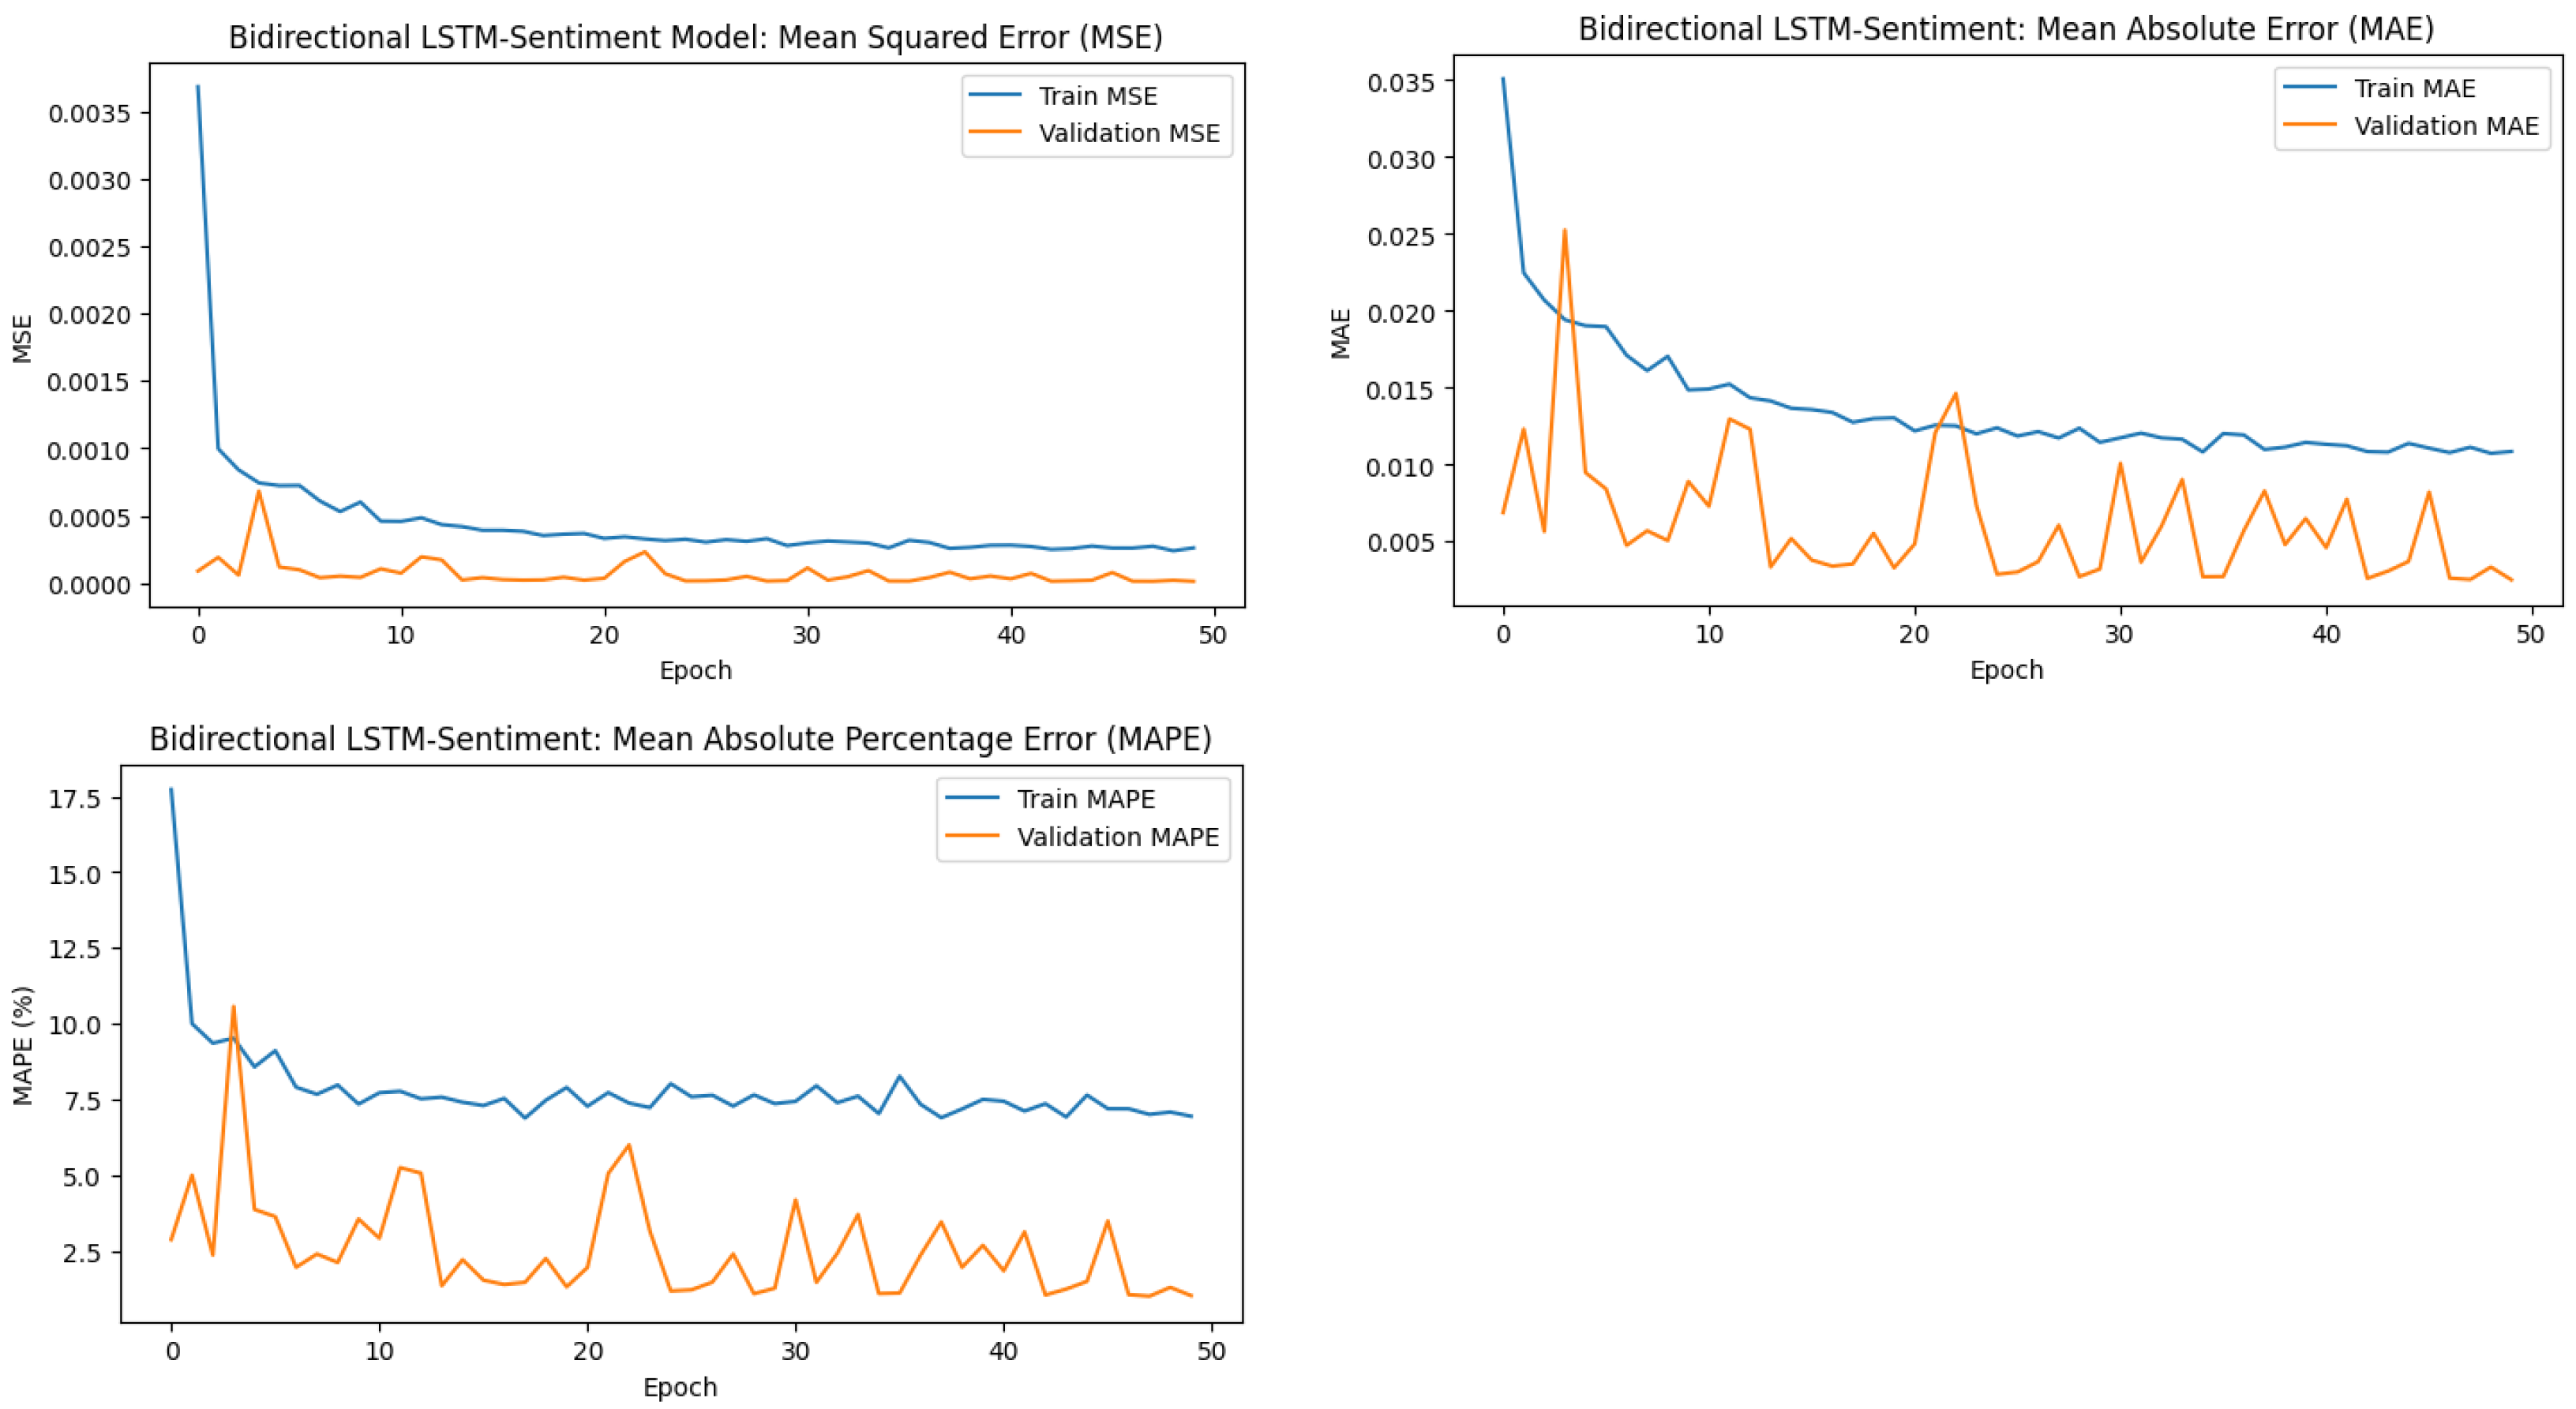
Figure 4.
Training and validation error trends for the Bidirectional LSTM-Sentiment model across metrics: MSE, MAE, and MAPE. The decreasing trends indicate effective learning and generalisation.
Figure 4.
Training and validation error trends for the Bidirectional LSTM-Sentiment model across metrics: MSE, MAE, and MAPE. The decreasing trends indicate effective learning and generalisation.
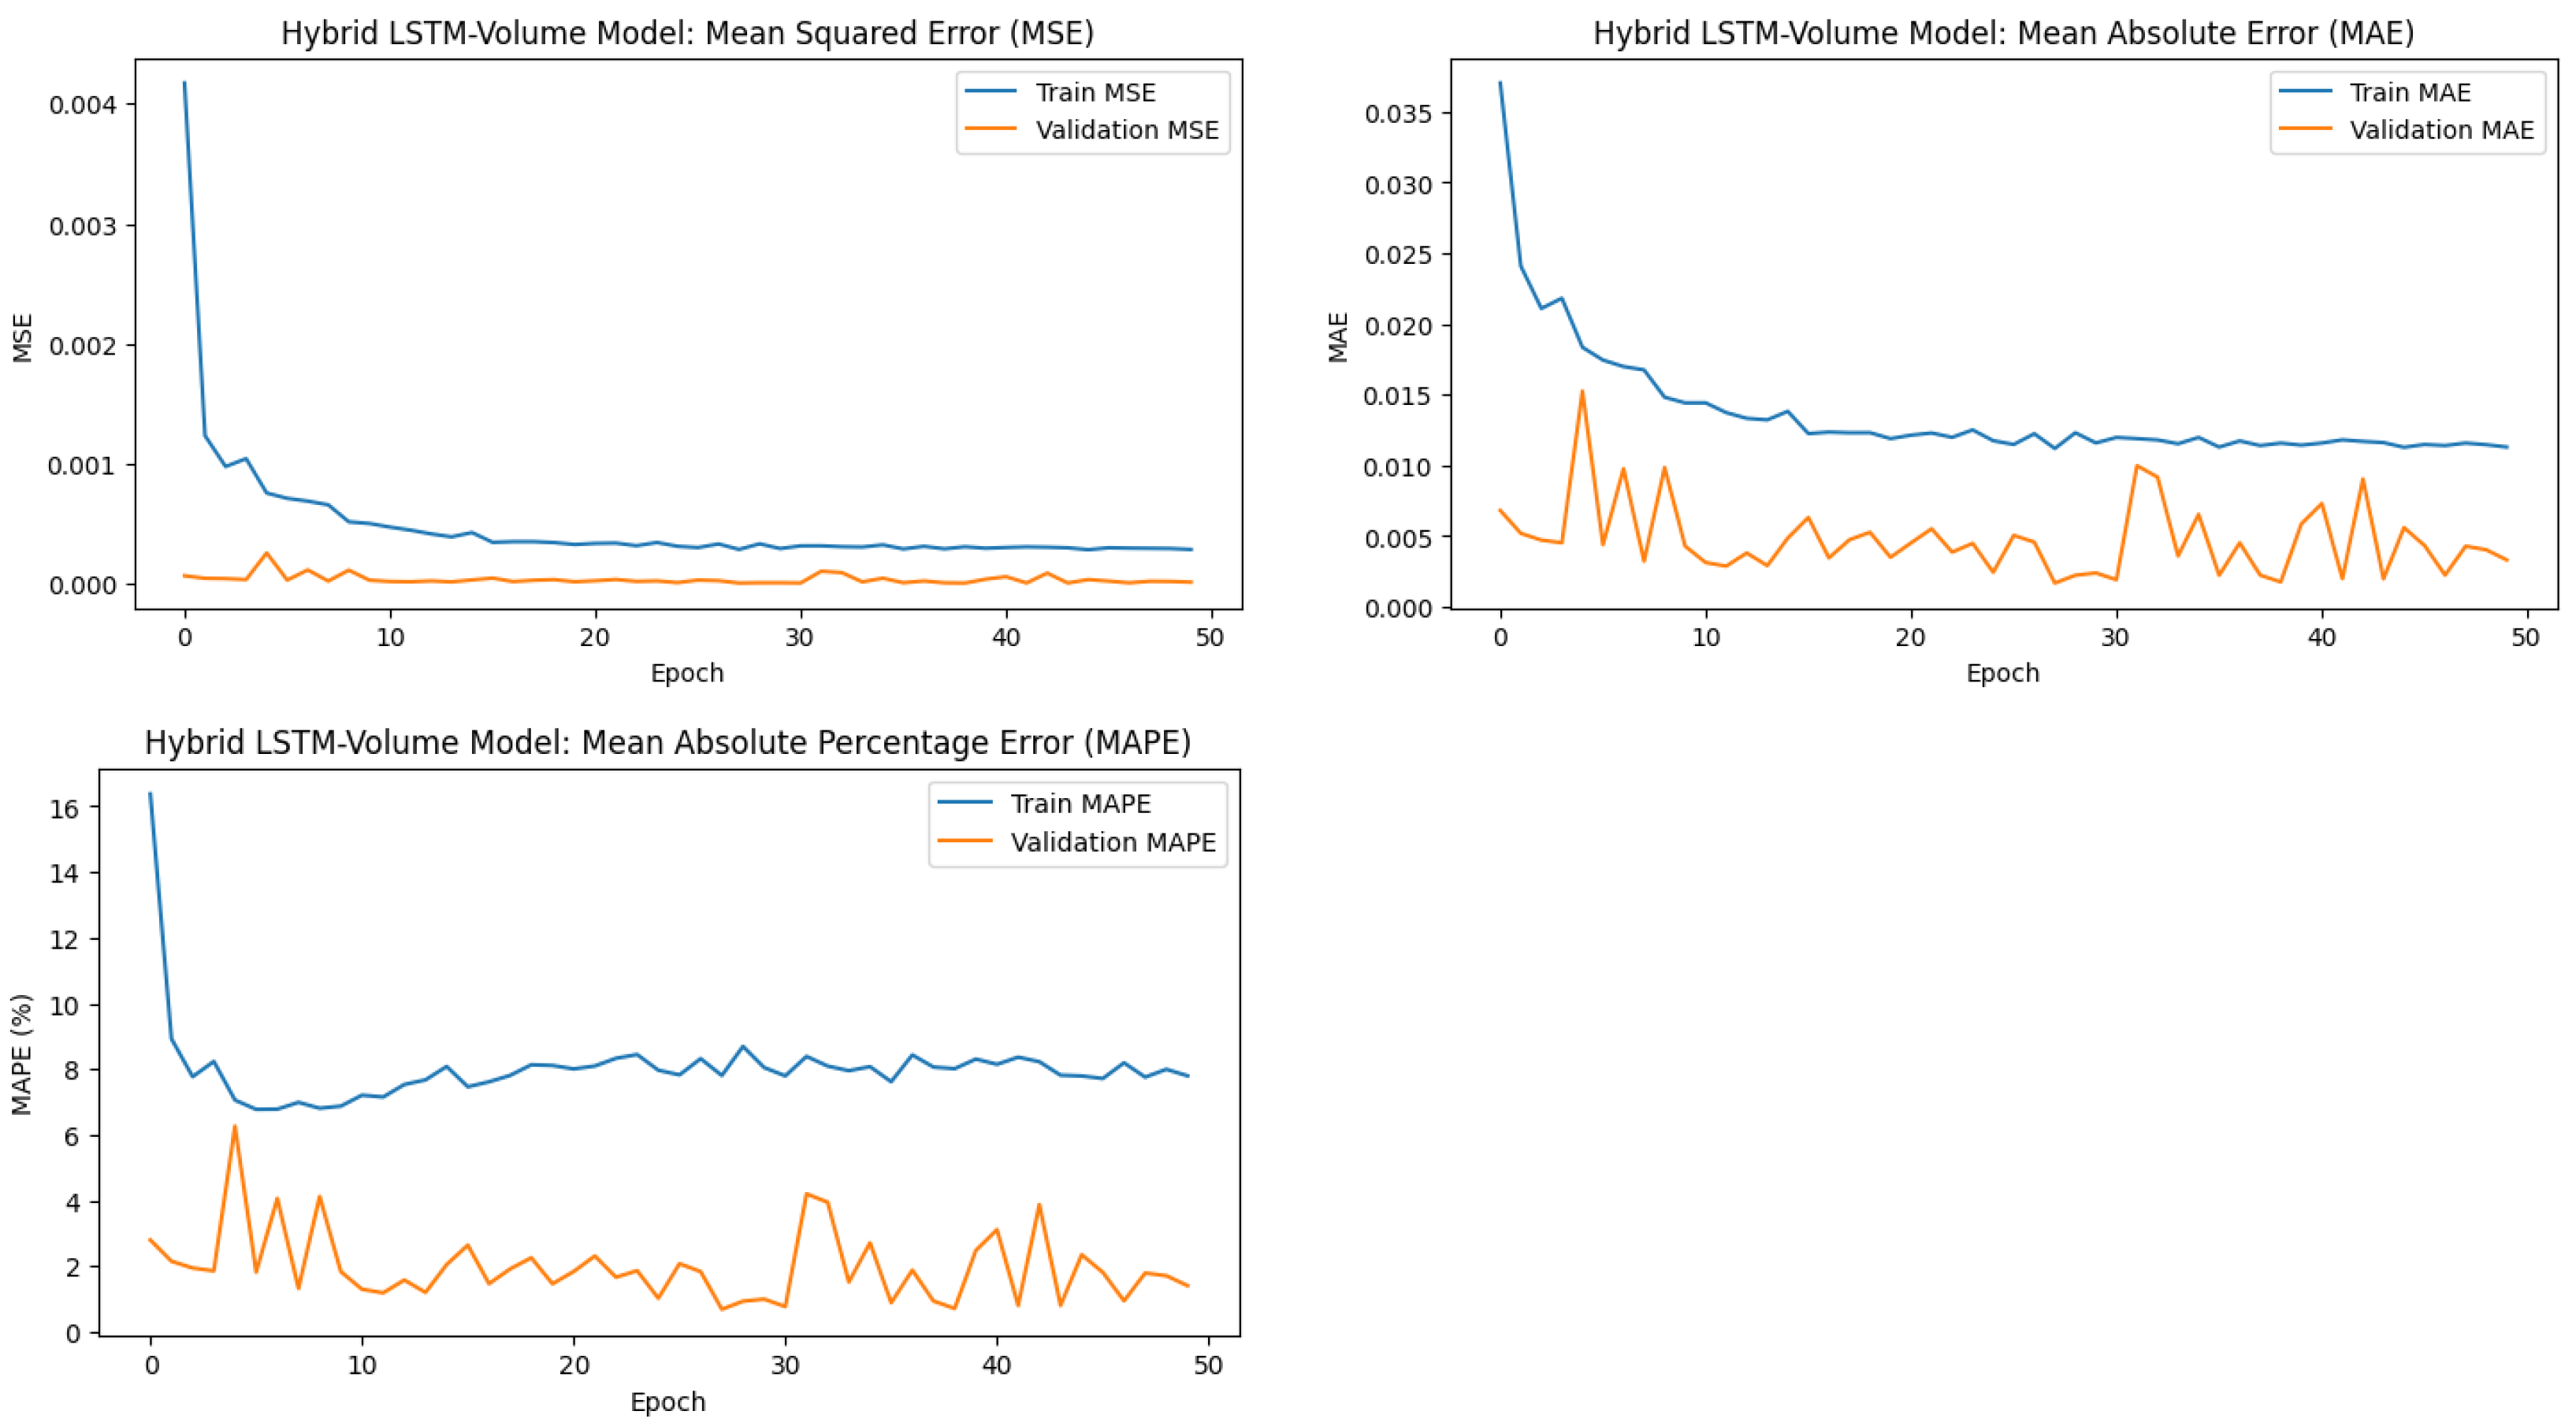
Figure 5.
Training and validation error trends for the Hybrid LSTM-Volume model across metrics: MSE, MAE, and MAPE. The decreasing trends indicate effective learning and generalisation.
Figure 5.
Training and validation error trends for the Hybrid LSTM-Volume model across metrics: MSE, MAE, and MAPE. The decreasing trends indicate effective learning and generalisation.
Figure 6.
Training and validation error trends for the tuned Hybrid LSTM-Volume model across metrics: MSE, MAE, and MAPE. The decreasing trends indicate effective learning and generalisation.
Figure 6.
Training and validation error trends for the tuned Hybrid LSTM-Volume model across metrics: MSE, MAE, and MAPE. The decreasing trends indicate effective learning and generalisation.
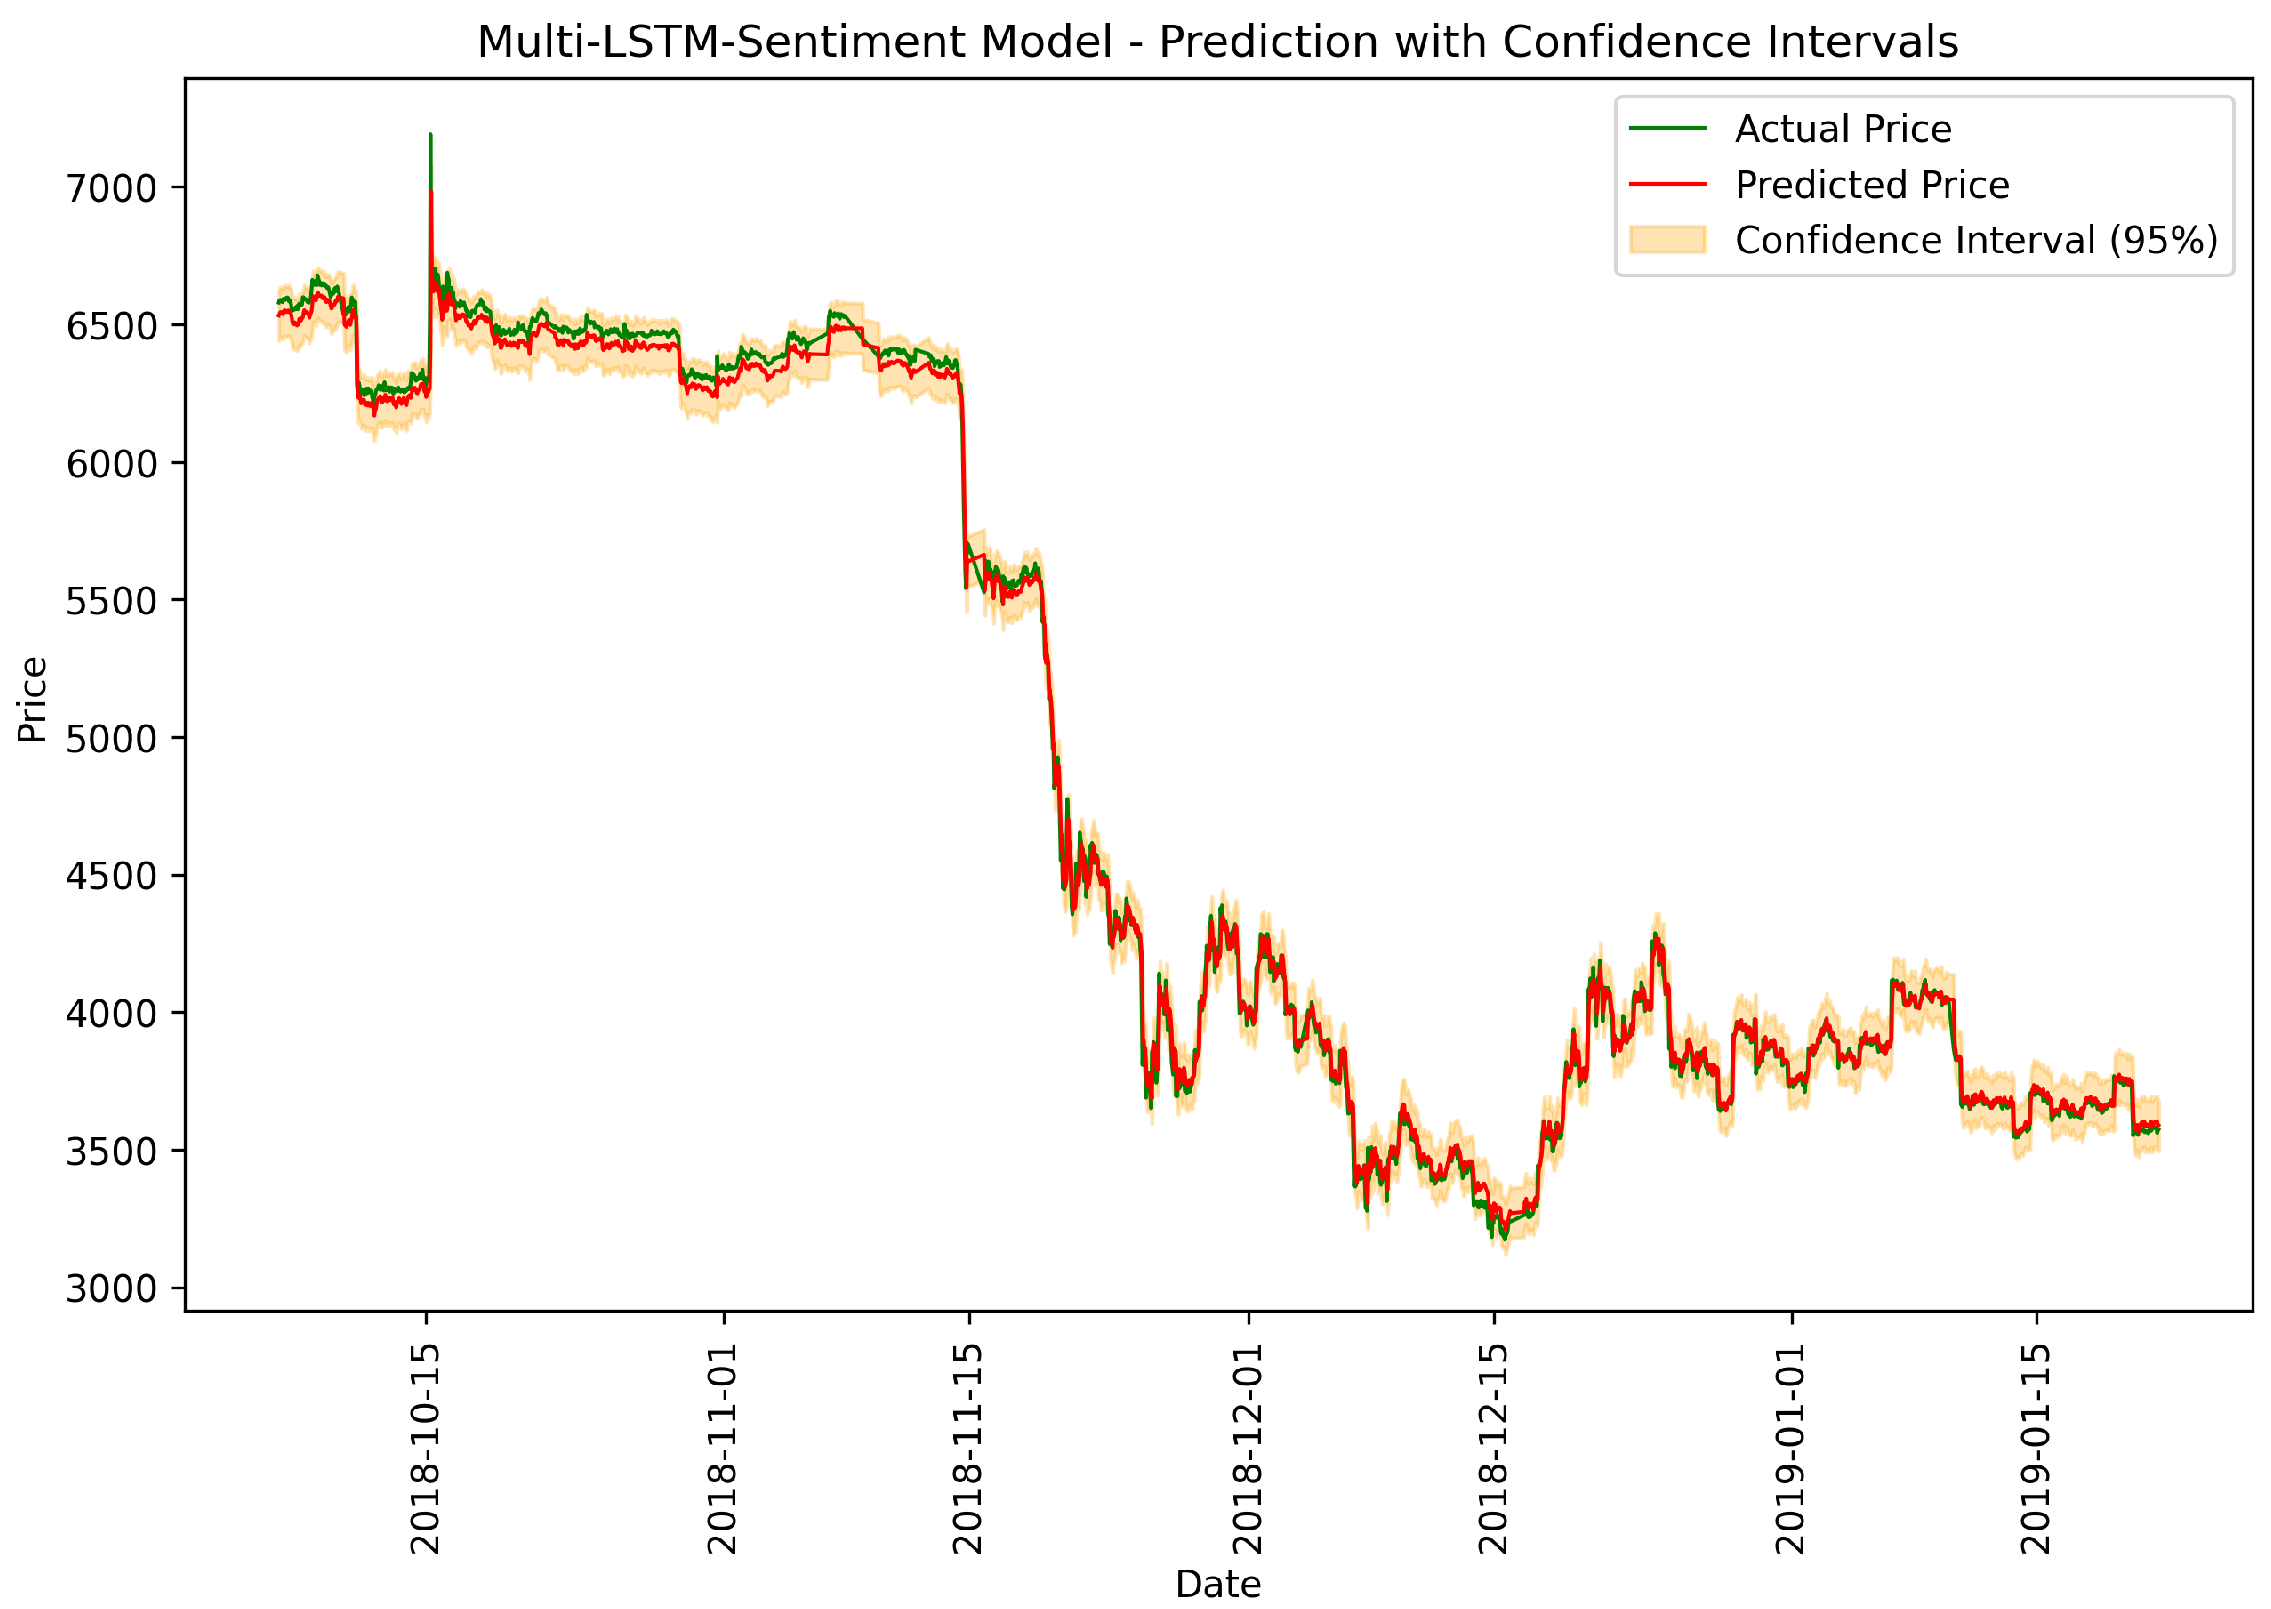
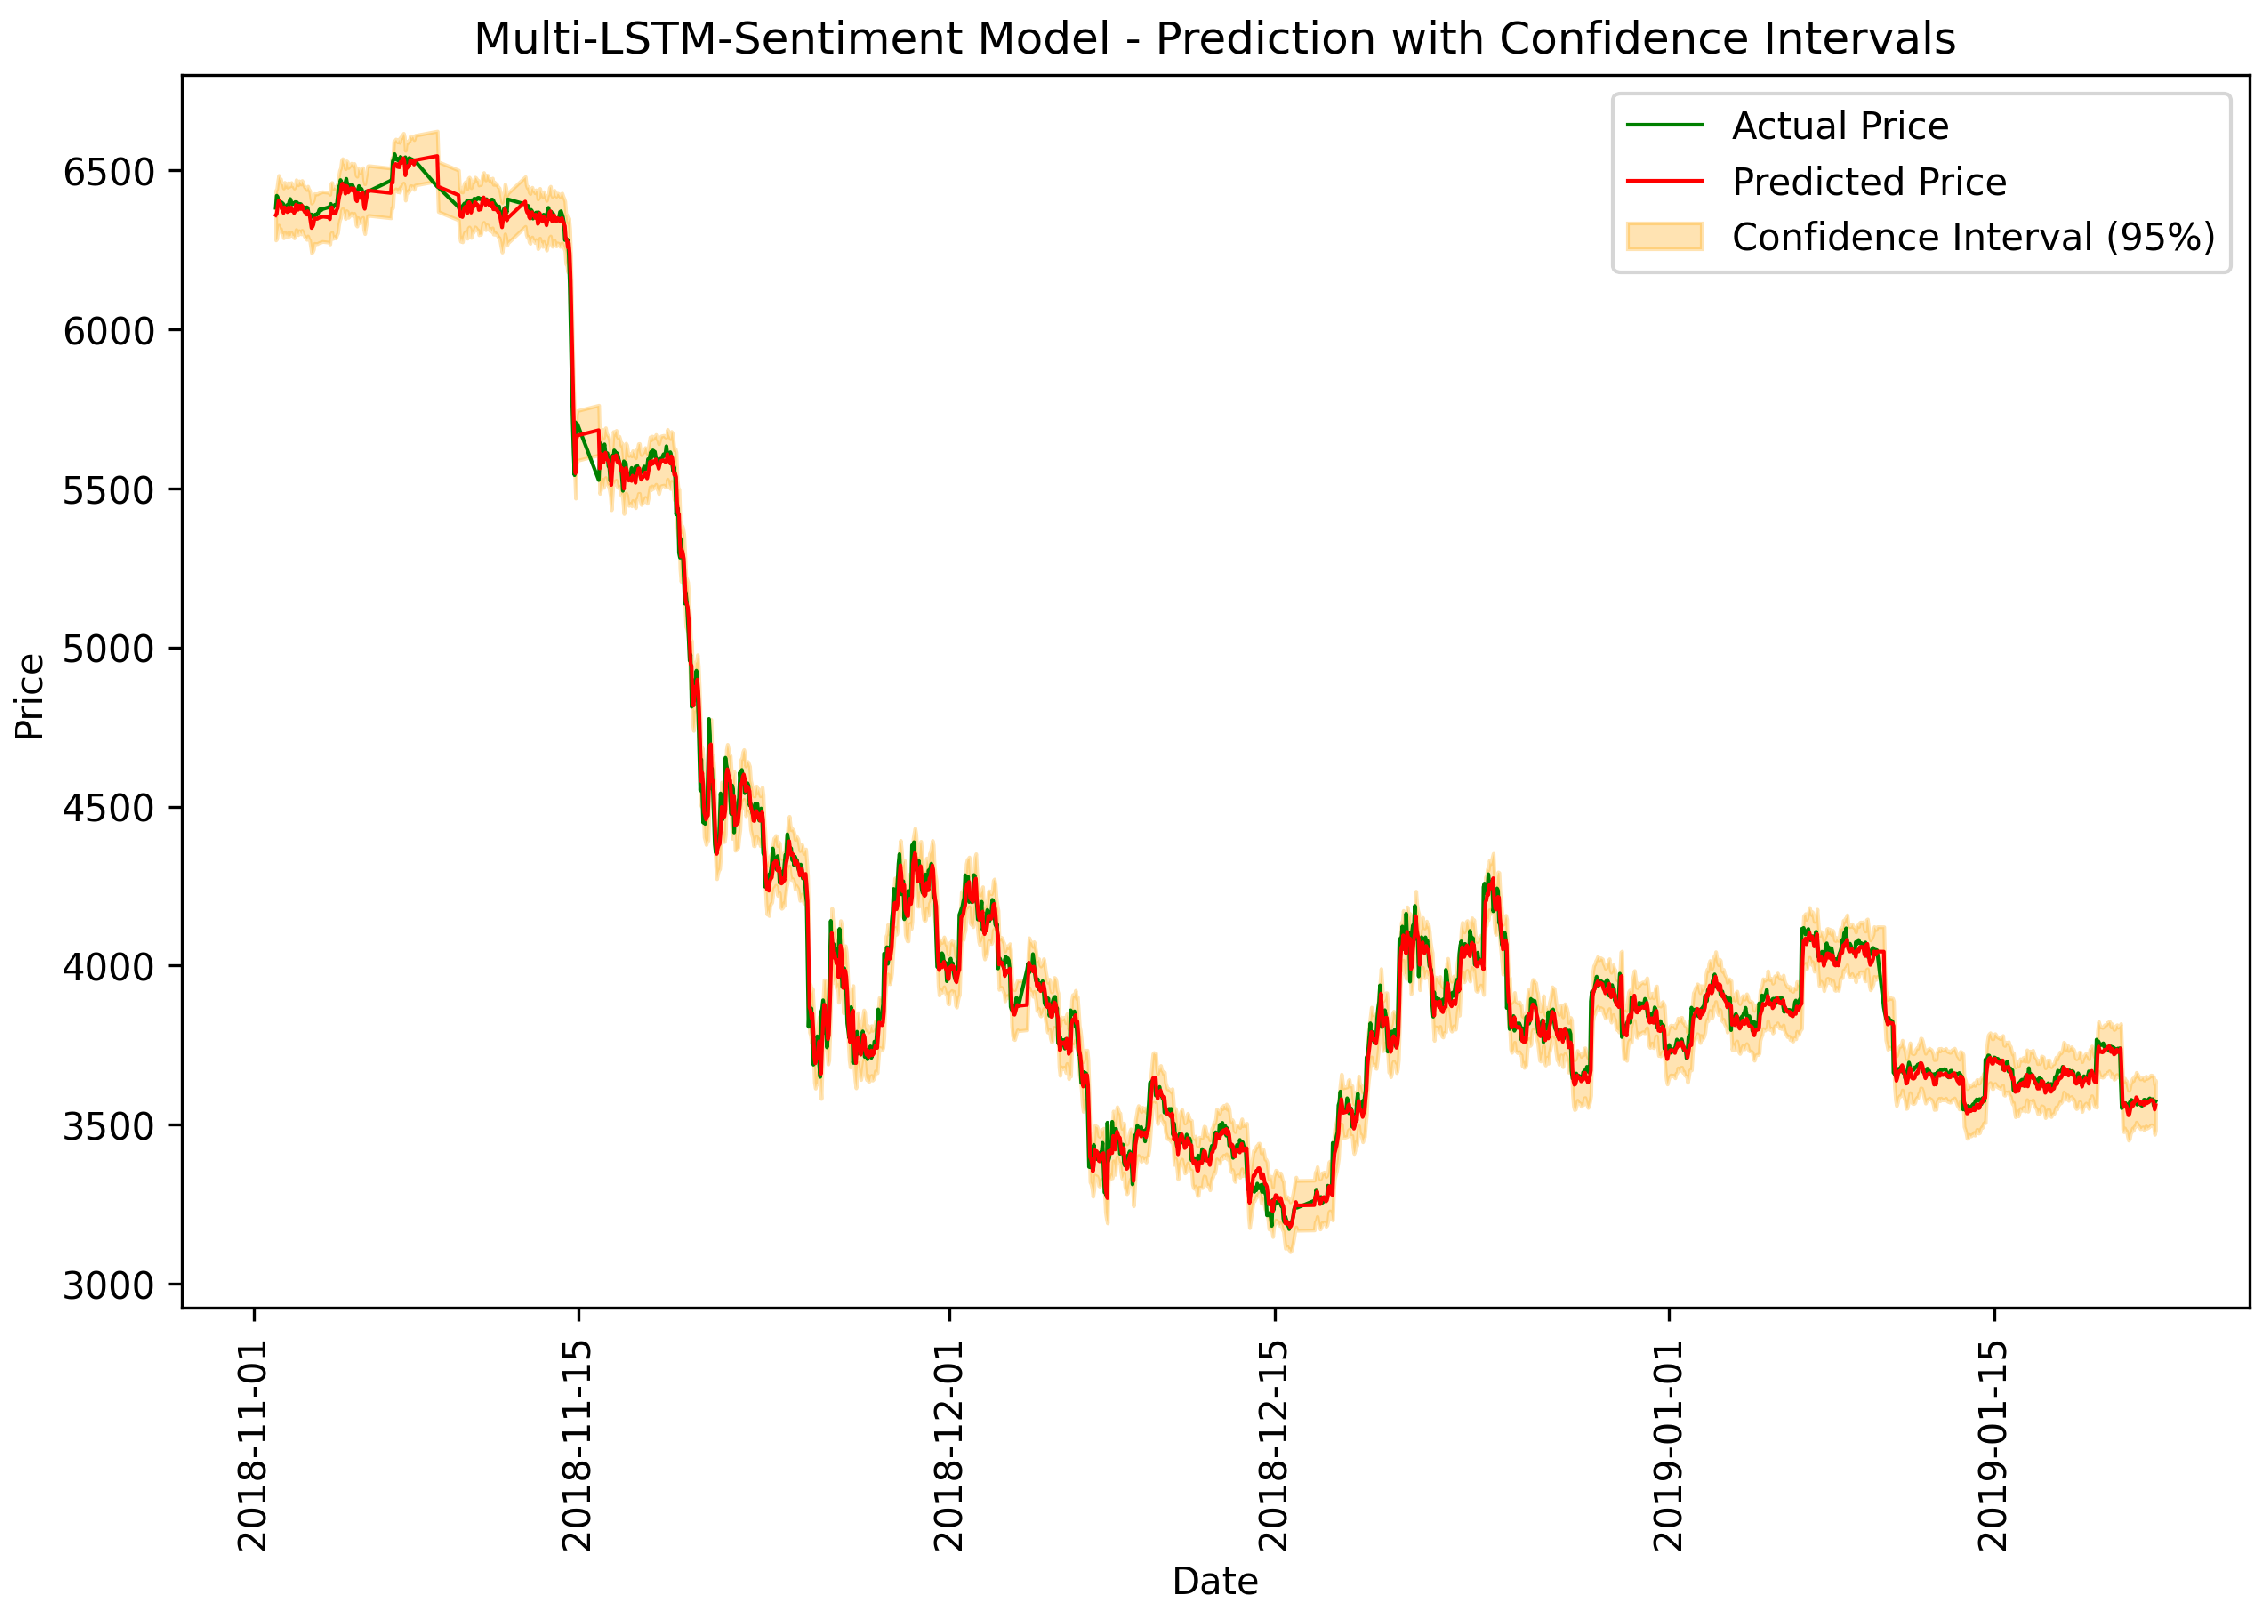
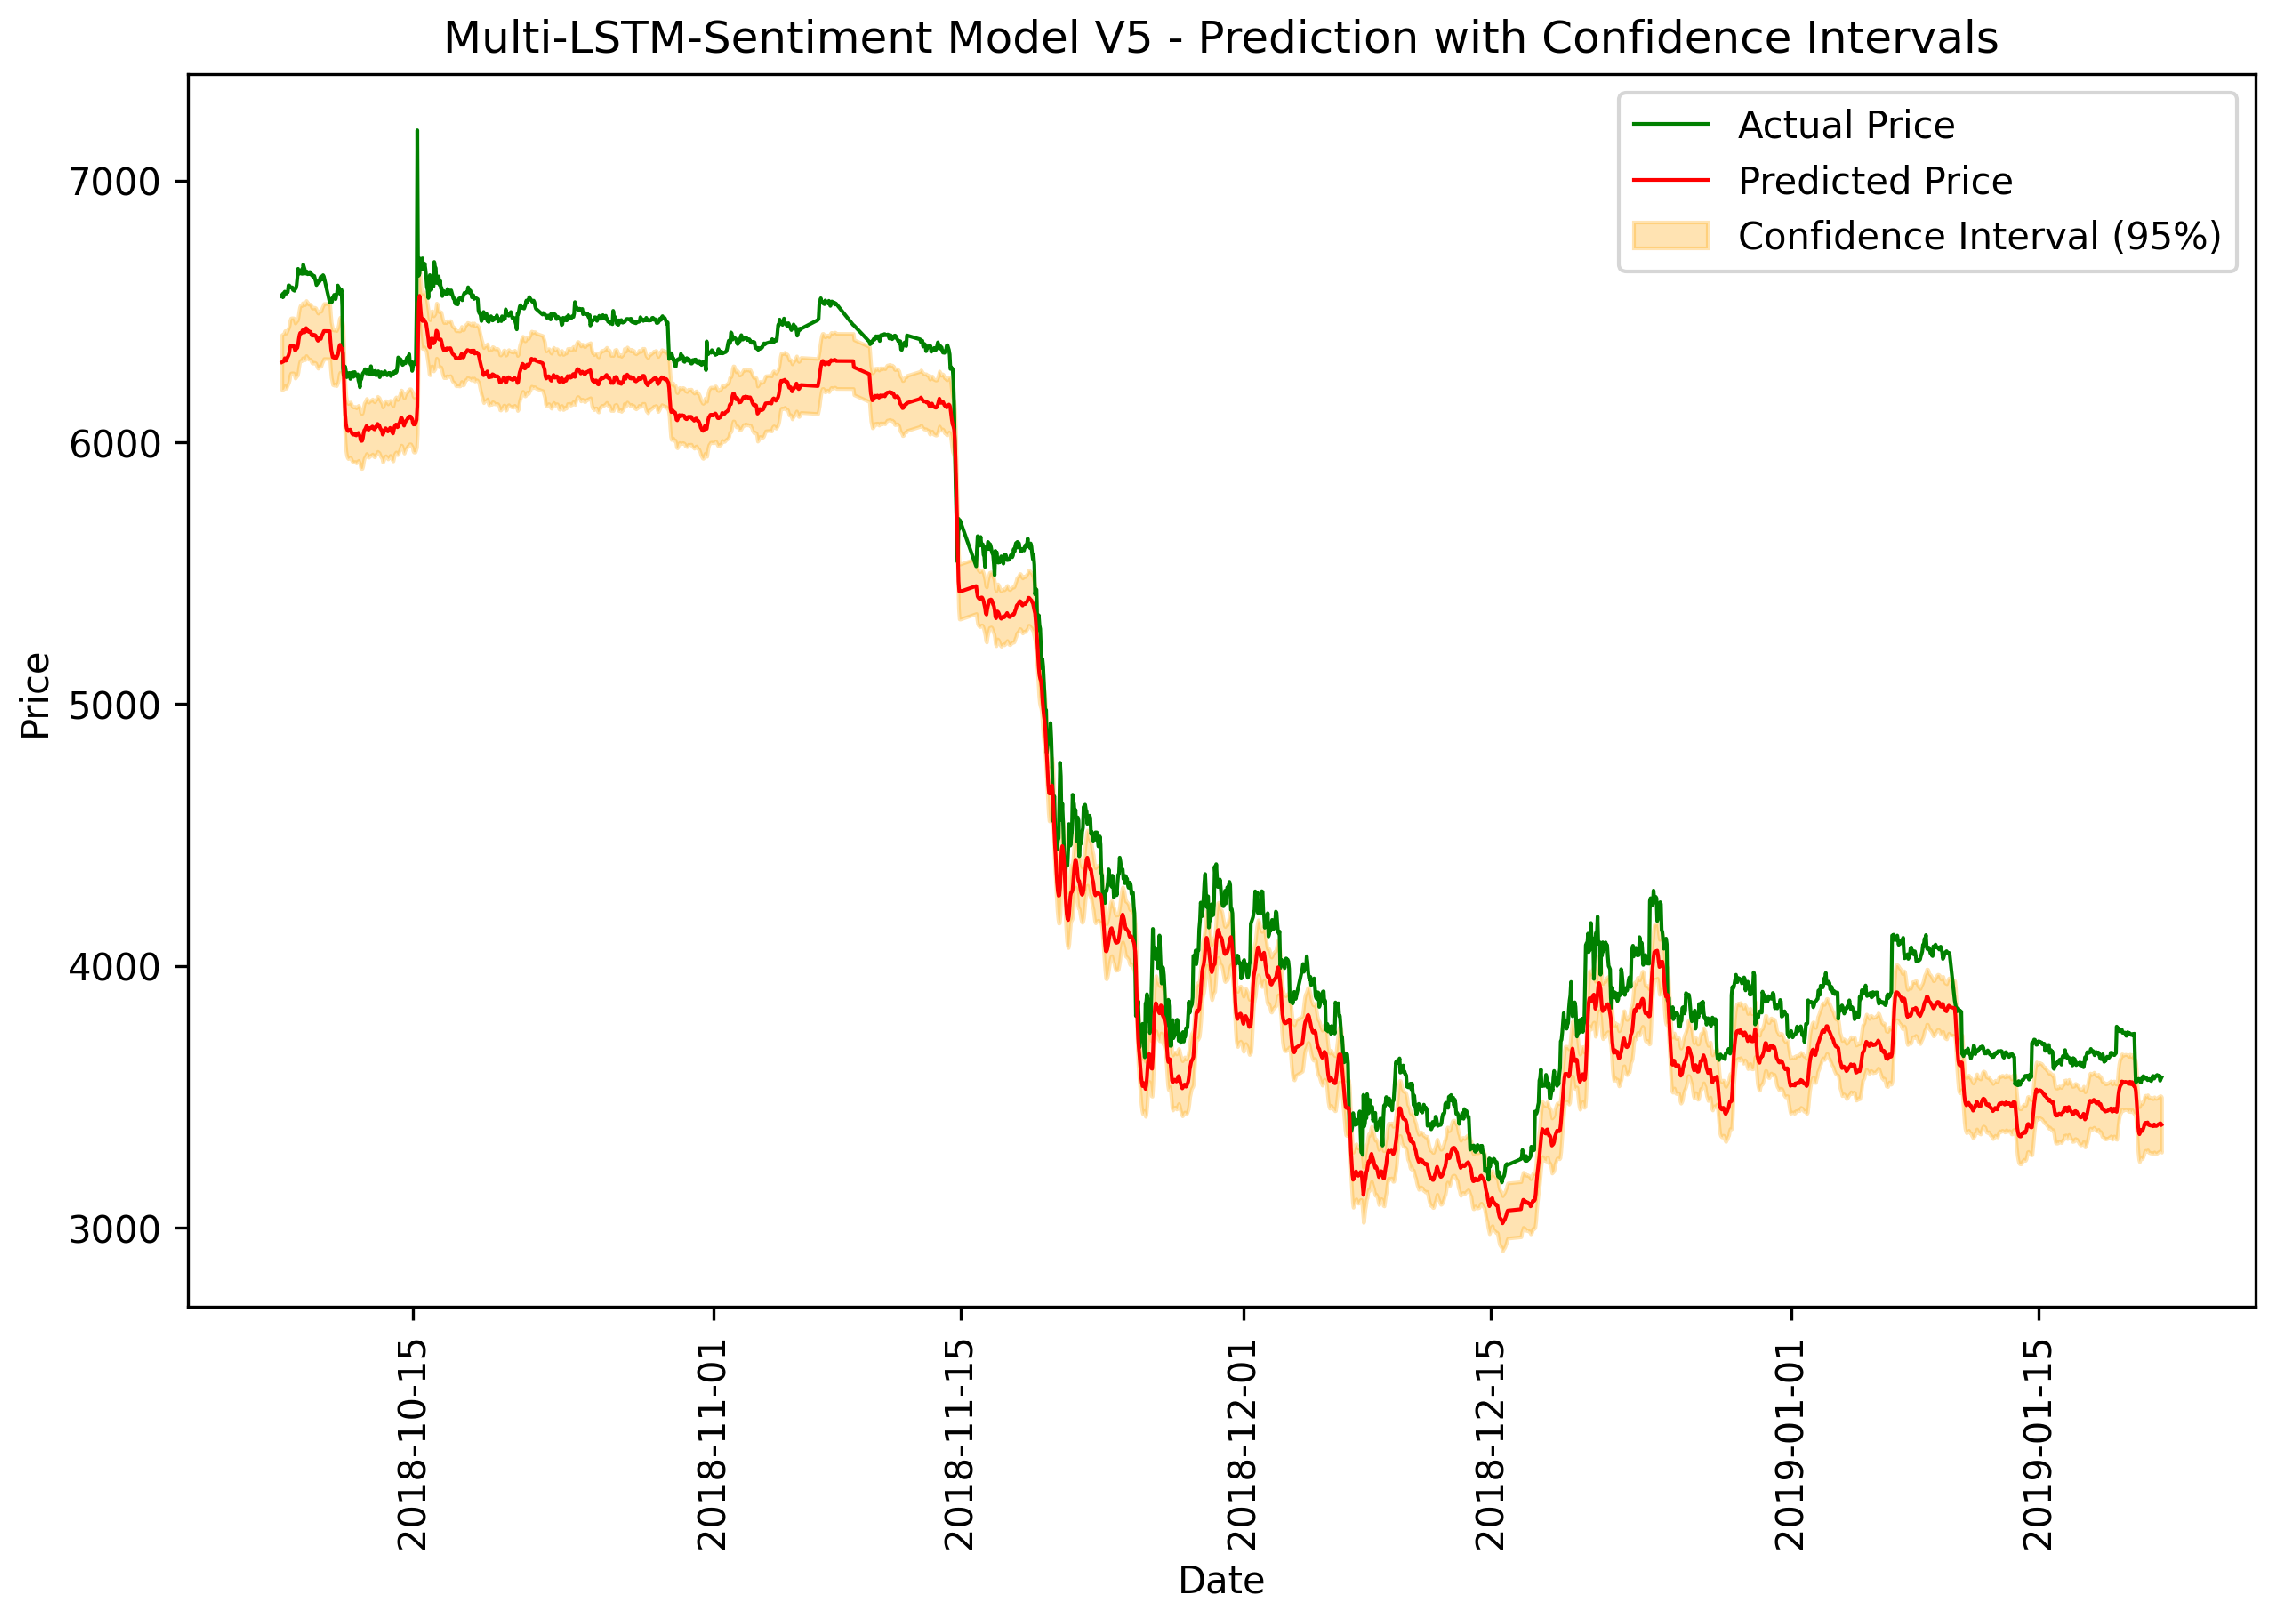
Figure 7.
Multi-LSTM-Sentiment: actual vs. predicted prices.
Figure 7.
Multi-LSTM-Sentiment: actual vs. predicted prices.
Figure 8.
Tuned Multi-LSTM-Sentiment: actual vs. predicted prices.
Figure 8.
Tuned Multi-LSTM-Sentiment: actual vs. predicted prices.
Figure 9.
Bidirectional LSTM-Sentiment: actual vs. predicted prices.
Figure 9.
Bidirectional LSTM-Sentiment: actual vs. predicted prices.
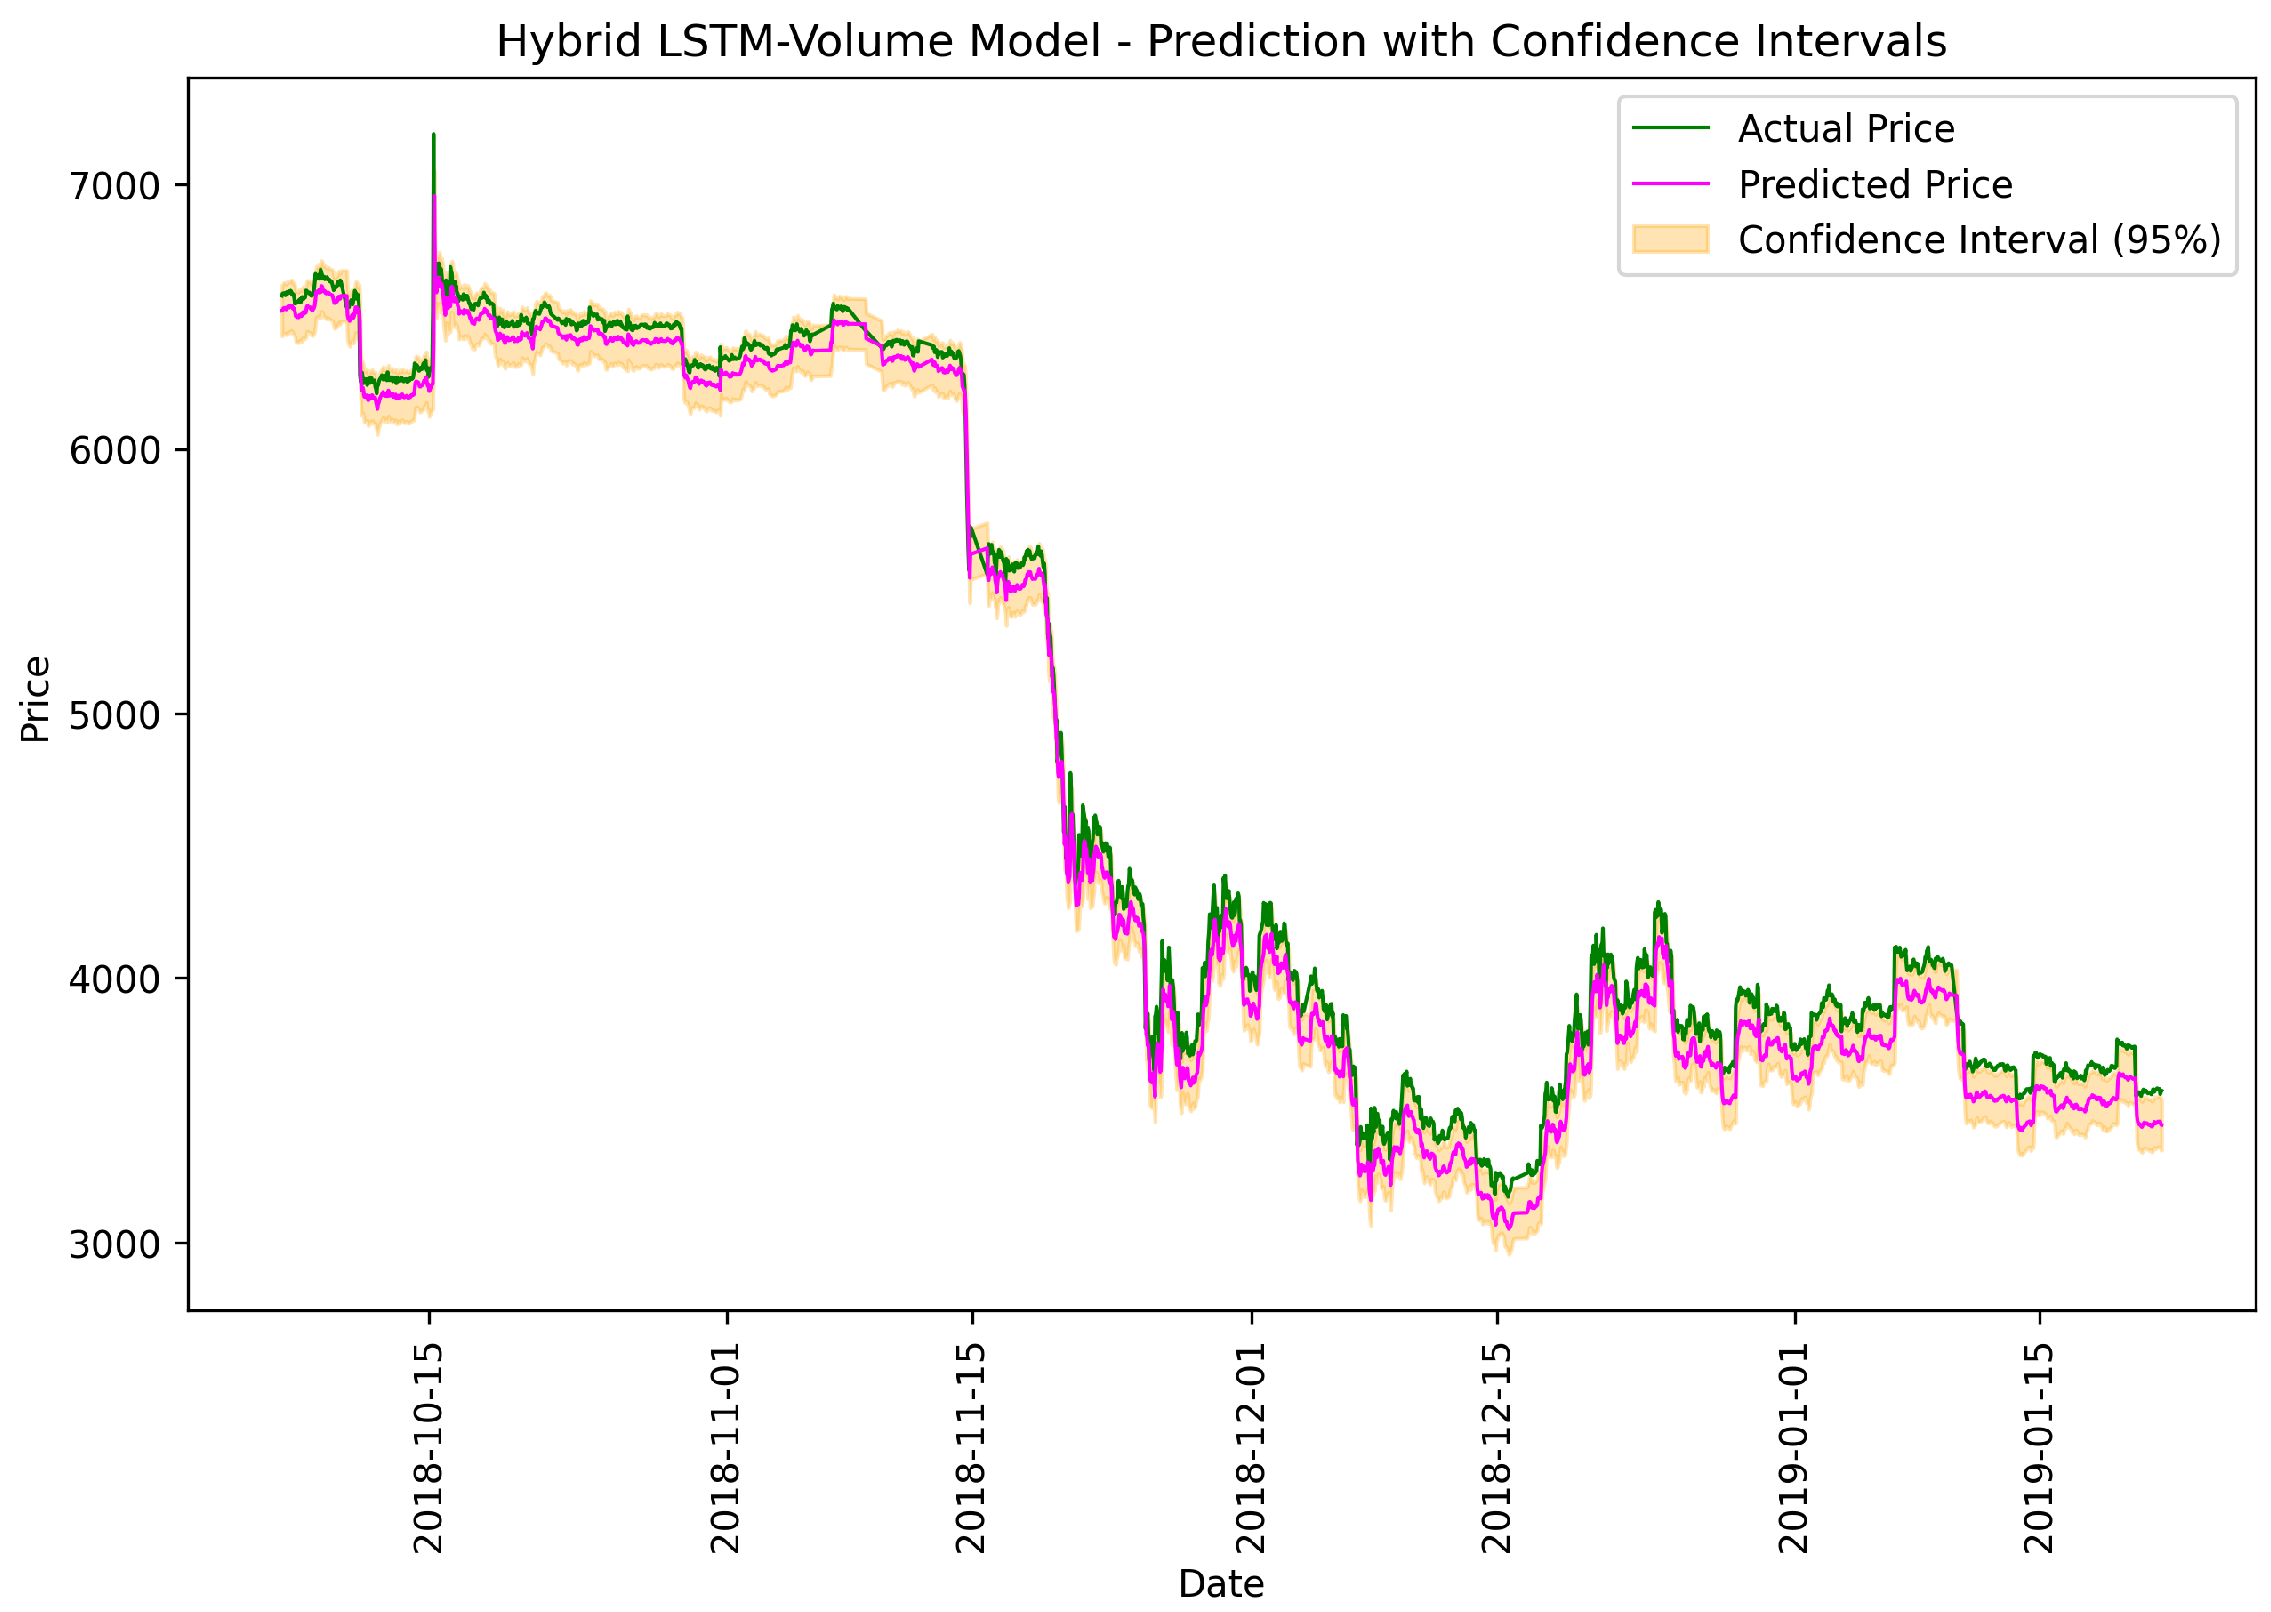
Figure 10.
Hybrid LSTM-Volume model: actual vs. predicted prices.
Figure 10.
Hybrid LSTM-Volume model: actual vs. predicted prices.
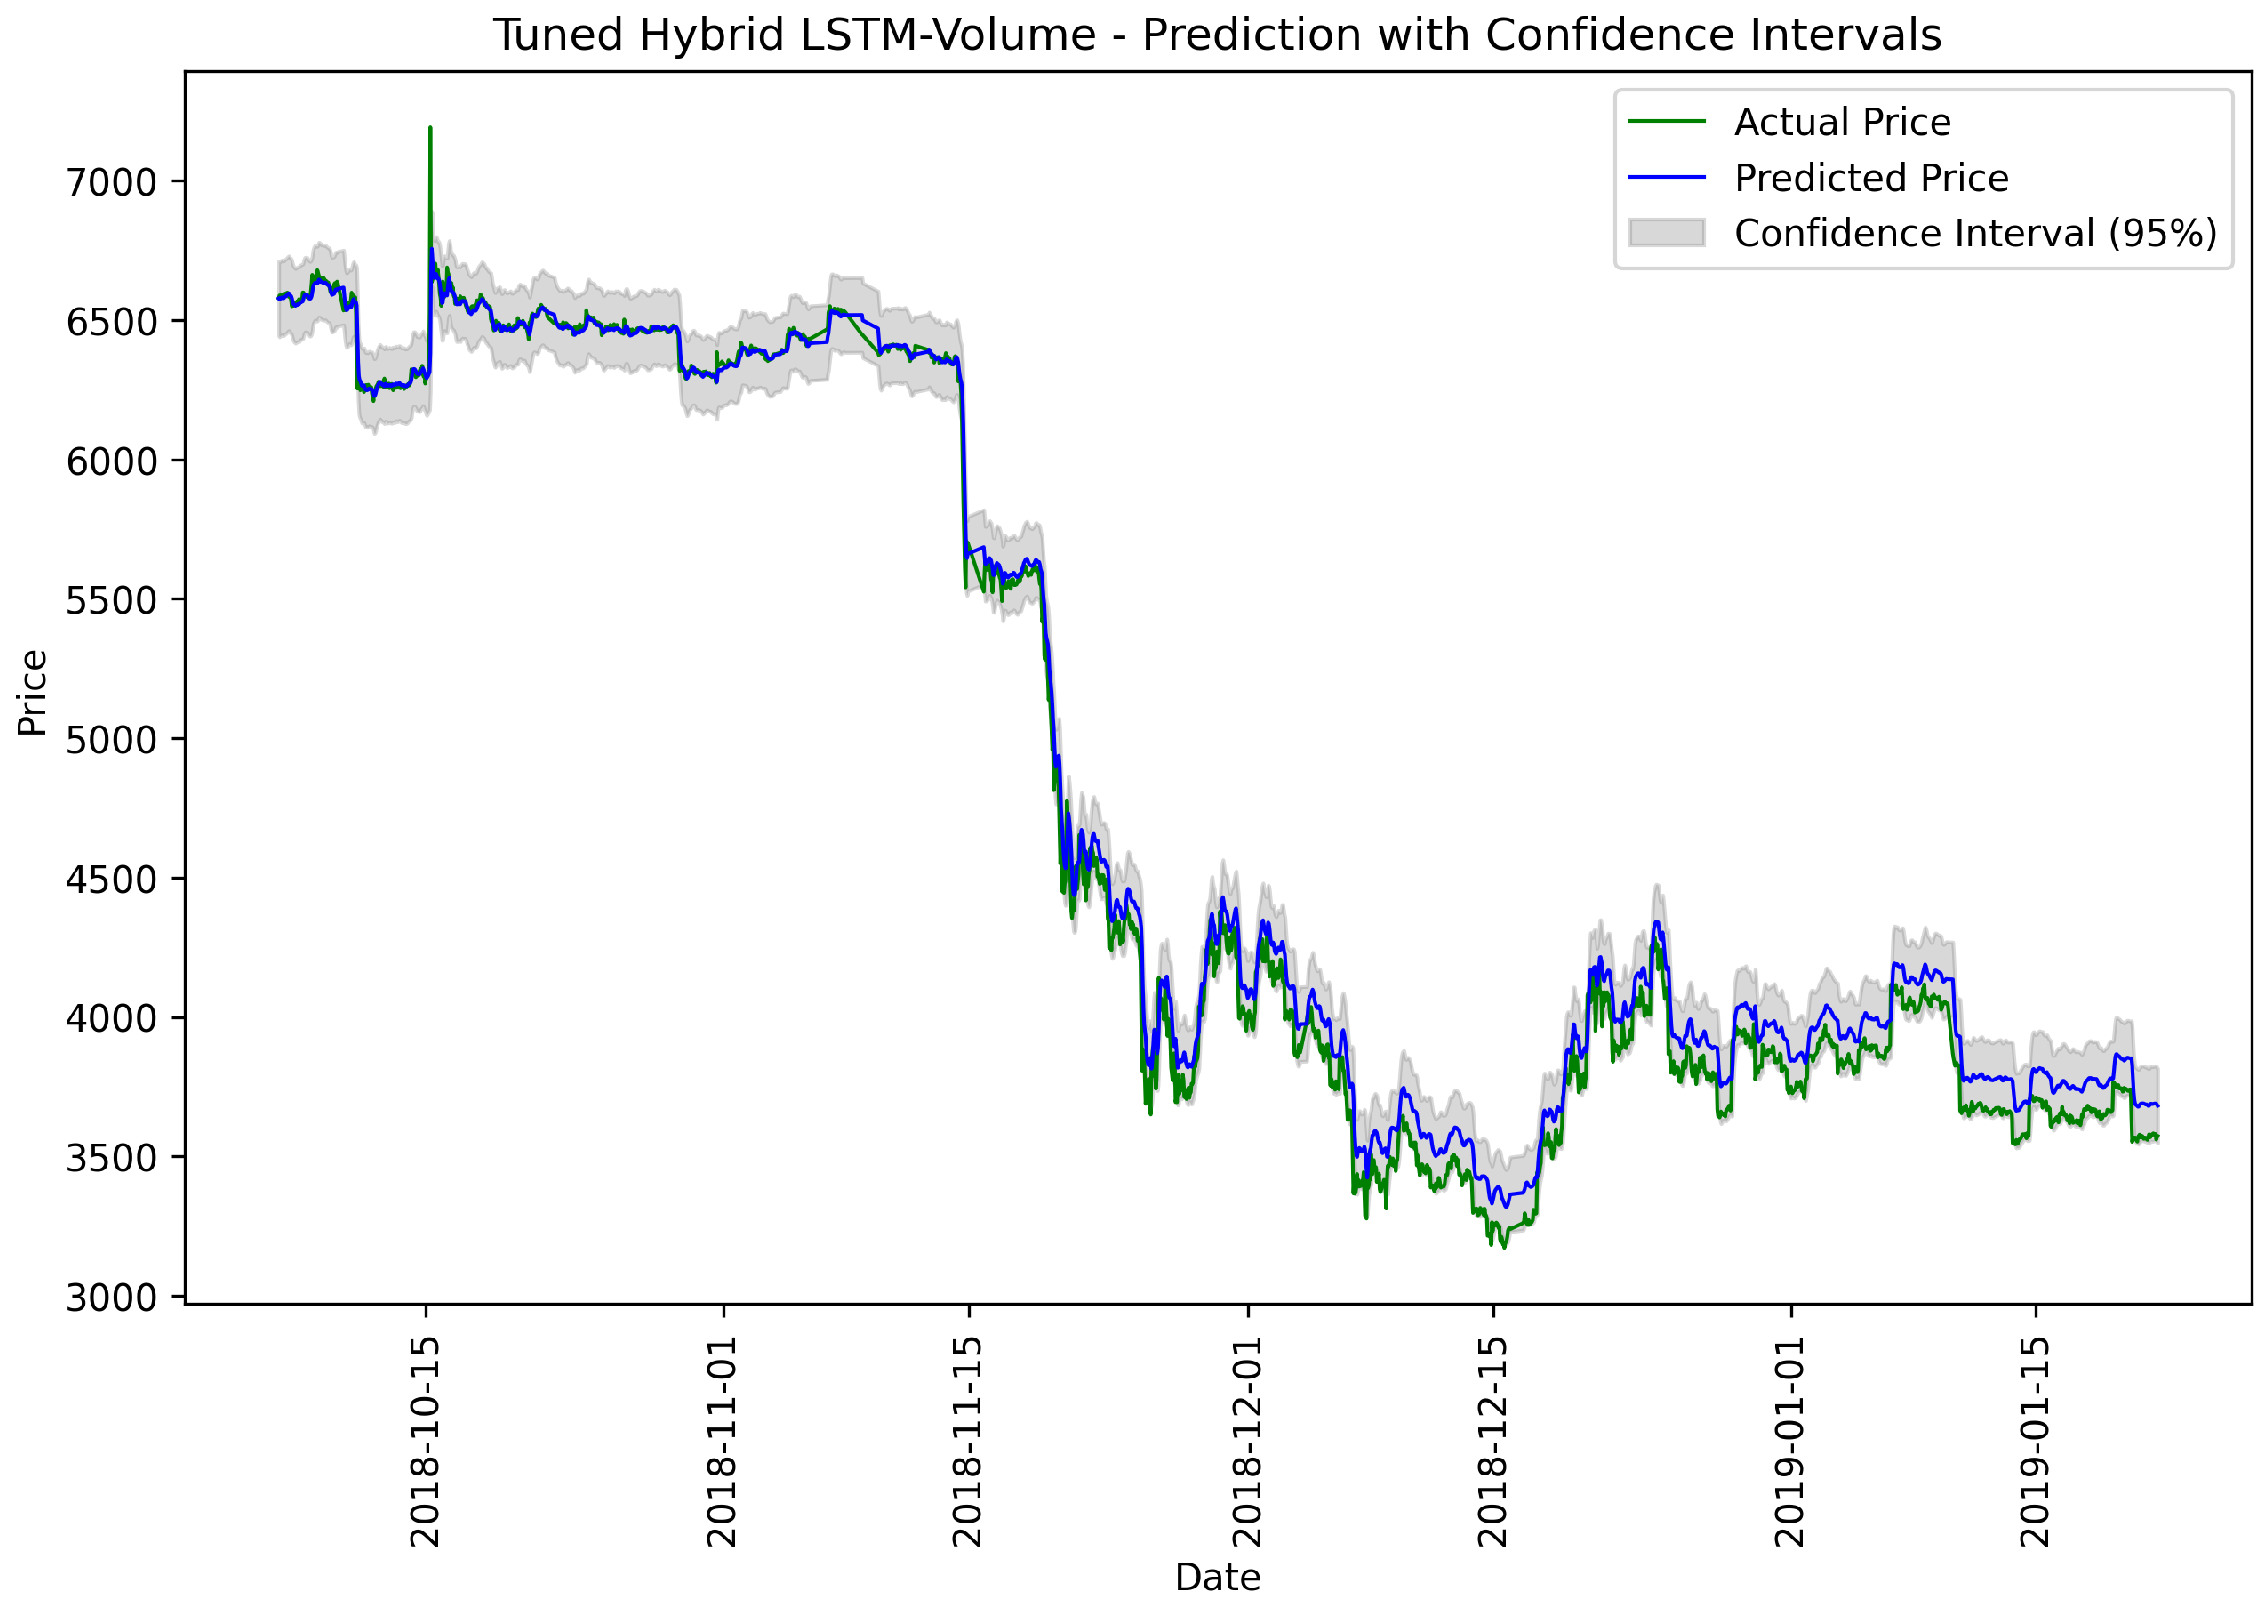
Figure 11.
Tuned Hybrid LSTM-Volume model: actual vs. predicted prices.
Figure 11.
Tuned Hybrid LSTM-Volume model: actual vs. predicted prices.
Figure 12.
Training and validation error trends for Multi-LSTM-Sentiment under 70%–15%–15% split across metrics: MAE, MAPE, and MSE.
Figure 12.
Training and validation error trends for Multi-LSTM-Sentiment under 70%–15%–15% split across metrics: MAE, MAPE, and MSE.
Figure 13.
Multi-LSTM-Sentiment: Actual vs. Predicted Prices under 70%–15%–15% split.
Figure 13.
Multi-LSTM-Sentiment: Actual vs. Predicted Prices under 70%–15%–15% split.
Figure 14.
Training and validation error trends for Tuned Multi-LSTM-Sentiment under 70%–15%–15% split across metrics: MAE, MAPE, and MSE.
Figure 14.
Training and validation error trends for Tuned Multi-LSTM-Sentiment under 70%–15%–15% split across metrics: MAE, MAPE, and MSE.
Figure 15.
Tuned Multi-LSTM-Sentiment: actual vs. predicted prices under 70%–15%–15% split.
Figure 15.
Tuned Multi-LSTM-Sentiment: actual vs. predicted prices under 70%–15%–15% split.
Figure 16.
Training error trends for feature sequence and model ablation.
Figure 16.
Training error trends for feature sequence and model ablation.
Figure 17.
Validation error trends for feature sequence and model ablation.
Figure 17.
Validation error trends for feature sequence and model ablation.
Figure 18.
Multi-LSTM V5: actual vs. predicted prices under ablation experiment.
Figure 18.
Multi-LSTM V5: actual vs. predicted prices under ablation experiment.
Figure 19.
Univariate LSTM: actual vs. predicted prices.
Figure 19.
Univariate LSTM: actual vs. predicted prices.
Table 1.
Summary of related work.
Table 1.
Summary of related work.
| Study | Model | Features | Sentiment Analysis | Key Findings |
|---|
| Abraham et al. (2018) [9] | Linear models | Tweet volume, Google Trends, sentiment | Yes | Sentiment analysis unreliable; tweet volume a robust predictor. |
| Philippas et al. (2019) [8] | Multiple regression | Google Trends, Twitter data | Yes | Media attention impacts Bitcoin prices. |
| Mudassir et al. (2020) [17] | SVM, LSTM | Statistical indicators (e.g., MA, RSI) | No | Machine learning outperforms time-series models. |
| Zuvela et al. (2022) [14] | Univariate RNN LSTM | Historical price data | No | Recommended incorporating sentiment analysis. |
| Critien et al. (2022) [18] | Bi-LSTM, CNN | Sentiment scores, tweet volume | Yes | Voting classifiers enhance predictive accuracy. |
| Seabe et al. (2023) [19] | Bi-LSTM, GRU | Historical data, RNN architectures | No | Bi-LSTM outperforms other RNN variants. |
| Gu et al. (2024) [10] | FinBERT-LSTM | Financial news sentiment, historical prices | Yes | Integration of sentiment and price trends improves accuracy. |
| Saleem et al. (2024) [7] | Logistic regression | Sentiment variance | Yes | Negative sentiment impacts price declines more than positive sentiment. |
| Mardjo et al. (2024) [13] | HyBiLSTM | Social, economic variables | Yes | Hybrid models capture both linear and non-linear dynamics. |
Table 2.
Performance metrics comparison for Multi-LSTM models.
Table 2.
Performance metrics comparison for Multi-LSTM models.
| Model | MSE | RMSE | MAE |
|---|
| Multi-LSTM-Sentiment | 9.80247 | 0.00990 | 0.00934 |
| Tuned Multi-LSTM-Sentiment | 9.29112 | 0.00304 | 0.00196 |
| Univariate RNN LSTM [14] | 340,685,452.13732 | 18,446.6821 | 13,094.2243 |
Table 3.
Performance comparison for Bidirectional LSTM.
Table 3.
Performance comparison for Bidirectional LSTM.
| Model | MSE | RMSE | MAE |
|---|
| Tuned Multi-LSTM-Sentiment | 9.29112 | 0.00304 | 0.00196 |
| Bidirectional LSTM-Sentiment | 9.20827 | 0.00350 | 0.00253 |
Table 4.
Performance comparison for Hybrid LSTM-Volume models.
Table 4.
Performance comparison for Hybrid LSTM-Volume models.
| Model | MSE | RMSE | MAE |
|---|
| Hybrid LSTM-Volume | 2.96226 | 0.00544 | 0.00499 |
| Tuned Hybrid LSTM-Volume | 2.97542 | 0.00545 | 0.00420 |
Table 5.
Performance metrics for feature sequence and model ablation.
Table 5.
Performance metrics for feature sequence and model ablation.
| Model | MSE | RMSE | MAE | MAPE |
|---|
| Multi-LSTM V5 |
0.00015
|
0.01235
|
0.01198
|
13.33914
|
Table 6.
Test performance metrics for univariate and multivariate models.
Table 6.
Test performance metrics for univariate and multivariate models.
| Model | MSE | RMSE | MAE | MAPE |
|---|
| Univariate LSTM |
0.00011
|
0.01072
|
0.01013
|
13.34481
|
| Tuned Multi-LSTM-Sentiment |
9.29013
|
0.00304
|
0.00196
|
2.20874
|
Table 7.
Performance metrics comparison for all models.
Table 7.
Performance metrics comparison for all models.
| Model | MSE | RMSE | MAE |
|---|
| Multi-LSTM-Sentiment |
9.80247
|
0.00990
|
0.00934
|
| Tuned Multi-LSTM-Sentiment |
9.29112
|
0.00304
|
0.00196
|
| Bidirectional LSTM-Sentiment |
9.20827
|
0.00350
|
0.00253
|
| Hybrid LSTM-Volume |
2.96226
|
0.00544
|
0.00499
|
| Tuned Hybrid LSTM-Volume |
2.97542
|
0.00545
|
0.00420
|


