Article

Potentials and Limitations of Using Sentinel Data for Power System Operation and Control: Case Study of Protection Against Forest Fires and Aerosol Contamination

by
Amalija Božiček
1,*,
Božidar Filipović-Grčić
2,
Bojan Franc
2,
Davor Škrlec
2 and
Frano Tomašević
2
1
Adnet Ltd., 10000 Zagreb, Croatia
2
University of Zagreb, Faculty of Electrical Engineering and Computing, 10000 Zagreb, Croatia
*
Author to whom correspondence should be addressed.
Appl. Sci. 2025, 15(3), 1533; https://doi.org/10.3390/app15031533
Submission received: 21 November 2024 / Revised: 26 January 2025 / Accepted: 30 January 2025 / Published: 3 February 2025

Abstract

:

Featured Application

This paper’s results and conclusions can be applied in future research on protection against forest fires and aerosol contamination, especially in power network operation, control, and planning.

Abstract

The power network is directly or indirectly exposed to various weather and climate conditions that can positively and negatively influence it. Forest fires and various aerosol contaminations may negatively affect the power network. Surface observations and measurements (e.g., weather stations) help protect against unfavorable influences, but the network is usually poor. That challenge may be solved by including satellite data in the power network planning, operation, and maintenance. This article presents the possibilities of using Sentinel mission’s data, at various temporal and spatial levels, for those purposes through examples of protection against forest fires and aerosol contamination. In the case of forest fires, satellite data enable a more-precise calculation of forest fire-spreading danger for areas with no installed weather stations, which may be used in the power system contingency analysis calculation. The analysis showed that aerosol contamination has a correlation with outage appearance in the 25 kV 50 Hz electric traction network. Sentinel 5p data may serve as a tool in a surface air-quality measurement data control to confirm/deny the high concentration of PM10 particles. Analysis showed that Sentinel data are favorable for power network operations on intra-day and day-ahead operations, as well as for long-term operations, which include planning and maintenance. The spatial resolution of Sentinel data is more than enough to fulfill the surface weather station network. Satellite data also enable the use of additional data that are not measured at ground stations.

1. Introduction

In an era when human life significantly depends on the electricity supply, uninterrupted power system operation is a daily challenge. The power system components are located mostly above the ground and are therefore exposed to various weather and climate conditions that can affect them both positively and negatively. To ensure optimal energy transfer, transmission system operators in the power system control operational service use different tools, one of them being contingency analysis. The inputs for the contingency analysis algorithm can include various types of information about the power system, as well as terrestrial and remote sensing meteorological data and other relevant information.
An example of such an indirect influence of weather and climate on the power network is forest fires. The behavior of the forest fire significantly depends on the weather conditions and the state of the ground, and its consequences are well known. It is less known that smoke and ash may damage overhead lines, decrease their transmission capacity, etc. Smoke and ash, together with pollen, dust, sea salt, and other atmospheric pollutants, are known as aerosols. Aerosols that may damage the power network have various atmospheric sources, dimensions, and behaviors.
Forest fires’ challenges and disastrous consequences are well known. Unfortunately, there are still many gaps in the protection against them. One of them is a lack of meteorological measurements, especially on the microscale, and information about the state of the landscape. It may be fulfilled using satellite data, e.g., Sentinel missions [1]. Also, there is a lack of weather and air-quality data in the aerosol contamination monitoring. The Croatian air-quality network is located mainly in the industrial zones [2]. The disruption in the power system operation could appear because of high levels of aerosol that may be released outside of industrial zones. The experience from the transmission system operator (TSO) is that aerosol originating from forest fires, sea salt, dust released during grain harvesting, etc., may cause significant problems, which was a motivation for exploring the possibilities of using Sentinel 5p data in aerosol contamination monitoring.
Satellite data can be used in various ways to protect the power network against forest fires and aerosol contamination. The literature provides many examples of Sentinel 2 data applications in monitoring urban and rural landscapes by calculating various indices [3,4,5,6,7]. Landscape monitoring may include vegetation growth monitoring [8], burnt area detection [9], and fire severity classification [10].
A group of authors continuously researched the Sentinel 3 Fire Radiative Power (FRP) product’s performance in active fire detection and fire radiative power retrieval in various parts of the world. A comparison of Sentinel 3 FRP products with similar data sources showed that FRP performances are at a high level [11,12,13].
Air temperature and land surface temperature are strongly connected to forest fire behavior [14]. The land surface temperature is possible to obtain by using the Sentinel 3 Land Surface Temperature (LST) product [15]. Its performances showed an accuracy of 1.8 K and a precision of 1.2 K [16]. These performances indicate the possibilities of the Sentinel 3 LST data application in forest fire-spreading prediction and monitoring. Including information about the land surface temperature together with information about vegetation moisture in fire-spreading prediction can produce results similar to or better than those obtained using only the Canadian Fire Weather Index (FWI) [17]. The other factor that can significantly influence forest fire ignition and spreading is soil moisture. In the literature, it is shown that the soil and/or vegetation moisture can be calculated through the evening and morning [18] or some other time interval [19], LST difference, as well as the difference between LST and air temperature [20].
As mentioned, in addition to monitoring land conditions and events on the Earth’s surface, it is also possible to use satellite data to monitor atmospheric events and the atmosphere’s composition. For the atmosphere’s composition or the aerosol contamination monitoring, often data recorded by the MODIS instrument [21,22] and the TROPOMI instrument [23] are used. The TROPOMI instrument is installed on the European Space Agency’s (ESA) satellite mission Sentinel 5p [24]. Satellite data usually contain information about the aerosol layer height or optical depth, aerosol absorbing index, ozone, nitrogen dioxide, sulfur dioxide, methane, etc. [23,24].
Among the other parameters, the concentration of PM10 and PM2.5 particles are usually measured at surface air-quality stations [2], but it can also be calculated from the information about aerosol optical depth or layer height and aerosol absorption information. A comparison of the computed data and data measured using surface air-quality stations showed a significant correlation [25,26].
In the energy industry, aerosol contamination can be significant at various levels. Power companies need to evaluate the Site Pollution Severity (SPS) before installing new power network components directly exposed to aerosol contamination and other atmospheric conditions. It is possible to measure SPS through direct and indirect aerosol contamination measurements (IEC 60815-1 and IEC 60815-4) [27,28]. SPS estimation can be conducted in several ways, e.g., considering the highest recorded value, the average of several recorded highest values, or simply following the IEC 60815-1 recommendations that require the inclusion of additional data [29].
Aerosol contamination monitoring and modeling using satellite data can also be used for planning activities through the creation of contamination maps [30] and the selection of overhead lines [31]. Some authors have compared satellite data recorded by various instruments with ground truth results for different parts of the world [26,32], but there is no research for Croatia and its complex geographical and climatological characteristics.
This article’s objective is to research the possibilities and limitations of using satellite data, focusing on Sentinel 2, 3, and 5p, in the power system control when forest fires develop and/or various aerosols highly contaminate the atmosphere. A detailed investigation of the satellite data application in the power system control enables other scientific research and new models and modules development. After the newly developed models and modules are implemented in the power system control on the operational and/or the planning level, the system’s functionality will be optimized, and various resources will be saved (e.g., adequate materials selection for the insulators will be made). Consequently, the availability of human resources will be optimized because the need for such frequent insulator monitoring and cleaning will be decreased, etc.

2. Materials and Methods
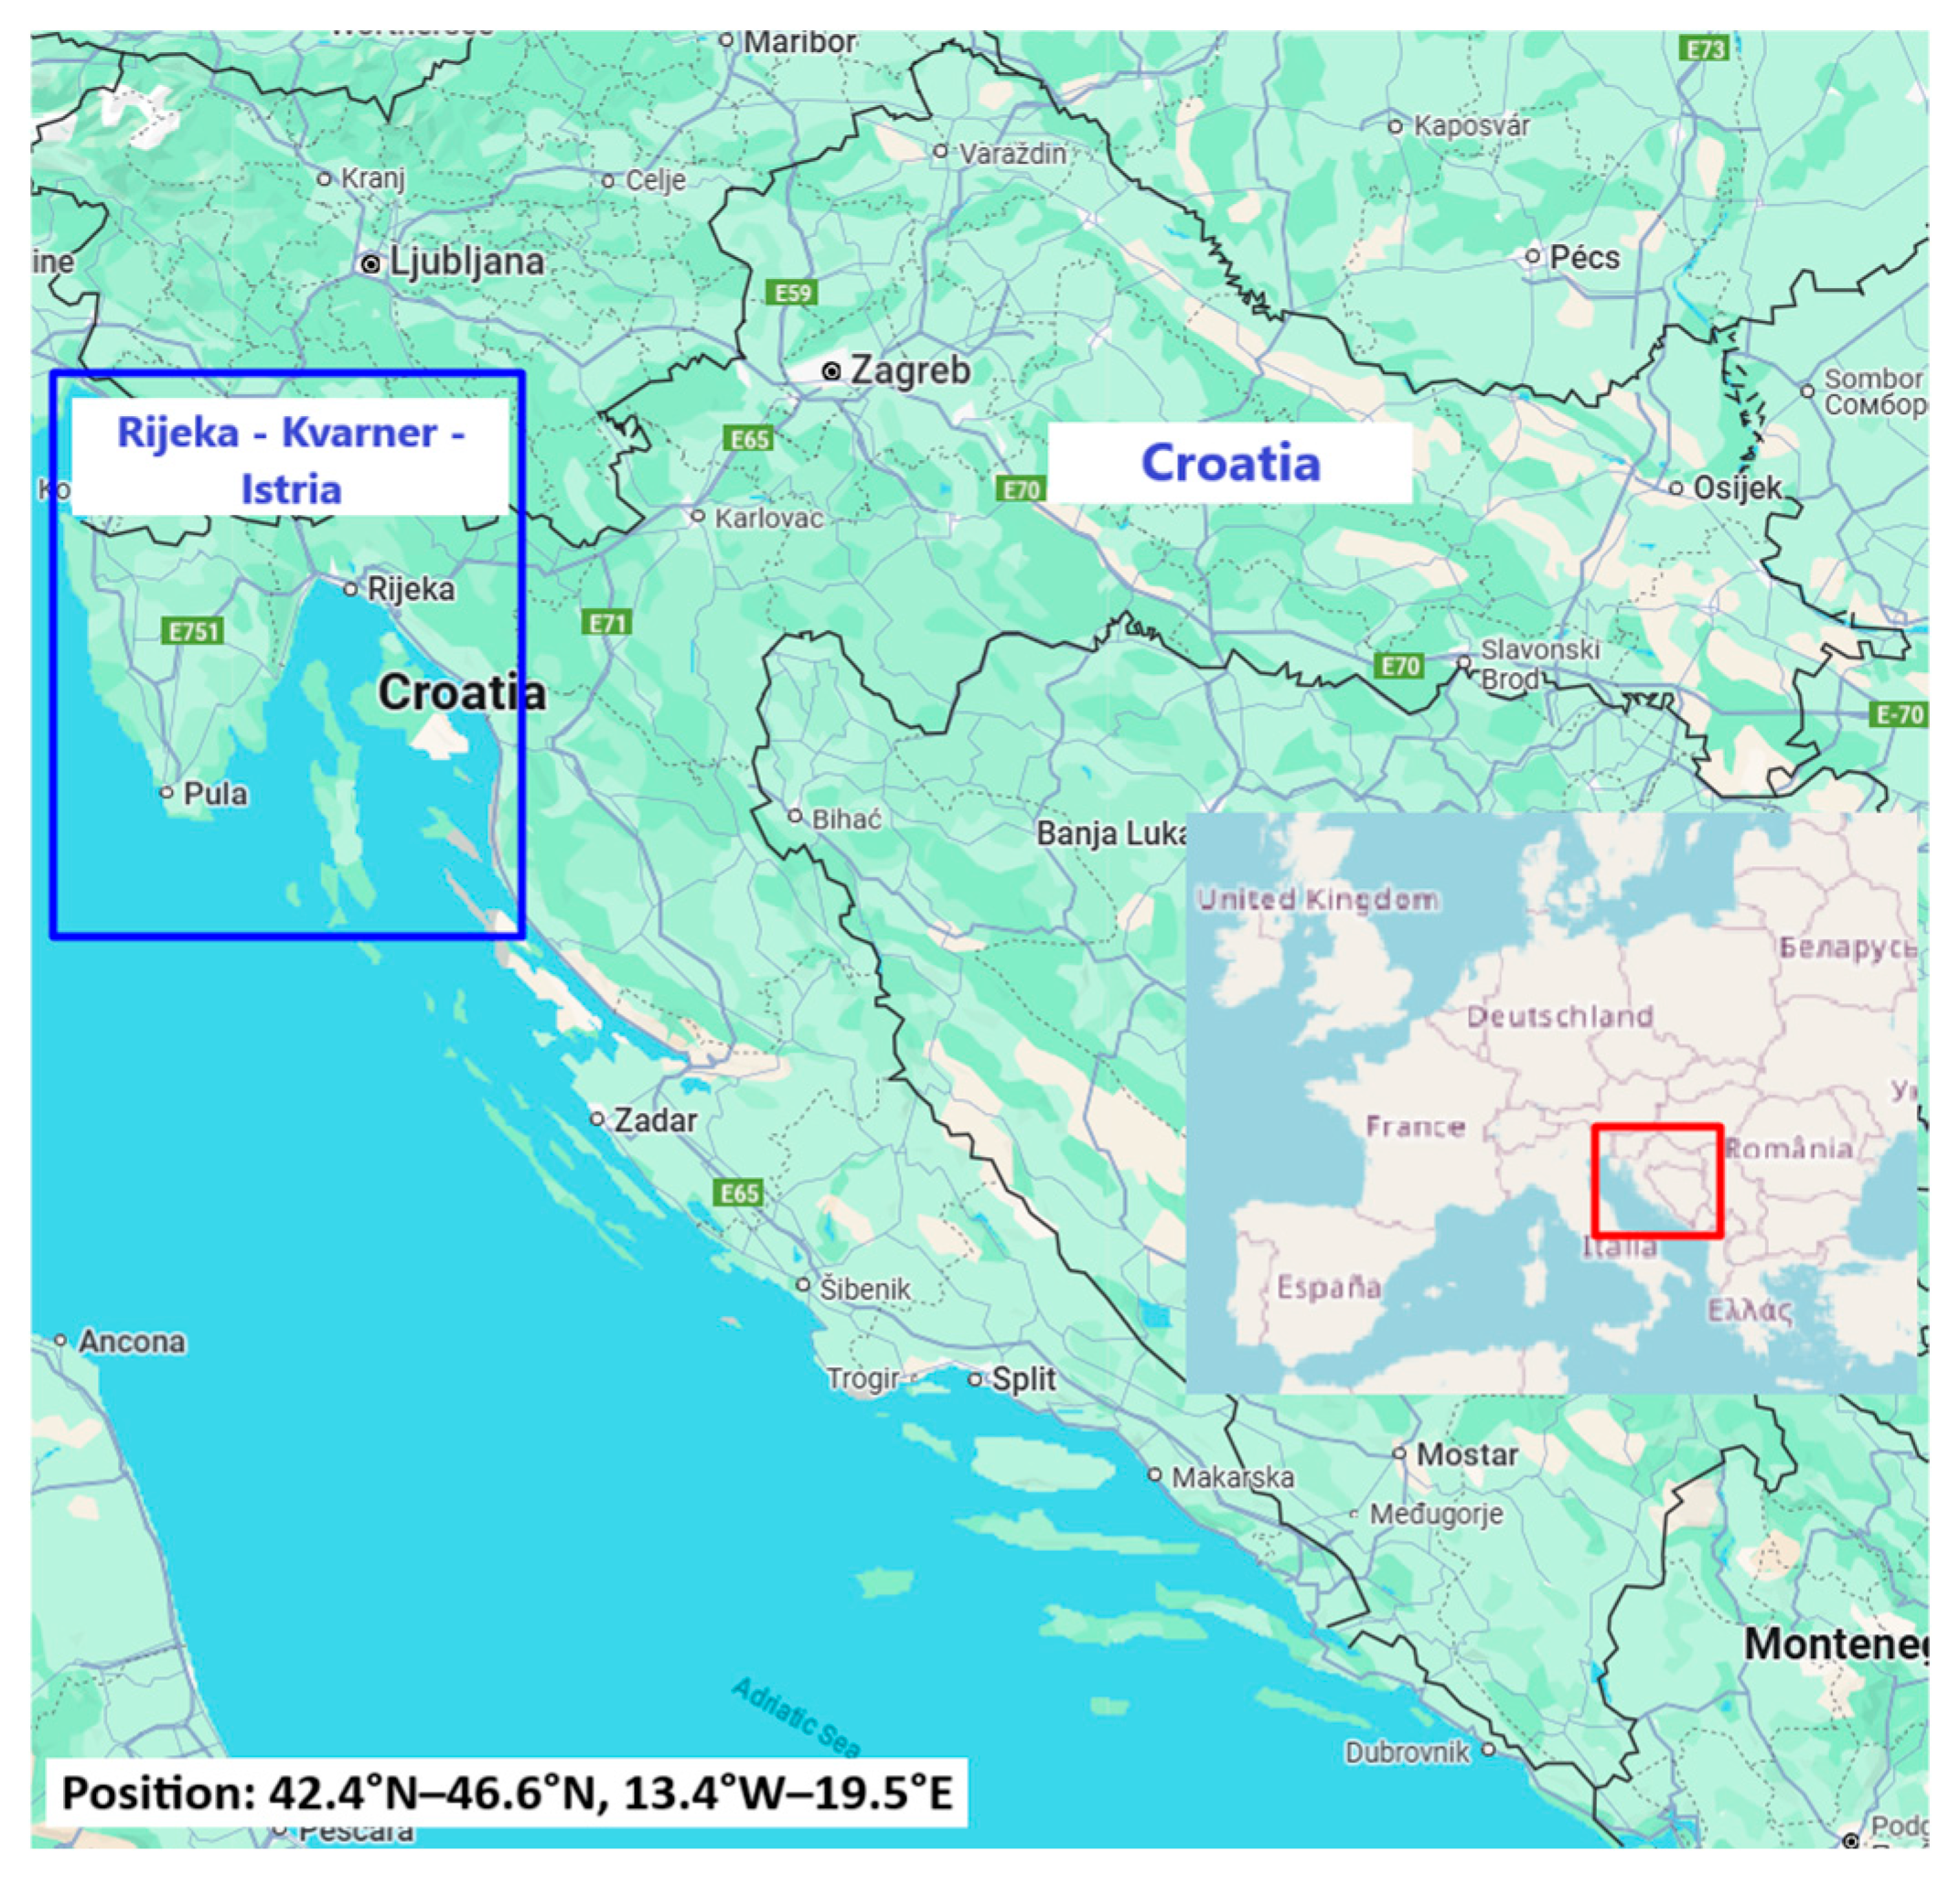
2.1. Study Area

This research is conducted for Croatia (Figure 1), a small Mediterranean country with a severe forest fire season and various aerosol contamination sources (e.g., sea salt, Saharan dust, etc.). This paper contributes to the overall aerosol contamination research and the applicability of the satellite data application with the research conducted for one Croatian region, which contains almost all specific Croatian conditions (the sea, islands, mountains, valleys, and rural and urban areas). This rich geographical diversity makes aerosol contamination monitoring and modeling more complex and forest fire protection challenging. The contribution of the power system protection against forest fires is in the analysis of the satellite data applicability.

2.2. Data

This research was based on data related to the power system and data related to the state of the ground and the atmosphere. Information about the power system topology and the power supply interruptions in the 25 kV overhead electric traction network was used. According to the recording method, data related to the state of the ground and the atmosphere can be grouped as surface measurements and as remote sensing data.

2.2.1. The Surface Measurements

The surface measurements include weather data (required for the FWI calculation using the Canadian method) and air-quality data. Weather data are obtained in a minute time resolution, and the air-quality data are on an hourly level. The FWI calculation is based on air temperature, wind speed, relative humidity, and precipitation [33]. According to the CIGRE [34] recommendation, weather data recorded on the power network towers and substations were used to obtain information relevant to the power network components. The air-quality data used are a concentration of PM10 particles recorded in one part of Croatia (the Rijeka–Kvarner–Istria region: blue box in Figure 1). The Croatian TSO provided weather data, and the Ministry of Economy and Regional Development of Croatia provided air-quality data.

2.2.2. The Remote Sensing Data
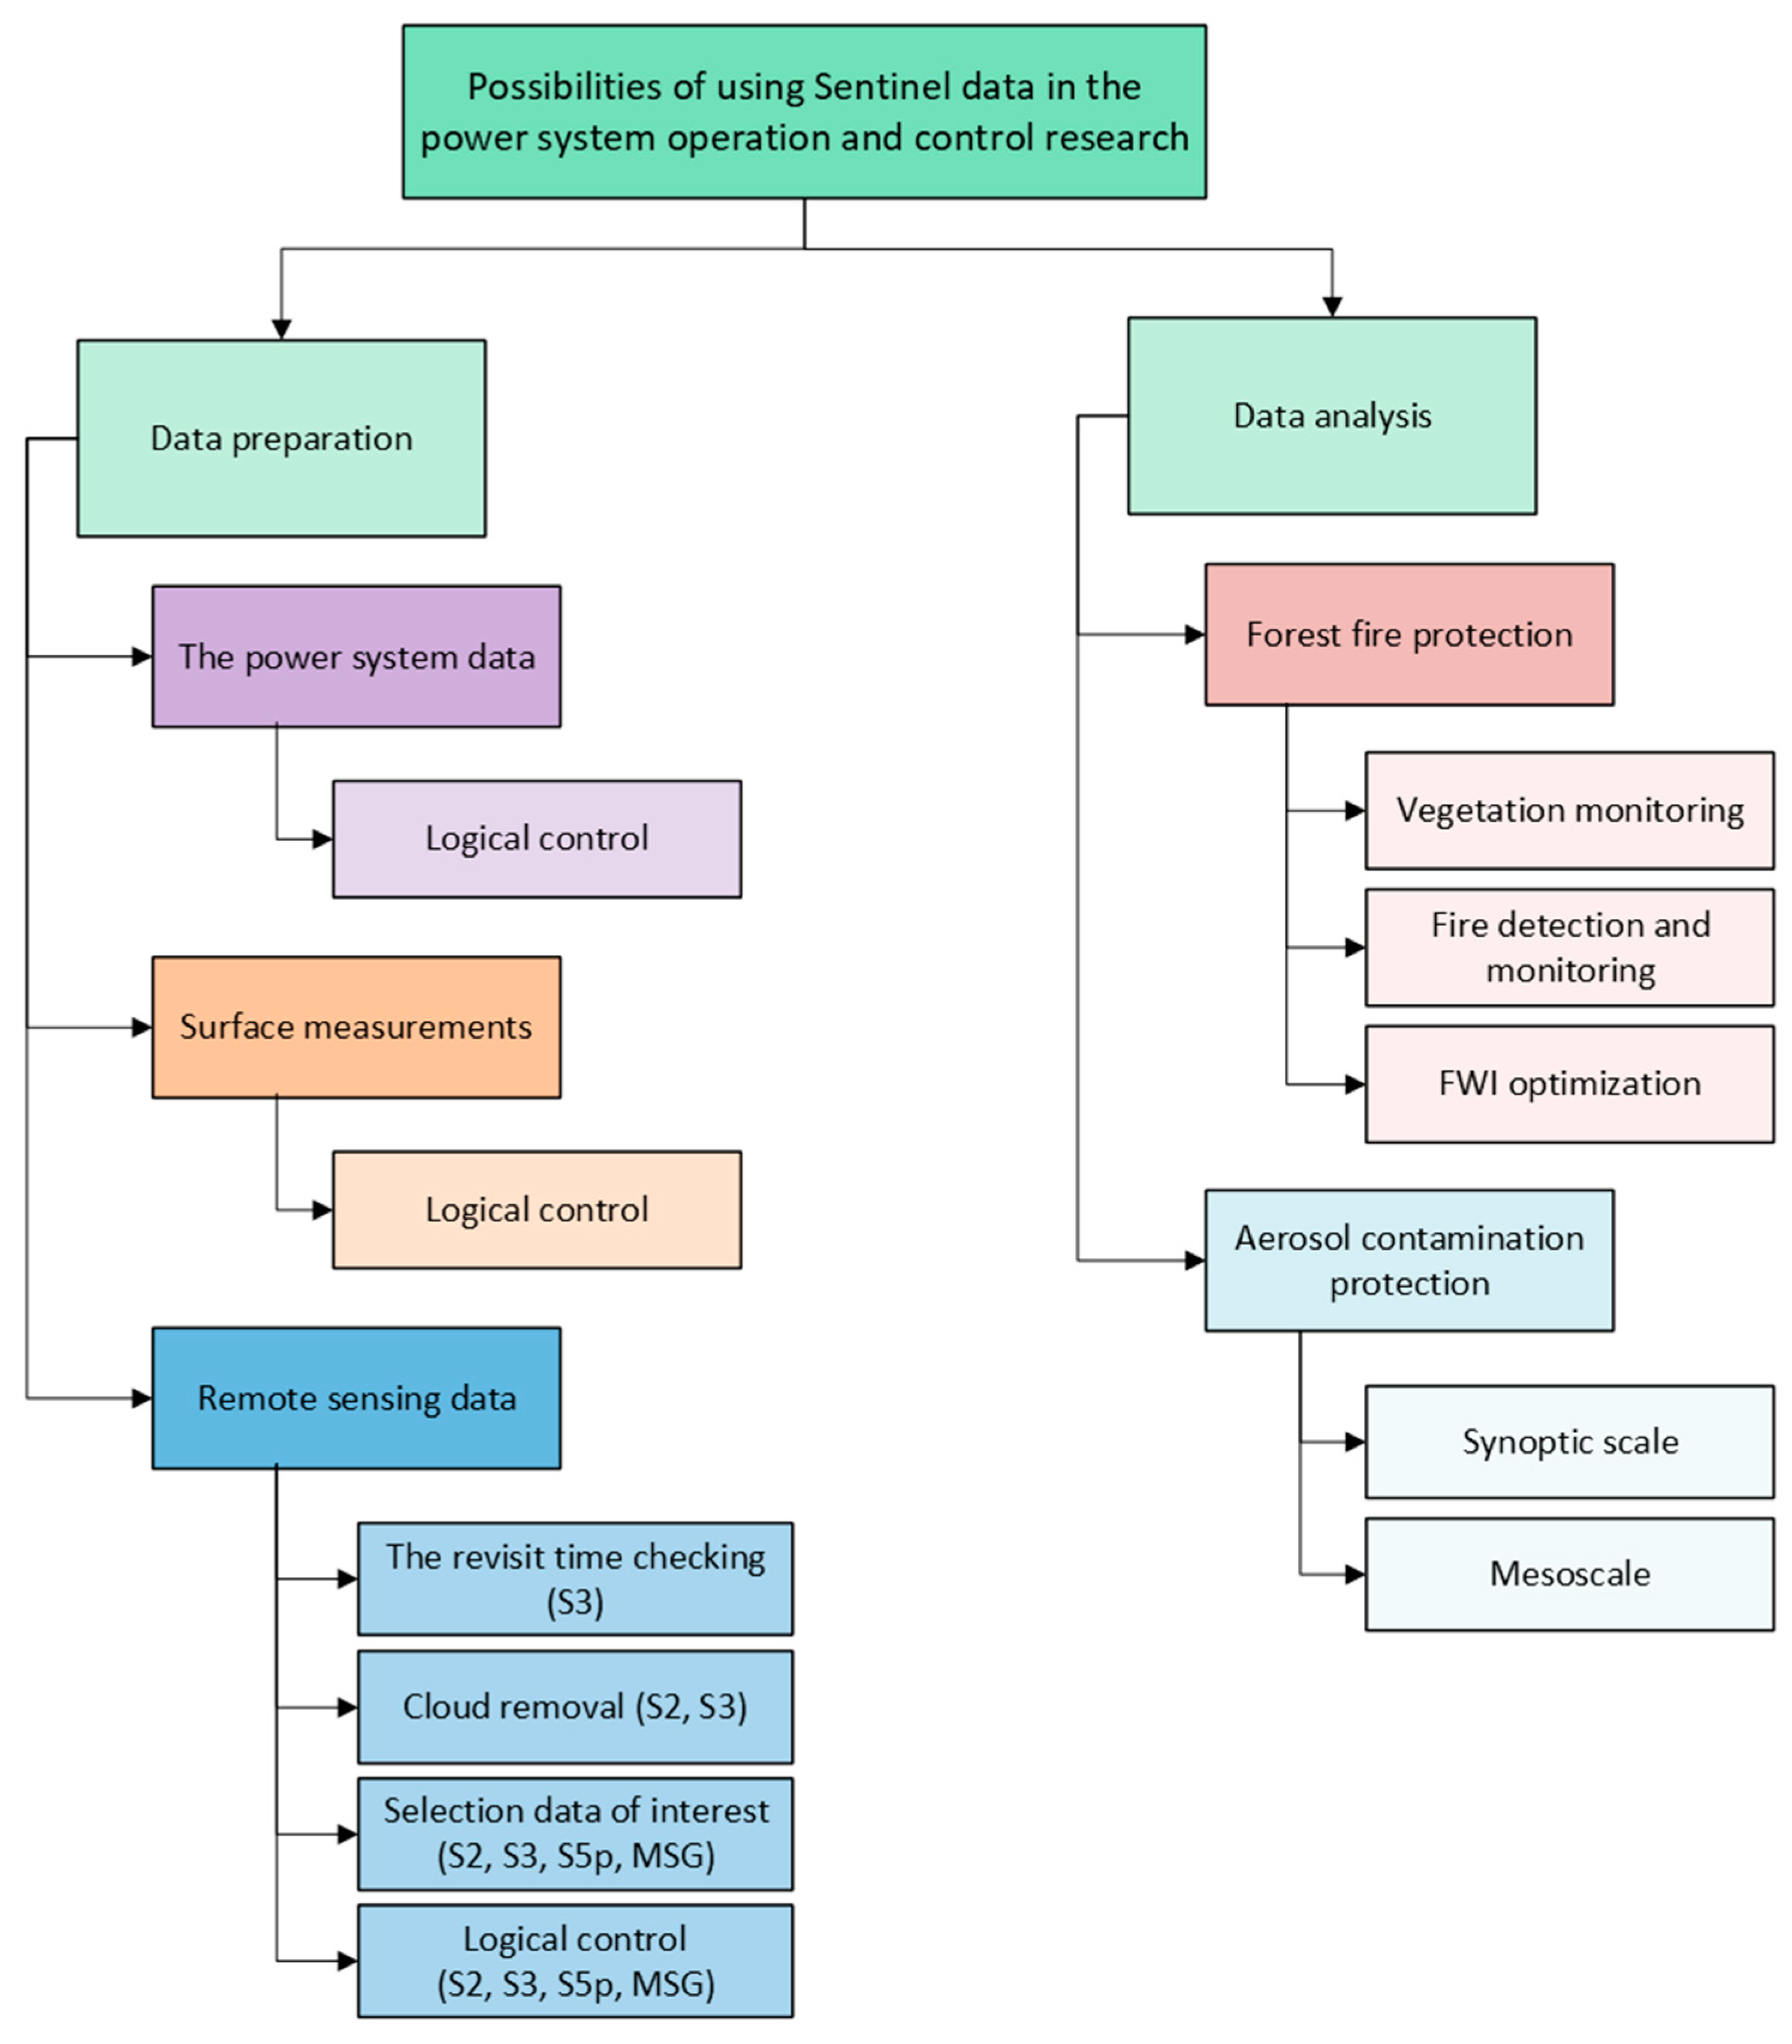
The remote sensing data used in this research are satellite data recorded by Sentinel missions operated by the ESA [14] and provided through the Copernicus Data Space Service [35]. The data used were recorded by the Sentinel 2 mission with the Multispectral Instrument (MSI) with the L2A level of processing. This product contains atmospheric-corrected images. The spectral bands of interest are 8A and 12, where band 8A is in the near-infra-red wavelengths, and band 12 is from the short-wave-infra-red wavelengths. The data’s spatial resolution is 20 m, and the temporal resolution is 5 days [36].
Data recorded by the Sentinel 3 mission are the LST and FRP. Data were recorded two times a day, before noon and in the evening, with a spatial resolution of 1 km [15]. The FRP data are recorded only when fire events exist when the satellite crosses over the area of interest with a spatial resolution of 1 km. The FRP presents the estimated released thermal energy of the fire event at the moment when the satellite crosses over the fire event [15].
The Sentinel 5p products used are the Aerosol Index (AI) and Aerosol Layer Height (LH). The AI is calculated from the 340–380 nm (AI340/380) and 354–388 nm (AI354/388) spectral band data. It can be positive and negative. Positive AI values indicate strongly absorbing aerosols in the UV spectral range (e.g., desert dust, biomass burning smoke, etc.). Near-zero and negative values indicate the presence of near-surface aerosols (e.g., sea salt). Strongly negative values indicate the presence of sulphates [37]. One of the differences in spectral bands is in bias and instrument error. The AI340/380 has a higher bias and a more-minor system error than the AI354/388 [37]. The Sentinel 5p data spatial resolution is 5.5 km × 3.5 km (5.5 km in the direction of satellite flight and 3.5 km in the direction of perpendicular flight at the nadir). Aerosol vertical dispersion monitoring is optimal in a resolution of 250 m. The data are retrieved once a day [1,37].
This research also used data recorded by the SEVIRI instrument on the Meteosat Second Generation (MSG) satellite operated by EUMETSAT. It used cloud cover images from the Dust RGB product. The spatial resolution of the SEVIRI instrument images is up to 3 km, and the temporal resolution is 15 min [38].
Information about forest fire events provided by the European Forest Fire Information System (EFFIS) [39] can also be categorized as remote sensing data. The forest fire data were originally recorded by the Sentinel 2 mission and processed by the EFFIS to obtain the forest fire time, location, and dimensions of the burnt area [39].

2.3. Methods

This research on the Sentinel missions’ data applicability in power system operation and control has two big parts: data preparation and data analysis (Figure 2). Data preparation is similar for both situations: the power system protection against forest fire spreading and aerosol contamination (Section 2.3.1). The data analysis was adapted to each situation separately (Section 2.3.2 and Section 2.3.3).

2.3.1. Data Preparation

Each data source required different data preparation, including logical control, determination and investigation of extreme values, cloud removal from satellite data, etc. The power system data preparation included logical control and completeness level determination to determine whether it could be used. Meteorological and air-quality measurements are non-controlled data, so they also require basic logical control to determine completeness and investigate extremes. Extreme values were compared with values recorded at neighboring measurement stations and the synoptical situations in the moment of suspicious data records.
Except for the logical control and extreme values investigation, satellite data required handling of cloud cover. Also, Sentinel 3 and Sentinel 5p data required investigating the sensing time from day to day and the location of recorded values. After determining that data are recorded at a similar time each day, further preparation and analysis were conducted.
The extremes of Sentinel 2 and Sentinel 3 LST data were investigated by comparing them with the synoptical situation and the landscape at the period of interest. The extreme FRP values were compared with the landscape cover, and the newspapers were checked for extreme fire event reports. The Sentinel 5p data were compared with the measured PM10 particle concentration and with the synoptical situation.
Cloud cover signifies the challenge in the data analysis. From the Sentinel 2 dataset, all products with a cloud cover higher than 10% were eliminated from further analysis. In the case of a lower level of cloud coverage, the cloud mask was applied, and only pixels where clouds were located were removed. The used cloud mask is obtained as part of the Sentinel 2 MSI product.
In the case of Sentinel 3 LST data, cloud coverage was removed by comparing LST and surface air temperature. In that way, suspicious pixels from the dataset were removed, but not all those that contained cloud coverage. Situations when a pretty-low air temperature was recorded were exceptionally challenging because it was not easy to distinguish between low water clouds’ (e.g., stratus) temperature and the temperature of the land surface.
EUMETSAT Meteosat Second Generation (MSG) data were compared with other MSG cloud cover products. Images from the most appropriate product were chosen for further analysis.

2.3.2. Data Analysis, Forest Fire Protection

For this research on implementing satellite data into the power network protection against forest fires, Sentinel 2 MSI data and Sentinel 3 LST and FRP products were used. Sentinel 2 data are used for landscape monitoring and burned area recovery monitoring. Sentinel 3 data are used for fire detection and fire-spreading danger prediction.
One of the critical elements in forest fire protection is getting to know landscape cover very well. The Sentinel 2 mission’s data, recorded in various spectral bands, enable pretty-detailed terrain monitoring in multiple ways. The Sentinel 2 True Color Image (TCI) product provides information about the actual state of the ground (when there is no cloud cover). Using data recorded in other spectral bands enables the calculation of various indices. By comparing indices values calculated at the beginning and at the end of certain time intervals (e.g., several weeks or months), it is possible to monitor vegetation growth, structure, health, etc. [3,40]. In this research, vegetation monitoring was conducted by calculating the Normalized Burn Ratio (NBR) using (1) and the difference between pre-fire and post-fire NBR indices known as delta NBR (dNBR) [41].
N B R = N I R S W I R N I R + S W I R = B a n d 8 A B a n d [ 12 ] B a n d 8 A + B a n d [ 12 ]
The analysis of fire detection possibilities and the possibility of determining the spreading danger was conducted by analyzing FRP data during fire events and LST data for the whole year, regardless of whether an active fire existed.
During the FRP analysis, it was observed that FRP values can be detected outside of the fire polygon. The area with the highest possibility of an active fire event was determined by analyzing the FRP values and FRP uncertainty in various buffers around fire polygons. The active fire area was determined by comparing the recorded FRP values with their theoretical values defined in [15] and according to the FRP values that can be recorded while various grasslands burn [42]. The LST analysis and its applicability in forest fire-spreading danger prediction have multiple steps. Firstly, data retrieval was compared from day to day before noon and in the evening. In the second step, the consistency of the data spatial distribution for each sensing time was checked. Then, the correlation between LST values and the FWI values calculated using the Canadian method [33] was conducted. The FWI calculation is conducted for the location of the meteorological measurements, and the LST data were recorded with a spatial resolution of 1 km. To calculate FWI values using satellite data, Croatia was divided into polygons according to climatological and geographical conditions. The FWI values calculated using satellite data have a different range than those calculated using the Canadian method, so danger classes had to be adapted. The adaptation was conducted according to the data dispersion between minimal and maximal values.

2.3.3. Data Analysis, Aerosol Contamination Protection

This research was conducted in two phases, at two different spatial scales, synoptic scale and mesoscale, to determine the most appropriate spatial scale for aerosol contamination monitoring and modeling using Sentinel 5p data. The synoptic scale has a horizontal length of 1000 km. A mesoscale ranges from about one kilometer up to several hundred kilometers. A microscale usually has a horizontal length of about 1 km or less, but it was excluded because of satellite data resolution (Section 2.2.2).
The possibility of using the AI340/380 and AI354/388 in aerosol contamination monitoring on a synoptic scale is explored in a well-known case study involving the movement of Saharan sand over the Mediterranean to the European continent on 19 June 2024. This case study was chosen because a rough AI validation can be conducted. The AI recorded by the Sentinel 5p satellite and the cloud cover images obtained by the EUMETSAT MSG satellite product Dust RGB were compared. Also, data were compared with surface air-quality measurements in the area of interest (Rijeka–Kvarner–Istria: blue box in Figure 1). The AI data are calculated daily, so they were compared with the daily movement of cloud cover (series of images in a 15 min time resolution) and with the series of measurements of PM10 particle concentrations at an hourly level.
After the possibilities of using Sentinel 5p data in aerosol contamination monitoring at the synoptic scale were confirmed, this research continued to explore the usefulness of Sentinel 5p data at the mesoscale. It was conducted for the Rijeka–Kvarner–Istria region in Croatia (Figure 1). The correlation between PM10 particle concentrations and Sentinel 5p products was conducted for the area of interest in its entirety, for the several stations closest to the location of failures and several buffers around each air-quality station. Buffers’ radii are 5 km, 10 km, 15 km, and 20 km. The analysis was conducted separately for the whole period of observations, for a seven-day period before the power network outage appeared and on the day of the outage. Observing the period before the failure, the analysis includes the possibility of aerosol sedimentation in a shorter period.
From the Sentinel 5p product, AI340/380 and AI354/388, aerosol mid-pressure and aerosol mid-layer height data were selected. The distribution of the selected data was checked by plotting histograms, and the method for calculating the correlation coefficients was defined. The outliers were checked separately by comparing aerosol index, layer height, surface measurements, and the synoptical situation. When the comparison was conducted, it was decided whether it was appropriate to mark the data as erroneous or not. After the correlation coefficient calculation, the statistically non-significant results were removed from further analysis ( p 0 < 0.5 ).
The PM10 particle concentration extremes were explored and compared with those recorded on the neighboring air-quality stations and AI and LH values. In this way, it was determined whether extremes were valid or if there were some errors in the measurements. Then, the rest of the data from the Sentinel 5p dataset were compared with a measured concentration of PM10 particles. The next step in this research includes information about power supply outages and faults in the 25 kV overhead contact network supplying electric traction. In this way, a pretty-broad initial analysis of Sentinel 5p data applicability of the aerosol contamination monitoring and modeling was conducted.

2.4. Computational Tools

Several tools were used during the data preparation and analysis. Data analysis was mainly conducted using Python libraries such as Pandas [43], GeoPandas [44], NumPy [45], and SciPy [46]. Data were visualized using QGIS [47] and Python libraries such as Cartopy [48] and Matplotlib [49]. The division of Croatian territory was conducted using QGIS (Voronoi method), and it was based on weather stations’ location and climatological conditions.

3. Results

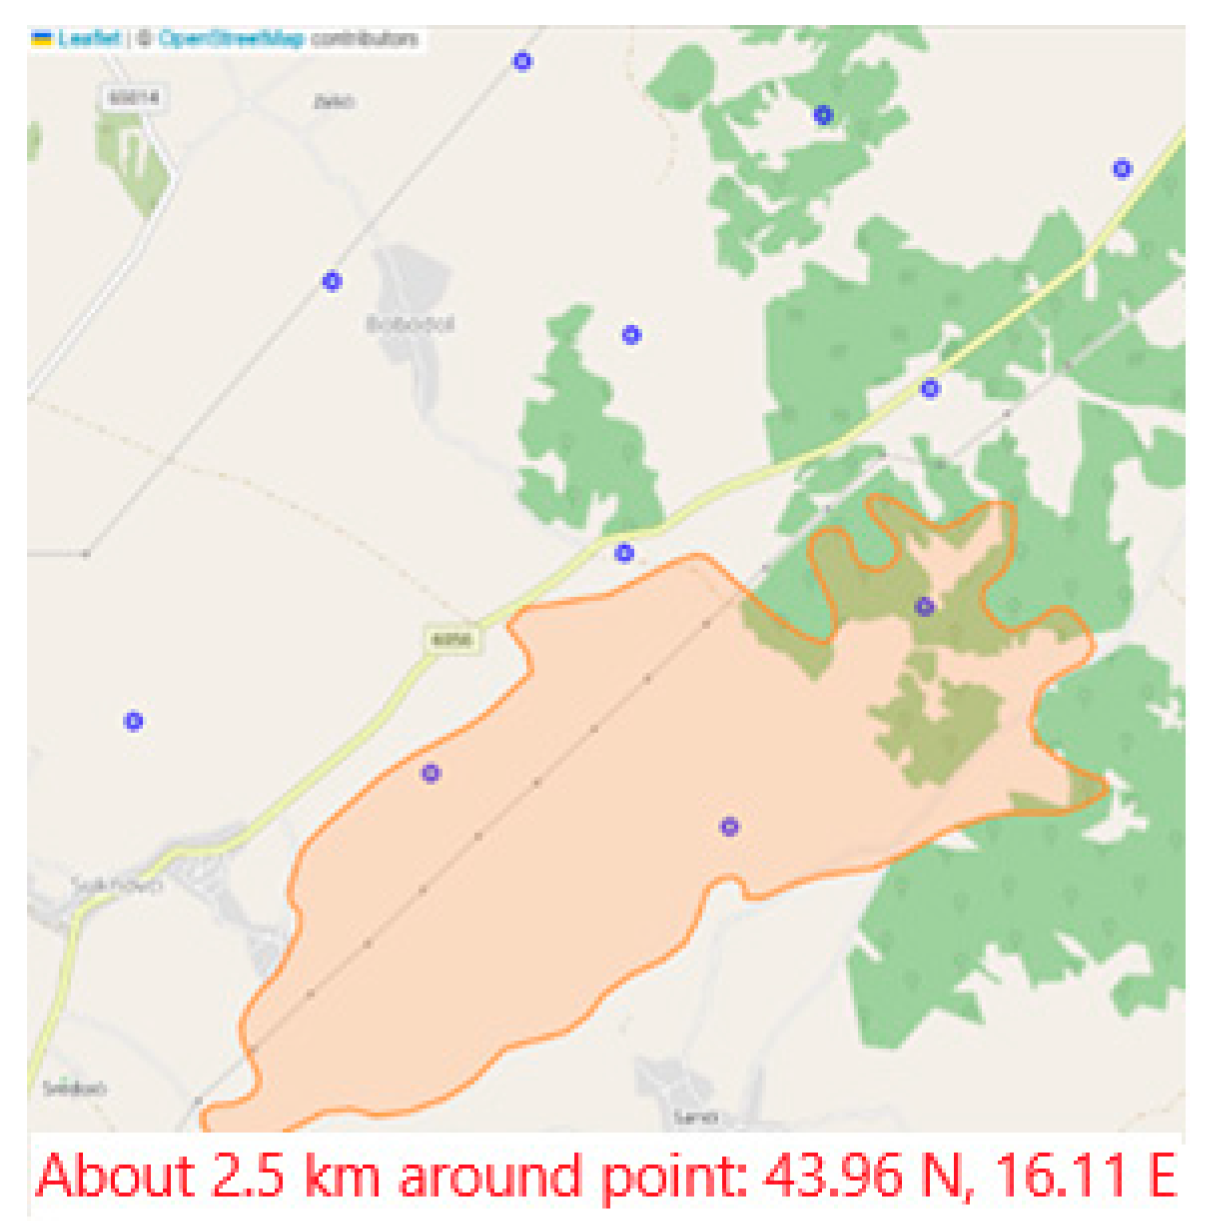
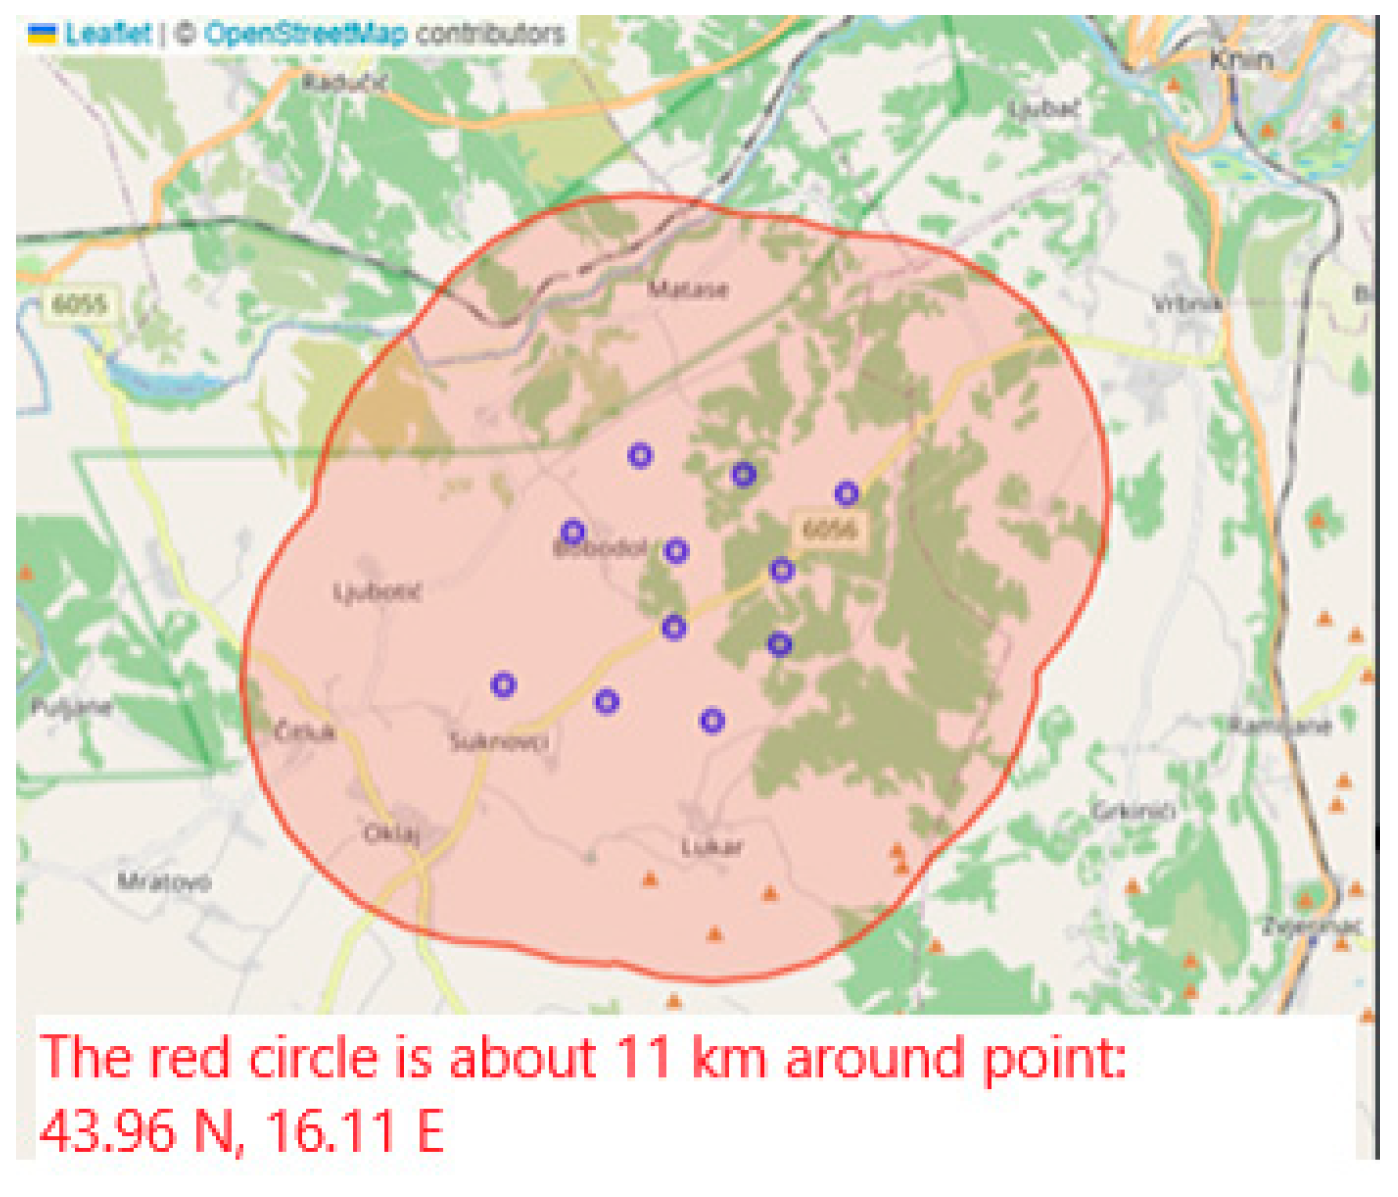
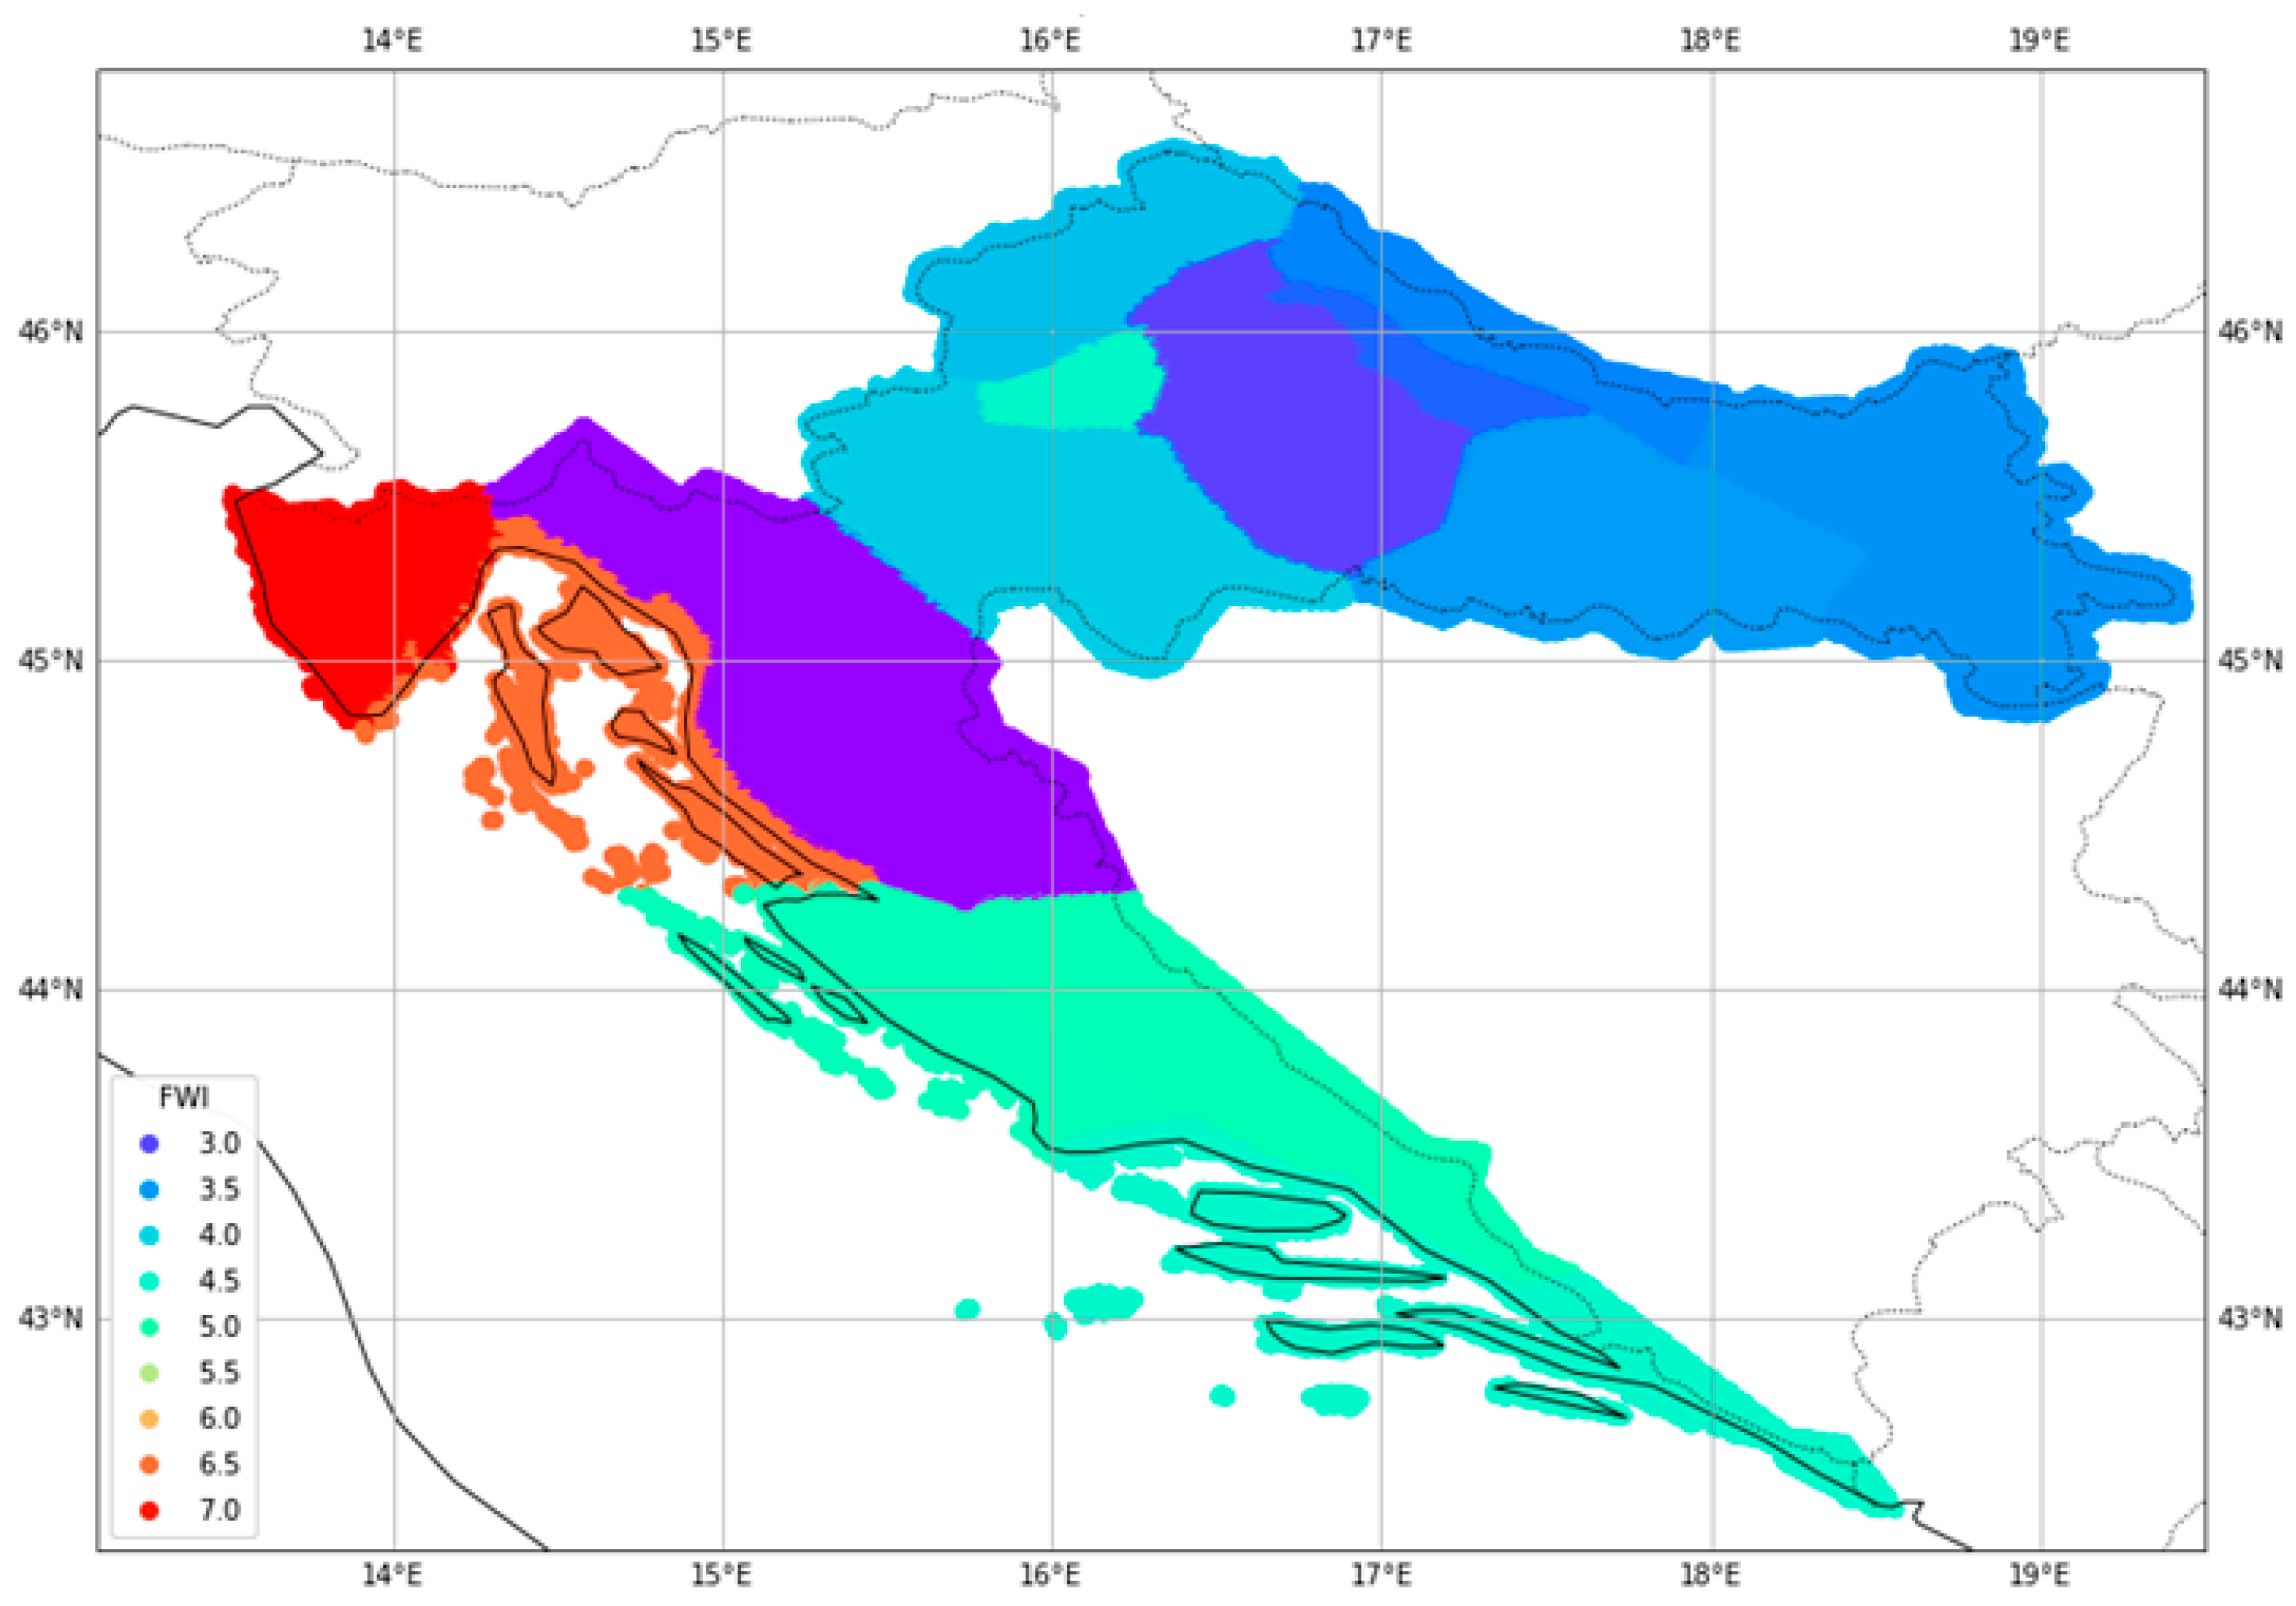
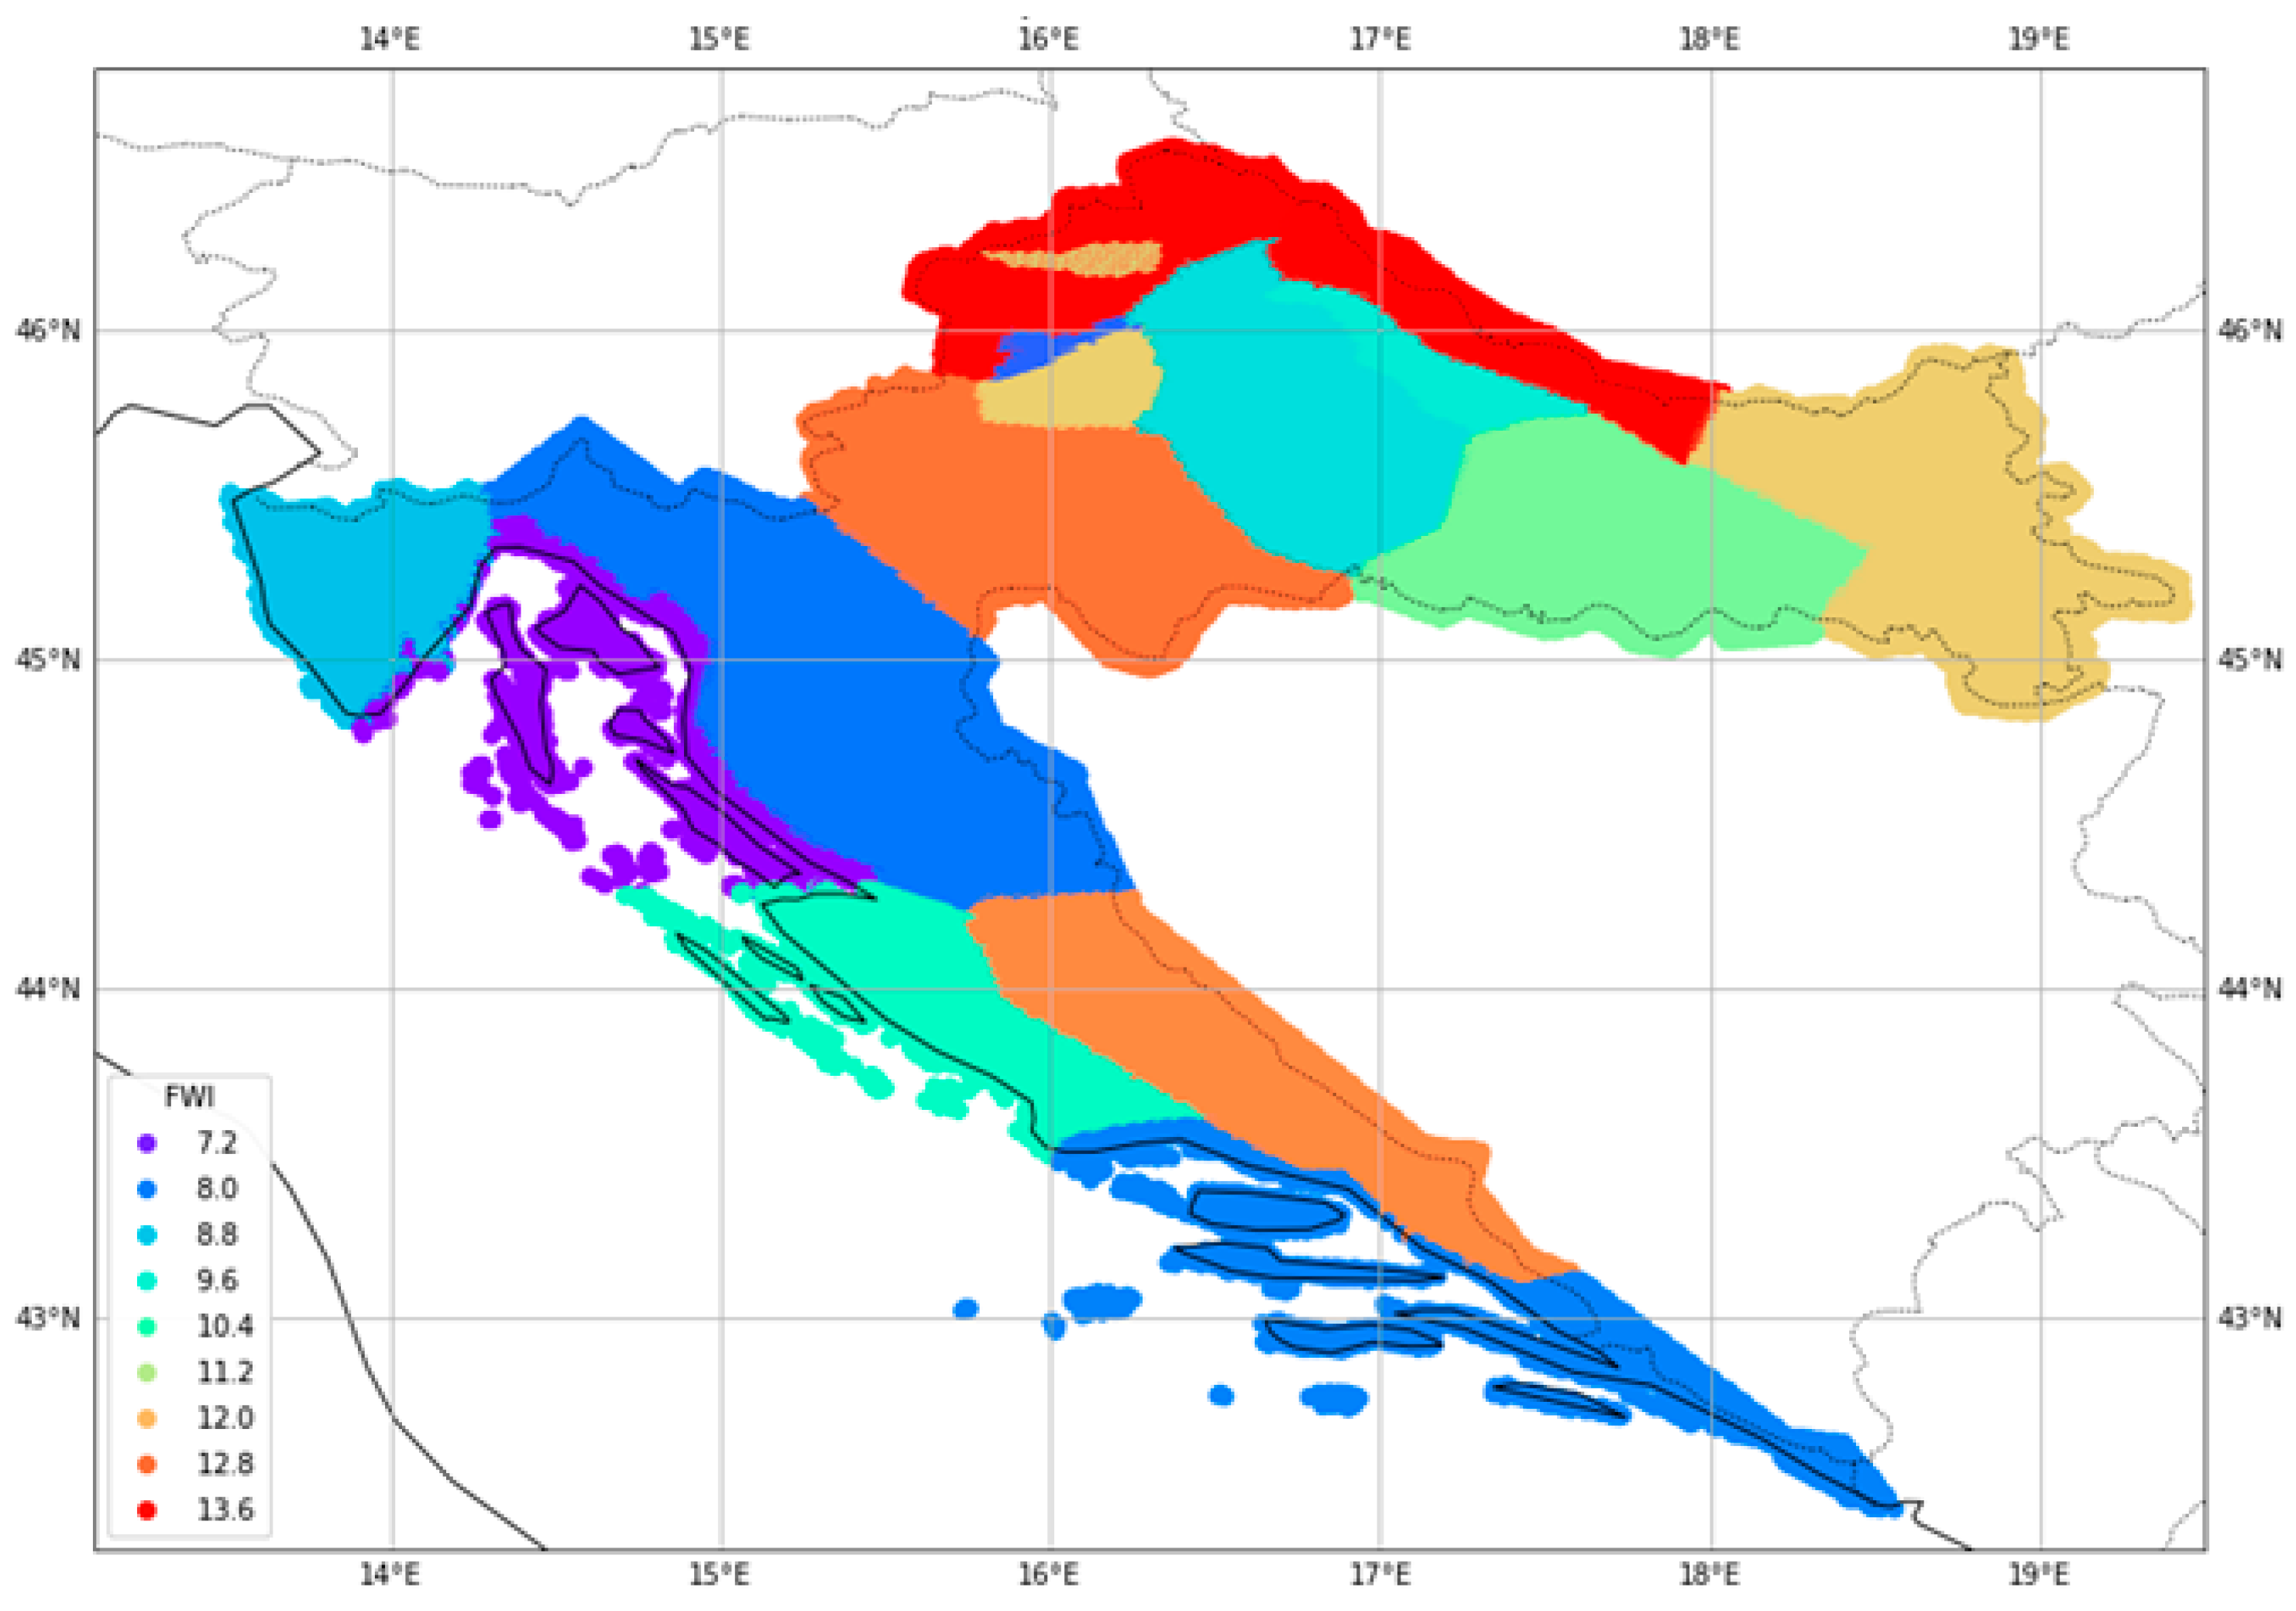
3.1. Forest Fire Protection

Landscape monitoring is one of the key elements in forest fire protection. It is possible to conduct it by calculating NBR and dNBR indices. At first glance, cloud coverage may interfere with vegetation monitoring because the Sentinel 2 satellite cannot record the situation below clouds. Croatia has favorable climate conditions for applying Sentinel 2 data in vegetation monitoring. There are many sunny hours, especially during the warm part of the year when grass and bushes grow the fastest, and the probability of forest fire ignition is the highest [50]. There is a high probability that two or three data retrievals will be useful for further analysis and calculation of NBR and dNBR indices. The successful applicability of the NBR and dNBR indices in the case study of Croatia is described and well documented in [41].
Other important segments are fire detection and prediction of fire-spreading danger. Comparing FRP values and FRP uncertainty in different buffers around the fire polygon indicates that the FRP’s highest mean values are in the fire polygon and one-kilometer buffer around the fire polygon. There is no significant difference between the FRP mean value in the 5 km and 11 km buffers. Most of the FRP values recorded outside of the fire polygon were within a three-kilometer radius of the fire polygon. Accordingly, it is possible to define an area of 3 km around the recorded group of FRP data as a potential fire location (Figure 3 and Figure 4).
Investigation of the Sentinel 3 LST observations showed that, for each revisit time, data are not recorded precisely at the same place. Also, a small number of recorded LST values was recorded inside the fire polygon (Figure 5). It was decided to observe the dataset recorded within a five-kilometer radius of each fire polygon. Enough LST values were recorded in that area to enable anomaly detection and adequate further analysis.
Further analysis showed a linear correlation between the Canadian FWI and recorded LST values in a 5 km area around the weather station, the data of which were used for the FWI calculation. Based on this correlation, the equation for the FWI was calculated and adjusted to Croatian climatological conditions (2), where L S T ¯ presents the mean value of the recorded LST values in a 5 km radius around each weather station. The adjusted FWI has a different value range than the original Canadian FWI, so it was necessary to adjust the danger classes (Table 1).
F W I a d j u s t e d = 0.871   *   L S T ¯ 9.549
FWI gradation was obtained by adjusting the FWI to Croatian conditions using the LST. It enables the use of the FWI throughout the year as an alarm tool for power network operation and maintenance. Additionally, it is possible to calculate the fire danger index more precisely for areas of interest where there are no installed weather stations (Figure 6 and Figure 7).

3.2. Aerosol Contamination Protection

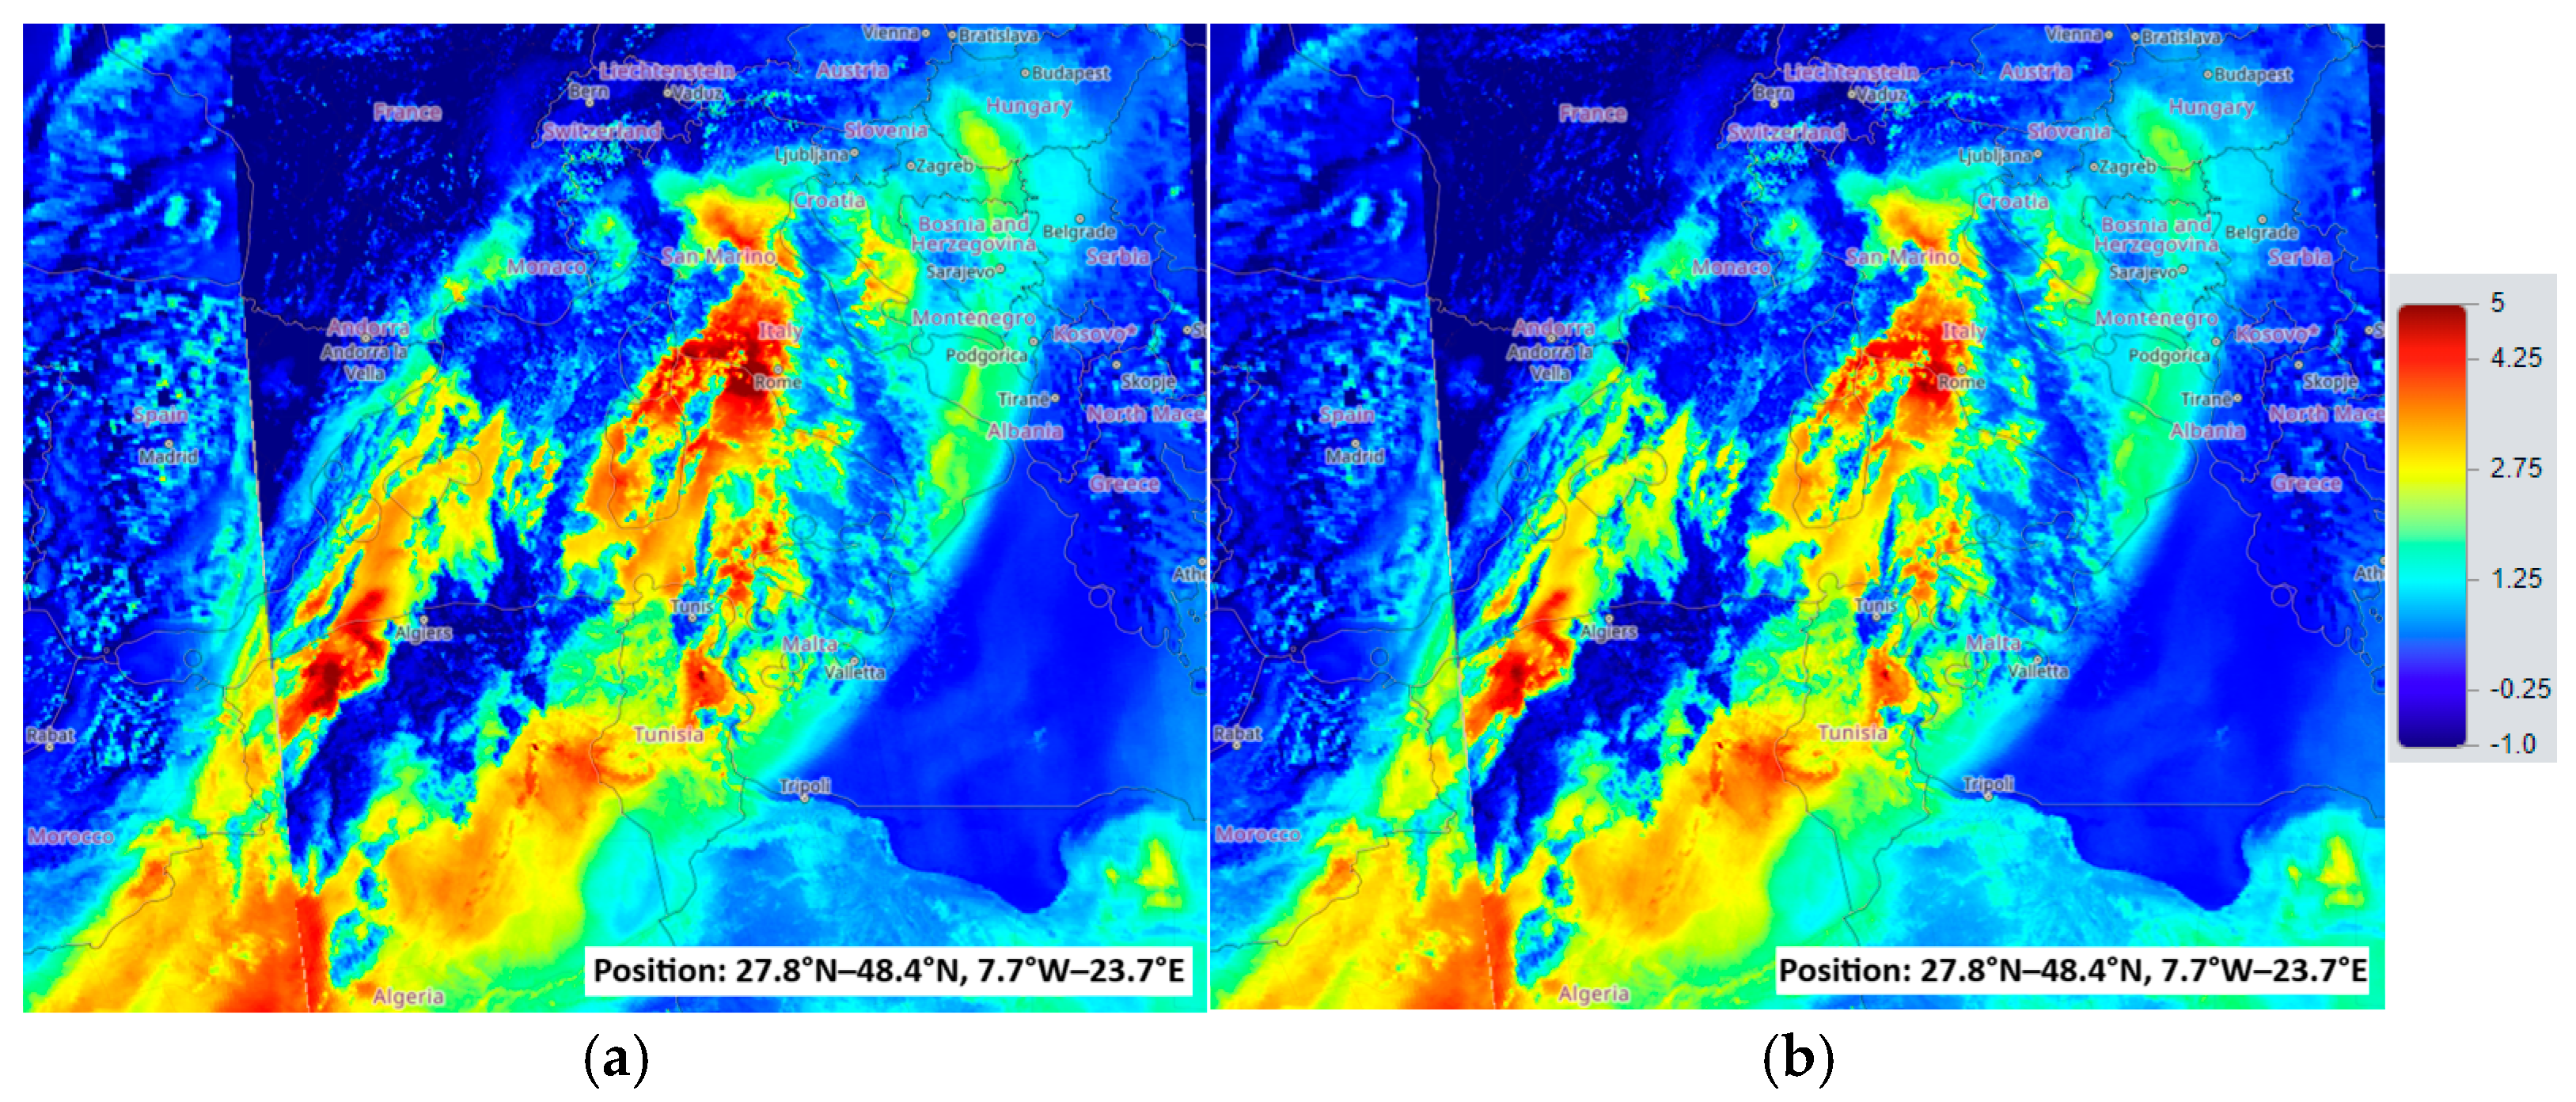
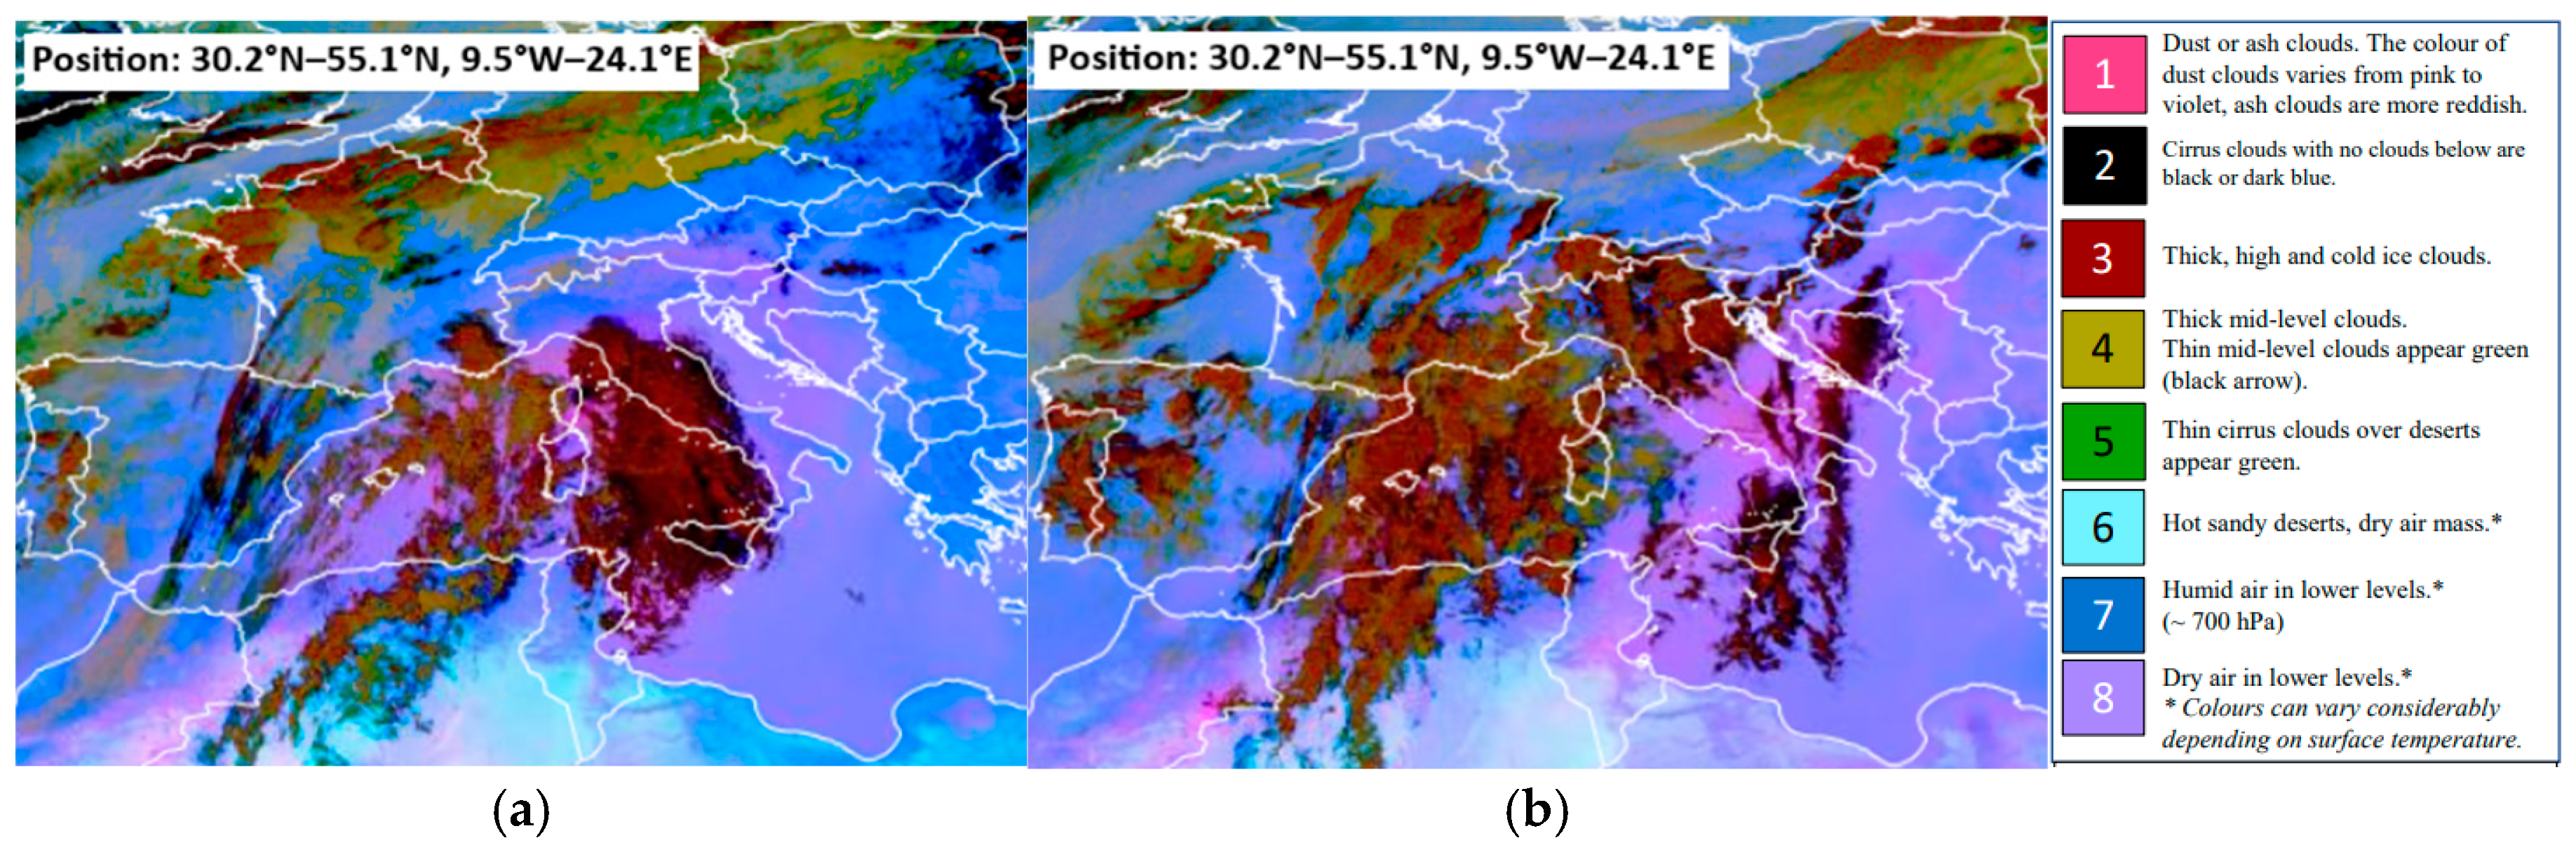
3.2.1. Aerosol Contamination Monitoring on a Synoptic Scale: The Saharan Dust Movement over the Mediterranean to Europe

Comparing AI340/380 and AI354/388 images and cloud cover images obtained by the EUMETSAT MSG satellite (Figure 8), the Saharan sand transportation route coincides. Also, it is possible to notice that a difference between indices AI340/380 and AI354/388 exists, although it is minimal. The AI values in the Rijeka–Kvarner–Istria area were approximately from 1.25 to 2.5. On the south and the southwest, it was even higher. Such a high index indicates a high aerosol concentration and its sand origin. Figures also show a low AI index (a blue area) in the middle of high values, possibly because of the thick cloud cover presence. It should be checked separately in some of the deeper analyses and presented in future papers. However, it is important to note that, despite the cloud cover, an overview of the situation can still be obtained. It is worth remembering that the AI is calculated daily (Figure 8), and the presented cloud cover images (Figure 9) are recorded at 09 UTC and 18 UTC.
Analysis of the surface measurements of the PM10 concentration showed its rise at the surface level on 20 June. The highest level (100–130 µg/m3) was recorded on 21 June and in the first half of the next day. Later, concentrations fell below 50, and then below 30 µg/m3 (Figure 10). When comparing surface measurements with the AI, the coincidence is apparent.

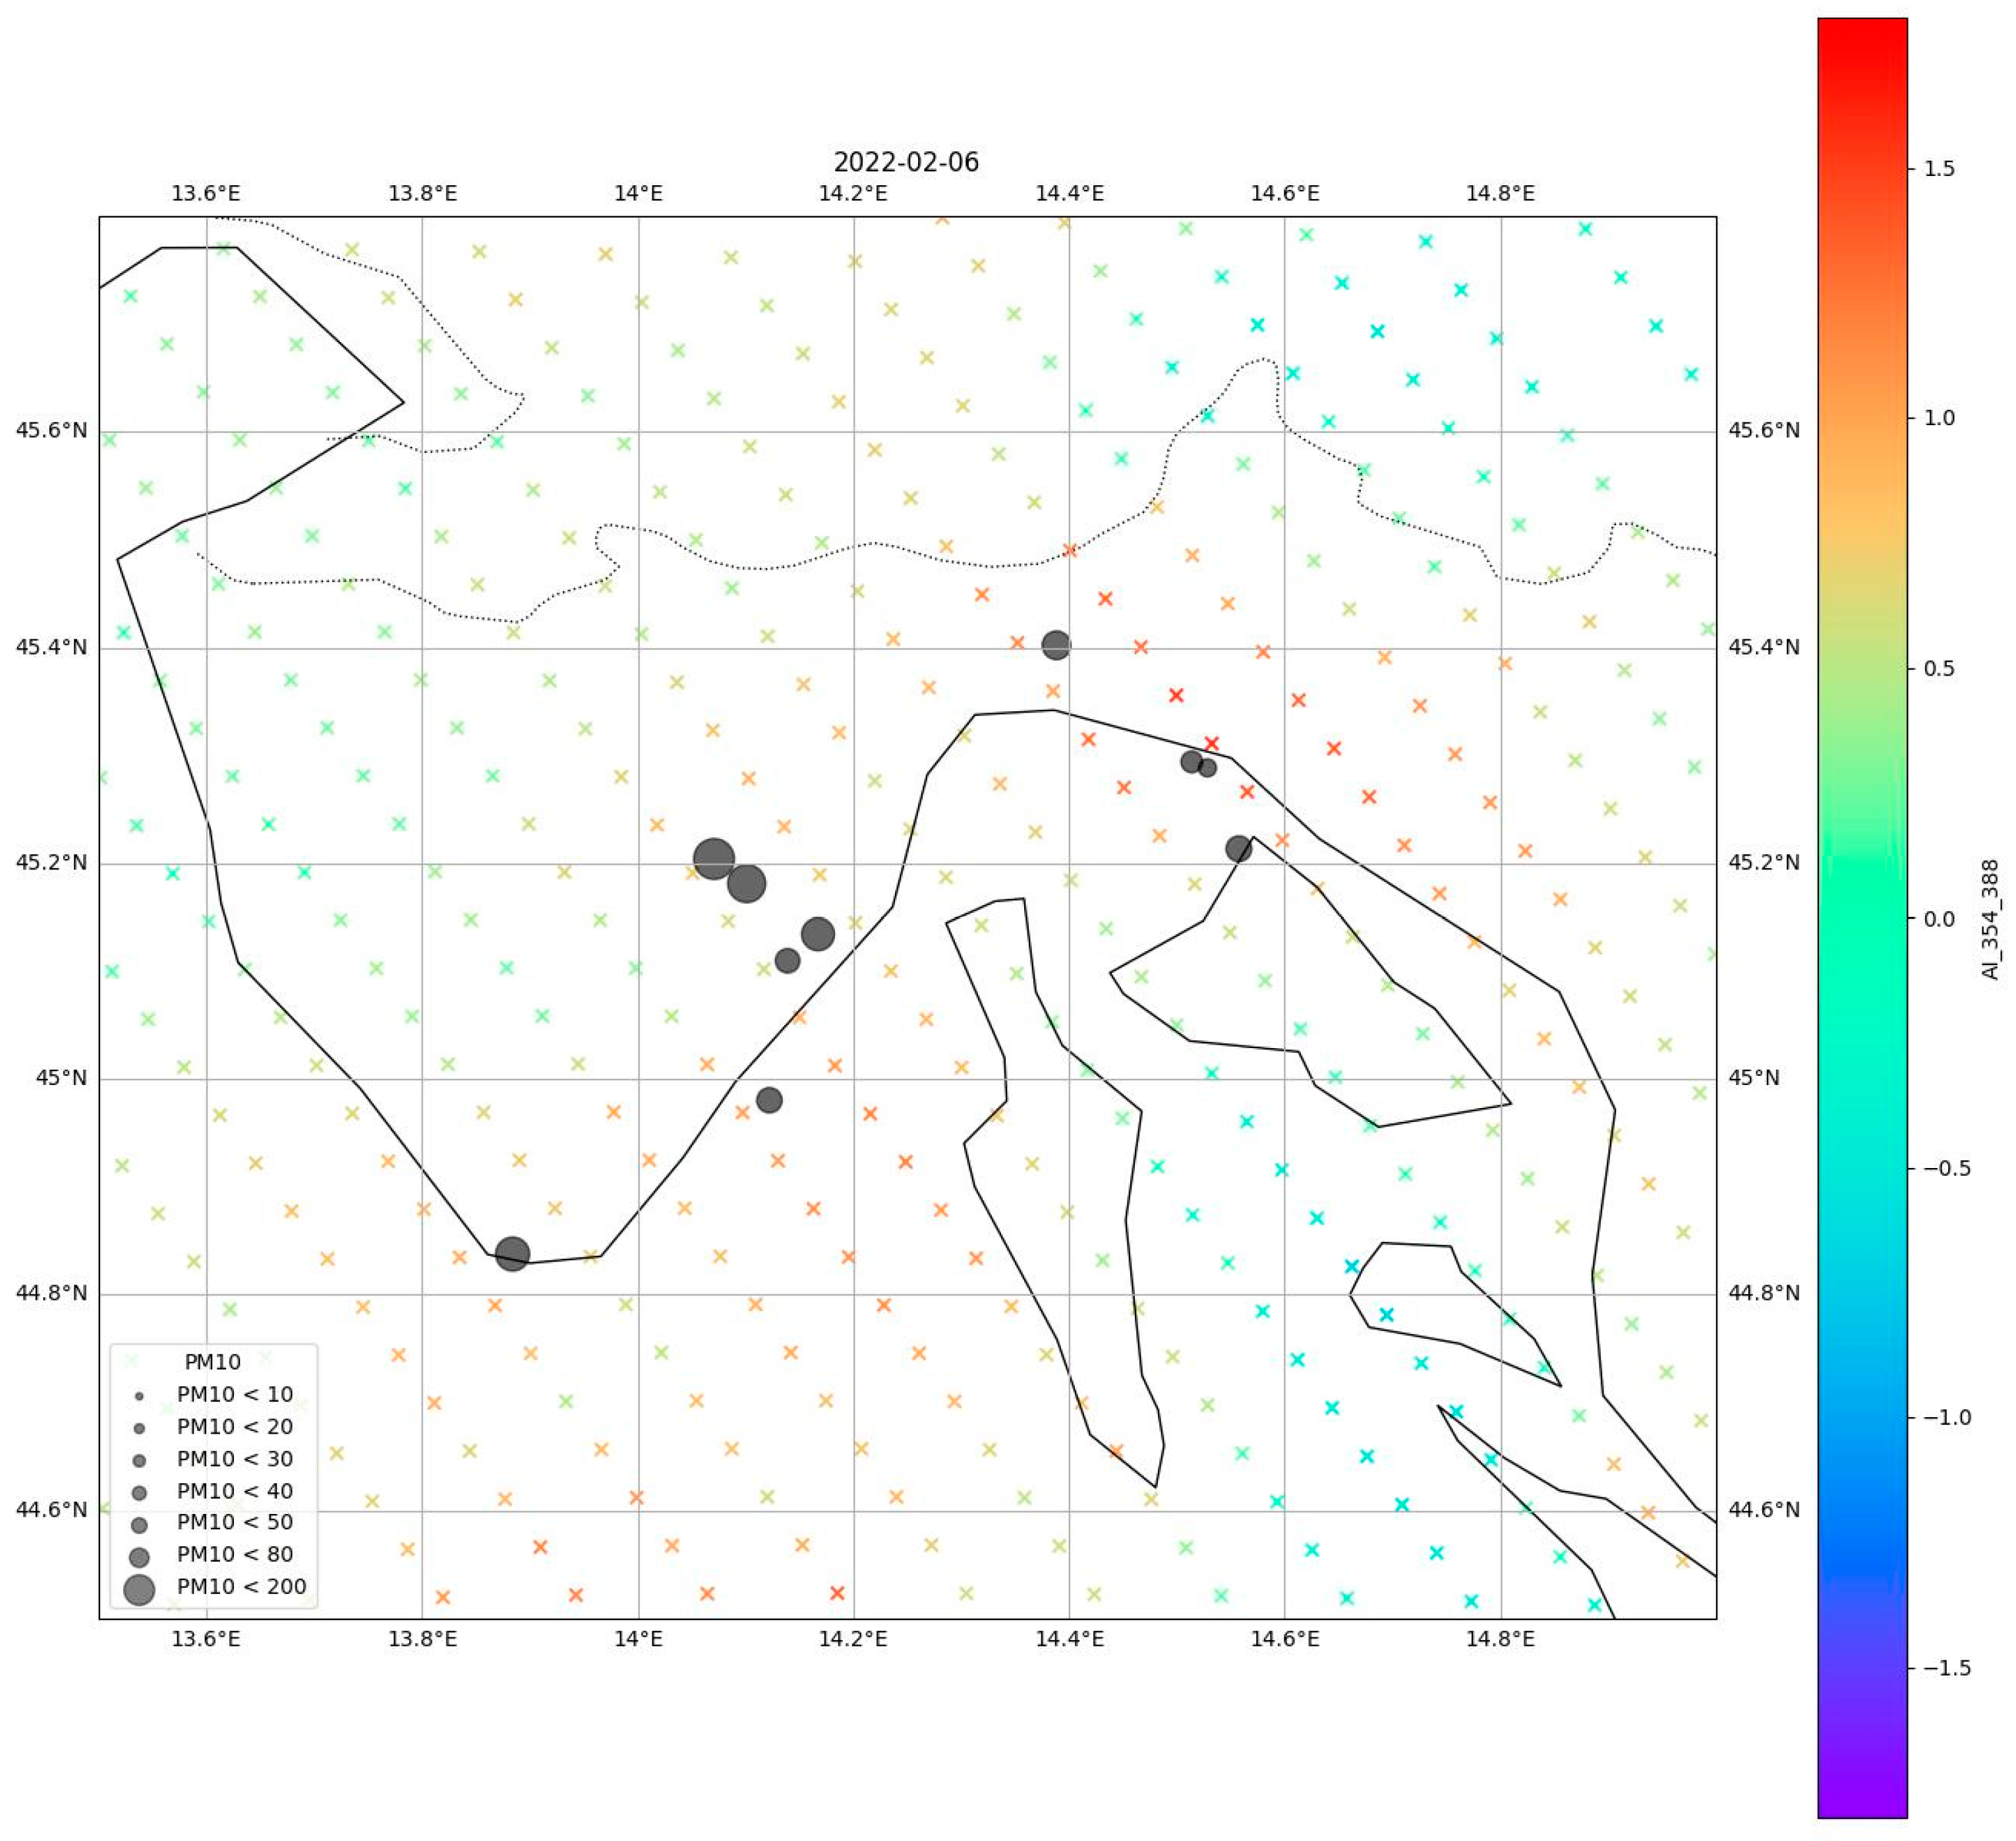
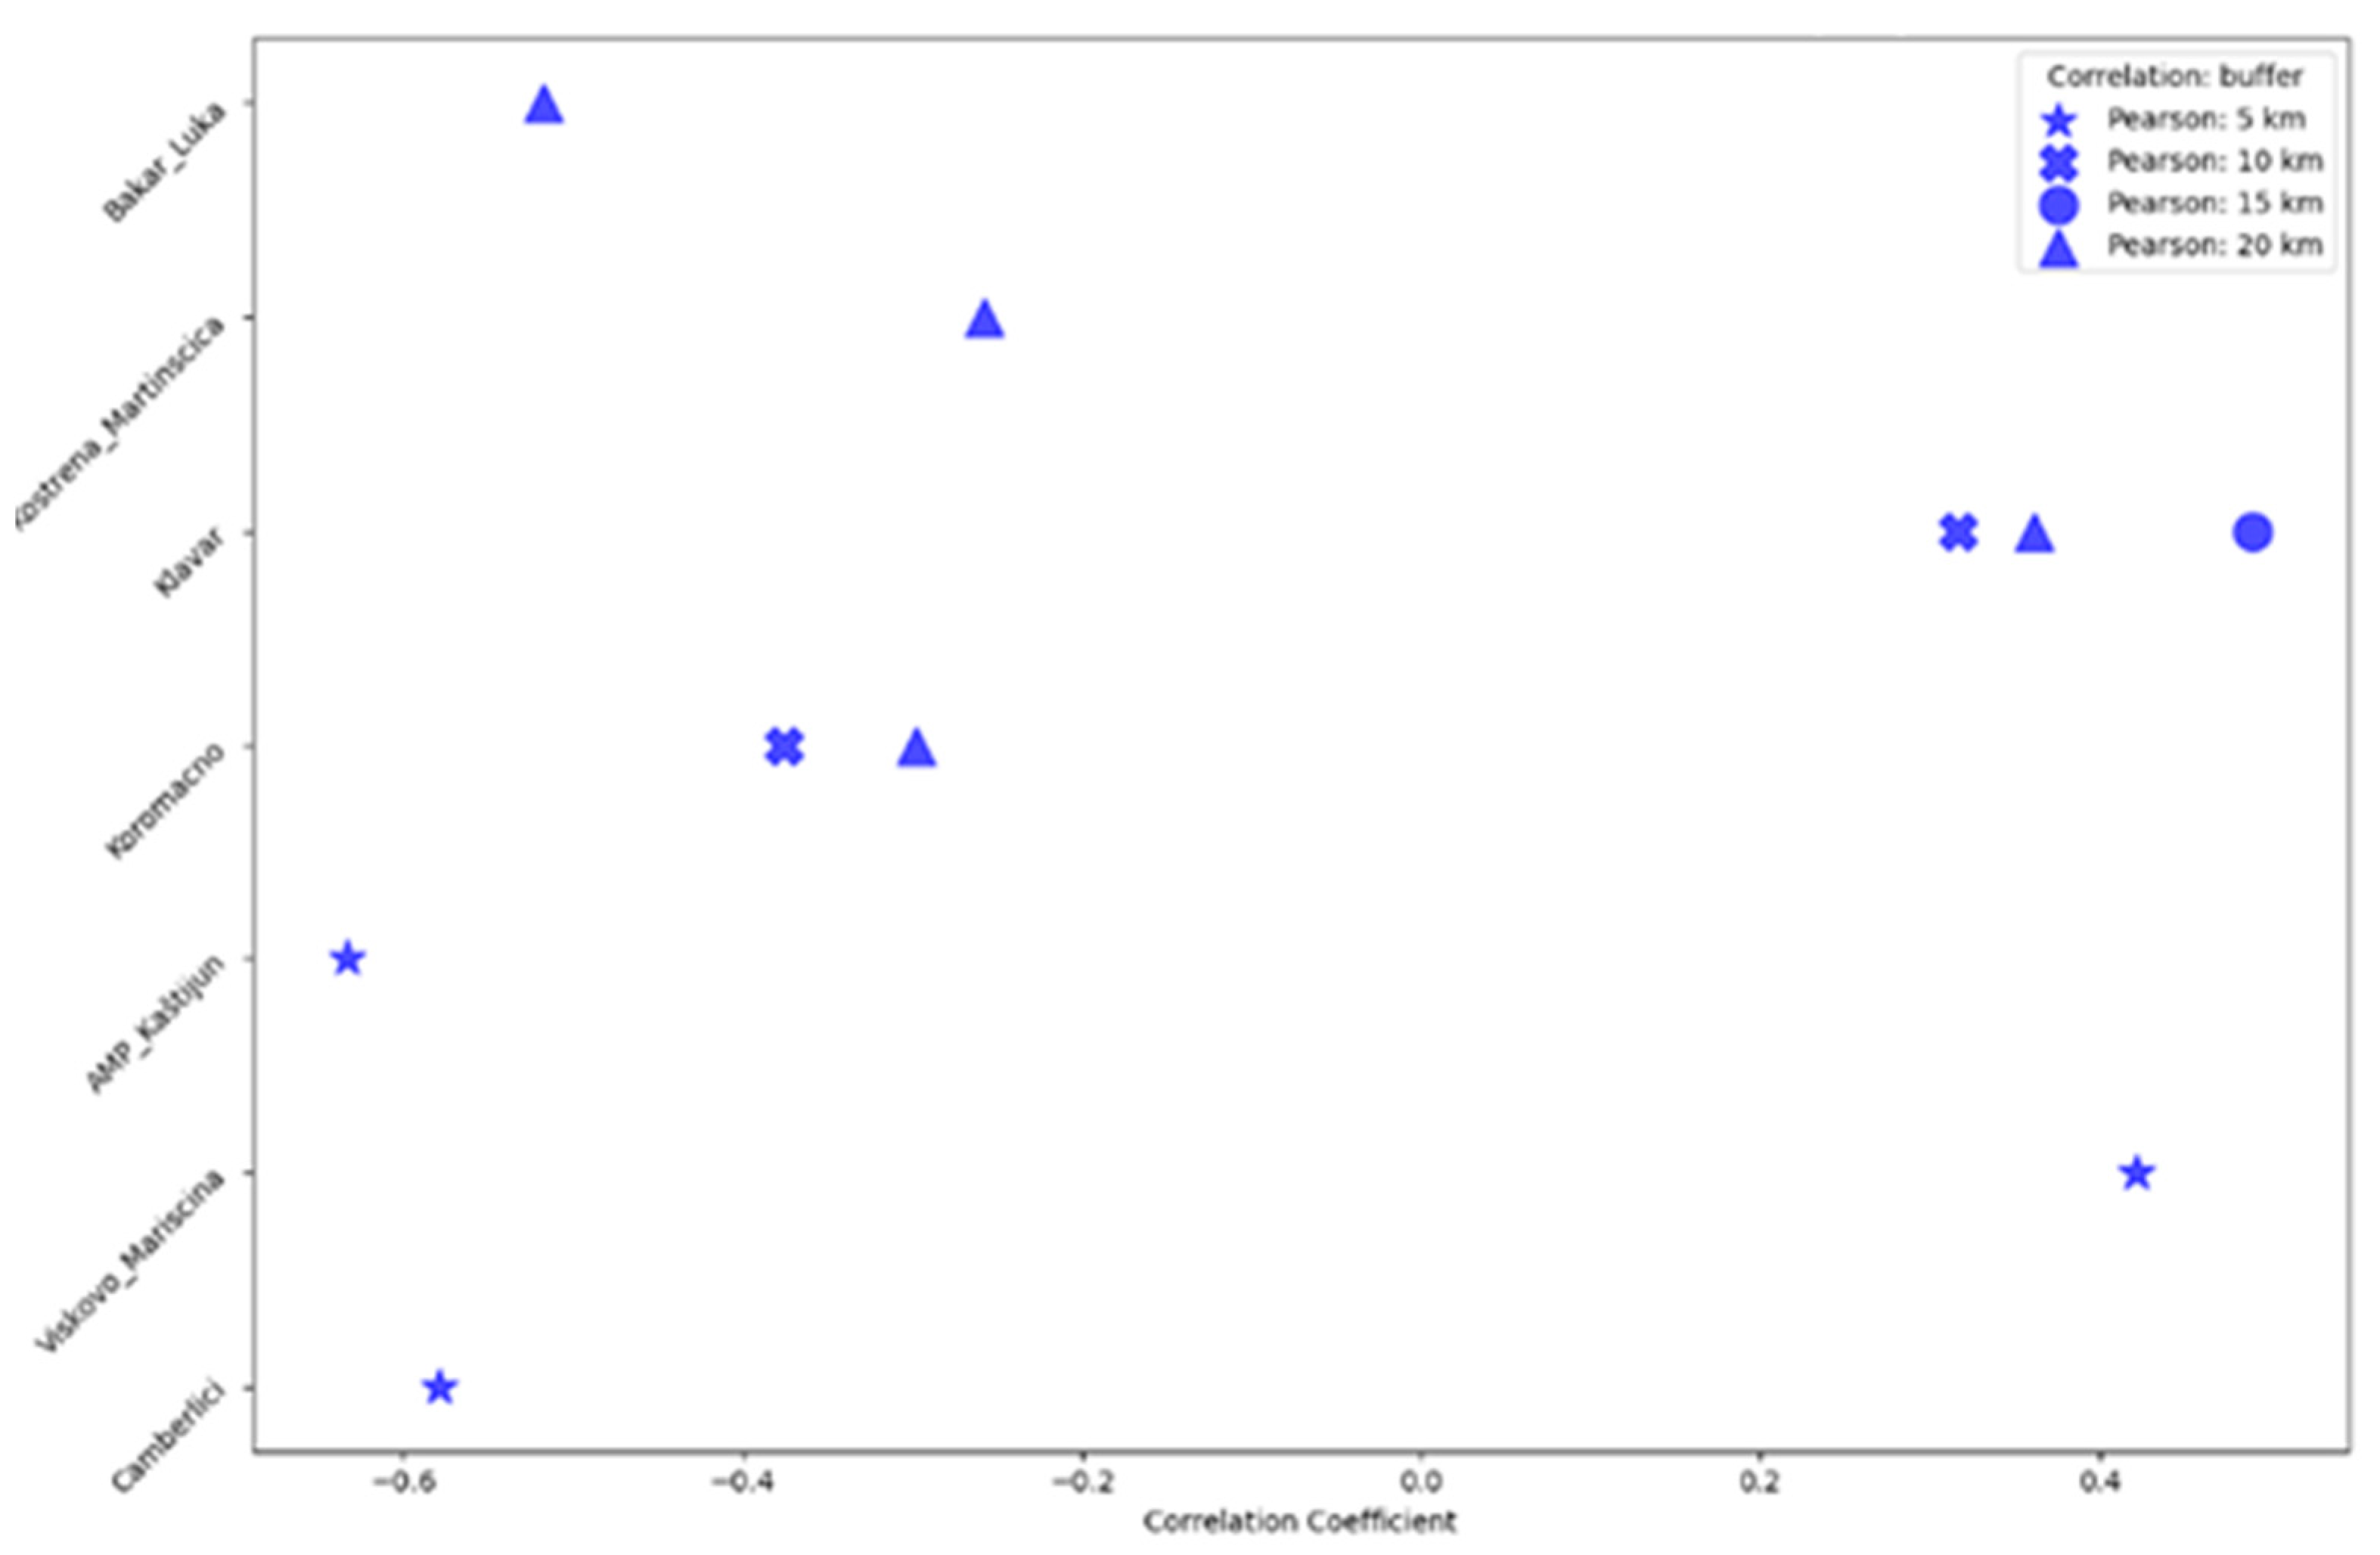
3.2.2. Aerosol Contamination Monitoring on a Mesoscale: The Faults in the 25 kV 50 Hz Electric Traction Network in Croatia

The recorded aerosol indices in the Rijeka–Kvarner–Istria area are mainly from the interval [−5, 3] with a distribution close to normal, slightly skewed to the left with slightly positive kurtosis (0.36 for AI340/380 and 0.61 for AI354/388) (Figure 11). The PM10 particle distribution showed a significantly higher number of measured values lower than 100 µg/m3. Similarly, the aerosol height analysis showed that most aerosol is not spread too high in the atmosphere. It goes mainly up to 2500 m or to the pressure level of approximately 800 hPa. The comparison of the Sentinel 5p satellite records and PM10 particle concentration measurements showed the power network outage appearance when AI values are negative (Figure 12) and positive (Figure 13) and when the PM10 concentration is relatively high.
During the period when PM10 particle concentrations were recorded at around 140–160 µg/m3 at some locations, the recorded AI values were close to minus two or minus three. At the same time, the aerosol mid-pressure was quite low (up to 850 hPa), and consequently the layer height was high (up to 1800 m). Recording the aerosol concentration at higher levels and having a significantly low AI may indicate that aerosols probably are not of sea salt origin. The presented example enables setting approximated limits of AI values when sea salt intrusion in the atmosphere is present. Additionally, it highlights the potential of using satellite data to control the surface measurements of aerosol contamination concentration. The satellite data can confirm surface measurements or raise questions about other factors.
It is shown that the AI distribution is close to normal, so Pearson’s correlation coefficients were calculated to explore the correlation between each Sentinel 5p product and PM10 particle concentration. The statistical analysis showed that the correlation between surface measurements and satellite observations is weak for the whole Rijeka–Kvarner–Istria area. The area that includes several stations closest to the locations of faults on the 25 kV contact network showed better results. Hence, the correlation coefficient shows a weak-to-moderate correlation (up to ±0.45). Analyzing correlations in various buffers around each air-quality station indicates that the AI and PM10 particle concentrations have a generally negative correlation, up to minus 0.7 (Figure 14), which is expected because AI values were mostly negative. In the case of faults on the 25 kV overhead contact network, results are similar, but different air-quality stations show the strongest correlations.
Calculating the correlation between PM10 particle concentrations and positive and negative AI values separately, it was observed that there was a moderate-to-strong correlation between positive AI values and PM10 particle concentrations (±0.3–0.7). The correlation of negative AI values showed a weak-to-moderate correlation (up to ±0.45). This indicates that further analysis and modeling should explore smaller AI intervals to find better correlations and conclusions that lead to adequate operational model development, which could serve in the power network protection against aerosol contamination. The intervals should correlate with the prevailing aerosol type at the area of interest. Presented correlations have a statistical significance of 95% or more.

4. Discussion

The aerosol contamination research in this paper was based on Sentinel 5p data, which are daily data. However, solutions obtained using other satellites with different spatial and temporal resolutions are available in the literature. In Slovakia, Sentinel 2 data (available every five days) are used to improve local pollution models for high-voltage transmission lines and insulators [54]. Pollution maps of the monthly accumulation of Saharan dust over Israel are conducted using the NASA satellite [55]. On the other side, Sentinel 2 mission data are also used in forest fire area monitoring in sub-Saharan Africa [56]. In contrast to this article, where satellite data were used individually, Sentinel 3 data, combined with Sentinel 2 and Terra MODIS data, can be used to map and track forest fires in burnt areas (e.g., the case study of Nikaragva) [57].
The FWI adjusted to Croatian conditions presented in this article has already been implemented into the contingency analysis calculation. Landscape monitoring by calculating the NBR and dNBR is also used, as well as an analysis of the possibilities of aerosol contamination monitoring. A significant part of this research was data preparation (Section 2.3.1), from conducting logical data control to cloud removal from satellite data, etc. Despite some missing data and a cloud coverage challenge, it is possible to say that the used data are pretty-high-quality, and in future research it is worth broadly exploring the possibilities of some kind of new cloud mask development for the Sentinel 3 LST dataset.

4.1. Discussion of Forest Fire Protection Using Sentinel Data

The gap in the Canadian method for calculating the FWI for Croatian conditions is a poor gradation during the summertime (a constantly very-high FWI) and during the wintertime (a constantly very-low FWI) when there are also many forest fires. Forest fires during winter are often intentionally caused (e.g., burning of weeds) and monitored. Still, they also can be widely spread under the power lines and negatively influence it (e.g., decrease the DLR or cause physical damages).
Combining the Canadian FWI and/or the FWI adjusted to Croatian conditions with the detected FRP values and their involvement in the contingency analysis calculation gives a precise view of power network segments that may be out of function or on segments that could be additionally burdened. As described earlier, the cloud cover, in this case, is a significant challenge (Section 2.3.1). Because of that, for now, the optimum solution is to combine the Canadian FWI calculation method and the newly obtained FWI method because the new method may isolate areas of interest. Future research may investigate better options for solving the cloud coverage challenge.
In Section 3, it was mentioned that FRP values can be recorded out of a fire polygon. The reason may be that the smoke and ash spread relatively quickly through the atmosphere, and their cooling is slow. The FRP product enables forest fire detection and determination of fire-spreading areas. Because of the Sentinel 3 revisit time, which is twice per day, fire detection by recording FRP is impossible to use at the intra-day or hourly operational level. The analysis of the FRP values recorded over a longer time period enables a view into fire behavior in the area of interest that can be used in power system planning and maintenance.

4.2. Discussion of Aerosol Contamination Protection Using Sentinel Data

The usefulness of Sentinel 5p data was analyzed on the mesoscale and synoptic scales. The case study of Saharan dust movement over the Mediterranean to the European continent confirms the possibility of using Sentinel 5p data on a synoptic scale. This case study was chosen because the aerosol origin was well known, and it was possible to confirm that highly positive AI values indicate the presence of a high concentration of dust in the atmosphere. The desert dust belongs to the group of aerosols characterized as PM10 particles.
The case study on the mesoscale includes faults in the power network in one part of Croatia. When the entire area was observed as a whole, there was no significant difference in the correlations between the overall dataset and the dataset when only dates with detected outages were isolated. When the research was more local (e.g., the surroundings of one air-quality station), results showed a better correlation for the situations with faults appearance. In further modeling, it should be kept in mind that the COVID-19 pandemic took place during the period of analyzed data. In that period, anthropogenic aerosol was decreased, and a smaller number of faults in the observed segment of the power network was recorded.
Additionally, a comparison of the surface measurements of PM10 particle concentrations with AI and LH data showed that those data may serve as a tool in a surface air-quality measurement data control to confirm the high concentration of PM10 particles or cast doubt on something else. Also, it may help to determine the prevalence of aerosol contamination in the area of interest where there is a lack of surface air-quality stations.

4.3. General Discussion and Future Research Possibilities

After discussing different Sentinel missions in two different scenarios, it is possible to conclude that mission Sentinel 2 is favorable for medium-to-long-term operations because of its revisit time and spatial resolution. The data of missions Sentinel 3 and 5p are favorable for intra-day and day-ahead operations, as well as for long-term operations such as power network planning and maintenance (Table 2).
It is worth emphasizing that this research of Sentinel 5p data application in the power network operation, especially in planning and maintenance, is in its beginning stage and will continue. Aerosol contamination research can continue by including weather data in the analysis and researching synoptic situations and local meteorological conditions for periods when a high aerosol concentration was recorded and when a high number of faults was detected. Then, a risk model of the power system outage appearance can be developed. Also, a method for the fusion of in situ air-quality measurements and satellite data could be researched.
The application of newly obtained correlations and modeling results will be made possible by their integration into contingency analysis calculation. It may be used in the power system maintenance, long-term planning operations, etc. When the suggested research is conducted, results will be discussed appropriately with scientific and industrial societies, as well as with the general audience. Also, similar research could be conducted in other industries, such as the health or food industry, traffic industry, etc.

5. Conclusions

The usefulness of Sentinel data in power system control is various. This paper presents the possibilities of using it in the protection against forest fires and aerosol contamination. Sentinel data are mainly favorable for power network planning and maintenance operations on short-term and long-term timescales. Satellite data used at the operational level on an hourly timescale should have a much-better time resolution. A better temporal and spatial resolution has been promised by the already-announced Meteosat Third Generation (MTG) satellites. Some of their products are already available at the non-operational level [58]. Alongside a better temporal resolution, it also promises a better spatial resolution, which could be crucial in power system planning and maintenance in the era of emphasized climate change and renewables inclusion. Local data are necessary for all levels, from electrical energy production through transmission and distribution to the energy market and consumption. Satellite data significantly contribute to data supply because it is unrealistic to expect that surface measurement stations will be installed with a resolution as good as that offered by satellite observations.

Author Contributions

Conceptualization, A.B.; methodology, A.B., B.F.-G. and B.F.; software, A.B. and B.F.; validation, A.B. and F.T.; formal analysis, A.B.; investigation, A.B.; resources, A.B., B.F.-G., B.F., D.Š. and F.T.; data curation, B.F., B.F.-G. and A.B.; writing—original draft preparation, A.B.; writing—review and editing, A.B., B.F.-G., B.F., D.Š. and F.T.; visualization, A.B.; supervision, B.F.-G., B.F. and F.T.; project administration, D.Š. and F.T.; funding acquisition, D.Š. All authors have read and agreed to the published version of the manuscript.

Funding

This research was funded by the European Space Agency (ESA), grant number 4000137701/22/NL/SC, and by the Ministry of Science, Education and Youth Republic of Croatia, grant number NPOO.C3.2.R2-I1.05.0009.

Institutional Review Board Statement

Not applicable.

Informed Consent Statement

Not applicable.

Data Availability Statement

Data used in this research can be downloaded at https://dataspace.copernicus.eu/ (accessed on 2 February 2025). The EFFIS data can be downloaded at https://forest-fire.emergency.copernicus.eu/ (accessed on 2 February 2025).

Conflicts of Interest

Author Amalija Božiček was employed by the company Adnet Ltd. The remaining authors declare that the research was conducted in the absence of any commercial or financial relationships that could be construed as a potential conflict of interest.

References

  1. Sentinel Online. Available online: https://sentinels.copernicus.eu/web/sentinel/home (accessed on 19 September 2024).
  2. Air Quality in the Republic of Croatia. Available online: https://iszz.azo.hr/iskzl/index.html (accessed on 19 November 2024).
  3. Hill, M.J. Vegetation index suites as indicators of vegetation state in grassland and savanna: An analysis with simulated SENTINEL 2 data for a North American transect. Remote Sens. Environ. 2013, 137, 94–111. [Google Scholar] [CrossRef]
  4. Gabban, A.; San-Miguel-Ayanz, J.; Viegas, D.X. On the suitability of the use of normalized difference vegetation index for forest fire risk assessment. Int. J. Remote Sens. 2006, 27, 5095–5102. [Google Scholar] [CrossRef]
  5. ESA, Land Cover. Available online: https://www.esa-landcover-cci.org/ (accessed on 18 November 2024).
  6. Addabbo, P.; Focareta, M.; Maruccio, S.; Votto, C.; Ullo, S.L. Contribution of Sentinel-2 data for applications in vegetation monitoring. Acta IMEXO 2016, 5, 44–54. [Google Scholar] [CrossRef]
  7. Lefebvre, A.; Sannier, C.; Corpetti, T. Monitoring Urban Areas with Sentinel-2A Data: Application to the Update of the Copernicus High Resolution Layer Imperviousness Degree. Remote Sens. 2016, 8, 606. [Google Scholar] [CrossRef]
  8. Misra, G.; Cawkwell, F.; Wingler, A. Status of Phenological Research Using Sentinel-2 Data: A Review. Remote Sens. 2020, 12, 2760. [Google Scholar] [CrossRef]
  9. Ramo, R.; Roteta, E.; Bistinasd, I.; van Weesd, D.; Aitor Bastarrika, A.; Chuvieco, E.; van der Werf, G.R. African burned area and fire carbon emissions are strongly impacted by small fires undetected by coarse resolution satellite data. Proc. Natl. Acad. Sci. USA 2021, 118, e2011160118. [Google Scholar] [CrossRef] [PubMed]
  10. Han, A.; Qing, S.; Bao, Y.; Na, L.; Bao, Y.; Liu, X.; Zhang, J.; Wang, C. Short-Term Effects of Fire Severity on Vegetation Based on Sentinel-2 Satellite Data. Sustainability 2021, 13, 432. [Google Scholar] [CrossRef]
  11. Wooster, M.J.; Xu, W.; Nightingale, T. Sentinel-3 SLSTR active fire detection and FRP product: Pre-launch algorithm development and performance evaluation using MODIS and ASTER datasets. Remote Sens. Environ. 2012, 120, 236–245. [Google Scholar] [CrossRef]
  12. Xu, W.; Wooster, M.J.; Polehampton, E.; Yemelyanova, R.; Zhang, T. Sentinel-3 active fire detection and FRP product performance—Impact of scan angle and SLSTR middle infrared channel selection. Remote Sens. Environ. 2021, 261, 112460. [Google Scholar] [CrossRef]
  13. Xu, W.; Wooster, M.J.; He, J.; Zhang, T. First study of Sentinel-3 SLSTR active fire detection and FRP retrieval: Nighttime algorithm enhancements and global intercomparison to MODIS and VIIRS AF products. Remote Sens. Environ. 2020, 248, 111947. [Google Scholar] [CrossRef]
  14. Stoyanova, J.S.; Georgiev, C.G.; Neytchev, P.N. Satellite Observations of Fire Activity in Relation to Biophysical Forcing Effect of Land Surface Temperature in Mediterranean Climate. Remote Sens. 2022, 14, 1747. [Google Scholar] [CrossRef]
  15. Polehampton, E.; Cox, C.; Smith, D.; Ghent, D.; Wooster, M.; Xu, W.; Bruniquel, J.; Henocq, C.; Dransfeld, S. Copernicus Sentinel-3 SLSTR Land User Handbook; European Space Agency: Paris, France, 2023. [Google Scholar]
  16. Pérez-Planells, L.; Niclòs, R.; Puchades, J.; Coll, C.; Göttsche, F.-M.; Valiente, J.A.; Valor, E.; Galve, J.M. Validation of Sentinel-3 SLSTR Land Surface Temperature Retrieved by the Operational Product and Comparison with Explicitly Emissivity-Dependent Algorithms. Remote Sens. 2021, 13, 2228. [Google Scholar] [CrossRef]
  17. Maffei, C.; Lindenbergh, R.; Menenti, M. Combining multi-spectral and thermal remote sensing to predict forest fire characteristics. ISPRS J. Photogramm. Remote Sens. 2021, 181, 400–412. [Google Scholar] [CrossRef]
  18. Tarpanelli, A.; Camici, S.; Nielsen, K.; Brocca, L.; Moramarco, T.; Benveniste, J. Potentials and limitations of Sentinel-3 for river discharge assessment. Adv. Space Res. 2021, 68, 593–606. [Google Scholar] [CrossRef]
  19. Zhang, D.; Tang, R.; Zhao, W.; Tang, B.; Wu, H.; Shao, K.; Li, Z.-L. Surface Soil Water Content Estimation from Thermal Remote Sensing based on the Temporal Variation of Land Surface Temperature. Remote Sens. 2014, 6, 3170. [Google Scholar] [CrossRef]
  20. Stoyanova, J.; Georgiev, C.; Neytchev, P.; Kulishev, A. Spatial-Temporal Variability of Land Surface Dry Anomalies in Climatic Aspect: Biogeophysical Insight by Meteosat Observations and SVAT Modeling. Atmosphere 2019, 10, 636. [Google Scholar] [CrossRef]
  21. TERRA. MODIS. Available online: https://terra.nasa.gov/about/terra-instruments/modis (accessed on 25 September 2024).
  22. MODIS Collection 5 Deep Blue Aerosol Product. Available online: https://ntrs.nasa.gov/api/citations/20170010422/downloads/20170010422.pdf (accessed on 2 February 2025).
  23. Veefkind, J.P.; Aben, I.; McMullan, K.; Förster, H.; de Vries, J.; Otter, G.; Claas, J.; Eskes, H.J.; de Haan, J.F.; Kleipool, Q.; et al. TROPOMI on the ESA Sentinel-5 Precursor: A GMES mission for global observations of the atmospheric composition for climate, air quality and ozone layer applications. Remote Sens. Environ. 2012, 120, 70–83. [Google Scholar] [CrossRef]
  24. SentiWiki. Sentinel-5P. Available online: https://sentiwiki.copernicus.eu/web/sentinel-5p (accessed on 25 September 2024).
  25. Tampubolon, T.; Yanti, J.; Tampubolon, F.R. Estimating Spatiotemporal Aerosol Index between MODIS and Sentinel 5 in Medan City. J. Phys. Conf. Ser. 2023, 2672, 012007. [Google Scholar] [CrossRef]
  26. Wang, Y.; Yuan, Q.; Li, T.; Tan, S.; Zhang, L. Full-coverage spatiotemporal mapping of ambient PM2.5 and PM10 over China from Sentinel-5P and assimilated datasets: Considering the precursors and chemical compositions. Sci. Total Environ. 2021, 793, 148535. [Google Scholar] [CrossRef] [PubMed]
  27. IEC/TS 60815-1; Selection and Dimensioning of High-Voltage Insulators for Polluted Conditions—Part 1: Definitions, Information and General Principles. International Electrotechnical Commission: Geneva, Switzerland, October 2008.
  28. EC/TS 60815-4; Selection and Dimensioning of High-Voltage Insulators for Polluted Conditions—Part 4: Definitions, Information and General Principles. International Electrotechnical Commission: Geneva, Switzerland, October 2016.
  29. INMR. Advanced Pollution Modeling on Insulators: Verification by Direct Measurements & Service Experience. Available online: https://www.inmr.com/advanced-pollution-modeling-on-insulators-verification-by-direct-measurements-service-experience/ (accessed on 18 November 2024).
  30. Ma, Y.; Pei, Z.; Ma, Y.; Wu, B.; Zhai, S.; Luo, J.; Kong, P. Mapping of Pollution Distribution for Electric Power System Based on Satellite Remote Sensing. Environ. Sci. 2022, 10, 938806. [Google Scholar] [CrossRef]
  31. Chisholm, W.A. Using Satellite Maps of Pollution Flux for Improved Insulator Selection and Operation; INMR World Congress: Barcelona, Spain, 2017. [Google Scholar]
  32. Chisholm, W.A. Dust and Sea Salt Pollution Mapping: Satellite Versus Ground Truth Results; INMR World Congress: Tucson, AZ, USA, 2024. [Google Scholar]
  33. Van Wagner, C.E.; Pickett, T.L. Equations and FORTRAN program for the 3 Forest Fire Weather Index System; Canadian Forest Service: Ottawa, ON, Canada, 1985. [Google Scholar]
  34. CIGRE WG B2.12; Guide for the Selection of Weather Parameters for Bare Overhead Conductor Ratings. CIGRE: Paris, France, 2006.
  35. Copernicus Data Space Service. Available online: https://dataspace.copernicus.eu/ (accessed on 19 November 2024).
  36. S2 Mission. Available online: https://sentiwiki.copernicus.eu/web/s2-mission (accessed on 16 November 2024).
  37. Stein Zweers, D.C. TROPOMI ATBD of the UV Aerosol Index; Royal Netherlands Meteorological Institute Ministry of Infrastructure and the Environment: Utrecht, The Netherlands, 2022. [Google Scholar]
  38. Kocman, S.; Debaecker, V.; Bas, S.; Saunier, S.; Garcia, K.; Just, D. Investigations on the Global Image Datasets for the Absolute Geometric Quality Assessment of MSG SEVIRI imagery. Int. Arch. Photogramm. Remote Sens. Spat. Inf. Sci. 2020, 43, 1339–1346. [Google Scholar] [CrossRef]
  39. European Forest Fire Information System. Available online: https://forest-fire.emergency.copernicus.eu/ (accessed on 23 September 2024).
  40. Kim, Y.; Jeong, M.-H.; Youm, M.; Kim, J.; Kim, J. Recovery of Forest Vegetation in a Burnt Area in the Republic of Korea: A Perspective Based on Sentinel-2 Data. Appl. Sci. 2021, 11, 2570. [Google Scholar] [CrossRef]
  41. Božiček, A.; Đurović, M.; Filipović-Grčić, B.; Stipetić, N.; Franc, B. Impact of Lightning-Induced Wildfires on Power System Based on Satellite Data and Climatological Projections. In Proceedings of the New Energy and Future Energy Systems Conference, Matsue, Japan, 21–24 November 2023. [Google Scholar] [CrossRef]
  42. Palumbo, I.; Gregoire, J.-M.; Simonetti, D.; Punga, M. Spatio-temporal distribution of fire activity in protected areas of Sub-Saharan Africa derived from MODIS data. Procedia Environ. Sci. 2021, 7, 26–31. [Google Scholar] [CrossRef]
  43. Pandas. Available online: https://pandas.pydata.org/ (accessed on 19 November 2024).
  44. GeoPandas. Available online: https://geopandas.org/en/stable/ (accessed on 19 November 2024).
  45. NumPy. Available online: https://numpy.org/ (accessed on 19 November 2024).
  46. SciPy. Available online: https://scipy.org/ (accessed on 19 November 2024).
  47. QGIS. Available online: https://www.qgis.org/ (accessed on 19 November 2024).
  48. Cartopy. Available online: https://scitools.org.uk/cartopy/docs/latest/ (accessed on 19 November 2024).
  49. Matplotlib. Available online: https://matplotlib.org/ (accessed on 2 February 2025).
  50. Zaninović, K.; Gajić-Čapka, M.; Perčec Tadić, M.; Vučetić, M.; Milković, J.; Bajić, A.; Cindrić, K.; Cvitan, L.; Katušin, Z.; Kaučić, D.; et al. Climate atlas of Croatia 1961–1990, 1971–2000. In Proceedings of the 9th EMS Annual Meeting, Toulouse, France, 28 September–2 October 2009. [Google Scholar]
  51. Copernicus Browser. Available online: https://browser.dataspace.copernicus.eu/ (accessed on 19 September 2024).
  52. EUMETSAT User Portal. Available online: https://view.eumetsat.int/productviewer?v=default (accessed on 19 September 2024).
  53. SEVIRI Dust RGB Quick Guide. Available online: https://resources.eumetrain.org/rgb_quick_guides/quick_guides/DustRGB.pdf (accessed on 30 September 2024).
  54. Kramer, P.; Kvassay, M.; Mojžiš, J.; Kenyeres, M.; Očkay, M.; Hluchý, L.; Pavlov, L.; Skurčák, L. Using Satellite Imagery to Improve Local Pollution Models for High-Voltage Transmission Lines and Insulators. Future Internet 2022, 14, 99. [Google Scholar] [CrossRef]
  55. Volpov, E.; Linder, R.; Kishcha, P. Development of Outdoor Insulation Pollution Maps for IECo Power Grid; CIGRE: Paris, France, 2018. [Google Scholar]
  56. Roteta, E.; Bastarrika, A.; Padilla, M.; Storm, T.; Chuvieco, E. Development of a Sentinel-2 burned area algorithm: Generation of a small fire database for sub-Saharan Africa. Remote Sens. Environ. 2019, 222, 1–17. [Google Scholar] [CrossRef]
  57. Chiang, S.-H.; Chiang, S.-H.; Ulloa, N.I. Mapping and Tracking Forest Burnt Areas in the Indio Maiz Biological Reserve Using Sentinel-3 SLSTR and VIIRS-DNB Imagery. Sensors 2019, 19, 5423. [Google Scholar] [CrossRef]
  58. MTG (Meteosat Third Generation). Available online: https://www.eoportal.org/satellite-missions/meteosat-third-generation#irs-infrared-sounder (accessed on 25 September 2024).
Figure 1. The area of interest is Croatia (red box) and the Istra–Kvarner–Rijeka area (blue box). Position coordinates are approximate.
Applsci 15 01533 g001
Figure 2. The workflow of this research.
Applsci 15 01533 g002
Figure 3. Recorded FRP (blue dots) and fire polygon (orange).
Applsci 15 01533 g003
Figure 4. The buffer around FRP pixels indicates the area of increased fire probability.
Applsci 15 01533 g004
Figure 5. Spatial distribution of LST values recorded on different dates for the fire event detected on 27 May 2021 at 12:06. The red line presents the fire polygon, and the blue dots present locations of measured LST values.
Applsci 15 01533 g005
Figure 6. The FWI that was calculated using the Canadian method, 1 April 2021.
Applsci 15 01533 g006
Figure 7. The Canadian FWI adjusted to Croatian conditions, 1 April 2021.
Applsci 15 01533 g007
Figure 8. The Saharan sand movement over the Mediterranean to the European continent, 19 June 2024. AI340/380 (a), AI354/388 (b) [51]. Position coordinates are approximate.
Applsci 15 01533 g008
Figure 9. Cloud cover, EUMETSAT, Dust RGB, 19.06.2024. 09 UTC (a) and 18 UTC (b) [52,53]. Position coordinates are approximate.
Applsci 15 01533 g009
Figure 10. Concentration of PM10 [µg/m3] particles in Rijeka, Croatia, 20–22 June 2024.
Applsci 15 01533 g010
Figure 11. Distribution of AI values in the Rijeka–Kvarner–Istria area.
Applsci 15 01533 g011
Figure 12. AI negative values (colored “×”) and PM10 particle concentrations (gray circle) on the day when outages appeared, 18 January 2022.
Applsci 15 01533 g012
Figure 13. AI positive values (colored “×”) and PM10 particle concentrations (gray circle) on the day when outages appeared, 6 February 2022.
Applsci 15 01533 g013
Figure 14. Correlations between the AI340-380 and PM10 particle concentration.
Applsci 15 01533 g014
Table 1. Danger classes for the FWI adjusted to Croatian conditions using LST data.
ClassVery LowLowModerateHighVery HighExtreme
Value≤−5<−5, 0]<0, 10]<10, 15]<15, 20]20<
Table 2. The time duration of the power network operations and the possibilities of using Sentinel data ("+” signify possible use, “−” signify imposible use).
Satellite Mission Sentinel 2 MSISentinel 3 LSTSentinel 3 FRPSentinel 5p AI/LH
Operation Duration
Hourly
Intra-day+++
Day-ahead+++
Weekly+
Monthly and seasonal+
Long term++++
Disclaimer/Publisher’s Note: The statements, opinions and data contained in all publications are solely those of the individual author(s) and contributor(s) and not of MDPI and/or the editor(s). MDPI and/or the editor(s) disclaim responsibility for any injury to people or property resulting from any ideas, methods, instructions or products referred to in the content.

