
Update on Endemic Fluorosis in a Region of Europe (Tenerife, Canary Islands)

 ,
,  ,
,  ,
,  ,
, 

Abstract
1. Introduction
2. Material and Methods
2.1. Samples
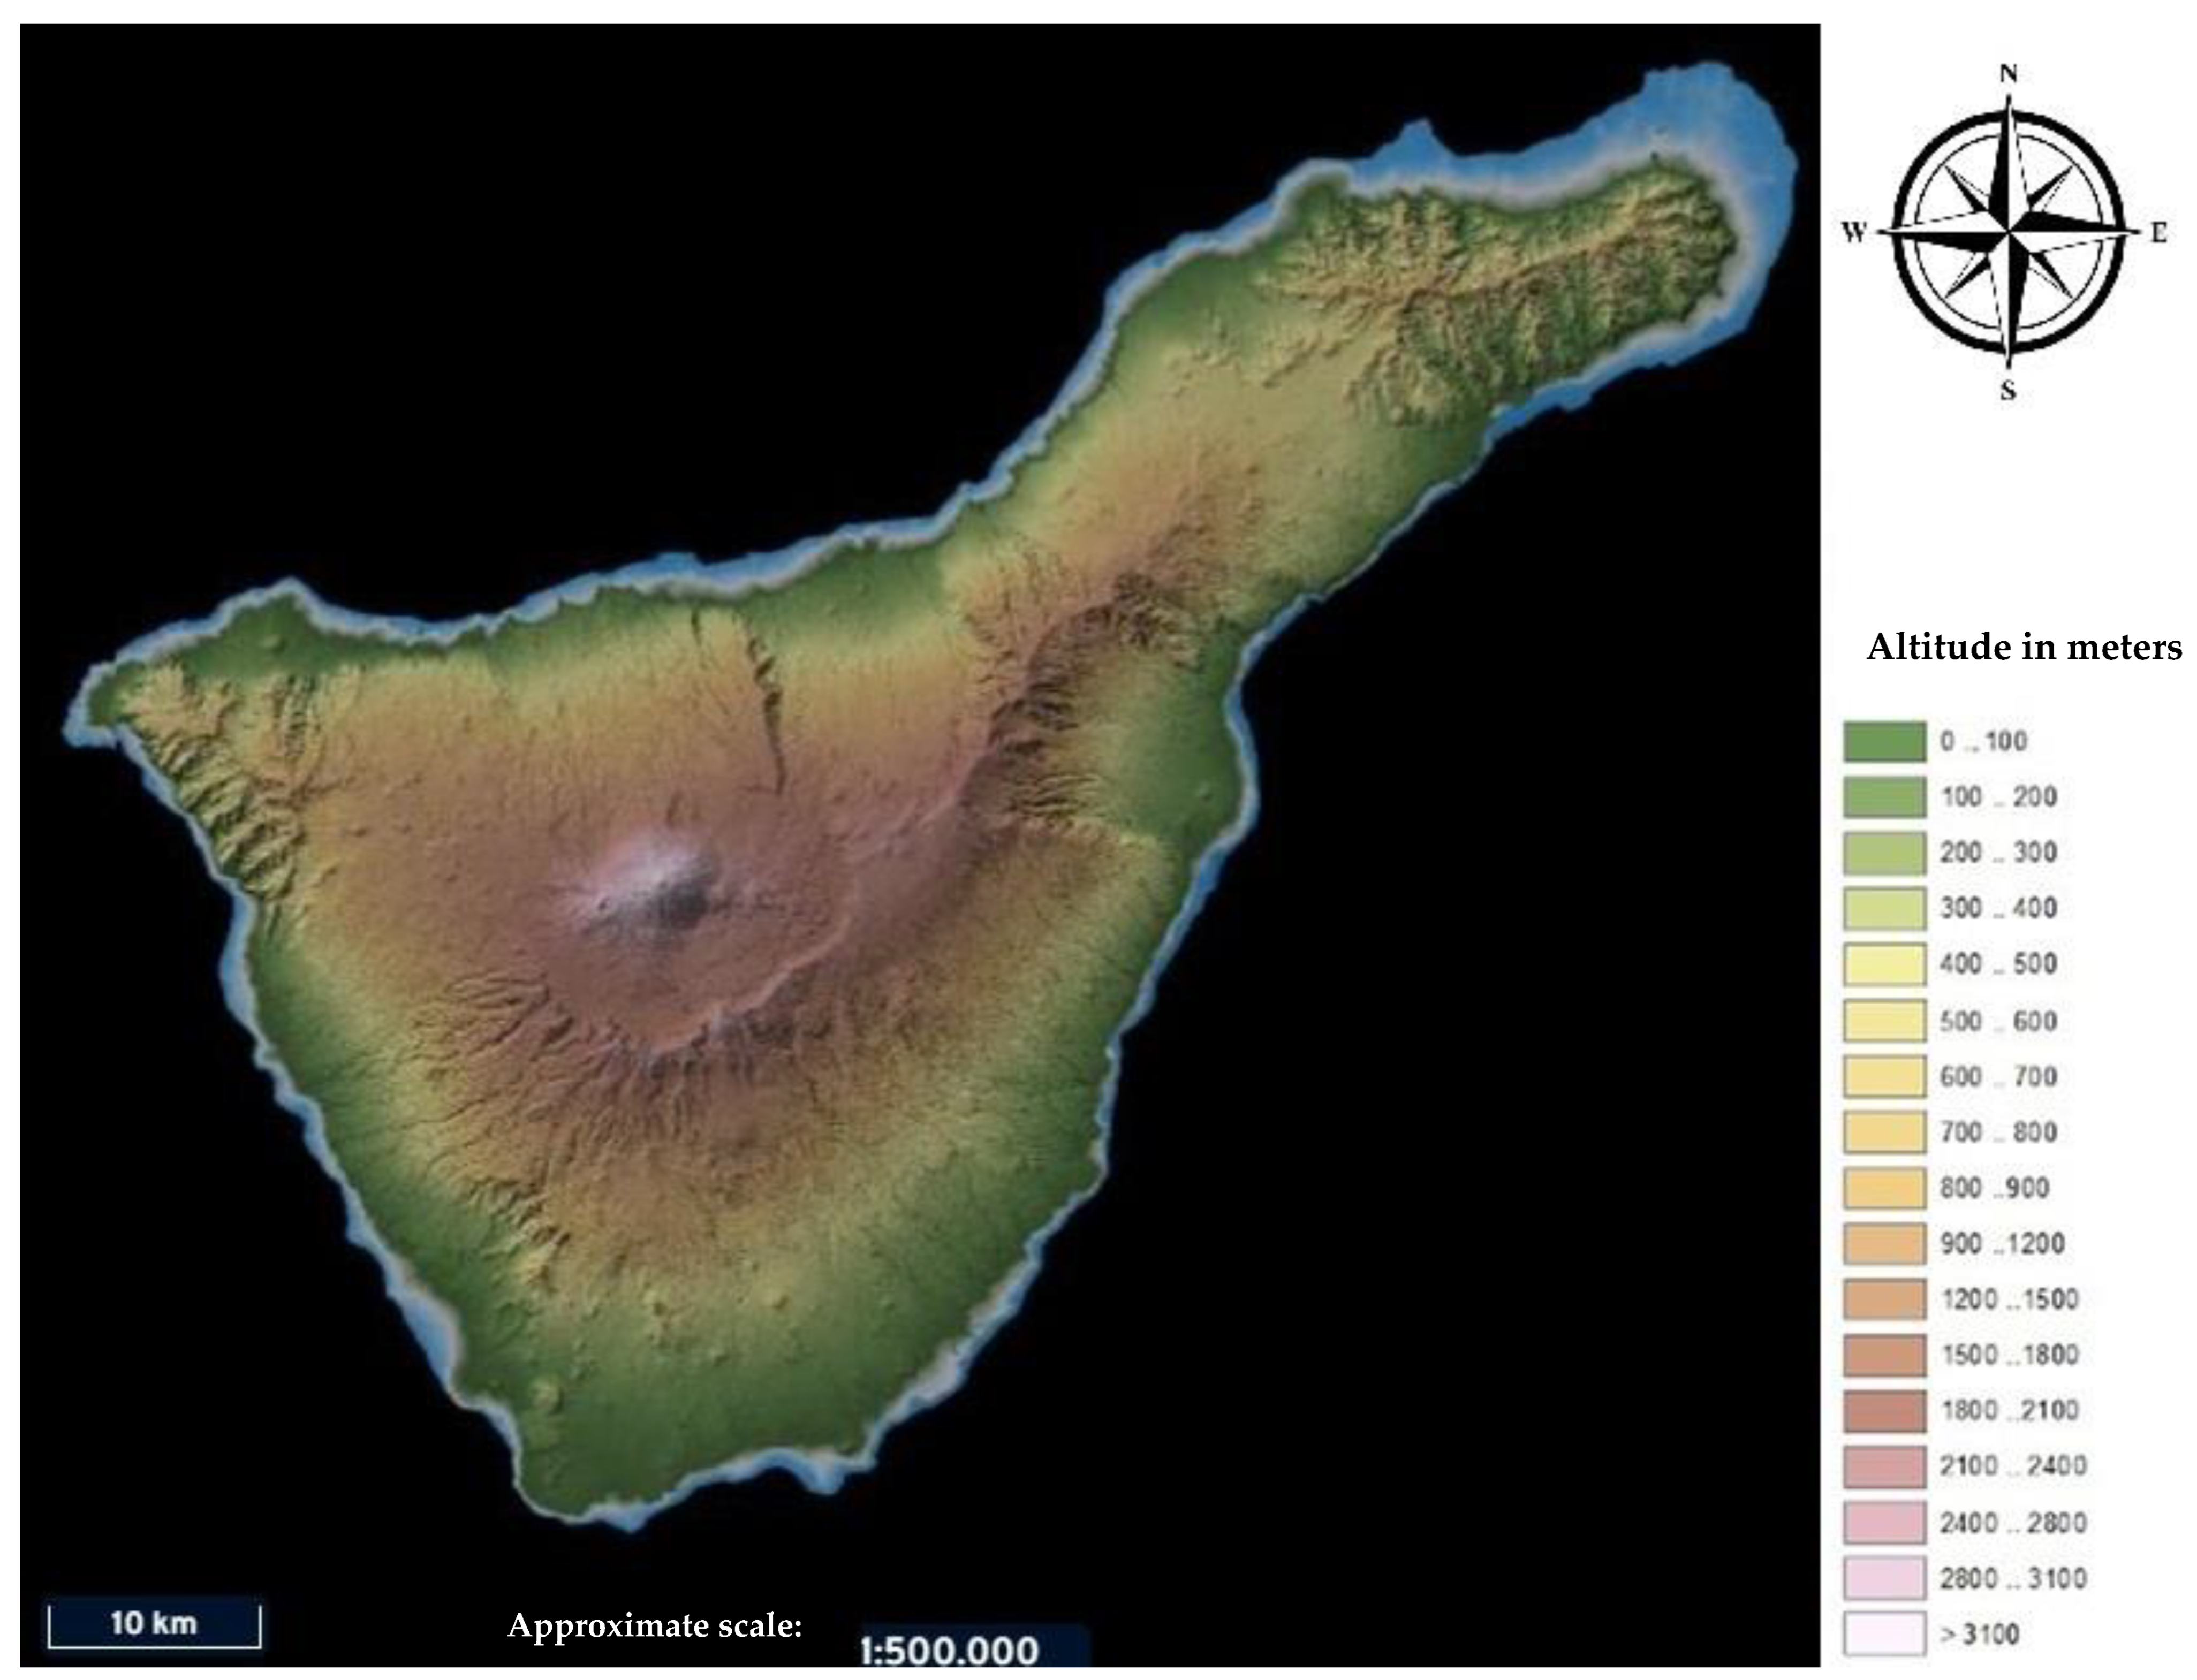
- Metropolitan region: Santa Cruz de Tenerife, La Laguna, El Rosario and Tegueste.
- Northern region: Tacoronte, el Sauzal, la Matanza de Acentejo, la Victoria de Acentejo, Santa Úrsula, la Orotava, Puerto de la Cruz, los Realejos, San Juan de la Rambla, la Guancha, Icod de los Vinos, Garachico, el Tanque, los Silos and Buenavista.
- Southern region: Candelaria, Arafo, Güimar, Fasnia, Arico, Granadilla de Abona, San Miguel de Abona, Vilaflor, Arona, Adeje, Guía de Isora and Santiago del Teide.
2.2. Analytical Method
2.3. Statistical Análisis
2.4. Fluoride Exposure Assessment and Risk Characterization
3. Results and Discussion
Exposure Assessment and Risk Characterization
4. Conclusions
Author Contributions
Funding
Institutional Review Board Statement
Informed Consent Statement
Data Availability Statement
Conflicts of Interest
References
- Christe, K.; Schneider, S. Fluorine, Chemical Element. 2018. Available online: https://www.britannica.com/science/fluorine (accessed on 27 March 2018).
- Symonds, R.; Rose, W.; Reed, M. Contribution of Cl- and F-bearing gases to the atmosphere by volcanoes. Nature 1988, 344, 415–418. [Google Scholar] [CrossRef]
- Pyle, D.M.; Mather, T.A. Halogens in igneous processes and their fluxes to the atmosphere and oceans from volcanic activity: A review. Chem. Geol. 2009, 263, 110–121. [Google Scholar] [CrossRef]
- Wang, H.; Mu, L.; Jiang, M.; Wang, Y.; Yan, W.; Jiao, Y. The relationship between chemical elements in soil and whole blood, and fluorosis induced by coal-fired pollution. Environ. Monit. Assess. 2014, 186, 2081–2088. [Google Scholar] [CrossRef]
- Tu, J.; Liu, K.-J.; Ran, L.-J.; Pan, X.-P. Fluoride Burden of Aluminum Plant Workers. Iran. J. Public Health 2015, 44, 583–585. Available online: http://www.ncbi.nlm.nih.gov/pubmed/26056678 (accessed on 10 November 2024). [PubMed]
- Liteplo, R.; Gomes, R.; Howe, P.; Malcolm, H. Environmental Health Criteria 227. Fluorides; World Health Organization: Geneva, Switzerland, 2002; Available online: http://apps.who.int/iris/bitstream/handle/10665/42415/WHO_EHC_227.pdf;jsessionid=E2A19C99E8F7A0D2C3ABD388A0C5AED7?sequence=1 (accessed on 10 November 2024).
- ATSDR; U.S. Department of Health and Human Services. Toxicological Profile for Fluorides, Hydrogen Fluoride, and Fluorine’ Agency for Toxic Substances and Disease Registry; Agency for Toxic Substances and Disease Registry: Atlanta, GA, USA, 2003. Available online: https://www.atsdr.cdc.gov/toxprofiles/tp11.pdf (accessed on 12 December 2024).
- Camargo, J.A. Fluoride toxicity to aquatic organisms: A review. Chemosphere 2003, 50, 251–264. [Google Scholar] [CrossRef]
- Regenspurg, S.; Virchow, L.; Wilke, F.D.; Zimmer, M.; Jolie, E.; Hachenberger, A.; Yirgu, G.; Gebru, E.F.; Vieth-Hillebrand, A.; Gizaw, B. Origin and migration of fluoride in the area of the Aluto Volcanic Complex (Main Ethiopian Rift). Appl. Geochem. 2022, 146, 105403. [Google Scholar] [CrossRef]
- Gaciri, S.J.; Davies, T.C. The occurrence and geochemistry of fluoride in some natural waters of Kenya. J. Hydrol. 1993, 143, 395–412. [Google Scholar] [CrossRef]
- Bellomo, S.; Alessandro, W.; Longo, M. Volcanogenic fluoride in rainwater around active degassing volcanoes: Mt. Etna and Stromboli Island. Sci. Total Environ. Environ. 2003, 301, 175–185. [Google Scholar] [CrossRef]
- Salazar Pérez, C. Adsorción de Fluoruro por Alúmina Activada. La Laguna. 2016. Available online: https://riull.ull.es/xmlui/bitstream/handle/915/2918/AdsorciondeFluoruroporAluminaActivada.pdf?sequence=1 (accessed on 11 November 2024).
- Rodríguez Gómez, M.I. Determinación Potenciométrica de la Concentración de Fluoruros en Aguas y Algunos Alimentos Líquidos. Cálculo de la Ingesta por Parte de la Población Canaria; Universidad de La Laguna: Santa Cruz de Tenerife, Spain, 2015. [Google Scholar]
- Martín Delgado, M.M.; Suárez Fraga, M.A.; Hardisson de la Torre, A.; Álvarez Marante, R. Metabolismo y toxicología del ión fluoruro. Cir. Far. 1991, 309, 3–24. [Google Scholar]
- Chu, C.H.; Mei, M.L.; Lo, E.C.M. Use of fluorides in dental caries management. Gen. Dent. 2010, 58, 37–43; quiz 44–45, 79–80. Available online: http://www.ncbi.nlm.nih.gov/pubmed/20129891 (accessed on 11 November 2024).
- Marília Afonso Rabelo, B. Fluoride and the Oral Environment; Karger: Basel, Switzerland, 2011. [Google Scholar]
- Giambro, N.J.; Prostak, K.; DenBesten, P.K. Characterization of Fluorosed Human Enamel by Color Reflectance, Ultrastructure, and Elemental Composition. Caries Res. 1995, 29, 251–257. [Google Scholar] [CrossRef]
- Luke, J. Fluoride Deposition in the Aged Human Pineal Gland. Caries Res. 2001, 35, 125–128. [Google Scholar] [CrossRef] [PubMed]
- Fratzl, P.; Roschger, P.; Eschberger, J.; Abendroth, B.; Klaushofer, K. Abnormal bone mineralization after fluoride treatment in osteoporosis: A small-angle x-ray-scattering study. J. Bone Miner. Res. 2009, 9, 1541–1549. [Google Scholar] [CrossRef] [PubMed]
- Valdez-Jiménez, L.; Soria Fregozo, C.; Miranda Beltrán, M.L.; Gutiérrez Coronado, O.; Pérez Vega, M.I. Efectos del flúor sobre el sistema nervioso central. Neurología 2011, 26, 297–300. [Google Scholar] [CrossRef]
- Varol, E.; Varol, S. Does Fluoride Toxicity Cause Hypertension in Patients with Endemic Fluorosis? Biol. Trace Elem. Res. 2012, 150, 1–2. [Google Scholar] [CrossRef] [PubMed]
- Grandjean, P.; Landrigan, P.J. Neurobehavioural effects of developmental toxicity. Lancet Neurol. 2014, 13, 330–338. [Google Scholar] [CrossRef] [PubMed]
- Choi, A.L.; Zhang, Y.; Sun, G.; Bellinger, D.C.; Wang, K.; Yang, X.J.; Li, J.S.; Zheng, Q.; Fu, Y.; Grandjean, P. Association of lifetime exposure to fluoride and cognitive functions in Chinese children: A pilot study. Neurotoxicology Teratol. 2015, 47, 96–101. [Google Scholar] [CrossRef] [PubMed]
- Aghaei, M.; Karimzade, S.; Yaseri, M.; Khorsandi, H.; Zolfi, E.; Hossein Mahvi, A. Hypertension and fluoride in drinking water: Case study from west Azerbaijan, Iran. Res. Rep. 2015, 48, 252–258. Available online: http://eprints.umsu.ac.ir/451/1/FJ2015_v48_n3_p252-258_sfs.pdf (accessed on 20 December 2024).
- Panneerselvam, L.; Govindarajan, V.; Ameeramja, J.; Nair, H.R.; Perumal, E. Single oral acute fluoride exposure causes changes in cardiac expression of oxidant and antioxidant enzymes, apoptotic and necrotic markers in male rats. Biochimie 2015, 119, 27–35. [Google Scholar] [CrossRef]
- Linhares, D.P.S.; Garcia, P.V.; Amaral, L.; Ferreira, T.; Cury, J.A.; Vieira, W.; Rodrigues, A.d.S. Sensitivity of two biomarkers for biomonitoring exposure to fluoride in children and women: A study in a volcanic area. Chemosphere 2016, 155, 614–620. [Google Scholar] [CrossRef]
- Dec, K.; Łukomska, A.; Maciejewska, D.; Jakubczyk, K.; Baranowska-Bosiacka, I.; Chlubek, D.; Wąsik, A.; Gutowska, I. The Influence of Fluorine on the Disturbances of Homeostasis in the Central Nervous System. Biol. Trace Elem. Res. 2017, 177, 224–234. [Google Scholar] [CrossRef] [PubMed]
- Death, C.; Coulson, G.; Kierdorf, U.; Kierdorf, H.; Morris, W.K.; Hufschmid, J. Dental fluorosis and skeletal fluoride content as biomarkers of excess fluoride exposure in marsupials. Sci. Total Environ. 2015, 533, 528–541. [Google Scholar] [CrossRef]
- Jáudenes Marrero, J.R. Estudio de la Ingesta Dietética de Fluoruro en la Población Canaria; Universidad de La Laguna: Santa Cruz de Tenerife, Spain, 2019. [Google Scholar]
- World Health Organization. Fluoride in Drinking-Water, Background Document for Development of WHO Guidelines for Drinking-Water Quality; World Health Organization: Geneva, Switzerland, 2004; Available online: https://www.who.int/docs/default-source/wash-documents/wash-chemicals/fluoride-background-document.pdf (accessed on 10 November 2024).
- Lung, S.-C.C.; Cheng, H.-W.; Fu, C.B. Potential exposure and risk of fluoride intakes from tea drinks produced in Taiwan. J. Expo. Sci. Environ. Epidemiol. 2008, 18, 158–166. [Google Scholar] [CrossRef]
- Dhar, V.; Bhatnagar, M. Physiology and toxicity of fluoride. Indian J. Dent. Res. 2009, 20, 350–355. [Google Scholar] [CrossRef] [PubMed]
- Sarvaiya, B.; Bhayya, R.; Arora, R.; Meht, D.N. Prevalence of dental fluorosis in relation with different fluoride levels in drinking water among school going children in Sarada tehsil of Udaipur district, Rajasthan. J. Indian Soc. Pedod. Prev. Dent. 2012, 30, 317. [Google Scholar] [CrossRef] [PubMed]
- Kakumanu, N.; Rao, S.D. Skeletal Fluorosis Due to Excessive Tea Drinking. N. Engl. J. Med. 2013, 368, 1140. [Google Scholar] [CrossRef]
- Mariño, R. The prevalence of fluorosis in children is associated with naturally occurring water fluoride concentration in Mexico. J. Evid.-Based Dent. Pract. 2013, 13, 100–101. [Google Scholar] [CrossRef]
- Ruxton, C. Fluoride in the UK diet. Nurs. Stand. 2014, 28, 52–59. [Google Scholar] [CrossRef]
- González Sacramento, N.; Rubio Armendáriz, C.R.; Gutierrez, A.J.; Luis Gonzalez, G.; Hardisson de la Torre, A.; Revert Gironés, C. El agua de consumo como fuente de exposición crónica a fluoruro en Tenerife; evaluación del riesgo. Nutr. Hosp. 2015, 31, 1787–1794. [Google Scholar] [PubMed]
- Waugh, D.T.; Potter, W.; Limeback, H.; Godfrey, M. Risk assessment of fluoride intake from tea in the Republic of Ireland and its implications for public health and water fluoridation. Int. J. Environ. Res. Public Health 2016, 13, 259. [Google Scholar] [CrossRef]
- Rodríguez, I.; Hardisson, A.; Paz, S.; Rubio, C.; Gutiérrez, A.J.; Jaudenes, J.R.; Burgos, A.; Revert, C. Fluoride intake from the consumption of refreshment drinks and natural juices. J. Food Compos. Anal. 2018, 72, 97–103. [Google Scholar] [CrossRef]
- Alejandro-Vega, S.; Hardisson, A.; Rubio, C.; Gutiérrez, A.J.; Jaudenes-Marrero, J.R.; Paz-Montelongo, S. Soft Drinks as a Dietary Source of Fluoride Exposure. Biol. Trace Elem. Res. 2023, 202, 3816–3828. [Google Scholar] [CrossRef] [PubMed]
- Chaudhuri, R.N. Fluorine and Fluorosis. Indian Med. Gaz. 1944, 79, 273–274. [Google Scholar]
- Daver, M.B. Occurrence of fluorosis in endemic forms in Hyderabad state. Indian Med. Gaz. 1945, 80, 332–336. Available online: http://www.ncbi.nlm.nih.gov/pubmed/21007249 (accessed on 15 November 2024).
- Khan, Y.M.; Wig, K.L. Chronic endemic fluorosis (with bone affections) in the Punjab. Indian Med. Gaz. 1945, 80, 429–433. Available online: http://www.ncbi.nlm.nih.gov/pubmed/21009994 (accessed on 11 November 2024).
- Arellano, L.A.; Fleitas, A.T.; Dávila, M.E. Prevalencia de Fluorosis dental en áreas fluoruradas y no fluoruradas de la ciudad de Mérida, Venezuela. Acta Odontológica Venez. 1998, 36, 35–40. [Google Scholar]
- Mulualem, D.; Hailu, D.; Tessema, M.; Whiting, S.J. Association of Dietary Calcium Intake with Dental, Skeletal and Non-Skeletal Fluorosis among Women in the Ethiopian Rift Valley. Int. J. Environ. Res. Public Health 2022, 19, 2119. [Google Scholar] [CrossRef] [PubMed]
- Mohammadi, A.; Yousefi, M.; Yaseri, M.; Jalilzadeh, M.; Mahvi, A. Skeletal fluorosis in relation to drinking water in rural areas of West Azerbaijan, Iran. Sci. Rep. 2017, 7, 17300. [Google Scholar] [CrossRef] [PubMed]
- Al Warawreh, A.; Al Tamimi, Z.; Al Qatawna, M.; Al Momani, A.; Al Mhaidat, M.; El Naji, W.; AlSaraireh, S. Prevalence of Dental Fluorosis among Southern Jordanian Population. Int. J. Dent. 2020, 2020, 8890004. [Google Scholar] [CrossRef]
- Mahantesha, T.; Dixit, U.; Nayakar, R.; Ashwin, D.; Ramagoni, N.; Kamavaram Ellore, V. Prevalence of Dental Fluorosis and associated Risk Factors in Bagalkot District, Karnataka, India. Int. J. Clin. Pediatr. Dent. 2016, 9, 256–263. [Google Scholar] [CrossRef] [PubMed]
- Rojanaworarit, C.; Claudio, L.; Howteerakul, N.; Siramahamongkol, A.; Ngernthong, P.; Kongtip, P.; Woskie, S. Hydrogeogenic fluoride in groundwater and dental fluorosis in Thai agrarian communities: A prevalence survey and case-control study. BMC Oral Health 2021, 21, 545. [Google Scholar] [CrossRef]
- Li, M.; Qu, X.; Miao, H.; Wen, S.; Hua, Z.; Ma, Z.; He, Z. Spatial distribution of endemic fluorosis caused by drinking water in a high-fluorine area in Ningxia, China. Environ. Sci. Pollut. Res. 2020, 27, 20281–20291. [Google Scholar] [CrossRef] [PubMed]
- Firempong, C.; Nsiah, K.; Awunyo-Vitor, D.; Dongsogo, J. Soluble fluoride levels in drinking water-a major risk factor of dental fluorosis among children in Bongo community of Ghana. Ghana Med. J. 2013, 47, 16–23. [Google Scholar]
- Kwai Kut, K.M.; Sarswat, A.; Srivastava, A.; Pittman, C.U.; Mohan, D. A review of fluoride in african groundwater and local remediation methods. Groundw. Sustain. Dev. 2016, 2–3, 190–212. [Google Scholar] [CrossRef]
- Indermitte, E.; Saava, A.; Karro, E. Exposure to high fluoride drinking water and risk of dental fluorosis in Estonia. Int. J. Environ. Res. Public Health 2009, 6, 710–721. [Google Scholar] [CrossRef]
- Molina-Frechero, N.; Gaona, E.; Angulo, M.; Sanchez Perez, L.; Gonzalez Gonzalez, R.; Nevarez Rascon, M.; Bologna-Molina, R. Fluoride Exposure Effects and Dental Fluorosis in Children in Mexico City. Med. Sci. Monit. Int. Med. J. Exp. Clin. Res. 2015, 21, 17300. [Google Scholar] [CrossRef] [PubMed]
- Rocha, R.A.; Calatayud, M.; Devesa, V.; Vélez, D. Evaluation of exposure to fluoride in child population of North Argentina. Environ. Sci. Pollut. Res. 2017, 24, 22040–22047. [Google Scholar] [CrossRef] [PubMed]
- Do, L.; Ha, D.; Roberts-Thomson, K.; Spencer, A. Dental fluorosis in the Australian adult population. Aust. Dent. J. 2020, 65, 47–51. [Google Scholar] [CrossRef]
- Nilchian, F.; Asgary, I.; Mastan, F. The Effect of Dental Fluorosis on the Quality of Life of Female High School and Precollege Students of High Fluoride-Concentrated Area. J. Int. Soc. Prev. Community Dent. 2018, 8, 314–319. [Google Scholar] [CrossRef] [PubMed]
- Saldarriaga, A.; Rojas-Gualdrón, D.; Restrepo, M.; Santos-Pinto, L.; Jeremias, F. Dental fluorosis severity in children 8-12 years old and associated factors. Acta Odontológica Latinoam 2021, 34, 156–165. [Google Scholar] [CrossRef]
- Beltrán-Aguilar, E.; Barker, L.; Dye, B. Prevalence and Severity of Dental Fluorosis in the United States, 1999–2004; NCHS Data Brief; U.S. Department of Health and Human Services, Centers for Disease Control and Prevention, National Center for Health Statistics: Washington, DC, USA, 2010; Volume 53, pp. 1–8.
- El Día. (2021, 28 de Febrero). El Pueblo que Depende de la Mayor Galería de Agua de Canarias. Available online: https://www.eldia.es/tenerife/2021/02/28/pueblo-depende-mayor-galeria-agua-35976726.amp.html (accessed on 29 November 2024).
- El Diario. Canariasahora. (2023, 26 de Febrero). Las Recientes Erupciones y el Exceso de Demanda Reavivan la Alerta de una Traba Histórica con el Agua del Norte de Tenerife. Available online: https://www.eldiario.es/canariasahora/sociedad/recientes-erupciones-exceso-demanda-reavivan-alerta-traba-historica-agua-norte-tenerife_1_9980868.html (accessed on 29 November 2024).
- Fernandez Caldas, E.; Perez García, V. Las aguas subterraneas de Tenerife. Origen y caracterísitcas químicas. An. Edafol. Agrobiol. 1967, 26, 294–308. [Google Scholar]
- Gómez Santos, G.; Gómez Santos, D.; Martín Delgado, M. Fluor y Fluorosis Dental; Servicio Canario de la Salud. Dirección General de Salud Pública, Ed.; Gobierno de Canarias: Santa Cruz de Tenerife, Spain, 2002. [Google Scholar]
- Stewart, C.; Johnston, D.M.; Leonard, G.S.; Horwell, C.J.; Thordarson, T.; Cronin, S.J. Contamination of water supplies by volcanic ashfall: A literature review and simple impact modelling. J. Volcanol. Geotherm. Res. 2006, 158, 296–306. [Google Scholar] [CrossRef]
- Jha, S.K.; Mishra, V.K.; Sharma, D.K.; Damodaran, T. Fluoride in the Environment and Its Metabolism in Humans. In Reviews of Environmental Contamination and Toxicology Volume 211; Whitacre, D.M., Ed.; Springer: New York, NY, USA, 2011; pp. 121–142. [Google Scholar]
- Kaur, A.; Bala, R.; Bhinder, S.S.; Kansal, S.K. Chapter 5—Health impacts due to fluoride contamination in water: Current scenario. In Contamination of Water; Ahamad, A., Siddiqui, S.I., Singh, P., Eds.; Academic Press: Cambridge, MA, USA, 2021; pp. 65–84. [Google Scholar]
- Quesada, M.L.; de la Nuez, J.; Martín, M.C.; Eff-Darwich, A. Vigilancia de la Actividad Volcánica en Tenerife Mediante una Red de Seguimiento de la Emisión de Radón. V Programa Marco en el Area “Energía, Medio Ambiente y Desarrollo Sostenible”. 2003. Available online: https://tern.webs.ull.es/geologiatenerife.htm (accessed on 20 January 2025).
- Gobierno de Canarias. Población Según Sexos. Municipios por Islas de Canarias y Años; Instituto Canario de Estadística: Las Palmas de Gran Canaria, Spain, 2024; Available online: https://www3.gobiernodecanarias.org/istac/statistical-visualizer/visualizer/data.html?resourceType=dataset&agencyId=ISTAC&resourceId=E30245A_000002&version=~latest#visualization/table (accessed on 20 January 2025).
- European Commission. Directive 2020/2184 of the European Parliament and of the Council of 16 December 2020 on the Quality of Water Intended for Human Consumption, Pub. L. No. DOUE. Núm. 435, de 23/12/2020; European Commission: Brussels, Belgium, 2020. [Google Scholar]
- Gobierno de España. Real Decreto 3/2023, de 10 de Enero, por el que se Establecen los Criterios Técnico-Sanitarios de la Calidad del Agua de Consumo, su Control y Suministro., Pub. L. No. 4253–4354; Gobierno de España: Madrid, Spain, 2023. [Google Scholar]
- GRAFCAN. Sistema de Información Territorial de Canarias; Gobierno de Canarias: Santa Cruz de Tenerife, Spain, 2025; Available online: https://visor.grafcan.es/visorweb/default.php?svc=svcMTI&srid=EPSG:32628&lat=3132812.4632702535&lng=357489.9682400531&zoom=11&lang=es# (accessed on 20 January 2025).
- Consejo Insular de Aguas de Tenerife. Plan Hidrológico de Tenerife 2021–2027. 2023. Available online: https://www.aguastenerife.org/index.php?option=com_content&view=article&id=294&Itemid=1673 (accessed on 2 December 2024).
- EFSA. Scientific Panel on Dietetic Products Nutrition and Allergies Scientific Opinion on Dietary Reference Values for fluoride. EFSA J. 2013, 11, 3332. [Google Scholar] [CrossRef]
- EFSA. Scientific Committee on Food (SCF) and the EFSA Panel on Dietetic Products, Nutrition and Allergies (NDA). Overview on Tolerable Upper Intake Levels. 2023. Available online: https://www.efsa.europa.eu/sites/default/files/2023-11/ul_summary_tables-version-8.pdf (accessed on 20 November 2024).
- EFSA. Scientific Panel on Dietetic Products, Nutrition and Allergies Scientific opinion on dietary reference values for water. EFSA J. 2010, 8, 1459. [Google Scholar]
- Falcón Florido, J.T.; Hardisson de la Torre, A.; Máiquez Chaves, M.; Alvarez Marante, R.; Wildpret Dixkes, L.M. Recalificación sanitaria de las aguas de abastecimiento público en la isla de Tenerife. Rev. Sanid. Hig. Pública 1987, 1–2, 105–115. [Google Scholar]
- Consejo Insular de Aguas de Tenerife. Plan Hidrológico de Tenerife 2009–2015. 2009. Available online: https://www.aguastenerife.org/index.php?option=com_content&view=article&id=126&Itemid=1676 (accessed on 2 December 2024).
- Consejo Insular de Aguas de Tenerife. Plan Hidrológico de Tenerife 2015–2021. 2015. Available online: https://www.aguastenerife.org/index.php?option=com_content&view=article&id=138&Itemid=1675 (accessed on 2 December 2024).
- Rodriguez, M.I.; de Bonis, A.; León, M.C.; Hardisson, A.; Sierra, A. Estudio de la concentración de fluoruro en aguas de abastecimiento público en tres municipios de la isla de Tenerife. In Proceedings of the III Congreso Iberoamericano de Toxicología y XI Jornadas Toxicológicas Españolas, Tenerife, Spain, 25–28 September 1995. [Google Scholar]
- Hardisson, A.; Rodríguez, M.I.; Burgos, A.; Díaz Flores, L.; Gutiérrez, R.; Várela, H. Fluoride Levels in Publicly Supplied and Bottled Drinking Water in the Island of Tenerife, Spain. Bull. Environ. Contam. Toxicol. 2001, 67, 163–170. [Google Scholar] [CrossRef]
- Hardisson, A.; Reyes, J.P. Estudio de los contenidos en ion fluoruro en dos zonas endémicas de fluorosis dental en las Islas Canarias. Alimentaria 1986, 177, 43–48. [Google Scholar]
- Falcón, J.T.; Hardisson, A.; Brito, G.; Ríos, R.; Rodríoguez, C.; Garrido, M.D. Estudio fisicoquímico de las aguas de abastecimiento público del archipielago canario. Aliment. Rev. Tecnol. Hig. Los Aliment. 1987, 184, 49–56. [Google Scholar]
- Hardisson, A. Proyecto de investigación de la Consejería de Sanidad y Consumo titulado “Estudio de las concentraciones de fluoruro en aguas y vinos de las Islas Canarias. Evaluación de los efectos toxicológicos de su consumo,” Pub. L. No. BOC. Resolución de 26 de agosto de 1996. Boletín Of. Canar. 1996, 119, 8619–8623. [Google Scholar]
- Proyecto Tecnoagua. Evaluación de Tecnologías Potenciales de Reduccionde la Contaminación de las Aguas de Canarias; Universidad de La Laguna: Santa Cruz de Tenerife, Spain, 2011. [Google Scholar]
- Friess, J.; Rubio, C.; Hernández Sánchez, C.; Glas, K.; Hardisson, A. Niveles de fluoruro en aguas de consumo humano en una isla volcánica (Tenerife, Islas Canarias). In Proceedings of the Sitges: XI National Congress Spanish Society of Nutrition, Sitges, Spain, 10–13 June 2009. [Google Scholar]
- Rubio, C.; Rodríguez, I.; Jaudenes, J.R.; Gutiérrez, A.J.; Paz, S.; Burgos, A.; Hardisson, A.; Revert, C. Fluoride levels in supply water from a volcanic area in the Macaronesia region. Environ. Sci. Pollut. Res. 2020, 27, 11587–11595. [Google Scholar] [CrossRef] [PubMed]
- Revelo-Mejía, I.A.; Alejandro-Vega, S.; Paz-Montelongo, S.; Niebla-Canelo, D.; Cerdán-Pérez, S.; Rubio-Armendáriz, C.; Gutiérrez-Fernández, Á.J.; Hardisson, A.; Rodríguez-Díaz, R.; Hernández-Sánchez, C. Fluoride Levels in Supply Water from the Canary Islands Region. Foods 2023, 12, 745. [Google Scholar] [CrossRef] [PubMed]
- European Commission. Directive 2000/60/EC of the European Parliament and of the Council of October 23, 2000 Establishing a Framework for Community Action in the Field of Water Policy, Pub. L. No. DOCE. Núm. 327, de 22/12/2000, 1; European Commission: Brussels, Belgium, 2000. [Google Scholar]
- Jáudenes Marrero, J.R.; Hardisson de la Torre, A.; Gutiérrez Fernández, Á.J.; Rubio Armendáriz, C.R.; Revert Gironés, C. Evaluación del riesgo tóxico por la presencia de fluoruro en aguas de bebida envasada consumidas en Canarias. Nutr. Hosp. 2015, 32, 2261–2268. [Google Scholar] [CrossRef] [PubMed]


| Age Groups | UL (mgF/day) |
|---|---|
| 0–6 months | - |
| 7–11 months | - |
| 1–3 years | 1.5 |
| Male 4–6 years | 2.5 |
| Female 4–6 years | 2.5 |
| Male 7–9 years | 2.5 |
| Female 7–9 years | 2.5 |
| Male 10–14 years | 5 |
| Female 10–14 years | 5 |
| Male 15–17 years | 7 |
| Female 15–17 years | 7 |
| Male > 18 years | 7 |
| Female > 18 years | 7 |
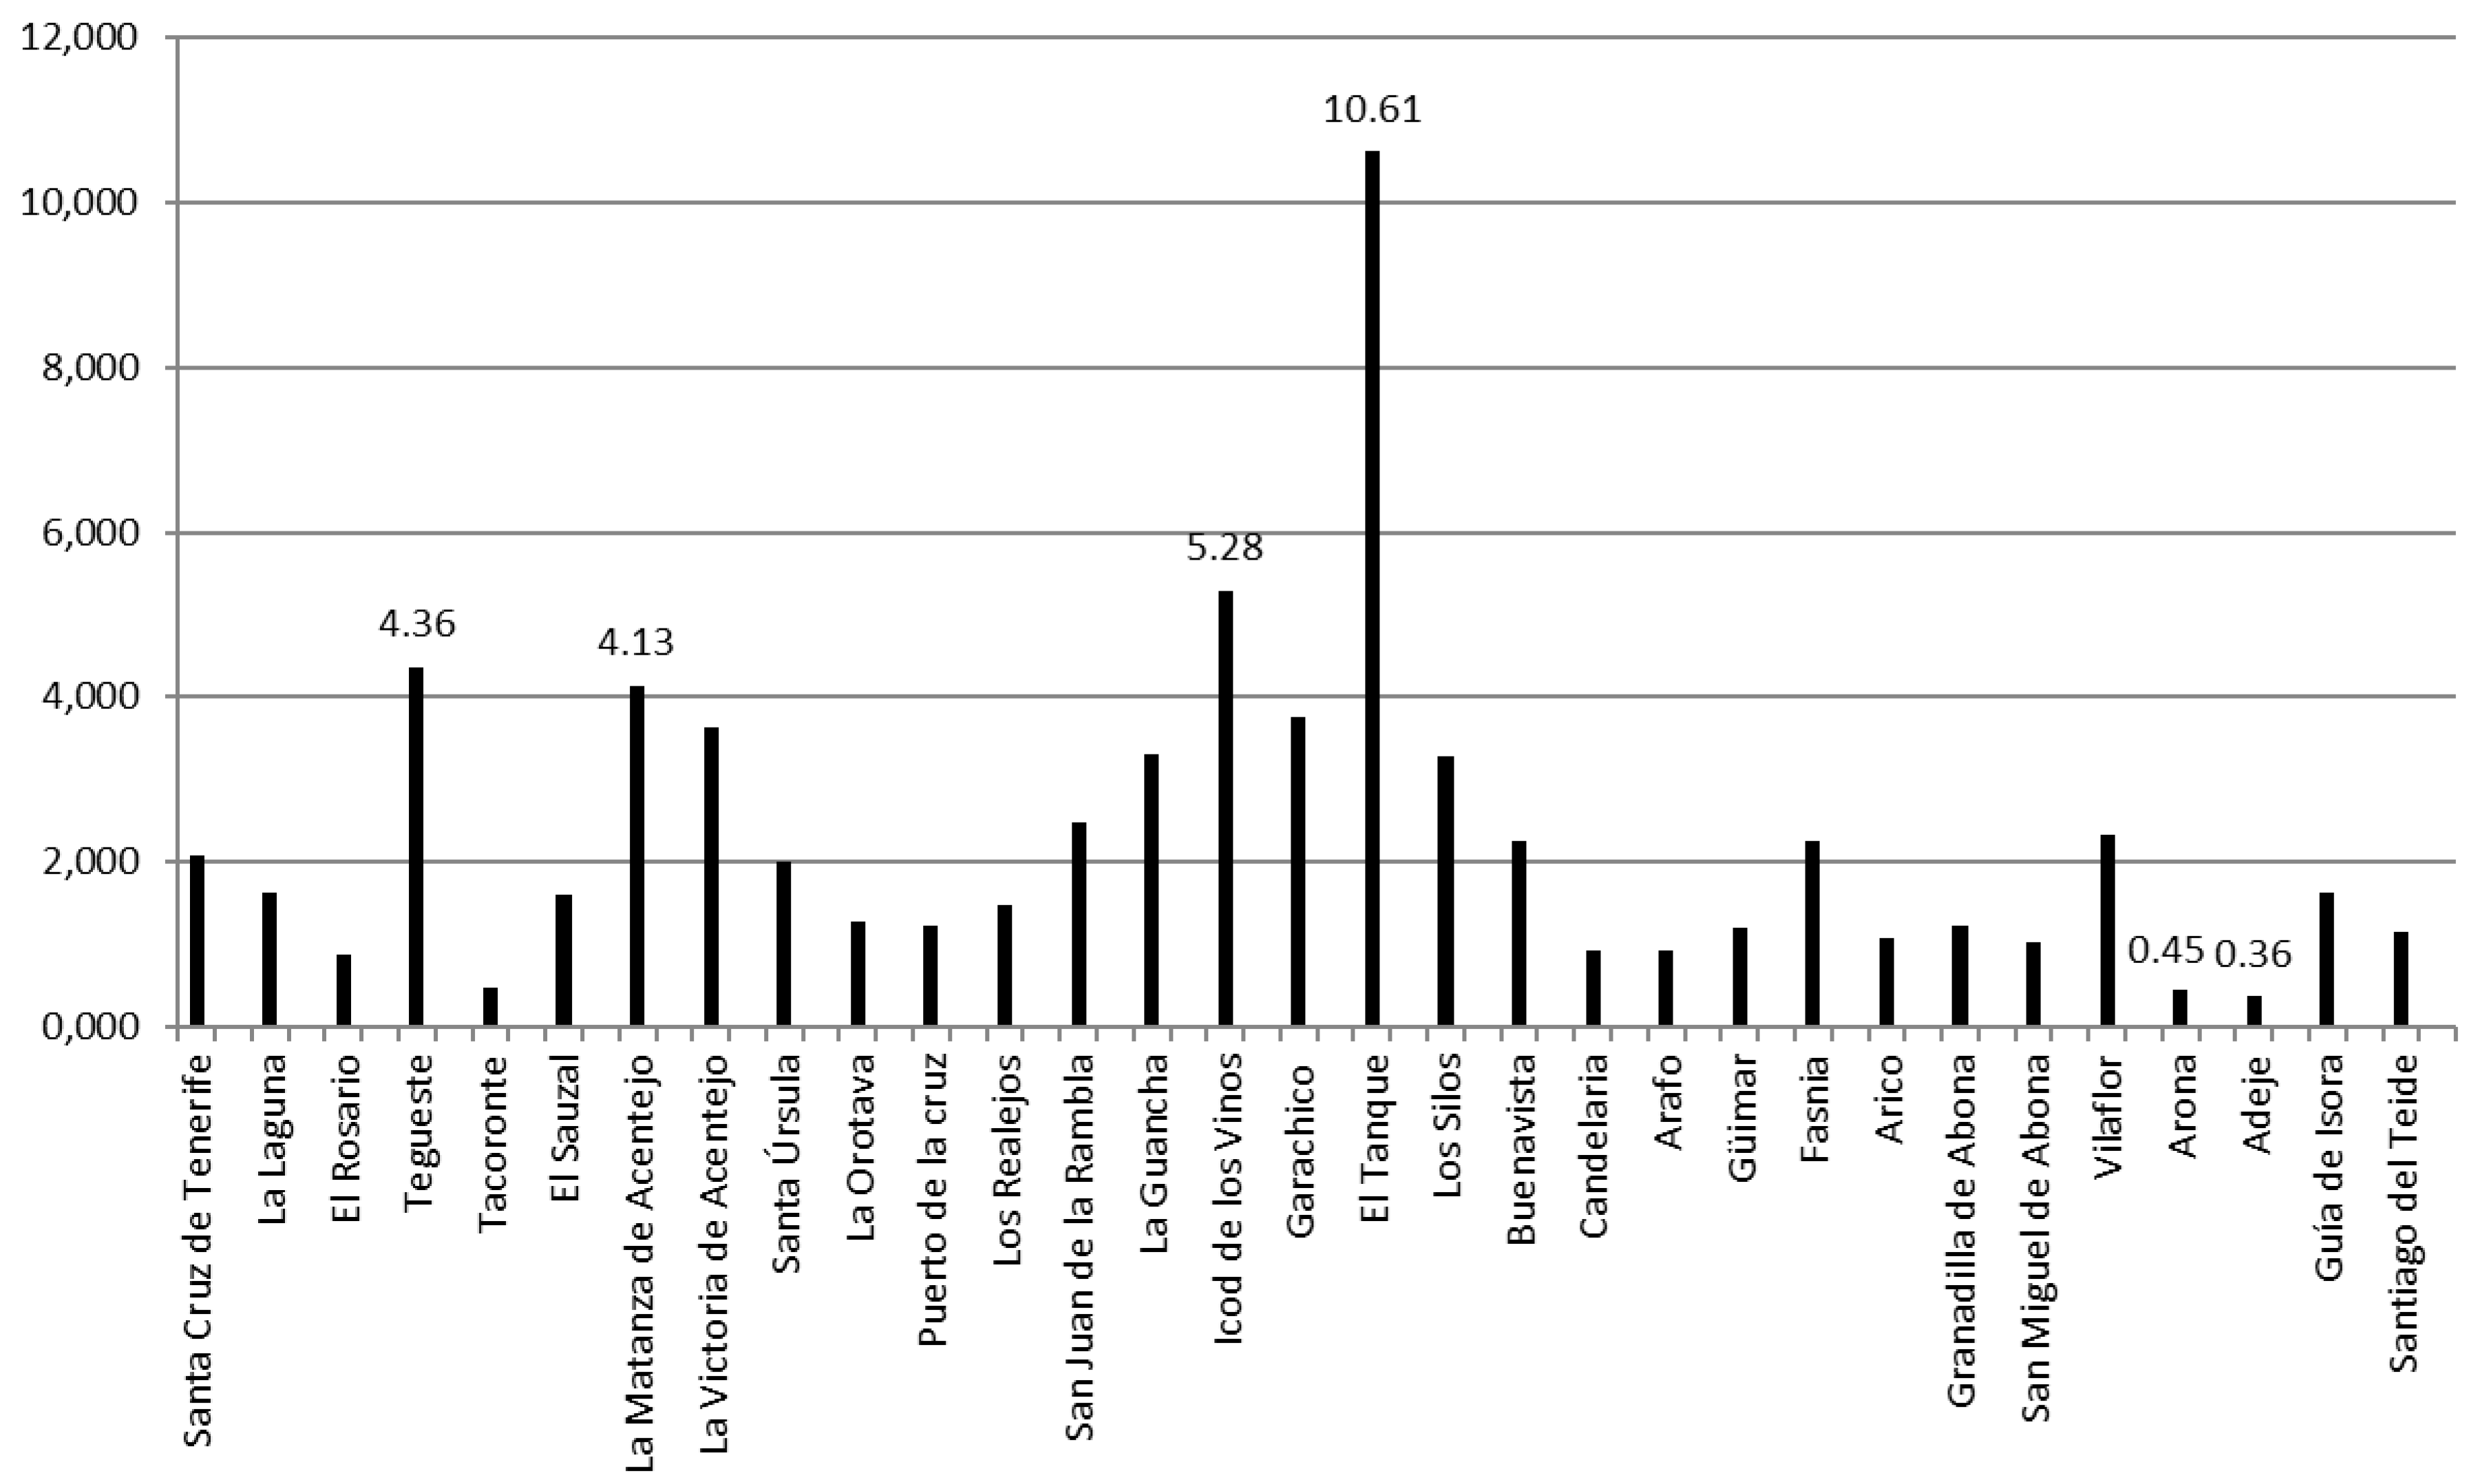
| Region | Municipality | District | [F−] mg/L District | [F−] mg/L Municipality | CI (95%) Municipality | [F−] mg/L Region | CI (95%) Region |
|---|---|---|---|---|---|---|---|
| Metropolitan | Santa Cruz de Tenerife | Casco urbano | 0.16 | 2.08 ± 2.71 | 2.08 ± 3.76 | 2.24 ± 1.50 | 2.24 ± 1.47 |
| Sobradillo | 4.00 | ||||||
| La Laguna | Valle Guerra | 1.30 | 1.64 ± 0.48 | 1.64 ± 0.66 | |||
| Geneto | 1.98 | ||||||
| El Rosario | Radazul | 0.82 | 0.89 ± 0.09 | 0.89 ± 0.13 | |||
| Machado | 0.95 | ||||||
| Tegueste | Casco urbano | 4.29 | 4.37 ± 0.11 | 4.37 ± 0.15 | |||
| El Socorro | 4.44 | ||||||
| North | Tacoronte | Casco urbano | 0.44 | 0.47 ± 0.05 | 0.47 ± 0.08 | 3.12 ± 2.45 | 3.12 ± 1.24 |
| Agua García | 0.51 | ||||||
| El Sauzal | La Baranda | 1.09 | 1.59 ± 0.71 | 1.59 ± 0.99 | |||
| Ravelo | 2.10 | ||||||
| La Matanza de Acentejo | Casco urbano | 2.52 | 4.13 ± 2.27 | 4.13 ± 3.15 | |||
| El Pirul | 5.74 | ||||||
| La Victoria de Acentejo | Santo Domingo | 0.93 | 3.63 ± 3.82 | 3.63 ± 5.30 | |||
| Vera-Carril | 6.33 | ||||||
| Santa Úrsula | Casco urbano | 2.19 | 2.00 ± 0.27 | 2.00 ± 0.37 | |||
| La Corujera | 1.81 | ||||||
| La Orotava | Casco urbano | 1.23 | 1.28 ± 0.08 | 1.28 ± 0.11 | |||
| Pinolere | 1.33 | ||||||
| Puerto de la cruz | Casco urbano | 0.92 | 1.23 ± 0.44 | 1.23 ± 0.61 | |||
| Las Dehesas | 1.55 | ||||||
| Los Realejos | San Cayetano | 1.75 | 1.49 ± 0.37 | 1.49 ± 0.51 | |||
| Casco urbano | 1.23 | ||||||
| San Juan de la Rambla | San Juan | 2.21 | 2.48 ± 0.38 | 2.48 ± 0.53 | |||
| Los Quevedos | 2.75 | ||||||
| La Guancha | Las Longueras | 3.41 | 3.32 ± 0.13 | 3.32 ± 0.17 | |||
| Casco urbano | 3.23 | ||||||
| Icod de los Vinos | San Marcos | 6.50 | 5.28 ± 1.73 | 5.28 ± 2.40 | |||
| El Amparo | 4.06 | ||||||
| Garachico | Casco urbano | 3.97 | 3.75 ± 0.31 | 3.75 ± 0.43 | |||
| San Juan del Reparo | 3.53 | ||||||
| El Tanque | Casco | 3.46 | 10.61 ± 10.12 | 10.61 ± 14.02 | |||
| San José de los Llanos | 17.76 | ||||||
| Los Silos | La Caleta de Interián | 3.25 | 3.29 ± 0.06 | 3.29 ± 0.08 | |||
| Casco urbano | 3.33 | ||||||
| Buenavista | Masca | 0.43 | 2.25 ± 2.58 | 2.25 ± 3.57 | |||
| Las Portelas | 4.07 | ||||||
| South | Candelaria | Casco urbano | 0.57 | 0.94 ± 0.51 | 0.94 ± 0.71 | 1.22 ± 0.60 | 1.22 ± 0.34 |
| Las Cuevecitas | 1.30 | ||||||
| Arafo | La Hidalga | 0.94 | 0.94 ± 0.01 | 0.94 ± 0.01 | |||
| Casco urbano | 0.93 | ||||||
| Güimar | Puertito de Güimar | 1.41 | 1.20 ± 0.31 | 1.20 ± 0.43 | |||
| Casco urbano | 0.98 | ||||||
| Fasnia | Los Roques de Fasnia | 2.05 | 2.26 ± 0.29 | 2.26 ± 0.40 | |||
| Casco urbano | 2.46 | ||||||
| Arico | Abades | 0.95 | 1.08 ± 0.20 | 1.08 ± 0.27 | |||
| Casco urbano | 1.22 | ||||||
| Granadilla de Abona | San Isidro | 0.39 | 1.22 ± 1.18 | 1.22 ± 1.63 | |||
| Casco urbano | 2.06 | ||||||
| San Miguel de Abona | Las Chafiras | 0.46 | 1.02 ± 0.79 | 1.02 ± 1.09 | |||
| Casco urbano | 1.58 | ||||||
| Vilaflor | La Escalona | 2.57 | 2.32 ± 0.34 | 2.32 ± 0.48 | |||
| Casco urbano | 2.08 | ||||||
| Arona | Las Américas | 0.05 | 0.45 ± 0.57 | 0.45 ± 0.80 | |||
| Casco urbano | 0.86 | ||||||
| Adeje | Costa Adeje | 0.02 | 0.37 ± 0.49 | 0.37 ± 0.68 | |||
| Casco urbano | 0.71 | ||||||
| Guía de Isora | Alcalá | 0.91 | 1.62 ± 1.00 | 1.62 ± 1.39 | |||
| Casco urbano | 2.33 | ||||||
| Santiago del Teide | Puerto Santiago | 0.45 | 1.16 ± 1.01 | 1.16 ± 1.39 | |||
| Casco urbano | 1.87 |
| Gallery | Year | |||||
|---|---|---|---|---|---|---|
| 1976 | 1981 | 1984 | 1986 | 1995 | 1997 | |
| Barranco Vergara | 6.41 | 7.80 | 8.00 | 9.40 | 10.20 | 10.00 |
| El Frontón | 4.72 | 5.10 | - | 4.40 | - | - |
| Pinalete | 4.18 | - | - | 4.30 | - | - |
| Sta. Teresa | 3.96 | 5.00 | - | 3.90 | - | - |
| Los Palomos | 3.25 | 5.98 | - | 4.30 | - | - |
| El Porvenir | 2.58 | 3.10 | - | 3.10 | - | - |
| Derriscadero | 2.54 | 2.00 | - | 3.30 | - | - |
| La Esperanza | 0.57 | - | - | - | - | - |
| Fuente Pedro * | - | 5.20 | 5.00 | - | - | - |
| Bilbao * | - | 4.10 | 3.50 | - | - | - |
| El Partido * | - | 2.90 | 2.75 | - | - | - |
| Municipality | Years | ||||||||||
|---|---|---|---|---|---|---|---|---|---|---|---|
| 1983 a | 1986 b | 1987 c | 1995 d | 1997 e | 1998–2000 f | 2006 f | 2009 g | 2015 h | 2020 i | 2023 j | |
| El-Tanque | 0.31–4.93 | - | 0.65 | - | - | >2.7 | >4 | 0.35–4.38 | 0.34–2.95 | - | 2.13 ± 0.01 |
| Garachico | 0.17–5.12 | - | 0.35 | - | - | >2.7 | 1.5–4 | 0.47–2.5 | 1.33–3.05 | - | 3.32 ± 0.78 |
| Icod-de-los-Vinos | 0.25–5.60 | - | 5.20–5.60 | 4.38 ± 2.13 | - | >2.7 | 1.5–4 | 2.22–3.94 | 2.05–3.12 | 4.59 ± 2.75 | 2.52 |
| Buenavista | 0.43–4.53 | - | 0.35 | - | - | >2.7 | >4 | 1.11–1.16 | 1.00–6.70 | - | - |
| Los-Silos | 0.20–0.62 | - | 0.50 | - | - | >2.7 | 1.5–4 | 1.05 | 0.96–3.05 | - | 2.41 ± 1.25 |
| La-Guancha | 2.75–8.00 | 3.90 | 4.10 | 5.11 ± 1.02 | 5.8 | >2.7 | 1.5–4 | 1.52–2.07 | - | 5.55 ± 1.18 | 3.82 ± 0.08 |
| San-Juan-de-la-Rambla | 0.70–4.47 | - | 2.50–2.90 | 2.64 ± 0.20 | - | >2.7 | 1.5–4 | 0.95–2.45 | 0.82–3.01 | 2.50 ± 0.35 | 2.73 |
| La-Matanza | 0.31–1.19 | - | 1.20 | - | - | 1.5–2.7 | 1.5–4 | 2.41–3.03 | 2.95–3.51 | - | 2.85 ± 0.35 |
| El-Sauzal | 1.31–1.38 | - | 1.40 | - | - | 1.5–2.7 | 1.5–4 | 2.34–2.76 | 0.67–4.5 | - | 7.00 |
| La-Victoria | 0.70–1.19 | - | 1.20 | - | - | 1.5–2.7 | 1.5–4 | 0.36–2.87 | 0.33–3.42 | - | 2.71 |
| Santa-Úrsula | 0.38–1.40 | - | 0.80–0.95 | - | - | 1.5–2.7 | 1.5–4 | 0.22–1.21 | 0.77–1.28 | - | 2.75 ± 0.55 |
| La-Laguna | 0.40–1.37 | - | 0.95 | - | - | 1.5 | <1.5 | 0.15–2.14 | 0.96–3.06 | - | 1.51 ± 1.13 |
| Tacoronte | 0.31–1.25 | - | 1.40 | - | - | 1.5–2.7 | <1.5 | 0.56–3.02 | - | - | 0.42 ± 0.16 |
| Tegueste | 0.45–1.35 | - | 0.90 | - | - | 1.5 | <1.5 | 0.26 | - | - | 5.39 ± 1.77 |
| Puerto-de-la-Cruz | 1.10–2.03 | - | 0.30–4.40 | - | - | 1.5 | <1.5 | 0.66–1.41 | - | - | 0.75 |
| La-Orotava | 0.27–0.52 | - | 0.28–0.30 | - | - | 1.5 | <1.5 | 0.42–0.52 | - | - | 4.92 ± 5.30 |
| Los-Realejos | 0.00–3.35 | - | 0.35 | - | - | >2.7 | <1.5 | 0.54–0.88 | - | - | 1.63 ± 0.40 |
| Santa-Cruz-de-Tenerife | 0.13–2.31 | - | 0.28 | - | - | <0.7 | <1.5 | 0.07–0.32 | - | - | 0.73 ± 1.39 |
| El-Rosario | 0.27–0.52 | - | 0.43 | - | - | <0.7 | <1.5 | 0.23–0.34 | - | - | 1.62 ± 0.83 |
| Candelaria | 0.20–0.78 | - | 0.50 | - | - | <0.7 | <1.5 | 0.19–0.23 | - | - | 0.96 ± 0.67 |
| Arafo | 0.65 | - | 0.53 | - | - | <0.7 | <1.5 | 0.36–0.41 | - | - | 2.32 ± 0.97 |
| Güimar | 0.44–2.65 | - | 0.66 | - | - | 1.5 | <1.5 | 0.38–0.59 | - | - | 0.99 ± 0.02 |
| Arico | 0.87–2.69 | - | 1.10–1.66 | - | - | 1.5 | <1.5 | 0.23–0.53 | - | - | 0.84 ± 1.46 |
| Granadilla | 0.45–0.95 | - | 0.30–0.95 | - | - | <0.7 | <1.5 | 0.57–1.33 | - | - | 1.16 ± 0.68 |
| San-Miguel | 0.37–0.80 | - | 0.80 | - | - | 1.5 | <1.5 | 0.33–0.59 | - | - | 0.93 ± 0.05 |
| Vilaflor | 0.40–1.12 | - | 0.30 | - | - | <0.7 | <1.5 | 0.21–0.28 | - | - | 0.57 ± 0.14 |
| Arona | 0.56–0.90 | - | 0.35 | - | - | <0.7 | <1.5 | 0.19–0.48 | - | - | 0.11 ± 0.08 |
| Adeje | 0.45–2.00 | - | 1.60 | - | - | <0.7 | >4 | 2.59–4.89 | - | - | 0.27 ± 0.40 |
| Guia-de-Isora | 0.45–1.15 | - | 0.30 | - | - | 1.5 | <1.5 | 0.57–1.41 | - | - | - |
| Santiago-del-Teide | 0.45–0.91 | - | 0.25 | - | - | 1.5 | <1.5 | 0.36–0.39 | - | - | 3.03 ± 0.07 |
| Fasnia | - | - | 0.12–0.95 | - | - | 1.5 | <1.5 | 1.22–1.31 | - | - | 2.60 ± 0.05 |
| Municipality | EDI (mg/L) | Contribution UL 1–3 Years (%) | Contribution UL 4–8 Years (%) | Contribution UL 10–14 Years (%) | Contribution UL > 18 Years (%) | ||||||
|---|---|---|---|---|---|---|---|---|---|---|---|
| 1 L | 1.5 L | 2 L | 1 L | 1.5 L | 1 L | 1.5 L | 1.5 L | 2 L | 1.5 L | 2 L | |
| Santa Cruz de Tenerife | 2.08 | 3.12 | 4.16 | 138.6 | 207.9 | 83.2 | 124.8 | 62.4 | 83.2 | 44.6 | 59.4 |
| La Laguna | 1.64 | 2.46 | 3.28 | 109.2 | 163.8 | 65.5 | 98.3 | 49.2 | 65.5 | 35.1 | 46.8 |
| El Rosario | 0.89 | 1.33 | 1.77 | 59.1 | 88.6 | 35.5 | 53.2 | 26.6 | 35.5 | 19.0 | 25.3 |
| Tegueste | 4.37 | 6.55 | 8.73 | 291.2 | 436.7 | 174.7 | 262.0 | 131.0 | 174.7 | 93.6 | 124.8 |
| Tacoronte | 0.47 | 0.71 | 0.95 | 31.6 | 47.5 | 19.0 | 28.5 | 14.2 | 19.0 | 10.2 | 13.6 |
| El Sauzal | 1.59 | 2.39 | 3.18 | 106.1 | 159.1 | 63.6 | 95.4 | 47.7 | 63.6 | 34.1 | 45.5 |
| La Matanza de Acentejo | 4.13 | 6.20 | 8.27 | 275.6 | 413.3 | 165.3 | 248.0 | 124.0 | 165.3 | 88.6 | 118.1 |
| La Victoria de Acentejo | 3.63 | 5.45 | 7.26 | 242.2 | 363.2 | 145.3 | 217.9 | 109.0 | 145.3 | 77.8 | 103.8 |
| Santa Úrsula | 2.00 | 3.00 | 4.00 | 133.4 | 200.1 | 80.0 | 120.1 | 60.0 | 80.0 | 42.9 | 57.2 |
| La Orotava | 1.28 | 1.92 | 2.56 | 85.3 | 128.0 | 51.2 | 76.8 | 38.4 | 51.2 | 27.4 | 36.6 |
| Puerto de la cruz | 1.23 | 1.85 | 2.46 | 82.1 | 123.2 | 49.3 | 73.9 | 37.0 | 49.3 | 26.4 | 35.2 |
| Los Realejos | 1.49 | 2.23 | 2.98 | 99.2 | 148.8 | 59.5 | 89.3 | 44.6 | 59.5 | 31.9 | 42.5 |
| San Juan de la Rambla | 2.48 | 3.72 | 4.96 | 165.3 | 248.0 | 99.2 | 148.8 | 74.4 | 99.2 | 53.1 | 70.9 |
| La Guancha | 3.32 | 4.98 | 6.64 | 221.3 | 331.9 | 132.8 | 199.1 | 99.6 | 132.8 | 71.1 | 94.8 |
| Icod de los Vinos | 5.28 | 7.92 | 10.56 | 352.0 | 528.0 | 211.2 | 316.8 | 158.4 | 211.2 | 113.1 | 150.9 |
| Garachico | 3.75 | 5.63 | 7.51 | 250.2 | 375.3 | 150.1 | 225.2 | 112.6 | 150.1 | 80.4 | 107.2 |
| El Tanque | 10.61 | 15.92 | 21.22 | 707.4 | 1061.1 | 424.5 | 636.7 | 318.3 | 424.5 | 227.4 | 303.2 |
| Los Silos | 3.29 | 4.94 | 6.58 | 219.4 | 329.0 | 131.6 | 197.4 | 98.7 | 131.6 | 70.5 | 94.0 |
| Buenavista | 2.25 | 3.38 | 4.51 | 150.2 | 225.3 | 90.1 | 135.2 | 67.6 | 90.1 | 48.3 | 64.4 |
| Candelaria | 0.94 | 1.41 | 1.88 | 62.6 | 93.8 | 37.5 | 56.3 | 28.2 | 37.5 | 20.1 | 26.8 |
| Arafo | 0.94 | 1.40 | 1.87 | 62.4 | 93.5 | 37.4 | 56.1 | 28.1 | 37.4 | 20.0 | 26.7 |
| Güimar | 1.20 | 1.79 | 2.39 | 79.7 | 119.6 | 47.8 | 71.7 | 35.9 | 47.8 | 25.6 | 34.2 |
| Fasnia | 2.26 | 3.38 | 4.51 | 150.4 | 225.7 | 90.3 | 135.4 | 67.7 | 90.3 | 48.4 | 64.5 |
| Arico | 1.08 | 1.63 | 2.17 | 72.3 | 108.4 | 43.4 | 65.0 | 32.5 | 43.4 | 23.2 | 31.0 |
| Granadilla de Abona | 1.22 | 1.84 | 2.45 | 81.6 | 122.4 | 49.0 | 73.5 | 36.7 | 49.0 | 26.2 | 35.0 |
| San Miguel de Abona | 1.02 | 1.53 | 2.04 | 68.0 | 102.1 | 40.8 | 61.2 | 30.6 | 40.8 | 21.9 | 29.2 |
| Vilaflor | 2.32 | 3.49 | 4.65 | 154.9 | 232.4 | 92.9 | 139.4 | 69.7 | 92.9 | 49.8 | 66.4 |
| Arona | 0.45 | 0.68 | 0.91 | 30.3 | 45.5 | 18.2 | 27.3 | 13.6 | 18.2 | 9.7 | 13.0 |
| Adeje | 0.37 | 0.55 | 0.73 | 24.5 | 36.7 | 14.7 | 22.0 | 11.0 | 14.7 | 7.9 | 10.5 |
| Guía de Isora | 1.62 | 2.43 | 3.24 | 108.1 | 162.2 | 64.9 | 97.3 | 48.7 | 64.9 | 34.8 | 46.3 |
| Santiago del Teide | 1.16 | 1.74 | 2.32 | 77.3 | 116.0 | 46.4 | 69.6 | 34.8 | 46.4 | 24.9 | 33.1 |
Disclaimer/Publisher’s Note: The statements, opinions and data contained in all publications are solely those of the individual author(s) and contributor(s) and not of MDPI and/or the editor(s). MDPI and/or the editor(s) disclaim responsibility for any injury to people or property resulting from any ideas, methods, instructions or products referred to in the content. |
© 2025 by the authors. Licensee MDPI, Basel, Switzerland. This article is an open access article distributed under the terms and conditions of the Creative Commons Attribution (CC BY) license (https://creativecommons.org/licenses/by/4.0/).
Share and Cite
Jáudenes-Marrero, J.R.; Paz-Montelongo, S.; Gutiérrez Fernández, Á.; Rubio, C.; Hardisson, A.; Alejandro-Vega, S. Update on Endemic Fluorosis in a Region of Europe (Tenerife, Canary Islands). Appl. Sci. 2025, 15, 1479. https://doi.org/10.3390/app15031479
Jáudenes-Marrero JR, Paz-Montelongo S, Gutiérrez Fernández Á, Rubio C, Hardisson A, Alejandro-Vega S. Update on Endemic Fluorosis in a Region of Europe (Tenerife, Canary Islands). Applied Sciences. 2025; 15(3):1479. https://doi.org/10.3390/app15031479
Chicago/Turabian StyleJáudenes-Marrero, Juan R., Soraya Paz-Montelongo, Ángel Gutiérrez Fernández, Carmen Rubio, Arturo Hardisson, and Samuel Alejandro-Vega. 2025. "Update on Endemic Fluorosis in a Region of Europe (Tenerife, Canary Islands)" Applied Sciences 15, no. 3: 1479. https://doi.org/10.3390/app15031479
APA StyleJáudenes-Marrero, J. R., Paz-Montelongo, S., Gutiérrez Fernández, Á., Rubio, C., Hardisson, A., & Alejandro-Vega, S. (2025). Update on Endemic Fluorosis in a Region of Europe (Tenerife, Canary Islands). Applied Sciences, 15(3), 1479. https://doi.org/10.3390/app15031479