Article

Sink–Source Characteristics of Carbon and Nitrogen in Four Typical Urban Water Bodies Within a Medium-Sized City of East China

1
School of Architecture and Planning, Foshan University, Foshan 528000, China
2
School of Environmental and Chemical Engineering, Foshan University, Foshan 528000, China
3
Guangdong Laboratory for Lingnan Modern Agriculture, Guangzhou 510642, China
4
State Key Laboratory of Environmental Criteria and Risk Assessment, Chinese Research Academy of Environmental Sciences, Beijing 100012, China
5
Key Laboratory of Land Surface Pattern and Simulation, Institute of Geographic Sciences and Natural Resources Research, Chinese Academy of Sciences, Beijing 100101, China
*
Author to whom correspondence should be addressed.
Appl. Sci. 2025, 15(3), 1434; https://doi.org/10.3390/app15031434
Submission received: 25 November 2024 / Revised: 22 January 2025 / Accepted: 23 January 2025 / Published: 30 January 2025
(This article belongs to the Section Environmental Sciences)

Abstract

:
The urban water environment, an integral component of the terrestrial hydrosphere, is closely linked to human activities and serves as a fundamental resource for industrial and agricultural development. Sedimentary organic matter in water bodies contains rich biological, physical, and chemical information, playing a central role in nutrient cycling and serving as a primary reservoir for nutrient accumulation. This study assesses the water quality, chemical indicators, and sediment productivity of four typical urban water bodies (Canal, Pond, Lake, and River) in Shaoxing City, eastern China. The results show that artificial water bodies, particularly canals, have higher dissolved oxygen (DO) compared to natural water bodies. Stationary water bodies, such as lakes and ponds, generally have higher total dissolved solids (TDS) and electrical conductivity (EC) than flowing water bodies like rivers and canals. All four urban water body types slightly exceed China’s Class-V water quality standard for total nitrogen (TN), with canals, lakes, ponds, and rivers averaging 1.29, 1.22, 1.23, and 1.23 times the standard, respectively. Ponds exhibit the highest total dissolved nitrogen (TDN) content, while ammonium (NH4+–N) and nitrate (NO3–N) levels are relatively consistent across the bodies, except for lower NO3–N in lakes. Higher organic matter in canals and lakes, indicated by chlorophyll-a (Chl-a) and permanganate index (CODMn), suggests greater eutrophication compared to ponds and rivers. Sediment total organic nitrogen (TON) content is relatively uniform across all water bodies, with slightly higher values in lakes and rivers. Total organic carbon (TOC) content is highest in lake sediments, 1.51 times that of canals. Carbon/nitrogen (C/N) ratios vary, with ponds and lakes showing the highest averages. Source quantification using isotopic analysis (δ13C and δ15N values) indicates that phytoplankton is the primary sedimentary organic matter source in rivers and canals, while terrestrial sources are significant in lakes and ponds. Sewage notably contributes to rivers and canals. These findings highlight the need for targeted pollution control strategies, focusing on phytoplankton and sewage as key sedimentary organic matter sources to mitigate eutrophication and enhance water quality in urban environments.

1. Introduction

The urban water environment is an important part of the terrestrial hydrosphere, which is closely related to human activities, and is a fundamental material basis for developing industrial and agricultural production and maintaining the life of urban residents [1,2,3]. Because of its unique location, the urban water environment integrates natural and human landscapes, serves as a major leisure area, and contributes to the economic development of cities. However, human impact on urban water environment is becoming increasingly severe. In the past two decades, eutrophication has occurred in urban water bodies in several countries to varying degrees, severely affecting the quality and function of urban water environments [4,5,6]. Eutrophication in urban water bodies in China is also relatively severe. Rapid urbanization, coupled with intensive industrial and agricultural activities in urban areas, causes excessive nitrogen (N) loading into urban rivers, lakes, and other small inner circulating water bodies in cities [7,8,9,10]. The eutrophication of urban water bodies has become an urgent problem that urban water environment protection should solve.
Sedimentary organic matter contains rich biological, physical, and chemical information. It is not only the central link of nutrient circulation in water bodies but also the main accumulation bank of nutrients [11,12,13]. Moreover, it can directly reflect the pollution history of water bodies and release various pollutants upward to the overlying water bodies under certain conditions, which is a major secondary pollution source affecting water quality [14,15]. Consequently, sedimentary organic matter preserves key information such as the original productivity and change process of water nutrition and can be used as an effective carrier to reconstruct the changes in water environmental productivity and evolution of material sources [16,17]. In general, the sedimentary organic matter sources can be categorized into internal and external sources, among which internal sources are mainly biological residues of water bodies and external sources are mainly granular and dissolved organic matter carried in the recharge process of external water sources [18,19,20]. Under the influence of human activities, nutrient salts are rapidly imported into urban water bodies, resulting in ecological environment changes such as water eutrophication, food chain structure changes, and seasonal hypoxia of bottom materials, which leave records in sediments.
Variation of biogenic elements, especially carbon (C) and nitrogen (N), and their isotopes in sediments is an effective indicator of water productivity, nutrient level, and material source [21]. The C/N ratio and stable isotopes of C and N in sediments are often used as indicators of changes in the source or cycle of sedimentary organic matter in aquatic systems over time because different sources of sedimentary organic matter have different C/N ratios and stable isotopic compositions [22,23,24]. For example, the C/N ratios of marine and terrestrial organic matter are usually 5–8 and >15, respectively. Under the influence of human activities, river sediments often show higher C/N ratios than marine sediments. Organic carbon isotope (δ13C) characteristics and C/N ratios are commonly used to assess the source of organic matter in ecosystems, while nitrogen isotope (δ15N) characteristics are mainly used to assess the anthropogenic emissions and nutrient structures of aquatic organisms [25,26,27]. However, previous studies have mostly focused on natural waters, such as large coastal bays, rivers, and lakes, and only few studies have focused on small artificial water bodies in medium-sized cities.
Based on the aforementioned factors, this study selected four typical urban water body in Shaoxing City, a medium-sized city of east China, as the research object. As a Chinese city with a long history of thousands of years, Shaoxing is well known for its water environment [9,10]. Its water body is the foundation of urban development and is a guarantee for the production and life of urban residents. With rapid urbanization, human and commercial activities are affected by factors such as aggregation and frequent eutrophication events have been reported in the urban water bodies of Shaoxing City. Four typical urban water bodies, namely artificial canals, artificial lakes, artificial ponds, and natural rivers, were selected, and the organic matter sources in urban water sediments were inferred by studying the water quality parameters, water chemical indicators, total organic carbon (TOC) contents, total organic nitrogen (TON) contents, and C/N ratios. Moreover, the δ13C and δ15N values of the sedimentary organic matter in these urban water bodies were investigated to determine the source composition of this organic matter and thereby identify the cause of water eutrophication. This study aims to investigate the water quality parameters and sediment carbon and nitrogen compositions across different types of urban water bodies. By analyzing these data, the study seek to identify the sources of carbon and nitrogen in various water bodies, providing new methodological insights into pollution source tracing in urban environments. Additionally, the findings of this study provide a useful reference for water eutrophication, water pollution source control, and water environment protection in small and medium cities.

2. Materials and Methods

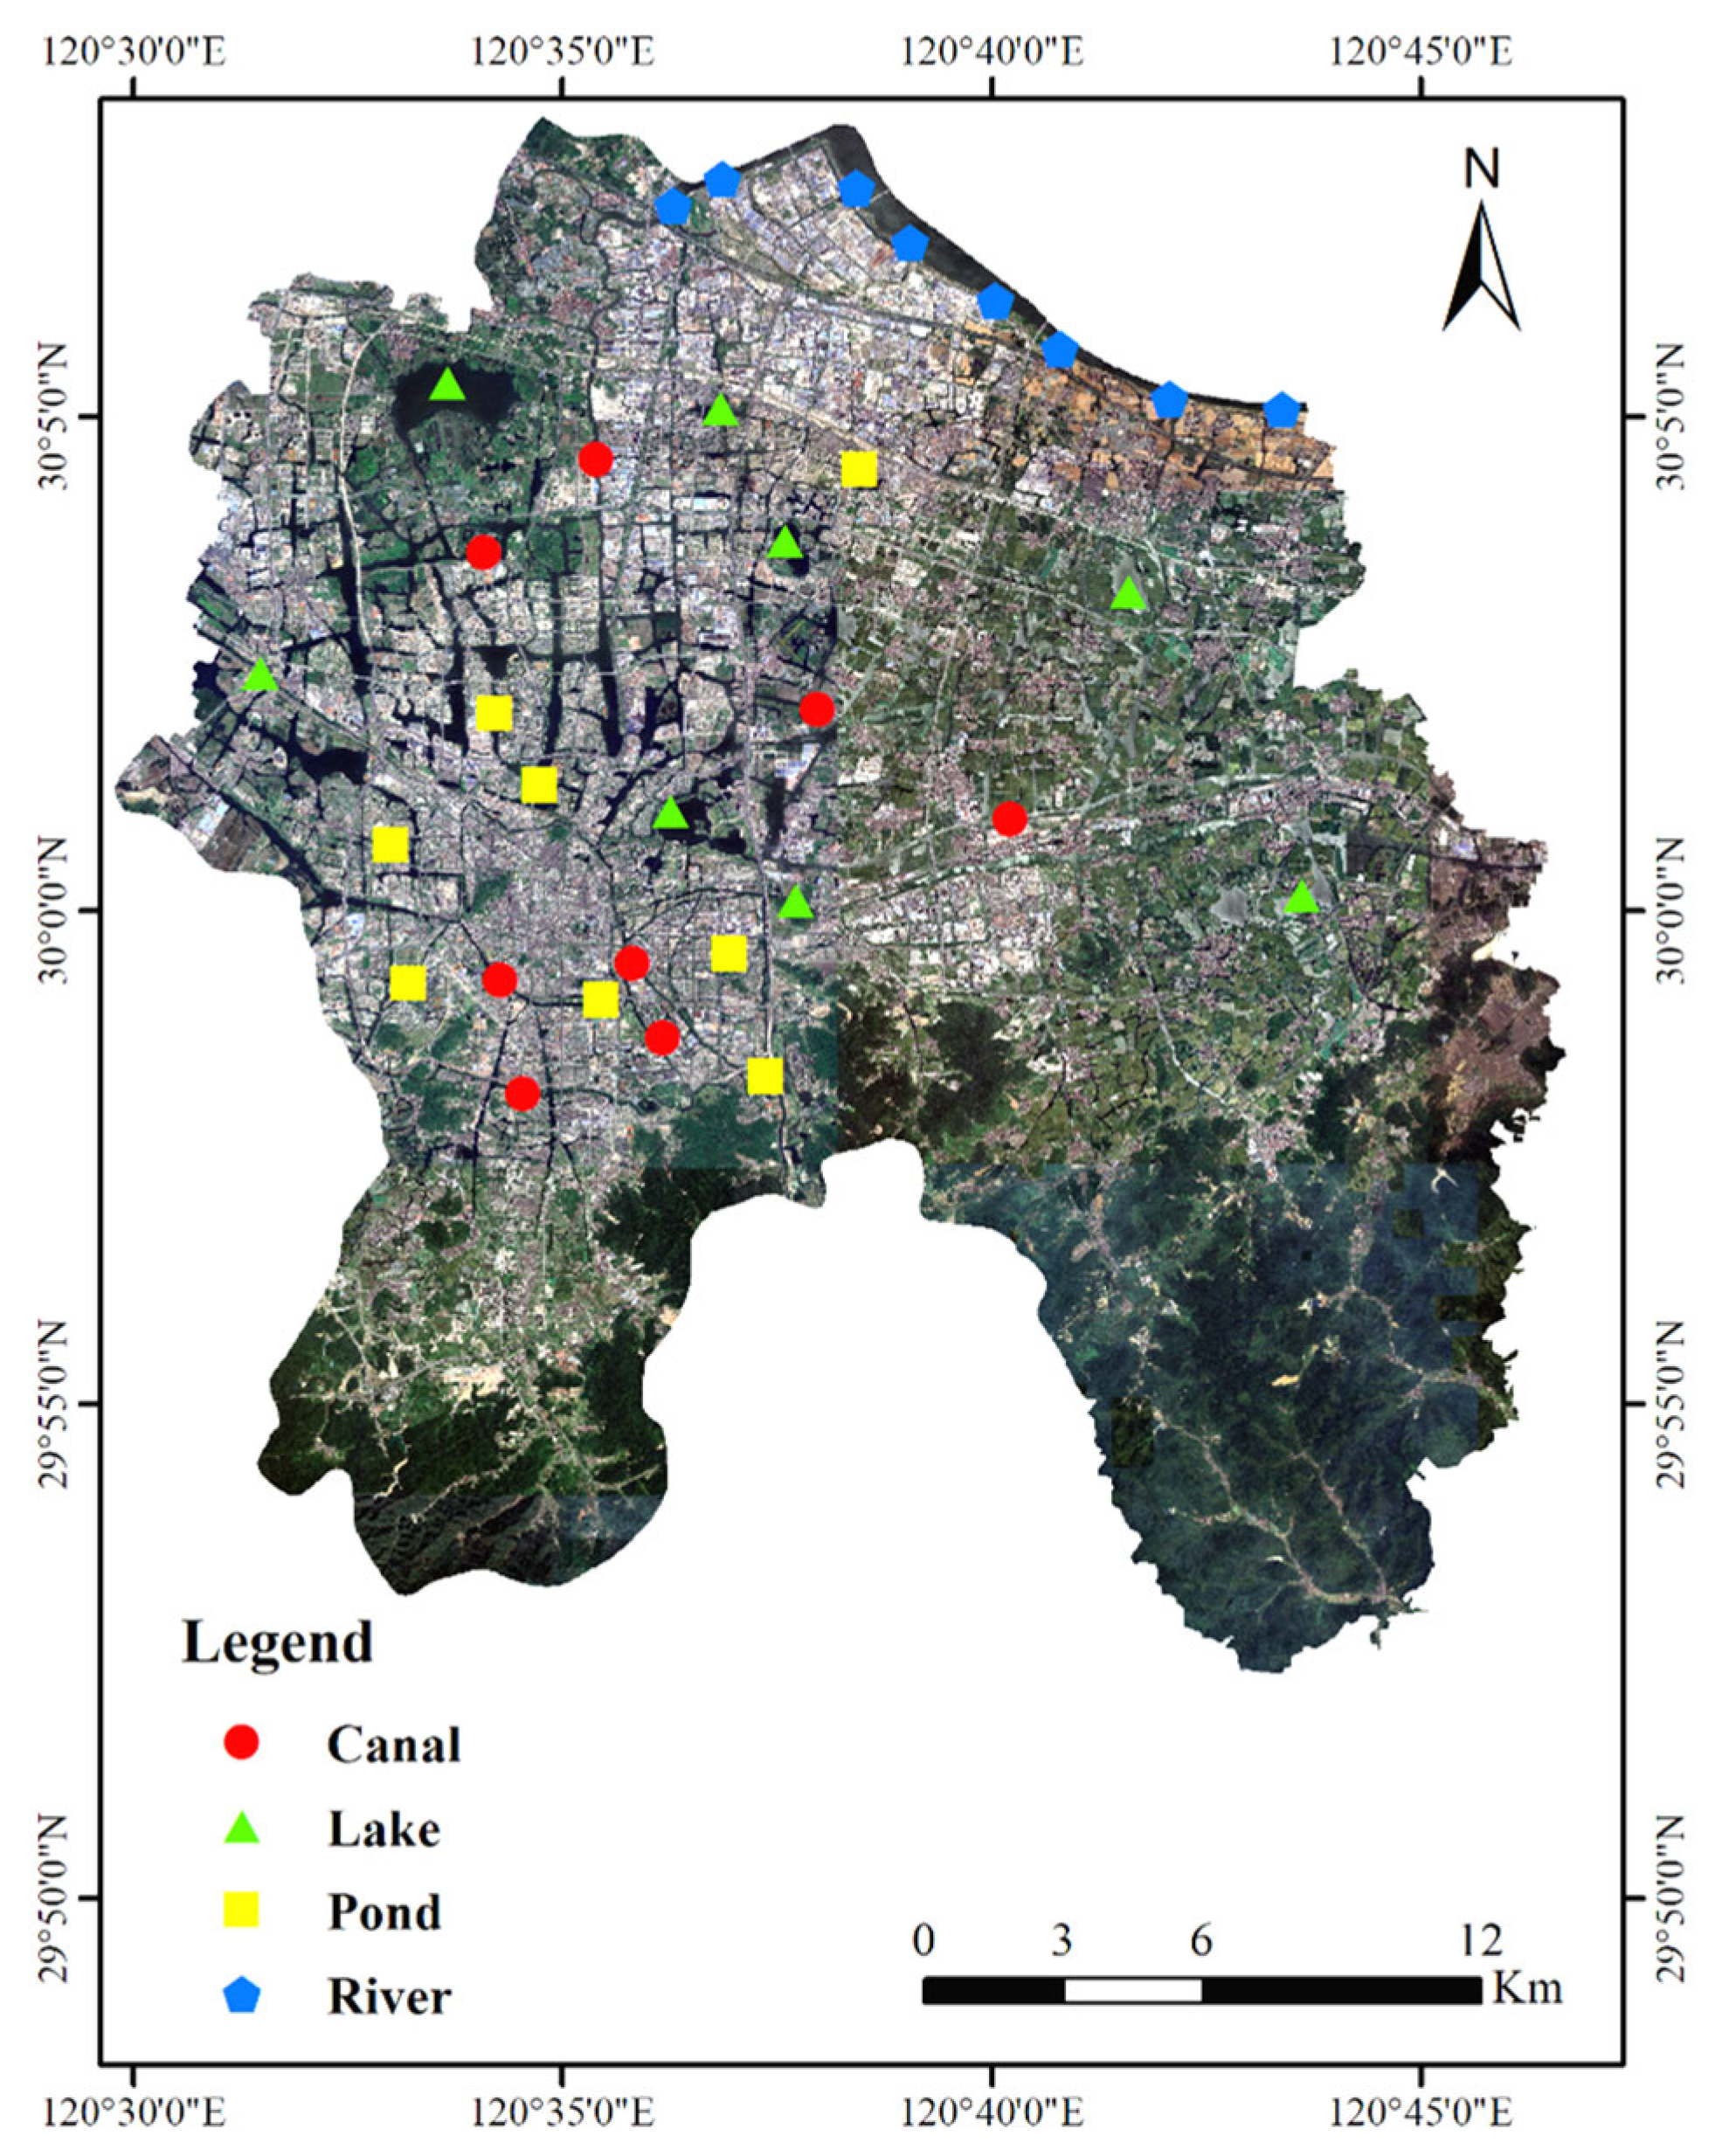
2.1. Study Area and Sample Collection

The study area is located in the Yuecheng district of Shaoxing City, Zhejiang Province, China (Figure 1). The site is located on the east coast of China and belongs to a subtropical monsoon climate zone with a mild, humid, and rainy climate. As a famous city with a history of >2500 years, Shaoxing is densely covered by rivers and lakes, and the history of canal construction is well known, both domestically and internationally. Shaoxing City has more than 30 rivers with >50 km2 drainage area and 23 lakes with >1 km2 water surface area. Shaoxing, a millennium-old city renowned for its waterways and often referred to as the “Venice of the East,” is notable for its unique concentration of different types of water bodies within a single urban area. Particularly, the ancient canals, which have been in existence for over a thousand years, serve as a testament to Shaoxing’s development and transformation as a water-centric city. From the perspective of population size and urban development scale, Shaoxing, as a prefecture-level city, represents an intermediate tier between major metropolitan areas and provincial capitals. Therefore, considering both its distinctive hydrological features and urban characteristics, Shaoxing City serves as a typical representative of medium-sized cities in eastern China.
Herein, 32 surface water samples from four typical urban water types (Canal, Lake, Pond, and River) were collected in 500 mL polyethylene plastic bottles. Sampling was conducted in June 2019, coinciding with the wet season in Shaoxing, when water levels across various urban water bodies were abundant. This period facilitated field sample collection and provided optimal conditions for analyzing multiple water quality parameters. The water quality parameters were measured on-site, and the remaining chemical indicators were quickly transported back to the laboratory for analysis. In total, 32 surface sediments were collected using a grab surface sediment collector. In each of the above sampling stations, the sediments at three parallel sampling points were selected to be uniformly mixed, representing the sampling station. The samples were returned immediately frozen at 20 °C and subjected to freeze-drying, then ground using a 200-mesh nylon mesh screen and stored in polyethylene plastic bags under sealed conditions for further experimental analysis.

2.2. Quality Analysis of the Four Typical Water Body Types

Basic water quality parameters such as pH, oxidation–reduction potential (ORP), electrical conductivity (EC), and total dissolved solid (TDS) content were measured on-site using a water quality multi-parameter analyzer (AP-2000). Total nitrogen (TN) and total dissolved nitrogen (TDN) contents were measured in unfiltered and filtered water samples, respectively. TN content, TDN content, NH4+–N, and NO3–N were determined using a continuous flow analyzer (Futura, French Alliance, Miribel, France). The permanganate index (CODMn) was determined using the acid potassium permanganate method, and Chl-a was determined using spectrophotometry. In addition, to further explore the main controlling factors of water quality parameters and chemical indicators of different types of water bodies, principal component analysis (PCA) was conducted on all parameters. In the PCA, the principal components were calculated based on the correlation coefficients matrix, with eigenvalues >1 being extracted. SPSS software 20 (SPSS Inc., Chicago, IL, USA) was used to analyze all the data.

2.3. C and N Content and Isotope Ratio Analysis of Sedimentary Organic Matter

The sediment sample (0.5 g) was transferred into a clean 15 mL polyethylene centrifuge tube, followed by the addition of 10 mL of 2.0 mol·L−1 KCl, shaking using a shaker, centrifugation, and supernatant removal. Following this, 10 mL of 1.0 mol·L−1 HCl was added to the centrifuge tube, followed by first sonication in an ultrasonic oscillator and oscillation in a regular oscillator. According to the different inorganic carbon removal requirements of the different samples, multiple acid washes were performed until no bubbles were observed upon adding the HCl solution to the sample. The following day, the centrifuge tube was placed in a centrifuge, and deionized water was used to replace the HCl solution. The above steps were repeated more than four times until the pH of the supernatant approached neutrality. Subsequently, the sample in the centrifuge tube was freeze-dried using a freeze dryer. After grinding, the sample was stored in a desiccator for subsequent analysis.
The TOC and TON contents were measured using an element analyzer (Flash EA2000, Thermo, Waltham, MA, USA). The organic isotopic carbon and nitrogen composition (δ13C and δ15N, respectively) of the sediments were measured using an elemental analyzer (Flash EA1112) and an isotopic mass spectrometer (MAT253) in combination [28]. The δ13C and δ15N were expressed as the differences between the isotopic ratios of a sample to the standard materials, and the error of instrumental analysis was <0.1‰.
δ13Csample = {(13C/12Csample)/(13C/12Cstandard) − 1} × 1000
δ15Nsample = {(15N/14Nsample)/(15N/14Nstandard) − 1} × 1000
where 13C/12Csample, 13C/12Cstandard, 15N/14Nsample, and 15N/14Nstandard are the C and N isotope ratios in the samples and standards, respectively. The standard substances for C and N isotope determination were Vienna PDB and atmospheric N2.
A three-end member model was used to calculate the relative contributions of terrestrial, phytoplankton, and sewage sources. The equations for the ternary mixing of δ13C, δ15N, and C/N ratios are as follows:
δ13Csample = f1 × δ13Cf1 + f2 × δ13Cf2 + f3 × δ13Cf3,
δ15Nsample = f1 × δ15Nf1 + f2 × δ15Nf2 + f3 × δ15Nf3,
C/Nsample = f1× C/Nf1 + f2 × C/Nf2 + f3 × C/Nf3,
f1 + f2 + f3 = 1
where the δ13C and C/N of the samples are used to analyze the source of C in sedimentary organic matter, and the δ15N and C/N of the samples are used to analyze the source of N in sedimentary organic matter. f1, f2, and f3 are their percentage contributions (%) to the total contents of C and N in sedimentary organic matter.

3. Results

3.1. Characteristics of the Basic Water Quality Parameters for Four Typical Water Bodies

The water quality parameters for the four urban water body types are shown in Table 1. All water types exhibited weak alkalinity, and the order of the average pH values was Lake (8.87) > Canal (8.84) > Pond (8.65) > River (8.47). Although the pH value difference between different water types was small, the pH value of natural water bodies was lower than that of artificial water bodies. The order of the average ORP values was River (185.94) > Pond (182.96) > Lake (167.78) > Canal (159.77). Thus, the order of the average ORP values exhibited a trend similar to that of the order of the average pH values. Moreover, the oxidation of natural water bodies was slightly stronger than that of artificial water bodies. Their order of the average DO values was Canal (8.83) > River (8.04) > Lake (7.41) > Pond (6.94); thus, artificial canals exhibited the highest DO value, 1.27 times that of ponds. The order of the average EC values of the four water bodies was Lake (224.59) > Pond (194.18) > Canal (174.05) > River (148.13). The conductivity of artificial lakes, a large relatively stationary water body, was the highest, 1.52 times that of fast-moving rivers. The order of the average TDS contents for the four water bodies was Lake (145.56) > Pond (125.75) > Canal (112.68) > River (95.83). The TDS values of relatively stationary water bodies were generally higher than those of relatively flowing water bodies, and the TDS value of lakes was 1.52 times that of rivers.

3.2. Characteristics of the Water Chemical Indicators for Four Typical Water Bodies

The water chemical indicators of the four urban water body types are shown in Table 2. Compared with the Surface Water Environmental Quality Standard (GB 3838-2002) [29] in China, the average TN contents in the four urban water bodies slightly exceeded the surface water Class-V water quality standard (2.0 mg/L). The average TN contents in Canal, Lake, Pond, and River were 1.29, 1.22, 1.23, and 1.23 times the Class-V water quality standards, respectively. In particular, the order of the average TD content in the four urban water bodies was Canal (2.58) > Pond (2.55) > River (2.46) > Lake (2.44). The variation trends of the TDN and TN contents in the four water bodies were considerably different. The order of the average TDN content in the four urban water bodies was Pond (2.46) > Canal (2.42) > Lake (2.31) > River (2.28). Further analysis of the NH4+–N and NO3–N contents in the water bodies showed that the NH4+–N content in the four water bodies was basically the same, with an average content of 0.07–0.10 mg/L. The NO3–N contents in Canal, Pond, and River exhibited small differences, with an average content of 1.76–1.81 mg/L. Moreover, the NO3–N content (1.64 mg/L) in Lake was slightly lower than that in the other three water bodies. The order of the average Chl-a content in the four water bodies was Canal (5.42) > Lake (4.35) > Pond (3.68) > River (3.37). Moreover, the order of average CODMn values in the four urban water bodies was Lake (3.47) > Canal (3.41) > Pond (3.29) > River (3.09). Thus, Pond and River exhibited a relatively low Chl-a content and CODMn value compared with the other two water bodies.

3.3. C and N Contents and Source Contributions of Sedimentary Organic Matter in Four Typical Water Bodies

All characteristics of the C and N contents of sedimentary organic matter of canals, lakes, ponds, and rivers are listed in Table 3. In general, the TON contents of sediment organic matter in the four water bodies exhibited minor differences, and the average TON content was 0.23–0.29%. However, the TON contents in lakes and rivers were slightly higher. The order of the average TOC content in the sediments of different types of water bodies was Lake (3.01) > River (2.52) > Pond (2.20) > Canal (2.00). The average TOC content in lake sediments was 1.51 times that in canals. Further analysis of the C/N ratio of the four types of water bodies revealed that the order of this ratio was Pond (8.90) > Lake (8.79) > River (8.30) > Canal (8.27). The maximum C/N ratio (10.90) was found in lakes, while the minimum C/N ratio (6.96) was found in canals.
By combining C/N ratios, δ13C, and δ15N values, the sedimentary organic matter sources in the four types of water bodies in urban areas can be qualitatively analyzed. Figure 2 shows the δ13C and δ15N results for the four types of water sediments. For δ13C values, the ranges for canals, lakes, ponds, and rivers are −25.15% to −28.70%, −25.15% to −28.70%, −22.47% to −27.96%, and −26.78% to −28.54%, respectively. For δ15N values, the ranges are 1.12–2.74%, 0.68–7.60%, 1.77%−5.76%, and 0.83–6.83%, respectively. In addition, to further analyze and calculate the carbon and nitrogen sources of sediment organic matter, the C/N ratios, δ13C, and δ15N values of phytoplankton, terrestrial, and sewage sources were determined. The average C/N ratios, δ13C, and δ15N values of phytoplankton/terrestrial/sewage sources are 7.01%/10.76%/15.25%, −27.29%/−23.33%/−22.06%, and 9.46%/3.43%/7.05%, respectively. The C/N ratios, δ13C, and δ15N values of the different end members differ significantly, indicating three typical sources of water pollution, which provides a reliable theoretical basis for the source analysis of sediment organic matter.
Using the δ13C and δ15N values of the end elements in the isotope ternary mixing model, the relative contributions of potential sources of sedimentary organic matter in the four urban water bodies were quantitatively calculated (Figure 3). The contributions of phytoplankton sources of organic matter to the four types of water bodies have the order of River (90.11%) > Canal (86.08%) > Lake (53.22%) > Pond (46.15%). Terrestrial sources of organic matter are mainly found in lakes (34.18%) and ponds (44.60%), but contribute minimally to canals and rivers. Notably, the contributions of sewage source organic matter to the four types of water bodies have the order of River (32.32%) > Canal (27.31%) > Lake (12.60%) > Pond (9.25%). In general, the contribution of phytoplankton and sewage sources to the sediments of rivers and canals is greater than that of terrestrial sources, while the contribution of terrestrial sources to the sediments of lakes and ponds is greater that of phytoplankton and sewage sources.

4. Discussion

Water quality is a key indicator of the health of aquatic ecosystems and is influenced by various natural and anthropogenic factors. The pH values for all water bodies range from slightly alkaline to neutral. Canals exhibit the broadest range (7.45–9.96), indicating a more variable environment, possibly due to agricultural runoff or industrial discharge. Lakes and ponds have similar pH ranges, with lakes showing a slightly higher mean pH (8.87) than ponds (8.65). Rivers have the narrowest pH range (7.82–9.72), suggesting a more stable environment. ORP indicates the tendency of water to gain or lose electrons and is a measure of water’s ability to act as an oxidizing or reducing agent [30]. Canals have the highest mean ORP (159.77), suggesting a more oxidizing environment, attributable to higher organic matter decomposition. Ponds have the widest range (73.66–214.26) and the highest variability in ORP, indicating a more dynamic redox state. Obviously, DO is essential for the survival of aquatic life. Canals have the highest mean DO (8.83 mg/L), which is beneficial for aquatic organisms. Meanwhile, ponds have the lowest mean DO (6.94 mg/L), attributable to higher biological oxygen demand from increased organic matter [31]. The wide DO range for rivers (2.84–13.29 mg/L) suggests significant spatial and temporal variability, consistent with rivers having the strongest flow characteristics among the four types of water bodies. EC measures the ability of water to conduct electricity and is influenced by the presence of ions. Lakes have the highest mean EC (224.59 uS/cm), indicating a higher concentration of dissolved ions. Rivers have the lowest mean EC (148.13 uS/cm), suggesting a lower ionic content, attributable to more frequent water exchange. TDS is a measure of the total amount of dissolved substances in water. Lakes have the highest mean TDS (145.56 mg/L), consistent with their high EC. Rivers have the lowest mean TDS (95.83 mg/L), consistent with their low EC, indicating less dissolved material.
Water chemical indicators reveal several key characteristics that distinguish these environments in terms of their nutrient content and biological productivity. The TN levels were relatively consistent among the four types of water bodies, with mean values ranging from 2.44 to 2.58 mg/L. This suggests a similar level of nitrogen input or availability across different aquatic ecosystems. The average TN contents in the four types of water bodies exceeding the surface water Class-V water quality standard (2.0 mg/L) in China showed that these bodies totally exhibited nitrogen pollution. However, there is a notable variation in TDN, which was highest in ponds (mean = 2.46 mg/L), indicating higher organic matter decomposition rates or runoff inputs in ponds [32]. NH4+–N contents were generally low across all samples, with means ranging from 0.07 to 0.10 mg/L, indicating efficient ammonification processes or rapid uptake by microorganisms within water bodies. Meanwhile, NO3–N levels varied more significantly, with the highest mean content observed in canals (1.81 mg/L). This may reflect a greater anthropogenic influence on riverine systems through agricultural runoff or sewage discharge [33,34]. Chl-a contents serve as an indicator of algal biomass and primary productivity. Rivers exhibited the lowest Chl-a levels (mean = 3.37 ug/L), whereas canals exhibited the highest (mean = 5.42 ug/L). This pattern is attributable to differences in light penetration, nutrient availability, and grazing pressure between these habitats [35]. CODMn provides insights into the amount of oxygen required to oxidize organic matter present in water. Lakes showed the highest CODMn values (mean = 3.47 mg/L), suggesting a higher organic pollutant load than in other water bodies. Canals also displayed elevated CODMn levels (mean = 3.41 mg/L), attributable to urban and industrial discharges [36].
The PCA analysis elucidates distinct water quality patterns across Canal, Lake, Pond, and River ecosystems (Figure 4). Specifically, PC1 and PC2 together captured more than 85% of the data variations, respectively highlighting the influence of external inputs (such as nutrients and pollutants) and internal dynamics (such as biological activity and natural circulation) on the water quality characteristics of different types of water bodies. In canals, ORP, EC, TDS, NH4, pH, DO, COD, and Chl-a are positively associated with PC1, indicating a strong oxidative environment with high conductivity, and a potential for nutrient enrichment and algal growth. Lakes exhibit a similar pattern, with ORP, EC, TDS, NH4, and Chl-a being positively correlated with PC1, suggesting oxidative conditions and nutrient-rich environments, while DO and pH negatively correlate with PC2, indicating lower oxygen levels and acidity. Ponds show a unique profile with ORP and TDN positively linked to PC1, reflecting oxidative conditions and high dissolved nitrogen, while NH4, EC, TDS, DO and pH negatively correlate with PC2, suggesting nutrient-rich conditions with lower oxygen and higher acidity. Rivers display a distinct pattern with EC and TDS positively correlated with PC1, indicating high conductivity and dissolved solids, while ORP, TN, TDN, NO3, NH4, Chl-a, DO, and pH show varying correlations across PCs, highlighting diverse environmental conditions and potential nutrient dynamics. These insights further underscore the complexity and heterogeneity of water quality across different aquatic ecosystems.
The composition and sources of organic matter in aquatic sediments are critical for understanding nutrient cycling, ecosystem productivity, and the impact of anthropogenic activities on water bodies [37]. Canal sediments have the lowest mean TON and TOC values, suggesting a low input of organic matter or efficient decomposition processes. Meanwhile, lake sediments have the highest mean TON and TOC values, indicating a high input of organic matter, potentially from both internal and external sources. The high TOC in lakes may also reflect the high input of terrestrial organic matter due to high connectivity with terrestrial ecosystems [38]. The C/N ratio is also a valuable indicator of the sources and diagenetic history of organic matter. Canal sediments have the lowest mean C/N ratio, suggesting a high proportion of nitrogen-rich organic matter, possibly from sewage or agricultural runoff sources. Pond sediments have the highest mean C/N ratio, indicating a high proportion of carbon-rich organic matter, attributable to inputs from vascular plants or a lower degree of decomposition.
Furthermore, the sources of sedimentary organic matter in four urban water bodies were evaluated using the C/N ratios and δ13C and δ15N values. According to previous studies [24,39], phytoplankton use airborne CO2 containing 12C for photosynthesis, and their δ13C values are generally more negative than those of other organic matter sources such as aquatic plants. In addition, when C/N ≤ 10, phytoplankton can be considered a source of deposited organic matter [40]. In this study, the δ13C value of the sedimentary organic matter of the four urban water bodies was relatively negative, among which the δ13C value of Canal was the most negative (−28.70%), and the C/N value of the sedimentary organic matter was <10. Therefore, C/N-integrated δ13C values can explain why phytoplankton is one of the three sources of sedimentary organic matter in urban water bodies. The growth of phytoplankton (algae) in water is caused by sewage with a high nutrient load [41]. Notably, Canal and Pond are relatively less subjected to exogenous interference, but the analysis of the δ15N value of the sedimentary organic matter shows that terrigenous organic matter is the main source of sedimentary organic matter in Canal and Pond, including soil organic matter and terrestrial plant debris. In addition, large values of δ13C (−22.47%) and δ15N (5.76%) of sedimentary organic matter were found in the urban ponds, which indicates that some ponds in urban areas may be subject to sewage input. This analysis shows that part of the source contribution of sediment organic matter in urban ponds is mainly sewage source organic matter. The δ13C and δ15N ranges of Lake and River sediments in urban areas are similar, and the δ15N ranges are widely distributed. This shows that the sources of organic matter in Lake and River sediments in urban areas are relatively complex. The relatively high δ13C value, medium C/N value, and low δ15N value of sedimentary organic matter in Lake and River indicate that sedimentary organic matter is primarily influenced by submerged water and phytoplankton [19]. Shaoxing City has a subtropical monsoon climate characterized by four distinct seasons and abundant rainfall. Soil organic matter and terrestrial plants around water bodies are easily affected by rainfall and enter water bodies through leaching or runoff, thus affecting changes in sedimentary organic matter in water bodies. Indeed, carbon and nitrogen isotope analysis methods (δ13C and δ15N) can underrepresent or misidentify sources due to overlapping signatures. Especially, in urban environments, multiple organic matter sources, such as sewage, terrestrial runoff, and phytoplankton, often exhibit similar isotopic compositions, complicating accurate differentiation. Moreover, environmental factors like temperature and pH can influence isotope fractionation, further obscuring source signals. Therefore, to enhance the precision of carbon and nitrogen source apportionment in future studies, it is recommended that stable isotope analysis be complemented with additional tracers such as heavy metals or polycyclic aromatic hydrocarbons (PAHs) [42]. This integrated approach can provide more robust source identification. Furthermore, the application of Bayesian mixing models can help quantify the relative contributions of different sources, even when isotopic signatures overlap, thereby reducing uncertainties in the source apportionment process [43,44,45].
In summary, the aforementioned comparative analysis highlights the unique characteristics of each water body type based on their quality and chemical properties. Understanding these variations is crucial for effective environmental management and conservation efforts tailored for specific aquatic ecosystems. Furthermore, using C/N ratio, δ13C and δ15N values to identify the sources of organic matter in urban water sediments has certain practical value and importance. According to different sources of water pollution, this study suggests that water bodies with numerous phytoplanktons and aquatic plants should be regularly recovered, water and soil conservation should be conducted around the water bodies, and the input of terrestrial organic matter (soil organic matter and terrestrial plant litter) into the water bodies should be controlled as much as possible in Shaoxing City. Sewage treatment should strictly adhere to local standards, ensuring discharge only after compliance with these regulations. This study highlights phytoplankton and sewage as key sources of organic carbon and nitrogen in urban water bodies. To mitigate eutrophication, the recommend policies about Shaoxing City for monitoring nutrient inputs, stricter effluent regulations, and best practices for fertilizer use. Improved wastewater treatment technologies and public education can reduce household chemical pollution. Integrating green infrastructure like constructed wetlands and permeable pavements into urban planning can manage stormwater runoff. Restoring aquatic ecosystems with native vegetation enhances biodiversity and water self-purification.

5. Conclusions

The water quality parameters, chemical indicators, and surface sediment productivity distribution of four typical urban water body types (Canal, Pond, Lake, and River) in Shaoxing City were qualitatively and quantitatively analyzed using the C/N ratio and δ13C and δ15N values. The key results are summarized as follows:
(1)
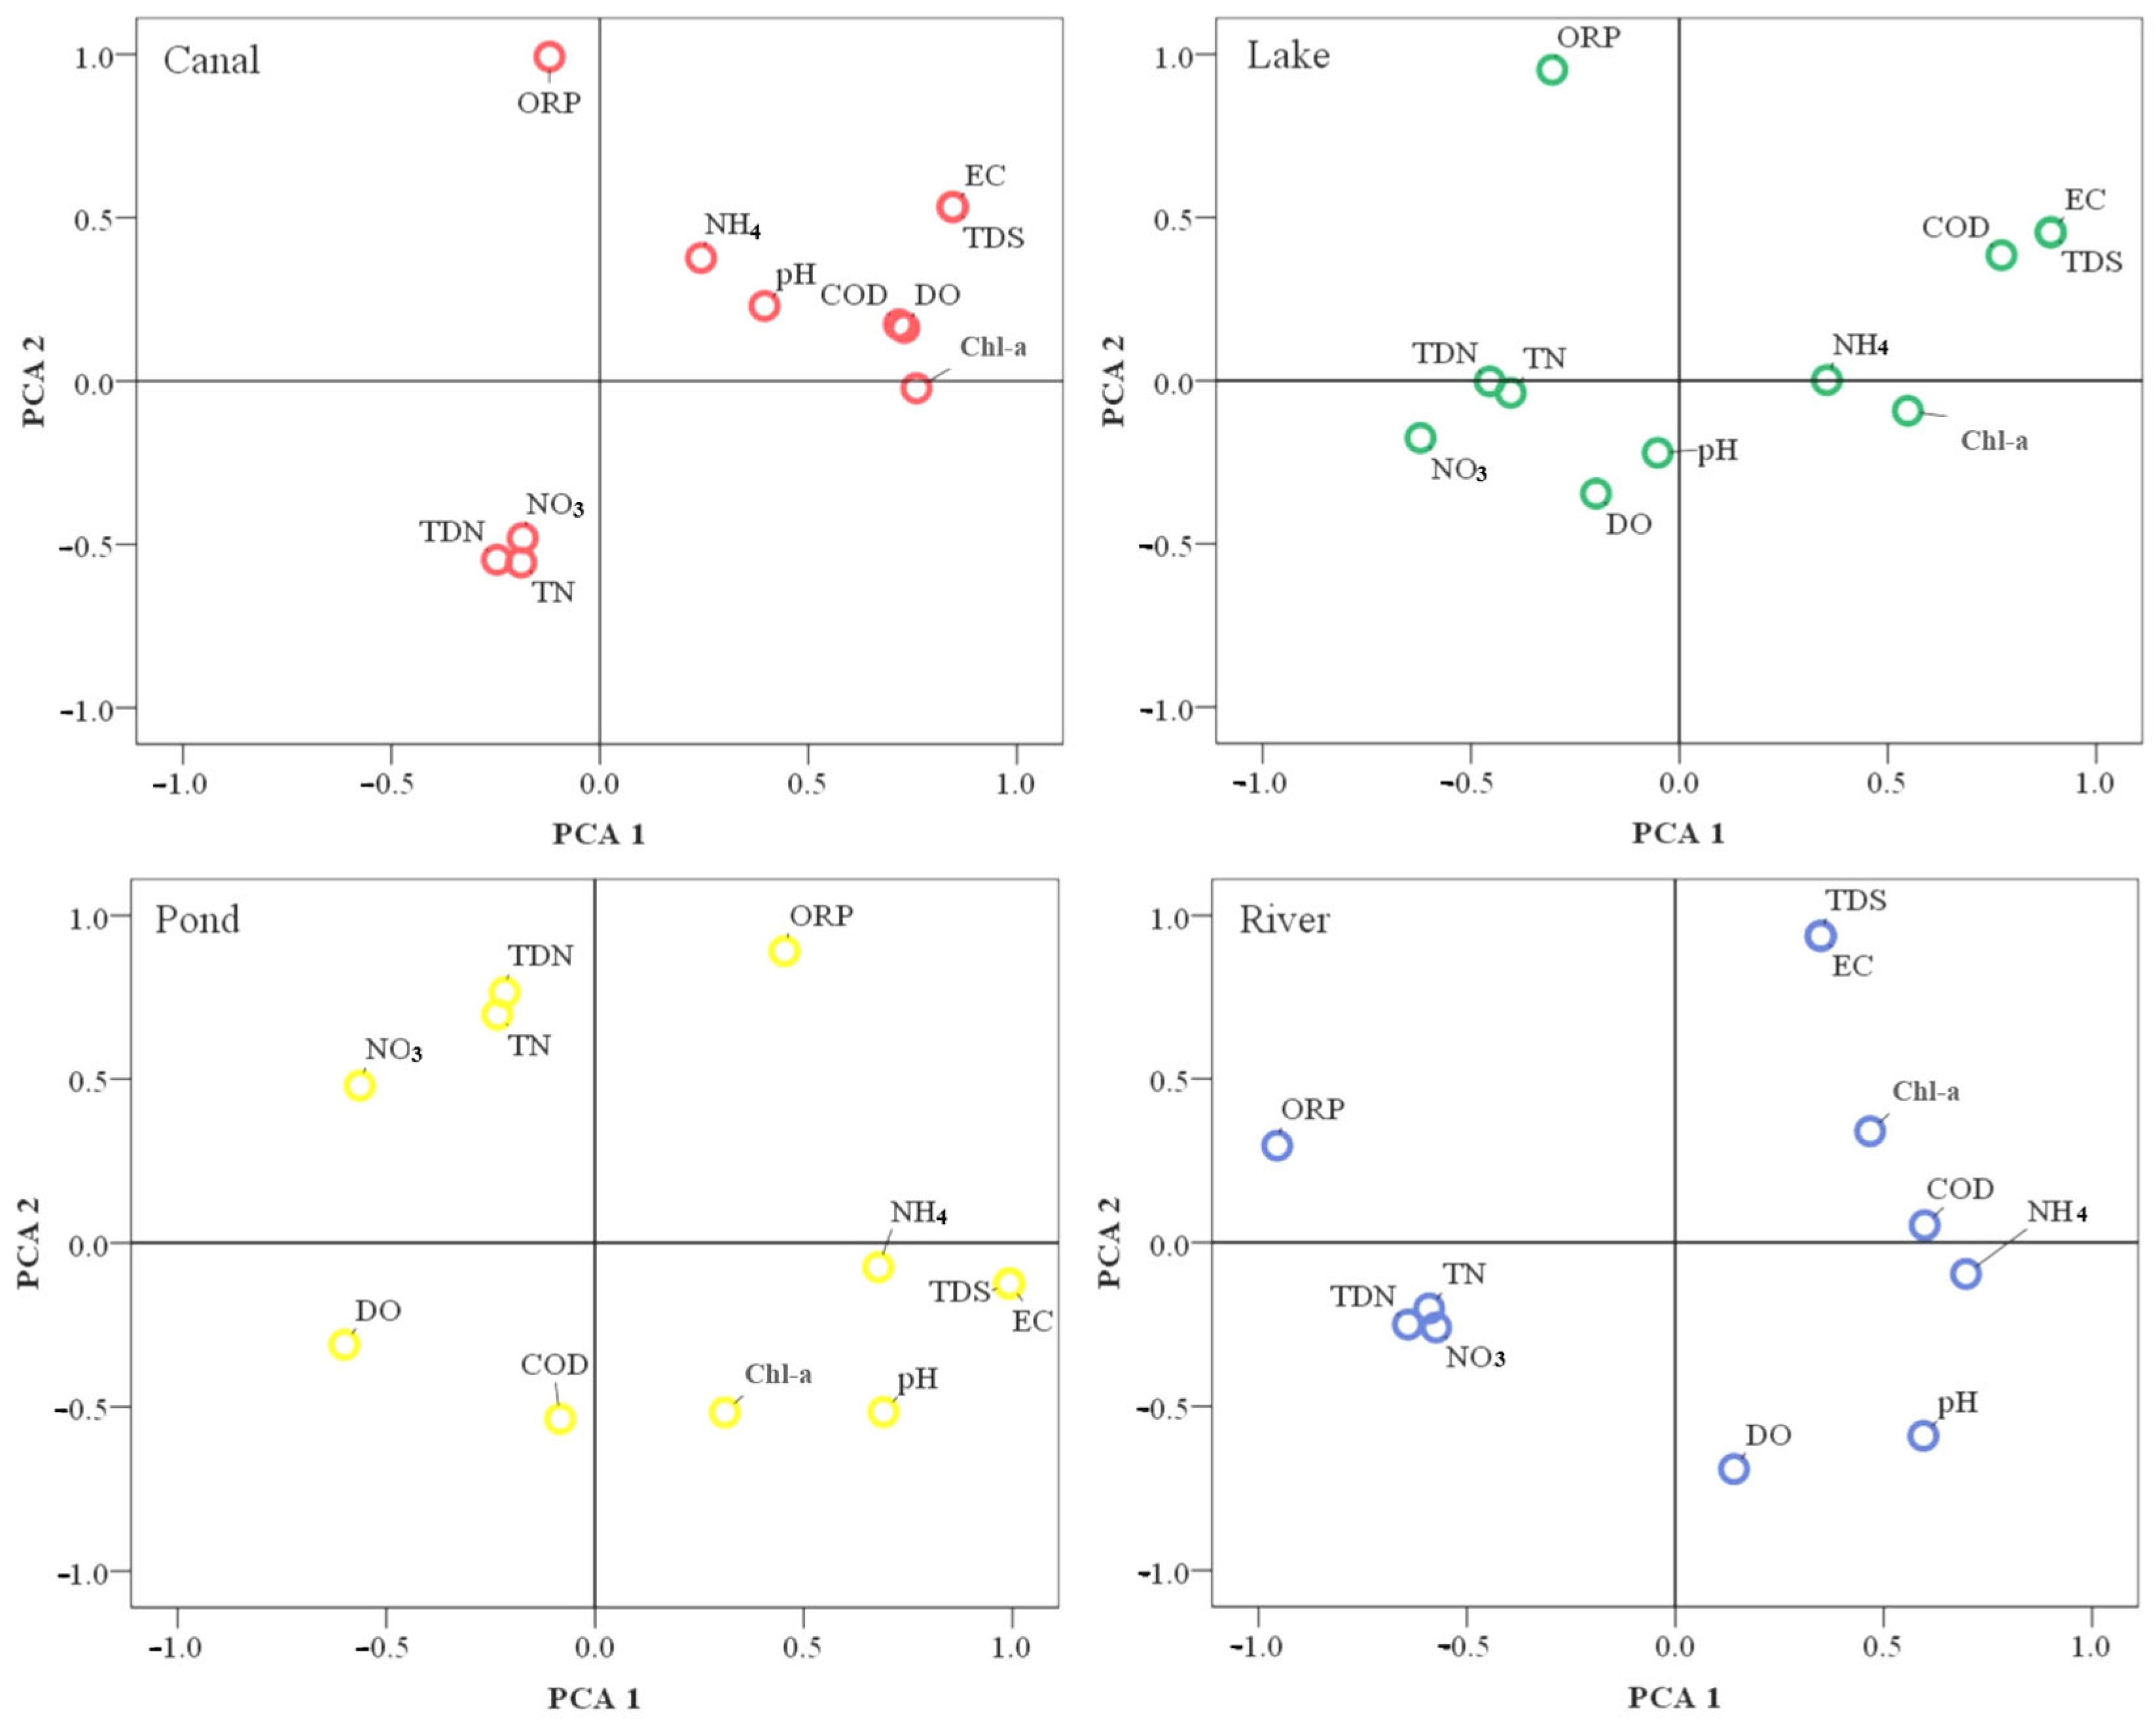
Urban water bodies exhibit subtle differences in water quality parameters. Artificial water bodies, particularly canals and lakes, exhibit higher DO and EC contents than natural water bodies. Canals have the highest DO contents, while lakes have the highest EC and TDS contents (1.52 times higher than those in rivers). Natural water bodies have a slightly stronger ORP and lower pH values than artificial water bodies. Overall, stationary water bodies, such as lakes and ponds, tend to have higher TDS and EC than flowing water bodies, such as rivers and canals.
(2)
All four urban water body types slightly exceed China’s Class-V water quality standard for TN, with Canal, Lake, Pond, and River averaging 1.29, 1.22, 1.23, and 1.23 times the standard, respectively. TD and TDN values vary significantly among the water bodies, with ponds showing the highest TDN. NH4+–N and NO3–N levels are relatively consistent across all water bodies, except for the slightly lower NO3–N of Lake. Chl-a and CODMn values indicate higher organic matter in Canal and Lake and lower organic matter in Pond and River, suggesting less eutrophication. These findings highlight the need for targeted water management strategies.
(3)
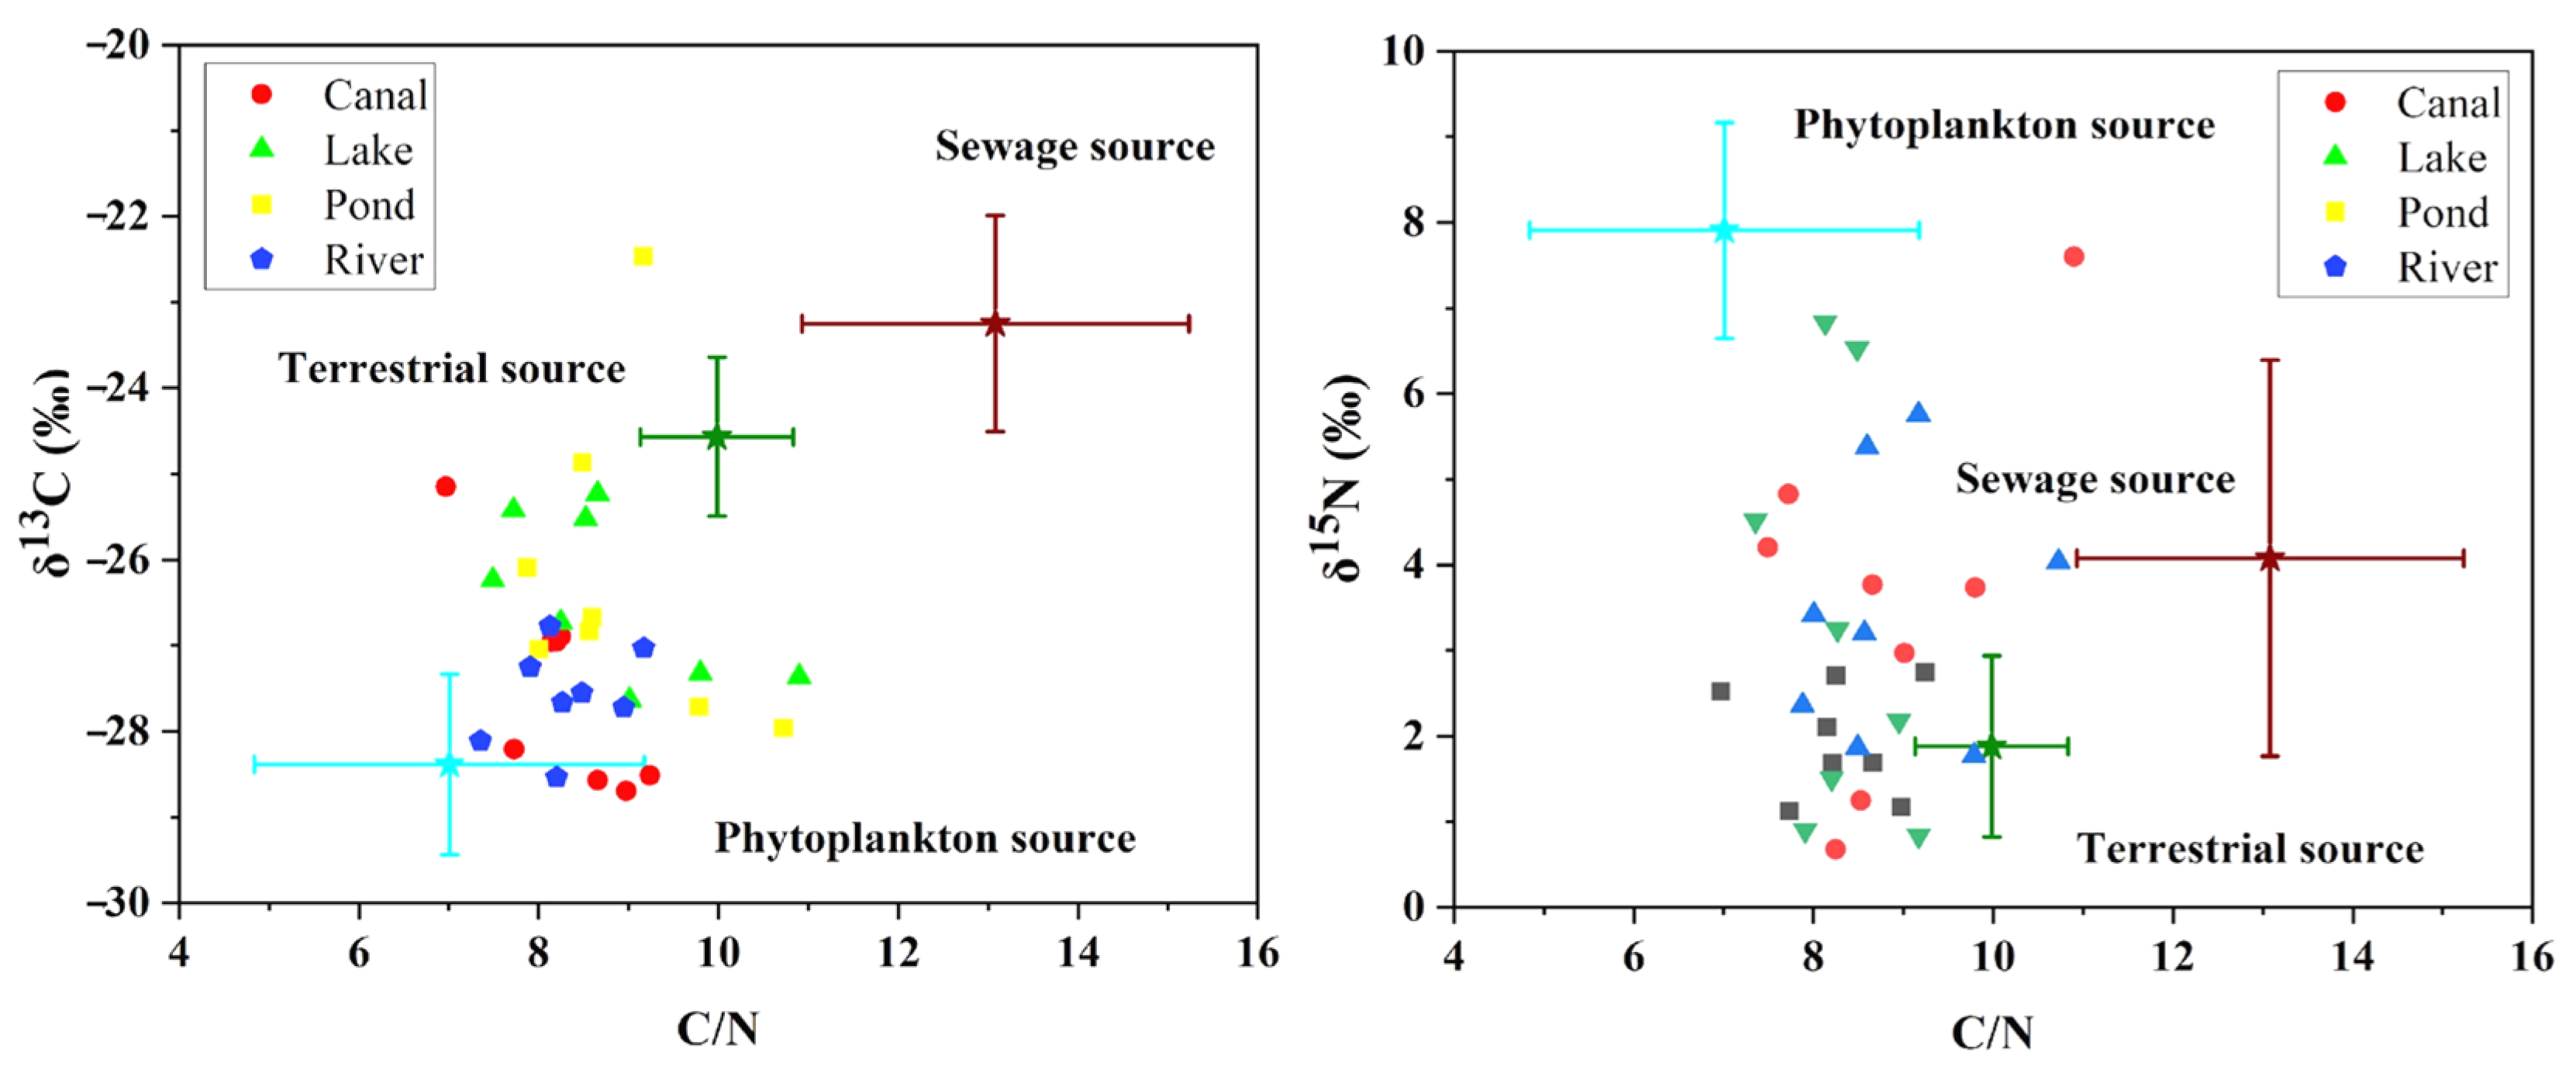
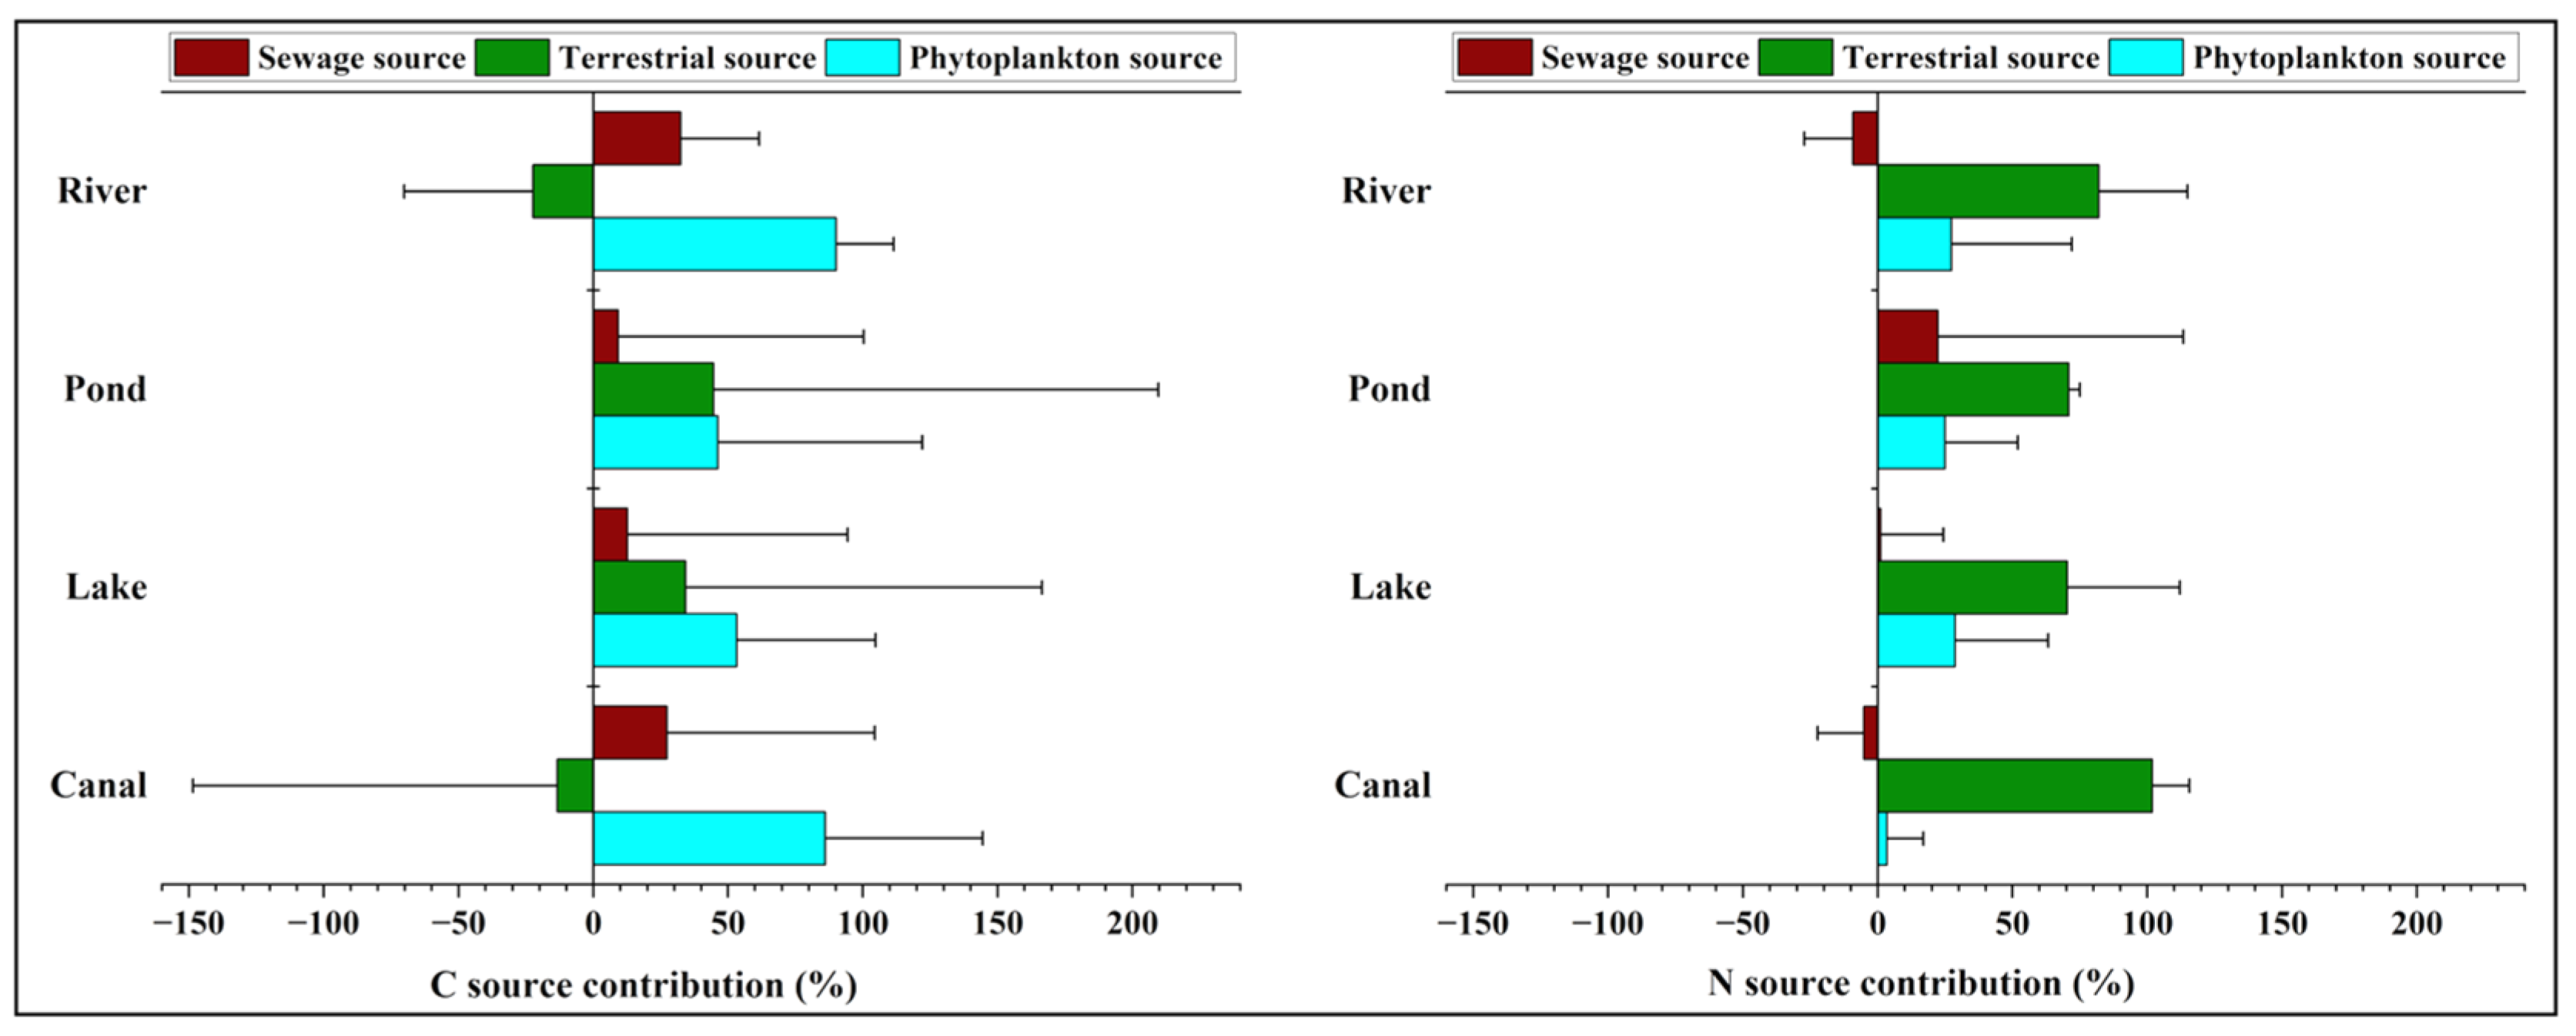
TON content in sediments is relatively uniform across all water bodies, with lakes and rivers showing slightly higher values. TOC content is highest in lakes, 1.51 times that of canals. C/N ratios vary, with ponds and lakes having the highest averages. Source quantification using isotopic analysis (δ13C and δ15N values) reveal distinct sources of organic matter: phytoplankton sources dominate in rivers and canals, whereas terrestrial sources dominate in lakes and ponds. Sewage sources contribute considerably to rivers and canals. This study underscores the importance of phytoplankton and sewage as organic matter sources in urban water bodies, highlighting the need for targeted pollution control strategies in the urban water environment.

Author Contributions

S.X.: writing—original draft, conceptualization, investigation, writing—review and editing; S.Y.: conceptualization, data curation; Y.D.: investigation, writing—review and editing; H.X., Y.Z. and S.L.: investigation and methodology, H.Z. and F.Y.: investigation and project administration; C.W.: funding acquisition and resources. All authors have read and agreed to the published version of the manuscript.

Funding

This study was financially supported by the Guangdong Basic and Applied Basic Research Foundation (Grant No. 2022A1515110930, 2022A1515110718, 2022A1515110325), Open Foundation of State Key Laboratory of Environmental Criteria and Risk Assessment, Chinese Research Academy of Environmental Sciences (No. SKLECRA2022OFP04), National Natural Science Foundation of China (Grant No. 42407288, 42307288), and the Laboratory of Lingnan Modern Agriculture Project (NZ2021026).

Institutional Review Board Statement

Not applicable.

Informed Consent Statement

Not applicable.

Data Availability Statement

The data presented in this study are available on request from the corresponding author due to privacy.

Acknowledgments

The authors would like to thank the anonymous reviewers for their comments and suggestions, which contributed to the further improvement of this paper.

Conflicts of Interest

The authors declare that they have no conflicts of interest.

References

  1. Anderson, N.J.; Dietz, R.D.; Engstrom, D.R. Land-use change, not climate, controls organic carbon burial in lakes. Proc. R. Soc. B 2013, 280, 20131278. [Google Scholar] [CrossRef] [PubMed]
  2. Yu, H.; Song, Y.; Chang, X.; Gao, H.; Peng, J. A scheme for a sustainable urban water environmental system during the urbanization process in China. Engineering 2018, 4, 190–193. [Google Scholar] [CrossRef]
  3. Nwokediegwu, Z.Q.S.; Ugwuanyi, E.D.; Dada, M.A.; Majemite, M.T.; Obaigbena, A. Urban water management: A review of sustainable practices in the USA. Eng. Sci. Technol. J. 2024, 5, 517–530. [Google Scholar] [CrossRef]
  4. Paerl, H.W.; Hall, N.S.; Calandrino, E.S. Controlling harmful cyanobacterial blooms in a world experiencing anthropogenic and climatic-induced change. Sci. Total Environ. 2011, 409, 1739–1745. [Google Scholar] [CrossRef]
  5. Jenny, J.P.; Normandeau, A.; Francus, P.; Taranu, Z.E.; Gregory-Eaves, I.; Lapointe, F.; Jautzy, J.; Ojala, A.E.K.; Dorioz, J.M.; Schimmelmann, A.; et al. Urban point sources of nutrients were the leading cause for the historical spread of hypoxia across European lakes. Proc. Natl. Acad. Sci. USA 2016, 113, 12655–12660. [Google Scholar] [CrossRef]
  6. Oliver, S.; Corburn, J.; Ribeiro, H. Challenges regarding water quality of eutrophic reservoirs in urban landscapes: A mapping literature review. Int. J. Environ. Res. Public Health 2018, 16, 40. [Google Scholar] [CrossRef]
  7. Zhang, Y.; Su, Y.; Liu, Z.; Yu, J.; Jin, M. Lipid biomarker evidence for determining the origin and distribution of organic matter in surface sediments of Lake Taihu, Eastern China. Ecol. Indic. 2017, 77, 397–408. [Google Scholar] [CrossRef]
  8. Liu, J.; Shen, Z.; Yan, T.; Yang, Y. Source identification and impact of landscape pattern on riverine nitrogen pollution in a typical urbanized watershed, Beijing, China. Sci. Total Environ. 2018, 628–629, 1296–1307. [Google Scholar] [CrossRef]
  9. Zhou, J.; Hu, M.; Liu, M.; Yuan, J.; Ni, M.; Zhou, Z.; Chen, D. Combining the multivariate statistics and dual stable isotopes methods for nitrogen source identification in coastal rivers of Hangzhou Bay, China. Environ. Sci. Pollut. Res. Int. 2022, 29, 82903–82916. [Google Scholar] [CrossRef]
  10. Zhou, S.; Chen, F.; Xu, Z. Evaluating the accessibility of urban parks and waterfronts through online map services: A case study of Shaoxing, China. Urban For. Urban Green. 2022, 77, 127731. [Google Scholar] [CrossRef]
  11. Krull, E.; Haynes, D.; Lamontagne, S.; Gell, P.; McKirdy, D.; Hancock, G.; McGowan, J.; Smernik, R. Changes in the chemistry of sedimentary organic matter within the Coorong over space and time. Biogeochemistry 2009, 92, 9–25. [Google Scholar] [CrossRef]
  12. Torres, I.C.; Inglett, P.W.; Brenner, M.; Kenney, W.F.; Ramesh Reddy, K. Stable isotope (δ13C and δ15N) values of sediment organic matter in subtropical lakes of different trophic status. J. Paleolimnol. 2012, 47, 693–706. [Google Scholar] [CrossRef]
  13. Chen, X.; Feng, M.; Ke, F.; Pan, J.; Fan, F.; Wang, Y.; Li, W. Source and biogeochemical distribution of organic matter in surface sediment in the deep oligotrophic Lake Fuxian, China. Aquat. Geochem. 2018, 24, 55–77. [Google Scholar] [CrossRef]
  14. Akhtar, N.; Syakir Ishak, M.I.; Bhawani, S.A.; Umar, K. Various natural and anthropogenic factors responsible for water quality degradation: A review. Water 2021, 13, 2660. [Google Scholar] [CrossRef]
  15. Xu, H.; Gao, Q.; Yuan, B. Analysis and identification of pollution sources of comprehensive river water quality: Evidence from two river basins in China. Ecol. Indic. 2022, 135, 108561. [Google Scholar] [CrossRef]
  16. Joshi, S.R.; Kukkadapu, R.K.; Burdige, D.J.; Bowden, M.E.; Sparks, D.L.; Jaisi, D.P. Organic matter remineralization predominates phosphorus cycling in the mid-bay sediments in the Chesapeake Bay. Environ. Sci. Technol. 2015, 49, 5887–5896. [Google Scholar] [CrossRef]
  17. Yan, D.; An, Z.; Capo, E. Organic matter content and source is associated with the depth-dependent distribution of prokaryotes in lake sediments. Freshw. Biol. 2024, 69, 496–508. [Google Scholar] [CrossRef]
  18. Derrien, M.; Yang, L.; Hur, J. Lipid biomarkers and spectroscopic indices for identifying organic matter sources in aquatic environments: A review. Water Res. 2017, 112, 58–71. [Google Scholar] [CrossRef]
  19. Li, Z.; Xu, X.; Ji, M.; Wang, G.; Han, R.; Ma, J.; Yan, X.; Liu, J. Estimating sedimentary organic matter sources by multi-combined proxies for spatial heterogeneity in a large and shallow eutrophic lake. J. Environ. Manag. 2018, 224, 147–155. [Google Scholar] [CrossRef]
  20. Gao, H.; Fan, Y.; Wang, G.; Li, L.; Zhang, R.; Li, S.; Wang, L.; Jiang, Z.; Zhang, Z.; Wu, J.; et al. The sources of sedimentary organic matter traced by carbon and nitrogen isotopes and environmental effects during the past 60 years in a shallow steppe lake in Northern China. Water 2023, 15, 2224. [Google Scholar] [CrossRef]
  21. Bergamino, L.; Dalu, T.; Richoux, N.B. Evidence of spatial and temporal changes in sources of organic matter in estuarine sediments: Stable isotope and fatty acid analyses. Hydrobiologia 2014, 732, 133–145. [Google Scholar] [CrossRef]
  22. Li, R.; Liang, Z.; Hou, L.; Zhang, D.; Wu, Q.; Chen, J.; Gao, L. Revealing the impacts of human activity on the aquatic environment of the Pearl River Estuary, South China, based on sedimentary nutrient records. J. Clean. Prod. 2023, 385, 135749. [Google Scholar] [CrossRef]
  23. Xiao, H.; Mao, C.; Wang, S.; Jia, Z.; Rao, W. Seasonal variation and provenance of organic matter in the surface sediments of the three gorges reservoir: Stable isotope analysis and implications for agricultural management. Sci. Total Environ. 2023, 870, 161886. [Google Scholar] [CrossRef] [PubMed]
  24. Soldatova, E.; Krasilnikov, S.; Kuzyakov, Y. Soil organic matter turnover: Global implications from δ13C and δ15N signatures. Sci. Total Environ. 2024, 912, 169423. [Google Scholar] [CrossRef]
  25. Carneiro, L.M.; do Rosário Zucchi, M.; de Jesus, T.B.; da Silva Júnior, J.B.; Hadlich, G.M. δ13C, δ15N and TOC/TN as indicators of the origin of organic matter in sediment samples from the estuary of a tropical river. Mar. Pollut. Bull. 2021, 172, 112857. [Google Scholar] [CrossRef]
  26. Zhao, R.; Dong, X.; Liu, Q.; Xu, M.; Zhao, Y. Distribution, sources and influencing factors of organic carbon in the surface sediments of the coastal tidal flats in Jiangsu Province. Front. Mar. Sci. 2023, 10, 1220923. [Google Scholar] [CrossRef]
  27. Zhang, J.; Hao, Q.; Li, Q.; Zhao, X.; Fu, X.; Wang, W.; He, D.; Li, Y.; Zhang, Z.; Zhang, X.; et al. Source identification of sedimentary organic carbon in coastal wetlands of the western Bohai Sea. Sci. Total Environ. 2024, 913, 169282. [Google Scholar] [CrossRef]
  28. Xie, S.; Yang, F.; Feng, H.; Yu, Z.; Liu, C.; Wei, C.; Liang, T. Organic fertilizer reduced carbon and nitrogen in runoff and buffered soil acidification in tea plantations: Evidence in nutrient contents and isotope fractionations. Sci. Total Environ. 2021, 762, 143059. [Google Scholar] [CrossRef]
  29. GB 3838-2002; Surface Water Environmental Quality Standard. Ministry of Environmental Protection of the People’s Republic of China; China Environmental Science Press: Beijing, China, 2002.
  30. Copeland, A.; Lytle, D.A. Measuring the oxidation–reduction potential of important oxidants in drinking water. J. Am. Water Works Assoc. 2014, 106, E10–E20. [Google Scholar] [CrossRef]
  31. Ganguly, S.L.; Paria, D.S.; Jana, B.B. Evaluating the ecological resilient driven performance of a tropical waste stabilization pond system using ecological signature of biological integrity. J. Ecol. Eng. 2015, 16, 97–107. [Google Scholar] [CrossRef]
  32. Wang, J.J.; Lafrenière, M.J.; Lamoureux, S.F.; Simpson, A.J.; Gélinas, Y.; Simpson, M.J. Differences in riverine and pond water dissolved organic matter composition and sources in Canadian high Arctic watersheds affected by active layer detachments. Environ. Sci. Technol. 2018, 52, 1062–1071. [Google Scholar] [CrossRef] [PubMed]
  33. Zhang, W.S.; Swaney, D.P.; Li, X.Y.; Hong, B.; Howarth, R.W.; Ding, S.H. Anthropogenic point-source and non-point-source nitrogen inputs into Huai River basin and their impacts on riverine ammonia–nitrogen flux. Biogeosciences 2015, 12, 4275–4289. [Google Scholar] [CrossRef]
  34. Choi, M.; Lee, C.; Kim, L.H.; Choi, S.H.; Bong, Y.S.; Lee, K.S.; Shin, W.J. Assessing sources of nutrients in small watersheds with different land-use patterns using TN, TP, and NO3--N. J. Hydrol. Reg. Stud. 2024, 55, 101958. [Google Scholar] [CrossRef]
  35. Zou, W.; Zhu, G.; Cai, Y.; Vilmi, A.; Xu, H.; Zhu, M.; Gong, Z.; Zhang, Y.; Qin, B. Relationships between nutrient, chlorophyll a and Secchi depth in lakes of the Chinese Eastern Plains ecoregion: Implications for eutrophication management. J. Environ. Manag. 2020, 260, 109923. [Google Scholar] [CrossRef]
  36. Zhang, Z.; Zhang, F.; Du, J.; Chen, D.; Zhang, W. Impacts of land use at multiple buffer scales on seasonal water quality in a reticular river network area. PLoS ONE 2021, 16, e0244606. [Google Scholar] [CrossRef]
  37. Kayler, Z.E.; Premke, K.; Gessler, A.; Gessner, M.O.; Griebler, C.; Hilt, S.; Klemedtsson, L.; Kuzyakov, Y.; Reichstein, M.; Siemens, J.; et al. Integrating aquatic and terrestrial perspectives to improve insights into organic matter cycling at the landscape scale. Front. Earth Sci. 2019, 7, 127. [Google Scholar] [CrossRef]
  38. Rantala, M.V.; Nevalainen, L.; Rautio, M.; Galkin, A.; Luoto, T.P. Sources and controls of organic carbon in lakes across the subarctic treeline. Biogeochemistry 2016, 129, 235–253. [Google Scholar] [CrossRef]
  39. Ke, Z.; Tan, Y.; Huang, L.; Zhao, C.; Jiang, X. Spatial distributions of δ13C, δ15N and C/N ratios in suspended particulate organic matter of a bay under serious anthropogenic influences: Daya Bay, China. Mar. Pollut. Bull. 2017, 114, 183–191. [Google Scholar] [CrossRef]
  40. Liu, Y.; Wang, X.; Wen, Q.; Zhu, N. Identifying sources and variations of organic matter in an urban river in Beijing, China using stable isotope analysis. Ecol. Indic. 2019, 102, 783–790. [Google Scholar] [CrossRef]
  41. Dalu, T.; Richoux, N.B.; Froneman, P.W. Nature and source of suspended particulate matter and detritus along an austral temperate river–estuary continuum, assessed using stable isotope analysis. Hydrobiologia 2016, 767, 95–110. [Google Scholar] [CrossRef]
  42. Cai, M.; Lin, Y.; Chen, M.; Yang, W.; Du, H.; Xu, Y.; Cheng, S.; Xu, F.; Hong, J.; Chen, M.; et al. Improved source apportionment of PAHs and Pb by integrating Pb stable isotopes and positive matrix factorization application (PAHs): A historical record case study from the northern South China Sea. Sci. Total Environ. 2017, 609, 577–586. [Google Scholar] [CrossRef]
  43. Xiao, H.Y.; Liu, C.Q. Identifying organic matter provenance in sediments using isotopic ratios in an urban river. Geochem. J. 2010, 44, 181–187. [Google Scholar] [CrossRef]
  44. Blake, W.H.; Boeckx, P.; Stock, B.C.; Smith, H.G.; Bodé, S.; Upadhayay, H.R.; Gaspar, L.; Goddard, R.; Lennard, A.T.; Lizaga, I.; et al. A deconvolutional Bayesian mixing model approach for river basin sediment source apportionment. Sci. Rep. 2018, 8, 13073. [Google Scholar] [CrossRef]
  45. Liu, J.; Han, G. Tracing Riverine particulate black carbon sources in Xijiang river Basin: Insight from stable isotopic composition and Bayesian mixing model. Water Res. 2021, 194, 116932. [Google Scholar] [CrossRef]
Figure 1. Location of the study area and sampling sites.
Applsci 15 01434 g001
Figure 2. Characteristics of δ13C and δ15N for sediments from canals, lakes, ponds, and rivers.
Applsci 15 01434 g002
Figure 3. C and N source contributions for sediments from canals, lakes, ponds, and rivers.
Applsci 15 01434 g003
Figure 4. PCA results for water quality and chemical indicators from canals, lakes, ponds, and rivers.
Applsci 15 01434 g004
Table 1. Characteristics of the basic water quality parameters of canals, lakes, ponds, and rivers.
Water Quality ParameterspHORP (REDOX)DO (mg/L)EC (uS/cm)TDS (mg/L)
Canal (n = 8) Range7.45–9.96121.52–184.664.06–11.25123.00–209.6779.60–135.67
Mean8.84159.778.83174.05112.68
SD0.824.562.8426.5917.23
Lake (n = 8)Range7.95–9.9694.52–201.344.36–9.21117.86–462.2076.14–299.80
Mean8.87167.787.41224.59145.56
SD0.932.891.67104.1567.62
Pond (n = 8)Range7.00–9.3773.66–214.264.78–10.17147.00–231.4094.88–150.00
Mean8.65182.966.94194.18125.75
SD0.7246.552.3230.9620.18
River (n = 8)Range7.82–9.72160.70–212.752.84–13.2997.60–230.0062.80–149.14
Mean8.47185.948.04148.1395.83
SD0.5916.883.6748.0731.31
Table 2. Characteristics of water chemical indicators of canals, lakes, ponds, and rivers.
Water Chemical
Indicators
TN (mg/L)TDN (mg/L)NH4-N (mg/L)NO3-N (mg/L)Chl-a (ug/L)CODMn
(mg/L)
Canal (n = 8)Range2.21–3.062.10–2.840.06–0.121.31–2.542.35–11.192.88–3.96
Mean2.582.420.091.815.423.41
SD0.370.310.020.53.530.35
Lake (n = 8)Range1.89–2.931.81–2.760.06–0.131.03–2.181.51–6.232.67–5.25
Mean2.442.310.11.644.353.47
SD0.370.380.030.41.80.8
Pond (n = 8)Range2.31–2.752.18–2.710.05–0.181.52–2.222.13–5.082.88–3.58
Mean2.552.460.11.83.683.29
SD0.170.190.050.231.140.24
River (n = 8)Range1.67–3.351.60–3.150.03–0.140.99–2.511.10–5.452.08–4.25
Mean2.462.280.071.763.373.09
SD0.60.550.040.571.790.76
Table 3. Characteristics of C and N contents of sedimentary organic matter of canals, lakes, ponds, and rivers.
C and N Contents of Sedimentary
Organic Matter
TON (%)TOC (%)C/N
Canal (n = 8)Range0.14–0.361.17–3.366.96–9.24
Mean0.23 2.00 8.27
SD0.09 0.85 0.72
Lake (n = 8)Range0.10–0.430.81–4.657.49–10.90
Mean0.29 3.01 8.79
SD0.12 1.32 1.12
Pond (n = 8)Range0.16–0.341.34–3.547.87–10.72
Mean0.25 2.20 8.90
SD0.08 0.80 0.96
River (n = 8)Range0.14–0.431.09–4.017.35–9.16
Mean0.29 2.52 8.30
SD0.12 1.10 0.57
Disclaimer/Publisher’s Note: The statements, opinions and data contained in all publications are solely those of the individual author(s) and contributor(s) and not of MDPI and/or the editor(s). MDPI and/or the editor(s) disclaim responsibility for any injury to people or property resulting from any ideas, methods, instructions or products referred to in the content.

