Article

Optimization of Anatase TiO2 Photocatalyst for Diclofenac Degradation by Using Response Surface Methodology

1
Leibniz Institute for Catalysis (LIKAT), Albert-Einstein-Str. 29a, 18059 Rostock, Germany
2
School of Chemical Engineering, Jimma Institute of Technology, Jimma University, Jimma 378, Ethiopia
3
Civil and Environmental Engineering Faculty, Jimma Institute of Technology, Jimma University, Jimma 378, Ethiopia
4
School of Natural Sciences, Technische Universität München, Lichtenbergstr. 4, 85748 Garching, Germany
*
Author to whom correspondence should be addressed.
Appl. Sci. 2025, 15(3), 1401; https://doi.org/10.3390/app15031401
Submission received: 13 December 2024 / Revised: 15 January 2025 / Accepted: 27 January 2025 / Published: 29 January 2025
(This article belongs to the Special Issue Pollution Control Chemistry II)

Abstract

:
Titanium oxide semiconductors are considered effective photocatalysts for the degradation of organic pollutants. The photocatalytic activity of titanium dioxide is influenced by several factors, one of which is its phase composition, with anatase being considered the phase with the highest photocatalytic activity. In this work, a simple acid-assisted sol–gel process was used to synthesize a pure anatase phase by varying the synthesis and calcination temperature. The synthesized materials were characterized using various techniques and tested under simulated sunlight irradiation for the photocatalytic degradation of the drug diclofenac sodium (DCF), for which the pseudo-first-order apparent degradation rate constant and mineralization efficiency were determined. A pure anatase phase with high photocatalytic activity (up to 97% TOC removal) was obtained when TiO2 was synthesized at between 70 °C and 100 °C and calcined at between 400 °C and 500 °C. Furthermore, the obtained data were used to predict the optimal anatase synthesis and calcination temperatures for DCF removal using a response surface methodology (RSM) method. The model predicted a synthesis temperature of 71 °C and a calcination temperature of 440 °C, which should result in a pseudo-first-order DCF decay rate constant of 0.055 min−1 and a TOC removal rate of 100%. The experimentally determined values for the degradation rate (0.063 min−1) and TOC removal (97%) were in good agreement with the model’s predicted values.

1. Introduction

Today, millions of people in Africa are exposed to dangerous levels of chemical and biological contaminants in their drinking water. Water pollution is caused directly by the discharge of agricultural and industrial waste, as well as domestic wastewater from residential areas, and indirectly by population growth, industrialization, increasing urbanization, and climate change [1,2]. Pharmaceutical contaminants, in particular, are considered hazardous even in small concentrations, because they are often corrosive and toxic and are accumulated by animal and human organisms [3]. Therefore, much research is focused on the development of new processes for the removal of pharmaceutical waste [4].
There are several methods for the removal of pharmaceutical residuals from fresh- and wastewater. Some of these include coagulation, flocculation, adsorption, precipitation, membrane separation, and aerobic and anaerobic processes [5]. The disadvantages of the currently used removal methods include the formation of hazardous byproducts (chemicals), the use of expensive chemicals, high operation and raw material costs, long process times, complex sludge production, and separation problems [6]. In general, these treatment methods are still unsatisfactory in terms of their sustainability and environmental impact.
Advanced oxidation processes (AOPs) are currently considered as an alternative method for the removal of pharmaceutical compounds from fresh- and wastewater [7]. These methods rely on the formation of highly active species through, e.g., the photolysis of H2O2 and O3 under UV irradiation, which can degrade even relatively inert molecules [8]. Heterogenous photocatalysis is another AOP method. Using this technique, complex organic and inorganic substances can be converted into small molecules like CO2 and H2O [9] using a semiconductor and light energy [10,11]. In a photocatalytic process, electrons and holes are generated via the irradiation of the photocatalyst with light, which can react directly with the pollutant or generate further reactive species like hydroxyl radicals and superoxide radicals [11].
Metal oxide semiconductors such as TiO2, ZnO, WO3, and Fe2O3 are of great interest for the photocatalytic degradation of drugs, as they can harness energy in the UV-Vis range and generate reactive charge carriers when irradiated with light [12,13]. The energetic position of their valance band and/or conduction band enables the formation of superoxide radicals via the reaction of dissolved oxygen molecules with electrons from the conduction band and/or the formation of hydroxyl radicals via the reaction of holes in the valence band with water or surface hydroxyl groups.
Among different semiconductor-based heterogeneous photocatalysts, TiO2 seems to be one of the best and most effective materials in photocatalytic pollutant degradation. It is considered as environmentally friendly, non-toxic, and relatively cheap, and is available in sufficient quantities compared to other semiconductor materials [14]. TiO2 can exist in three different polymorph phases [15], which are, in order of abundance, rutile, anatase, and brookite [16]. Anatase is considered as the most photocatalytically active polymorph, while rutile is the most common, employed as a white pigment, an opacifier, and a UV radiation absorber [16]. A pure anatase phase is mainly synthesized via hydrothermal methods, which involve a high pressure and reaction temperature, or using sol–gel methods under ambient pressure. In the hydrothermal process, the morphological shape of TiO2 can be controlled [17], but the time and energy consumption levels are relatively high [18] and the upscaling of the process is often difficult. With the sol–gel method, mainly amorphous or low-crystallinity TiO2 will be obtained, and for the formation of a highly crystalline TiO2 phase, an additional annealing step is often necessary [19,20]. Morphological shape control with methods involving an annealing step is more challenging [21] because the high temperature necessary to form TiO2 with high crystallinity leads not only to an increase in the primary crystallite size but also often to an aggregation or agglomeration of the primary formed TiO2 particles or to sintering processes.
In this work, a simple method was used to synthesize anatase TiO2 in a reproducible manner [22]. The obtained material was characterized via various methods and used for the photocatalytic degradation of diclofenac sodium (DCF) under simulated solar irradiation. The aim of this work was to study the effects of two important synthesis parameters, namely the temperature of the acid-assisted sol–gel synthesis process and the calcination temperature, on the photocatalytic performance of the anatase phase in the degradation of DCF. Finally, a response surface methodology (RSM) was used to predict the synthesis and calcination temperatures that would result in the anatase phase exhibiting the fastest photocatalytic degradation and mineralization of DCF.

2. Materials and Methods

2.1. Chemicals

Titanium (IV) isopropoxide (TIPP, C12H28O4Ti, 100% pure, CAS: 546-68-9) was purchased from TCI (Zwijndrecht, Belgium). Acetic acid (100% pure) was obtained from Walter-CMP GmbH & Co., KG (Kiel, Germany). Sodium hydroxide pellets (extra pure) were delivered from ACROS Organics (Geel, Belgium). Diclofenac sodium (≥98%) was obtained from Sigma-Aldrich (Steinheim, Germany).

2.2. TiO2 Synthesis

A previously reported acid-assisted sol–gel method was applied for the TiO2 synthesis [22], but with a higher amount of the starting compounds to obtain a larger TiO2 quantity. In this process, 102 mL of distilled water was added into a 250 mL conical flask containing a magnetic stirrer bar. The flask was fixed on a magnetic stirrer plate with a heating bath and the water was stirred at about 400 rpm. Then, 9.5 mL of TIPP was slowly added by using a syringe. After TIPP addition, the opening of the flask was immediately covered with a cap and stirring was continued for 30 min at room temperature. In the following step, the heating bath was heated up to 40 °C, 70 °C, or 100 °C. To suppress the evaporation of water, a water-cooled reflux condenser was attached to the conical flask. After reaching the adjusted temperature, 22 mL of acetic acid (AA) was quickly added to the TIPP-containing solution using a pipette. All TiO2 samples were synthesized with a fixed molar ratio of TTIP:H2O:AA = 1:11.5:2.6. Stirring of the suspension was continued for another 3 h at the adjusted temperature, followed by naturally cooling the suspension to room temperature with constant stirring. Afterwards, the suspension was neutralized and coagulated by means of the addition of 20 mL of 10 M aqueous sodium hydroxide solution. The obtained mixture was centrifuged at 8000 rpm (8730 rcf) for 15 min and the white precipitate was washed with distilled water. The centrifugation–washing procedure was repeated several times. Subsequently, the solid was collected and dried at 65 °C for 17 h in a drying cabinet. After grinding, the sample was split into four parts and three aliquots were calcined at 400 °C, 500 °C, or 600 °C in a static air atmosphere (see also Supplementary Data, Figure S1).

2.3. Characterization Methods

XRD powder patterns were recorded on a Panalytical X’Pert θ/2θ-diffractometer equipped with an Xcelerator detector using automatic divergence slits and Cu kα1/α2 radiation (40 kV, 40 mA; λ = 0.15406 nm, 0.154443 nm). Cu beta-radiation was excluded using a nickel filter foil. Finely ground samples were mounted on silicon zero background holders and data collection was performed with 0.086°·s−1. The obtained intensities were converted from automatic to fixed divergence slits (0.25°) for further analysis. Peak positions and profiles were fitted with the pseudo-Voigt function using the HighScore Plus software package 4.9 (Panalytical). Phase identification was performed by using the PDF-2 database of the International Center of Diffraction Data (ICDD). The primary crystallite size was calculated by using the Scherrer Equation:
D = K λ β C O S ( θ )
where D is the average primary crystallite size, K is the Scherrer constant (0.94), λ is the X-ray wavelength (Cu Kα = 1.5406 Å), β is the line width at FWHM in radians, and θ is the Bragg angle in degrees.
The BET surface area and the pore size distribution were calculated by using the Brunauer–Emmett–Teller (BET) and Barrett–Joyner–Halenda (BJH) methods, respectively. Prior to the analysis, the samples were degassed at 150 °C for 5 h.
UV-Vis diffuse reflectance spectra (DRS) were recorded on a AvaSpec 2048 fiber optical spectrometer (Avantes BV, Apeldoorn, The Netherlands) equipped with an Ava Light-DHS light source and an FCR-19UV200-2-ME reflection probe by using BaSO4 as the reference standard material.
The SEM micrographs were recorded using a Merlin VP compact device (Zeiss, Oberkochen, Germany).
The photoelectrochemical experiment was performed on a typical three-electrode setup on a photoelectrochemical CIMPS system (Zahner Zennium, PP211, Kronach, Germany). A Pt wire and an Ag/AgCl (3 M NaCl) electrode served as the counter electrode and reference electrode, respectively, and the electrolyte was a 0.5 M Na2SO4 solution. The working electrode was prepared by means of a coating method: typically, 0.02 g of photocatalyst was added into 0.9 mL of isopropanol in the presence of 0.1 mL of Nafion solution (5 wt%). After ultrasonic dispersion for 10 min, a homogeneous ink was obtained, which was dripped onto FTO glass with an active area of 1.5 × 1.5 cm2 and subsequently dried naturally in the air. A UV LED lamp (λ = 365 nm, Zahner, Kronach, Germany) was used as the light source. The photocurrent response curves were measured with the light on and off every 20 s during the measurements. Electrochemical impedance spectroscopy (EIS) was carried out through a potential static method in the frequency range of 0.01–100 KHz.

2.4. Photocatalytic Degradation Experiments

The degradation tests were carried out in a solar light simulator Sun Test CPS+ system. Further details of the applied system can be found in [23]. First, 60 mL of a DCF solution (c = 25 mg/L) was poured into the photoreactor. To this solution, 30 mg of catalyst was added, and the reactor was closed and placed in the exposure chamber. Before the xenon lamp of the Sun Test CPC+ was turned on, the suspension was stirred in the dark for 30 min to retain the adsorption–desorption equilibrium. After turning on the light, samples were taken from the reactor at 30 min intervals and analyzed using the HPLC method. After 120 min of irradiation, the experiment was terminated, and the reaction mixture was separated from the photocatalyst by means of centrifugation. The relative DCF concentration ct/c0 was calculated from the HPLC area of DCF in the starting solution (A0) and the DCF area obtained after a reaction time t (At) using Equation (2).
c t c 0 = A t A 0      
The total organic carbon (TOC) content of the reaction mixture was then determined by using a TOC analyzer (multi-N/C 3100, Analytic Jena, Jena, Germany). The degree of mineralization was obtained by using the total organic carbon (TOC) content in the final reaction mixture and in the starting solution. The photocatalytic mineralization efficiency (TOC removal) was calculated using Equation (3), whereas C0 and C are the initial and the organic carbon content after 120 min of irradiation (mg/L), respectively.
T O C   r e m o v a l % = ( C 0 C ) C 0   · 100 %
The reusability test was conducted under the same conditions as described above. After 120 min of irradiation, the TiO2 was separated from the aqueous phase by means of centrifugation and then washed with water. This step was repeated four times. The TiO2 photocatalyst was then dried in an oven at 80 °C for 17 h, ground, and used for a new experiment. The TOC content of the aqueous reaction solution was determined immediately after separation from the photocatalyst.

2.5. Mathematical Modeling

The fitting of the apparent first-order rate constant and the TOC removal was performed using the response surface methodology (D-optimal custom design model, Version 13.0.5.0), which can be used for at least two input variables. The input variables were synthesis temperature (A) (40 °C, 70 °C or 100 °C) and calcination temperature (B) (400 °C, 500 °C, or 600 °C), while the TOC removal and the apparent DCF degradation rate constant were the output parameters. The statistical analysis parameters which were applied to prove whether the model equations strongly or weak fit the model are presented in Equations (4)–(8). For strong model fitting, the R2 and adjusted R2 must be greater than 0.9, and the adjusted R2 should always be less than R2. The discrepancy of the prediction R2 and adjusted R2 must not be greater than 0.2. The parameters were calculated as follows:
R 2 = i n ( Y ^ Y ¯ ) 2 i n ( Y i Y ¯ ) 2
A d j u s t e d   R 2 = 1 ( 1 R 2 ) ( n 1 ) n p
P r e d i c t e d   R 2 = 1 i n ( Y i Y ^ ) 2 i n ( Y i Y ¯ ) 2
A d e q u a t e   P r e c i s i o n = M a x Y ^ M i n Y ^ ν y ˙ > 4
ν y ˙ = p σ 2 n
where Yi is the actual response at each term,  Y ¯  is the average actual response,  Y ^  is the predicted response at each term, n is the number of runs, p is the number of independent variables, and σ is the standard deviation.

3. Result and Discussion

3.1. Characterization

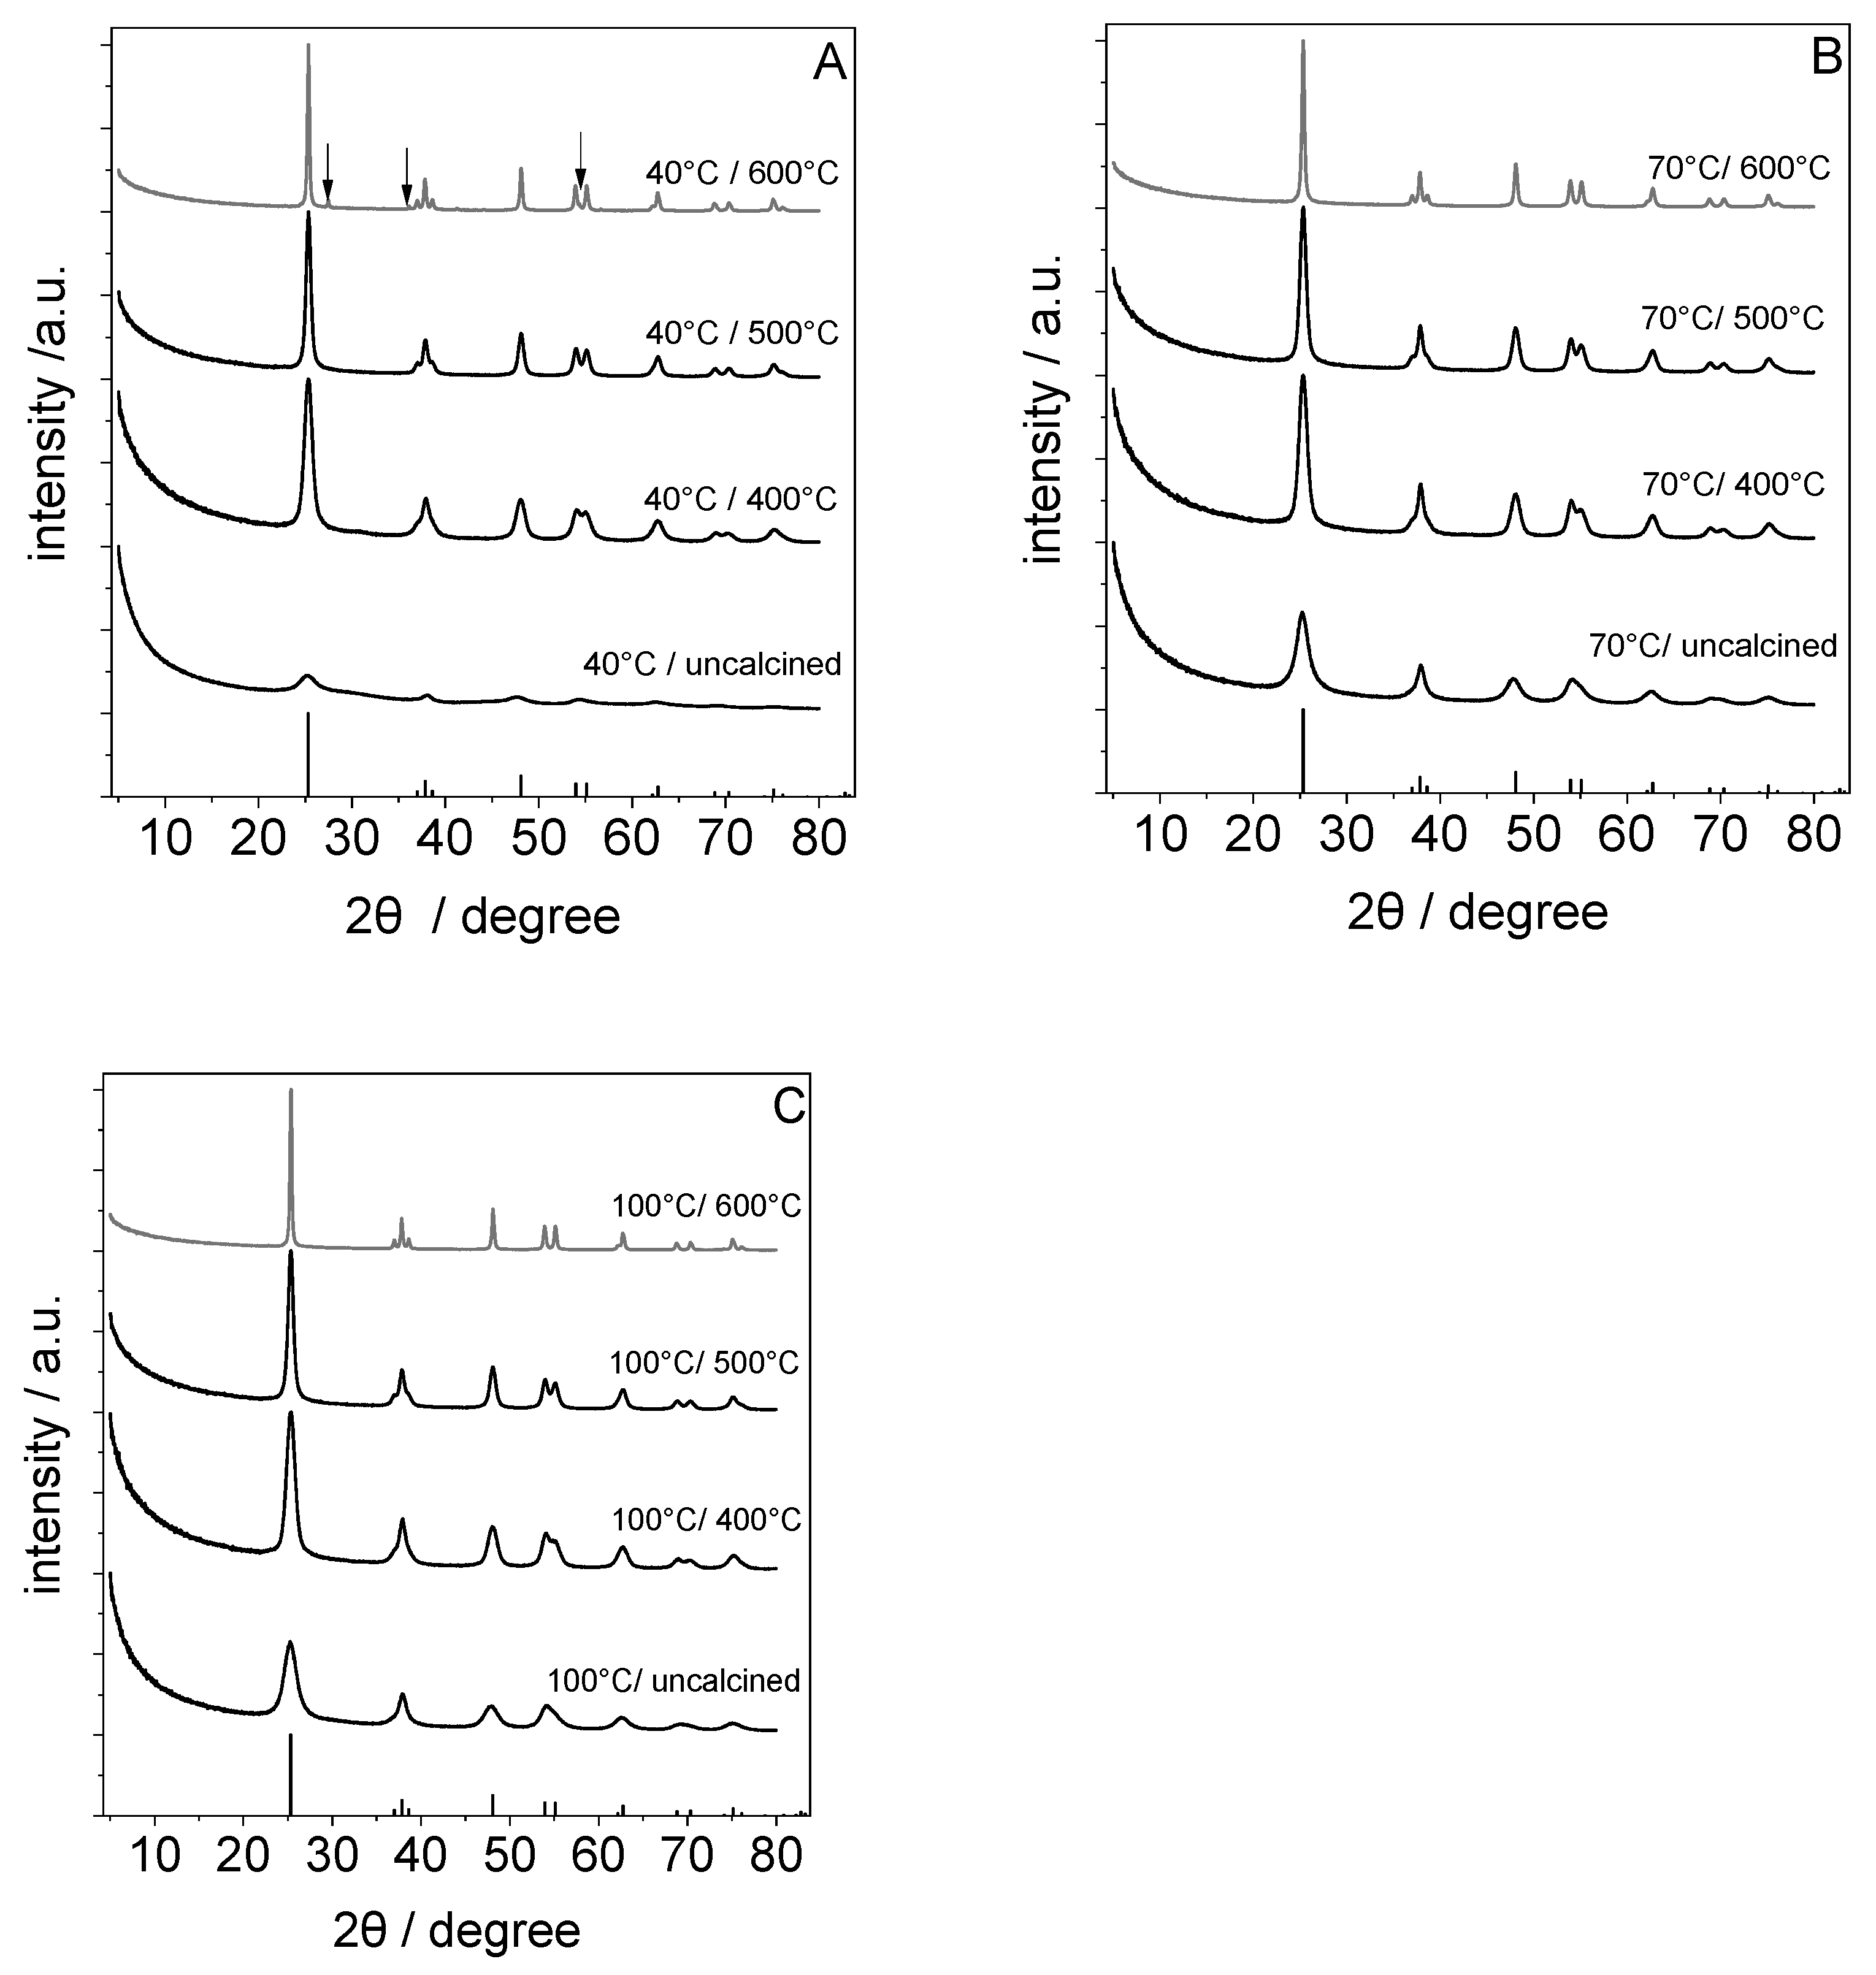
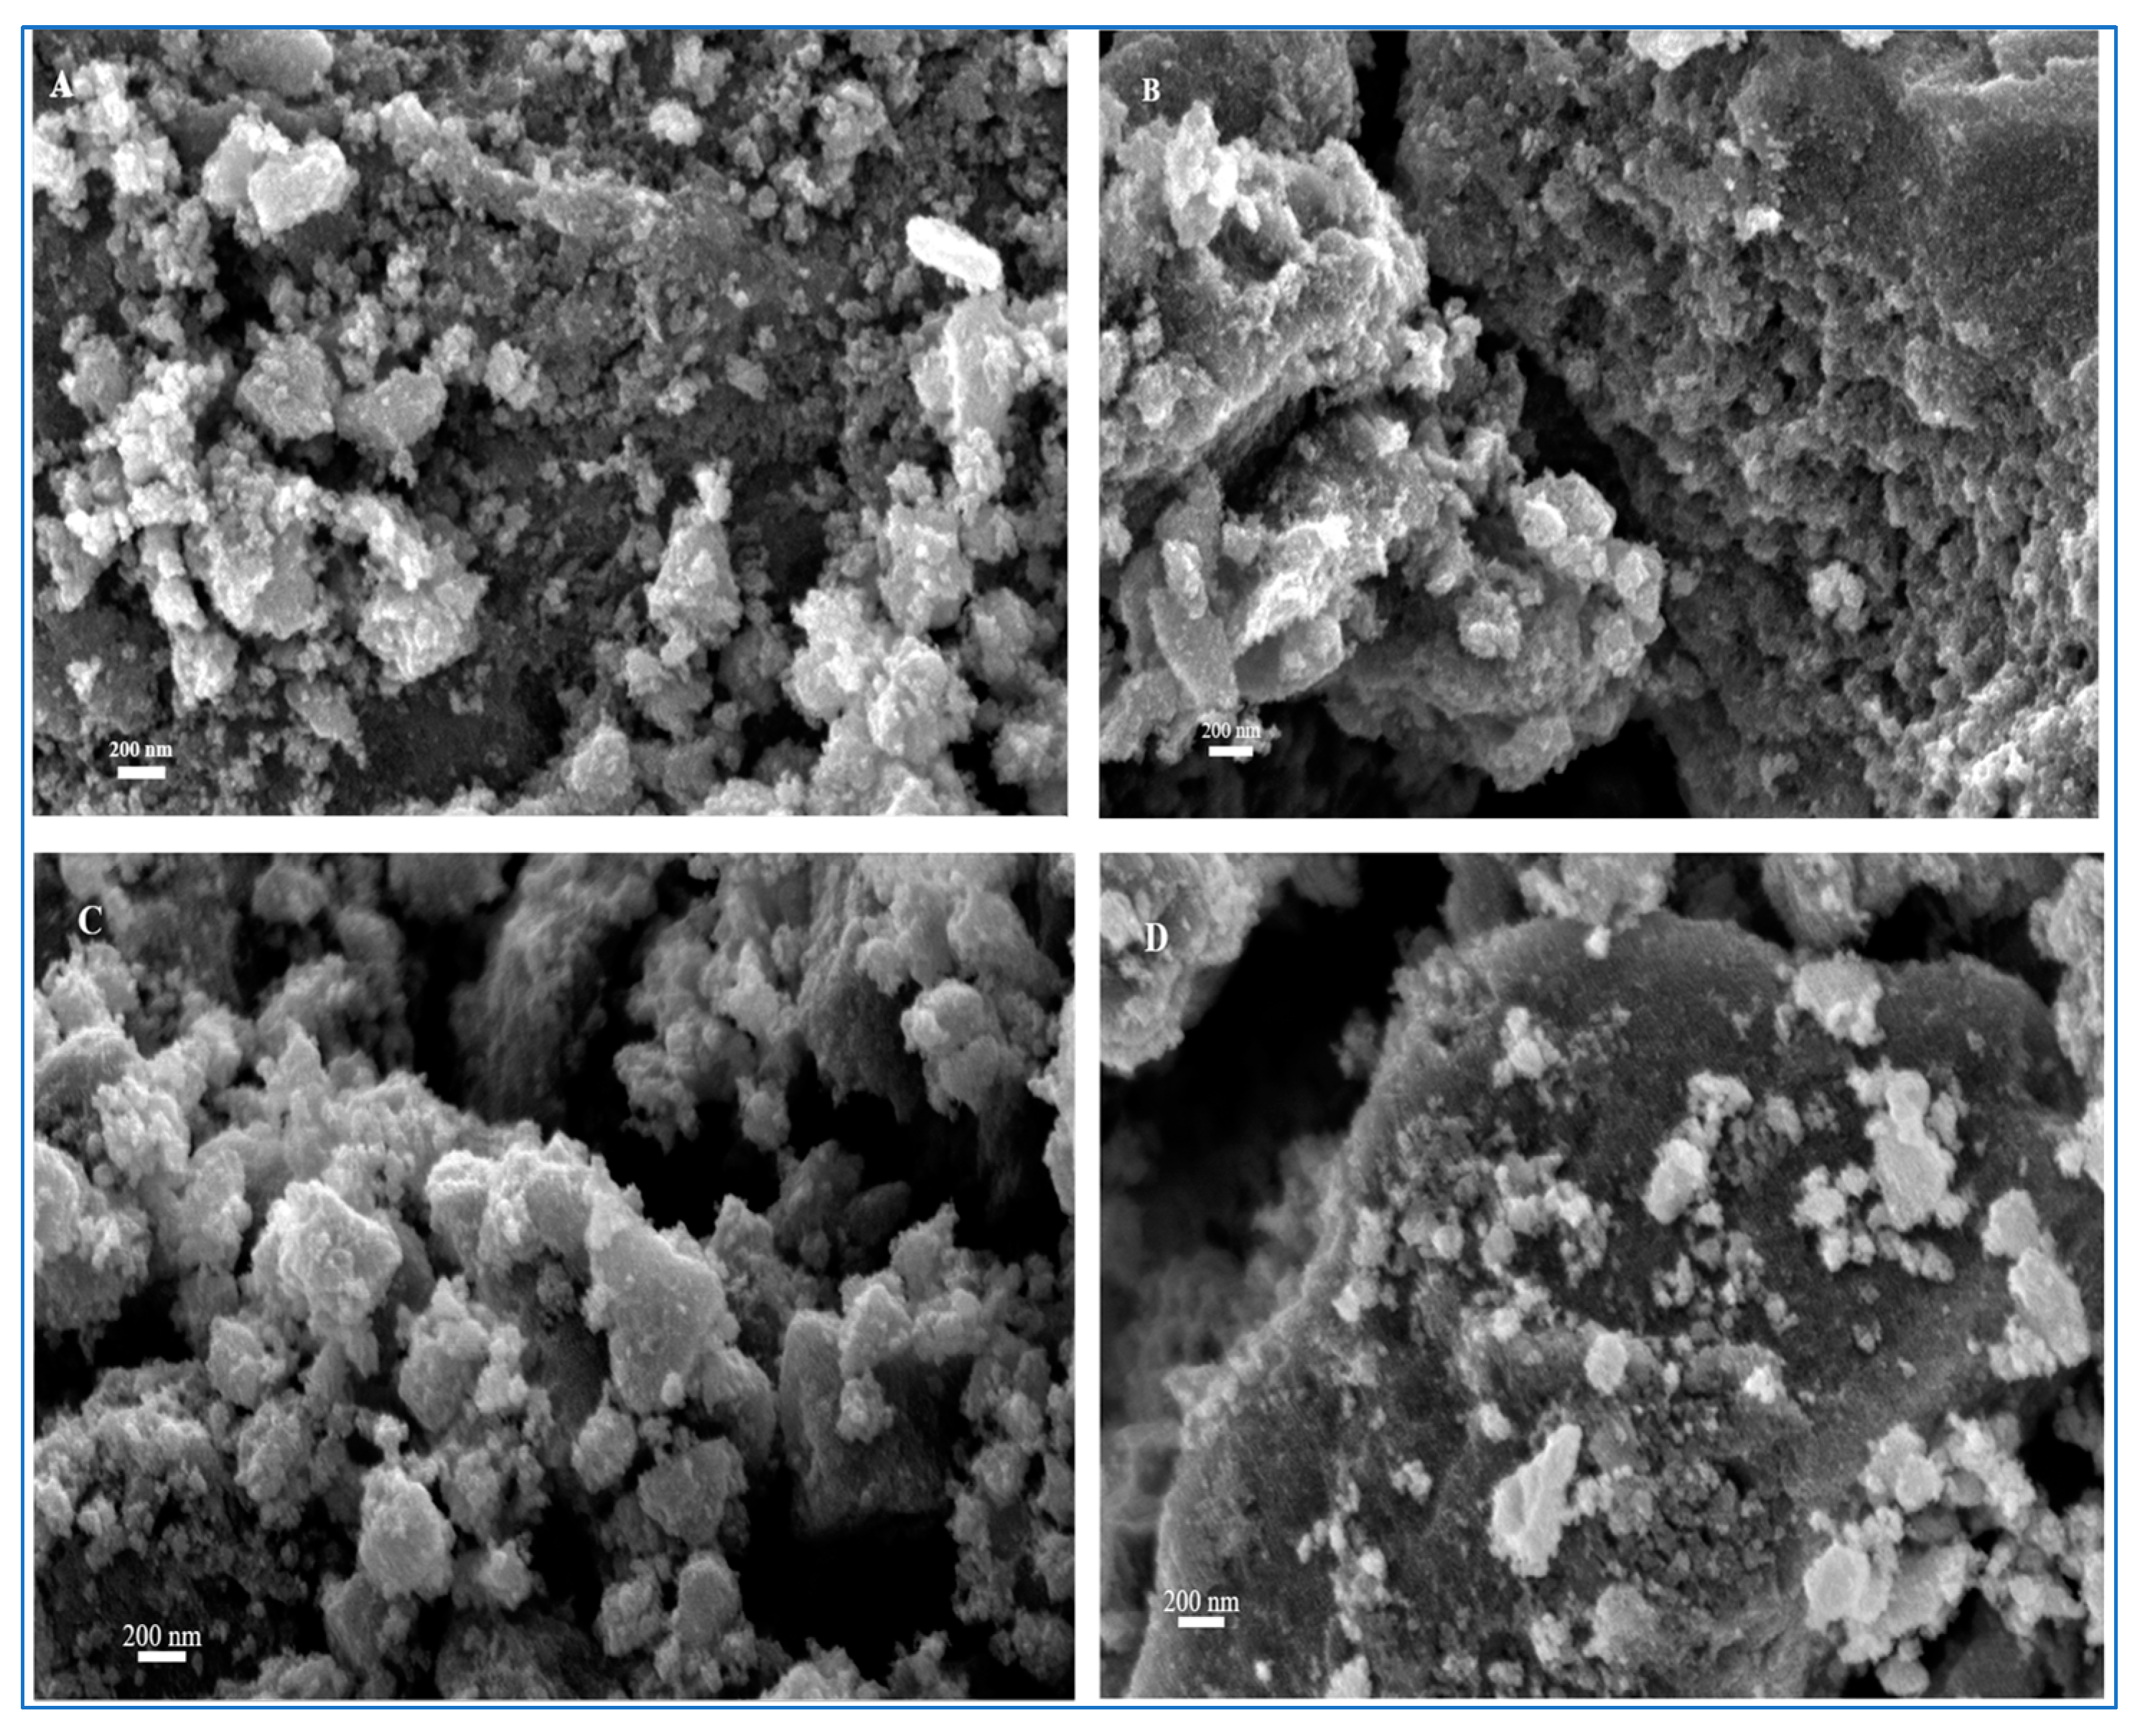
3.1.1. Phase Composition and Morphology

The XRD powder patterns of the material synthesized via the acid-assisted sol–gel process at 40 °C, 70 °C, and 100 °C and those obtained after a subsequent thermal treatment at 400 °C, 500 °C, or 600 °C are presented in Figure 1. The uncalcined material synthesized at 40 °C (Figure 1A) showed broad reflections with low intensity and 2θ positions near the main reflections of the anatase phase. The observation of peak broadening in connection with additional scattering of amorphous material (peak at ≈ 27°) indicates a low crystallinity of the formed TiO2. When the synthesis temperature of the sol–gel process was increased to 70 or 100 °C, the intensity of these reflections increased. Within the powder diffraction data (cf. Figure 1B,C), all reflections can be attributed to the anatase phase (ICDD pdf 00-064-0863). After calcination, the width of the diffraction lines decreased without any change in the phase composition, except for the sample synthesized at 40 °C which was calcined at 600 °C. Here, additional peaks located at 2θ = 27.4, 36.1, and 54.3° can be observed and attributed to the presence of a rutile phase (ICDD pdf 01-073-2224).
The sol–gel process involves hydrolysis and condensation reactions. Hydrolysis leads to the formation of hydroxides, which can condense by releasing water, forming TiO2 [24,25]. In the acid-assisted sol–gel process, the added acetic acid promotes the formation of an anatase TiO2 phase and reduces the interaction between TiO2 particles through adsorbates creating a steric barrier on the surface of TiO2 cores [22]. The condensation reaction is therefore slower and more ordered, which leads to the formation of crystalline TiO2 domains at room temperature [22].
The primary anatase crystallite size estimated by using the Scherrer equation is summarized in Table 1. The primary crystallite size increased with calcination temperature. Moreover, crystallite size seems to also be affected by the synthesis temperature. The increase in crystallite size with increasing calcination temperature was lower for materials synthesized at 70 °C than for those synthesized at 40 °C or 100 °C. The reason for this is still unclear. One possible explanation might be differences in the structure of the [TiOx] polyhedrons of the formed amorphous TiO2 phase. These structural differences could influence the ratio between the growth of existing crystallites and the formation of small new anatase crystallites during calcination. The smaller crystallite size in the material synthesized at 70 °C after its calcination at 500 or 600 °C compared to the material synthesized at 40 and 100 °C might indicate that a larger number of new anatase crystallites are formed in the TiO2 synthesized at 70 °C during calcination than in the TiO2 samples synthesized at 40 or 100 °C.
Figure 2 shows SEM images of the titanium dioxide sample synthesized at 70 °C and those materials obtained after calcination at 400 °C, 500 °C, or 600 °C. The shape and size of the synthesized titanium dioxide structures are largely irregular, and the samples consist of hierarchical structures that are composed of agglomerated TiO2 particles. Furthermore, the SEM images show no significant changes in particle morphology after calcination. The rough surface of the particles appears smoother after calcination and the material calcined at 500 °C or 600 °C seems to have a higher density.
EDX spectra (Figure S2) show the presence of titanium (Ti) and oxygen (O) in all samples. Ti and O were the only elements present in uncalcined TiO2 and in the material calcined at 400 °C. Samples calcined at 500 °C or 600 °C show the presence of a small amount of sodium, probably resulting from the neutralization step.

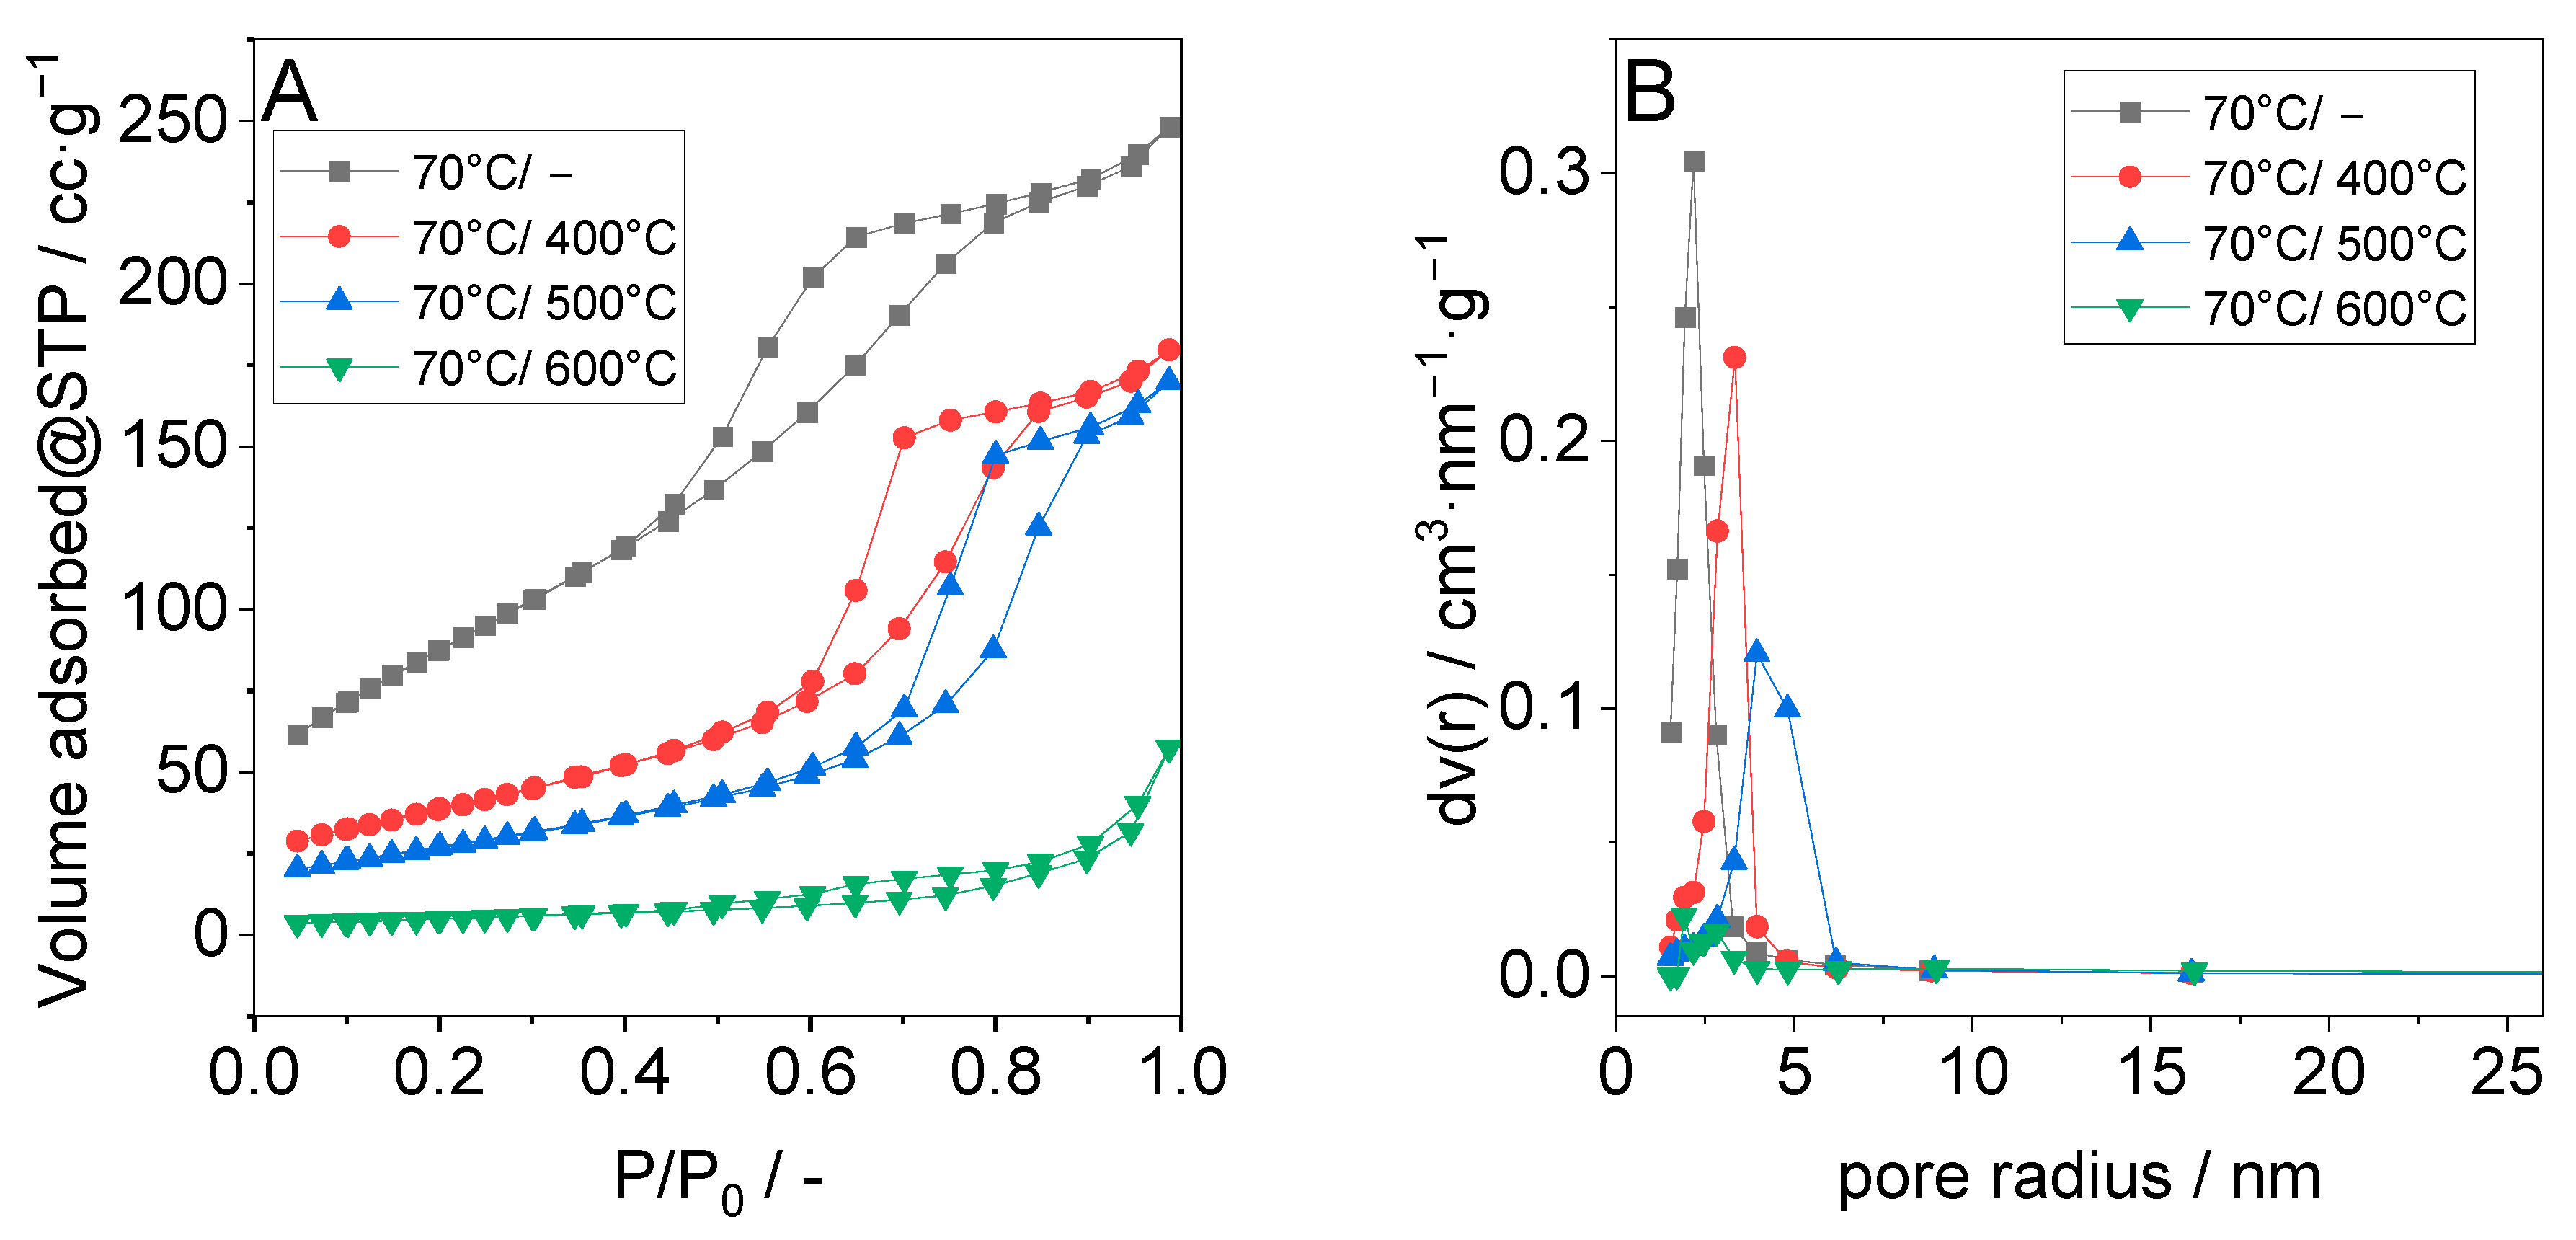
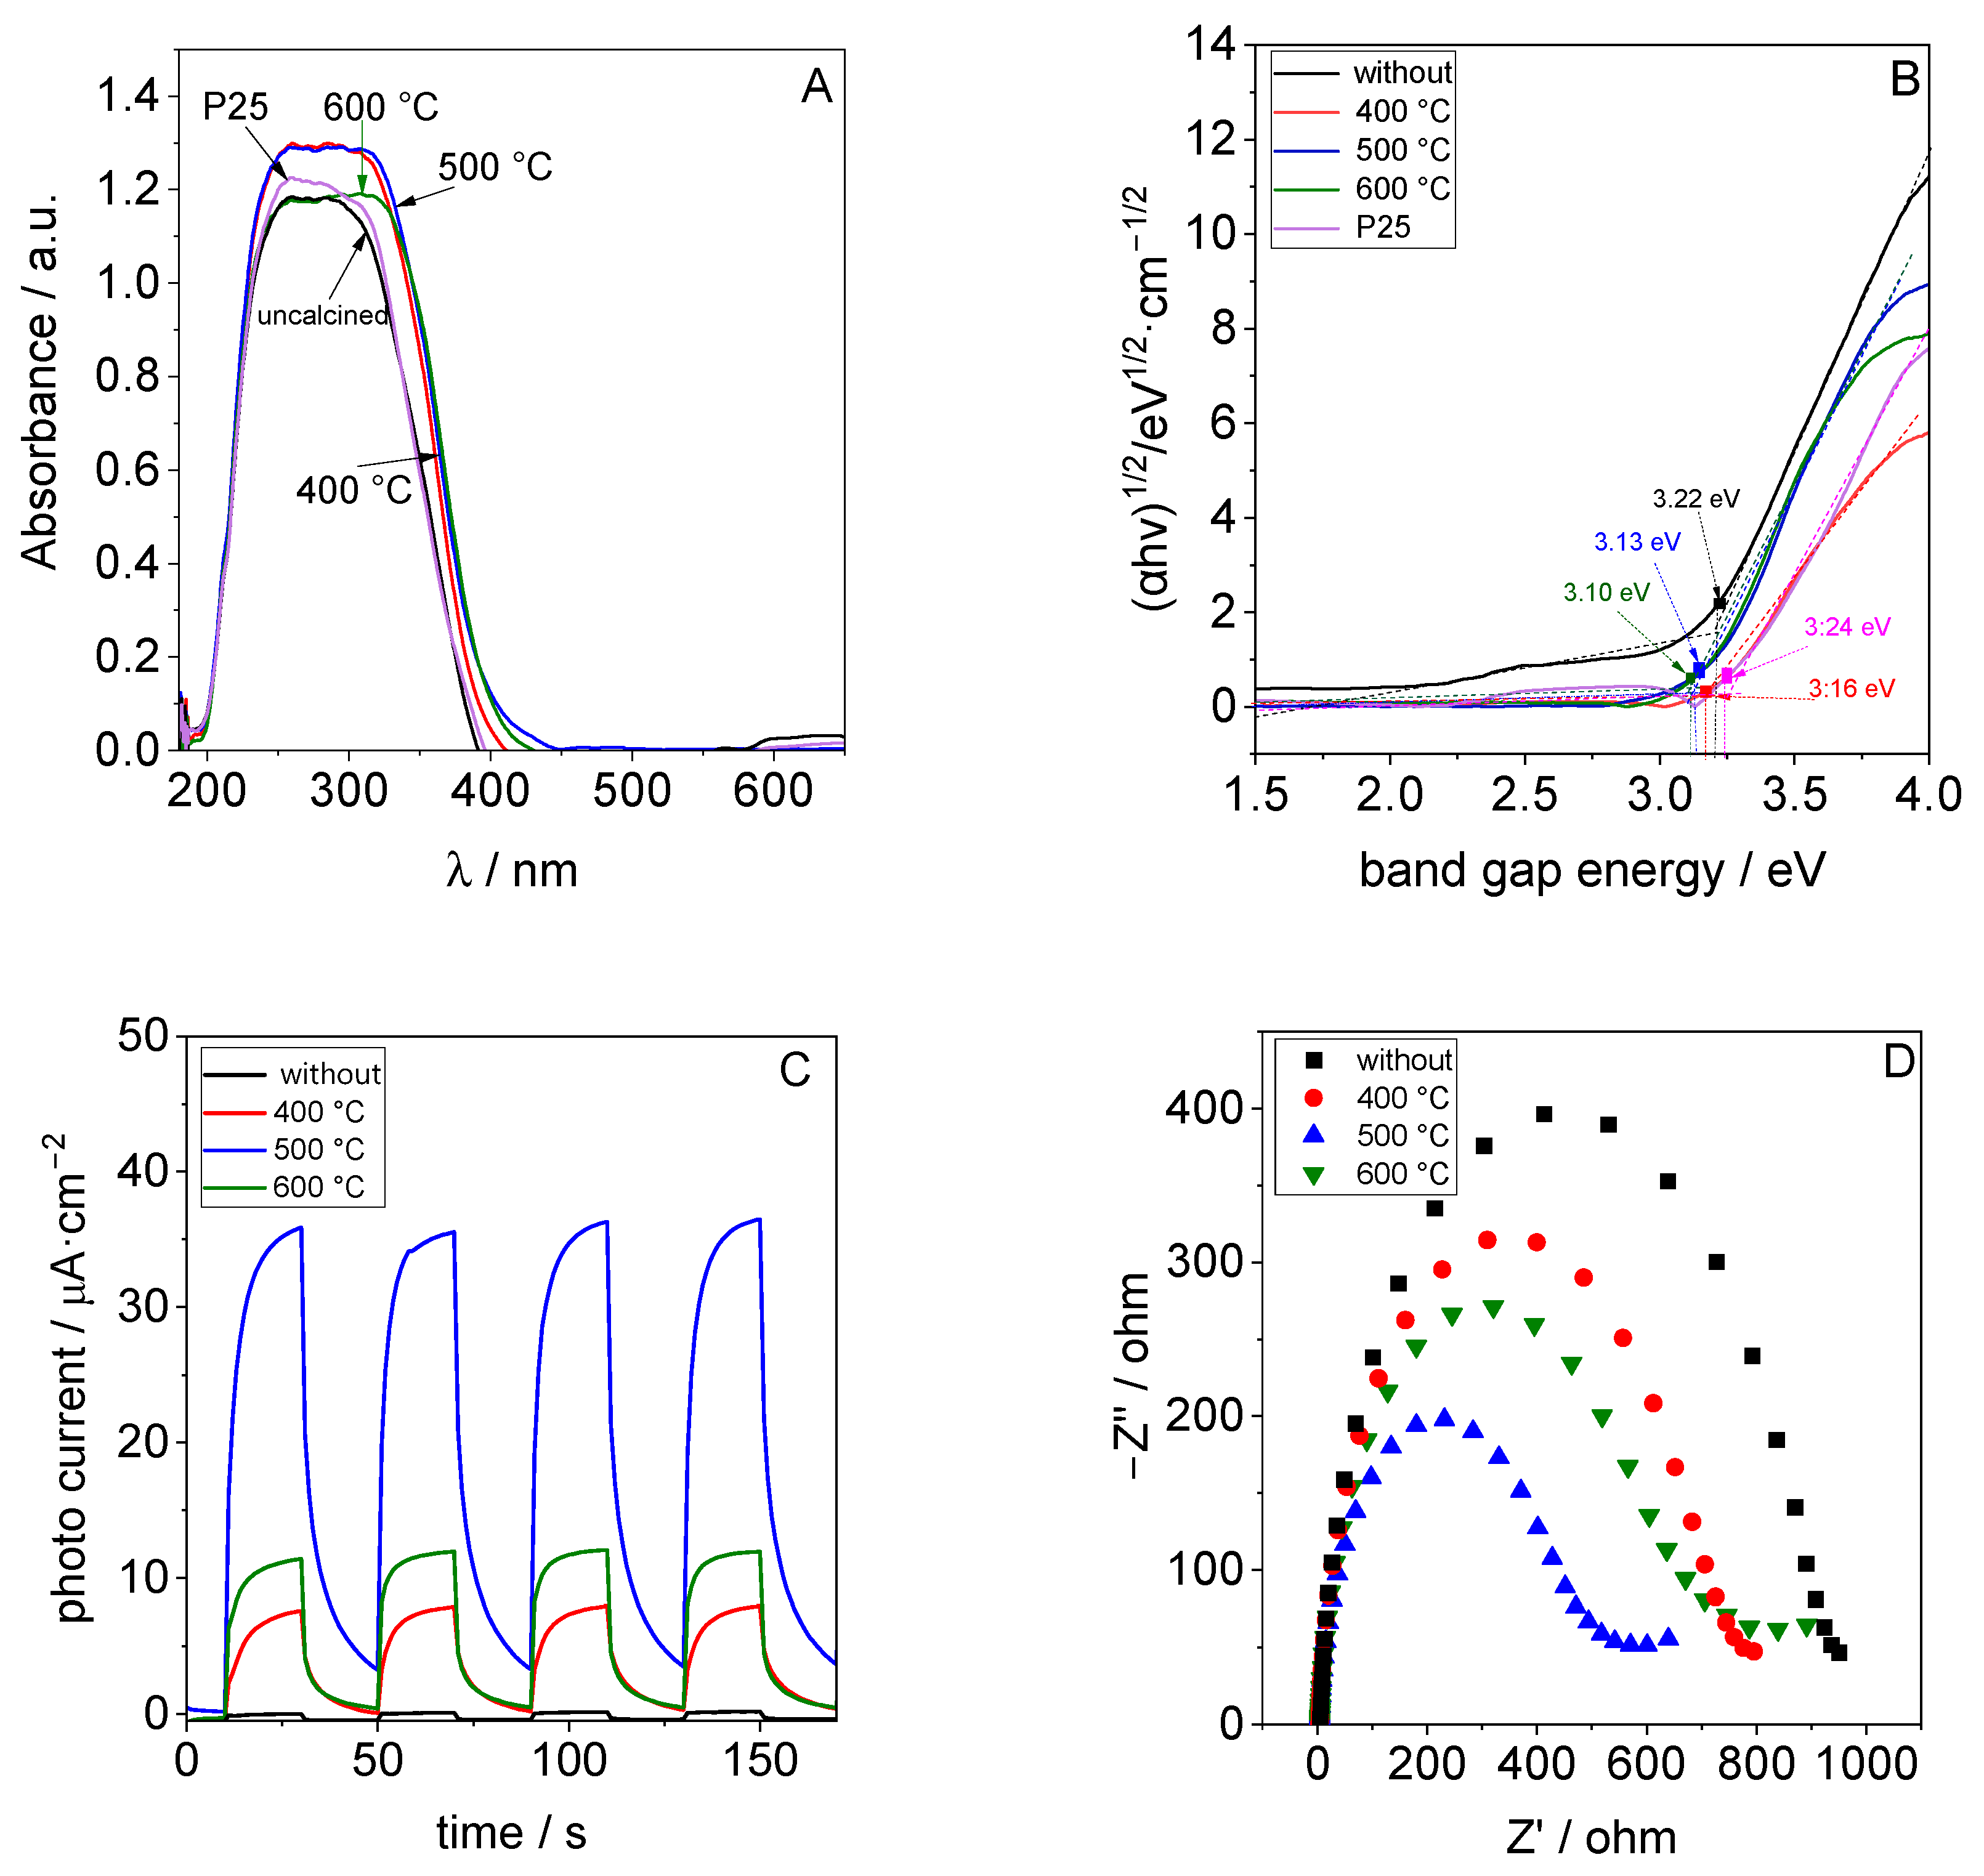
3.1.2. Textural Properties and Light Absorption

N2-sorption isotherms for pristine TiO2 synthesized at 70 °C as well as for materials obtained after calcination at different temperatures are presented in Figure 3A, and their pore radius distribution is shown in Figure 3B. The N2-sorption isotherms of the uncalcined sample and that of the material calcined at temperatures up to 500 °C can be classified as type IV with an H3 hysteresis loop, which indicates the presence of mesopores [26,27]. The adsorption isotherm shifts to areas of higher relative pressure with increasing calcination temperature, indicating the formation of larger pores with increasing temperature [28]. On the other hand, the absence of the hysteresis loop in the adsorption isotherms of the sample calcined at 600 °C indicates that the TiO2 has almost completely lost its mesoporosity at this temperature. The derived BET surface areas (ABET), pore volumes (Vp), and pore size maxima (Sp) are summarized in Table 2. A relatively high BET surface area of about 300 m2·g−1 was measured for the uncalcined sample [29]. As expected, BET surface area and pore volume significantly decreased when the material was calcined. Interestingly, the BET surface area of the TiO2 sample calcined at 500 °C was still two times higher in comparison to the BET surface area of P25 [30].
During calcination, the primary crystallite size of the anatase crystallites increased significantly, regardless of the applied synthesis temperatures. It is assumed that amorphous TiO2 is transformed into anatase during calcination and that this transformation increases with increasing calcination temperature. The loss of the amorphous TiO2 content with increasing temperature, which is associated with a collapse of the mesopores, leads to material densification and thus to a decrease in the BET surface area and the pore volume of the TiO2 [31]. During crystallization, the anatase crystallites forming the wall of mesopores undergo growth, thereby reducing the number and volume of the existing voids, which are responsible for the mesoporous structure. The calcination also removes organic residues from TiO2, as shown by the reduced carbon content. When the sample is calcined at 600 °C, the amorphous part will be almost completely transformed into crystalline anatase. In addition, the transformation of the anatase phase into the rutile phase begins at this high temperature, and sintering can also occur [31]. As a sum of these processes, the BET surface area and the pore volume of the material calcined at 600 °C decrease drastically.
Diffuse reflectance spectra (DRS) from TiO2 samples synthesized at 70 °C are presented in Figure 4A. As expected, TiO2 absorbed light only in the UV region. The calcination temperature had only a minor influence on its light adsorption. Tauc’s method was used to determine the band gap of the TiO2 samples (Figure 4B). The band gap of the synthesized TiO2 samples was between 3.1 and 3.22 eV, as shown in Table 2, and these values are in accordance with the band gap of anatase as reported previously [32].
The results of the electrochemical characterization of the samples synthesized at 70 °C are shown in Figure 4C,D. The material calcined at 500 °C exhibits the highest photocurrent, followed by the TiO2 calcined at 600 and 400 °C. Almost no photocurrent was measured for the uncalcined material (Figure 4C). The TiO2 calcined at 500 °C also has the smallest EIS radius (Figure 4D). Both results indicate that the TiO2 calcined at 500 °C can separate and migrate photogenerated charge carriers more effectively than the other materials investigated.

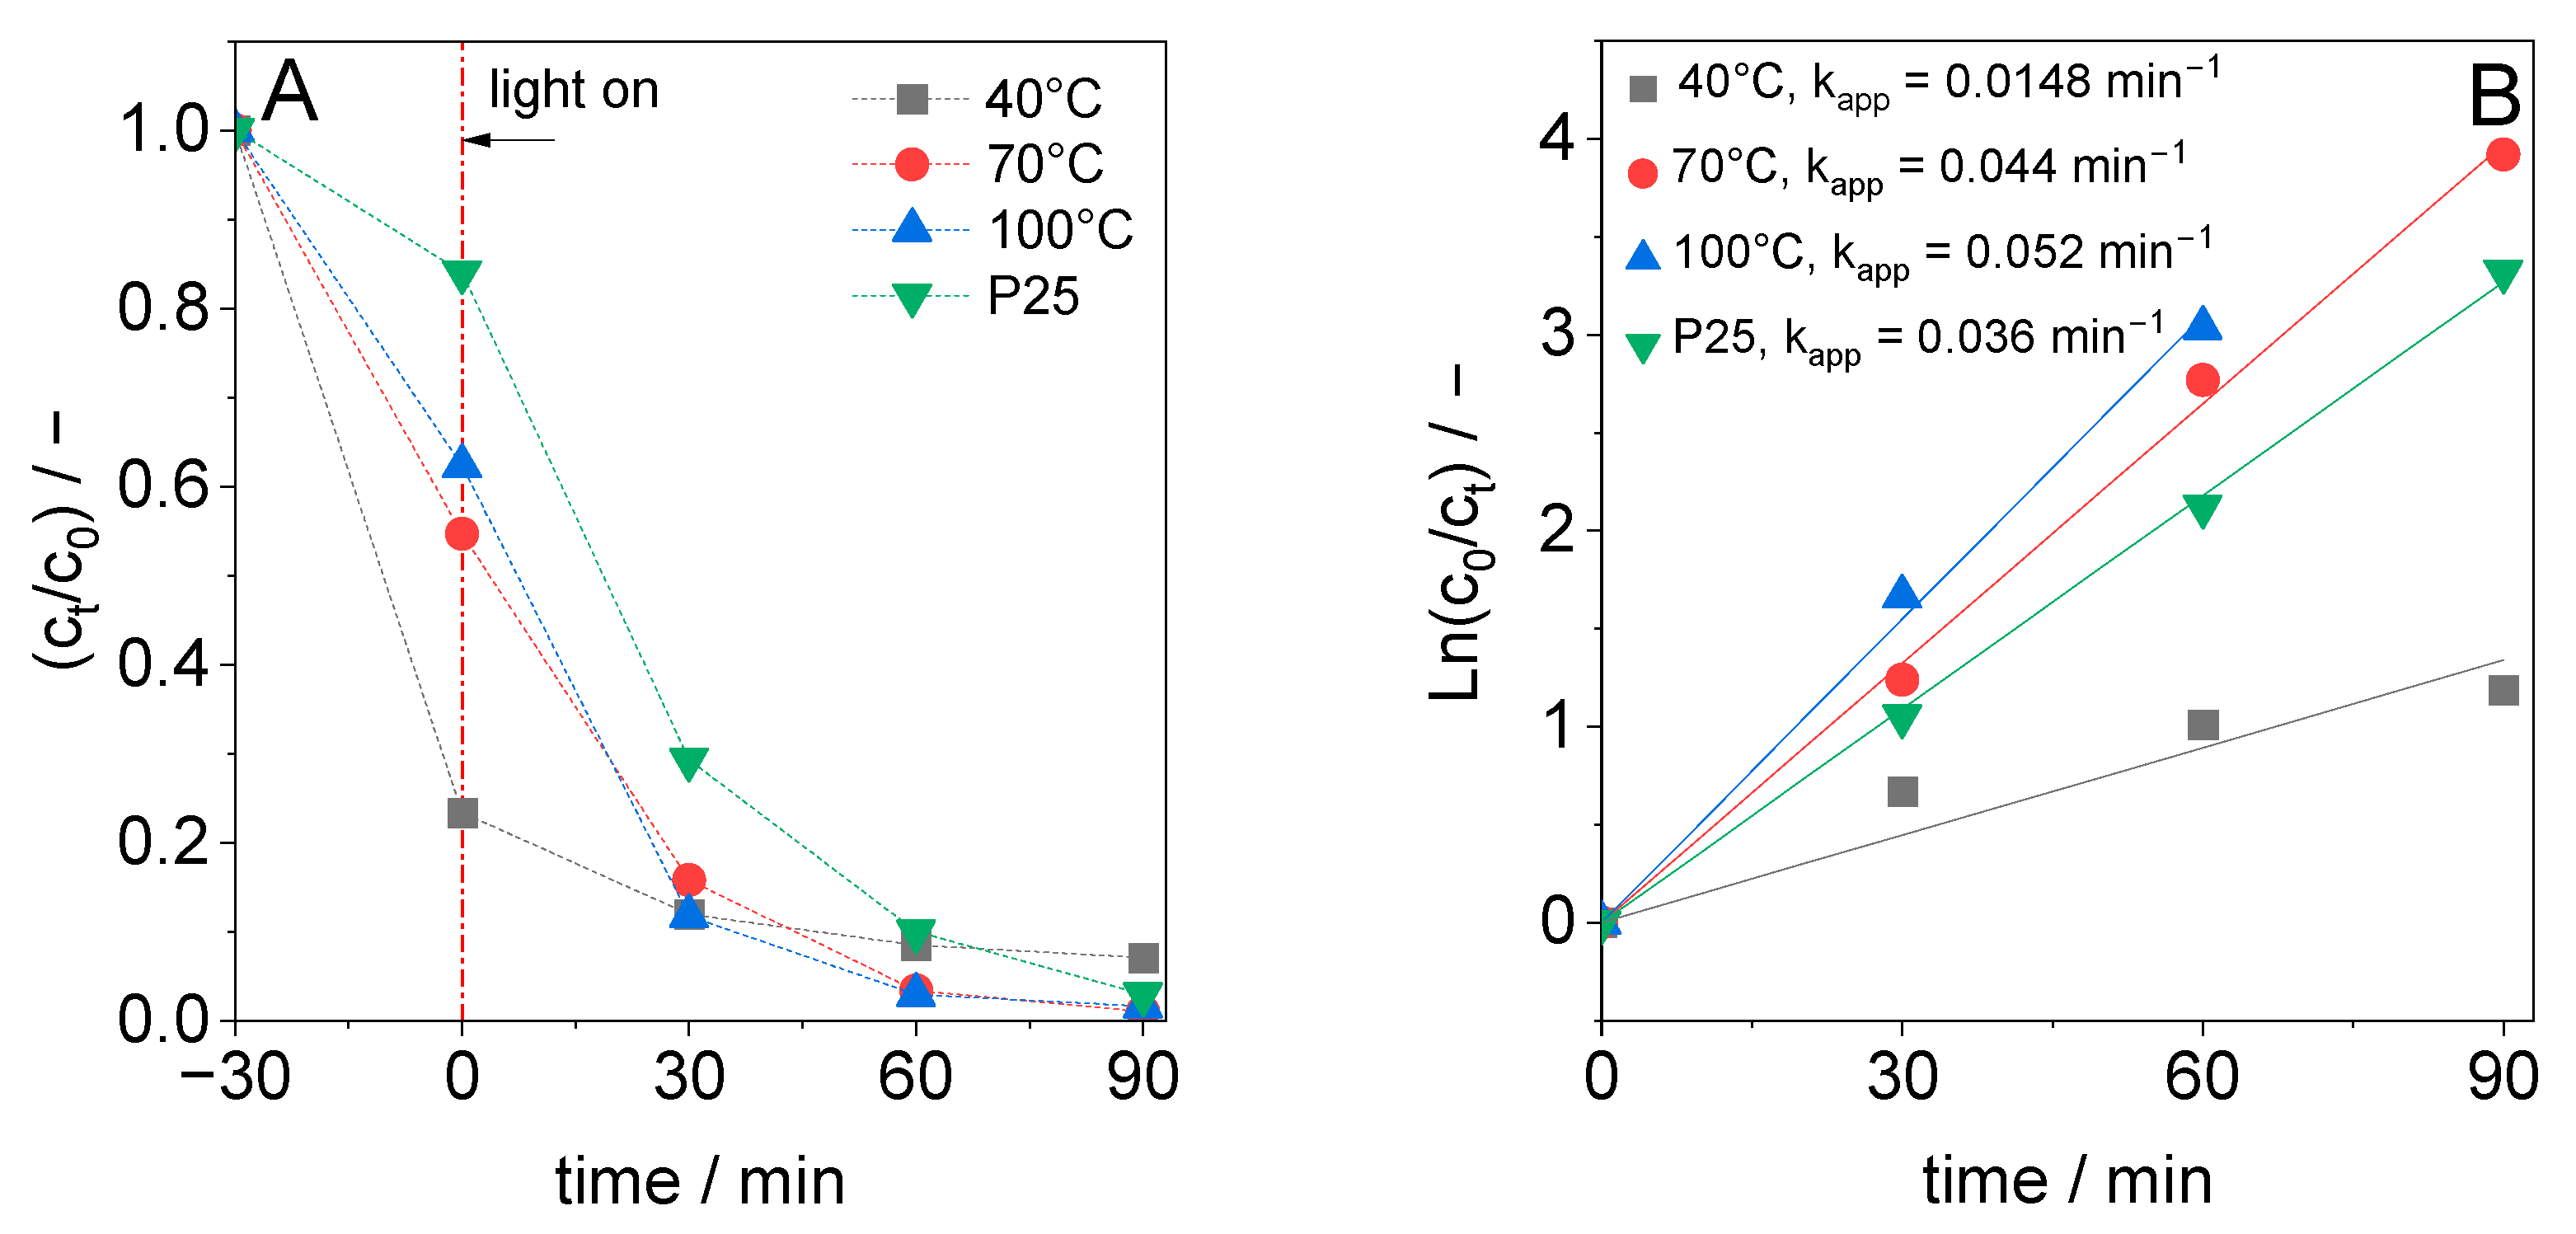
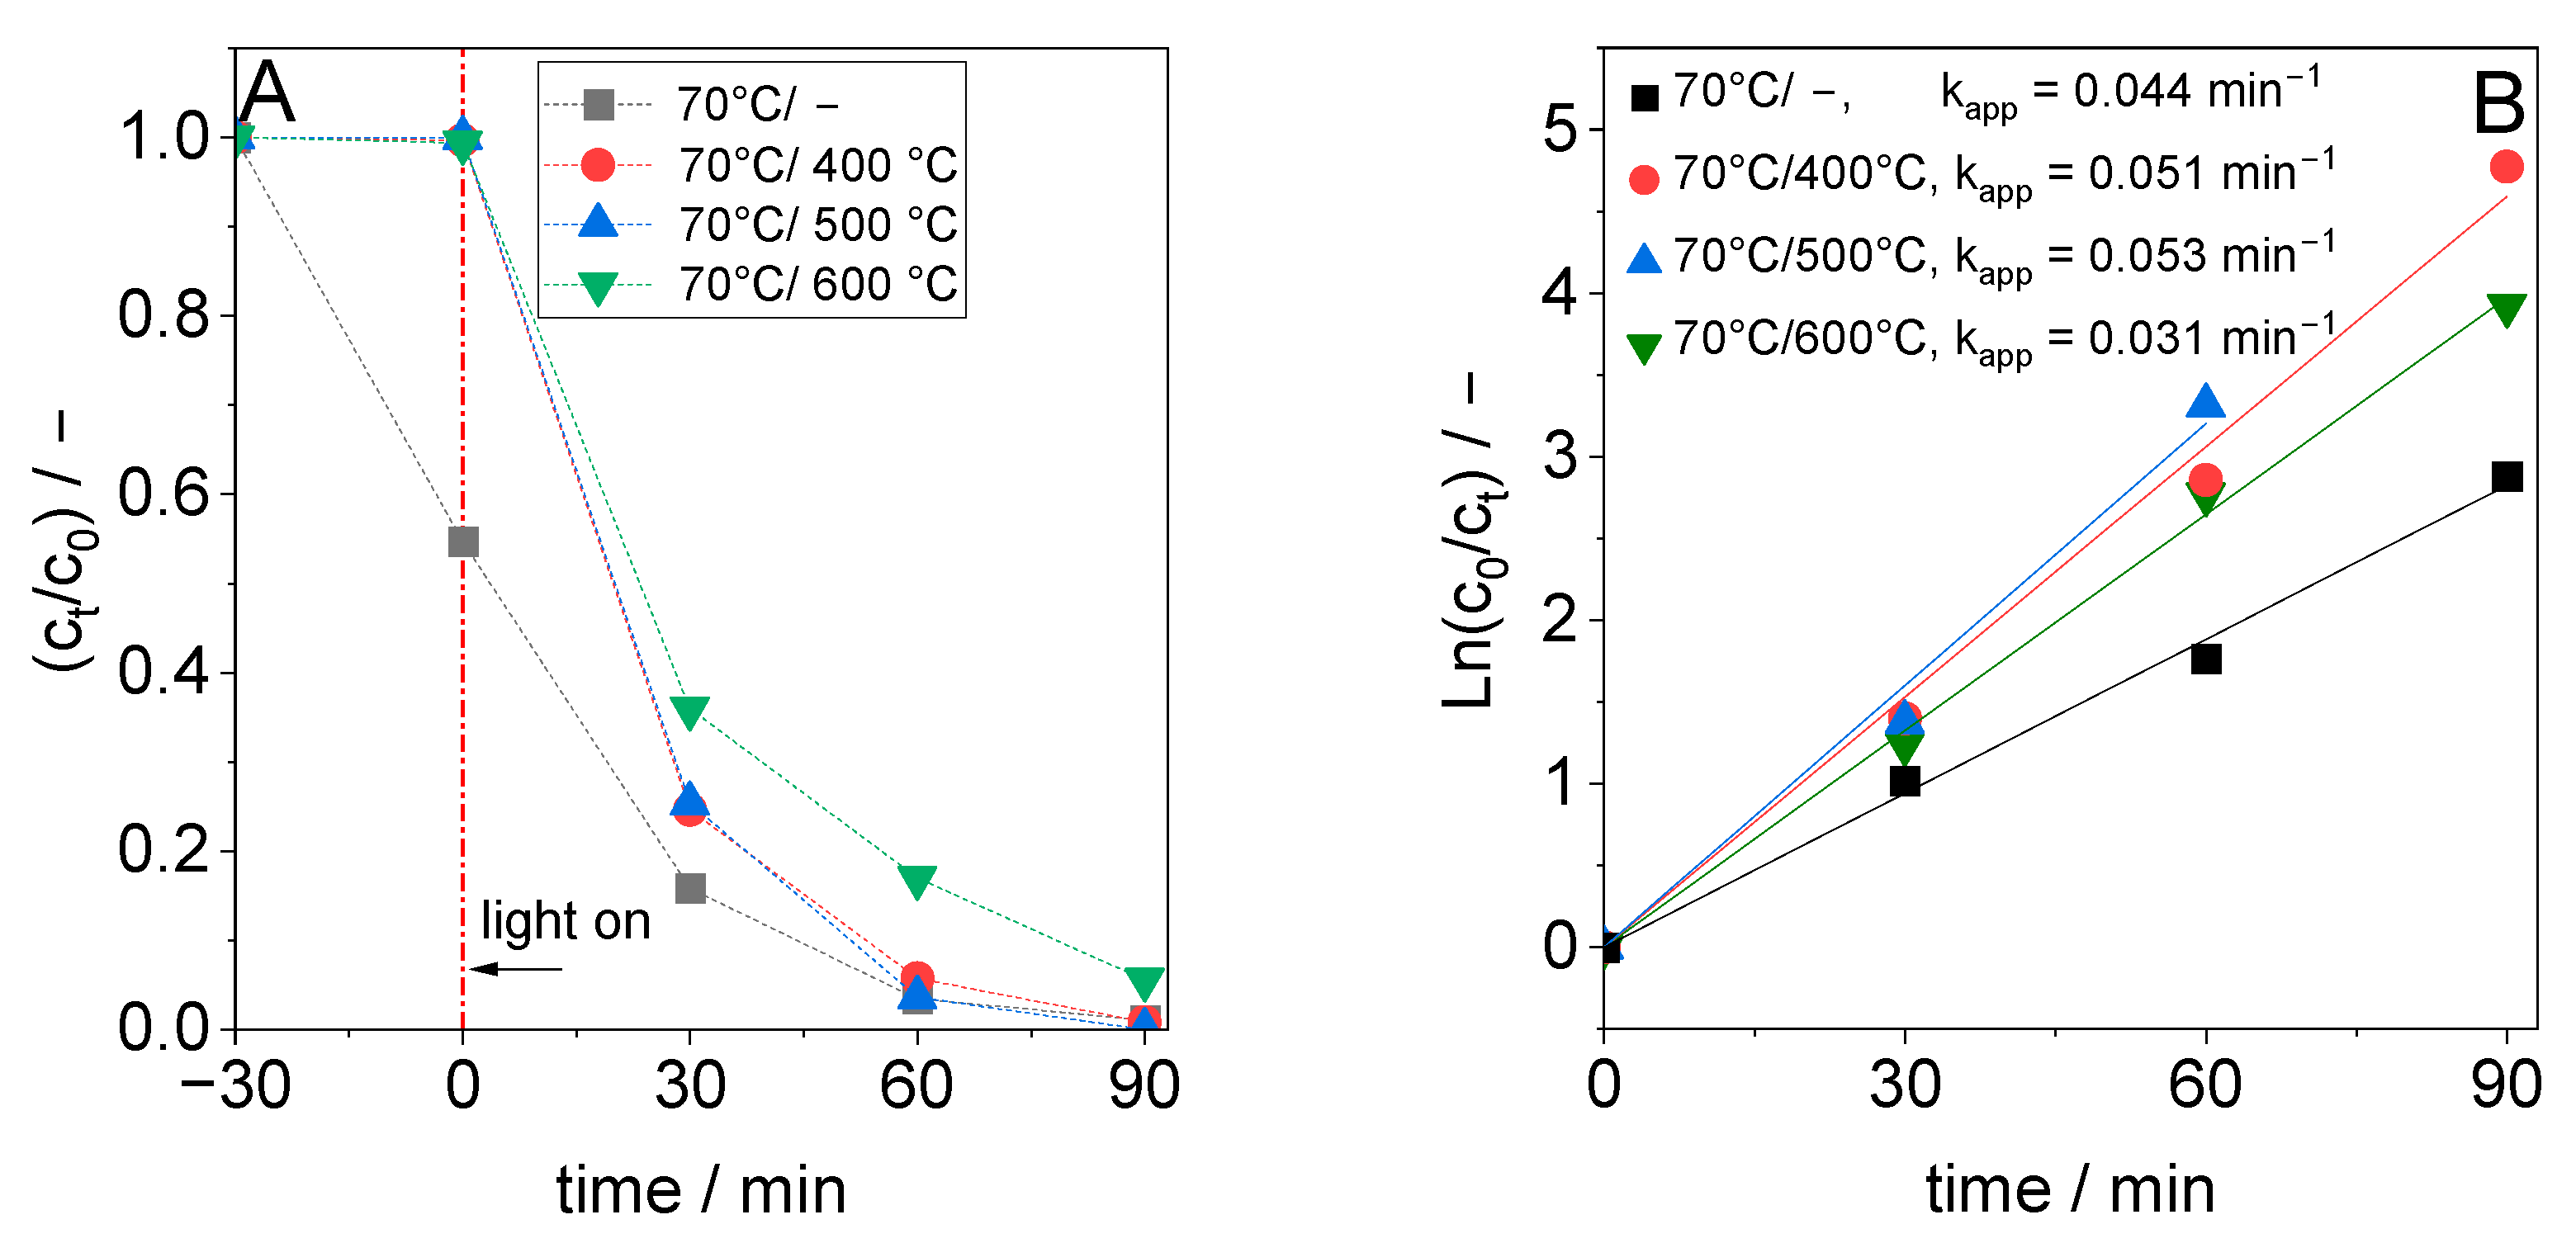
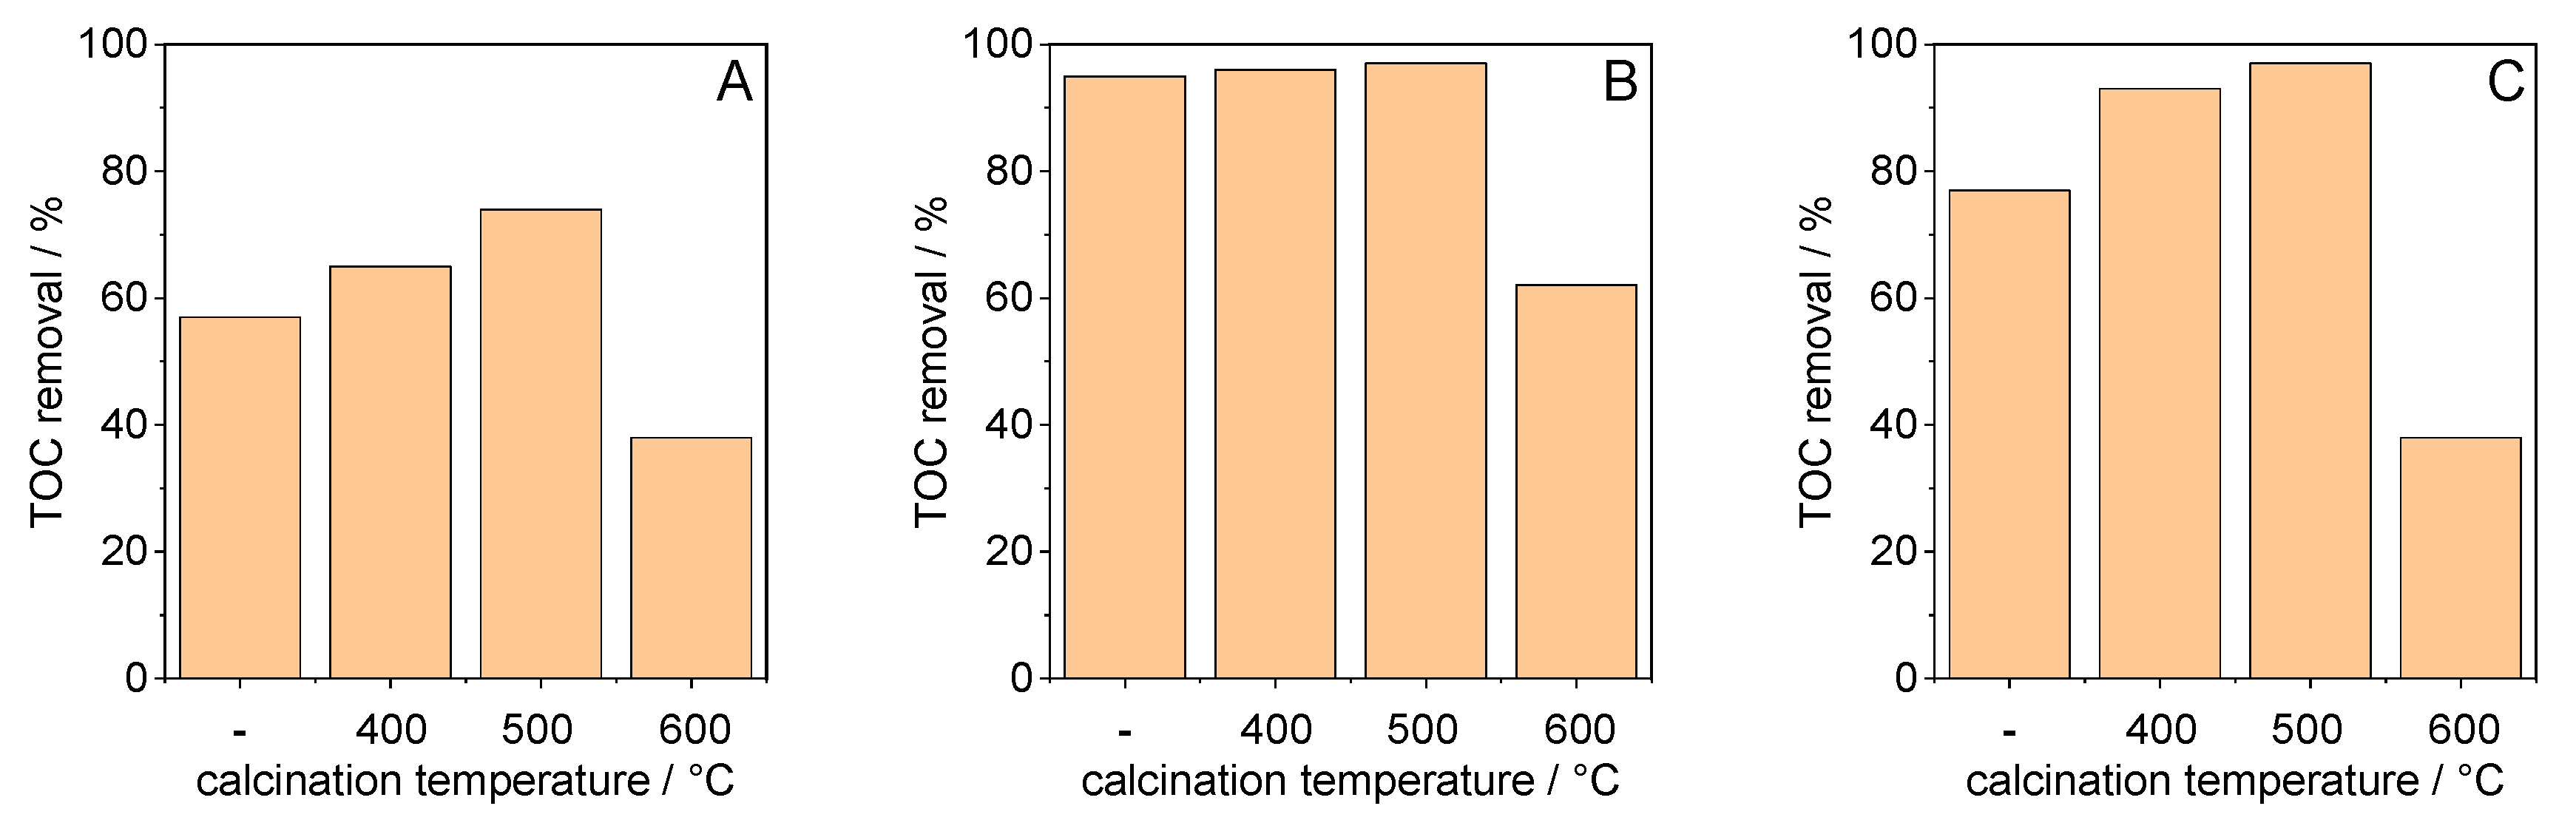
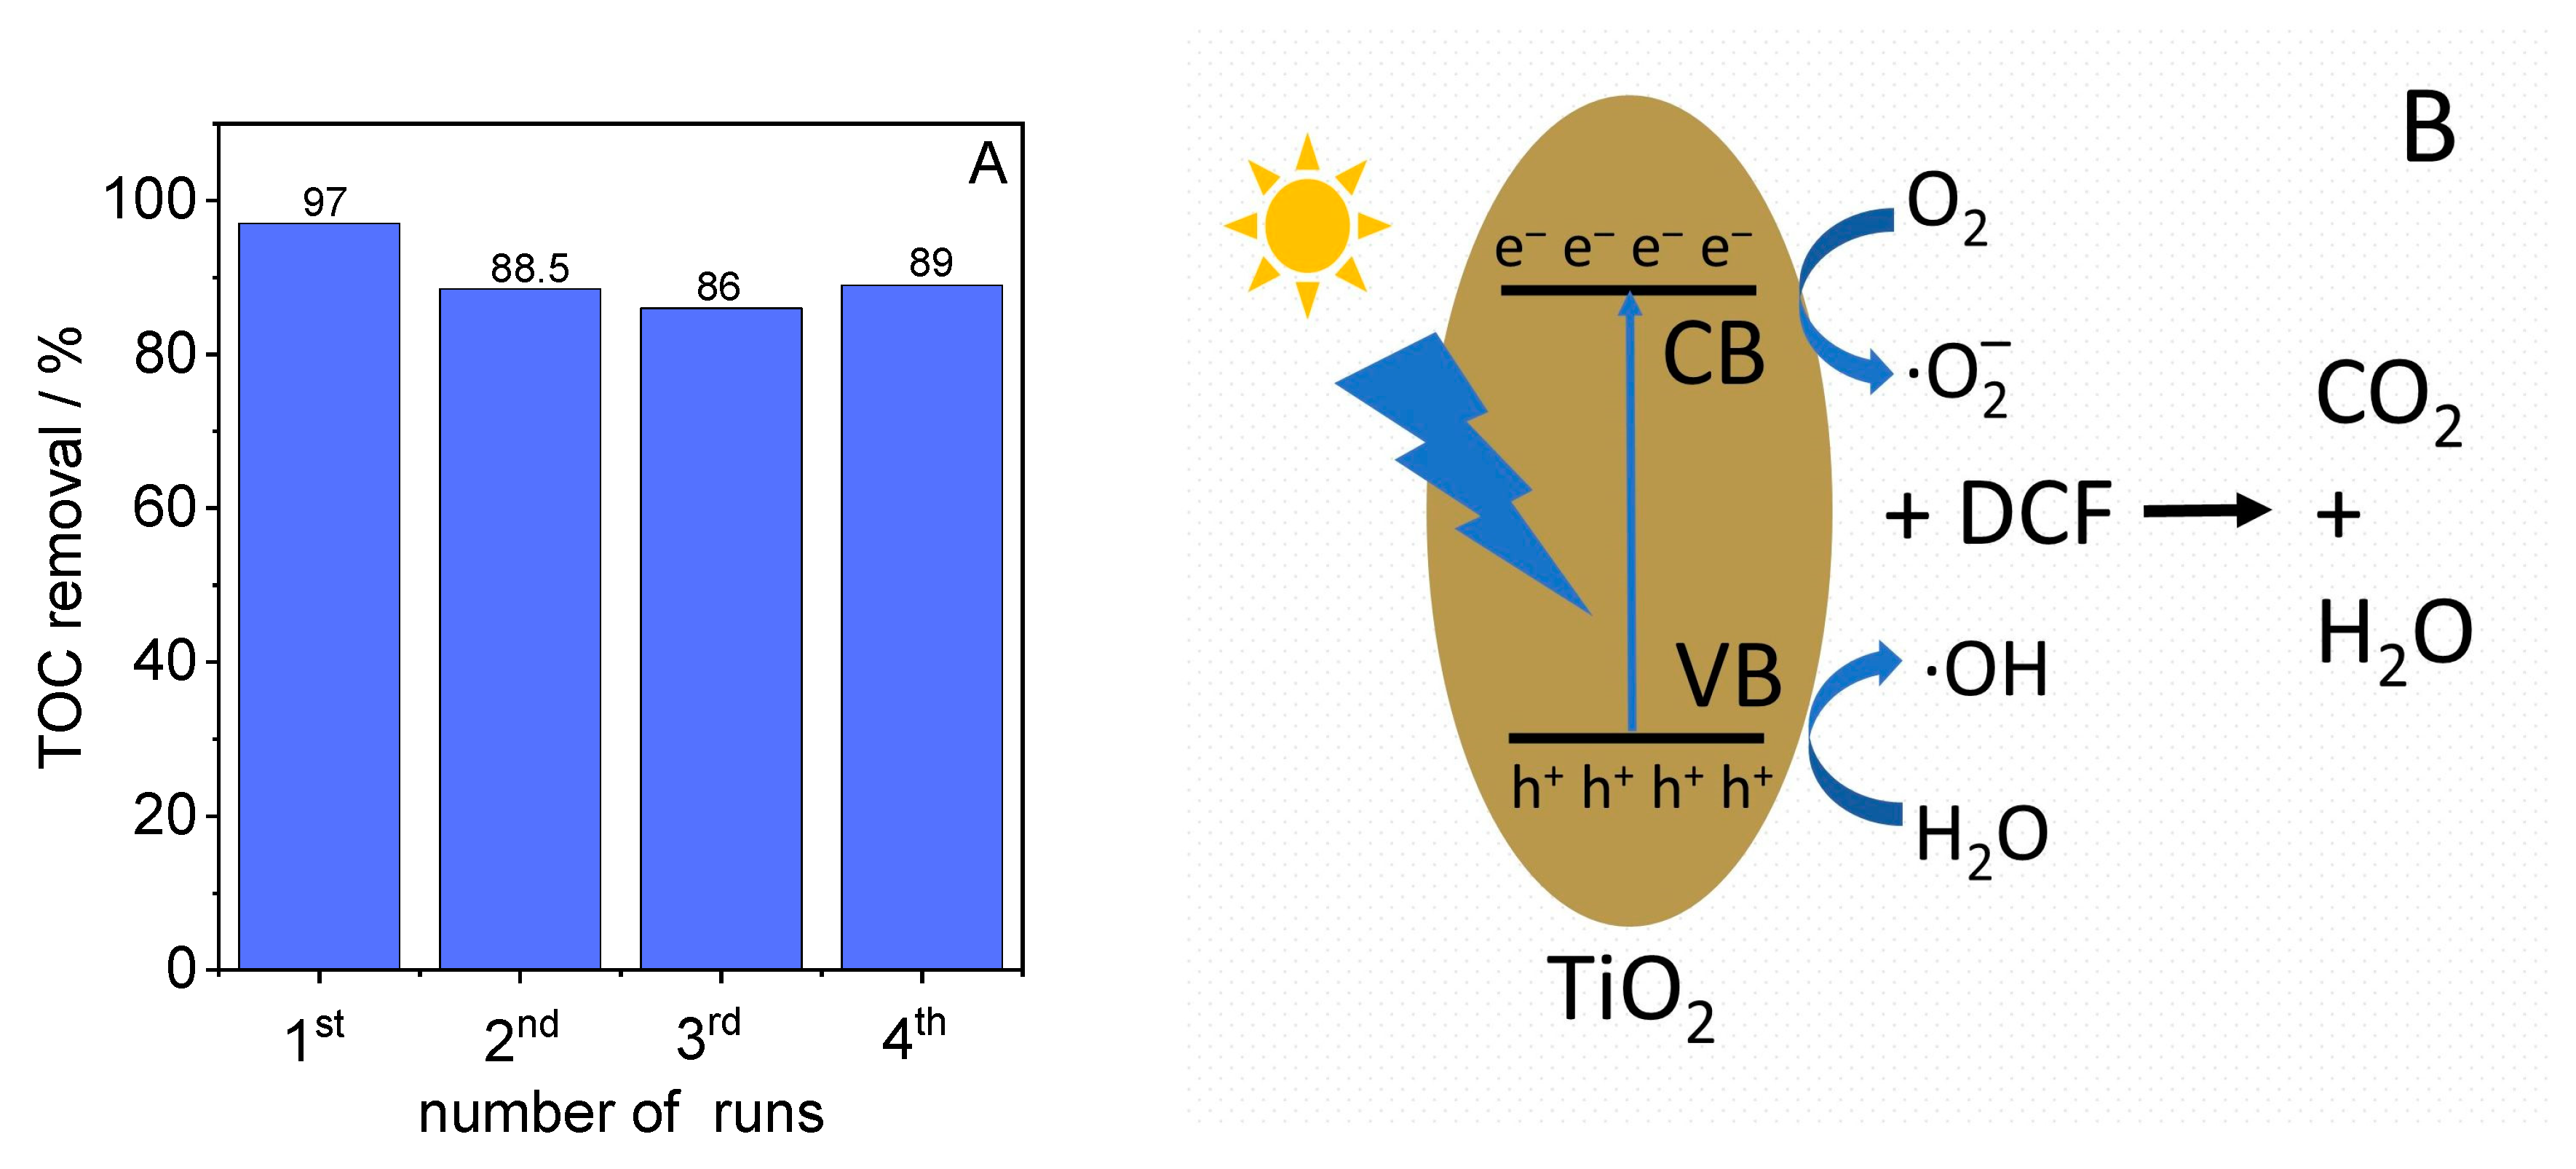
3.2. Photocatalytic Results

The uncalcined TiO2 samples showed both DCF adsorption and photocatalytic degradation (cf. Figure 5A). When the TiO2 was synthesized at 40 °C, about 75% of DCF was adsorbed within 30 min in the dark, but DCF adsorption dropped significantly when the synthesis temperature was raised to 70 °C or 100 °C. The reasons for the higher DCF adsorption of the material synthesized at 40 °C might be a high content of amorphous titanium dioxide, a low crystallinity of the TiO2 phase, and a high carbon content. A negative effect of the presence of an amorphous TiO2 phase on the photocatalytic activity has been already reported [33]. The photocatalytic DCF degradation activity of the samples synthesized at 70 °C or 100 °C is similar to that of P25, which also shows lower adsorption of DCF in the dark. The pseudo-first-order rate constant for photocatalytic DCF degradation estimated from a plot of ln(c0·ct−1) versus reaction time is presented in Figure 5B. The rate constant of DCF degradation increases with increasing sol–gel synthesis temperature, and for TiO2 synthesized at 70 °C and 100 °C, the estimated degradation rate constant was slightly higher than the rate constant obtained when using P25 TiO2 as the photocatalyst.
The impact of annealing temperature on DCF adsorption in the dark and degradation under light irradiation is shown in Figure 6A for TiO2 synthesized at 70 °C. After calcination at 400 °C, the TiO2 material lost its ability to adsorb DCF on its surface. On the other hand, the degradation rate of DCF in the calcined materials was significantly faster compared to the non-calcined sample. HPLC chromatograms of the reaction solution after different irradiation times using the sample calcined at 500 °C as the photocatalyst are shown in Figure S3. The chromatograms show a rapid decrease in the DCF signal with increasing irradiation time.
During the calcination step, in addition to the thermally induced TiO2 crystallization, carbon-containing groups will be removed [34]. It is assumed that with increasing crystallinity, the number of DCF adsorption sites decreases; however, the number of distorted lattice structures that act as charge trapping and/or recombination sites will also decrease [35]. In such cases, a higher number of photogenerated electrons and holes can reach the TiO2 surface and react with oxygen, surface hydroxyl groups, or adsorbed water molecules to produce highly reactive oxygen species like superoxide and hydroxyl radicals. This can be seen by the increased photocurrent when the material was calcined at up to 500 °C (Figure 4C). The comparable first-order rate constant for TiO2 calcined at 400 or 500 °C indicates that the photocatalytic activity of the TiO2 might be influenced not only by the charge carrier generation, recombination, and migration, but also by the number of available surface sites. The larger BET surface area of the sample calcined at 400 °C could at least partially compensate for the faster recombination of the generated charge carriers compared to the sample calcined at 500 °C. The pseudo-first-order degradation rate constant of anatase TiO2 calcined at 400 °C or 500 °C was 1.4- and 1.5-times higher than the degradation rate obtained in the presence of P25 TiO2 photocatalyst, respectively (Figure 6B).
Otherwise, too high a calcination temperature (600 °C) reduced the degradation activity significantly, although the photocurrent and the EIS radius were comparable to those of the sample calcined at 400 °C. A diametral effect of high calcination temperature on photocatalytic activity was reported previously [36]. After calcination at 600 °C, the BET surface area (17.9 m2·g−1) and pore volume were significantly smaller than those of the materials calcined at 400 or 500 °C (see Table 2), which significantly reduces the number of photocatalytically active surface sites. Another reason for the lower rate constant of DCF degradation could be the incipient formation of a rutile phase, which forms from the crystalline anatase phase at 600 °C and which cannot be detected with XRD due to its low content. In this case, sites of this newly formed phase could act as charge carrier traps and/or recombination centers and thus reduce the photocatalytic activity of the TiO2 calcined at 600 °C, despite the high crystallinity of the anatase phase.
Figure 7 compares the photocatalytic performance of materials synthesized at different temperatures but calcined under identical conditions at 500 °C. TiO2 samples synthesized at 70 °C or 100 °C exhibit higher activity after calcination than the sample synthesized at 40 °C. This confirmed that the formed TiO2 phase is only one of the factors responsible for the photocatalytic activity.
A further important parameter which is used to assess the photocatalytic performance of a photocatalyst is the pollutant mineralization, which describes the total oxidation of the pollutant to CO2 and H2O. The mineralization efficiency was established by comparing the TOC value of the starting solution with the TOC content obtained after 120 min of irradiation. The results presented in Figure 8A–C demonstrate that the DCF mineralization is affected by the synthesis temperature as well as by the applied calcination temperature. For materials which were not calcined, the reduction in TOC content resulted from DCF adsorption as well as from its photocatalytic degradation. Although the calcined materials had largely lost the ability to adsorb DCF, the materials calcined at up to 500 °C had a higher TOC removal rate than the uncalcined samples, indicating faster mineralization, which is caused by photocatalytically initiated reactions and not by adsorption. When the material was synthesized at 70 °C, a high mineralization efficiency was observed for the uncalcined sample (95%). The highest mineralization (97%) was observed for TiO2 which was synthesized at 70 °C or 100 °C and calcined at 500 °C. Interestingly, the lower BET surface area of the material calcined at 500 °C compared to that calcined at 400 °C (see Table 2) indicates that this parameter alone does not determine the photocatalytic performance of the anatase phase. Independent on the synthesis temperature, a calcination at 600 °C led to a significant decrease in TOC removal.
Finally, the photocatalytic stability of the formed anatase phase for the degradation of DCF was examined using the material synthesized at 70 °C and calcined at 500 °C. For this reason, the mineralization was observed in four consecutive runs. Between each run, the catalyst was washed with water. As shown in Figure 9A, the degree of mineralization decreased slightly by about 10% from the first to the second run and remained constant in the three subsequent runs, indicating that the material has good photocatalytic stability for the degradation and mineralization of DCF under the applied conditions.
The proposed mechanism for DCF degradation across TiO2 upon irradiation with simulated sunlight is shown in Figure 9B. By irradiating with light with an energy equal to or greater than the band gap of TiO2, electrons are transferred from the valence band (VB) of TiO2 to its conduction band (CB), creating positively charged holes in its valence band. The reaction of these electrons and holes with dissolved oxygen or water molecules forms reactive oxygen-containing species (superoxide radicals (⋅O2) and hydroxyl radicals (⋅OH)), which degrade DCF and its formed intermediates into CO2 and water.

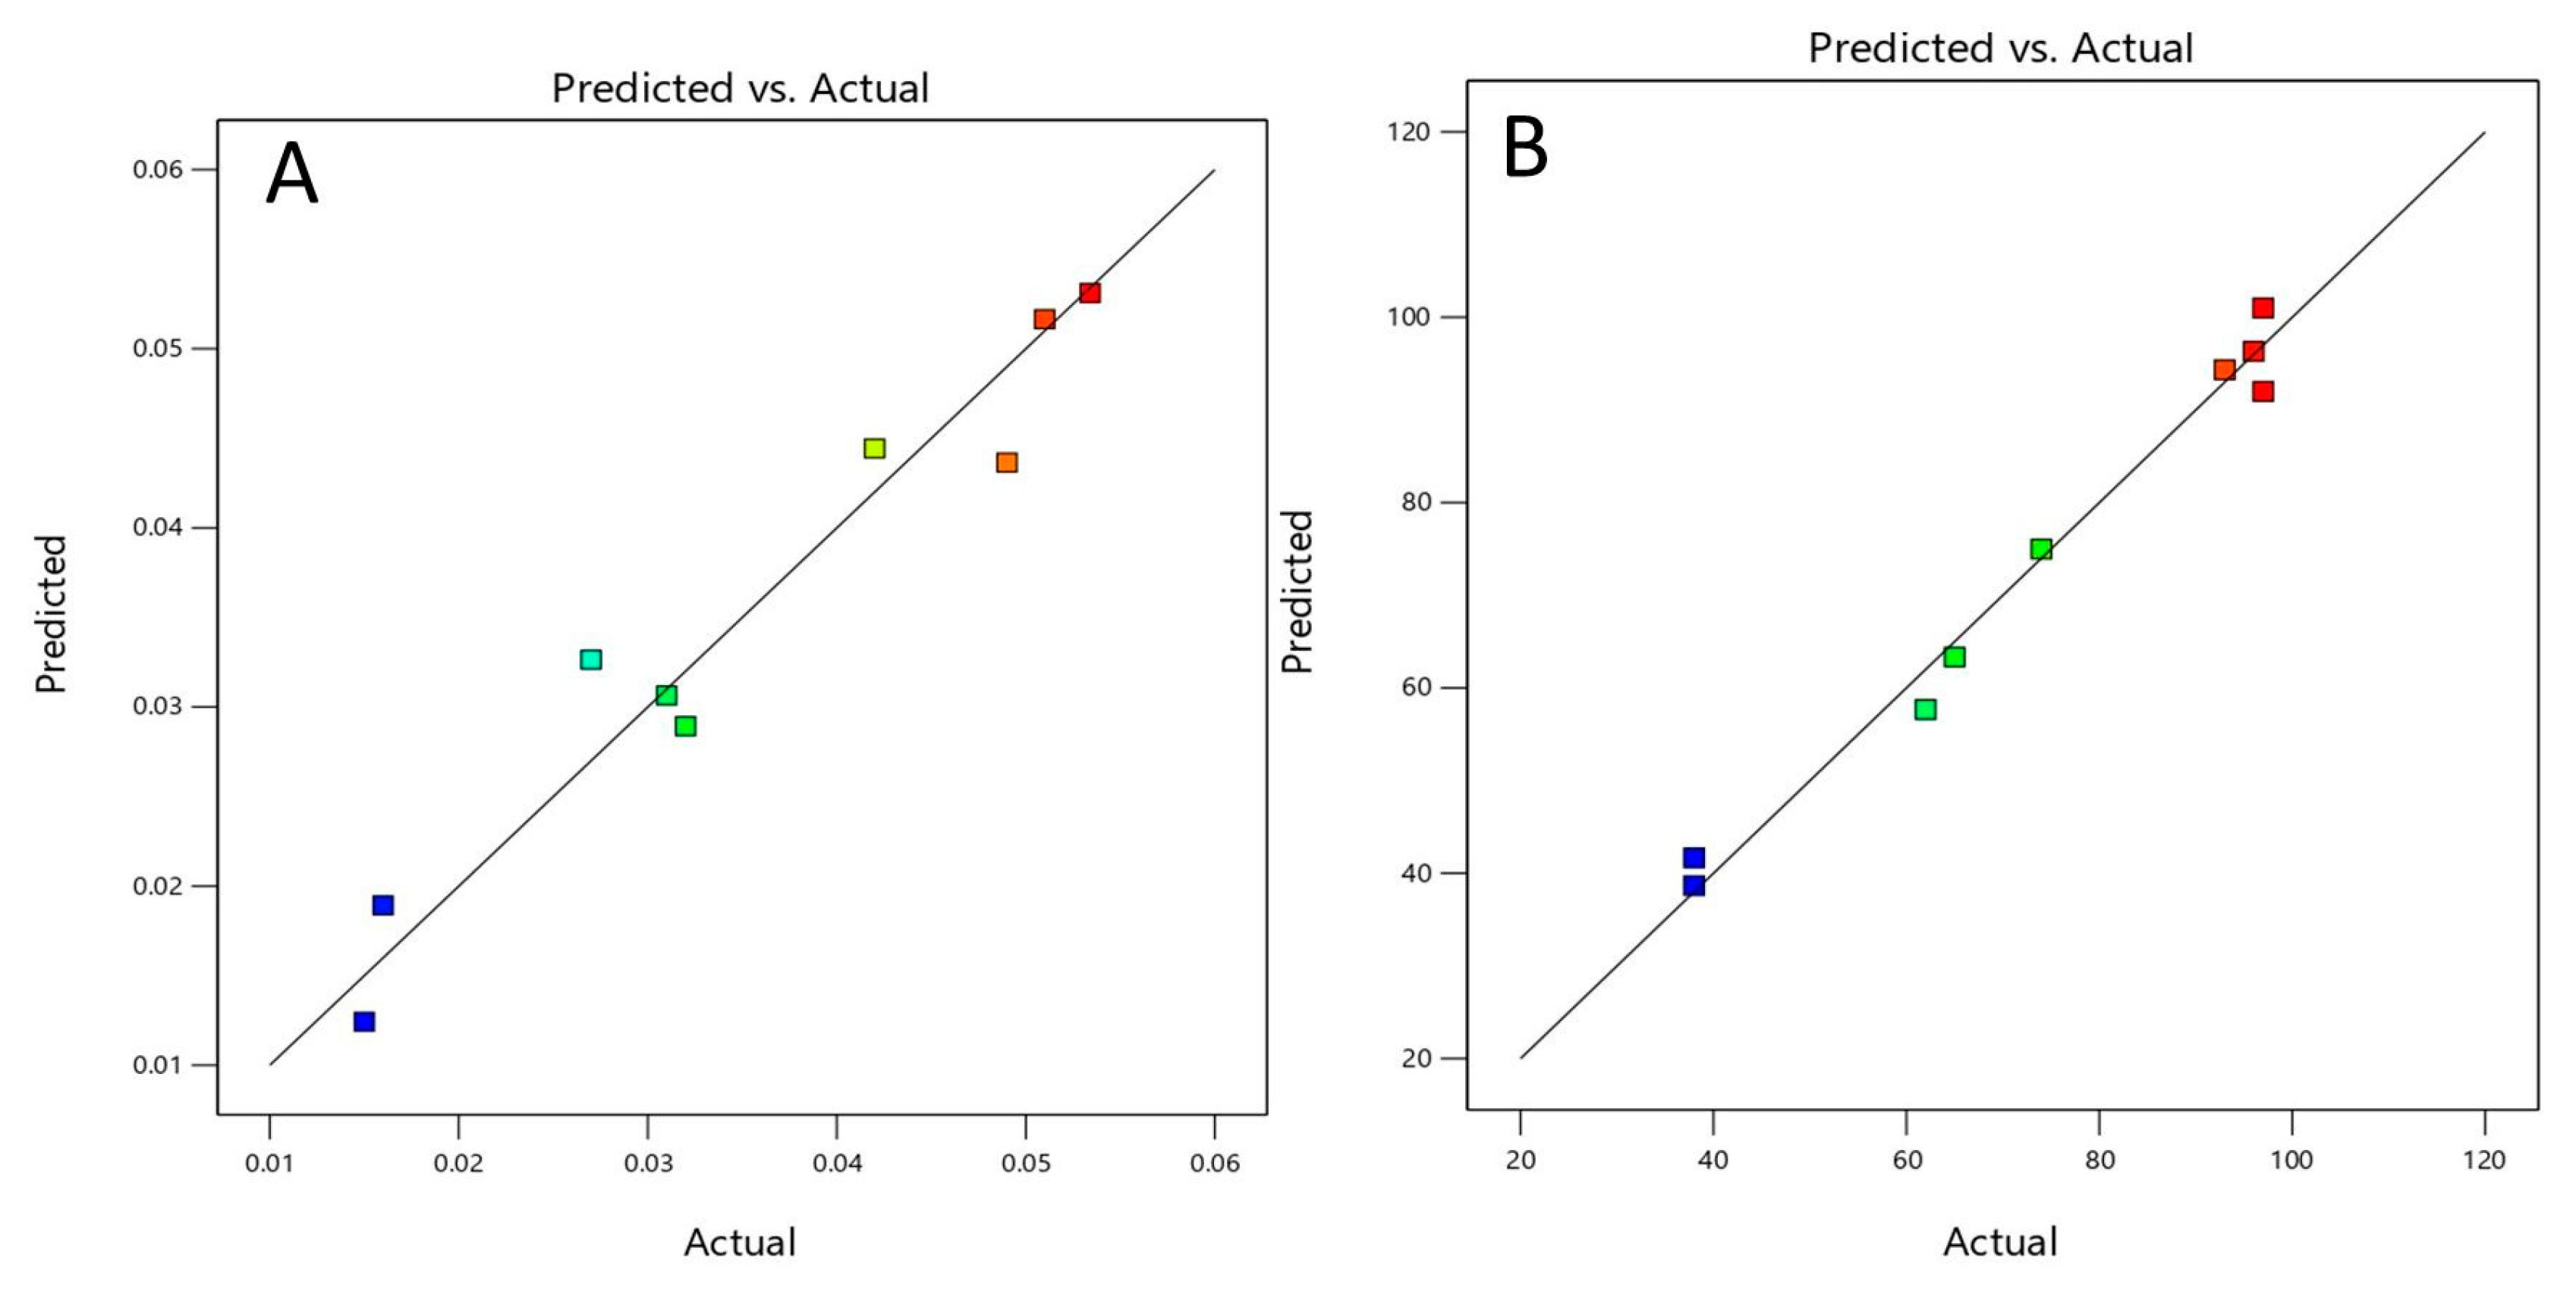
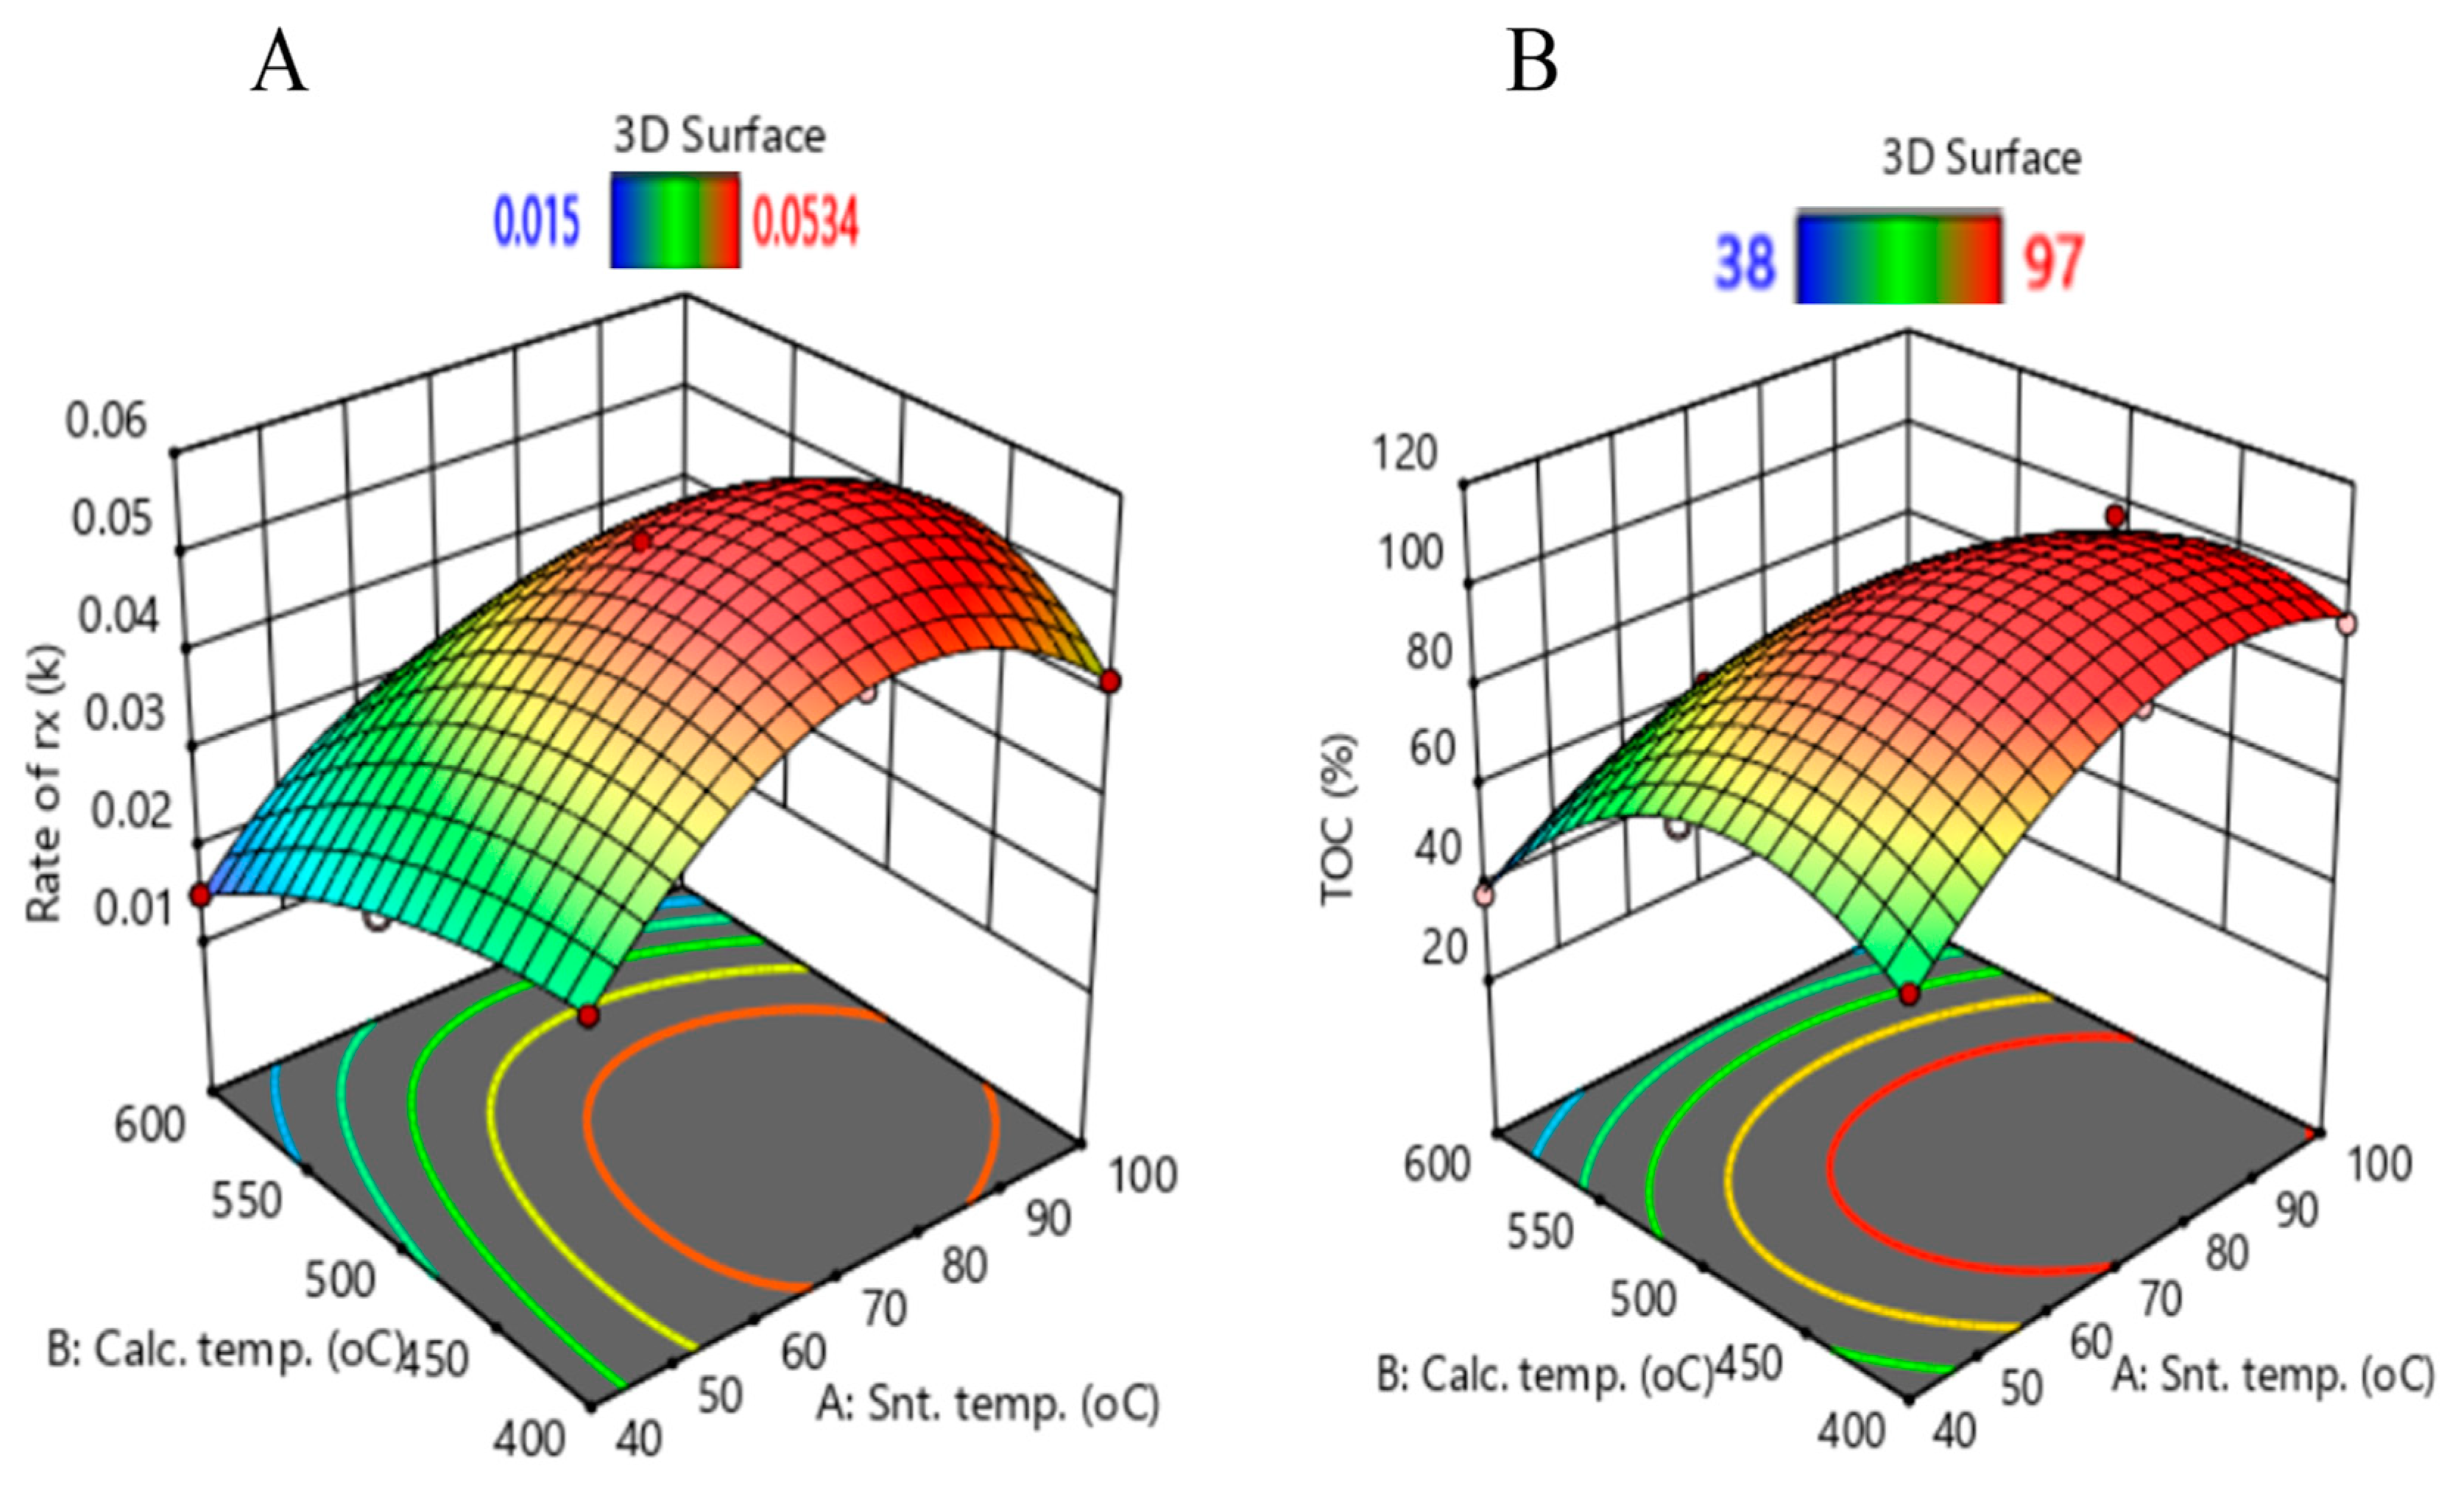
3.3. Results of the RSM Model

In this section, statistical methods are applied to find the optimal synthesis parameters leading to a TiO2 photocatalyst with the highest performance regarding DCF decay and mineralization. Using the optimal custom design model Version 13.0.5.0, the synthesis temperature and the calcination temperature were used as input variables (A) and (B), respectively. Four different models were applied, but only the quadratic model fit the pseudo-first-order DCF degradation rate and TOC removal, as shown in Tables S1 and S2, respectively. Statistic parameters obtained from data fitting for the quadratic model are summarized in Table 3. For the pseudo-first-order DCF degradation rate, the predicted R2 (0.440) is relatively low compared to the adjusted R2 of 0.877, i.e., the difference is greater than 0.2. Such a difference might result from large block effects [37]. The Adeq precision value (10.101), which measures the signal to noise ratio, is higher than 4, indicating an adequate signal [37]. For TOC removal, the predicted R2 of 0.831 is still in reasonable agreement with the adjusted R2 of 0.955, i.e., the difference is less than 0.2, the Adeq precision value (the signal to noise ratio) is 14.846, indicating an adequate signal for this parameter as well. The statistic parameters indicate that the quadratic model can predict both parameters inside the chosen region.
The obtained quadratic equations for the pseudo-first-order rate constant and TOC removal are presented in Equations (9) and (10). A comparison between the experimental and predicted values obtained with these equations is presented in Table 4. The quadratic equation fits TOC removal better than the first-order DCF degradation rate constant, as shown in Figure 10 (A = synthesis temperature; B = calcination temperature). The reason for the poorer fitting of the rate constant could be that the number of collected data points was too small to determine the rate constant with the required accuracy. However, a compromise usually must be found between the required experimental effort and the quality of the experimental results. Tables S3 and S4 show that not all factors in Equations (9) and (10) have the same significance. In both models, the factor AB shows the lowest significance, whereas, in general, the significance of the factors for the equation describing the TOC removal is higher.
        k = 0.314124 + 2.886 × 10 3 A + 1.144 × 10 3 B 7.5 × 10 7 A B 1.7 × 10 5 A 2 1.19667 × 10 6 B 2
    T O C = 599.11111 + 4.17222 A + 2.37000 B 0.002333 A B 0.019444 A 2 0.002400 B 2
Figure 11 shows 3D surface plots which include the calcination and synthesis temperature interactions with the rate of DCF degradation and degree of TOC removal. Synthesis temperatures greater than 70 °C and calcination temperatures between 400 °C and 500 °C are necessary to prepare anatase TiO2 which is photocatalytically active under solar irradiation. Contour plots showing the synthesis parameters leading to a highly active anatase photocatalyst are presented in Figures S4 and S5.
Finally, the model was used to predict an optimal synthesis temperature and calcination temperature to form a catalyst with an anatase phase showing the highest DFC degradation rate and mineralization efficiency. An optimal synthesis temperature of 71 °C and an optimal calcination temperature of 440 °C were suggested by the model, leading to a DCF decay rate of 0.055 min−1 and a mineralization rate of 100%. A new catalyst was synthesized with these parameters and tested in the DFC degradation process. The DFC degradation rate obtained with this new catalyst was slightly faster (0.063 min−1) than predicted and the TOC removal rate was 97%, slightly lower than the predicted value.

4. Conclusions

With the applied acid-assisted sol–gel method, a pure anatase TiO2 phase with reasonable photocatalytic properties can be prepared in a facile and reproducible manner. With the obtained materials, DCF can be almost completely mineralized within 120 min via irradiation with simulated sunlight. The photocatalytic activity of the anatase phase for the degradation and mineralization of DCF depends on the temperature of the acid-assisted sol–gel process and the calcination temperature. Both parameters affect the electronic (e.g., charge carrier separation and migration) as well as structural (e.g., crystallinity and BET surface area) properties of the formed TiO2 phase. To obtain TiO2 with high photocatalytic activity for the degradation of pollutants, these properties should be effectively balanced.
Using an RSM model, the optimal synthesis and calcination temperatures for photocatalytic DCF degradation and mineralization can be predicted. Moreover, the predicted optimal values correspond well with the values that were determined experimentally. The obtained results are considered as a basis for the development of composite materials based on an anatase phase that photocatalytically degrades pollutants with higher efficiency compared to a pure anatase phase.

Supplementary Materials

The following supporting information can be downloaded at: https://www.mdpi.com/article/10.3390/app15031401/s1. Figure S1: Scheme of TiO2 synthesis; Figure S2: EDX results of TiO2 synthesized at 70 °C and calcined at 400, 500, and 600 °C; Figure S3: Plot of HPLC chromatograms; Figure S4: Contour of actual factor coding for the rate constant; Figure S5: Contour of actual factor coding for the TOC decomposition; Table S1: Comparison of results for the rate constant using different models; Table S2: Comparison of results for the TOC removal using different models; Table S3: ANOVA result for the rate constant; Table S4: ANOVA result for the TOC decomposition.

Author Contributions

Conceptualization, D.A.A. and N.S.; methodology, D.A.A.; software, D.A.A.; validation, D.A.A. and N.S.; investigation, D.A.A., H.L. and T.T.H.D.; resources, N.S.; data curation, D.A.A.; writing—original draft preparation, D.A.A.; writing—review and editing, D.A.A., H.L. and N.S.; visualization, N.S. and D.A.A.; supervision N.S., J.S. and F.F.; project administration, N.S. and J.S.; funding acquisition, J.S. All authors have read and agreed to the published version of the manuscript.

Funding

This research received no external funding.

Institutional Review Board Statement

Not applicable.

Informed Consent Statement

Not applicable.

Data Availability Statement

Data are available from the authors based on reasonable requirements from the reader.

Acknowledgments

Desalegn Akuma thanks the EXiST project (Ethiopia Center of Excellency in Science and Technology, funding code 51235) and the Leibniz Institute for Catalysis (LIKAT Rostock) for their financial support. The help by Felix Lorenz (BET), Kathleen Schubert (XRD), Tim Peppel (SEM), and Michael Sebek (experimental work) is gratefully acknowledged.

Conflicts of Interest

The authors declare no conflicts of interest.

References

  1. Boretti, A.; Rosa, L. Reassessing the projections of the world water development report. NPJ Clean Water 2019, 2, 15. [Google Scholar] [CrossRef]
  2. Dandesa, B.; Akuma, D.A.; Alemayehu, E. Water purification improvement using moringa oleifera seed extract pastes for coagulation follow scoria filtration. Heliyon 2023, 9, e17420. [Google Scholar] [CrossRef]
  3. Pratyusha, K.; Gaikwad, N.M.; Phatak, A.; Chaudhari, P. Review on: Waste material management in pharmaceutical industry. Int. J. Pharm. Sci. Rev. Res. 2012, 16, 121–129. [Google Scholar]
  4. Ahammad, N.A.; Ahmad, M.A.; Hameed, B.H.; Mohd Din, A.T. A mini review of recent progress in the removal of emerging contaminants from pharmaceutical waste using various adsorbents. Environ. Sci. Pollut. Res. 2023, 30, 124459–124473. [Google Scholar] [CrossRef]
  5. Younas, F.; Mustafa, A.; Farooqi, Z.U.R.; Wang, X.; Younas, S.; Mohy-Ud-Din, W.; Ashir Hameed, M.; Mohsin Abrar, M.; Maitlo, A.A.; Noreen, S. Current and emerging adsorbent technologies for wastewater treatment: Trends, limitations, and environmental implications. Water 2021, 13, 215. [Google Scholar] [CrossRef]
  6. Saravanan, A.; Kumar, P.S.; Jeevanantham, S.; Karishma, S.; Tajsabreen, B.; Yaashikaa, P.; Reshma, B. Effective water/wastewater treatment methodologies for toxic pollutants removal: Processes and applications towards sustainable development. Chemosphere 2021, 280, 130595. [Google Scholar] [CrossRef]
  7. Deegan, A.; Shaik, B.; Nolan, K.; Urell, K.; Oelgemöller, M.; Tobin, J.; Morrissey, A. Treatment options for wastewater effluents from pharmaceutical companies. Int. J. Environ. Sci. Technol. 2011, 8, 649–666. [Google Scholar] [CrossRef]
  8. Malato, S.; Fernández-Ibáñez, P.; Maldonado, M.I.; Blanco, J.; Gernjak, W. Decontamination and disinfection of water by solar photocatalysis: Recent overview and trends. Catal. Today 2009, 147, 1–59. [Google Scholar] [CrossRef]
  9. Pavel, M.; Anastasescu, C.; State, R.-N.; Vasile, A.; Papa, F.; Balint, I. Photocatalytic degradation of organic and inorganic pollutants to harmless end products: Assessment of practical application potential for water and air cleaning. Catalysts 2023, 13, 380. [Google Scholar] [CrossRef]
  10. Vinayagam, V.; Palani, K.N.; Ganesh, S.; Rajesh, S.; Akula, V.V.; Avoodaiappan, R.; Kushwaha, O.S.; Pugazhendhi, A. Recent developments on advanced oxidation processes for degradation of pollutants from wastewater with focus on antibiotics and organic dyes. Environ. Res. 2024, 240, 117500. [Google Scholar] [CrossRef]
  11. Pandis, P.K.; Kalogirou, C.; Kanellou, E.; Vaitsis, C.; Savvidou, M.G.; Sourkouni, G.; Zorpas, A.A.; Argirusis, C. Key points of advanced oxidation processes (AOPs) for wastewater, organic pollutants and pharmaceutical waste treatment: A mini review. ChemEngineering 2022, 6, 8. [Google Scholar] [CrossRef]
  12. Saravanan, A.; Kumar, P.S.; Jeevanantham, S.; Anubha, M.; Jayashree, S. Degradation of toxic agrochemicals and pharmaceutical pollutants: Effective and alternative approaches toward photocatalysis. Environ. Pollut. 2022, 298, 118844. [Google Scholar] [CrossRef] [PubMed]
  13. Velempini, T.; Prabakaran, E.; Pillay, K. Recent developments in the use of metal oxides for photocatalytic degradation of pharmaceutical pollutants in water—A review. Mater. Today Chem. 2021, 19, 100380. [Google Scholar] [CrossRef]
  14. Madkhali, N.; Prasad, C.; Malkappa, K.; Choi, H.Y.; Govinda, V.; Bahadur, I.; Abumousa, R. Recent update on photocatalytic degradation of pollutants in waste water using TiO2-based heterostructured materials. Results Eng. 2023, 17, 100920. [Google Scholar] [CrossRef]
  15. Fujishima, A.; Zhang, X.; Tryk, D.A. TiO2 photocatalysis and related surface phenomena. Surf. Sci. Rep. 2008, 63, 515–582. [Google Scholar] [CrossRef]
  16. Dambournet, D.; Belharouak, I.; Amine, K. Tailored preparation methods of TiO2 anatase, rutile, brookite: Mechanism of formation and electrochemical properties. Chem. Mater. 2010, 22, 1173–1179. [Google Scholar] [CrossRef]
  17. Katal, R.; Masudy-Panah, S.; Tanhaei, M.; Farahani, M.H.D.A.; Jiangyong, H. A review on the synthesis of the various types of anatase TiO2 facets and their applications for photocatalysis. Chem. Eng. J. 2020, 384, 123384. [Google Scholar] [CrossRef]
  18. Lekphet, W.; Ke, T.-C.; Su, C.; Kathirvel, S.; Sireesha, P.; Akula, S.B.; Li, W.-R. Morphology control studies of TiO2 microstructures via surfactant-assisted hydrothermal process for dye-sensitized solar cell applications. Appl. Surf. Sci. 2016, 382, 15–26. [Google Scholar] [CrossRef]
  19. You, Y.; Xu, C.; Xu, S.; Cao, S.; Wang, J.; Huang, Y.; Shi, S.-Q. Structural characterization and optical property of TiO2 powders prepared by the sol–gel method. Ceram. Int. 2014, 40, 8659–8666. [Google Scholar] [CrossRef]
  20. Han, H.; Jang, J.U.; Oh, D.; Na, K.-H.; Choi, W.-Y.; Jayakrishnan, N.; Nayak, A.K. Advances and Perspectives of Titanium-Based Nanocomposites for Energy Generation and Environmental Remediation Applications: A Review. Energy Fuels 2023, 37, 17708–17735. [Google Scholar] [CrossRef]
  21. Quintero, Y.; Mosquera, E.; Diosa, J.; García, A. Ultrasonic-assisted sol–gel synthesis of TiO2 nanostructures: Influence of synthesis parameters on morphology, crystallinity, and photocatalytic performance. J. Sol.-Gel Sci. Technol. 2020, 94, 477–485. [Google Scholar] [CrossRef]
  22. Leyva-Porras, C.; Toxqui-Teran, A.; Vega-Becerra, O.; Miki-Yoshida, M.; Rojas-Villalobos, M.; García-Guaderrama, M.; Aguilar-Martínez, J. Low-temperature synthesis and characterization of anatase TiO2 nanoparticles by an acid assisted sol–gel method. J. Alloys Compd. 2015, 647, 627–636. [Google Scholar] [CrossRef]
  23. Sebek, M.; Krake, E.F.; Baumann, W.; Strunk, J.; Steinfeldt, N. Effect of atmosphere and relative humidity on photodegradation of clopidogrel under artificial solar and indoor light irradiation. J. Pharm. Biomed. Anal. 2023, 234, 115506. [Google Scholar] [CrossRef]
  24. Acar, Z.Y.; Asiltürk, M. An investigation on the influence of hydrolysis ratio and base type on the characterization of synthesised nano-TiO2 by using sol–gel method. J. Nanopart. Res. 2022, 24, 162. [Google Scholar] [CrossRef]
  25. Yoldas, B.E. Hydrolysis of titanium alkoxide and effects of hydrolytic polycondensation parameters. J. Mater. Sci. 1986, 21, 1087–1092. [Google Scholar] [CrossRef]
  26. Li, C.; Wang, J.; Feng, S.; Yang, Z.; Ding, S. Low-temperature synthesis of heterogeneous crystalline TiO2–halloysite nanotubes and their visible light photocatalytic activity. J. Mater. Chem. A 2013, 1, 8045–8054. [Google Scholar] [CrossRef]
  27. Sing, K.S. Reporting physisorption data for gas/solid systems with special reference to the determination of surface area and porosity (Recommendations 1984). Pure Appl. Chem. 1985, 57, 603–619. [Google Scholar] [CrossRef]
  28. Vijayan, B.; Dimitrijevic, N.M.; Rajh, T.; Gray, K. Effect of calcination temperature on the photocatalytic reduction and oxidation processes of hydrothermally synthesized titania nanotubes. J. Phys. Chem. C 2010, 114, 12994–13002. [Google Scholar] [CrossRef]
  29. Rajput, R.B.; Jamble, S.N.; Kale, R.B. Solvothermal synthesis of anatase TiO2 for the detoxification of methyl orange dye with improved photodegradation efficiency. Eng. Sci. 2021, 17, 176–184. [Google Scholar] [CrossRef]
  30. Athikaphan, P.; Neramittagapong, S.; Assawasaengrat, P.; Neramittagapong, A. Methanol production from CO2 reduction over Ni/TiO2 catalyst. Energy Rep. 2020, 6, 1162–1166. [Google Scholar] [CrossRef]
  31. Chan, C.K.; Porter, J.F.; Li, Y.G.; Guo, W.; Chan, C.M. Effects of calcination on the microstructures and photocatalytic properties of nanosized titanium dioxide powders prepared by vapor hydrolysis. J. Am. Ceram. Soc. 1999, 82, 566–572. [Google Scholar] [CrossRef]
  32. Dette, C.; Pérez-Osorio, M.A.; Kley, C.S.; Punke, P.; Patrick, C.E.; Jacobson, P.; Giustino, F.; Jung, S.J.; Kern, K. TiO2 anatase with a bandgap in the visible region. Nano Lett. 2014, 14, 6533–6538. [Google Scholar] [CrossRef]
  33. Torralvo-Fernández, M.J.; Enciso, E.; Martinez, S.; Sobrados, I.; Sanz, J.; Tonti, D.; Soria, J.; Yurdakal, S.; Palmisano, G.; Augugliaro, V. Influence of the preparation temperature on the photocatalytic activity of 3d-ordered macroporous anatase formed with an opal polymer template. ACS Appl. Nano Mater. 2018, 1, 2567–2578. [Google Scholar] [CrossRef]
  34. Luís, A.; Neves, M.; Mendonça, M.; Monteiro, O. Influence of calcination parameters on the TiO2 photocatalytic properties. Mater. Chem. Phys. 2011, 125, 20–25. [Google Scholar] [CrossRef]
  35. Henderson, M.A. A surface science perspective on TiO2 photocatalysis. Surf. Sci. Rep. 2011, 66, 185–297. [Google Scholar]
  36. Lukong, V.; Ukoba, K.; Jen, T. Heat-assisted sol–gel synthesis of TiO2 nanoparticles structural, morphological and optical analysis for self-cleaning application. J. King Saud Univ.-Sci. 2022, 34, 101746. [Google Scholar] [CrossRef]
  37. Arumbu, P.; Srinivasalu, S. Sustainable model for high signal to noise ratio to measure underwater acoustic signal using Acoustic Doppler Velocimeter. Comput. Electr. Eng. 2018, 68, 262–270. [Google Scholar] [CrossRef]
Figure 1. XRD powder patterns of TiO2 synthesized at different synthesis temperatures and after a subsequent calcination step (synthesis temperature of (A) 40 °C, (B) 70 °C, and (C) 100 °C (the calcination was carried out in static air at 400 °C, 500 °C or 600 °C)) and reference Bragg peak positions (ICDD pdf 00-064-0863), respectively. Low-intensity peaks assigned to rutile are labeled with arrows.
Applsci 15 01401 g001
Figure 2. SEM images of TiO2 synthesized at 70 °C ((A) uncalcined sample, (B) calcined at 400 °C, (C) calcined at 500 °C, and (D) calcined at 600 °C).
Applsci 15 01401 g002
Figure 3. (A) Nitrogen adsorption and desorption curves of TiO2 synthesized at 70 °C and after calcination and (B) the corresponding pore size distribution.
Applsci 15 01401 g003
Figure 4. (A) UV-Vis DR spectra of TiO2 synthesized at 70 °C and after calcination at 400 °C, 500 °C or 600 °C and (B) the corresponding Tauc plots for band gap estimation, (C) their photocurrent under irradiation with light (λ = 365 nm), and (D) the corresponding EIS results.
Applsci 15 01401 g004
Figure 5. (A) Plot of relative DCF concentration versus time for TiO2 synthesized using the sol–gel process at different temperatures (without calcination) and (B) plot for the estimation of the pseudo-first-order rate constant (for B: c0 = DCF concentration when turning on the light).
Applsci 15 01401 g005
Figure 6. (A) Plot of relative DCF concentration versus time for TiO2 synthesized at 70 °C and of samples calcined at 400 °C, 500 °C or 600 °C and (B) plot for the estimation of the pseudo-first-order rate constant (for B: c0 = DCF concentration when turning on the light).
Applsci 15 01401 g006
Figure 7. (A) Plot of relative DCF concentration versus reaction time for TiO2 samples synthesized at different temperatures and calcined at 500 °C and (B) plot for the estimation of the apparent pseudo-first-order rate constant (for B: c0 = DCF concentration when turning on the light).
Applsci 15 01401 g007
Figure 8. Effect of calcination temperature on TOC removal for TiO2 synthesized at (A) 40 °C, (B) 70 °C, and (C) 100 °C (‘-’ = without calcination, TOC values were determined after irradiation of 120 min).
Applsci 15 01401 g008
Figure 9. (A) Results of the reusability test for DFC degradation and (B) the proposed mechanism for DCF degradation using TiO2 under irradiation with simulated sunlight.
Applsci 15 01401 g009
Figure 10. (A) Plot of experimental versus predicted first-order rate constants and (B) plot of experimentally determined TOC value versus predicted TOC removal value (for the meaning of the colors, see Figure 11A,B).
Applsci 15 01401 g010
Figure 11. Three-dimensional surface plots for (A) DCF degradation rate and (B) TOC removal.
Applsci 15 01401 g011
Table 1. Primary crystallite size of the anatase phase (crystallite size was estimated from the (1 0 1) reflection).
ConditionsSynth. at 40 °CSynth. at 70 °CSynth. at 100 °C
Crystallite Size (nm)Crystallite Size (nm)Crystallite Size (nm)
Uncalcined765
Calcined at 400 °C887
Calcined at 500 °C141112
Calcined at 600 °C332634
Table 2. Results of N2 sorption and band gap estimation for materials synthesized at 70 °C.
SamplesTcalc
°C
ABET
m2 g−1
Vp
cm3 g−1
Sp
nm
C-Content
wt%
Eg
eV
TiO2-325.43.82.40.663.22
TiO2400140.72.84.00.053.16
TiO250097.42.65.40.043.13
TiO260017.90.9-0.043.10
Table 3. Statistical quadratic model data fitting for DCF decay rate and TOC removal.
Statistic ParametersKappTOC Removal
R20.9540.983
Adjusted R20.8770.955
Predicted R20.4400.831
Adeq Precision10.10114.846
Table 4. Experimental and fitted DFC degradation rate constant and mineralization efficiency using Equations (9) and (10).
TSynth
°C
TCalcin
°C
Experimental ResultsFitting Results
Kapp
min−1
TOC
Removal %
Kapp
min−1
TOC
Removal %
404000.033650.02861
5000.027740.03272
6000.015380.01236
704000.051960.05093
5000.053970.05197
6000.031620.02954
1004000.042930.04189
5000.049970.04086
6000.016380.01536
Disclaimer/Publisher’s Note: The statements, opinions and data contained in all publications are solely those of the individual author(s) and contributor(s) and not of MDPI and/or the editor(s). MDPI and/or the editor(s) disclaim responsibility for any injury to people or property resulting from any ideas, methods, instructions or products referred to in the content.

