Article

Evaluating Changes in the VOC Profile of Different Types of Food Products After Electron Beam Irradiation

by
Anastasia Oprunenko
1,*,
Timofey Bolotnik
1,
Yuri Ikhalaynen
1,
Victoria Ipatova
2,
Ulyana Bliznyuk
2,3,
Polina Borshchegovskaya
2,3,
Dmitry Yurov
2,
Nadezhda Bolotnik
4,
Elena Kozlova
5,
Alexander Chernyaev
2,3,
Irina Ananieva
1 and
Igor Rodin
1,6
1
Department of Chemistry, Lomonosov Moscow State University, GSP-1, 3 Leninskiye Gory, 119991 Moscow, Russia
2
Skobeltsyn Institute of Nuclear Physics, Lomonosov Moscow State University, GSP-1, 2 Leninskiye Gory, 119991 Moscow, Russia
3
Department of Physics, Lomonosov Moscow State University, GSP-1, 2 Leninskiye Gory, 119991 Moscow, Russia
4
Burnasyan Federal Medical Biophysical Center of Federal Medical Biological Agency, 123098 Moscow, Russia
5
Department of Medical and Biological Physics, Sechenov First Moscow State Medical University (Sechenov University), 119991 Moscow, Russia
6
Department of Epidemiology and Evidence-Based Medicine, Sechenov First Moscow State Medical University (Sechenov University), 119991 Moscow, Russia
*
Author to whom correspondence should be addressed.
Appl. Sci. 2025, 15(3), 1333; https://doi.org/10.3390/app15031333
Submission received: 10 December 2024 / Revised: 18 January 2025 / Accepted: 24 January 2025 / Published: 27 January 2025
(This article belongs to the Special Issue Applications of Analytical Chemistry in Food Science)

Abstract

:
During the development of food radiation processing protocols, one of the aims is to find an optimal dose range for a specific type of product in which pathogenic microflora are inhibited while biochemical and organoleptic properties are not disturbed. When various food products are exposed to ionizing radiation, volatile organic compounds (VOCs) are formed. Depending on the radiation dose, the list of VOCs and their content change, so they could be considered marker compounds for the description of irradiation-related processes. This work proposes a universal way to study and compare the profile of volatile compounds in products of animal and plant origin using GC-MS in combination with various data representation techniques, including unsupervised machine learning methods. The VOC profiles of beef, chicken, turkey, fish, and potatoes were examined.

1. Introduction

Studies aimed at improving the efficiency of radiation treatment are extremely relevant. The importance of this direction is determined by the presence of problems related to spoilage of products due to limited shelf life and disruptions in their transportation and storage. All this leads to a deterioration in their composition. Existing technologies for radiation treatment can help to avoid the outbreak of foodborne diseases worldwide. The use of ionizing radiation is one of the most effective and universal methods of extending the shelf life of food products, ensuring their sanitary safety [1,2,3]. To date, due to the widespread use of ionizing radiation, numerous studies have been conducted on the effect of various radiation treatment parameters on agricultural and food products [4,5,6,7,8,9,10,11]. Similarly to other methods of food processing [12], irradiation can affect both DNA molecules and cells of living organisms and macromolecules of food products, resulting in changes in both the chemical composition and nutritional value of food products and their microbiological safety. That is why an important task is to find a “working window” of doses for a particular type of product, where there is sufficient inhibition of pathogenic microflora, but at the same time, biochemical and organoleptic parameters are not compromised. Since different food products differ in the quantitative ratio of proteins, fats, and carbohydrates, as well as in the level of microbiological contamination, it is necessary to search for a solution to the problem of optimizing all the characteristics of irradiation, such that the greatest microbiological effect is achieved without leading to a decline in product quality.
Currently, to study the effect of ionizing radiation on the quality indicators of food products, various methods of analysis are used, including EPR (electron paramagnetic resonance), thermoluminescence, photoluminescence, and thiobarbituric acid reactive substance (TBARS) analysis [13,14]. The EPR method is used for the analysis of dry substances, but it has a significant disadvantage: the method is based on the detection of long-lived free radicals in the products, but with increased moisture content, the lifetime of free radicals is significantly reduced [15,16,17].
Thermoluminescence and photoluminescence methods are used to detect irradiation of food products containing mineral residues, especially silicate minerals and bioinorganic materials such as calcite, but not all VOCs contain silicon [18,19]. The method of thiobarbituric acid reactive substances analysis (TBARS method) allows for estimating the degree of lipid oxidation in meat products; nevertheless, during radiolysis lipids can be oxidized not only during irradiation but also during natural processes occurring in living tissues [20,21].
The common disadvantage of all these methods is their low informativeness, which does not allow for a reliable determination of whether the product was exposed to ionizing radiation. The main process occurring during the exposure of food products to ionizing radiation is water radiolysis, the products of which are free radicals with high chemical activity. These radicals can react with high-molecular compounds contained in meat and fish products—fats, proteins, carbohydrates, and others [22,23]. Radical processes result in the formation of the simplest stable compounds: aldehydes, ketones, alcohols, hydrocarbons, and other compounds. The formed compounds change the organoleptic properties of food products: they contribute to taste and specific odors [24,25]. The odor of irradiated food products is affected by the presence and content of volatile organic compounds (VOCs), which can potentially be used as markers of the impact of ionizing radiation on food products.
Recently, one of the methods used to analyze volatile compounds in food has been the electronic nose (e-nose), which can mimic the human olfactory system. An e-nose is an array of gas sensors that provides a fingerprint of specific volatile compounds that can be analyzed by pattern recognition algorithms. Typically, volatile molecules react with the sensing materials of the gas sensor and cause irreversible changes in electrical properties such as conductivity [26]. These changes are then detected and characterized by pattern recognition algorithms to perform discrimination or classification. For dimensionality reduction in complex multivariable models, the main method is PCA, which is an unsupervised feature extraction method. For example, Schaulof and colleagues developed a new artificial nose based on carbon dots deposited on electrodes combined with machine learning methods to predict individual and mixed gases. In gas recognition, PCA has advanced by integrating multimodal feature extraction and sensor data fusion [27].
Most modern gas sensors are based on electrical and optical principles, which have attracted considerable scientific interest due to their simplicity and wide range of applications. The rapid development of efficient, simple, and integrated smart electronic and optoelectronic gas sensors has expanded their applications in various fields, such as air pollutant monitoring, medical diagnosis, food spoilage detection, and public safety warnings [28].
The most promising method for the determination of VOCs is currently gas chromatography combined with mass spectrometric detection (GC-MS), which has high sensitivity and selectivity [29,30]. The GC-MS method, in combination with different variants of sample preparation (vapor-phase analysis, solid-phase microextraction), is currently widely used for the determination of VOCs in foodstuffs exposed to ionizing radiation. The application of the GC-MS method for the identification and determination of VOCs in chicken, pork, and turkey meat after exposure to ionizing radiation is described in [25,31,32], and approximate patterns of VOC formation based on the type of meat products are established.
In earlier works, the authors compared the effect of electron and X-ray radiation on microbiological parameters and the content of volatile organic compounds in chilled turkey meat [11]. It was found that the ranges of doses that significantly suppress pathogenic microflora while preserving organoleptic properties of turkey meat are different for electron and X-ray radiation. In the studied samples of turkey meat analyzed using the GC-MS method, three main groups of VOCs were detected: alcohols, ketones, and aldehydes. These compounds are responsible for the specific odor of irradiated meat products, and their content increases exponentially with increasing absorbed doses for both types of irradiation. In another study [33], it was shown that volatile organic compounds found in meat products can be accurately identified using gas chromatography coupled with mass spectrometry. When turkey meat was exposed to an electron beam with doses up to 1 kGy, the concentrations of alcohols, aldehydes, and ketones reached a maximum. To describe the nonlinear dependencies of organic compound concentrations in turkey meat as a function of irradiation dose, a mathematical model was proposed, which assumed the presence of two opposite processes: decay and accumulation of organic compounds that can be detected in turkey meat. VOCs are promising compound markers of ionizing radiation action factors because they are sensitive to environmental changes and physicochemical processes occurring in the matrix of products. Each food product has its own composition of VOCs, their spectrum is very extensive, and due to chemical transformations, VOCs can change into each other. In addition, a wide range of doses is often used in studies. All these factors affect the practicality and possibility of product discrimination, so modern machine learning techniques can be used to deal with such a large amount of data.
At present, there are several putative marker compounds for food irradiation, but there is no confirmation of the correctness of the choice of these compounds as markers [29,30,34]. Continuous monitoring of the data obtained by analyzing a large number of samples of different types of products is necessary. In order to extract the most important information when analyzing experimental data, a large number of machine learning methods are applied in modern analytical chemistry.
Recently, the following methods have been used to analyze the obtained multivariate data: principal component analysis (PCA), projection to latent structures (PLS), discriminatory analysis using regression to latent structures (PLS-DA), artificial neural networks, and formally independent modeling of class analogies (SIMCAs) [35]. The listed methods allow the classification of the obtained data (spectra, chromatograms, etc.) into groups. One of the simplest variants is the “fingerprint” method. Fingerprint modeling and analysis are widely used in food recognition or quality control. In [36], the whole process of converting GC-MS data into olfactometry results is presented, including instrumental and sensory analysis, identification of odor compounds, the process of structuring GC-MS data by modeling fingerprint images, and prediction using convolutional neural networks. GC-MS fingerprints are very complex, and similar samples may be indistinguishable. Thus, the usage of unsupervised methods for data complexity reduction should ease the tasks related to the classification of complex mixtures and impact-derived marker discovery, which is especially crucial for food objects.
An important task today is the search for marker compounds indicating exposure of products to ionizing radiation. Such markers can be VOCs detected in products of animal and plant origin before and after irradiation. In this study, we aimed to develop an analytical method combining qualitative analysis of products for VOC content by GC-MS and the principal component method for discrimination of irradiated and non-irradiated samples.

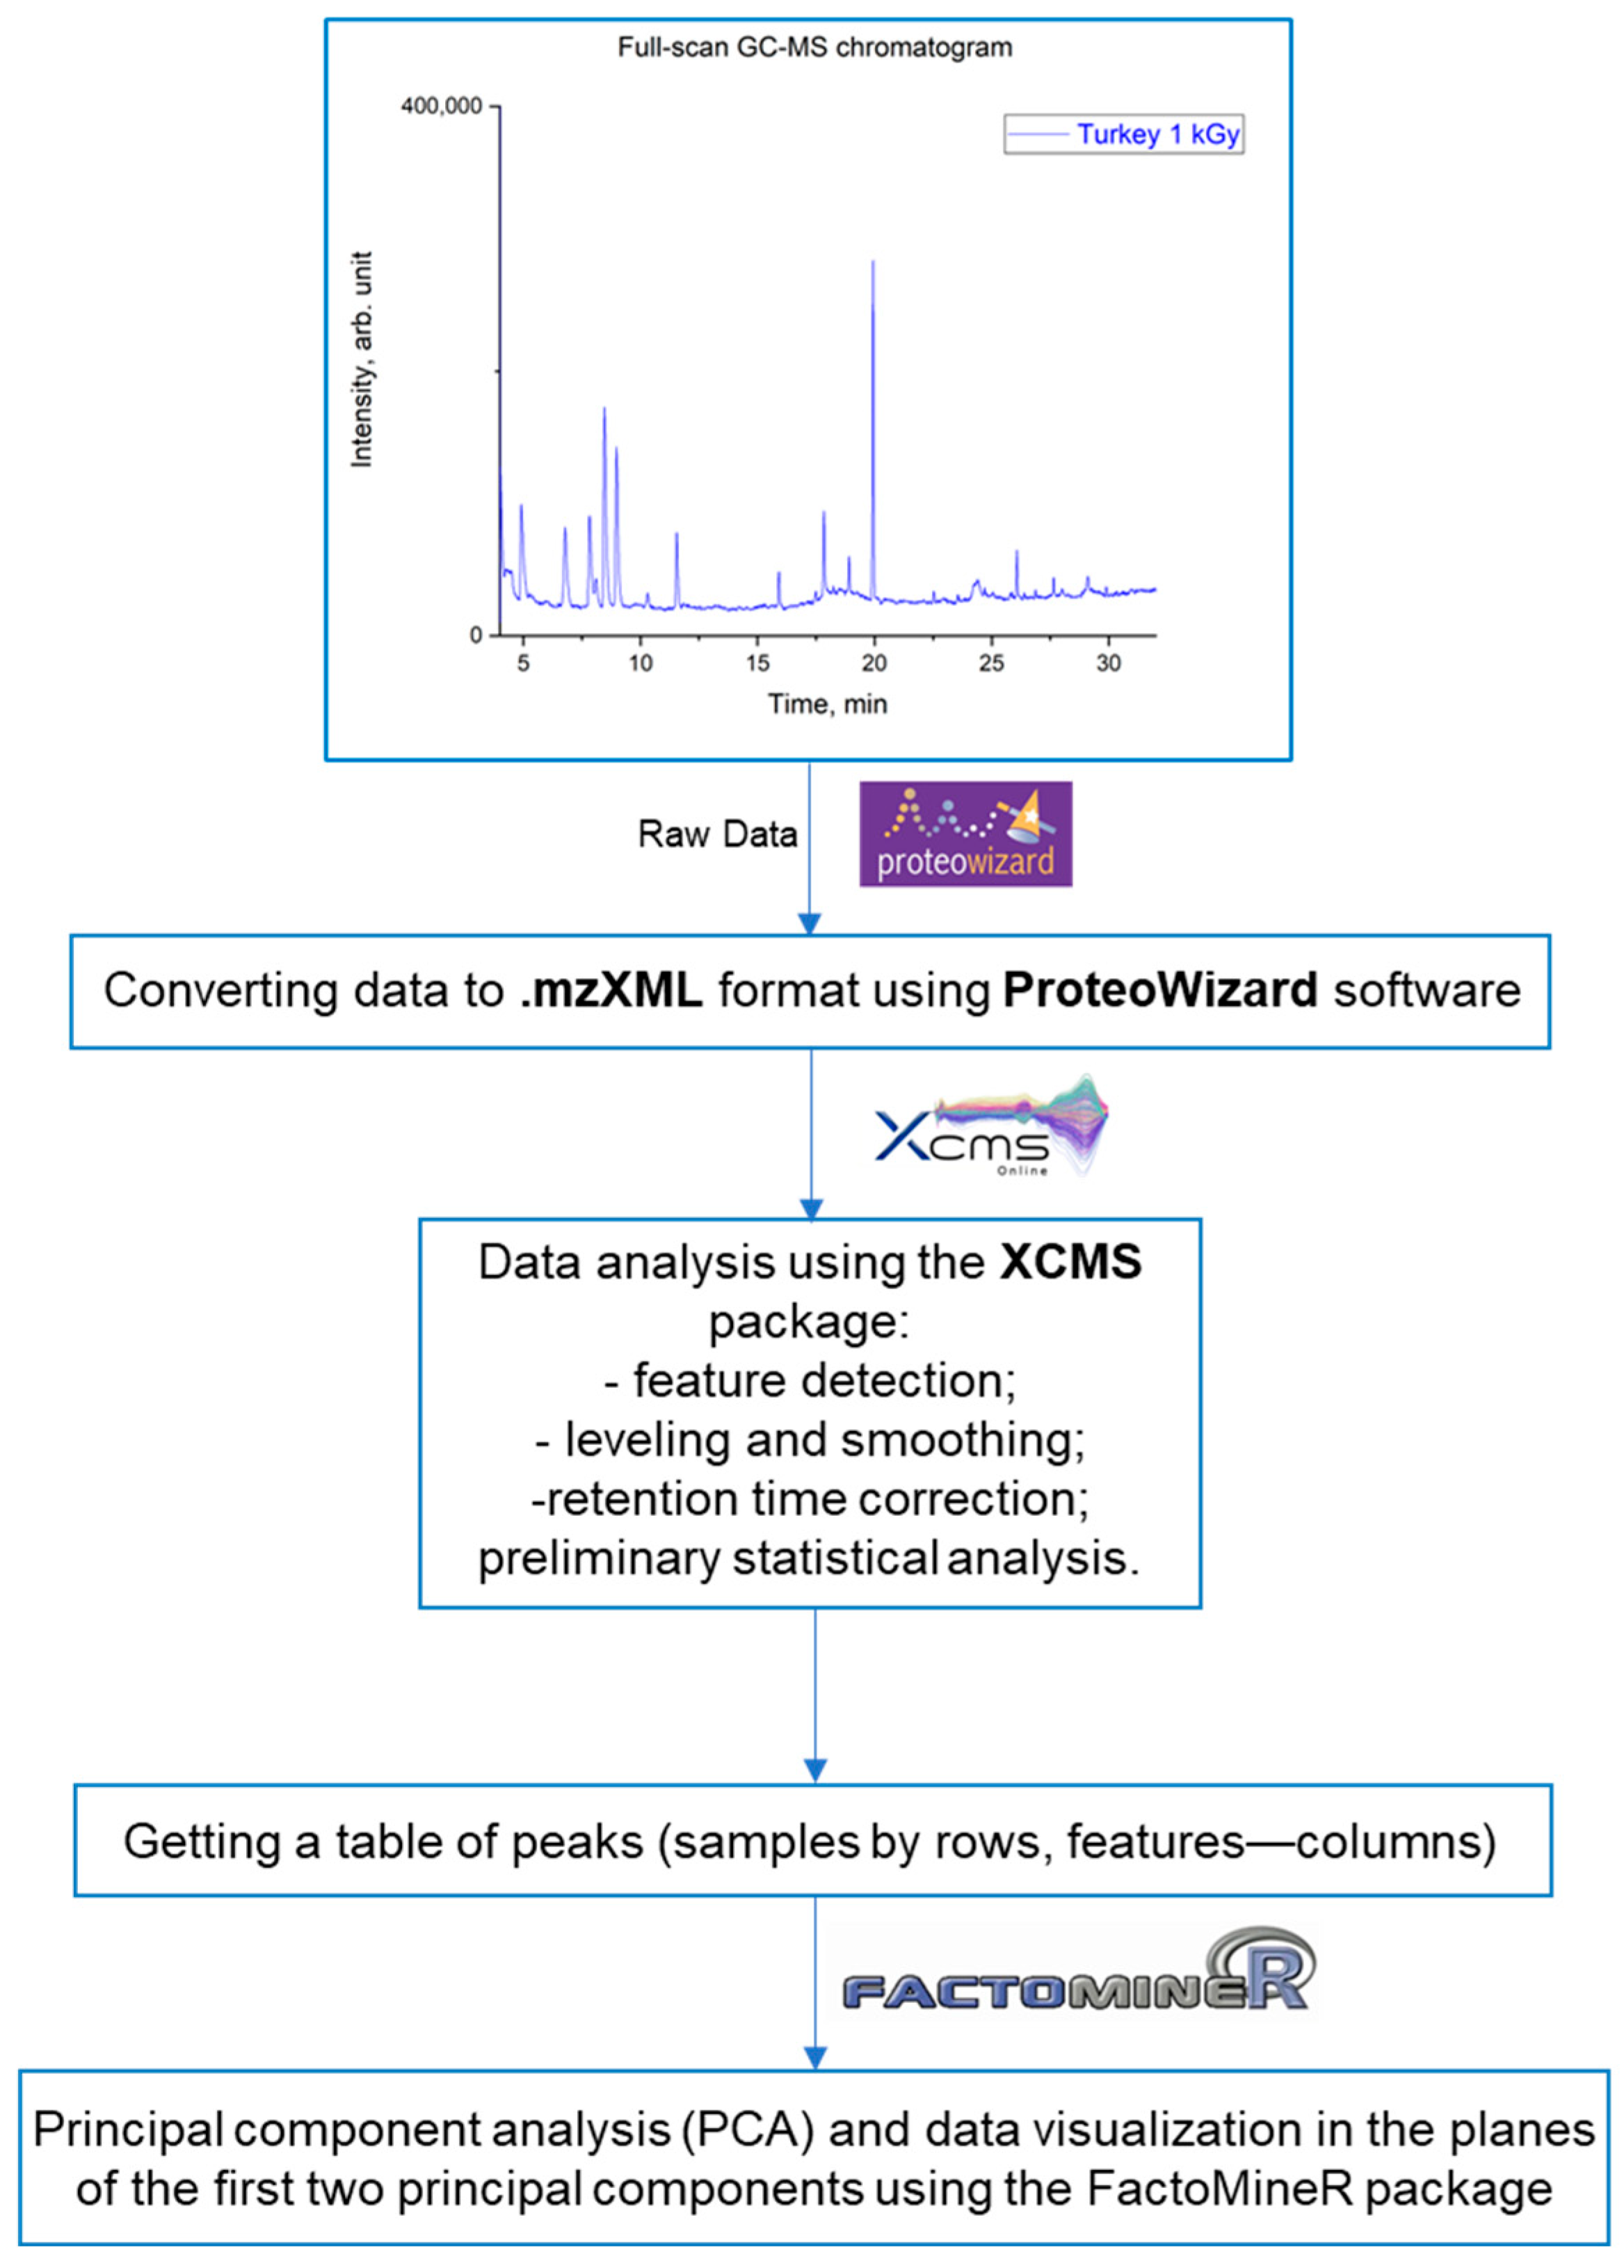
2. Materials and Methods

2.1. Standard Samples and Sample Preparation for Analysis

The objects of the study were chilled meat products (turkey, beef, chicken) and fish products (salmon), as well as vegetable products (potatoes). Chicken, turkey, beef, and fish samples were stored in a refrigerator at 2 °C for no more than a day after slaughter. Potatoes harvested 2 months prior to treatment were stored in a dark place at an ambient temperature of 18 °C. Potato samples were peeled and cut into pieces weighing 0.5 ± 0.1 g. Chicken, turkey, beef, and fish samples were ground to obtain homogeneous minced meat and divided into 0.5 ± 0.1 g portions. All product samples were placed in plastic Eppendorf-type microcentrifuge tubes of 2 mL for subsequent irradiation. The thickness of potato slices, ground beef, poultry mince, and fish mince did not exceed 3 mm to ensure uniform irradiation of the samples with accelerated electrons at an energy of 1 MeV.

2.2. Irradiation

The samples were irradiated at the continuous electron gas pedal UELR-1-25-T001 (D.V. Skobeltsyn Research Institute of Physics, Moscow State University, Moscow, Russia) with a maximum beam energy of 1 MeV, at an average current of 0.5 ± 0.1 μA and an ambient temperature of 20 °C. For each irradiation session, the studied samples, amounting to 8 pieces, were laid out on a duralumin plate according to the scheme described in [34]. The error in determining the charge, which was measured using ADC (LLC “Production Association OVEN”, Ekaterinburg, Russia), did not exceed 2%. The range of irradiation doses was from 100 Gr to 1000 Gy for potatoes, and from 250 Gy to 10,000 Gr for products of animal origin.

2.3. Dosimetric Control

A chemical dosimeter of ferrous sulfate solutions (Fricke dosimeter) was used to measure ionizing radiation doses. The samples were irradiated with doses of 0.25 kGy, 0.5 kGy, 1 kGy, and 2 kGy. The dose rate of electron irradiation was Pe = 1.2 ± 0.1 (Gy/s).

2.4. Equipment

A gas chromatography–mass spectrometer (Shimadzu GCMS-QP2010 Ultra) equipped with an HT200H Headspace Autosampler was used for determination. Data acquisition and chromatogram processing were performed using GCMS solution software (Version 2.70), and component identification was performed using the NIST/EPA/NIH Mass Spectral Library 2018 (NIST 2018) ((GC Image, LLC PO Box 57403 Lincoln NE 68505-7403, USA).

2.5. GC-MS Analysis

The determination of VOCs in the studied samples was carried out by gas chromatography–mass spectrometry. The contents of four 2 mL tubes (2 g) were randomly combined into one sample and placed at the bottom of a 20 mL vial for headspace analysis, and 2 mL of deionized water was added. The vials were hermetically sealed using a crimper with a Teflon gasketed lid and placed in the vial holder of the autosampler. The samples were thermostated for 20 min at 90 °C. Then, 1 mL of the vapor phase was injected into the chromatograph and analyzed according to the conditions presented in Table 1.

2.6. Chemometric Analysis

The raw data were converted to the mzXML format using ProteoWizard software (Version V3.0.19254) [37]. After that, the data were processed using the XCMS package for the peak picking, deconvolution, and alignment steps [38] according to the parameters recommended for processing experimental GC-MS data conducted on quadrupole mass analyzers (Figure 1). Missing values in the obtained parameter tables (m/z, retention time, peak area) were filled with half of the minimum peak area value of the corresponding signal between peaks [39]. Further, dimensionality reduction of the obtained data was performed using the principal component method (PCM); principal component calculation was performed using the FactoMineR package [40]. Based on the obtained principal component matrices, the projections of samples in the planes of the first two principal components were obtained.
As a result of the chromatogram markup and alignment procedures, tables containing the values of chromatographic peak areas for each m/z-retention time pair were obtained. The obtained data were filtered within the ranges from 0 to 4 min and from 32 to 40 min in order to remove non-reproducible signals corresponding to low-retention components and signals associated with degradation of the stationary phase of the column.

3. Results and Discussion

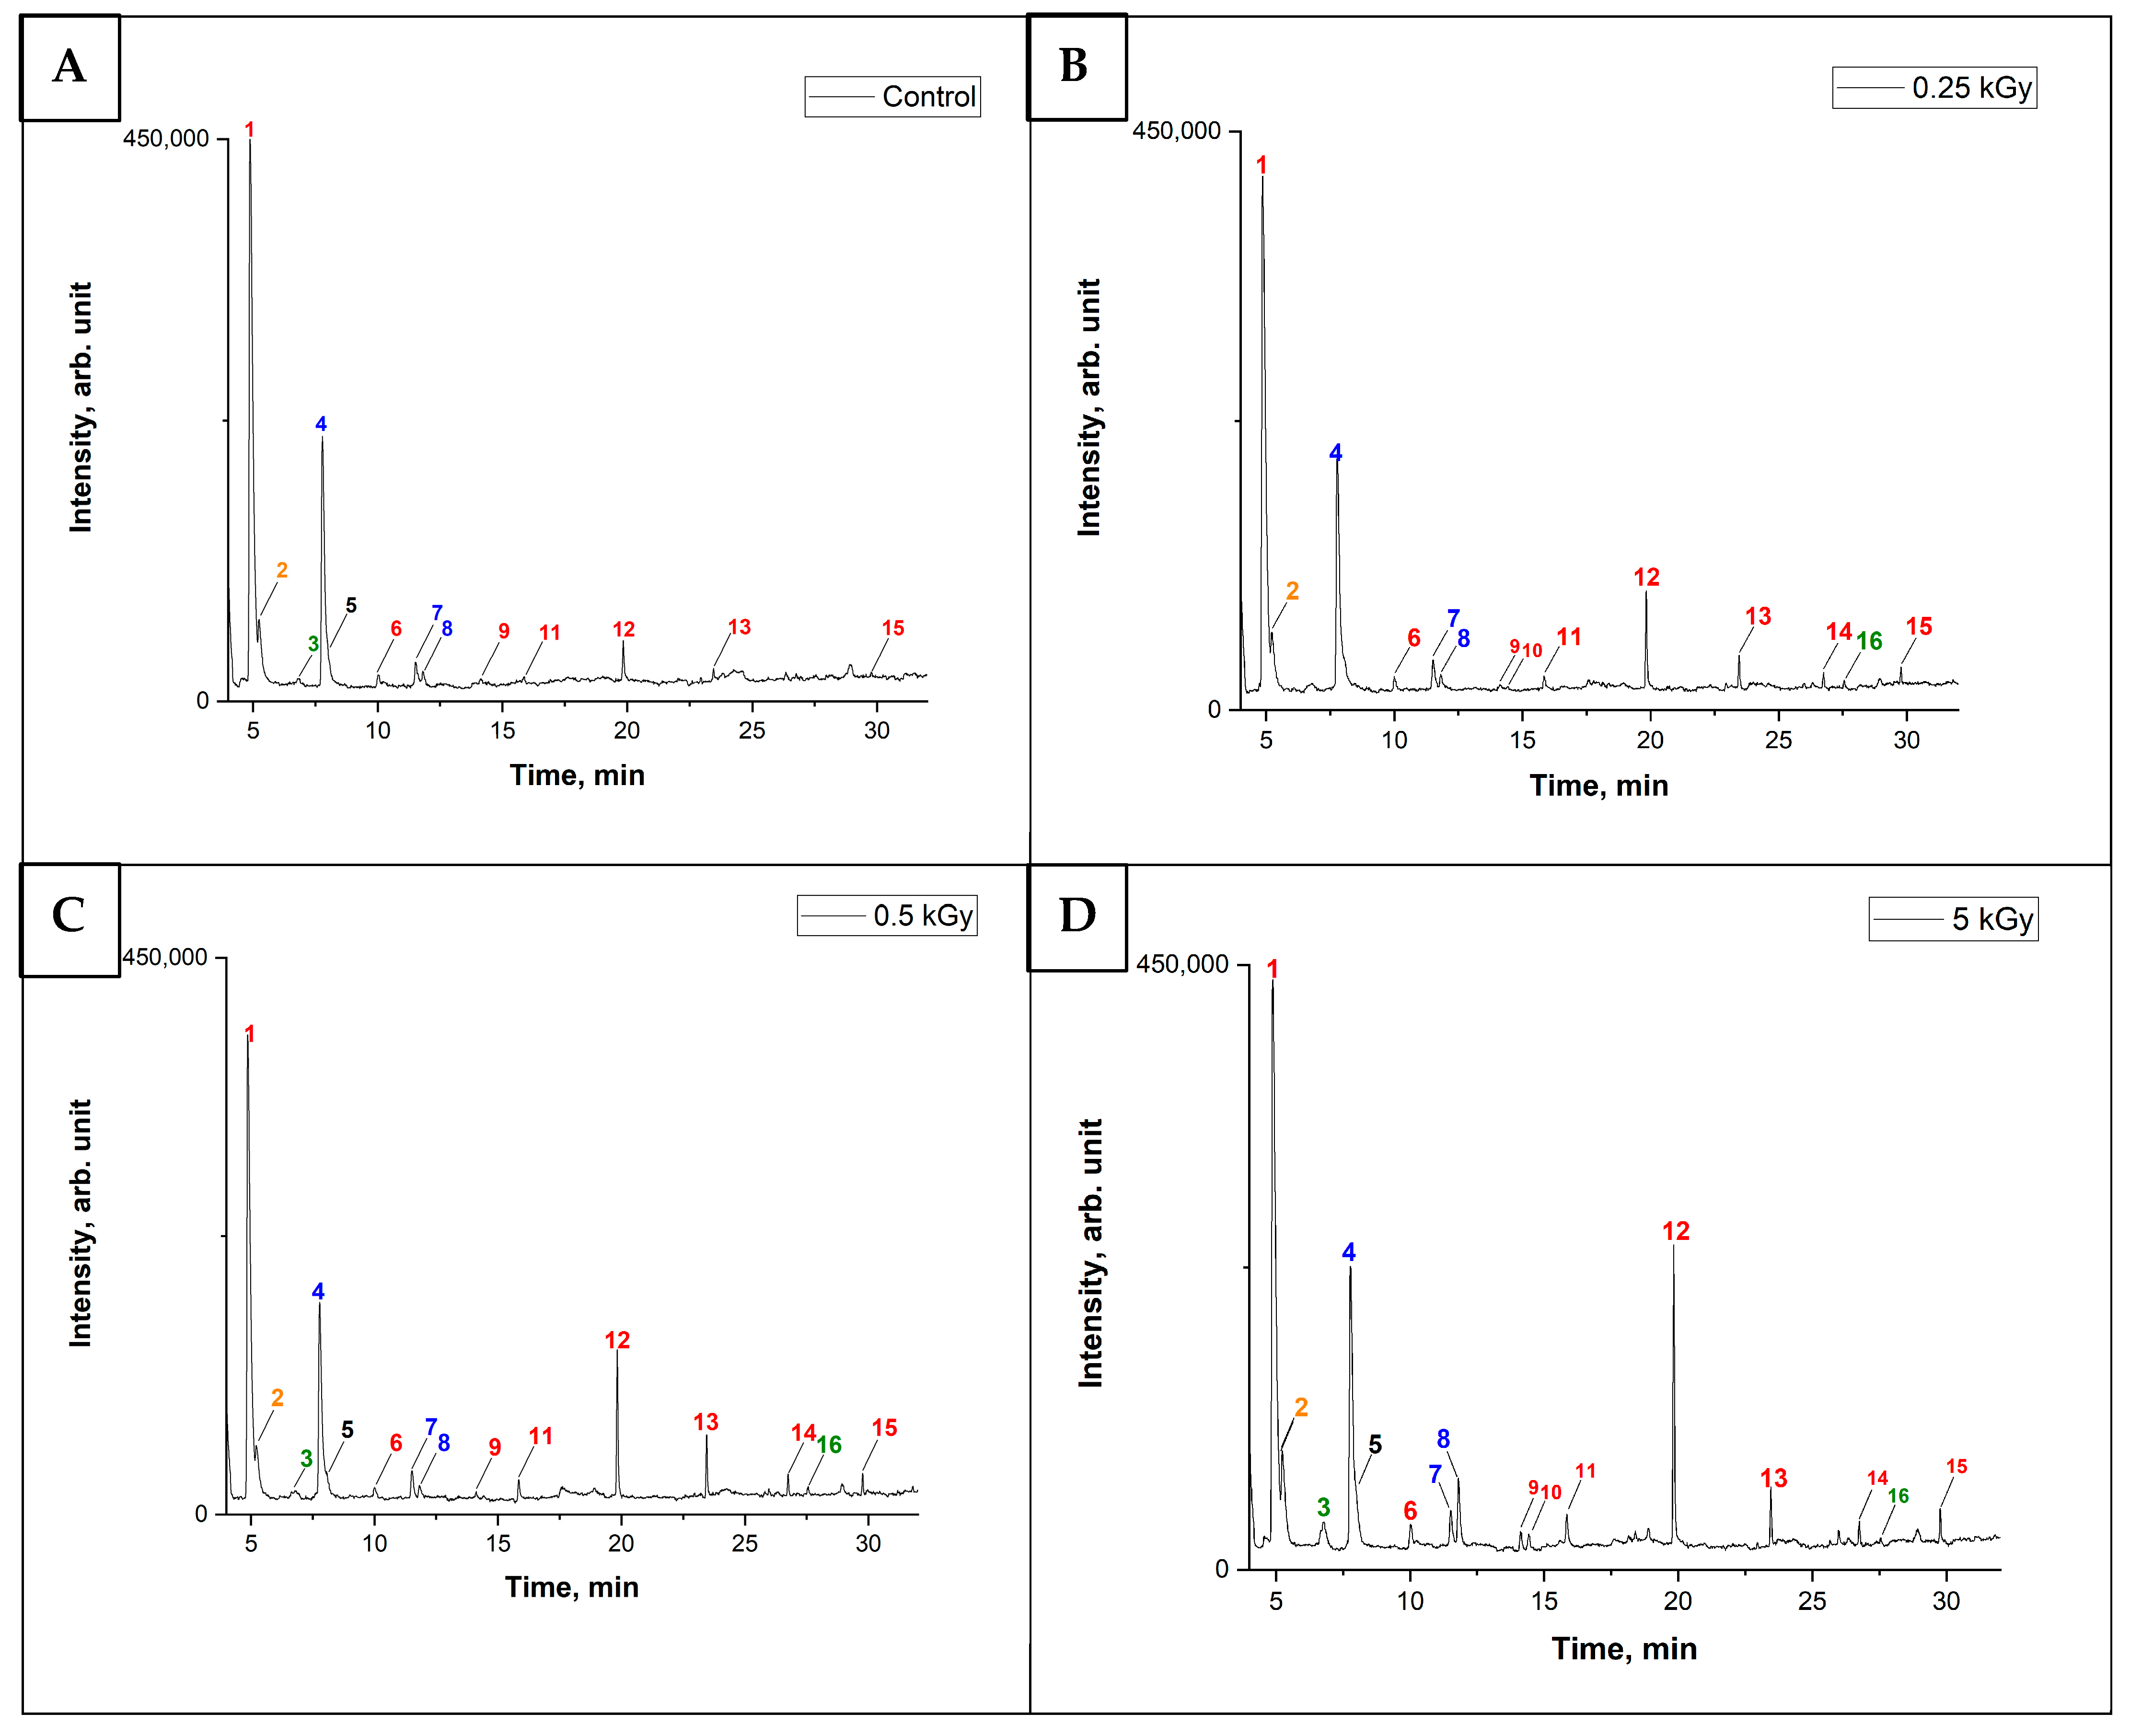
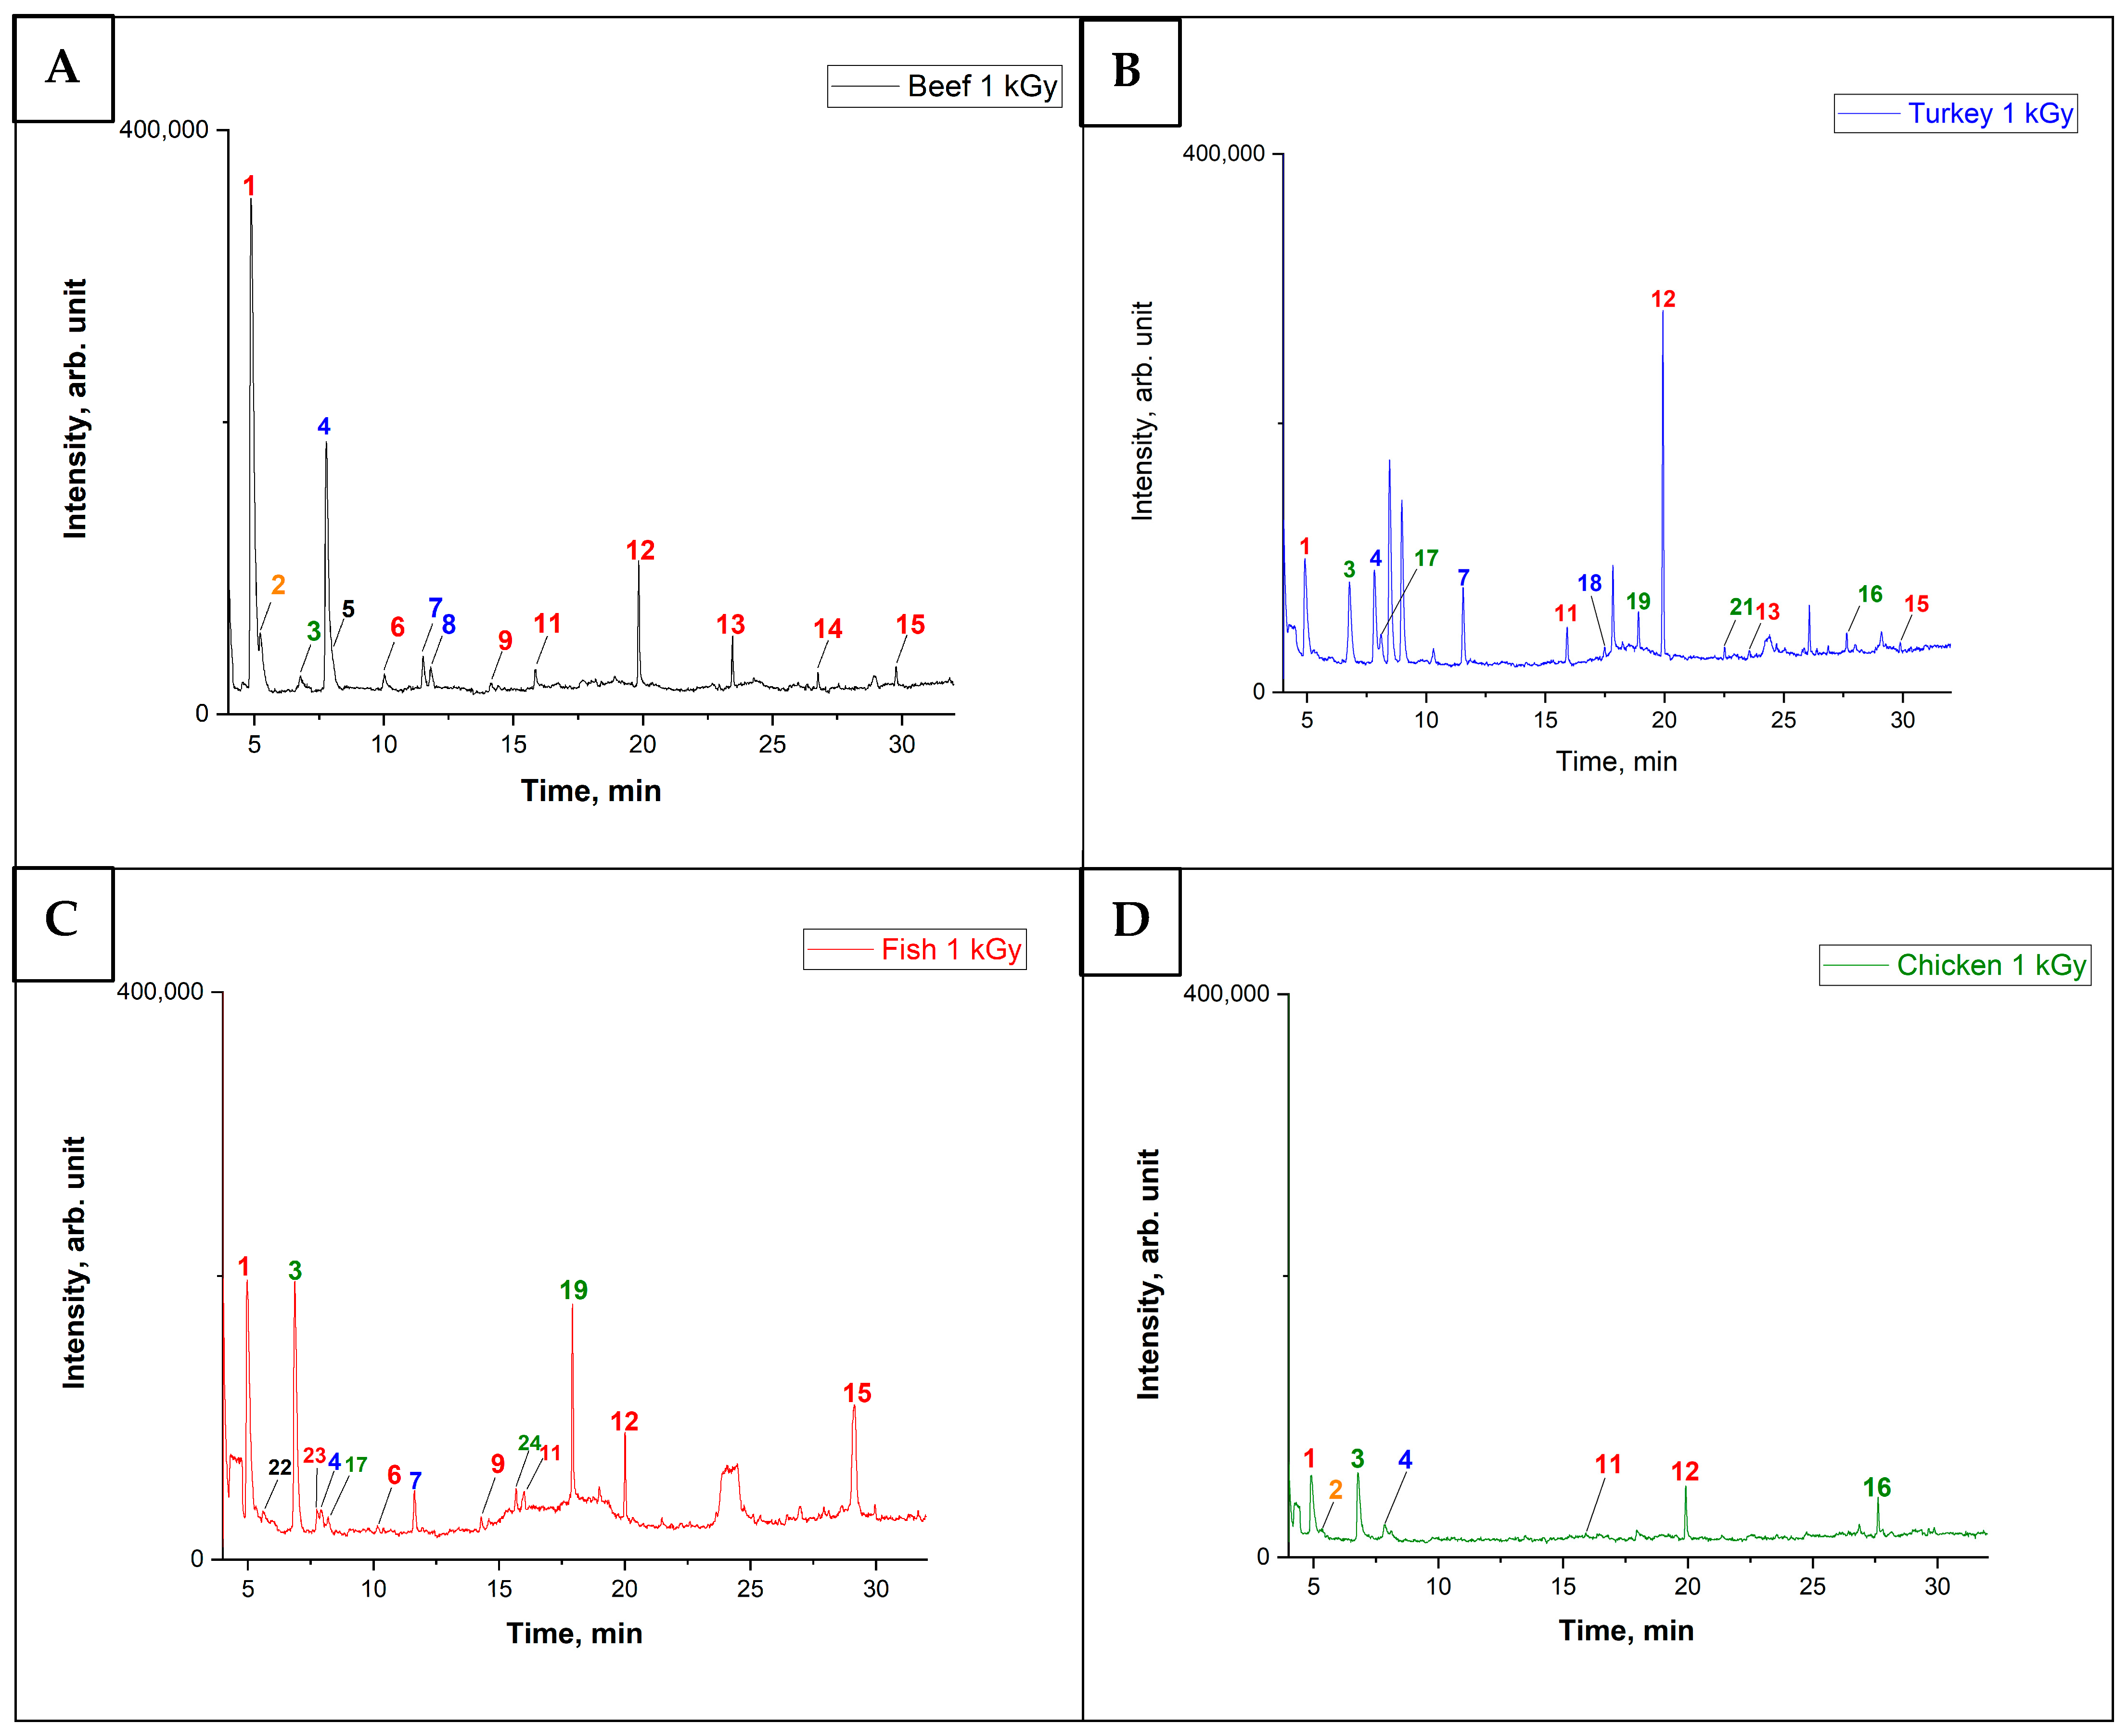
3.1. Optimization of GC-MS Analysis Conditions

Chromatographic column selection: To achieve the best analytical characteristics of GC-MS analysis, all analysis and sample preparation conditions were selected and optimized. Since a large number of polar organic compounds were assumed in the studied samples, it was proposed to separate the components on a column VF-624 (60 m × 0.25 mm × 1.8 microns) with a fixed phase based on cyanopropyl polydimethylsiloxane. Optimization of the separation conditions of the components was carried out by analyzing standard solutions of VOCs (content of each component: 1 mg/L). The criterion for optimization of the temperature program was the separation of peaks of all substances. Since the components to be determined have low boiling points (20–190 °C), headspace analysis is suitable for their determination. In order to achieve the best sensitivity, the injected sample volume was 1 mL, and the sample heating temperature was 90 °C (this value is limited by the boiling point of water).
Selection of temperature control conditions: To determine the optimal time of heating of the sample, standard solutions with the content of each component in the solution of 1 mg/L were studied. The solutions were thermostated at 90 °C for 5, 10, 15, 20, and 30 min. It was found that the equilibrium in the vapor-condensed phase system occurs at 20 min of sample heating.

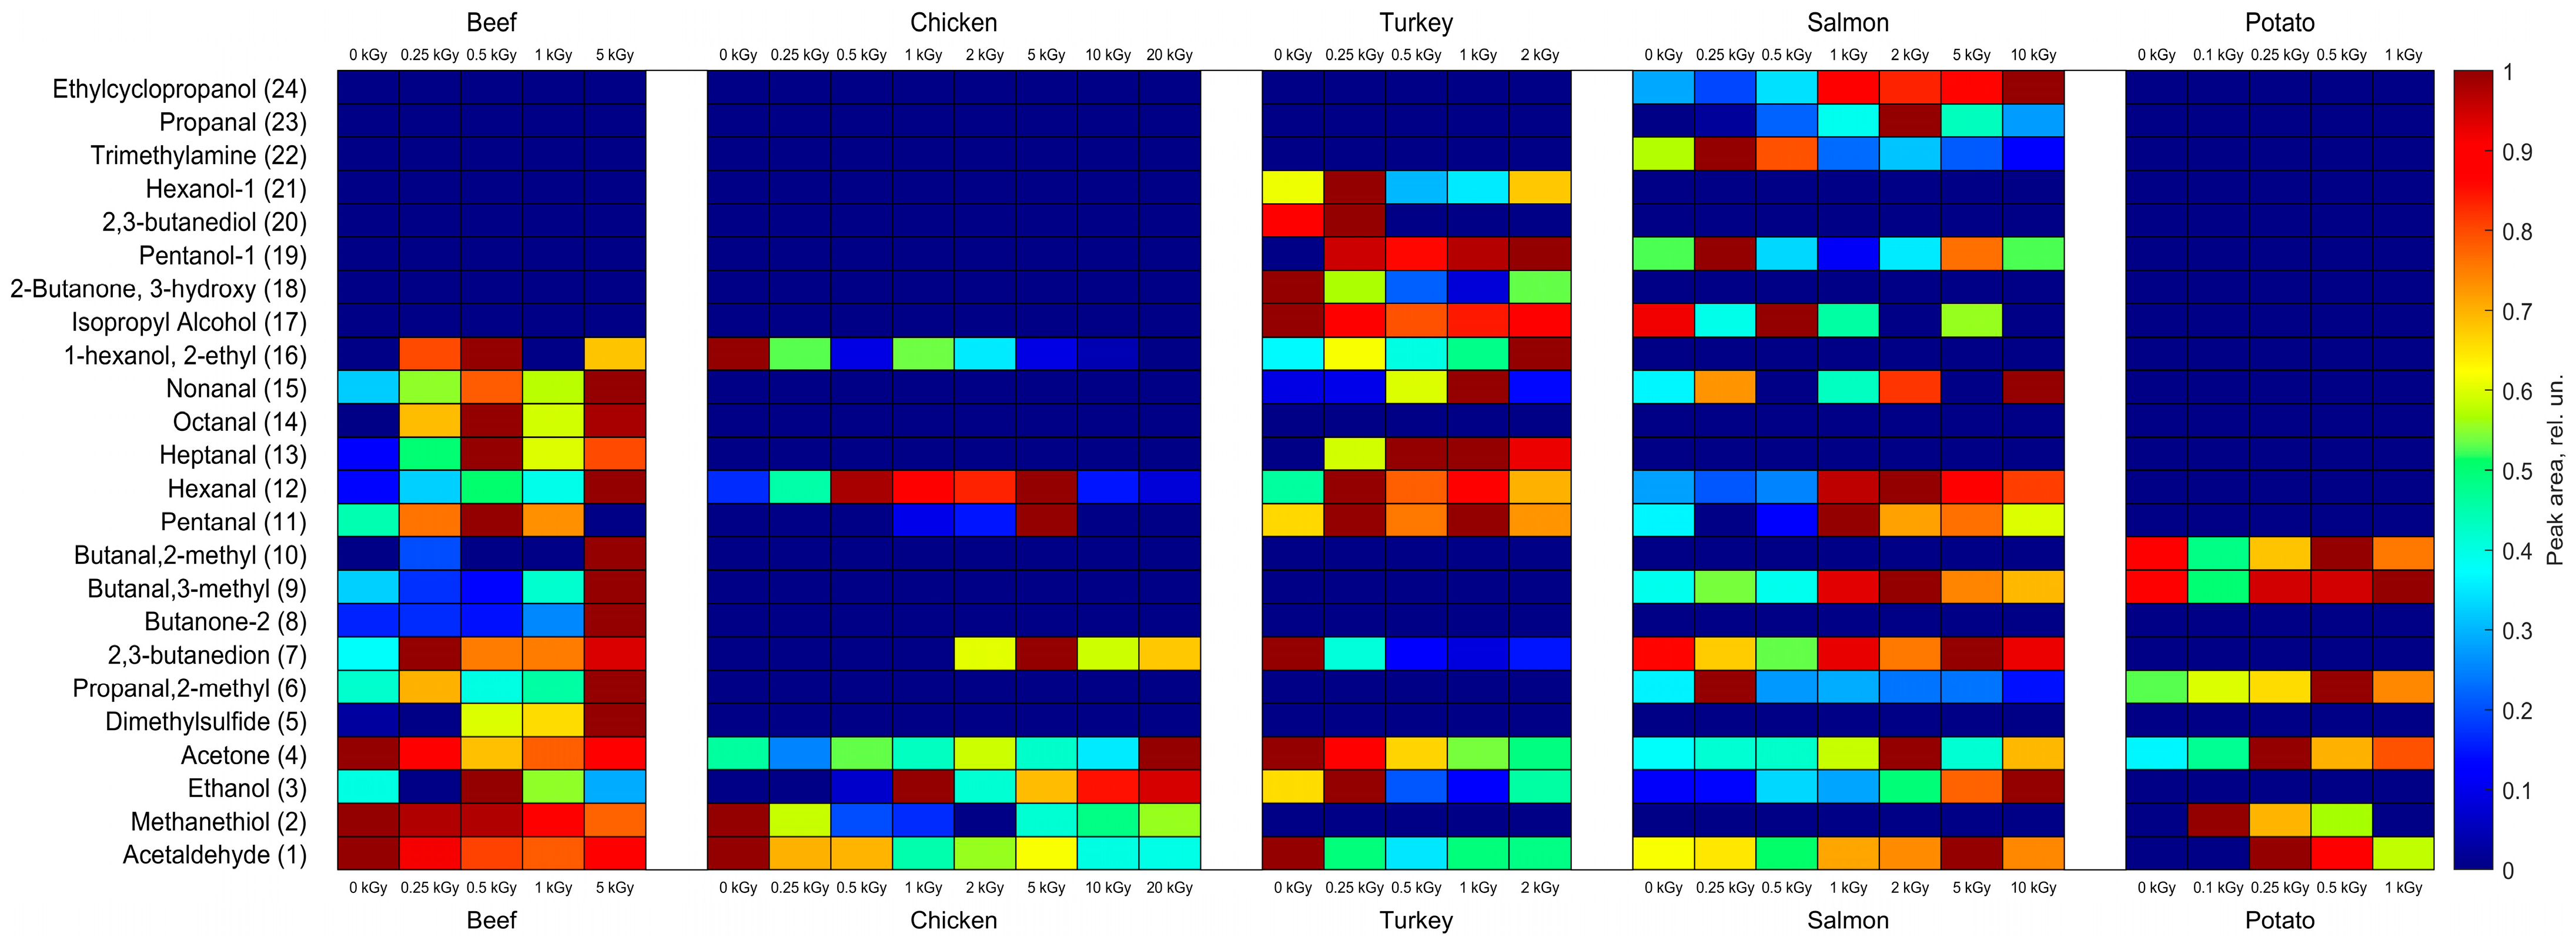
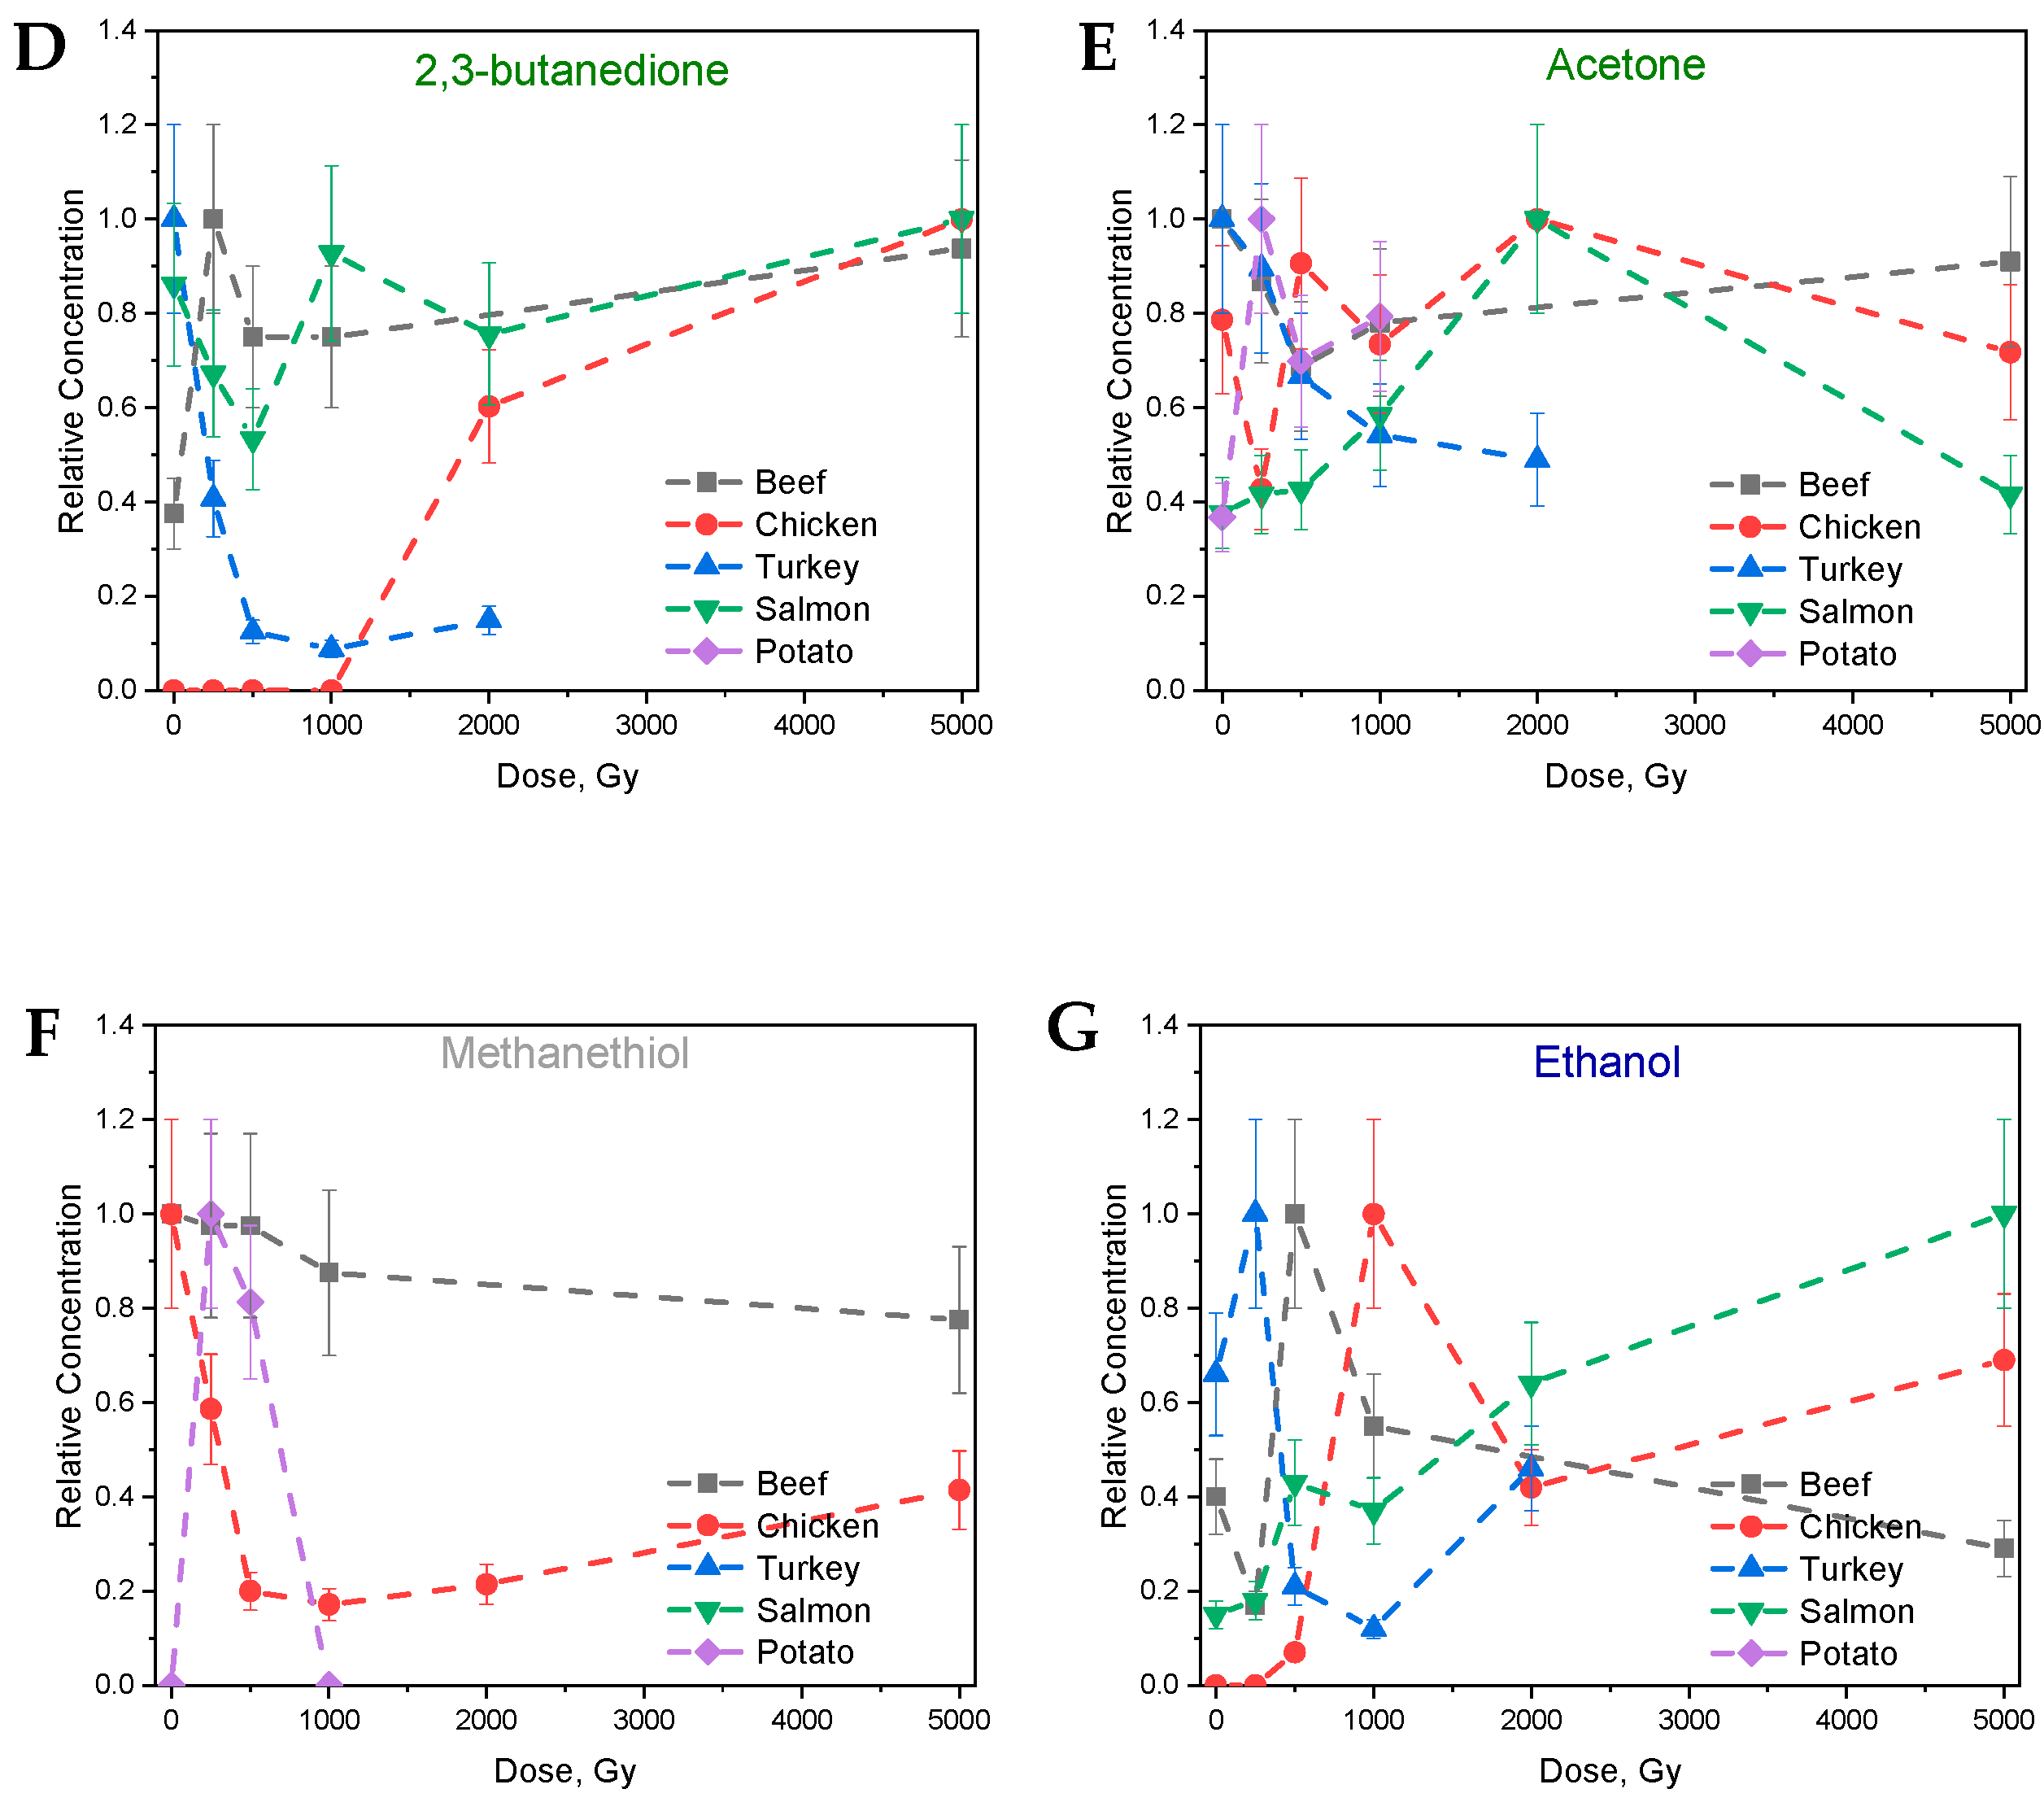
3.2. The Behavior of VOCs in the Food Samples After Irradiation

Beef, chicken, turkey, fish, and potato samples of 2 g each were placed in vials after irradiation with 2 mL of deionized water added, then sealed and subjected to GC-MS analysis. Figure 2 shows the heat map of the VOC concentrations normalized to the maximum value of each volatile compound identified in the irradiated and non-irradiated food samples. Various VOCs are plotted on the ordinate axis of the heat map, and the data on the abscissa axis are grouped by irradiation dose and product type. Quantitative VOC data in non-irradiated and irradiated beef, chicken, turkey, salmon, and potato samples can be found in Table A1, Table A2, Table A3, Table A4 and Table A5 in Appendix A.
As can be seen from Table A1, Table A2, Table A3, Table A4 and Table A5, the list of VOCs for different products differs significantly, with beef and salmon samples having higher amounts of detected volatile compounds compared to turkey, chicken, and potatoes. A higher amount of VOCs in salmon and beef samples can be attributed to a higher fat and protein content since irradiation triggers the oxidation of fatty acids and amino acids, which leads to the formation of a wide range of VOCs [41].
Irradiation of meat products in order to destroy biological contaminants affects the course of chemical reactions in food products and, accordingly, organoleptic properties. Irradiation generates highly reactive compounds that catalyze oxidative transformations of proteins and lipids, and the mechanisms of such transformations are usually very complex and not fully understood [30].
Figure 3 shows chromatograms of beef samples irradiated at different doses. There is a significant change in the content of some components, and the list of identified compounds expands with an increase in the radiation dose. As a result of GC-MS analysis, 16 compounds of various VOC classes were identified in irradiated beef samples, among which the most intense peaks belong to acetaldehyde, acetone, 2,3-butanedione, butanone-2, hexanal, and 2-methylpropanal. In turn, 14 compounds were found in the non-irradiated beef sample, and the butanal, 3-methyl, butanal, 2-methyl, hexanol-1, octanal, and 1-hexanol,2-ethyl found in the irradiated samples were not detected. The predominant classes of VOCs in beef samples are aldehydes, alcohols, and ketones, but thiols and sulfides have also been found. A total of 16 identified VOCs, as a result of the analysis of beef samples, were distributed into five classes. Thus, the list of VOCs in irradiated beef samples is larger than in the non-irradiated food samples, further referred to as control samples and shown as 0 kGy in graphs and tables, even at the lowest radiation dose of 0.25 kGy.
Figure 4 shows the chromatograms of beef, chicken, turkey, and salmon samples exposed to 1 kGy. Despite the fact that samples of all products were analyzed under the same conditions (under the same sample preparation conditions and GC-MS parameters) and were subjected to the same irradiation doses, they have significantly different VOC profiles. For example, a small set of compounds is identified in chicken meat, whereas turkey and salmon have a fairly extensive range of VOCs. This fact once again indicates the significant dependency of the VOCs formed and their amount on the ratio of macronutrients in the meat. Salmon, as well as any fish, has more fats in its composition than turkey and chicken, which are recognized as dietary. This indicates oxidation of fats under the action of irradiation, leading to the formation of a large number of aldehydes and ketones.
Figure 5 shows the dose dependencies of the concentrations of aldehydes (acetaldehyde, hexanal, butanal,3-methyl), ketone (2,3-butanedione), and alcohol (ethanol) identified in most food samples studied. The VOC concentrations are represented as the peak areas corresponding to each compound calculated as the average peak area of three repetitive irradiation sessions normalized to the maximum value of each volatile compound identified in the irradiated and non-irradiated food samples.

3.2.1. Aldehydes

It was found that aldehydes, which are considered to be among the main substances responsible for the specific odor of meat, fish, and poultry products [42], constitute the majority of VOCs identified in food samples. While acetaldehyde was detected in all food samples, hexanal, 2,3-butanedione, and ethanol were found in animal products.
The concentration of acetaldehyde, formed by the decomposition of various fatty acids and alcohols often present in meat products [42,43], in irradiated beef and poultry samples decreased with an increase in the irradiation dose. This can be due to the decomposition of acetaldehyde under the action of accelerated electrons during e-beam irradiation. The content of acetaldehyde in salmon samples increased nonlinearly with the higher dose, which is a sign of intensive oxidation of fatty acids that salmon is rich in. It should be noted that acetaldehyde was not detected in non-irradiated potato samples but was found in irradiated potato samples, which can be an indicator of carbohydrate decomposition.
Hexanal, characterized by a strong grassy odor, is formed by the oxidation of unsaturated fatty acids in meat, but can also be derived from the hydrolysis of triglycerides or the degradation of amino acids [42]. In all samples of meat products, an increase in hexanal content with irradiation dose was observed, which may indicate intensive oxidative processes of fatty acids caused by irradiation. In potato samples, this compound was absent, which is due to the low fat content in plant products.
The compound 3-methylbutanal, with an unpleasant but low-intensity odor, is an oxidation product of the amino acid isoleucine, which is contained in the amino acid sequence of proteins [44]. This compound was detected in non-irradiated and irradiated beef, salmon, and potato samples, and increased with a higher irradiation dose, which is a sign of protein oxidation.

3.2.2. Ketones

The compound 2,3-butanedione, with an intense oily odor, is primarily formed by the degradation of proteins and by autolysis of the glycogen polysaccharide present in the muscle tissue of animal products [45]. Most products with a high protein content, such as beef, chicken, and salmon, demonstrated an increase in the concentration of 2,3-butanedione with a higher dose. An 80–90% decrease in the concentration of 2,3-butanedione in turkey samples with an increase in the irradiation dose ranging from 0.25 kGy to 2 kGy may result from its oxidation during irradiation, and at the same time, 2,3-butanedione may also form due to oxidation of alcohol 2,3-butanediol present in the non-irradiated turkey samples.
The compound 2-butanone,3-hydroxy, which was identified only in turkey meat samples, has a strong buttery-creamy odor that can be attributed to enzymatic processes in the product or oxidation of the alcohol 2,3-butanediol [46,47]. It was found that 2-butanone,3-hydroxy content was reduced by 40–90% with an increase in the irradiation dose, which may indicate effective suppression of microorganisms potentially present in chilled turkey meat.
Acetone, a ketone resulting from fatty acid peroxidation, was detected in all food samples, and showed different dependencies of the concentration on the irradiation dose. In beef samples, acetone content decreased by 10–30% when the beef samples were irradiated with a dose ranging from 0.25 kGy to 5 kGy. In salmon, however, a 60% increase in the acetone concentration was observed at 2 kGy, which further decreased to the level of the non-irradiated salmon samples with an increase in the irradiation dose up to 5 kGy. The acetone concentration showed a 50% decrease in turkey samples irradiated with doses ranging from 0.25 kGy to 2 kGy; however, acetone content demonstrated no significant changes with respect to the non-irradiated samples after irradiation within 0.25–2 kGy. It should be noted that plant products, such as potatoes, showed a 40–60% increase within 0.1–1 kGy.

3.2.3. Alcohols

The formation of alcohols, particularly ethanol, in animal products is usually due to enzymatic processes involving glucose and various microorganisms, in particular Pseudomonas, which subsequently cause food spoilage [45,48,49]. However, there are other pathways for its formation, such as the reduction of ketones and aldehydes formed during lipid oxidation. In the non-irradiated chicken samples and the samples irradiated with 0.25 kGy, ethanol was absent. However, an increase in ethanol content to 40–90% was observed as the irradiation dose increased from 0.5 kGy to 5 kGy. In turkey samples irradiated at a dose of 0.25 kGy, a 35% increase was detected. With further dose increases, ethanol content rose by 50% relative to the values of the non-irradiated turkey samples. In the irradiated salmon samples, a steady increase in ethanol content was observed with irradiation doses ranging from 0.25 kGy to 5 kGy, while beef samples exhibited non-monotonous dose-dependent behavior of ethanol content within the same dose range.

3.2.4. Other Compounds

Sulfur compounds, particularly methanethiol, are formed as a result of the breakdown of the amino acids cysteine and methionine, which are part of the amino acid sequence of proteins present in meat and poultry [50]. A 20% and 60–80% decrease in methanethiol concentration in beef samples and chicken, respectively, with the irradiation dose ranging from 0.25 kGy to 5 kGy may be a sign of the breakdown of amino acids after irradiation and the decomposition of methanethiol due to irradiation. The absence of sulfur compounds in salmon samples may be due to the fact that fish contains a large amount of tocopherols (Vitamin E) and selenium, which act as antioxidants, preventing the formation of sulfur compounds [51].
As an added benefit, irradiation with accelerated electrons at doses ranging from 1 kGy to 5 kGy ensured a 30–40% decrease in the concentration of trimethylamine—a toxic compound formed as a result of the degradation of proteins that causes significant changes in the color and taste of seafood [52]. It should be noted that the doses 0.25 kGy and 0.5 kGy increased the trimethylamine content up to 30–40%, which is a sign of protein degradation due to irradiation.
The analysis of dose dependencies of VOCs in food samples shows that the concentration of volatile compounds is determined by the accumulation of compounds due to the decomposition of macronutrients after irradiation, as well as the decomposition of volatile compounds under the action of radiation. The behavior of compounds in different dose ranges is influenced by the dose thresholds at which the macronutrients from which these compounds are formed decompose, the initial concentration of volatiles, and the rate of their decay with a higher irradiation dose.

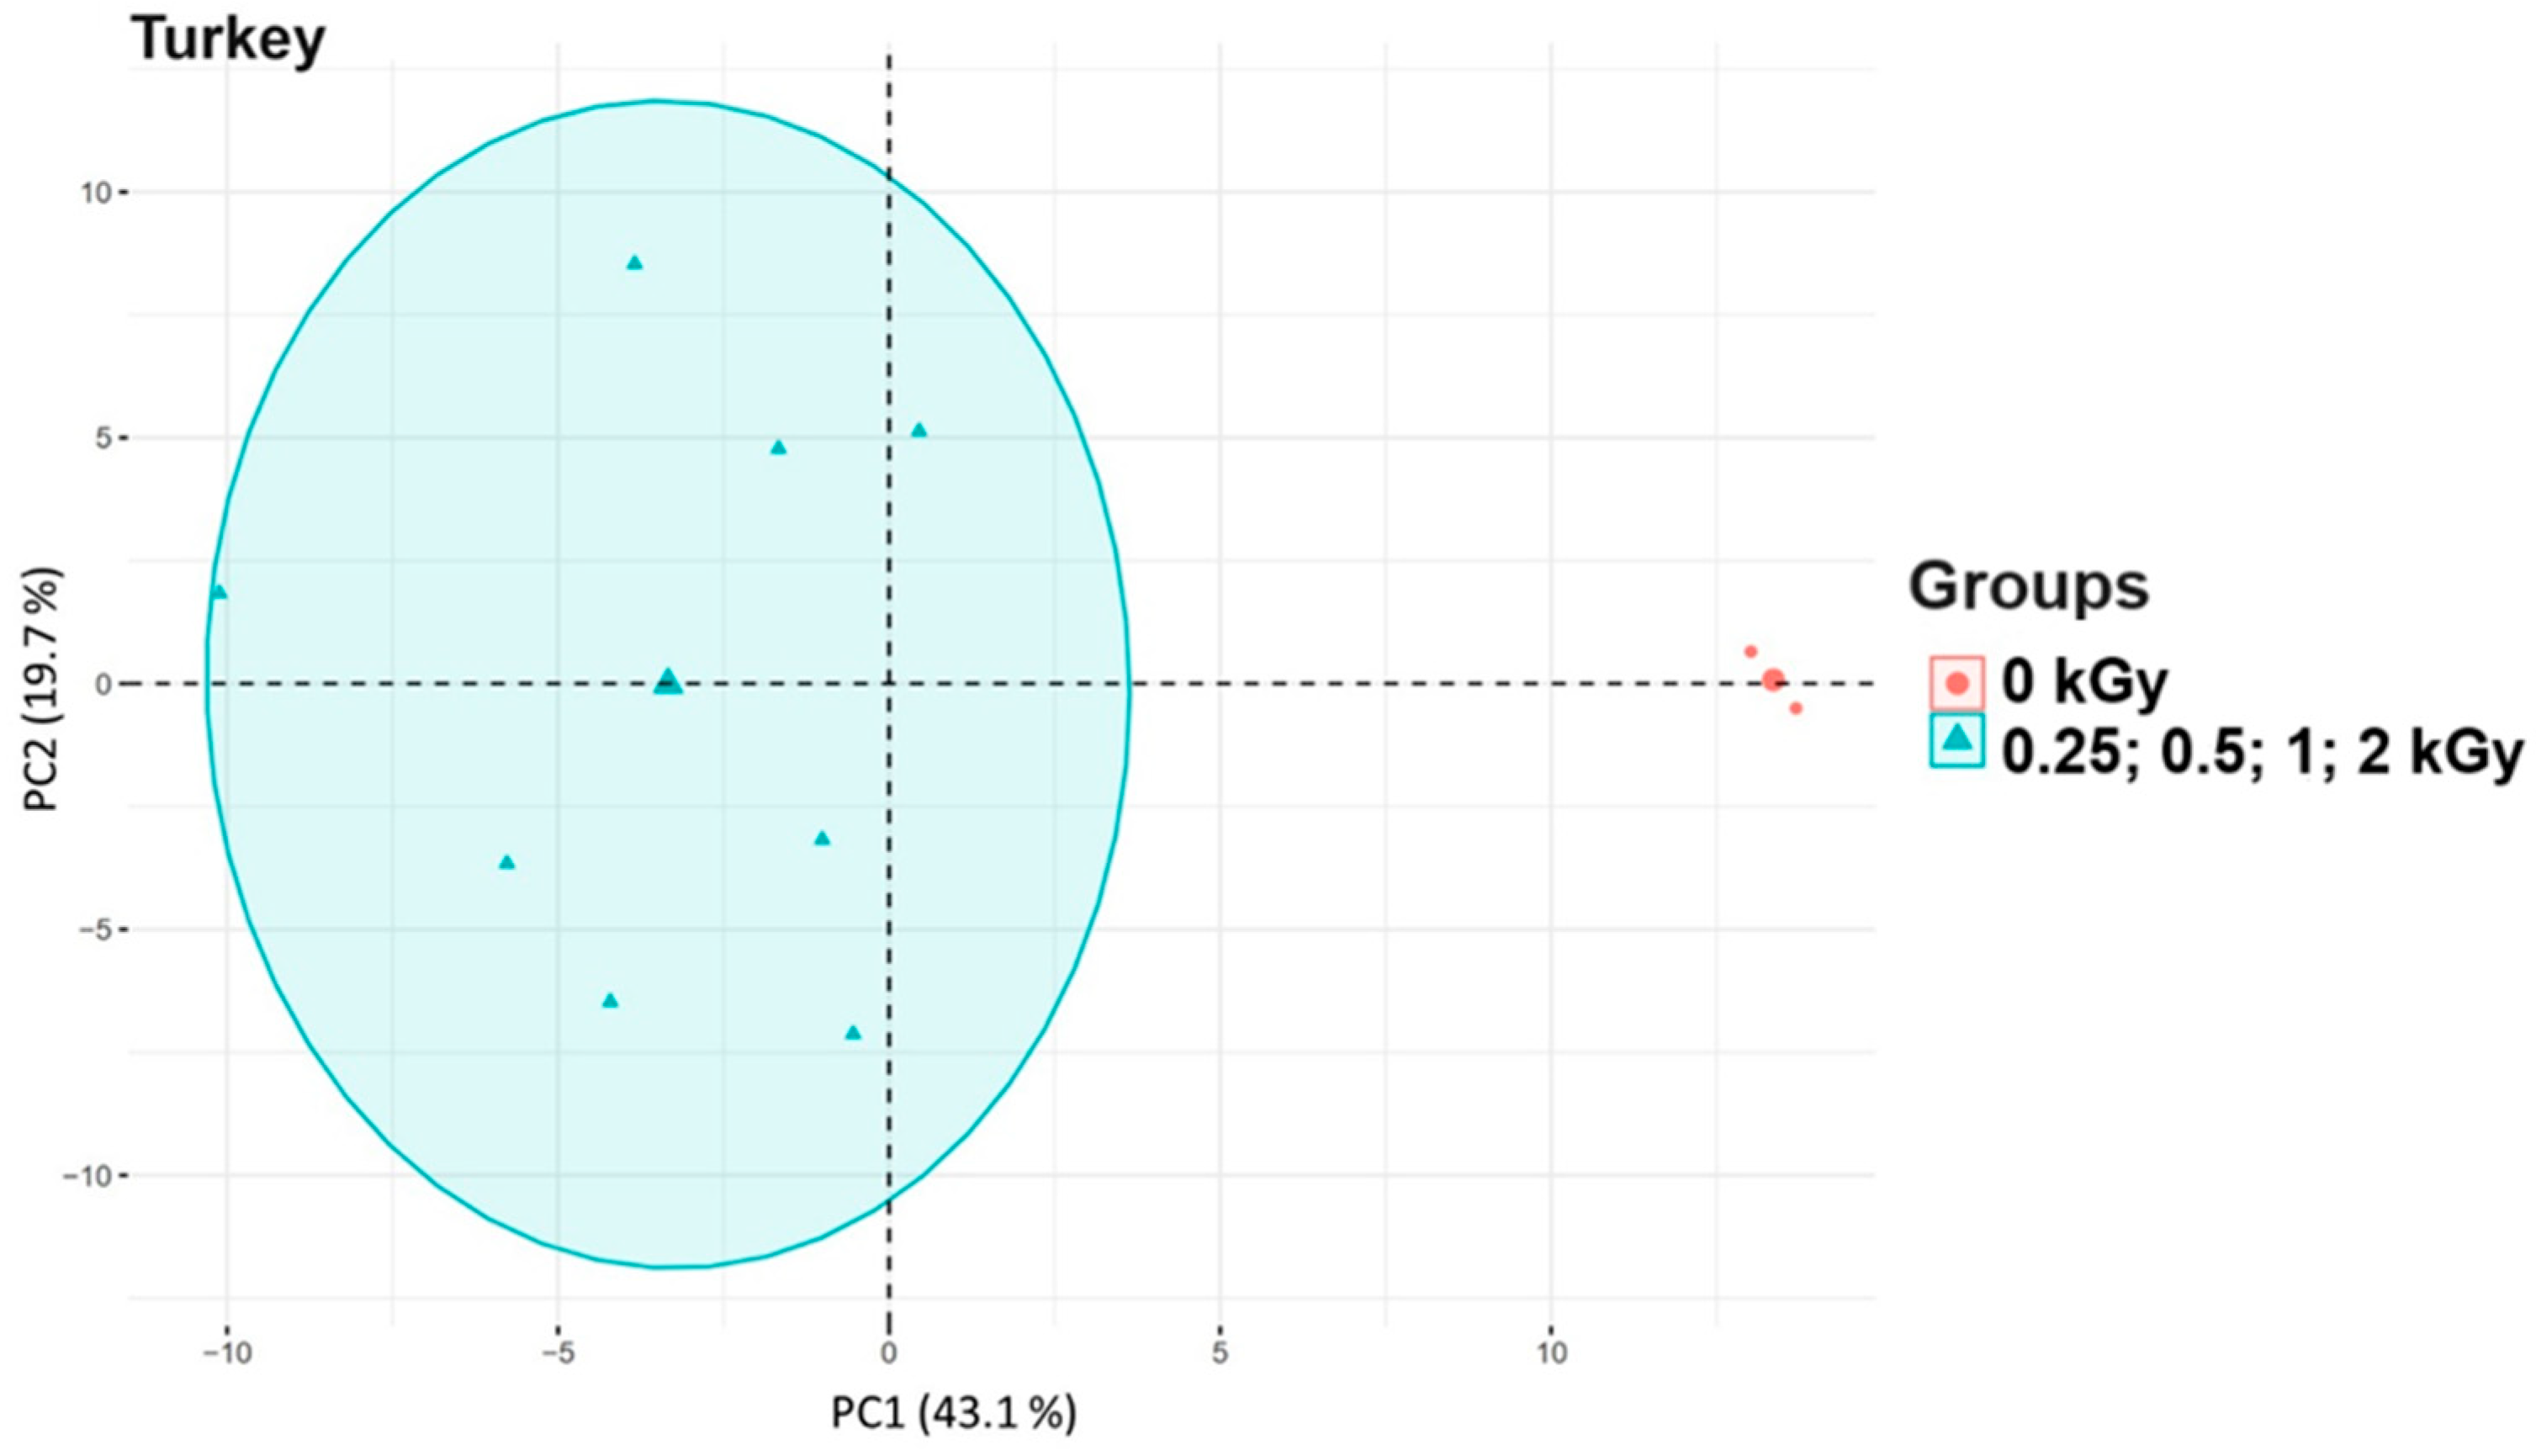
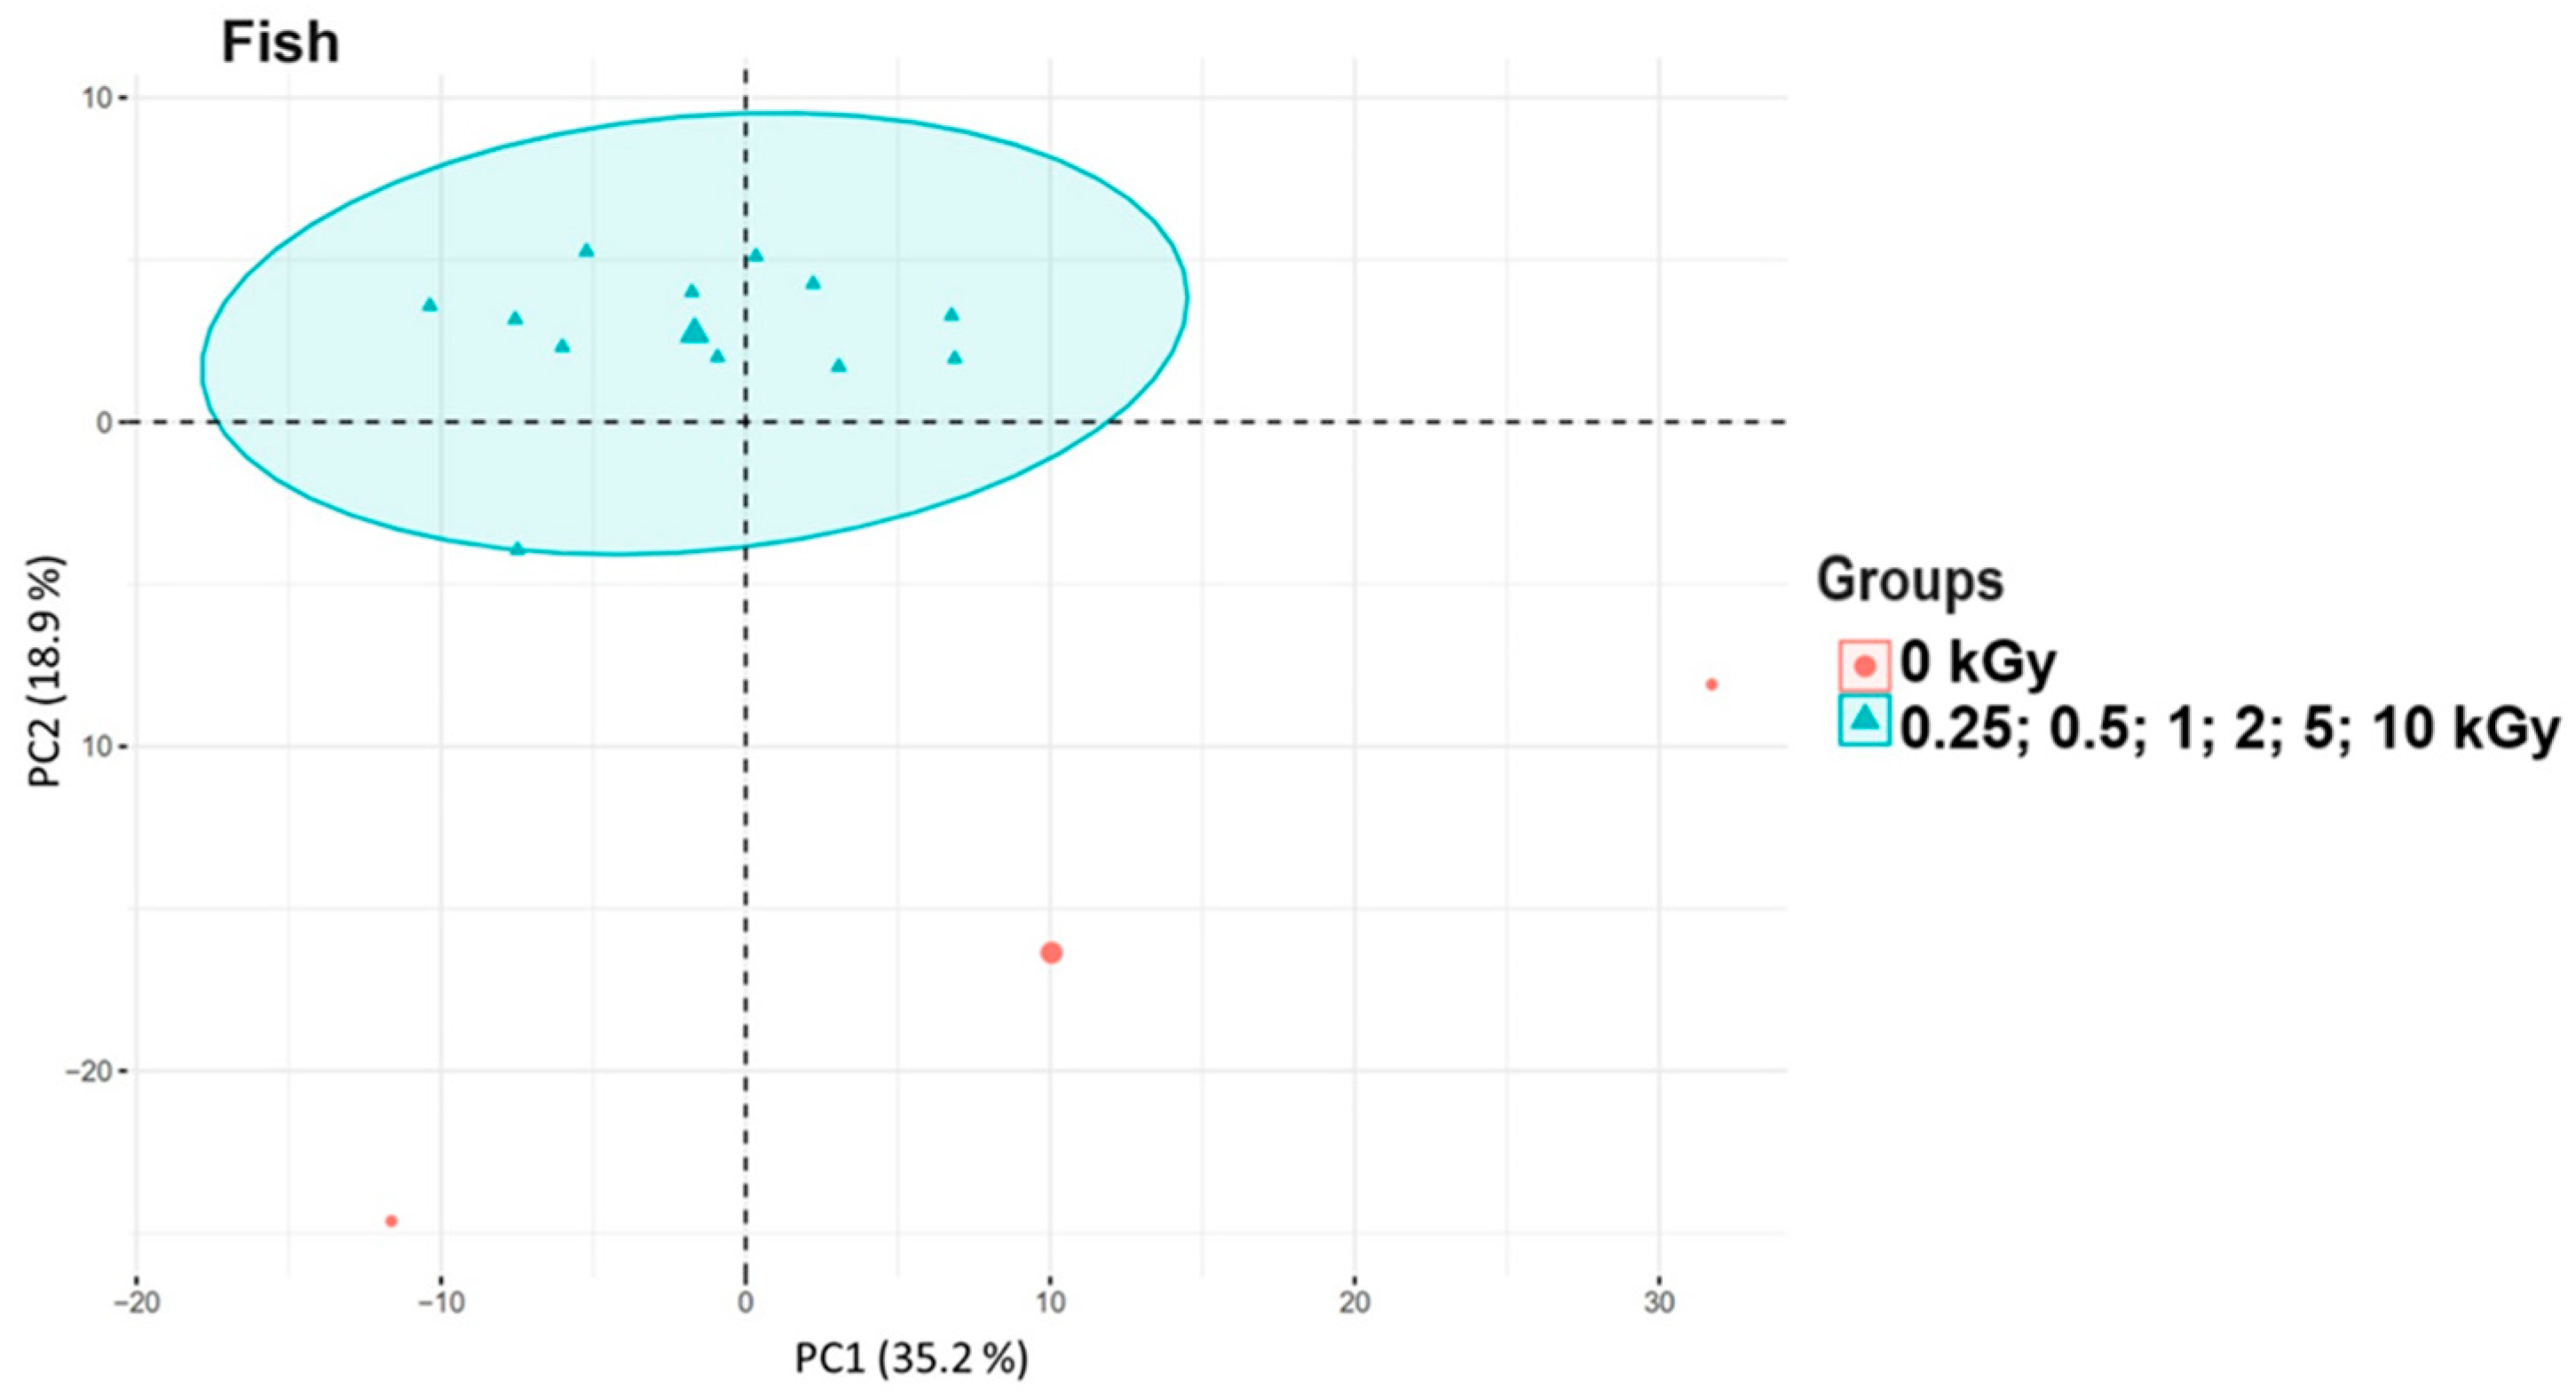
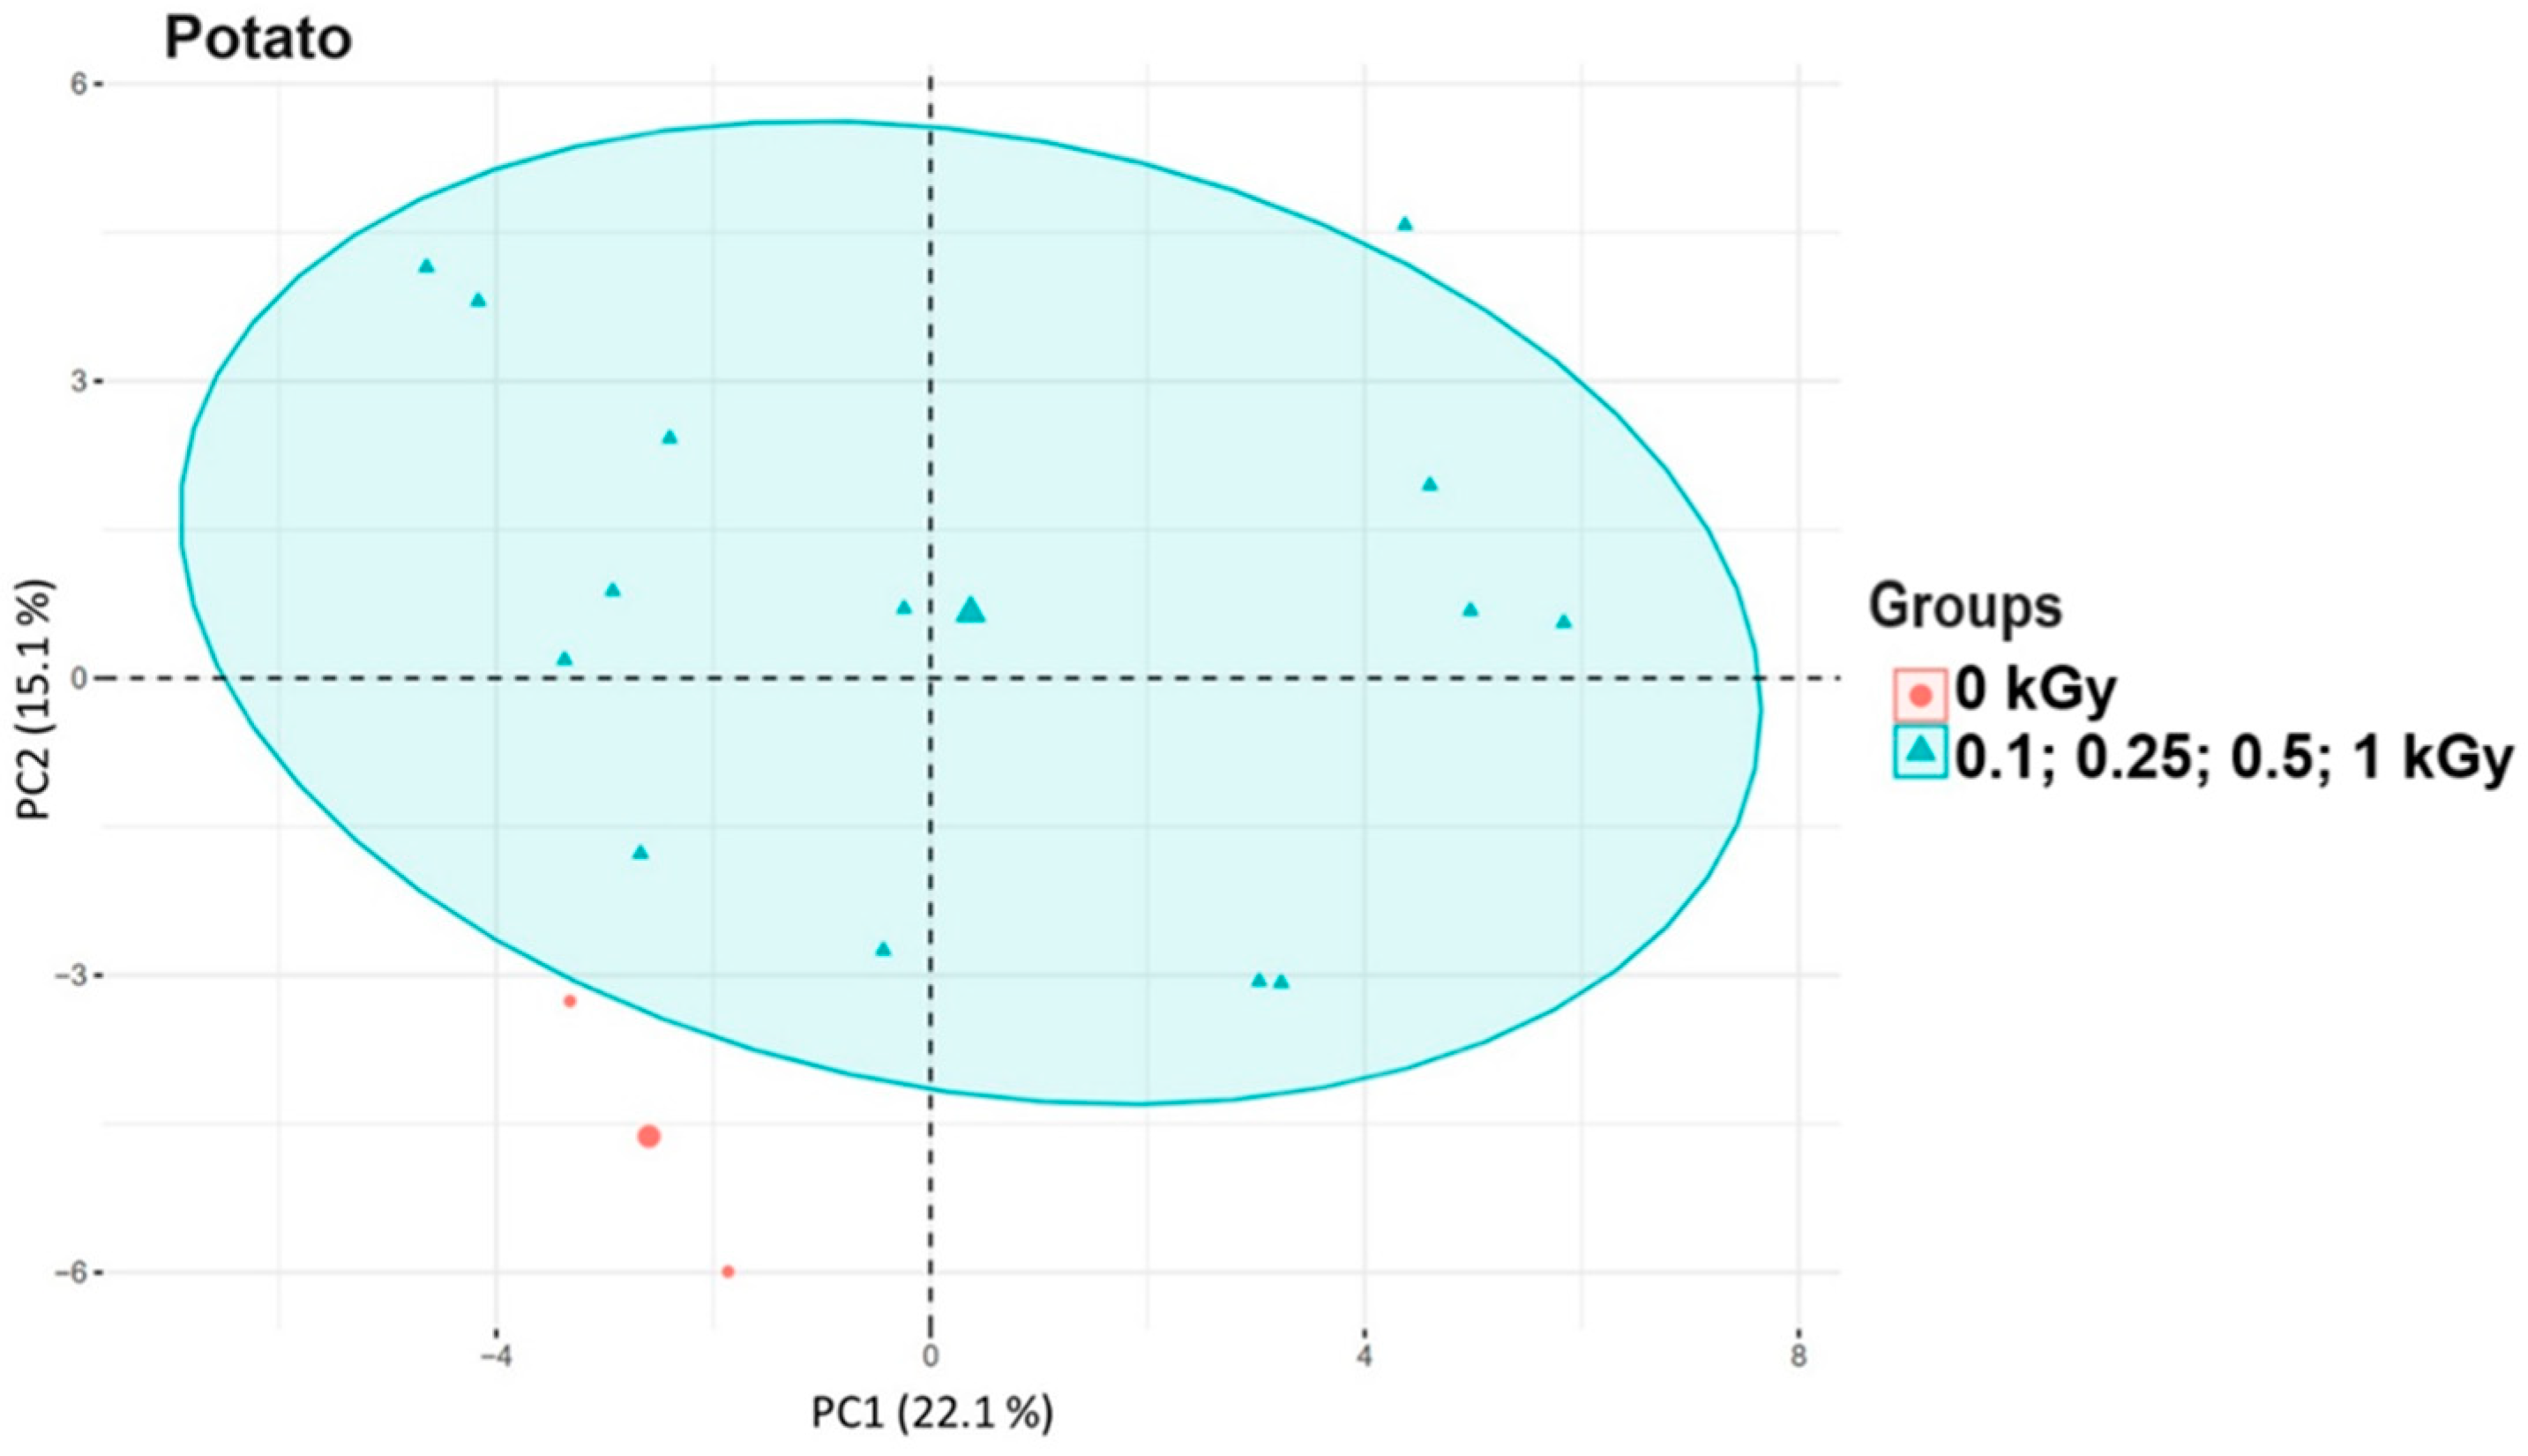
3.3. Principal Component Analysis of Food Samples After Irradiation

Figure 6, Figure 7, Figure 8, Figure 9 and Figure 10 show discrimination plots of data sets obtained by processing chromatograms of irradiated and non-irradiated samples of turkey, beef, chicken, fish, and potato, respectively. A visual analysis of the sample projections on the principal component planes shows a noticeable clustering of the irradiated and control samples, demonstrating the informative nature of the accumulated data set and the ability to differentiate irradiated samples from non-irradiated ones. The first two principal components in the case of each product contain sufficient information, so the plots are plotted in the coordinates of the first two principal components. Figure 6 shows a plot of the scores of turkey samples irradiated with different doses compared to non-irradiated samples. The first two principal components (PC1 and PC2) explain 43.1% and 19.7% (a total of 62.8%) of the information.
The main contribution to the separation of irradiated and non-irradiated beef samples is made by aldehydes. First, the number of aldehydes increases from the non-irradiated to irradiated beef samples, and second, the concentration of most of them also increases. Although this relationship is not linear, the total concentration of all identifiable aldehydes is almost 40% lower in the non-irradiated sample than in the sample exposed to a minimum dose of 0.25 kGy. In salmon samples, aldehydes, which are the lipid oxidation products, also predominate among all identified volatile compounds, and the overall concentration of aldehydes increases with an increase in the irradiation dose. While most VOCs demonstrate erratic behavior in response to different irradiation doses, especially in the case of poultry meat and potatoes, aldehydes, which are lipid and protein oxidation products, are more predictable and, therefore, particularly interesting for further research involving machine learning algorithms.
Since most of the aldehydes identified in the food products showed an increase in concentration with an increase in irradiation dose, and these aldehydes are oxidation products of fats and proteins, their content can serve as a potential marker for selecting doses that ensure no physical and chemical changes occur in the product during irradiation. The use of PCA for processing aldehyde content data in food products of different chemical compositions irradiated with different doses will help determine specific doses for each product type that avoid intensive lipid and protein oxidation while enabling the identification of irradiated food products.

4. Conclusions

In the course of the study, it was found that aldehydes (pentanal, hexanal, heptanal, etc.), unlike other VOCs, form rather predictable patterns when products of different compositions are irradiated. Since the amount of most aldehydes increased with an increase in the radiation dose, the total content of aldehydes can be used as a potential marker for a wide range of food products to determine optimal irradiation dose ranges and to detect the occurrence of food irradiation.
To discriminate between irradiated and non-irradiated products of animal and plant origin, we developed an approach on the basis of the PCA method which uses VOC data obtained by GC-MS. Using this approach, it was found that the most effective discrimination of irradiated and non-irradiated food samples was achieved for salmon. Most likely, this is due to a higher content of unsaturated fatty acids in the fish compared to beef and poultry, which ensures a high yield of various VOCs (mainly aldehydes), due to the processes of lipid oxidation. For plant-based products, such as potatoes, which contain mostly carbohydrates, the yield and diversity of VOCs are relatively poor, so samples are poorly discriminated using the PCA method.
Industrial food irradiation can benefit from the processing of VOCs using machine learning algorithms, as this advanced method allows for the precise determination of optimal dose ranges for different types of products, which would inhibit microbial contamination without causing an undesirable change in the quality of food products. Since it has been confirmed that the aldehydes can serve as universally applicable and highly reliable markers for the identification of irradiated food samples, the focus on aldehydes will enhance the criteria for determining the upper limit of the optimal dose range which does not lead to oxidation of macronutrients in foods.
Another application of these findings lies in detecting whether a product has been irradiated. A great variety of foods with different chemical compositions calls for an advanced approach that would enable the identification of irradiated food to prevent overexposure or underexposure in the absence of clear information on irradiation processing by the manufacturer. Considering the complexity of the behavior of VOCs in food products in response to different irradiation doses, further studies will benefit from using the combination of VOC data and machine learning algorithms.
The results of this study highlight the importance of applying multivariate analysis methods to large data sets obtained from GC-MS studies. Future research could focus on other methods for classifying and clustering different food products according to the detectable VOCs responsible for differences between samples, as well as assessing the impact of different processing conditions on food composition and quality.

Author Contributions

Conceptualization, U.B.; methodology, U.B. and E.K.; irradiation, V.I., P.B. and D.Y.; experiment preparation A.O., I.A. and T.B., data analysis and visualization, Y.I.; validation, U.B. and P.B.; data curation, U.B., I.A., N.B. and E.K.; all authors discussed the data; formal analysis, U.B., P.B. and V.I.; writing—original draft preparation, A.O. and I.R.; writing—review and editing, E.K., V.I., U.B., T.B., P.B., I.A., Y.I., D.Y., N.B. and A.C.; supervision, I.R. and A.C. All authors have read and agreed to the published version of the manuscript.

Funding

This research was funded by the Russian Science Foundation, grant 22-63-00075.

Institutional Review Board Statement

Not applicable.

Informed Consent Statement

Not applicable.

Data Availability Statement

The original contributions presented in this study are included in the article. Further inquiries can be directed to the corresponding author.

Acknowledgments

GC-MS analysis was perfomed with a GCMS 2010Ultra (Shimadzu, Japan) from Moscow University Development Program.

Conflicts of Interest

The authors declared no potential conflicts of interest with respect to the research, authorship, and/or publication of this article.

Appendix A

Table A1. Volatile organic compounds detected in irradiated and non-irradiated beef samples (n = 3, p = 0.95).
VOCsRetention Time, minSimilarity Search *, %/Peak Area, TIC × 105
Acetaldehyde (1) Dose 0 kGyDose 0.25 kGyDose 0.5 kGyDose 1 kGyDose 5 kGy
4.8898/44 ± 998/41 ± 898/36 ± 798/35 ± 798/39 ± 8
Methanethiol (2)5.2395/4.0 ± 1.293/3.9 ± 1.294/3.9 ± 1.294/3.5 ± 1.196/3.1 ± 0.9
Ethanol (3)6.8576/0.26 ± 0.09ND 177/0.65 ± 0.2376/0.36 ± 0.1385/0.19 ± 0.07
Acetone (4)7.7796/18 ± 497/16 ± 397/13 ± 397/14 ± 397/17 ± 3
Dimethylsulfide (5)7.9394/0.083 ± 0.029ND89/2.1 ± 0.690/2.3 ± 0.794/3.5 ± 1.1
Propanal,2-methyl (6)10.0286/0.42 ± 0.1593/0.70 ± 0.2585/0.40 ± 0.1487/0.46 ± 0.1693/1.0 ± 0.4
2,3-butanedione (7)11.5194/0.60 ± 0.2194/1.6 ± 0.594/1.2 ± 0.493/1.2 ± 0.495/1.5 ± 0.5
Butanone-2 (8)11.8082/0.45 ± 0.1688/0.48 ± 0.1782/0.41 ± 0.1488/0.72 ± 0.2596/2.8 ± 0.8
Butanal,3-methyl (9)14.1280/0.24 ± 0.0881/0.13 ± 0.0584/0.10 ± 0.0482/0.31 ± 0.1186/0.74 ± 0.26
Butanal,2-methyl (10)14.43ND77/0.098 ± 0.034NDND87/0.49 ± 0.15
Pentanal (11)15.8478/0.30 ± 0.1187/0.51 ± 0.1890/0.67 ± 0.2385/0.49 ± 0.1790/0.86 ± 0.30
Hexanal (12)19.8392/1.2 ± 0.494/2.9 ± 0.995/4.5 ± 1.495/3.5 ± 1.195/8.9 ± 2.7
Heptanal (13)23.4585/0.25 ± 0.0996/1.0 ± 0.397/2.0 ± 0.694/1.2 ± 0.496/1.6 ± 0.5
Octanal (14)26.75ND89/0.42 ± 0.1593/0.61 ± 0.2187/0.36 ± 0.1391/0.60 ± 0.21
Nonanal (15)29.7789/0.25 ± 0.0992/0.43 ± 0.1592/0.61 ± 0.2189/0.45 ± 0.1691/0.78 ± 0.27
1-hexanol, 2-ethyl (16)27.54ND80/0.20 ± 0.0786/0.25 ± 0.09ND89/0.17 ± 0.06
1 ND—Not detected. Similarity search *—the degree of agreement between the library and experimentally obtained mass spectra.
Table A2. Volatile organic compounds detected in irradiated and non-irradiated chicken samples (n = 3, p = 0.95).
VOCsRetention Time, minSimilarity Search *, %/Peak Area, TIC × 105
Dose 0 kGyDose 0.25 kGyDose 0.5 kGyDose 1 kGyDose 2 kGyDose 5 kGyDose 10 kGyDose 20 kGy
Acetaldehyde (1)4.8897/71 ± 1497/50 ± 1097/50 ± 1096/32 ± 697/40 ± 897/44 ± 995/28 ± 696/28 ± 6
Methanethiol (2)5.2388/7.0 ± 2.187/4.1 ± 1.284/1.4 ± 0.490/1.2 ± 0.4ND 180/2.9 ± 0.995/3.4 ± 1.184/3.9 ± 1.2
Ethanol (3)6.78NDND87/2.5 ± 0.897/37 ± 797/15 ± 397/25 ± 598/31 ± 697/35 ± 7
Acetone (4)7.7793/9.2 ± 2.789/5.0 ± 1.591/11 ± 291/8.6 ± 2.385/12 ± 293/8.4 ± 2.590/7.0 ± 0.2.1 93/20 ± 4
2,3-Butanedione (7)11.56NDNDNDND87/4.7 ± 1.491/7.8 ± 2.392/4.6 ± 1.483/5.3 ± 1.6
Pentanal (11)15.91ND87/2.8 ± 0.882/7.2 ± 2.281/0.65 ± 0.2382/0.10 ± 0.0486/0.66 ± 0.23NDND
Hexanal (12)19.9290/12 ± 293/33 ± 793/72 ± 1491/65 ± 1392/61 ± 1892/73 ± 2291/11 ± 386/5.9 ± 1.8
1-hexanol, 2-ethyl (16)27.6295/16 ± 395/8.6 ± 2.686/1.5 ± 0.592/8.7 ± 2.687/5.7 ± 1.787/1.5 ± 0.587/0.74 ± 0.26ND
1 ND—Not detected. Similarity search *—the degree of agreement between the library and experimentally obtained mass spectra.
Table A3. Volatile organic compounds detected in irradiated and non-irradiated turkey samples (n = 3, p = 0.95).
VOCsRetention Time, minSimilarity Search *, %/Peak Area, TIC × 105
Acetaldehyde (1) Dose 0 kGyDose 0.25 kGyDose 0.5 kGyDose 1 kGyDose 2 kGy
4.9098/12 ± 298/6.1 ± 1.897/4.3 ± 1.397/6.1 ± 1.898/6.0 ± 1.8
Ethanol (3)6.7998/21 ± 498/32 ± 696/6.8 ± 2.094/3.8 ± 1.197/15 ± 3
Acetone (4)7.8396/9.6 ± 2.997/8.6 ± 2.697/6.4 ± 1.997/5.2 ± 1.696/4.7 ± 1.4
Isopropyl Alcohol (17)8.0986/1.9 ± 0.693/1.7 ± 0.592/1.5 ± 0.590/1.6 ± 0.589/1.7 ± 0.5
2,3-butanedione (7)11.5598/33 ± 798/13 ± 398/4.1 ± 1.297/2.9 ± 0.998/4.9 ± 1.5
Pentanal (11)15.1888/0.73 ± 0.2691/1.1 ± 0.390/0.83 ± 0.2990/1.1 ± 0.389/0.80 ± 0.28
2-Butanone, 3-hydroxy (18)17.4996/3.0 ± 0.993/1.7 ± 0.586/0.65 ± 0.2383/0.24 ± 0.0891/1.6 ± 0.5
Pentanol-1 (19)18.91ND 186/0.94 ± 0.3386/0.85 ± 0.390/0.96 ± 0.3488/0.99 ± 0.35
Hexanal (12)19.9396/0.4896/10.4 ± 3.195/8.1 ± 2.496/9.3 ± 2.895/7.3 ± 2.2
2,3-butanediol (20)20.7782/2.2 ± 0.789/2.5 ± 0.8NDNDND
Hexanol-1 (21)22.5287/0.57 ± 0.2091/0.93 ± 0.3385/0.28 ± 0.1083/0.33 ± 0.1291/0.63 ± 0.22
1-hexanol, 2-ethyl (16)27.6483/0.32 ± 0.1190/0.54 ± 0.1984/0.35 ± 0.1288/0.42 ± 0.1592/0.87 ± 0.3
Heptanal (13)23.56ND81/0.077 ± 0.02587/0.13 ± 0.0590/0.13 ± 0.0589/0.12 ± 0.04
Nonanal (15)29.8981/0.23 ± 0.0885/0.25 ± 0.0983/1.5 ± 0.584/2.5 ± 0.886/0.35 ± 0.11
1 ND—Not detected. Similarity search *—the degree of agreement between the library and experimentally obtained mass spectra.
Table A4. Volatile organic compounds detected in irradiated and non-irradiated salmon samples (n = 3, p = 0.95).
VOCsRetention Time, minSimilarity Search *, %/Peak Area, TIC × 105
Dose 0 kGyDose 0.25 kGyDose 0.5 kGyDose 1 kGyDose 2 kGyDose 5 kGyDose 10 kGy
Acetaldehyde (1)4.9898/140 ± 3098/140 ± 3098/110 ± 2098/160 ± 3098/160 ± 3098/220 ± 4098/160 ± 30
Trimethylamine (22)5.5594/11 ± 293/20 ± 487/16 ± 380/4.5 ± 1.485/6.2 ± 1.982/4.2 ± 1.388/2.4 ± 0.7
Ethanol (3)6.8898/63 ± 1398/75 ± 1598/180 ± 4098/160 ± 3098/270 ± 5098/430 ± 9098/550 ± 110
Propanal (23)7.75ND 187/0.26 ± 0.0991/2.5 ± 0.892/4.4 ± 1.395/11 ± 388/4.9 ± 1.585/3.1 ± 0.9
Acetone (4)7.9584/3.8 ± 1.186/4.2 ± 1.387/4.3 ± 1.392/5.9 ± 1.889/10.1 ± 3.080/4.2 ± 1.390/7.0 ± 2.1
Isopropyl Alcohol (17)8.2186/5.6 ± 1.788/2.4 ± 0.788/6.1 ± 1.885/2.8 ± 0.8ND87/3.4 ± 1.0ND
Propanal, 2-methyl (6)10.2086/3.2 ± 1.087/8.9 ± 2.787/2.4 ± 0.791/2.6 ± 0.883/2.1 ± 0.685/2.1 ± 0.693/1.3 ± 0.4
2,3-butanedion (7)11.6493/16 ± 395/12 ± 293/9.6 ± 2.993/17 ± 394/14 ± 395/18 ± 493/17 ± 3
Butanal, 3-metlyl- (9)14.2880/3.2 ± 1.082/3.2 ± 1.080/2.3 ± 0.782/5.5 ± 1.784/5.9 ± 1.878/4.4 ± 1.379/4.1 ± 1.2
Ethylcyclopropanol (24)15.6087/2.1 ± 0.686/1.4 ± 0.488/2.5 ± 0.887/6.6 ± 2.088/6.1 ± 1.887/6.3 ± 1.988/7.3 ± 2.2
Pentanal (11)15.7983/3.1 ± 0.9ND80/1.0 ± 0.483/8.5 ± 2.686/6.1 ± 1.881/6.5 ± 2.080/5.1 ± 1.5
Pentanol-1 (19)17.8784/1.1 ± 0.379/2.1 ± 0.686/0.70 ± 0.2579/0.23 ± 0.0885/0.74 ± 0.2688/1.6 ± 0.591/1.1 ± 0.3
Hexanal (12)19.8088/6.6 ± 2.090/4.9 ± 1.589/5.9 ± 1.891/2.3 ± 0.793/24 ± 593/21 ± 492/19 ± 4
Nonanal (15)29.8081/1.6 ± 0.584/3.2 ± 1.0ND84/1.9 ± 0.687/3.6 ± 1.1ND90/4.4 ± 1.3
1 ND—Not detected. Similarity search *—the degree of agreement between the library and experimentally obtained mass spectra.
Table A5. Volatile organic compounds detected in irradiated and non-irradiated potato samples (n = 3, p = 0.95).
VOCsRetention Time, minSimilarity Search *, %/Peak Area, TIC × 105
Acetaldehyde (1) Dose 0 kGyDose 0.1 kGyDose 0.25 kGyDose 0.5 kGyDose 1 kGy
4.80ND 1ND80/1.9 ± 0.679/1.7 ± 0.579/1.1 ± 0.3
Methanethiol (2)5.26ND80/4.6 ± 1.483/3.2 ± 1.087/2.6 ± 0.8ND
Acetone (4)7.8088/9.4 ± 2.891/12 ± 295/26 ± 594/18 ± 493/20 ± 4
Propanal,2-methyl (6)9.9492/4.5 ± 1.486/5.1 ± 1.588/5.6 ± 1.789/8.5 ± 2.684/6.3 ± 1.9
Butanal,3-methyl (9)14.181/3.3 ± 1.079/1.9 ± 0.680/3.6 ± 1.184/3.6 ± 1.176/3.8 ± 1.1
Butanal,2-methyl (10)14.484/3.7 ± 1.180/2.0 ± 0.677/2.8 ± 0.887/4.1 ± 1.279/3.1 ± 0.9
1 ND—Not detected. Similarity search *—the degree of agreement between the library and experimentally obtained mass spectra.

References

  1. Hallman, G.J. Control of stored product pests by ionizing radiation. J. Stored Prod. Res. 2013, 52, 36–41. [Google Scholar] [CrossRef]
  2. Lizikova, M.S. The role of the IAEA in solving problems in the field of food and agriculture. Agrar. Land Law 2020, 7, 111–115. [Google Scholar]
  3. IAEA Report 2023. Available online: https://www.iaea.org/sites/default/files/gc/gc67-inf4_rus_1.pdf (accessed on 10 December 2024).
  4. Mshelia, R.D.; Dibal, N.I.; Chiroma, S.M. Food irradiation: An effective but under-utilized technique for food preservations. J. Food Sci. Technol. 2023, 60, 2517–2525. [Google Scholar] [CrossRef] [PubMed]
  5. Shah, M.A.; Mir, S.A.; Pala, S.A. Enhancing food safety and stability through irradiation: A review. J. Microbiol. Biotechnol. Food Sci. 2014, 3, 371–378. [Google Scholar]
  6. Gautam, S.; Tripathi, J. Food Processing by Irradiation–An effective technology for food safety and security. Indian J. Exp. Biol. 2016, 54, 700–707. [Google Scholar]
  7. Joshua Ajibola, O. An overview of irradiation as a food preservation technique. Nov. Res. Microbiol. J. 2020, 4, 779–789. [Google Scholar]
  8. Indiarto, R.; Pratama, A.W.; Sari, T.I.; Theodora, H.C. Food irradiation technology: A review of the uses and their capabilities. Int. J. Eng. Trends Technol. 2020, 68, 91–98. [Google Scholar] [CrossRef]
  9. Yang, J.; Pan, M.; Han, R.; Yang, X.; Liu, X.; Yuan, S.; Wang, S. Food irradiation: An emerging processing technology to improve the quality and safety of foods. Food Rev. Int. 2023, 40, 2321–2343. [Google Scholar] [CrossRef]
  10. Chulikova, N.; Malyuga, A.; Borshchegovskaya, P.; Zubritskaya, Y.; Ipatova, V.; Chernyaev, A.; Yurov, D.; Zolotov, S.; Nikitchenko, A.; Bliznyuk, U.; et al. Electron Beam Irradiation to Control Rhizoctonia solani in Potato. Agriculture 2023, 13, 1221. [Google Scholar] [CrossRef]
  11. Bliznyuk, U.; Avdyukhina, V.; Borshchegovskaya, P.; Bolotnik, T.; Ipatova, V.; Nikitina, Z.; Nikitchenko, A.; Rodin, I.; Studenikin, F.; Chernyaev, A.; et al. Effect of electron and X-ray irradiation on microbiological and chemical parameters of chilled turkey. Sci. Rep. 2020, 12, 750. [Google Scholar] [CrossRef]
  12. Yurna, D.A.; Frolov, D.I. Technologies for safe conservation of products of animal origin. Innov. Technol. Technol. 2023, 10, 44–51. [Google Scholar]
  13. Chauhan, S.K.; Kumar, R.; Nadanasabapathy, S.; Bawa, A.S. Detection methods for irradiated foods. Compr. Rev. Food Sci. Food Saf. 2009, 8, 4–16. [Google Scholar] [CrossRef]
  14. Zeb, A.; Ullah, F. A Simple Spectrophotometric Method for the Determination of Thiobarbituric Acid Reactive Substances in Fried Fast Foods. J. Anal. Methods Chem. 2016, 2016, 9412767. [Google Scholar] [CrossRef] [PubMed]
  15. Rieger, P.H. Electron spin resonance: Analysis and interpretation. In Royal Society of Chemistry; RSC Publishing: London, UK, 2007. [Google Scholar]
  16. Ukai, M.; Kameya, H.; Nakamura, H.; Shimoyama, Y. An electron spin resonance study of dry vegetables before and after irradiation. Spectrochim. Acta Part A Mol. Biomol. Spectrosc. 2008, 69, 1417–1422. [Google Scholar] [CrossRef]
  17. Barba, F.J.; Roohinejad, S.; Ishikawa, K.; Leong, S.Y.; Bekhit, A.E.D.A.; Saraiva, J.A.; Lebovka, N. Electron spin resonance as a tool to monitor the influence of novel processing technologies on food properties. Trends Food Sci. Technol. 2020, 100, 77–87. [Google Scholar] [CrossRef]
  18. Jung, Y.K.; Lee, J.Y.; Kang, T.S.; Jo, C.H.; Lee, J.H.; Choi, J.D.; Kwon, K.S. Detection of irradiated food using photostimulated luminescence and thermoluminescence. Korean J. Food Sci. Technol. 2016, 48, 399–404. [Google Scholar] [CrossRef]
  19. Murthy, K.V.R.; Rey, L.; Belon, P. Photoluminescence and thermally stimulated luminescence characteristics of rice flour. J. Lumin. 2007, 122, 279–283. [Google Scholar] [CrossRef]
  20. Wahyono, T.; Firmansyah, A.M.; Febrisiantosa, A.; Setiyawan, A.I.; Karimy, M.F.; Trinugraha, A.C.; Sholikin, M.M.; Benita, A.M.; Jayanegara, A. Thiobarbituric Acid Reactive Substances (TBARS) and quality of poultry meat as affected by electron beam irradiation: A meta-analysis study. In Developing Modern Livestock Production in Tropical Countries; CRC Press: Boca Raton, FL, USA, 2023; pp. 34–38. [Google Scholar]
  21. Khalid, W.; Arshad, M.S.; Yasin, M.; Imran, A.; Ahmad, M.H. Quality characteristics of gamma irradiation and kale leaf powder treated ostrich and chicken meat during storage. Int. J. Food Prop. 2021, 24, 1335–1348. [Google Scholar] [CrossRef]
  22. Feiner, G. Meat and Fat. In Salami; Academic Press: Cambridge, MA, USA, 2016; pp. 3–30. [Google Scholar]
  23. Parke, D.N.; Rogers, R.W.; Althen, T.G.; Martin, J.M. Meat Irradiation. Prof. Anim. Sci. 2005, 21, 75–80. [Google Scholar] [CrossRef]
  24. Nam, H.A.; Ramakrishnan, S.R.; Kwon, J.H. Effects of electron-beam irradiation on the quality characteristics of mandarin oranges (Citrus unshiu (Swingle) Marcov) during storage. Food Chem. 2019, 286, 338–345. [Google Scholar] [CrossRef]
  25. Feng, X.; Moon, S.; Lee, H.; Ahn, D.U. Effect of irradiation on the parameters that influence quality characteristics of uncured and cured cooked turkey meat products. Poult. Sci. 2016, 95, 2986–2992. [Google Scholar] [CrossRef] [PubMed]
  26. Lee-Rangel, H.A.; Mendoza-Martinez, G.D.; Diaz de León-Martínez, L.; Relling, A.E.; Vazquez-Valladolid, A.; Palacios-Martínez, M.; Roque-Jiménez, J.A. Application of an electronic nose and HS-SPME/GC-MS to determine volatile organic compounds in fresh mexican cheese. Foods 2022, 11, 1887. [Google Scholar] [CrossRef] [PubMed]
  27. Mei, H.; Peng, J.; Wang, T.; Zhou, T.; Zhao, H.; Zhang, T.; Yang, Z. Overcoming the limits of cross-sensitivity: Pattern recognition methods for chemiresistive gas sensor array. Nano-Micro Lett. 2024, 16, 269. [Google Scholar] [CrossRef] [PubMed]
  28. Zong, B.; Wu, S.; Yang, Y.; Li, Q.; Tao, T.; Mao, S. Smart Gas Sensors: Recent Developments and Future Prospective. Nano-Micro Lett. 2025, 17, 54. [Google Scholar] [CrossRef] [PubMed]
  29. Lee, K.C.; Park, J.H.; Kim, J.K.; Park, H.Y.; Yoon, Y.S.; Eun, J.B.; Song, B.S. Rapid Identification Method for Gamma-Irradiated Soybeans Using Gas Chromatography–Mass Spectrometry Coupled with a Headspace Solid-Phase Microextraction Technique. J. Agric. Food Chem. 2020, 68, 2803–2815. [Google Scholar] [CrossRef]
  30. Zianni, R.; Mentana, A.; Tomaiuolo, M.; Campaniello, M.; Iammarino, M.; Centonze, D.; Palermo, C. Volatolomic approach by HS-SPME/GC–MS and chemometric evaluations for the discrimination of X-ray irradiated mozzarella cheese. Food Chem. 2020, 423, 136239. [Google Scholar] [CrossRef]
  31. Rababah, T.; Hettiarachchy, N.S.; Horax, R.; Cho, M.J.; Davis, B.; Dickson, J. Thiobarbituric acid reactive substances and volatile compounds in chicken breast meat infused with plant extracts and subjected to electron beam irradiation. Poult. Sci. 2006, 85, 1107–1113. [Google Scholar] [CrossRef]
  32. Li, C.; He, L.; Jin, G.; Ma, S.; Wu, W.; Gai, L. Effect of different irradiation dose treatment on the lipid oxidation, instrumental color and volatiles of fresh pork and their changes during storage. Meat Sci. 2017, 128, 68–76. [Google Scholar] [CrossRef]
  33. Bliznyuk, U.; Borshchegovskaya, P.; Bolotnik, T.; Chernyaev, A.; Ipatova, V.; Nikitchenko, A.; Shinkarev, O.; Yurov, D.; Khmelevskiy, O.; Rodin, I. Research into Gas Chromatography–Mass Spectrometry (GC-MS) for Ensuring the Effect of 1 MeV-Accelerated Electrons on Volatile Organic Compounds in Turkey Meat. Separations 2022, 9, 227. [Google Scholar] [CrossRef]
  34. Taghvaei, M.; Sommers, C.; Ceric, O.; Hussain, F.; Yucel, U.; Smith, J.S. Solid-phase micro extraction of food irradiation marker 2-dodecylcyclobutanone (2-DCB) from chicken jerky treated with glycerol. J. Food Sci. 2020, 85, 2608–2614. [Google Scholar] [CrossRef]
  35. Rodionova, O.E.; Pomerantsev, A.L. Chemometrics: Achievements and prospects. Adv. Chem. 2006, 75, 302–321. [Google Scholar]
  36. Bi, K.; Zhang, D.; Qiu, T.; Huang, Y. GC-MS fingerprints profiling using machine learning models for food flavor prediction. Processes 2019, 8, 23. [Google Scholar] [CrossRef]
  37. Kessner, D.; Chambers, M.; Burke, R.; Agus, D.; Mallick, P. ProteoWizard: Open source software for rapid proteomics tools development. Bioinformatics 2008, 24, 2534–2536. [Google Scholar] [CrossRef] [PubMed]
  38. Domingo-Almenara, X.; Siuzdak, G. Metabolomics data processing using XCMS. In Computational Methods and Data Analysis for Metabolomics; Springer: Berlin/Heidelberg, Germany, 2020; pp. 11–24. [Google Scholar]
  39. Gromski, P.S.; Xu, Y.; Hollywood, K.A.; Turner, M.L.; Goodacre, R. The influence of scaling metabolomics data on model classification accuracy. Metabolomics 2015, 11, 684–695. [Google Scholar] [CrossRef]
  40. Lê, S.; Josse, J.; Husson, F. FactoMineR: An R package for multivariate analysis. J. Stat. Softw. 2008, 25, 1–18. [Google Scholar] [CrossRef]
  41. Zhang, Y.; Liang, Z.; Tang, C.; Liao, W.; Yu, Y.; Li, G.; Yang, Y.; An, T. Malodorous gases production from food wastes decomposition by indigenous microorganisms. Sci. Total Environ. 2020, 717, 137175. [Google Scholar] [CrossRef]
  42. Dinh, T.; To, K.; Schilling, M. Fatty Acid Composition of Meat Animals as Flavor Precursors. Meat Muscle Biol. 2021, 5, 1–16. [Google Scholar] [CrossRef]
  43. Kosowska, M.; Majcher, M.A.; Fortuna, T.; Majcher, M.A. Volatile Compounds in Meat and Meat Products. Food Sci. Technol. 2017, 37, 1–7. [Google Scholar] [CrossRef]
  44. Kim, Y.; Kemp, R.; Samuelsson, L. Effects of dry aging on meat quality attributes and metabolite profiles of beef loins. Meat Sci. 2016, 111, 168–176. [Google Scholar] [CrossRef]
  45. Zareian, M.; Böhner, N.; Loos, H.M.; Silcock, P.; Bremer, P.; Beauchamp, J. Evaluation of Volatile Organic Compound Release in Modified Atmosphere-Packaged Minced Raw Pork in Relation to Shelf-Life. Food Packag. Shelf Life 2018, 18, 51–61. [Google Scholar] [CrossRef]
  46. Bhadury, D.; Nolvachai, Y.; Marriott, P.J.; Tanner, J.; Tuck, K.L. Detection of Volatiles from Raw Beef Meat from Different Packaging Systems Using Solid-Phase Microextraction GC–Accurate Mass Spectrometry. Foods 2021, 10, 2018. [Google Scholar] [CrossRef] [PubMed]
  47. Legako, J.; Cramer, T.; Yardley, K.; Murphy, T.; Gardner, T.; Chail, A.; Pitcher, L.; MacAdam, J. Retail stability of three beef muscles from grass-, legume-, and feedlot-finished cattle. J. Anim. Sci. 2018, 96, 2238–2248. [Google Scholar] [CrossRef]
  48. Casaburi, A.; Piombino, P.; Nychas, G.J.; Villani, F.; Ercolini, D. Bacterial populations and the volatilome associated to meat spoilage. Food Microbiol. 2015, 45, 83–102. [Google Scholar] [CrossRef] [PubMed]
  49. Wang, Y.; Han, J.; Wang, D.; Gao, F.; Zhang, K.; Tian, J.; Jin, Y. Research Update on the Impact of Lactic Acid Bacteria on the Substance Metabolism, Flavor, and Quality Characteristics of Fermented Meat Products. Foods 2022, 11, 2090. [Google Scholar] [CrossRef] [PubMed]
  50. Saraiva, C.; Oliveira, I.; Silva, J.A.; Martins, C.; Ventanas, J.; García, C. Implementation of multivariate techniques for the selection of volatile compounds as indicators of sensory quality of raw beef. Food Sci. Technol. 2015, 52, 3887–3898. [Google Scholar] [CrossRef] [PubMed]
  51. Wojtasik-Kalinowska, I.; Guzek, D.; Górska-Horczyczak, E.; Głąbska, D.; Brodowska, M.; Sun, D.V.; Wierzbicka, A. Volatilecompounds and fatty acids profile in Longissimus dorsi muscle frompigs fed with feed containing bioactive components. LWT Food Sci. Technol. 2016, 67, 112–117. [Google Scholar] [CrossRef]
  52. Servillo, L.; D’onofrio, N.; Giovane, A.; Casale, R.; Cautela, D.; Castaldo, D.; Iannaccone, F.; Neglia, G.; Campanile, G.; Balestrieri, M.L. Ruminant meat and milk contain delta-valerobetaine, another precursor of trimethylamine N-oxide (TMAO) like gamma-butyrobetaine. Food Chem. 2018, 260, 193–199. [Google Scholar] [CrossRef]
Figure 1. Scheme of the chemometric algorithm for GC-MS data processing.
Applsci 15 01333 g001
Figure 2. Heat map of volatile organic compound concentrations in beef, chicken, turkey, salmon and potato irradiated with different doses, expressed in relative units. Dark blue cells show that the compound was not detectable.
Applsci 15 01333 g002
Figure 3. Chromatograms of beef samples: (A)—non-irradiated, (B)—irradiated with 0.25 kGy dose, (C)—irradiated with 0.5 kGy dose, (D)—irradiated with 5 kGy dose. Numbers correspond to the compounds of Table A1.
Applsci 15 01333 g003
Figure 4. Chromatograms of beef (A), turkey (B), fish (C), and chicken (D) samples exposed to a dose of 1 kGy.
Applsci 15 01333 g004
Figure 5. Dependencies of the relative concentration of the aldehydes acetaldehyde (A), hexanal (B), and butanal,3-methyl (C); ketones 2,3-butanedione (D) and acetone (E); the alcohol ethanol (F); and sulfur compound methanethiol (G) on irradiation dose.
Applsci 15 01333 g005aApplsci 15 01333 g005b
Figure 6. PCA plot for the discrimination of control samples and samples exposed to ionizing radiation for turkey.
Applsci 15 01333 g006
Figure 7. PCA plot for the discrimination of control samples and samples exposed to ionizing radiation for beef.
Applsci 15 01333 g007
Figure 8. PCA plot for the discrimination of control samples and samples exposed to ionizing radiation for chicken.
Applsci 15 01333 g008
Figure 9. PCA plot for the discrimination of control samples and samples exposed to ionizing radiation for fish.
Applsci 15 01333 g009
Figure 10. PCA plot for the discrimination of control samples and samples exposed to ionizing radiation for potato.
Applsci 15 01333 g010
Table 1. GC-MS analysis conditions.
GC-MS ParametersValue
ColumnVF-624 MS (60 m × 0.32 mm, film thickness 1.8 µm)
Split mode1:1
Evaporation chamber temperature 250 °C
Column temperature40 °C (5 min) → (6 °C/min) 220 °C (5 min)
Carrier gasHelium
Carrier gas flow rate1.5 cm3/min
Interface temperature 220 °C220 °C
Ion source temperature230 °C
Ionization modeElectron ionization
Electron energy70 eV
Measurement modeScanning
Scanning rangem/z 33–350
Scanning speed3.3 scan/s
Disclaimer/Publisher’s Note: The statements, opinions and data contained in all publications are solely those of the individual author(s) and contributor(s) and not of MDPI and/or the editor(s). MDPI and/or the editor(s) disclaim responsibility for any injury to people or property resulting from any ideas, methods, instructions or products referred to in the content.

