Article

Wavelength Selection for Satellite Quantum Key Distribution

Walton Institute, South East Technological University, X91 P20H Waterford, Ireland
*
Author to whom correspondence should be addressed.
Appl. Sci. 2025, 15(3), 1308; https://doi.org/10.3390/app15031308
Submission received: 18 October 2024 / Revised: 15 January 2025 / Accepted: 21 January 2025 / Published: 27 January 2025
(This article belongs to the Special Issue Quantum Communication and Applications)

Abstract

:
Current distance limitations of quantum key distribution (QKD) over fibre optic networks suggest that satellite (free-space optical) QKD networks will be required to enable global quantum communications. However, the operational availability of these systems is limited by background noise and strong attenuation caused by turbulence and adverse weather conditions. Using the decoy-state BB84 QKD protocol, we evaluate the secret key rate for a range of wavelengths, receiver sizes and initial beam waists through a variety of atmospheric conditions. We combine filtering techniques, adaptive optics, and wavelength selection to optimize the performance of satellite QKD. This study is simulation-based.

1. Introduction

The security of the Internet depends on public-key (asymmetric) cryptography and the inability of computers to solve particular types of computationally intense problems in a short amount of time. Quantum algorithms enabled by quantum computers pose a serious threat to this type of encryption. Shor’s algorithm can factor large integers in polynomial time and could theoretically be used to break many public-key cryptography schemes [1]. This has led researchers to investigate ways to enable quantum-safe data transmission. One of the most promising methods is quantum key distribution (QKD), which uses quantum physics to enable the secure exchange of symmetric cryptography keys between two parties by detecting the presence of an eavesdropper during the exchange [2,3,4]. Despite QKD being one of the most mature quantum technologies, it still lacks the infrastructure to establish a global quantum-safe network. The most common classical communication channel is optical fibre, which can efficiently carry information around the globe by using amplifiers to boost the signal as it travels. In quantum communication, the no-cloning theorem prevents the use of amplifiers [5], causing the probability of the qubit being absorbed or depolarised growing exponentially with the length of the fibre.
The current distance limitation of fibre optic networks for QKD highlights the need to find alternative transmission methods, such as quantum repeaters, photonic crystal fibre and satellite QKD networks. Quantum repeaters work by dividing the communication distance into smaller regions where keys are separately distributed to each region, followed by entanglement exchange and a purification process that links adjacent nodes [6,7]. Hollow core fibre (HCF) offers substantial reductions in nonlinear effects and fibre attenuation [8]. Attenuation in HCF has reduced from 0.174 dB/km [9] to below 0.11 dB/km [10]. This significant reduction in attenuation holds potential for future integrated optical communication systems and long distance quantum communication.
An alternative solution is to use FSOC to establish a satellite–Earth link, as demonstrated by the Micius satellite [11,12], which successfully distributed a key over a distance of 1200 km. Although satellite–Earth FSOC shows promise for long-distance (>1000 km) QKD, it faces several practical challenges [13,14,15,16,17,18], for example, background noise caused by solar radiation, which makes daytime operation very difficult [19,20,21]. Gruneisen et al. have suggested that narrow filtering techniques combined with adaptive optics could permit daytime operation [22,23]. Another option is to use wavelengths with significant dips in solar radiance, such as those in the mid-wavelength infrared (MWIR) region. Most FSOC and QKD systems operate using wavelengths between 700 nm and 1550 nm [19,24,25] due to the abundance of optical components and the overlap with the telecommunication industry. However, limited operational availability due to high attenuation in poor weather conditions has motivated researchers to look at longer wavelengths [26,27] where authors predict improvements in propagation through fog and turbulence [28,29]. Advancements in quantum cascade laser technology have enabled researchers to begin investigating the potential advantages of long-wave FSOC and QKD [27,30,31].
There are two primary approaches to QKD protocols, continuous-variable (CV) and discrete-variable (DV), with various implementations within each [32,33]. In the DV scheme, information is encoded in discrete quantum properties of the photon, such as polarization. Alternatively, in the CV scheme, information is encoded in the continuous quadrature variables of the electromagnetic field, such as amplitude and phase of the laser light. In short, DV protocols are considered to be more robust over longer distances than CV protocols, whereas CV protocols have higher key rates [14,18]. This results from the use of a multiphoton source with high laser repetition rates (e.g., 50 MHz), many more degrees of freedom for quantum state encoding, homodyne or heterodyne detectors with high efficiency (0.95) and compatibility with standard telecommunications and lower coupling losses. CVQKD could potentially also operate in strong stray light and in daytime as it filters out background radiation. Substantial challenges exist when considering the practical feasibility of satellite CVQKD, for example, setup stabilization, reduction of noise and reduction of loss. Another major challenge is sharing the local oscillator between Alice (satellite transmitter) and Bob (ground receiver), so that they have the same reference frame to encode and measure the phase information [34]. One reason why polarization DVQKD protocols are used successfully in satellite QKD is that the polarization of the laser beam is affected less than the phase as it propagates through the atmosphere. Belenchia et al. provide a comparison of CV and DV protocols for satellite–Earth FSOC in terms of maturity, cost, robustness to space operations, and other operational parameters [15]. It should be noted that, to date, nearly all satellite-based demonstrations of QKD have been DV-based [13,19]. Therefore, we have based our work on DV-QKD using the decoy-state BB84 protocol.
The Micius satellite has been used to demonstrate QKD, entanglement distribution and quantum teleportation. Moreover, it has paved the way for developing global quantum communication networks [35]. In [36], an analysis was performed on data from the Micius satellite trusted-node downlink using BB84 weak coherent decoy states. The satellite to ground transmission window was limited to 440 s for a zenith pass, and the effects of background light, source quality, and overpass geometries were estimated during the modelling of the satellite QKD key generation capacity. Background noise was found to be the limiting factor and that developing methods to suppress background light are a priority. In [37], an upper bound to the maximum finite secret key length (SKL) generation capacity was established in order to inform system engineering development, operation and deployment. A demonstration of a space–ground QKD network included a compact terminal on the Tiangong-2 Space Lab connected to four ground stations, and showed that medium-inclination orbit and Sun-synchronous orbits are suitable for future quantum satellite constellations [38]. Recent advances in metasurfaces, nanophotonic systems and photonic integrated circuits pave the way for compact devices in secure key encryption and quantum communication [39,40].
The focus of this work is on optimizing satellite QKD performance for a variety of atmospheric conditions using a range of techniques to mitigate losses. Regions of the electromagnetic spectrum that produce the highest secret key rates R for satellite QKD downlink channels operating in daylight under realistic and adverse atmospheric conditions are identified. Suitable filtering techniques, adaptive optics, and wavelengths selection are combined. Moreover, secret key rates, R, are evaluated for a range of physical component sizes. This paper is structured as follows: In Section 2, transmittance and spectral radiance are calculated for different regions of the electromagnetic spectrum. Section 3 outlines a channel model accounting for free-space diffraction, turbulence and background noise. Section 4, which focuses on QKD performance, describes the calculations of the secret key rate, R, using the decoy-state BB84 protocol [41], combined with adaptive optics, spectral and temporal filtering. In Section 5, the simulation results are analysed to identify optimum wavelength regions for satellite QKD. For practical QKD, there is often limits imposed on receiver and transmitter sizes so that the best wavelengths for a range of component sizes are determined. The performance of each wavelength region is compared while operating through adverse weather conditions, such as haze, fog and rain. Section 6 concludes this paper by summarising the results and recommending future directions.

2. Transmittance and Spectral Radiance

The most widely used codes to model atmospheric transmission and radiance are based on radiative transfer models with different spectral resolutions: LOWTRAN 7 (20 cm−1), MODTRAN 2/3 (2 cm−1) and FASCOD3 (1 cm−1) [42,43,44]. These programs convert spectral lines in the HITRAN database to transmittance and radiance using different methods, such as Voigt, Lorentz, and Doppler line shapes. The line-by-line radiative transfer model (LBLRTM) is the most accurate and hence slowest of these codes to run. A combined atmospheric radiative transfer (CART v1) software based on the HITRAN database with a spectral resolution of 1 cm−1 was developed to rapidly calculate atmospheric transmittance and background radiance for complex atmospheric regions in China [45]. Due to the complexity involved in modelling the atmospheric environment, discrepancies arise between simulations and real-world systems. Many atmospheric parameters, such as cloud cover and aerosol composition/concentration, vary rapidly in space and time and can therefore only be modelled approximately and less accurately. Validation of these atmospheric models could come from hot air balloon experiments equipped with cameras and sensors to capture atmospheric conditions from ground level up to the stratosphere, and ground-based camera and sensor experiments to monitor background radiation and seasonal variations in weather conditions such as rain, fog and cloud cover. The combination of these experiments could inform the feasibility of optical ground stations at particular locations for future experiments in satellite quantum communications.

2.1. Key Assumptions and Limitations of MODTRAN Simulations

MODTRAN assumes that the atmosphere is described in several layers up to a 100 km altitude using one of six different reference model atmospheric profiles which specify gas content per layer. The layers are defined at their boundaries by temperature, pressure density, etc., and the MODTRAN program interpolates between layers. MODTRAN includes several atmospheric gases, aerosols, and cloud and rain models. Water vapour is the major factor in cloud formation and in determining transmission of laser light through the atmosphere. Cloud models incorporate parameters such as cloud type, altitude and thickness, optical properties, water content, temperature, and multiple cloud layers. The scattering term is modelled using Mie theory, which describes the scattering of electromagnetic radiation by spherical particles. The absorption term is modelled using the Beer–Lambert law, which describes the absorption of radiation by a medium. Atmospheric refraction and surface reflection and emission are also accounted for, as well as solar and lunar irradiance.
Despite its major success and widespread use in modelling the atmosphere, MODTRAN has certain limitations. MODTRAN6 uses a line-by-line (LBL) algorithm, which allows the transmittance to be computed at an arbitrarily small wavelength resolution using a high-resolution transmission molecular absorption database called HITRAN. This LBL radiative transfer model is very intense and requires significant time and computer power to solve. Also, while the MODTRAN program includes several atmospheric models, real-world atmospheric environments are much more complicated. MODTRAN assumes that the concentration of atmospheric constituents varies with altitude, but not horizontally. Lastly, in terms of adaptability, the MODTRAN program has only a few aerosol models, which yields a risk that the aerosol parts become inaccurate when studying conditions beyond these models [46,47].
In this work, the MODTRAN Atmospheric Generation Toolkit was used to replicate the atmospheres of each scenario [48,49]. MODTRAN6 was used to clarify the wavelength ranges available for QKD by determining the losses resulting from atmospheric absorption and scattering. For satellite QKD to help establish the quantum network, systems must yield secret key rates in a variety of atmospheric conditions and geographical locations. Two very different scenarios are considered here: the summer subtropical climate of Tucson, Arizona, is compared with the winter temperate climate of Waterford, Ireland. MODTRAN was used to simulate these atmospheres and determine the transmittance and spectral radiance across a range of wavelengths. Spectral radiance is highly dependent on the sun’s position in the sky relative to the Earth. Therefore, we specify a location and time. Tucson is used to represent an ideal location for satellite communications whereas the wet and cloudy skies of Waterford represent regions where satellite communication is more challenging.

2.1.1. Scenario 1: Tucson, Arizona

At noon on the summer solstice (21 June), the desert climate of Tucson is replicated using a 70 km visibility to represent clear skies while wind speeds of 3.33 m/s, desert aerosols and desert albedos imitate the atmospheric conditions. The transmittance (blue) and spectral radiance (black) for a ground receiver pointed at the zenith is plotted across the electromagnetic spectrum and shown in Figure 1.

2.1.2. Scenario 2: Waterford, Ireland

In contrast, at noon on the winter solstice (21 December), the atmosphere for the Irish coastal region of Waterford is reconstructed using 23 km visibility rural aerosols and farm albedos. Similarly, the transmittance (green) and spectral radiance (red) is also plotted in Figure 1 for a direct comparison with data from Tucson. At this time of year, Waterford is often covered by clouds. Therefore, a cirrus cloud model was used, and more opaque variants were also considered later.

2.2. Atmospheric Windows

The International Commission on Illumination classifies optical radiation into three categories, IR-A (700–1400 nm), IR-B (1400–3000 nm), and IR-C (3000 nm–1 mm), sub-classified into [50]: near-infrared (NIR) 750 nm–1.4 μ m; short-wavelength infrared (SWIR) 1.4–3 μ m; mid-wavelength infrared (MWIR) 3–8 μ m; long-wavelength infrared (LWIR) 8–15 μ m; and far-infrared (FIR) 15 μ m–1 mm. We adopt these sub-classifications, with the addition of the visible region (400–750 nm).

3. Channel Model

To determine which wavelengths are feasible for QKD, we first characterise the key loss factors present in the communication channel. We focus on a satellite downlink channel where the main sources of degradation are diffraction, absorption, scattering, excess noise and turbulence-induced wavefront errors. Losses due to absorption, scattering and radiance are determined using MODTRAN. The total channel efficiency is calculated using Equation (1).
η = η d η e x t η F S η o p t η d e t
where η d is the geometric loss due to diffraction, η e x t is the atmospheric extinction losses resulting from absorption and scattering, η F S is the field stop loss, η d e t is the detector efficiency, and η o p t is the overall efficiency of the optical setup at the receiver including filter efficiencies. In the following sections, we briefly describe each of the losses. Positioning and tracking losses were not accounted for in this model. These are important when considering different telescope apertures, which will result in different field of views and spot sizes. They will be included in a future work.

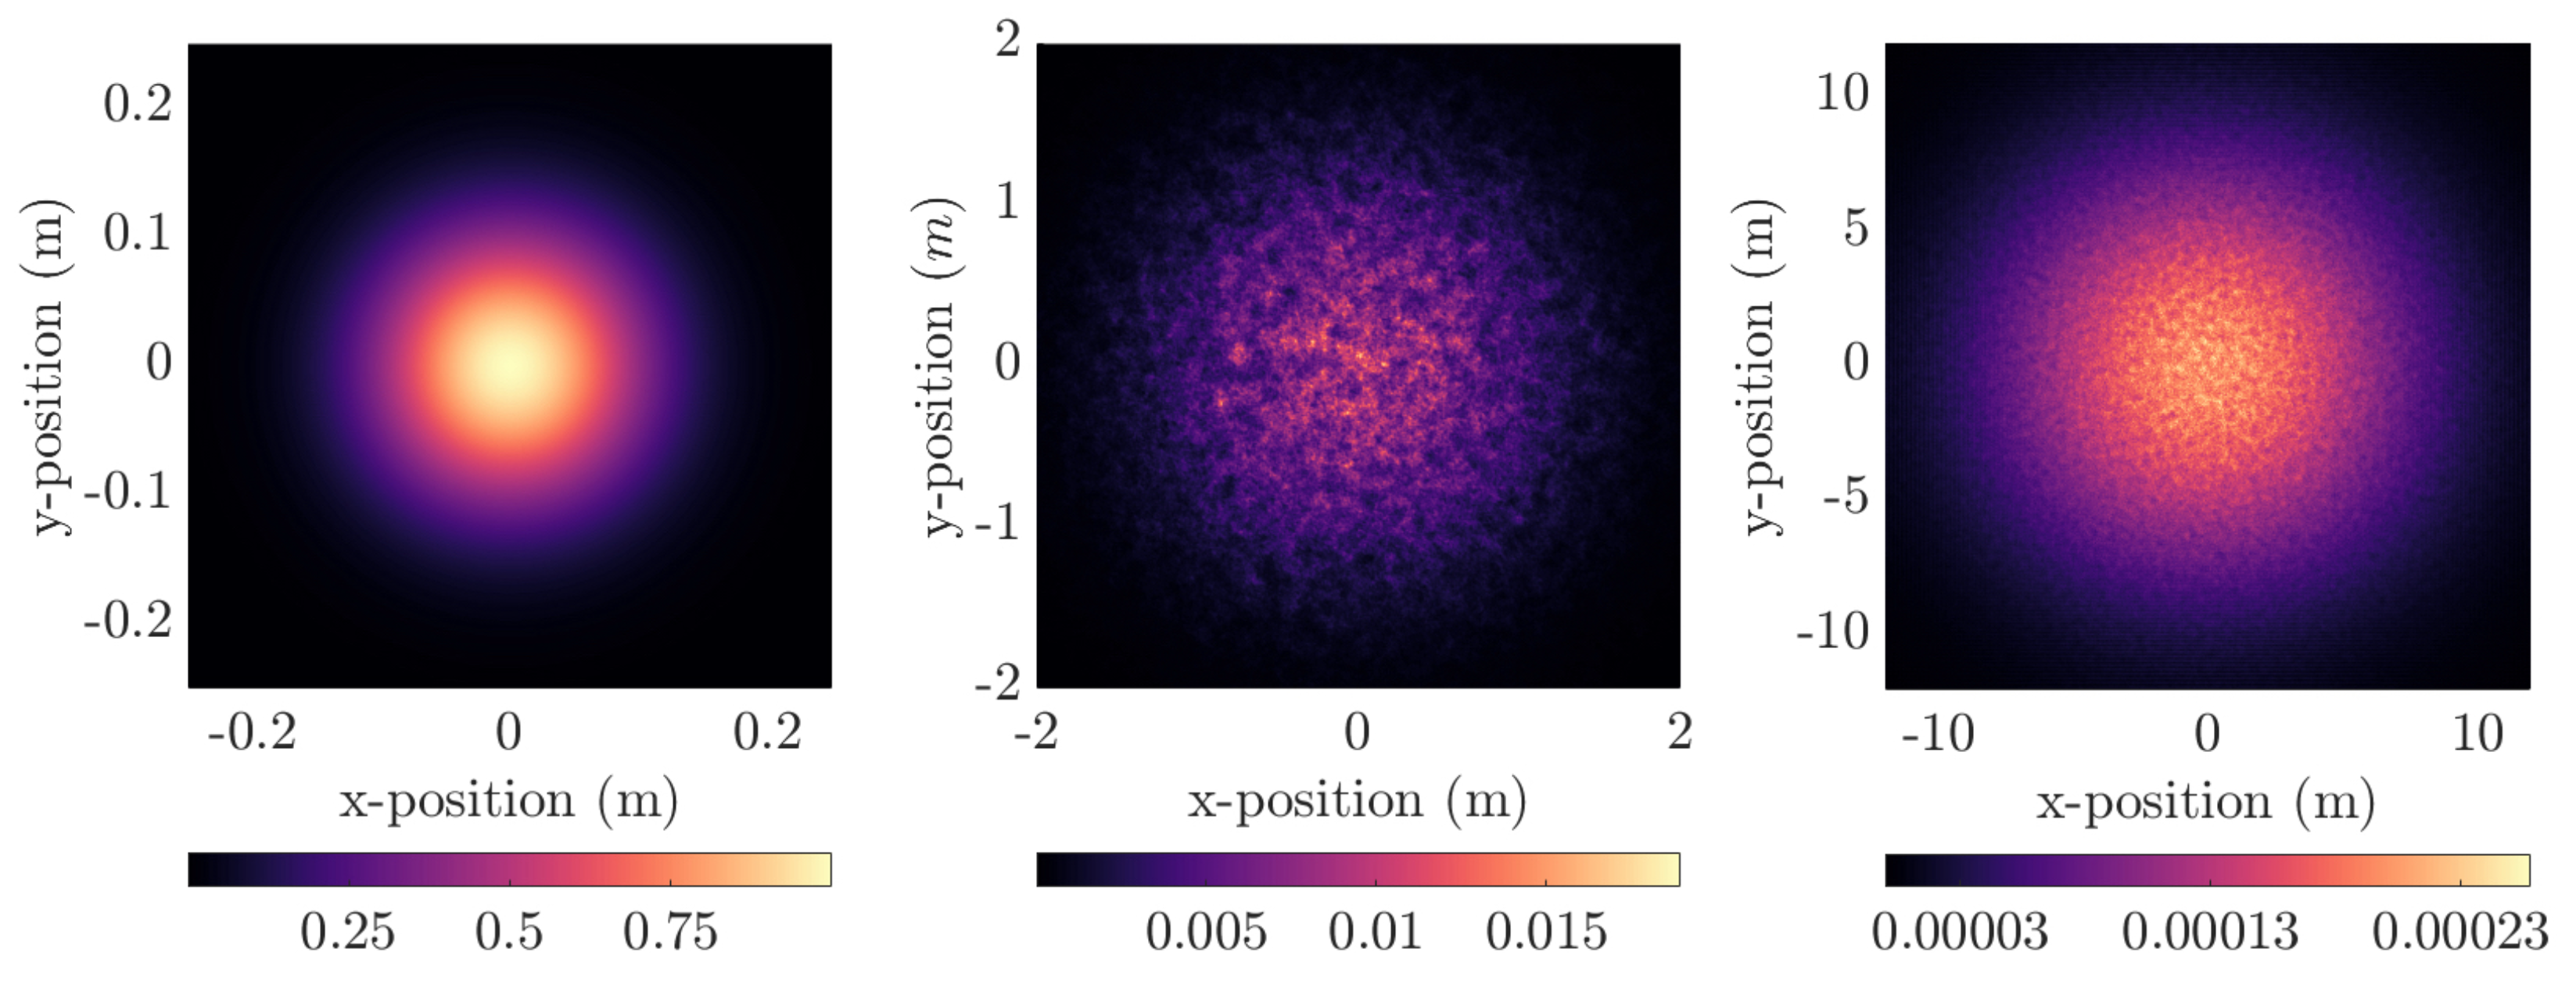
3.1. Free-Space Diffraction

The losses resulting from diffraction-induced beam spread can be accounted for using the following equation to approximate the free-space coupling efficiency η d :
η d = 1 exp 1 2 D r 2 w 2 ( λ , z , w 0 )
where D r is the diameter of the receiver aperture and w ( λ , z , w 0 ) is the beam waist at the receiver [14]. It is common practice to approximate a laser beam as a Gaussian beam where the transverse intensity profile follows an ideal Gaussian distribution. As the beam propagates, diffraction causes its profile to change depending on its wavelength λ , initial beam waist w 0 , and propagation distance z. The beam spot size for a Gaussian beam is given by [51]
w ( λ , z , w 0 ) = w 0 2 1 + λ z π w 0 2 2
This increase in the beam spot size relative to the size of the receiver aperture is responsible for significant power loss in the satellite downlink scenario. Increasing either the initial beam waist, w 0 , or the receiver diameter, D r , will increase the geometric coupling efficiency. Alternatively, increasing λ or the propagation distance, z, will decrease the geometric coupling efficiency. So, for a given z, as λ is varied, w 0 and D r can also be varied to keep the coupling efficiency constant. This suggests that larger components can make up for longer wavelengths in terms of the geometric coupling efficiency. However, the channel efficiency is a combination of geometric and atmospheric transmittance, which also varies with wavelength.

3.2. Turbulence

As the beam propagates through the atmosphere, it may encounter atmospheric turbulence caused by random fluctuations in temperature and pressure. This alters the spatial and temporal refractive index of air, which can cause the beam to spread and become distorted [52,53]. The refractive index structure of the atmosphere, c n 2 ( x ) , is given by Equation (4) as follows:
c n 2 ( x ) = 0.00594 ( v / 27 ) 2 ( 10 5 x ) 10 exp ( x / 1000 ) + 2.7 × 10 16 exp ( x / 1500 ) + A exp ( x / 100 )
where x is the altitude, the wind speed v is 21 m/s and A is the value of C n 2 ( 0 ) , set to 1.7 × 10 14 for the Hufnagel–Valley model H V 5 / 7 variant. Most turbulent effects occur within the lower 20 km of the atmosphere. In the downlink, the beam travels hundreds of kilometres before it interacts with significant turbulence, at which point the beam waist is large and more resilient to turbulence. To quantify the amount of beam spread and beam wander in the downlink scenario, we use the phase screen model [52,54,55,56], where the propagation path is subdivided into smaller regions and the random phase changes of each region are accounted for by a thin phase screen placed at the beginning of each region (details of the simulation are provided in Appendix A). Figure 2 shows the evolution of two beams as they propagate from a 500 km satellite down through the turbulent atmosphere. The left beam shows the intensity profile of the beam at the point of initialization, while the centre and right images show the intensity profile that result from a 1.55 μ m beam and a 10 μ m beam, respectively, after each has propagated through a statistically independent realization of the satellite downlink channel.
The wavefronts at the receiver differ in two meaningful ways. Firstly, the 15 cm beam waist has grown to 1.65 m in the case of the SWIR beam and to 10.6 m for the LWIR beam. Secondly, the turbulence-induced phase changes have distorted both wavefronts but significantly less for the 10 μ m beam. This retains much of its original Gaussian distribution unlike the intensity of the 1.55 μ m beam which is now distributed in small pockets. The scintillation index ( σ I 2 ) is a useful measure to quantify the strength of atmospheric turbulence and is defined as the normalized variance of irradiance fluctuations. Calculations confirm that for zenith angles less than 60, the downlink channel operates under the condition of weak turbulence ( σ I 2 ) < 1 [57]. Thus, we can consider turbulence-induced beam spread negligible. Beam spread is almost entirely caused by diffraction and can be accurately approximated by a Gaussian spatial profile using Equation (3). The phase screen algorithm is computationally intensive to run, so the Strehl ratio, S, is adopted [58] to account for the reduced spatial coherence at the receiver entrance pupil, which leads to a broadened spot size in the focal plane.
S = 1 + D R r ( λ ) 5 / 3 6 / 5
where r ( λ ) is the coherence length given by
r ( λ ) = r 0 λ λ 0 6 / 5
where r 0 is the coherence length measured at λ 0 = 500 nm and is inversely related to the strength of turbulence.

3.3. Background Noise

For a given temporal filter Δ t , spectral filter Δ λ and spatial filter field of view Ω F O V , the number of sky noise photons, N b , entering the receiver is described by the following radiometric expression [20]:
N b = H b Ω F O V π D r 2 λ Δ λ Δ t 4 h c
where H b is the spectral radiance shown in Figure 1, h is Planck’s constant, and c is the speed of light. It is important to note the quadratic relationship between D r and N b . Although increasing the receiver diameter increases the channel efficiency, it also increases the number of noise photons entering the detector. This places upper limitations on the secret key rate generation for each wavelength, which is determined by the atmospheric transmittance and spectral radiance at that channel. Despite reductions in spectral radiance, the responsivity of photon detectors is higher at longer wavelengths, resulting in more noise photons incident on the detector. The background probability, Y 0 , is the probability of a noise photon entering the detector [59]:
Y 0 = N b η d e t η o p t + 4 f d a r k Δ t
and it is dominated by N b but also includes a contribution from detector dark counts f d a r k .

4. QKD Performance

4.1. QKD Protocol

The BB84 QKD protocol can be used to derive the secret key rate R performance metric to identify wavelengths suitable for satellite downlink quantum communication. Ideally, this protocol is implemented using a single-photon source, but attenuated laser pulses (weak coherent states) are commonly used in real-world QKD systems. The decoy-state protocol was proposed by Hwang [41] and introduces extra states of different intensity to overcome eavesdropping attacks, such as photon number splitting (PNS). Here, we adopt the decoy-state BB84 protocol and begin by defining some important quantities. The secret bit yield is the key generation rate per signal-state and can be expressed as [59]
R = q Q μ f e c H 2 E r , μ + Q 1 1 H 2 e 1
where q is 1/2 for the BB84 protocol, f e c is the error correction efficiency set to 1.22, a commonly used value associated with cascade error correction [60], and H 2 ( x ) is the Shannon binary entropy formula defined as
H 2 ( x ) = x log 2 ( x ) ( 1 x ) log 2 ( 1 x )
The signal or decoy-state gain, Q n , is given by
Q n = Y 0 + 1 e η n
where n is mean photon number (MPN) of the signal-state μ , or decoy-state ν . We choose the signal-state and decoy-state MPNs to be 0.7 and 0.1 for μ and ν , respectively. The signal/decoy quantum bit error rate E r , n (QBER) is given by
E r , n = e 0 Y 0 + e d 1 e η n Y 0 + 1 e η n
where the polarization cross-talk error, e d , is 0.01 and the background error rate, e 0 , is 0.5 for randomly occurring dark and background counts. The single-photon gain, Q 1 , is calculated using
Q 1 = μ 2 e μ μ ν ν 2 Q ν e ν Q μ e μ ν 2 μ 2 μ 2 ν 2 μ 2 Y 0
The single-photon yield, Y 1 , is
Y 1 = μ μ ν ν 2 Q ν e ν Q μ e μ ν 2 μ 2 μ 2 ν 2 μ 2 Y 0
Finally, the single-photon state error rate, e 1 , is given by
e 1 = E r , ν Q ν e ν Y 1 ν e 0 Y 0 Y 1 ν

4.2. Adaptive Optics

Adaptive optics (AO) systems have the potential to significantly improve performance for satellite QKD by overcoming atmospheric turbulence. Liao et al. performed a field experiment showing free-space QKD over 53 km free-space link across Qinghai Lake in daylight [61]. A single-mode fibre was used to spatially filter optical noise, along with a fast steering mirror, a deformable mirror, and an optical tracking system with 300 Hz feedback frequency. In [58], a satellite QKD analysis combined AO and a single-mode optical fibre which reduced background noise and improved fibre coupling efficiency. A 200-Hz bandwidth closed-loop AO system was shown to be sufficient to facilitate daytime QKD, even with the high slew rates associated with 400 and 800 km LEO orbits. Gruneisen et al. followed this with a terrestrial field-site validation of a 2 kHz frame rate, and a 130 Hz closed-loop bandwidth AO system across a 1.6 km horizontal path in daylight under carefully tuned 700 km downlink conditions [23]. These studies clearly show that adaptive optics combined with suitable spatial, spectral and temporal filtering improve the performance of satellite and free-space QKD. However, several challenges remain in scaling these experimental findings to operational satellite QKD systems under realistic environmental and hardware constraints. AO systems are complex, containing specialized modules requiring high stability to operate in remote locations and often harsh environments with limited space. Future miniaturization of detectors and optical components will improve system performance and aid the transition to operational satellite QKD systems.
AO systems utilize a deformable mirror to correct turbulence-induced wavefront aberrations and have been shown to significantly improve the performance of QKD systems operating in a turbulent channel [22,60,62]. Adaptive optics is used to guide a beam of photons from the transmitter to the receiver, regardless of the type of QKD protocol being used. If the transmitter is on the ground, a guide star can be used to pre-compensate for the effects of atmospheric turbulence and align the QKD laser source on the ground with the receiver on the satellite. Conversely, if the transmitter is on the satellite, a beacon laser can be used to correct for distortions in the wavefront due to atmospheric turbulence and align the QKD laser source on the satellite with the receiver on the ground. The optical ground station Cassegrain reflecting telescope consists of an AO module and a quantum receiver module. Beacon and signal (at slightly different wavelengths) are sent from the satellite sources to the telescope and directed to the separate modules via a dichroic mirror [23,58]. A Shack–Hartmann wavefront sensor (SHWFS) measures higher-order wavefront errors. A fast steering mirror (FSM) compensates for a low-order wavefront tilt while a deformable mirror (DM) compensates for higher-order wavefront aberrations. In a closed-loop AO system, dynamic feedback control reduces residual wavefront errors. Here, we adopt a 200 Hz closed-loop bandwidth AO system which yields an effective r 0 50 cm [58]. r 0 can be varied to investigate how performance is impacted by turbulence-induced phase changes and how an adaptive optics system can improve the secret key rate.
There are several practical challenges faced when integrating AO in space-borne systems. Two essential components of AO systems are the deformable mirror (DM) and the Shack–Hartmann wavefront sensor (SHWS). DeMi is a 6U CubeSat mission that characterized the on-orbit performance of a 140-actuator microelectromechanical system (MEMS) DM with an image front sensor and a SHWFS [63]. MEMS DMs are a promising technology for space-based adaptive optics because of their high actuator density, and low size, weight and power (SWAP) requirements. Results from the mission include individual actuator displacements to a precision of 12 nm and correcting wavefront errors in space to a <100 nm RMS error which is similar to performance from ground measurements. The DeMi mission demonstrates operation of MEMS DMs after surviving the harsh conditions of the launch and operation in space.

4.3. Filtering Techniques

To improve the signal-to-noise ratio and the secret key rate, several filtering methods can be utilized. A narrow temporal filter temporarily opens to allow signal photons through to the detector and closes once the signal has passed, blocking out the remaining noise photons. Precise synchronization is required to effectively block out noise. As such, a practical filter of 1 ns is chosen. Several light sources contribute to the accumulated background noise, including solar, lunar and terrestrial radiance, which results in a spectrum of continuous wavelength noise. Much of this noise can be blocked using a narrow spectral filter, which selectively allows light of certain wavelengths to pass through. We use a 1 nm spectral filter. Two spatial filtering strategies are proposed in [58], a diffraction limited (DL) strategy and a turbulence limited (TL) strategy. The key difference between the strategies is whether the field stop grows to accommodate the turbulence broadened beam spot (TL) or remains constant at the diffraction limit (DL). We adopt the turbulence limited strategy in which the size of the field stop is varied to always allow 84% of the signal through. The choice of spatial filter determines the solid-angle field of view (FOV), which is given by [58]
Ω F O V = π 1.22 λ D r 1 + D r r ( λ ) 5 / 3 3 / 5 2
Ω F O V increases with λ , which makes spatial filtering significantly more effective at shorter wavelengths.

5. Results and Discussion

The signal gain is determined by the channel efficiency, which is a multivariate equation given by Equation (1). The largest contributors are atmospheric extinction and geometric coupling efficiency. Both depend on wavelength, λ , but the geometric coupling efficiency also depends on the initial beam waist, w 0 , propagation distance, z, and the receiver aperture diameter, D r . Similarly, the background probability is a function of wavelength, and it is highly correlated with the receiver diameter and the spatial filter field of view.
To account for this parameter interdependence, the secret key rate R is analysed as a function of λ , D r and w 0 . The methodology exploits the fact that w 0 has more of an effect on the receiver aperture and maximum key rate than it does on wavelength selection. w 0 is set to a constant value and R is solved for a range of λ and D r values. For each wavelength region, the highest performing λ is selected and used to solve R for a range of D r and w 0 values. The resulting 3D arrays are plotted, and the optimal D r , w 0 is found for the chosen wavelengths, enabling a best-case comparison of each transmission window. The simulation parameters used in this work are listed as follows: optical receiver efficiency, η o p t = 0.45 , detector efficiency, η d e t = 0.8 , signal-state mean photon number, μ = 0.7 , decoy-state mean photon number, ν = 0.1 , detector dark counts, f d a r k = 10 Hz, temporal filter width, Δ t = 1 ns, spectral filter width, Δ λ = 1 nm, background error rate, e 0 = 0.5 , polarization cross-talk error, e d = 0.01 , error correction efficiency, f e c = 1.22 , and propagation distance, z = 500 km. Note that the values chosen for detector efficiency, η d e t = 0.8 , and detector dark counts or dark count rate (DCR), f d a r k = 10 Hz, are based on recent advances in SNSPD technology. Current single-photon detectors with η d e t > 0.5 typically operate at wavelengths shorter than 2 μ m. For example, at a wavelength of 1550 nm, state-of-the-art SNSPD detector efficiencies/DCR of 90 % /10 cps (NbN), 93 % /1000 cps (WSi), and 87 % /100 cps (MoSi) have been demonstrated to work [64]. NIST have taken steps to develop SNSPDs based on tungsten silicide (WSi) by demonstrating saturated internal detection efficiency up to 10 μ m [65]. By optimizing absorption in the nanowires and coupling to active areas of detectors, it may be possible to achieve mid-infrared high-detector-efficiency SNSPDs.

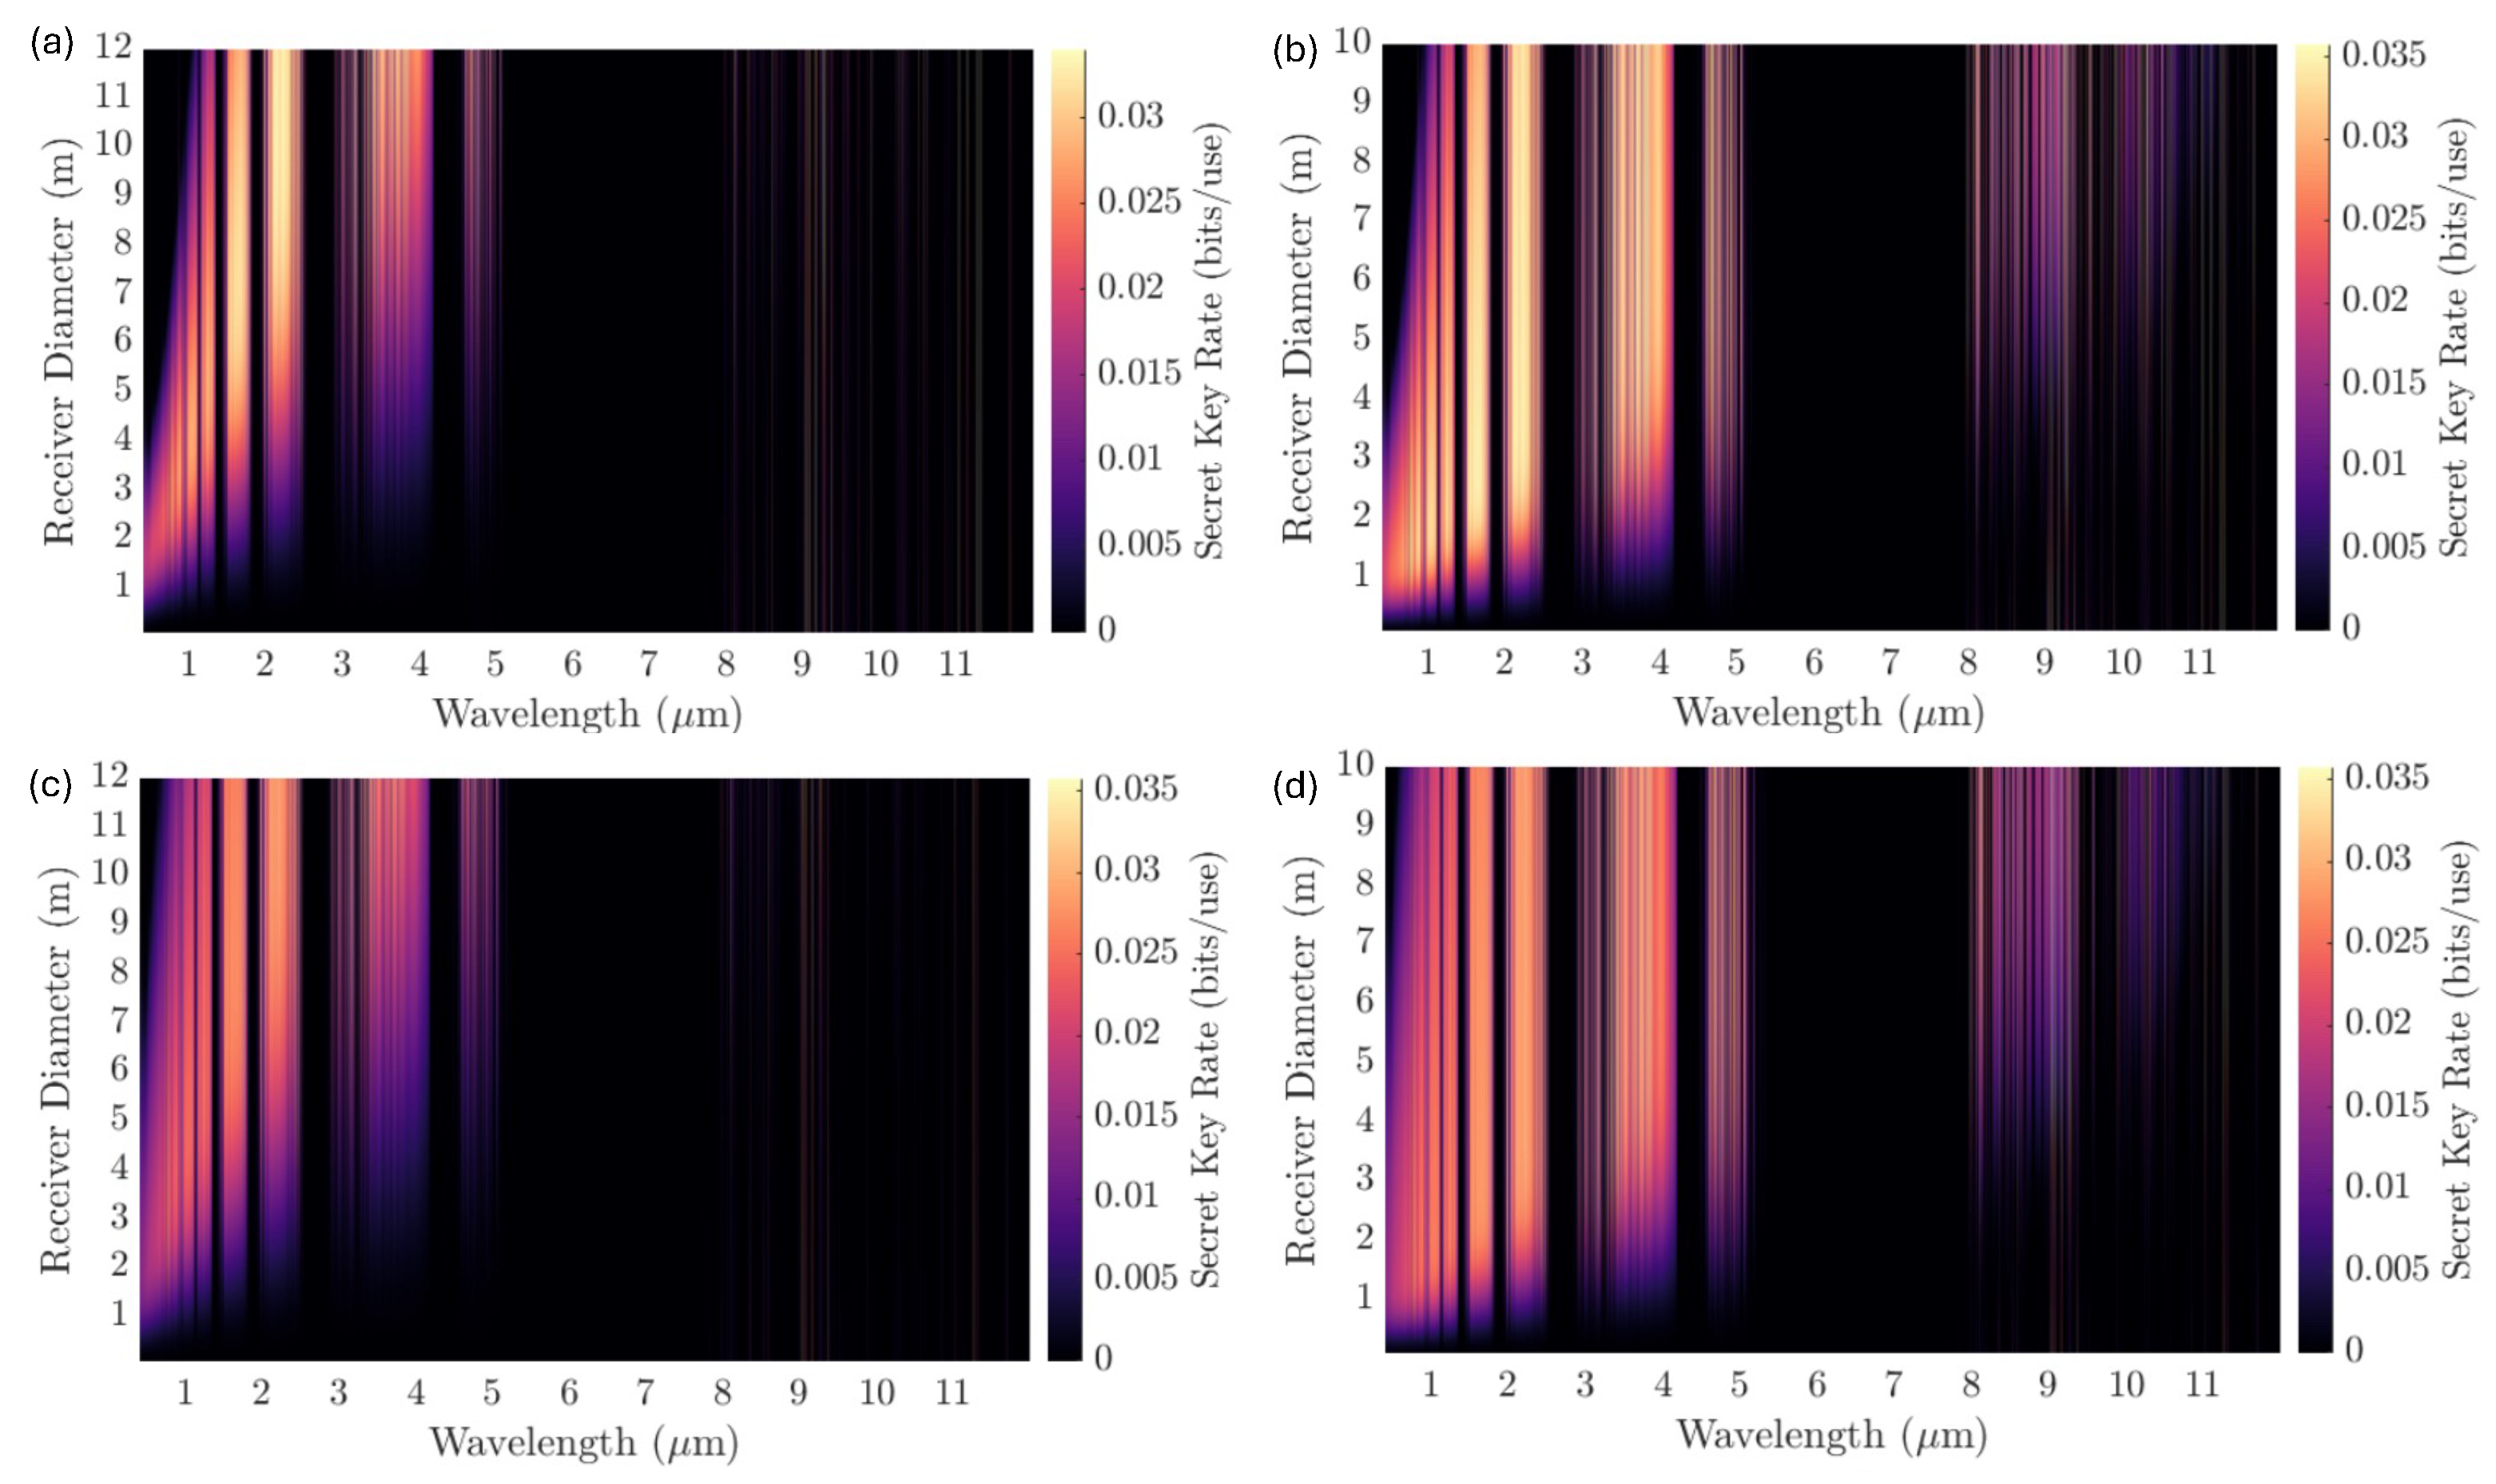
5.1. Wavelength Selection

Figure 3 shows QKD performance across the electromagnetic spectrum, highlighting suitable windows in Tucson (top) and Waterford (bottom). The λ , D r pair that produces the highest secret key rate in each region are selected for further analysis. To account for variations in the initial beam waist, we present secret key rates for w 0 = 10 cm (shown on the left), which replicates the size limitations imposed by a CubeSat, and w 0 = 35 cm (shown on the right), which replicates larger satellites. It can immediately be seen from Figure 3 how the optimum wavelength varies with the initial beam waist. It is interesting to note the following: (i) in both scenarios (Tucson and Waterford), the optimum wavelength increases with the initial beam waist, (ii) the secret key rate is high across a range of wavelength windows from 500 nm– 5 μ m for both initial beam waists, (iii) the secret key rate is higher in Tucson than Waterford, and (iv) within each wavelength window, the secret key rate is higher for an initial beam waist of 35 cm than 10 cm across a wider range of D r values. These observations assist in the selection of the optimum λ , D r , w 0 combination in the next section.

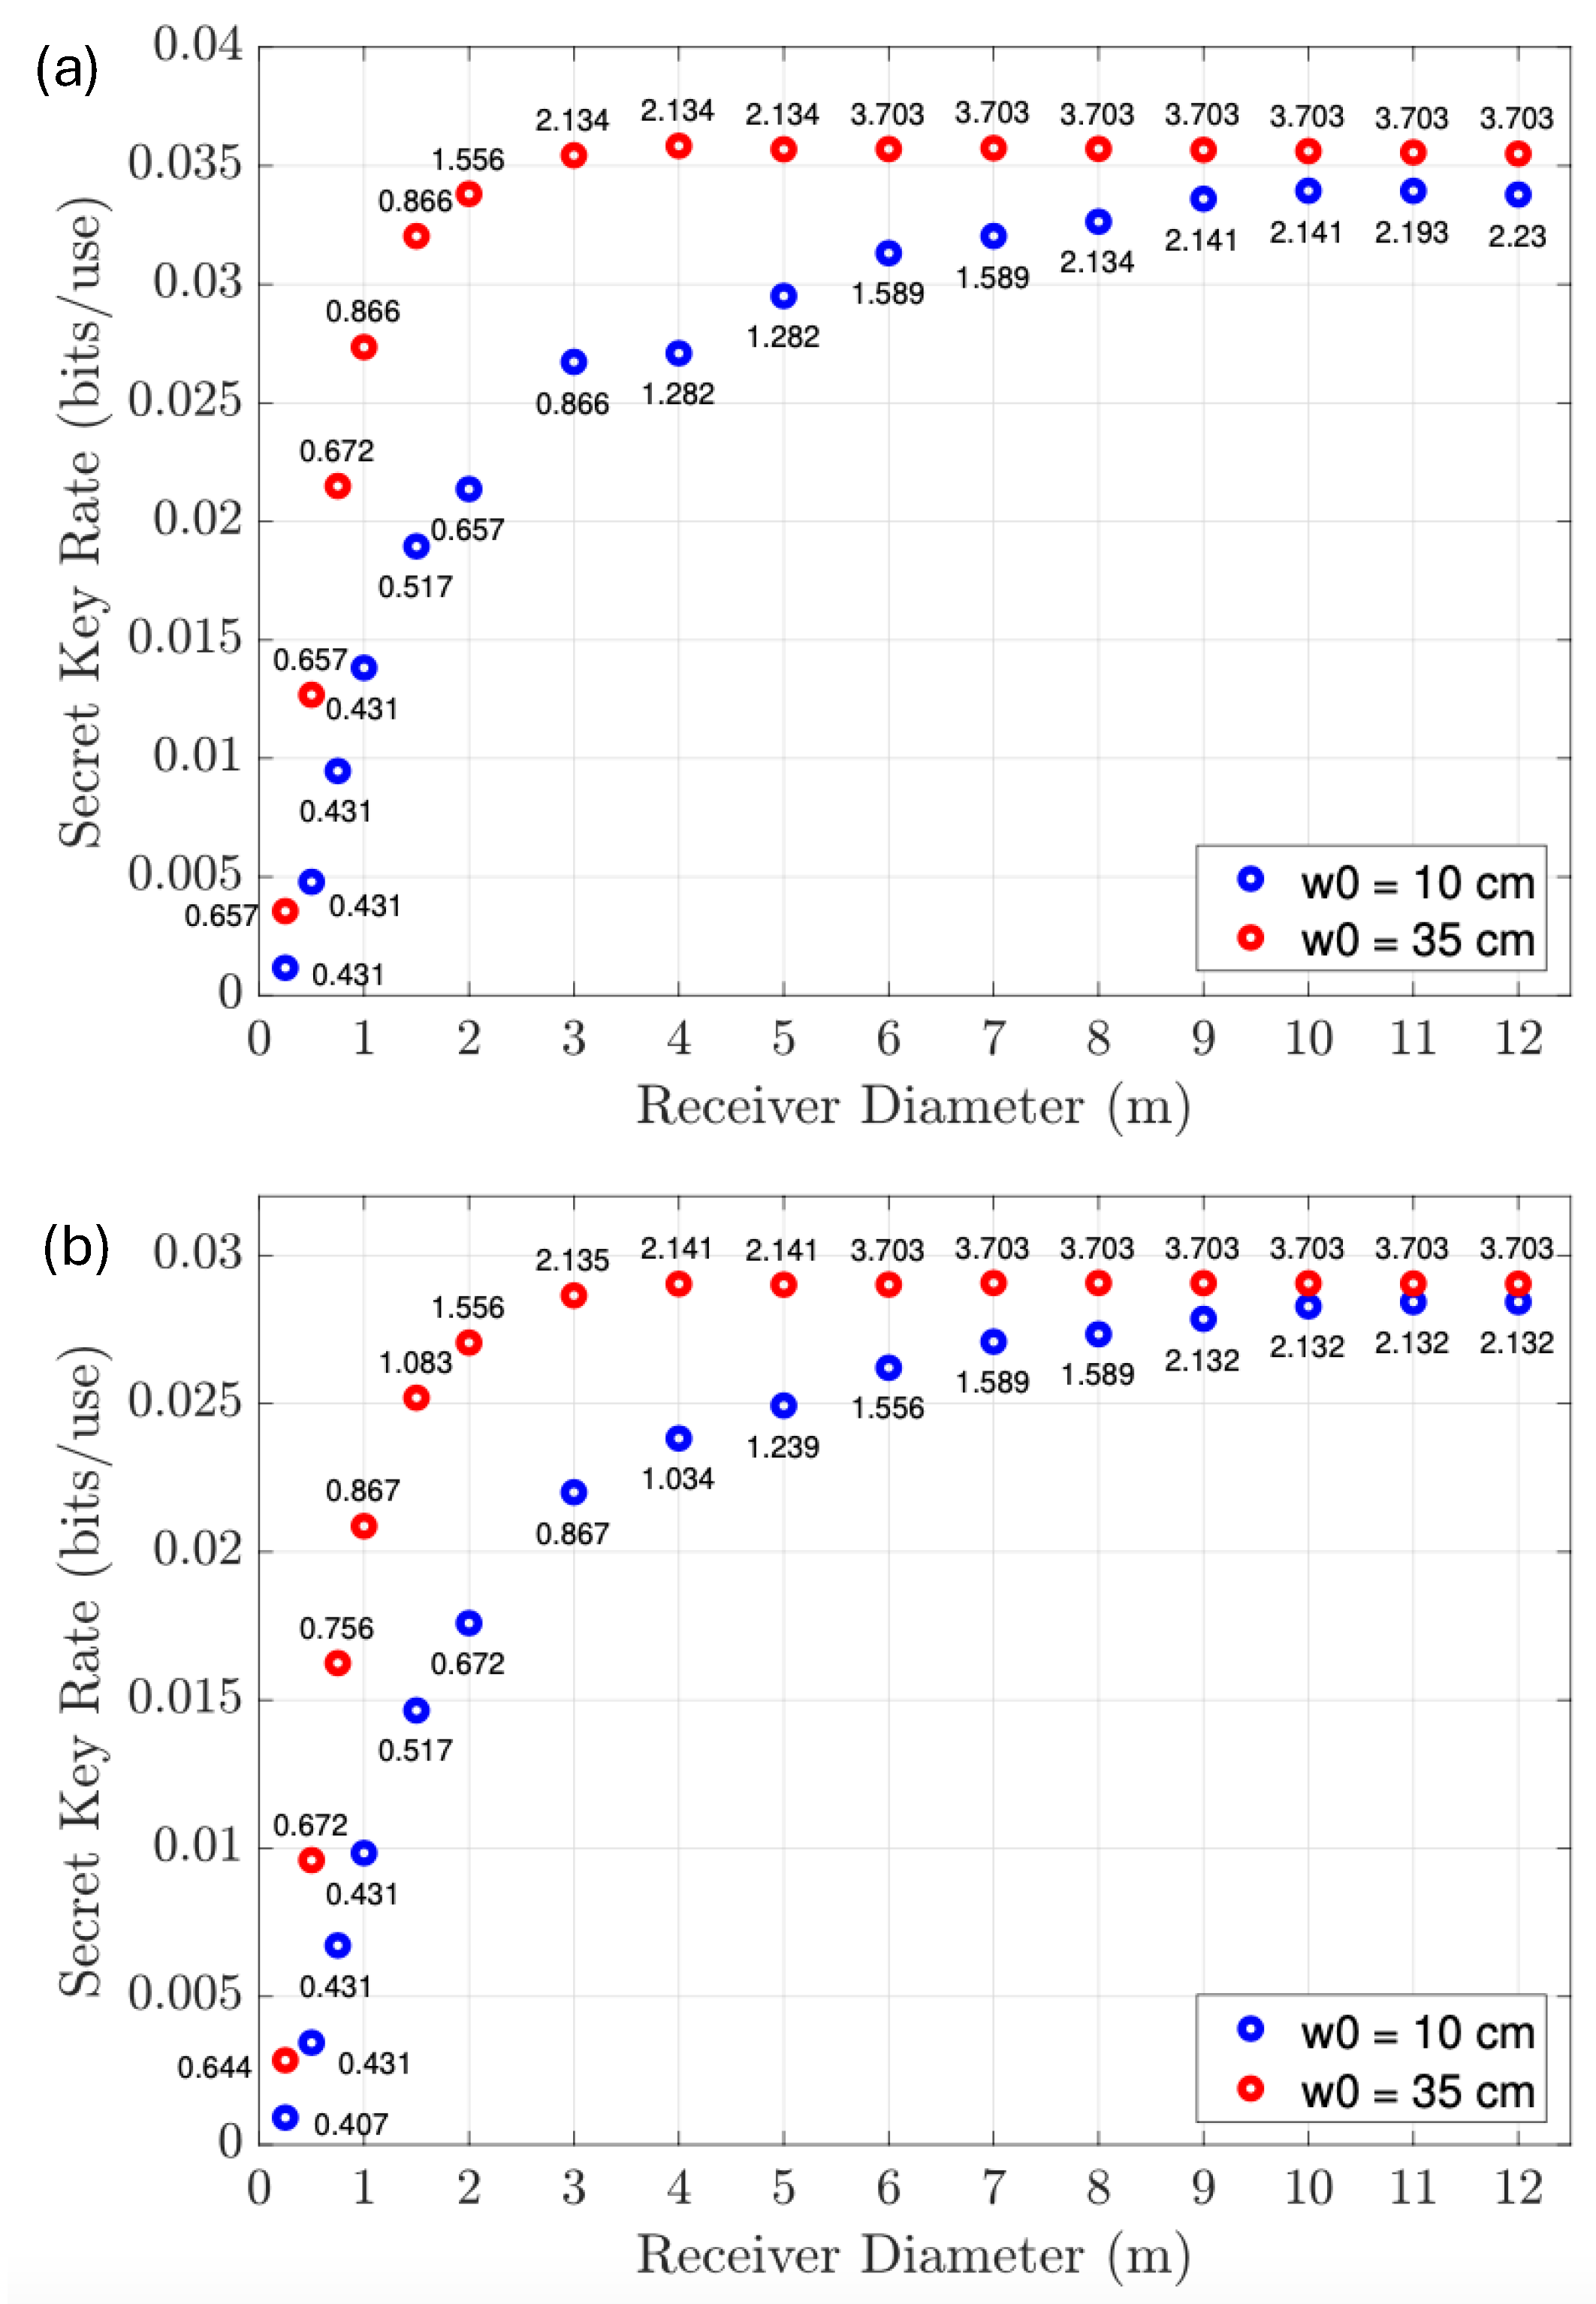
5.2. Component Size Optimization

One wavelength from each region is selected to represent its corresponding transmission window, and the performance of each is compared in a range of turbulent strengths. Additionally, the two highest-performing wavelengths across the commonly used sections of the NIR and SWIR windows are also analysed. w 0 is then varied between 0.1 m and 1.2 m to identify the ideal component sizes for each λ . Figure 4 shows the secret key rate in (a) Tucson and (b) Waterford, for a range of D r and w 0 values. In the case of the downlink channel, the transmitter sits on-board the satellite, which places size limitations on w 0 . For a given w 0 , the best λ and D r were chosen. Similarly, λ and w 0 can be chosen to achieve high secret key rates for a ground receiver. The optimum λ , D r , w 0 combinations for each wavelength region and the maximum secret key rates achieved are presented in Table 1. SWIR and MWIR produce the highest secret key rates in the Tucson and Waterford scenarios. However, it is important to note the large w 0 and D r required to generate these rates.

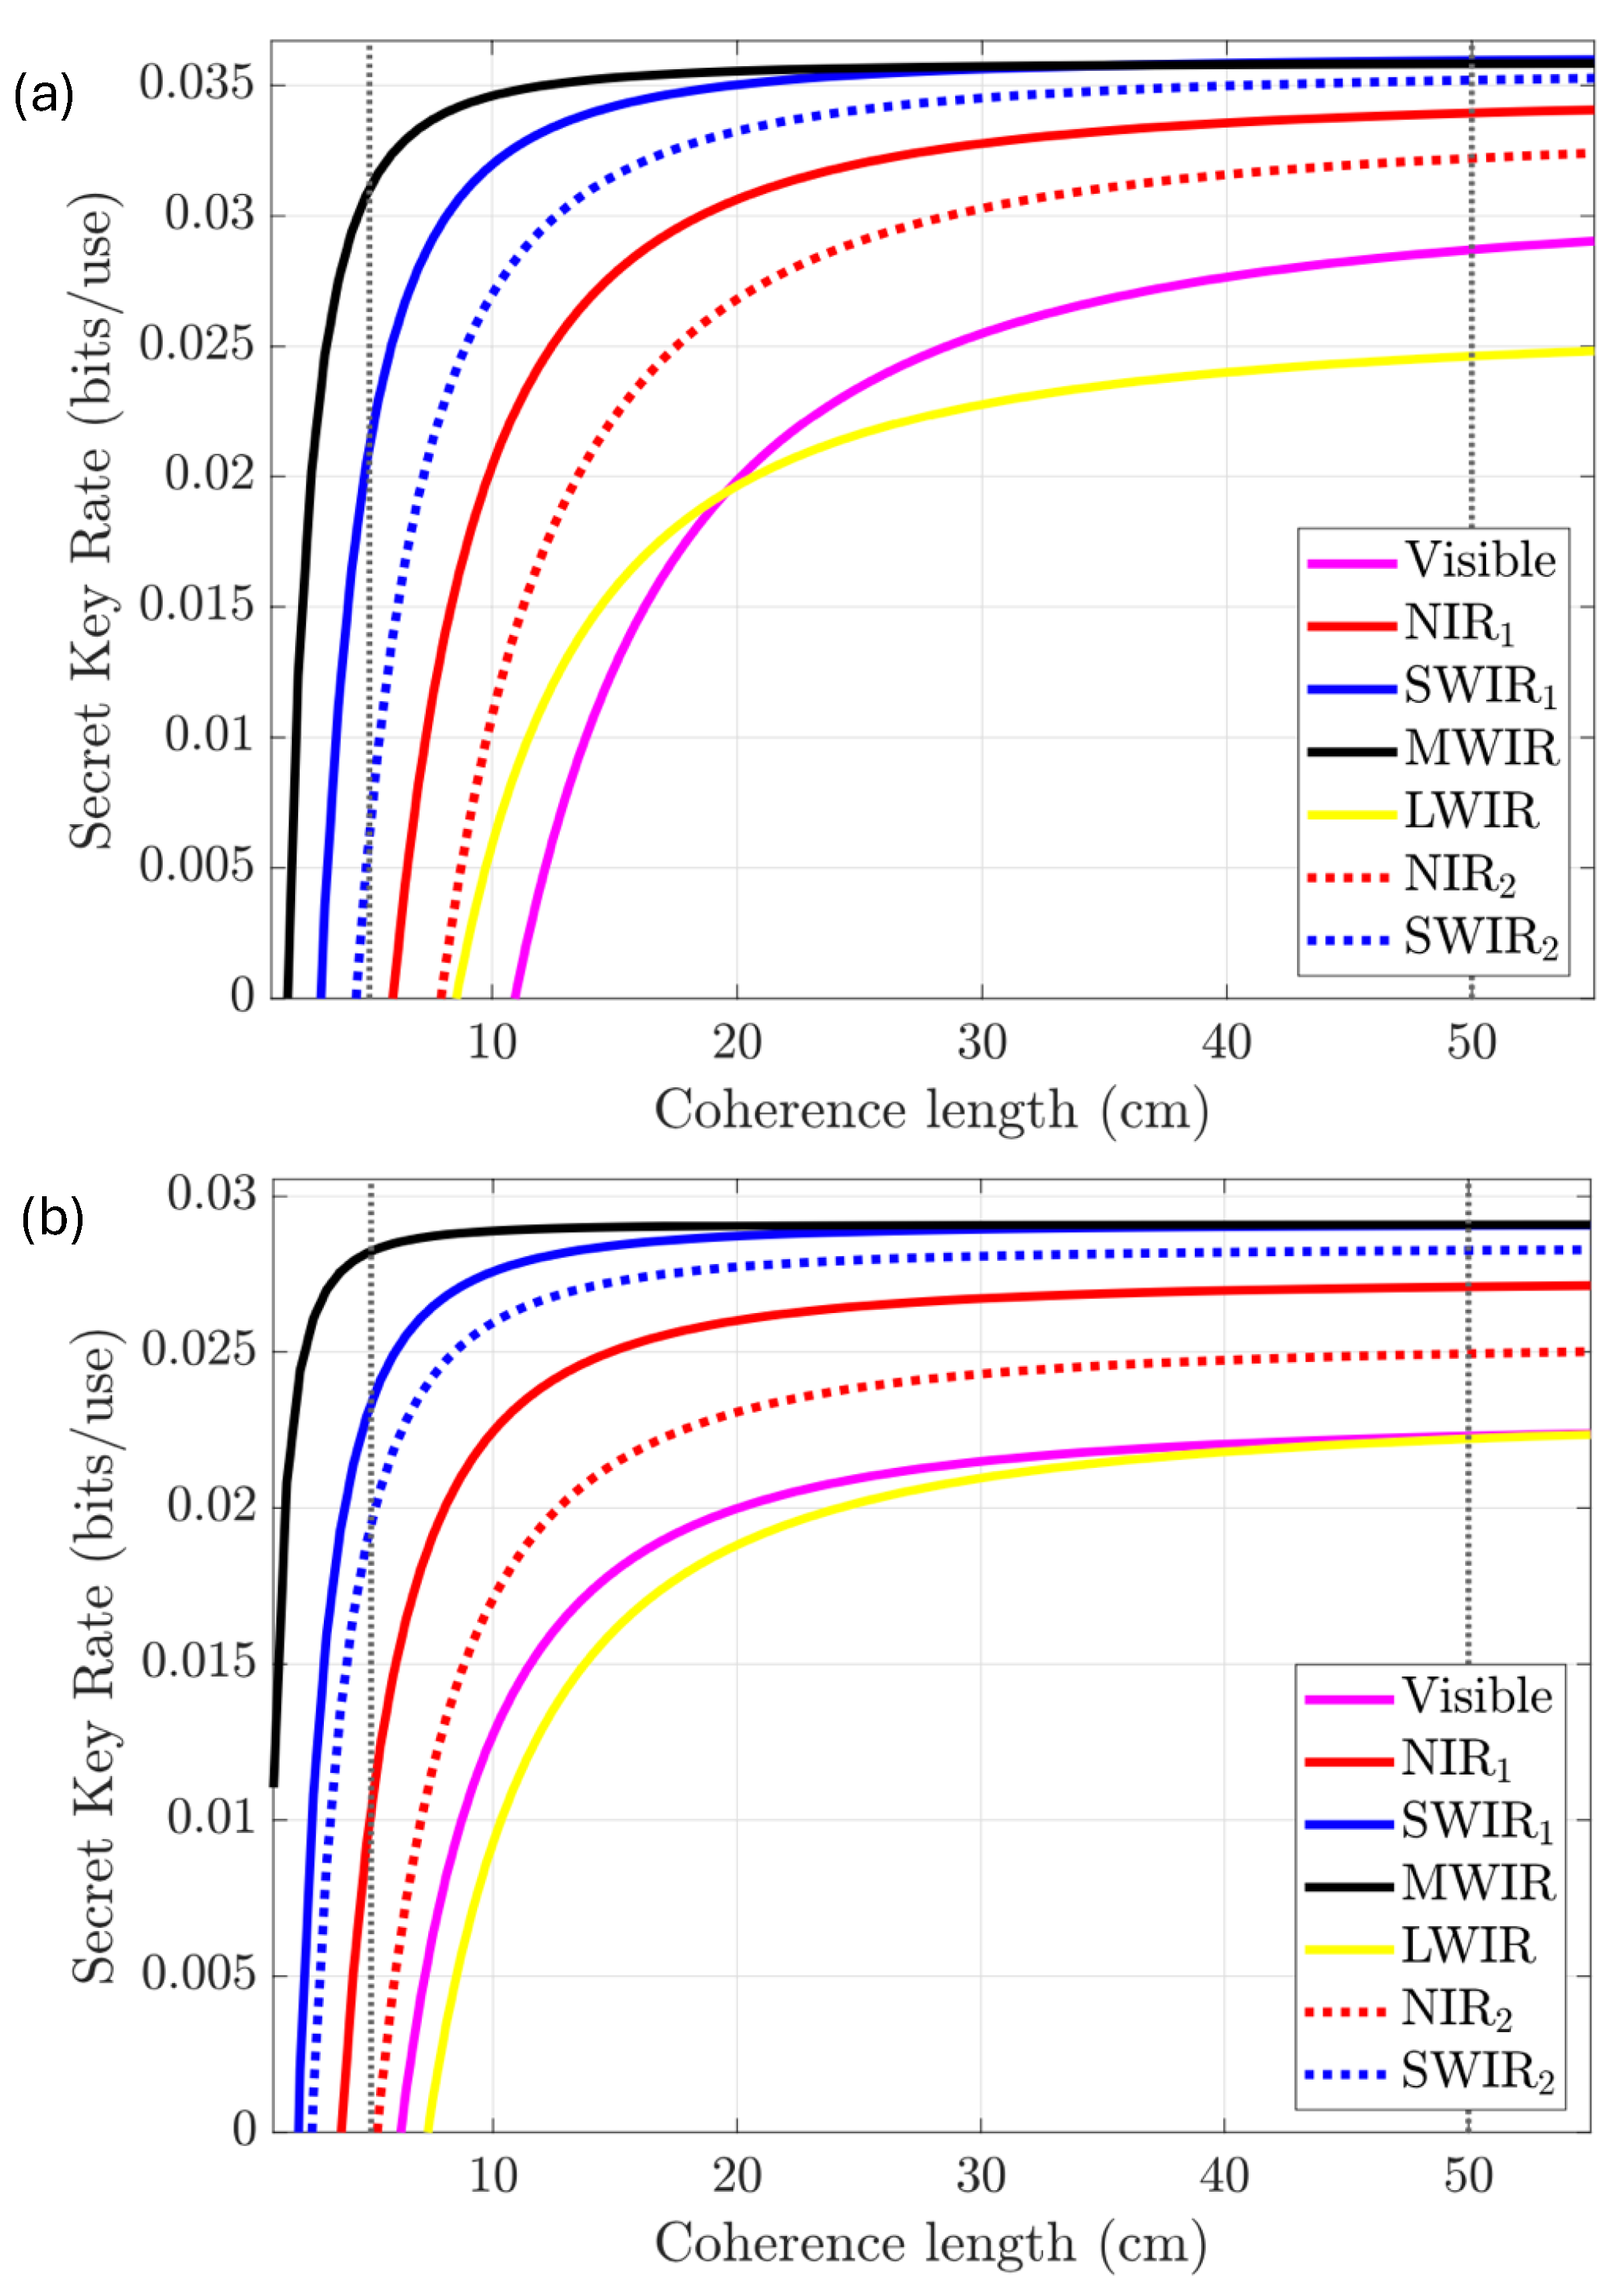
5.3. Wavelength Selection Through Atmospheric Turbulence

The authors in [58] show that the use of adaptive optics combined with tight filtering can improve QKD performance particularly in the visible region. As the beam spot size is proportional to the wavelength, using smaller wavelengths allows for tighter spatial filtering, which results in a higher signal-to-noise ratio. Filtering becomes even more important in conditions of low visibility, where transmittance decreases while spectral radiance increases due to additional atmospheric scattering. Here, we investigate how such a system affects wavelength selection. In Figure 5, the secret key rate is plotted for a range of coherence lengths, r 0 , using the optimal λ , D r , w 0 for (a) Tucson and (b) Waterford. The vertical lines at 5 cm and 50 cm are adopted from [58] and are a description of the wavefront resulting from uncompensated turbulence and post 200 Hz AO correction, respectively. There is a significant increase in performance gained by using AO correction, resulting in slightly higher secret key rates in Tucson than in Waterford. When the turbulence-distorted wavefront is compensated by AO, the SWIR and MWIR yield the best performance, followed by the NIR, visible and LWIR wavelengths, respectively. When the coherence length is small, indicating poorly compensated turbulence-induced wavefront aberrations, the MWIR performs significantly better than other wavelengths and could be used as an alternative to adaptive optics. We also compare the performance of the best NIR and SWIR wavelengths with wavelengths typically used in these regions. When the turbulent effects are compensated by a suitable AO system, there is not a large difference in secret key rates. However, when the turbulence-induced wavefront distortions are uncompensated, as indicated by the 5 cm coherence length, the secret key rate is much larger for the best wavelengths in each region.
In Figure 6, the maximum secret key rates across the entire spectrum are plotted against receiver diameter for (a) Tucson and (b) Waterford. The λ ( μ m) that produces the highest rate for each D r is shown next to each data point. Blue points correspond to a w 0 of 10 cm and red points correspond to a w 0 of 35 cm. When w 0 is 10 cm, the secret key rates are similar for both Tucson and Waterford, despite very different atmospheric conditions, with marginally higher secret key rates for the Tucson scenario. Visible wavelengths produce the highest secret key rates for lower D r values due to the smaller spot size at the receiver. As D r increases, the optimal λ transitions to the NIR region at 3 m, and the SWIR at 6 m, where a rate of 0.0262 bits/use is obtainable at λ = 1.556 μ m. When w 0 is 35 cm, the larger w 0 decreases the beam spread, and the NIR region outperforms the visible region at smaller D r values.
An advantage for the NIR region encompasses the high-performance, cost-effective optical components are readily available from the semiconductor industry [23,66]. This is demonstrated by the Micius satellite, which utilizes NIR wavelengths ranging from 810 nm to 850 mm [11,12]. Several challenges exist in implementing the optimized longer wavelength regions, SWIR and MWIR, particularly for larger receiver diameters and beam waists. For example, an initial beam waist of 10 cm (35 cm) and wavelength ∼1.55 μ m (∼3.70 μ m) requires a 6 m diameter receiver. Practical difficulties in implementing larger telescopes include supporting large, heavy optical components which are prone to imperfections, including distortion and aberrations, along with the expense and difficulty of manufacturing suitable high-quality reflective mirrors. These practical limitations in the receiver were ignored in the modelling under the assumption that they would be overcome in the future with advances in technology.
Alternatively, a small receiver diameter combined with a large initial beam waist could serve a multitude of wavelengths in the visible and NIR with a slightly lower performance. At 1 m, the NIR region is optimum (at a λ = 0.867 μ m), while at 2 m, the SWIR region (at a λ = 1.556 μ m) achieves a secret key rate of 0.0271 bits/use which is close to the maximum value. Many optical devices are optimised for the telecommunication channel at λ = 1.556 μ m, which makes it the most practical channel for high-performance satellite QKD. The SWIR region has been studied extensively in the literature, for channels around 1.55 μ m [61,67]. This is due to the maturity of optical components with widespread use in the telecommunications industry. The telecom band is the standard choice in optical fibre communication (both classical and quantum) and is fully compatible with integrated silicon photonics. Additionally, off-the-shelf single-mode fibre (SMF) has low absorption at 1550 nm wavelengths, and SMF coupling is optimized here. This is vital when considering the size, weight and power (SWAP) requirements for satellite QKD transmitters and optical payloads. As the beam waist requirement increases, the transmitter payload increases in SWAP requirements which is detrimental for satellite missions. The advantage at telecom wavelengths includes the significant advances in existing technologies and miniaturization with dedicated satellite missions (QUBE) for developing the integration of all optical components of a QKD system on a photonic integrated circuit (PIC) [68].

5.4. Adverse Atmospheric Conditions

Waterford winter skies often experience a range of adverse weather conditions. Considering historical hourly weather reports and model reconstructions for noon on 21 December [69], there is more than a 60 % chance of mostly cloudy or overcast weather and a 39 % chance of rain falling throughout the day. In this section, the performance of each wavelength is compared in these unfavourable conditions. Several low-level cloud/weather (<3 km) conditions were considered, including radiative fog with 500 m visibility, drizzle rain clouds, and haze, which is defined here as fog with a 5 km visibility. Other cloud types such as stratus, stratocumulus and moderate rain had even greater attenuation than drizzle rain clouds, so they are not included here. Figure 7 shows the transmittance and spectral radiance plotted as a function of wavelength for Figure 7a 5 km visibility haze, Figure 7c 500 m visibility radiative fog, and Figure 7e drizzle rain clouds. Research supports the advantages of LWIR FSOC systems for propagation through turbulence, as well as fog and other low visibility conditions [29,30,70]. In addition to reduced visibility, strong adverse atmospheric conditions can lead to serious (and random) deformations of the beam, resulting in a strong turbulence regime. Theoretical studies have been performed on quantum communications in moderate-to-strong turbulence, where atmospheric conditions can be detrimental to optical signals [17]. Positive key rates were obtained despite severely degraded signals and high optical losses. In strong turbulence, beam spread dominates pointing errors and beam wandering. All regions of the spectrum are attenuated by haze, but the LWIR region is much less affected. This improvement is even more evident when operating through fog and rain, where transmission is low in the LWIR but almost zero in all other regions. Analysis of these plots alone would conclude that the LWIR is the best region for QKD through adverse weather conditions.
Next, the secret key rate is calculated across the spectrum for the three adverse atmospheric conditions, as shown in Figure 7b,d,f. Surprisingly, the LWIR has the worst performance in all cases. Indeed, the only condition that permits positive rates is haze, with usable rates confined to wavelengths shorter than the LWIR. Wavelengths in the visible, NIR, and SWIR regions have higher secret key rates in haze due to their small spot sizes, which allows for tight spatial filtering. Despite the LWIR having the highest channel efficiency in adverse conditions, it also has the largest solid angle field of view and largest receiver requirement, resulting in the highest background probability, which consequentially yields the lowest secret key rate.

6. Conclusions

Developing a global quantum communication network poses several challenges, such as distance limitations of QKD over fibre optic networks. Satellite QKD is a promising solution that has matured from a theoretical concept to real-world demonstrations with the Micius satellite mission. Here, we determine optical wavelengths for QKD in the satellite downlink channel while operating through realistic daytime atmospheric conditions. The optimal wavelengths for QKD in the satellite downlink channel were determined for realistic daytime atmospheric conditions. A channel model was developed using the BB84 decoy-state QKD protocol as a performance metric. The secret key rate was determined for a wide range of wavelengths while considering operation in a broad range of atmospheric, geometric, and geographical conditions. Two base scenarios were considered, the clear skies of a typical summer’s day in Tucson, Arizona, to represent an ideal location for satellite communication and the overcast climate of an Irish winter, to represent a non-ideal location. On a relatively clear winter’s day with light cloud cover, Waterford is capable of yielding high secret key rates due to low solar radiance. However, Irish skies are often covered by clouds. Therefore, when more challenging atmospheric conditions are introduced, satellite communications become less practical.
Visible and NIR wavelengths benefit from a small beam spot size at the receiver, resulting in low diffraction losses and high transmittance. However, high solar radiance means that small receivers must be used to filter out excess noise photons, which reduces the secret key rate. The importance of the visible and NIR regions is that they (i) enable high secret key rates without requiring large receivers and (ii) can implement filtering techniques when operating through adverse weather conditions. The SWIR window has the highest transmittance across the whole spectrum and the lowest spectral radiance. However, it suffers from beam spread loss and requires large receivers to produce high secret key rate performance.
Future work could focus on an uplink scenario. Our analysis of the channel could be extended to include acquisition, tracking, and pointing (ATP), in addition to considering more angles. Furthermore, an analysis of potential attack scenarios and the impact of eavesdropping on the channel should be considered. Additionally, the altitude of the satellite is an important variable and requires further investigation to determine how it affects wavelength selection. Finally, a comparison with a CVQKD-based protocol, especially at longer wavelengths, would extend this work.

Author Contributions

Conceptualization, S.H., J.H. and D.K.; Methodology, S.H., N.B. and D.K.; Software, S.H.; Formal analysis, S.H.; Writing—original draft, S.H.; Writing—review and editing, J.H. and D.K.; Supervision, D.K. All authors have read and agreed to the published version of the manuscript.

Funding

This publication has emanated from research conducted with the financial support of Taighde Éireann—Research Ireland under Grant number 13/RC/2077_P2 at CONNECT: the Research Ireland Centre for Future Networks and under Grant number 21/RC/10294 P2.

Institutional Review Board Statement

Not applicable.

Informed Consent Statement

Not applicable.

Data Availability Statement

Data that support the plots within this paper and other findings of this study are available from the corresponding author upon reasonable request.

Conflicts of Interest

The authors declare no conflicts of interest.

Appendix A

Phase Screen Model

Turbulence is a statistical process. To account for random fluctuations in the refractive index, we use the modified von Karman refractive power spectral density (PSD) function as it is the simplest model that includes both the inner l 0 and outer L 0 scales [52,71]:
Φ ϕ ( k ) = 0.49 r 0 5 / 3 exp ( k 2 / k m 2 ) ( k 2 + k 0 2 ) 11 / 6
where k m = 5.92/ l 0 , K 0 = 2 π / L 0 and r 0 is the fried parameter for each region given by
r 0 = ( 0.423 k 2 s e c ( ζ ) h h + c n 2 ( h ) d h ) 3 / 5
where k is the wavenumber. The empirical Coulman–Vernin profile [72]
L 0 ( h ) = 4 1 + ( h 8500 2500 )
is used to compliment the Hufnagel Valley model, where l 0 = 0.005 L 0 . The scintillation index ( σ I 2 ) is defined as the normalized variance of irradiance fluctuations and is used here to quantify the strength of atmospheric turbulence:
σ I 2 = I x 0 , y 0 2 I x 0 , y 0 2 1
where I x 0 , y 0 is the received irradiance at point x 0 , y 0 . The beam is initialized using a Gaussian function and is represented by a uniform 2D square grid (of size 1024 × 1024) of complex numbers corresponding to the value of the electromagnetic field at that point in space [54]. Moreover, it is propagated using a discrete Fourier transform (DFT) algorithm. The phase screens are produced by performing fast Fourier transform (FFT) over a 2D uniform grid of Gaussian white noise, with variance being given by Equation (A1). To ensure that the condition of weak turbulence is maintained across each phase screen, the Rytov parameter is kept constant for each region of turbulence using the following equation [73]:
r R 2 = 1.23 k 7 / 6 h h + c n 2 ( h ) ( h h ) 11 / 6 d h = b
where b is set to 0.2, in accordance with reference [54]. The effect of turbulence can be considered negligible above 20 km, so Equation (A5) results in the total atmospheric turbulence spread across 17 phase screens. Software used in these simulations was developed in MATLAB v2021a [52] and run on Kay, Ireland’s high-performance computer provided by the Irish Centre for High-End Computing (ICHEC). Kay efficiently executed multiple iterations of the Monte Carlo simulation to generate 10,000 individual turbulent paths, enabling ensemble statistic analysis to characterize the propagation path and determine the impact of atmospheric turbulence.

References

  1. Shor, P.W. Polynomial-time algorithms for prime factorization and discrete logarithms on a quantum computer. SIAM Rev. 1999, 41, 303–332. [Google Scholar] [CrossRef]
  2. Bennett, C.H.; Brassard, G.; Mermin, N.D. Quantum cryptography without Bell’s theorem. Phys. Rev. Lett. 1992, 68, 557. [Google Scholar] [CrossRef] [PubMed]
  3. Ekert, A.K. Quantum cryptography based on Bell’s theorem. Phys. Rev. Lett. 1991, 67, 661–663. [Google Scholar] [CrossRef] [PubMed]
  4. Ralph, T.C. Security of continuous-variable quantum cryptography. Phys. Rev. A 2000, 62, 062306. [Google Scholar] [CrossRef]
  5. Wootters, W.K.; Zurek, W.H. A single quantum cannot be cloned. Nature 1982, 299, 802–803. [Google Scholar] [CrossRef]
  6. Briegel, H.J.; Dür, W.; Cirac, J.I.; Zoller, P. Quantum Repeaters: The Role of Imperfect Local Operations in Quantum Communication. Phys. Rev. Lett. 1998, 81, 5932–5935. [Google Scholar] [CrossRef]
  7. Ruihong, Q.; Ying, M. Research Progress Of Quantum Repeaters. J. Phys. Conf. Ser. 2019, 1237, 052032. [Google Scholar] [CrossRef]
  8. Kong, W.; Sun, Y.; Dou, T.; Xie, Y.; Li, Z.; Gao, Y.; Zhao, Q.; Chen, N.; Gao, W.; Hao, Y.; et al. Enhanced Coexistence of Quantum Key Distribution and Classical Communication over Hollow-Core and Multi-Core Fibers. Entropy 2024, 26, 601. [Google Scholar] [CrossRef]
  9. Jasion, G.T.; Sakr, H.; Hayes, J.R.; Sandoghchi, S.R.; Hooper, L.; Fokoua, E.N.; Saljoghei, A.; Mulvad, H.C.; Alonso, M.; Taranta, A. 0.174 dB/km hollow core double nested antiresonant nodeless fiber (DNANF). In Proceedings of the 2022 Optical Fiber Communications Conference and Exhibition (OFC), San Diego, CA, USA, 6–10 March 2022. [Google Scholar]
  10. Chen, Y.; Petrovich, M.; Fokoua, E.N.; Adamu, A.; Hassan, M.; Sakr, H.; Slavík, R.; Gorajoobi, S.; Alonso1, M.; Ando, R. Hollow Core DNANF Optical Fiber with <0.11 dB/km Loss. In Proceedings of the 2024 Optical Fiber Communications Conference and Exhibition (OFC), San Diego, CA, USA, 24–28 March 2024. [Google Scholar]
  11. Liao, S.K.; Cai, W.Q.; Liu, W.Y.; Zhang, L.; Li, Y.; Ren, J.G.; Yin, J.; Shen, Q.; Cao, Y.; Li, Z.P.; et al. Satellite-to-ground quantum key distribution. Nature 2017, 549, 43–47. [Google Scholar] [CrossRef]
  12. Yin, J.; Cao, Y.; Li, Y.H.; Liao, S.K.; Zhang, L.; Ren, J.G.; Cai, W.Q.; Liu, W.Y.; Li, B.; Dai, H.; et al. Satellite-based entanglement distribution over 1200 kilometers. Science 2017, 356, 1140–1144. [Google Scholar] [CrossRef]
  13. Sidhu, J.S.; Joshi, S.K.; Gündoğan, M.; Brougham, T.; Lowndes, D.; Mazzarella, L.; Krutzik, M.; Mohapatra, S.; Dequal, D.; Vallone, G.; et al. Advances in space quantum communications. IET Quantum Commun. 2021, 2, 182–217. [Google Scholar] [CrossRef]
  14. Pirandola, S. Satellite quantum communications: Fundamental bounds and practical security. Phys. Rev. Res. 2021, 3, 023130. [Google Scholar] [CrossRef]
  15. Belenchia, A.; Carlesso, M.; Bayraktar, Ö.; Dequal, D.; Derkach, I.; Gasbarri, G.; Herr, W.; Li, Y.L.; Rademacher, M.; Sidhu, J.; et al. Quantum physics in space. Phys. Rep. 2022, 951, 1–70. [Google Scholar] [CrossRef]
  16. Dequal, D.; Trigo Vidarte, L.; Roman Rodriguez, V.; Vallone, G.; Villoresi, P.; Leverrier, A.; Diamanti, E. Feasibility of satellite-to-ground continuous-variable quantum key distribution. Npj Quantum Inf. 2021, 7, 3. [Google Scholar] [CrossRef]
  17. Ghalaii, M.; Pirandola, S. Quantum communications in a moderate-to-strong turbulent space. Commun. Phys. 2022, 5, 38. [Google Scholar] [CrossRef]
  18. Pirandola, S. Limits and security of free-space quantum communications. Phys. Rev. Res. 2021, 3, 013279. [Google Scholar] [CrossRef]
  19. Bedington, R.; Arrazola, J.M.; Ling, A. Progress in satellite quantum key distribution. NPJ Quantum Inf. 2017, 3, 30. [Google Scholar] [CrossRef]
  20. Er-long, M.; Zheng-fu, H.; Shun-sheng, G.; Tao, Z.; Da-Sheng, D.; Guang-Can, G. Background noise of satellite-to-ground quantum key distribution. New J. Phys. 2005, 7, 215. [Google Scholar] [CrossRef]
  21. Tomaello, A.; Bonato, C.; Da Deppo, V.; Naletto, G.; Villoresi, P. Link budget and background noise for satellite quantum key distribution. Adv. Space Res. 2011, 47, 802–810. [Google Scholar] [CrossRef]
  22. Gruneisen, M.T.; Sickmiller, B.A.; Flanagan, M.B.; Black, J.P.; Stoltenberg, K.E.; Duchane, A.W. Adaptive spatial filtering of daytime sky noise in a satellite quantum key distribution downlink receiver. Opt. Eng. 2016, 55, 026104. [Google Scholar] [CrossRef]
  23. Gruneisen, M.T.; Eickhoff, M.L.; Newey, S.C.; Stoltenberg, K.E.; Morris, J.F.; Bareian, M.; Harris, M.A.; Oesch, D.W.; Oliker, M.D.; Flanagan, M.B.; et al. Adaptive-Optics-Enabled Quantum Communication: A Technique for Daytime Space-To-Earth Links. Phys. Rev. Appl. 2021, 16, 014067. [Google Scholar] [CrossRef]
  24. Plank, T.; Leitgeb, E.; Pezzei, P.; Ghassemlooy, Z. Wavelength-selection for high data rate Free Space Optics (FSO) in next generation wireless communications. In Proceedings of the 2012 17th European Conference on Networks and Optical Communications, Geltru, Spain, 20–22 June 2012; IEEE: New York, NY, USA, 2012; pp. 1–5. [Google Scholar]
  25. Vasylyev, D.; Semenov, A.; Vogel, W. Atmospheric quantum channels with weak and strong turbulence. Phys. Rev. Lett. 2016, 117, 090501. [Google Scholar] [CrossRef] [PubMed]
  26. Aellen, T.; Giovannini, M.; Faist, J.; Von der Weid, J.P. Feasibility study of free-space quantum key distribution in the mid-infrared. Quantum Inf. Comput. 2008, 8, 0001–0011. [Google Scholar]
  27. Wang, Z.; Malaney, R.; Green, J. Inter-satellite quantum key distribution at terahertz frequencies. In Proceedings of the ICC 2019–2019 IEEE International Conference on Communications (ICC), Shanghai, China, 20–24 May 2019; IEEE: New York, NY, USA, 2019; pp. 1–7. [Google Scholar]
  28. Pavelchek, A.; Trissel, R.G.; Plante, J.; Umbrasas, S. Long-wave infrared (10-micron) free-space optical communication system. In Proceedings of the Free-Space Laser Communication and Active Laser Illumination III. International Society for Optics and Photonics, San Diego, CA, USA, 4–6 August 2003; Volume 5160, pp. 247–252. [Google Scholar]
  29. Achour, M. Free-space optics wavelength selection: 10 μm versus shorter wavelengths. J. Opt. Netw. 2003, 2, 127–143. [Google Scholar] [CrossRef]
  30. Colvero, C.; Cordeiro, M.; De Faria, G.; Von der Weid, J. Experimental comparison between far-and near-infrared wavelengths in free-space optical systems. Microw. Opt. Technol. Lett. 2005, 46, 319–323. [Google Scholar] [CrossRef]
  31. Pang, X.; Ozolins, O.; Zhang, L.; Schatz, R.; Udalcovs, A.; Yu, X.; Jacobsen, G.; Popov, S.; Chen, J.; Lourdudoss, S. Free-Space Communications Enabled by Quantum Cascade Lasers. Phys. Status Solidi (A) 2021, 218, 2000407. [Google Scholar] [CrossRef]
  32. Pirandola, S.; Andersen, U.L.; Banchi, L.; Berta, M.; Bunandar, D.; Colbeck, R.; Englund, D.; Gehring, T.; Lupo, C.; Ottaviani, C.; et al. Advances in quantum cryptography. Adv. Opt. Photon. 2020, 12, 1012–1236. [Google Scholar] [CrossRef]
  33. Xu, F.; Ma, X.; Zhang, Q.; Lo, H.K.; Pan, J.W. Secure quantum key distribution with realistic devices. Rev. Mod. Phys. 2020, 92, 025002. [Google Scholar] [CrossRef]
  34. Marulanda Acosta, V.; Dequal, D.; Schiavon, M.; Montmerle-Bonnefois, A.; Lim, C.B.; Conan, J.M.; Diamanti, E. Analysis of satellite-to-ground quantum key distribution with adaptive optics. New J. Phys. 2024, 26, 023039. [Google Scholar] [CrossRef]
  35. Lu, C.Y.; Cao, Y.; Peng, C.Z.; Pan, J.W. Micius quantum experiments in space. Rev. Mod. Phys. 2022, 94, 035001. [Google Scholar] [CrossRef]
  36. Sidhu, J.S.; Brougham, T.; McArthur, D.; Pousa, R.G.; Oi, D. Finite key effects in satellite quantum key distribution. NPJ Quantum Inf. 2022, 8, 18. [Google Scholar] [CrossRef]
  37. Sidhu, J.S.; Brougham, T.; McArthur, D.; Pousa, R.G.; Oi, D. Finite key performance of satellite quantum key distribution under practical constraints. NPJ Quantum Inf. 2023, 6, 210. [Google Scholar] [CrossRef]
  38. Li, Y.; Liao, S.K.; Cao, Y.; Ren, J.G.; Liu, W.Y.; Yin, J.; Shen, Q.; Qiang, J.; Zhang, L.; Yong, H.L.; et al. Space-ground QKD network based on a compact payload and medium-inclination orbit. Optica 2022, 9, 933–938. [Google Scholar] [CrossRef]
  39. Zheng, Y.; Deng, Y.; Shi, Z.; Fan, Y.; Wang, Z.; Lei, D.; Zhou, Z.K.; Wang, X.H. Enriching Metasurface Functionalities by Fully Employing the Inter-Meta-Atom Degrees of Freedom for Double-Key- Secured Encryption. Adv. Mater. Technol. 2023, 8, 2201468. [Google Scholar] [CrossRef]
  40. Luo, W.; Cao, L.; Shi, Y.; Wan, L.; Zhang, H.; Li, S.; Chen, G.; Li, Y.; Li, S.; Wang, Y.; et al. Recent progress in quantum photonic chips for quantum communication and internet. Light. Sci. Appl. 2023, 12, 175. [Google Scholar] [CrossRef] [PubMed]
  41. Hwang, W.Y. Quantum key distribution with high loss: Toward global secure communication. Phys. Rev. Lett. 2003, 91, 057901. [Google Scholar] [CrossRef] [PubMed]
  42. Kneizys, F.X.; Shettle, E.P.; Anderson, G.P.; Gallery, W.O.; Abreu, L.W.; Selby, J.E.A.; Chetwynd, J.H.; Clough, S.A. The Modtran 2/3 and Lowtran 7 Model; MODTRAN Report; Spectral Sciences Inc.: Burlington, MA, USA, 1995. [Google Scholar]
  43. Anderson, G.P.; Clough, S.A.; Kneizys, F.X.; Shettle, E.P.; Abreu, L.W.; Chetwynd, J.H.; Hall, L.A. FASCOD3: Spectral simulation. In Proceedings of the I.R.S.1988 International Symposium, Lille, France, 18–24 August 1988; Volume 4. [Google Scholar]
  44. Henniger, H.; Wilfert, O. An introduction to free-space optical communications. Radioengineering 2010, 19, 203. [Google Scholar]
  45. Chen, X.; Wei, H. A combined atmospheric radiative transfer model (CART): A review and applications. J. Opt. Soc. Korea 2010, 14, 190–198. [Google Scholar] [CrossRef]
  46. Nilsson, B.A. Analysis of the Atmospheric Aerosol Extinction in the 0.5–14 μm region. In FOA Report C 30396-E1,E3; Defence Research Establishment, Department 3, FOA3: Linköping, Sweden, 1986. [Google Scholar]
  47. Hågård, A.; R., P. Infrared transmission measurement in the atmosphere. In Proceedings of the SPIE-Proceedings, Bellingham, WA, USA, 21–22 July 1992; Volume 1762. [Google Scholar]
  48. Berk, A.; Conforti, P.; Kennett, R.; Perkins, T.; Hawes, F.; Van Den Bosch, J. MODTRAN® 6: A major upgrade of the MODTRAN® radiative transfer code. In Proceedings of the 2014 6th Workshop on Hyperspectral Image and Signal Processing: Evolution in Remote Sensing (WHISPERS), Lausanne, Switzerland, 24–27 June 2014; IEEE: New York, NY, USA, 2014; pp. 1–4. [Google Scholar]
  49. Berk, A.; Conforti, P.; Hawes, F. An accelerated line-by-line option for MODTRAN combining on-the-fly generation of line center absorption within 0.1 cm–1 bins and pre-computed line tails. In Proceedings of the Algorithms and Technologies for Multispectral, Hyperspectral, and Ultraspectral Imagery XXI, Baltimore, MD, USA, 21–23 April 2015; International Society for Optics and Photonics: Bellingham, DC, USA, 2015; Volume 9472, p. 947217. [Google Scholar]
  50. Kaushal, H.; Jain, V.; Kar, S. Free Space Optical Communication; Springer: Berlin/Heidelberg, Germany, 2017. [Google Scholar]
  51. Svelto, O.; Hanna, D.C. Principles of Lasers; Springer: Berlin/Heidelberg, Germany, 1998; Volume 4. [Google Scholar]
  52. Schmidt, J.D. Numerical Simulation of Optical Wave Propagation with Examples in MATLAB; SPIE: Bellingham, DC, USA, 2010. [Google Scholar]
  53. Hufnagel, R.E.; Stanley, N.R. Modulation transfer function associated with image transmission through turbulent media. J. Opt. Soc. Am. A 1964, 54, 52–61. [Google Scholar] [CrossRef]
  54. Villaseñor, E.; Malaney, R.; Mudge, K.A.; Grant, K.J. Atmospheric Effects on Satellite-to-Ground Quantum Key Distribution using Coherent States. In Proceedings of the GLOBECOM 2020—2020 IEEE Global Communications Conference, Taipei, Taiwan, 7–11 December 2020; pp. 1–6. [Google Scholar]
  55. Martin, J.; Flatté, S.M. Intensity images and statistics from numerical simulation of wave propagation in 3-d random media. Appl. Opt. 1988, 27, 2111–2126. [Google Scholar] [CrossRef]
  56. Frehlich, R. Simulation of laser propagation in a turbulent atmosphere. Appl. Opt. 2000, 39, 393–397. [Google Scholar] [CrossRef] [PubMed]
  57. Andrews, L.; Phillips, R.; Yu, P. Optical scintillations and fade statistics for a satellite-communication system. Appl. Opt. 1995, 34, 7742–7751. [Google Scholar] [CrossRef]
  58. Lanning, R.N.; Harris, M.A.; Oesch, D.W.; Oliker, M.D.; Gruneisen, M.T. Quantum Communication over Atmospheric Channels: A Framework for Optimizing Wavelength and Filtering. Phys. Rev. Appl. 2021, 16, 044027. [Google Scholar] [CrossRef]
  59. Ma, X.; Qi, B.; Zhao, Y.; Lo, H.K. Practical decoy state for quantum key distribution. Phys. Rev. A 2005, 72, 012326. [Google Scholar] [CrossRef]
  60. Gruneisen, M.T.; Flanagan, M.B.; Sickmiller, B.A. Modeling satellite-Earth quantum channel downlinks with adaptive-optics coupling to single-mode fibers. Opt. Eng. 2017, 56, 126111. [Google Scholar]
  61. Liao, S.K.; Yong, H.L.; Liu, C.; Shentu, G.L.; Li, D.D.; Lin, J.; Dai, H.; Zhao, S.Q.; Li, B.; Guan, J.Y.; et al. Long-distance free-space quantum key distribution in daylight towards inter-satellite communication. Nat. Photonics 2017, 11, 509. [Google Scholar] [CrossRef]
  62. Zhu, L.; Sun, P.C.; Bartsch, D.U.; Freeman, W.R.; Fainman, Y. Wave-front generation of Zernike polynomial modes with a micromachined membrane deformable mirror. Appl. Opt. 1999, 38, 6019–6026. [Google Scholar] [CrossRef] [PubMed]
  63. Morgan, R.E.; Vlahakis, S.; Douglas, E.; Allan, G.; do Vale Pereira, P.; Egan, M.; Furesz, G.; Gubner, J.; Haughwout, C.; Holden, B.; et al. On-orbit operations summary for the Deformable Mirror Demonstration Mission (DeMi) CubeSat. In Adaptive Optics Systems VIII; Proceedings of the SPIE Astronomical Telescopes + Instrumentation, Montréal, QC, Canada, 17–22 July 2022; SPIE: Bellingham, DC, USA, 2022; Volume 12185. [Google Scholar]
  64. You, L. Superconducting nanowire single-photon detectors for quantum information. Nanophotonics 2020, 9, 2673–2692. [Google Scholar] [CrossRef]
  65. Verma, V.B.; Korzh, B.; Walter, A.B.; Lita, A.E.; Briggs, R.M.; Colangelo, M.; Zhai, Y.; Wollman, E.E.; Beyer, A.D.; Allmaras, J.P.; et al. Single-photon detection in the mid-infrared up to 10 μm wavelength using tungsten silicide superconducting nanowire detectors. APL Photonics 2021, 6, 056101. [Google Scholar] [CrossRef]
  66. Rockwell, D.A.; Mecherle, G.S. Wavelength selection for optical wireless communications systems. In Proceedings of the Optical Wireless Communications IV, Denver, CO, USA, 19–24 August 2001; International Society for Optics and Photonics: Bellingham, DC, USA, 2001; Volume 4530, pp. 27–35. [Google Scholar]
  67. Avesani, M.; Calderaro, L.; Schiavon, M.; Stanco, A.; Agnesi, C.; Santamato, A.; Zahidy, M.; Scriminich, A.; Foletto, G.; Contestabile, G.; et al. Full daylight quantum-key-distribution at 1550 nm enabled by integrated silicon photonics. NPJ Quantum Inf. 2021, 7, 93. [Google Scholar] [CrossRef]
  68. Pudelko, J.; Bayraktar, ö.; Khan, I.; Boxleitner, W.; Petscharnig, S.; Pacher, C.; Leuchs, G.; Marquardt, C. Integrated Photonics for Quantum Communication on a Cubesat. In Proceedings of the 2023 Conference on Lasers and Electro-Optics Europe & European Quantum Electronics Conference (CLEO/Europe-EQEC), Munich, Germany, 26–30 June 2023; p. 1. [Google Scholar]
  69. Waterford. WeatherSpark.com. Available online: https://weatherspark.com/d/33020/12/21/Average-Weather-on-December-21-in-Waterford-Ireland#Figures-Temperature (accessed on 15 January 2022).
  70. Manor, H.; Arnon, S. Performance of an optical wireless communication system as a function of wavelength. Appl. Opt. 2003, 42, 4285–4294. [Google Scholar] [CrossRef] [PubMed]
  71. Andrews, L.C.; Phillips, R.L. Laser Beam Propagation Through Random Media; SPIE: Bellingham, DC, USA, 2005. [Google Scholar]
  72. Coulman, C.; Vernin, J.; Coqueugniot, Y.; Caccia, J. Outer scale of turbulence appropriate to modeling refractive-index structure profiles. Appl. Opt. 1988, 27, 155–160. [Google Scholar] [CrossRef] [PubMed]
  73. Liu, X.; Zhang, Q.; Xin, X.; Tian, Q.; Tao, Y.; Tian, F.; Shen, Y.; Cao, G.; Chen, D.; Wang, Y.; et al. Numerical Simulation of Ground-to-Satellite Laser Transmission based on Unequal Spacing Phase Screen. In Proceedings of the 2019 18th International Conference on Optical Communications and Networks (ICOCN), Huangshan, China, 5–8 August 2019; pp. 1–3. [Google Scholar]
Figure 1. Transmittance and spectral radiance plotted as a function of wavelength in Tucson and Waterford. The transmittance and radiance in Tucson are coloured blue and black, respectively, while green and red are used to represent the equivalent data in Waterford.
Applsci 15 01308 g001
Figure 2. The intensity profile for the beam at initialization (left) and the resulting wavefront after a 500 km propagation including 20 km of turbulence when the wavelength is 1.55 μ m (centre) and 10 μ m (right).
Applsci 15 01308 g002
Figure 3. Three-dimensional surface plots representing the secret key rate, R, in (a,b) Tucson and (c,d) Waterford, for a set of receiver diameters, D r , and wavelengths, λ , when the initial beam waist, w 0 , is 10 cm (left) and 35 cm (right). The simulation parameters are listed in the text.
Applsci 15 01308 g003
Figure 4. Three-dimensional contour plots representing the secret key rate in (a) Tucson and (b) Waterford, for a range of receiver diameters D r and initial beam waists w 0 . Wavelengths were selected to represent each window, where the D r , w 0 combination (marked by the circle) optimizes the secret key rate.
Applsci 15 01308 g004
Figure 5. Variation of secret key rate with coherence length in (a) Tucson and (b) Waterford using the optimum w 0 , D r and λ values for each region of the electromagnetic spectrum.
Applsci 15 01308 g005
Figure 6. The effect that increasing the initial beam waist and receiver diameter has on the maximum secret key rate and optimum wavelength selection in (a) Tucson and (b) Waterford. Points show wavelengths, in μ m, that produce the maximum secret key rate for each initial beam waist and receiver size.
Applsci 15 01308 g006
Figure 7. Transmittance and spectral radiance for a ground receiver pointed at the zenith at noon on the winter solstice in Waterford, through (a) 5 km visibility haze, (c) 500 m visibility radiative fog, and (e) drizzle rain clouds. Parts (b,d,f) are 3D surface plots of secret key rates versus wavelength and receiver diameters in adverse weather conditions.
Applsci 15 01308 g007
Table 1. Wavelength, receiver diameter, and initial beam waist that maximise secret key rate in Tucson and Waterford using the parameters listed in the text. These are compared with commonly used wavelengths in the NIR2 and SWIR2 regions.
Scenario 1: Tucson
ParameterVisibleNIRSWIRMWIRLWIRNIR2SWIR2
Wavelength λ ( μ m)0.697391.28572.13443.70268.30310.8671.556
Secret key rate R (bits/use)0.02870.03390.0360.03580.02460.03220.0352
Receiver diameter D r (m)1.37842.16133.14234.55.13421.67572.5477
Initial beam waist w 0 (m)0.32610.44650.58190.76251.15380.37120.5067
Scenario 2: Waterford
ParameterVisibleNIRSWIRMWIRLWIRNIR2SWIR2
Wavelength λ ( μ m)0.697391.29882.14073.70268.3030.8671.556
Secret key rate R (bits/use)0.02230.02710.0290.02910.02220.02490.0282
Receiver diameter D r (m)1.58652.36943.34054.9365.2731.85412.7856
Initial beam waist w 0 (m)0.32610.46150.58190.76251.15380.37120.5067
Disclaimer/Publisher’s Note: The statements, opinions and data contained in all publications are solely those of the individual author(s) and contributor(s) and not of MDPI and/or the editor(s). MDPI and/or the editor(s) disclaim responsibility for any injury to people or property resulting from any ideas, methods, instructions or products referred to in the content.

