Article

User Profile Construction Based on High-Dimensional Features Extracted by Stacking Ensemble Learning

by
Zhaoyang Wang
1,
Li Li
1,
Ketai He
2,* and
Zhenyang Zhu
1,*
1
School of Automation Science and Electrical Engineering, Beihang University, Beijing 100191, China
2
School of Mechanical Engineering, University of Science and Technology Beijing, Beijing 100083, China
*
Authors to whom correspondence should be addressed.
Appl. Sci. 2025, 15(3), 1224; https://doi.org/10.3390/app15031224
Submission received: 13 December 2024 / Revised: 21 January 2025 / Accepted: 23 January 2025 / Published: 25 January 2025
(This article belongs to the Special Issue AI Technology and Security in Cloud/Big Data)

Abstract

:
Online social networks, as platforms for personal expression, have evolved into complex networks integrating political and social dimensions. This evolution has shifted the focus of network governance from addressing hacking activities to mitigating unpredictable social behaviors, such as the malicious manipulation of public opinion, the doxing of ordinary users, and cyberbullying. However, the sparsity of data and the concealed nature of user behavior pose significant challenges to existing network reconnaissance technologies. In this study, we focus on constructing user profiles on online social network platforms by extracting features to build deep user profiles based on behavioral patterns. Drawing inspiration from the 5Cs principle of credit evaluation, we refine it into a 3Cs principle tailored for user profiling on social network platforms and associate it with user behavioral patterns. To further analyze user behavior, a high-dimensional feature extraction method is proposed using an improved stacking ensemble learning model. Based on experimental data analysis, the most suitable base algorithms for high-dimensional feature extraction are identified. Experimental results demonstrate that the integration of high-dimensional features improved the behavior prediction accuracy of the profiling model by 9.26% on balanced datasets and enhanced the AUC (area under the curve) metric by 3.69% on imbalanced datasets. The proposed method effectively increases the depth and generalization performance of user profiling.

1. Introduction

Online social networks (OSNs) have gradually supplanted traditional media as the primary platforms for public information consumption and opinion expression [1,2]. Research indicates that these global information dissemination channels attract widespread participation in policy and news discussions. Their real-time nature and vast user base significantly contribute to the discourse surrounding trending topics and sudden events [3,4].
The proliferation of the internet and the rise of social networks, such as TikTok and Twitter, have not only facilitated the seamless communication, exchange, and dissemination of information but also provided covert means for illegal activities and cybercrimes. Exploiting the anonymity and virtuality of social media platforms, malicious actors employ metaphors, coded language, and other methods to communicate and disseminate information. By manipulating or altering the information carried by these networks, they can directly influence the thoughts of online audiences, thereby shaping their judgments on social events. Furthermore, the anonymity and global reach of these platforms enable perpetrators to engage in unlawful activities across multiple locations while amplifying their influence through the broadcasting features of social media. Fortunately, such behaviors typically exhibit a high degree of correlation and organization [5]. Leveraging technologies such as data mining and artificial intelligence to construct malicious user profiles can offer significant potential for proactive risk mitigation.
User labeling, or user profiling, involves using a set of user attributes or behavioral features to create concise yet representative descriptions based on data and behavior analysis. These attributes may include age, gender, IP address, occupation, education level, interests, and social media activities. Such data can be transformed into actionable intelligence for law enforcement, enabling the identification of high-risk individuals and the early detection of potential criminal activities. For instance, analyzing account registration details alongside data traces from clicks, visits, and bookmarks can directly identify and evaluate anomalous users—one of the most direct applications of user profiling in investigations [6]. Additionally, profiling can uncover behavioral patterns and interaction dynamics within criminal groups, facilitating the identification of other members and potential targets, thereby enabling the control and guidance of group behaviors [7].
In practice, although social media platforms contain valuable data for identifying individuals and predicting criminal tendencies, the sparse and unstructured nature of this data poses significant challenges for effective extraction and classification. The fragmentation and high degree of unstructured data demand sophisticated approaches in data mining and behavioral prediction. Furthermore, although academic research has explored user profiling from various perspectives and to varying degrees, its application in the context of internet communities remains relatively limited. However, the data carried by social network users often do not directly correlate with their risk levels. Instead, the relationship between user characteristics and risk exists in a higher-dimensional vector space. While basic attribute-based profiling captures substantial user information, deeper insights into user behavior and the extraction of high-dimensional features are essential for addressing risks posed by malicious online users.
In this study, we advance research into predicting the “risky behaviors” of users based on profiling. A deep user profiling model based on behavioral patterns is introduced guided by the 3Cs principle, adapted from the credit assessment 5Cs framework. Features are extracted from internet data based on these principles. Subsequently, the dataset is processed to derive the foundational features of user profiles, which are categorized into three attributes: population attributes, tweet attributes, and social attributes. Addressing the challenges of data sparsity and the concealment of anomalous behaviors, an enhanced stacking model is proposed. This model integrates base classifiers for extracting high-dimensional features and a meta-classifier for feature fusion. Through mathematical analysis and experimental evaluation, the performance of various base classifiers is compared, enabling the effective selection of high-dimensional features. By mining users’ in-depth behavioral patterns, we enrich user profile attributes, enhancing both accuracy and generalization. Based on this research, user characteristics are identified, and social network profiles are built by analyzing users’ personal information, online content, and social interactions. This approach helps predict abnormal behaviors on social networks, enhancing the efficiency of monitoring and guiding online communities, intelligence collection and analysis, and social security investigations.
In summary, the contributions of this paper are as follows:
  • It proposes the 3Cs principle for the risk assessment of social network users, categorizing raw datasets into three foundational attributes based on behavioral patterns and constructing OSN user profiles accordingly.
  • It analyzes and compares the strengths and weaknesses of various supervised learning algorithms in extracting high-dimensional attributes, identifying the most suitable classifiers for profiling tasks.
  • It improves traditional stacking methods by integrating diverse machine learning algorithms to extract high-dimensional user attributes, enhancing the accuracy and robustness of user profiles by leveraging basic attribute information.

2. Related Works

User profiling methods can be broadly classified into traditional approaches and those based on artificial intelligence (AI) algorithms. With advancements in AI, traditional profiling methods reliant on statistical and expert analyses have increasingly faded from mainstream research. Anjum et al. [8], in their review of hate speech analysis, examined 111 papers and found that 44 utilized classic machine learning (ML) methods, while 35 employed deep learning (DL) techniques. Among these, ML-based studies predominantly used support vector machines, naïve Bayes, and decision trees, whereas DL-based approaches frequently relied on convolutional neural networks (CNNs) and long short-term memory networks (LSTMs). ML research typically focuses on single-objective classification and prediction tasks, though a growing number of profiling analyses now adopt DL models for greater discrimination.

2.1. ML-Based User Profiling Research

ML-based user profiling primarily targets small-scale training scenarios for single-objective prediction tasks. To enhance the quality of user profiles in learning management systems, Yiouli et al. [9] employed a Bayesian network-based approach to make predictions across four different scenarios, demonstrating the versatility of user profiling techniques. For example, Bui [10] innovatively used geotagged points of interest (POI) from social media photos to estimate POI geographical boundaries. Similarly, Yang et al. [11] automatically detected POI changes from Chinese texts and registration data on the social media platform Weibo. Chew R. et al. [12] developed a competitive Reddit age prediction algorithm using public data, demonstrating the efficacy of ML methods in identifying age-specific audiences on Reddit for public health outreach. Their results highlighted distinct posting behaviors, language patterns, and account characteristics between teenagers and adults. Emad et al. [13] proposed an ML-based approach for detecting user gender and age using unigram features, part-of-speech tagging, and generative rules, achieving accuracy superior to existing techniques. Tsao et al. [14] applied unsupervised topic modeling with latent Dirichlet allocation on tweets from Ontario, Canada, during the second wave of COVID-19, providing a method for the timely identification of public sentiments and opinions. Alejandro et al. [15] analyzed the relationship between biodiversity observations and demographic characteristics (e.g., age, gender) of tourists in Patagonia through multivariate analysis and the Van der Waerden test using YouTube video data. Alsaqer et al. [16] achieved a 67% accuracy in the geolocation prediction of Saudi Arabian Twitter users based on tweet content, showcasing ML’s utility in inferring user attributes.

2.2. DL-Based User Profiling Research

DL-based user profiling leverages advancements in neural network technologies, such as CNNs, RNNs, and LSTMs, which excel in extracting information for tasks like text classification. Roberto et al. [17] proposed a dynamic coherence-based modeling (DCBM) algorithm based on semantic analysis. This method improves user profiles by analyzing the consistency of user interaction history, making them more aligned with actual user preferences. Pradeep et al. [18] conducted a review on detecting fake accounts in social networks. They found that most existing studies focus on three aspects: account features, behavioral features, and content features. They also suggested that future research should pay more attention to the application of DL techniques. As for the main focus of this paper, researchers have applied DL methods extensively to mainstream OSN platforms such as Weibo and Twitter, producing significant results across diverse social issues [19]. For instance, during the COVID-19 pandemic, ML and DL methods were used for sentiment classification [20], topic analysis [21], rumor detection [22], and stance prediction [23]. Tao et al. [24] analyzed public discourse on the Russia–Ukraine conflict, identifying cross-platform differences in sentiment and extracting emotional insights via semantic network graphs. Ma et al. [25] examined the spatial distribution of floods in southern China in 2020 and their association with public sentiment, contributing to emotion classification research. Zhang et al. [26] employed BERT (bidirectional encoder representations from transformers) and structural topic models to analyze young people’s perspectives on “involution” and their collective resistance behaviors online. Li et al. [27] selected the top three topics related to migrant workers on Weibo, applying LDA modeling and regression analysis to investigate emotional divergence. Kanaparthi [28] proposed a novel method combining sentiment polarity classification with VADER and TextBlob and emotional prediction using DistilBERT-powered RNNs for mental health groups.
Despite the increasing adoption of cutting-edge algorithms such as deep learning and reinforcement learning in various profiling tasks, ML methods and their variants still maintain relevance [29]. Historical studies underscore the wide applicability of AI-based user profiling approaches in predicting user attributes, identifying features, and analyzing stance and emotions. However, research into profiling “risky behaviors” or constructing user risk profiles based on OSNs remains limited, presenting a significant opportunity for future exploration.

2.3. Applications of User Profiling in Network Community Environment Governance

In the field of cybersecurity, user profiling has been widely applied to identify malicious activities and enhance predictive models. Mubarak et al. [30] proposed a fine-grained classification method for identifying malicious tweets within Arabic contexts, aimed at guiding users in modifying their tweets autonomously. Tufchi et al. [31] explored the generation, dissemination, and lifecycle of contemporary misinformation or “fake news” using supervised and unsupervised learning techniques, such as generative adversarial networks (GANs). Xin et al. [32], in view of the security threats caused by malicious software in the Android system, proposed the behavior profiling algorithm DroidPortrait for malicious software by combining the random forest method, achieving the behavior detection of malicious software. Alarfaj et al. [33] employed various machine learning and deep learning algorithms to detect Twitter bots that disseminate spam or political content. To address the limited generalization capabilities of real-time rumor detection models based solely on single-text semantic features, Huang Xuejian et al. [34] developed a prediction model that integrates diverse user and content features for identifying rumor-spreading behaviors on Weibo. Earlier, Ghosh [35] introduced a fraud detection system based on artificial neural networks (ANNs), leveraging a labeled dataset of credit card transactions. The model significantly improved the detection rate of fraudulent accounts—by an order of magnitude—while reducing false positives by 20 times compared to conventional methods. Similarly, Chen Rongrong et al. [36] utilized the XGBoost algorithm to construct a credit card fraud prediction model, offering financial institutions an efficient tool for anticipating fraudulent transactions. Donat et al. [37] investigated the predictive relationships between personal attributes—such as gender, age, relationship status, value preferences, and cognitive emotion regulation strategies—and dating violence, providing foundational insights into user profiling applications in violence prediction. Dinesh et al. [38] proposed a three-tier structure for detecting abnormal users on OSN platforms, combining user profiling, complex one-time password generation, and cookie-based user authentication through a CNN-based framework. Xu et al. [39] introduced a collusion attack detection method based on multi-dimensional user features and coordinated behavior analysis. By capturing group synchronization and anomalous behaviors, they constructed a user similarity matrix and employed spectral clustering to identify collusion attackers within candidate groups.
Most cybersecurity research focuses on financial risk detection, low-credit user profiling, rumor detection, and bot identification. However, the detection of abnormal users leveraging publicly available data on OSN platforms remains relatively underexplored, especially compared to backend analysis or group anomaly monitoring. This gap highlights the need for further research into leveraging public OSN data to uncover individual abnormal behaviors effectively.

3. Method

3.1. Basic Attributes for User Profiling

The need to assess users’ credit systems or individual characteristics from multiple perspectives to avoid losses caused by malicious users has gradually evolved into user profiling technology, which is now widely applied across various industries. In the financial market, the 5Cs of credit provide a user profiling framework used by financial institutions and other non-bank lenders to evaluate borrowers’ creditworthiness and overall loan application strength. The 5Cs consist of capacity, character, capital and collateral, and conditions [40]. The 5Cs represent general principles used in traditional credit scoring to solve issues, and as a classic user risk evaluation system, many of its assessment criteria are applicable to the study of risky users on online social networks (OSNs). In the context of profiling malicious users on social network platforms, although highly personal information related to capital and collateral cannot be obtained from publicly accessible social data, the remaining 3Cs—capacity, character, and conditions—can largely be verified through social data. Referring to the traditional 5Cs credit scoring principles, the 3Cs framework for social network user risk assessment can be summarized as follows:
(1)
Capacity:
Low-risk users tend to share content related to their personal life on social networks. Such content often reflects their educational background, stable financial standing, significant online influence, and long, interconnected network chains.
(2)
Character:
Low-risk users typically act as producers rather than mere consumers of social media content. Their language style and content quality indicate traits like caution and responsibility. They demonstrate relatively healthy and consistent online activity patterns, including moderate posting frequency and appropriate post length.
(3)
Conditions:
Low-risk users usually maintain a good physical and mental state, without recent occurrences of unfortunate events such as unemployment or illness. These conditions reduce the likelihood of extreme behavior. While IP addresses cannot directly indicate user risk, malicious users often exhibit clustering or convergence in their IP patterns.
Based on the above principles, we summarize the relevant user attributes and their representative social network features in Table 1. Attributes and features that could potentially fall under two principles are only categorized under one principle.
Based on the potential behavioral patterns related to user profiling and the representative social network features summarized in Table 1 according to the 3Cs principles, we further investigate specific attributes derived from actual OSN platform data and categorize them more systematically. We mainly focus on data collected from Twitter due to its accessibility and consistency with other platforms. Guided by the 3Cs principles, the features collected in the raw dataset are preprocessed through data cleaning, content replacement, short-text data processing, and other operations, resulting in the feature set U_low. U_low contains all fundamental input attributes for the subsequent malicious user profiling prediction model. By analyzing these features, they are categorized into three groups representing potential user behavior patterns: population attributes, tweet attributes, and social attributes (detailed in Table 2).
Population attributes include basic user characteristics such as username, age, gender, and location. These attributes often influence users’ perspectives on various issues. For instance, usernames can provide significant insights into behavioral styles. Tweet attributes serve as another vital source of information on social networks. Although attributes like “tweet_vec” may not directly correlate with malicious behavior evaluation, temporal data, originality, the use of emojis, and the inclusion of links reveal personal preferences and behavioral tendencies, indirectly reflecting risk-related actions. The most distinctive social attributes arise from users’ profile pages, which offer statistics on network relationships, including followers and followings. Moreover, tweet-associated activities such as likes, retweets, comments, views, and mentions (@friends) also fall under this category. These behaviors underline the core social value of platforms, which lies in the connections established through user interactions like liking, retweeting, and commenting. Together, these social attributes form a unique source of networked information on social media platforms.

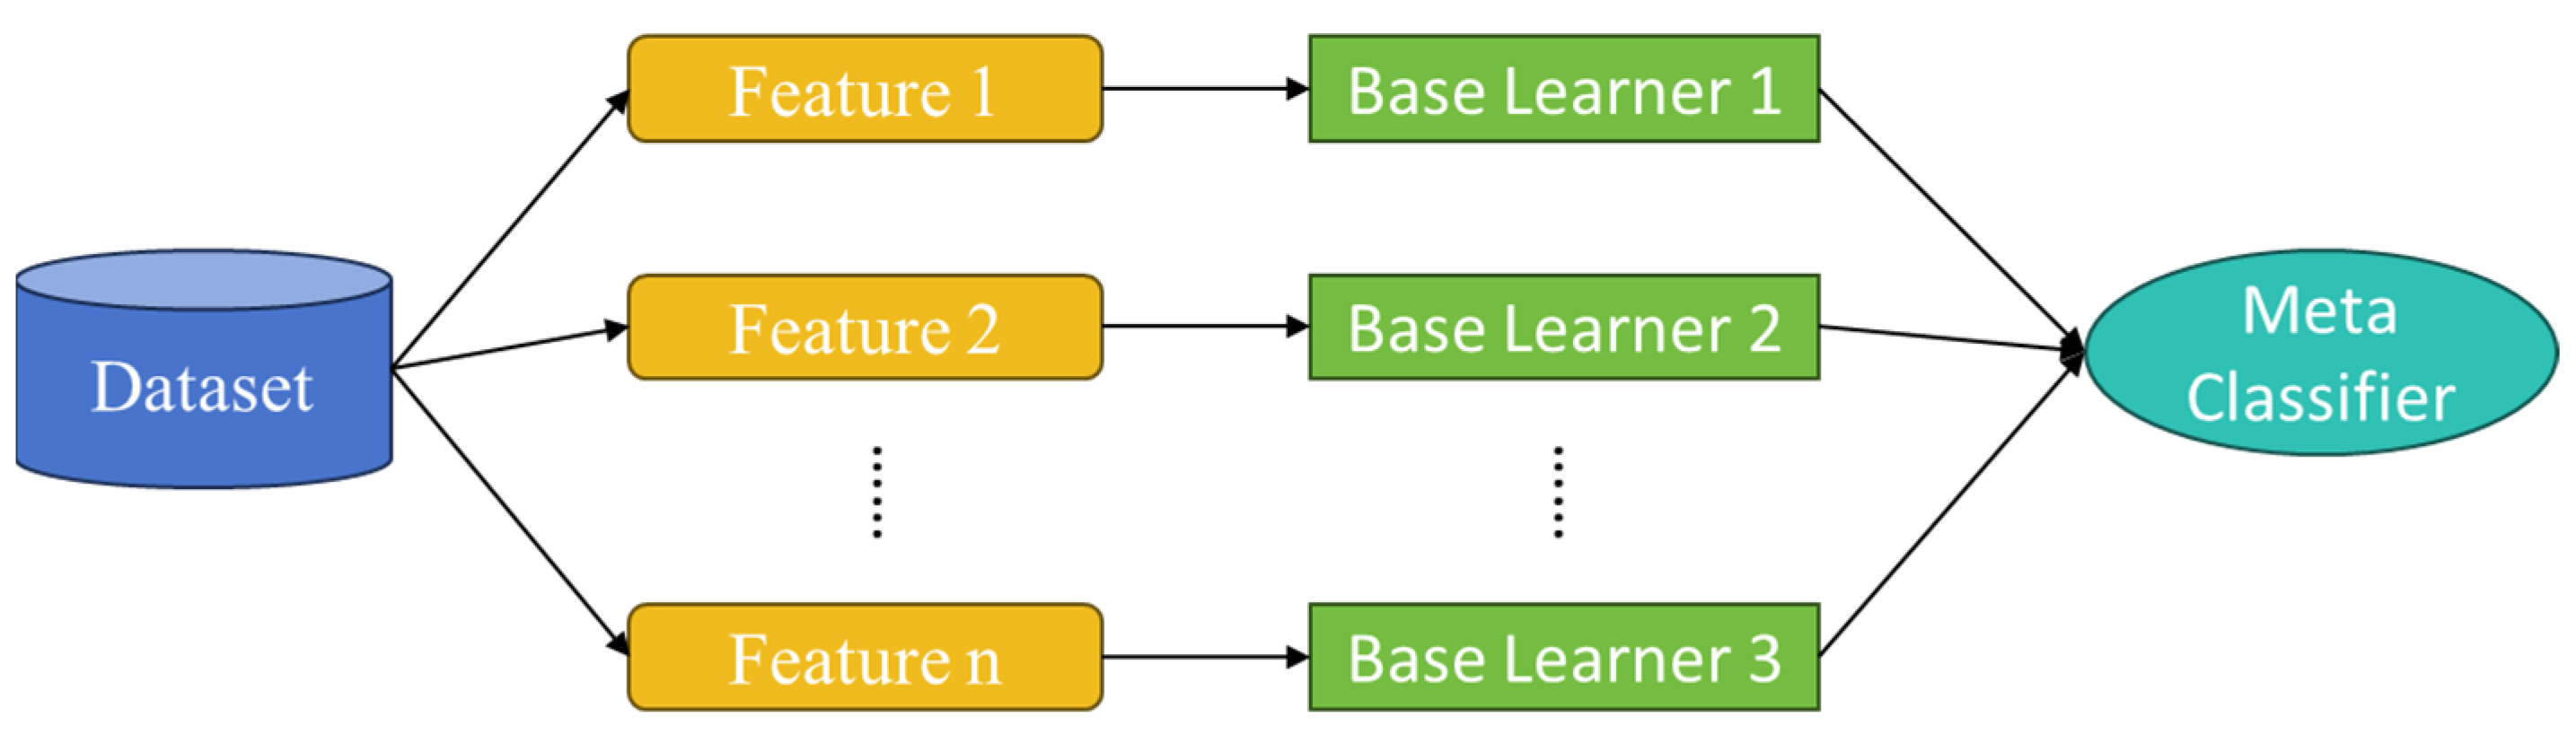
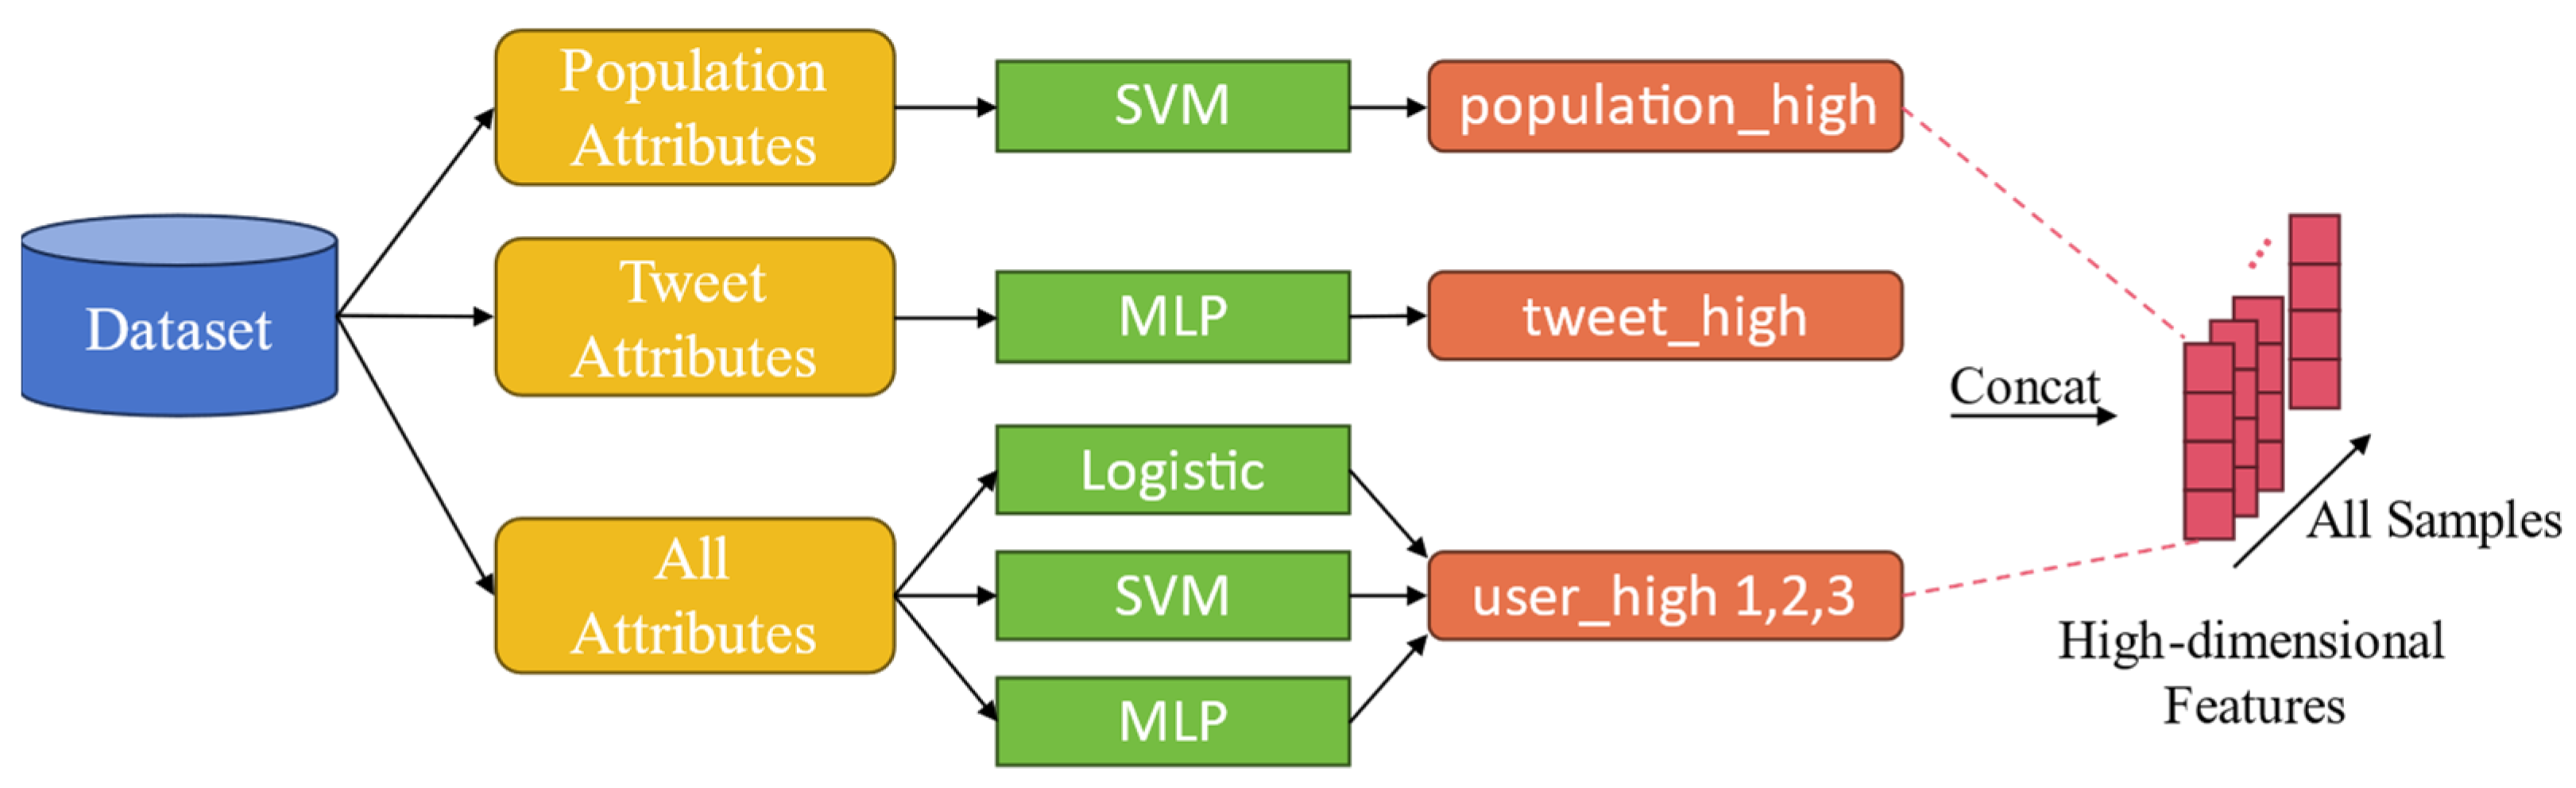
3.2. High-Dimensional Feature Extraction Using Stacking Learning

Although basic user attributes provide significant insights, the relationship between social network users’ features and their risk levels is often not directly apparent. Instead, this correlation exists in a higher-dimensional space. To further explore user behaviors and uncover hidden features, the extraction of deep, high-dimensional attributes becomes essential.
To combine the predictions of two or more base machine learning algorithms, an ensemble learning-based approach is employed for the design of feature extractors. Classic ensemble learning structures include bagging, boosting, and stacking. The goal of bagging is to enhance the model’s generalization ability by reducing the variance of the base classifiers. Therefore, the effectiveness of bagging largely depends on the stability of the base classifiers. In the case of boosting, from a mathematical perspective, it can reduce the bias of the results, theoretically enabling it to generate arbitrarily precise classifiers, even with weak base learners. However, this also makes boosting highly sensitive to noise, making it difficult to achieve good training results in datasets that are not conducive to it. Additionally, the serial structure of boosting leads to slower training times. On the other hand, stacking’s training method improves both model variance and bias. While aiming for broad model generalization, it retains the original features, with its meta-classifier used to find the corresponding weights or combinations of the features from the updated training set. If the outputs of the base classifiers are regarded as deep features of the samples, the meta-model can also be described as a multimodal data fusion model with deep information modalities.
After comparing and contrasting the three ensemble learning approaches, we finally select the stacking model as the overall framework for the proposed model. Based on the analysis in Section 3.1, the attributes are categorized into three groups: population attributes, social attributes, and tweet attributes. Each group represents unique dimensions of user behavior, requiring specific analytical approaches. The workflow, illustrated in Figure 1, integrates these groups using a tailored stacking approach.
In this method, base classifiers are trained separately for each attribute group, with only the best-performing classifiers retained. These are then integrated by a meta-classifier, which combines the output of the base classifiers into a single prediction. The ensemble model optimizes overall performance by considering the combined strength of all classifiers rather than relying on individual models. This structured integration ensures that each data type is analyzed effectively while capturing their deeper relationships in high-dimensional space.
To complement the foundational attributes, we introduce high-dimensional attributes in this paper, derived from a combination of the three attribute groups and advanced feature extraction methods. These new attributes, outlined in Table 3, encapsulate user characteristics that may not be evident in low-dimensional features but can be identified through advanced machine learning techniques.
For feature extraction, several supervised learning algorithms are employed, including logistic regression, support vector machines (SVMs), multi-layer perceptrons (MLPs), 1D convolutional neural networks (1D-CNNs), and decision trees. These algorithms process the basic features to generate higher-order representations that can reveal latent patterns linked to user risk. The results of these models will be evaluated in Section 4 to determine their effectiveness in uncovering meaningful high-dimensional attributes. This stacking-based framework effectively bridges the gap between basic user features and complex, high-dimensional patterns, providing a robust foundation for understanding user behavior and predicting risk on social networks.

4. Experiment

4.1. Implementation Details

The dataset used in this study is the publicly available Apontador dataset, which was collected from a location-based professional social network platform. The dataset was manually labeled by Helen Costa et al. [41], with 3538 entries categorized as spam, divided into three classes: local marketer, polluter, and bad-mouther. Local marketer includes ads related to local businesses, where excessive advertisements and promotional content may interfere with users’ normal browsing and some marketing information may contain phishing links or malware, posing security risks to users. Polluter refers to content that is irrelevant or unrelated to a specific location, and the proliferation of such content can lead to topic drift, disrupting the discussion atmosphere within the community. Bad-mouther is characterized by aggressive comments that target a particular place or other users, infringing upon their reputation and privacy and potentially causing psychological harm, thereby threatening social stability. These categories align with the malicious user labels discussed in the previous chapter, making the Apontador dataset suitable for experimental validation in this research. Additionally, 3538 non-spam entries are randomly selected to balance the dataset, resulting in a total of 7076 samples, as summarized in Table 4.
The dataset contains a significant imbalance, with far fewer malicious users compared to regular users in reality. In order to evaluate the performance of different combinations more realistically, especially under threshold-sensitive evaluation metrics, a balanced dataset is used. On the other hand, to get closer to real life, the imbalanced dataset is used. This dataset reflects the actual distribution of high-risk and regular users. The imbalanced dataset is derived from the Apontador dataset, with 3538 non-spam entries (representing two-thirds) and 1769 spam entries (including 531 local marketing, 858 pollution, and 380 malicious defamation cases, representing one-third). In subsequent studies by Helen Costa et al., features are further categorized into four groups, totaling 60 normalized features. The grouping principles are consistent with those in this study, with slight differences in naming. For simplicity, content attributes and social attributes in the dataset are denoted as CA and SA, respectively, corresponding to the tweet attributes and social attributes in Table 4. User attributes and place attributes are combined into user attributes according to the principles of this paper and are simply referred to as UA, corresponding to the population attributes in Table 4.

4.2. Stacking Base Classifier Performance Analysis

To analyze the effectiveness of the five base classifiers in deriving high-dimensional features, χ 2   Chi - squared , χ 2   p - value , and Pearson and Spearman correlation coefficients are used. These correlation metrics help quantify the strength of the relationships between features and labels, focusing on absolute values. The evaluation is performed on both the balanced and imbalanced datasets, comparing the performance of different attribute features using GBDT as the classifier. The GBDT model utilizes 100 decision trees with a learning rate of 0.1 and a maximum tree depth of 3, and evaluation is based on precision, recall, and F1-score metrics.
The test and correlation analysis results for the high-dimensional features extracted from population attributes are presented in Table 5, with prediction results for spam and non-spam information shown in Table 6. As indicated in Table 5, all the high-dimensional features derived from the user statistics pass the significance tests, confirming that, despite variations in the influence of each feature on the profiling results, they all contribute positively to improving accuracy. The high-dimensional features generated by different base learners are strongly correlated with the sample labels, with decision trees yielding the highest correlation. However, as shown in Table 6, decision tree-derived high-dimensional features exhibit balanced but mediocre prediction results. For non-spam information, the precision metric is of primary concern, while for spam, recall is prioritized. Classifier 2 demonstrates high precision for predicting positive samples, meaning that most of the cases it identified as positive are indeed correct, reducing false positives. Additionally, it shows high recall for predicting negative samples, meaning it successfully captures most of the actual negative samples, reducing false negatives. Therefore, classifier 2 (SVM) is chosen as the base learner for user attribute features in this study.
The test results and correlation analysis for the high-dimensional features extracted from tweet attributes are shown in Table 7. All the high-dimensional features extracted from tweet attributes pass the significance tests, but different base learners exhibit varied performance. Specifically, 1D-CNN, MLP, and decision trees perform better than Logistic learners in extracting high-dimensional features from tweet attributes, which differs from the results observed for population attributes. In the correlation analysis of the high-dimensional features extracted from tweet attributes, decision trees still achieve the best correlation metrics. However, their correlation coefficients do not differ significantly from those of other base classifiers. The high-dimensional features extracted by MLP show nearly identical Pearson and Spearman correlation coefficients to those extracted by decision trees.
The classification results for spam and non-spam information using high-dimensional features from tweet attributes as input are presented in Table 8. MLP achieves the highest precision score (0.824) and recall score (0.823) with marginal differences. The F1 score also indicates that MLP performs more consistently in predicting non-spam information. In terms of balancing false positives and false negatives, MLP demonstrates strong performance. Its high precision reduces the misclassification of positive samples, while its high recall ensures that nearly all negative samples are correctly identified. Consequently, MLP is selected as the base learner for high-dimensional feature extraction from tweet attributes.
The test results and correlation analysis for the high-dimensional features extracted from social attributes are shown in Table 9. Similar to the tweet attributes, all the high-dimensional features extracted from social attributes pass the significance tests. However, in terms of correlation with the sample labels, high-dimensional features based on social attributes show a considerable gap compared to those based on tweet and population attributes.
The classification performance for positive and negative samples using the high-dimensional features from social attributes as input is shown in Table 10. The recall for non-spam information reaches relatively ideal levels, with over 90% of positive samples being correctly predicted. However, the detection capability for spam information, which is the focus of this study, is only about 55%. Furthermore, the prediction of spam information exhibits an opposite pattern to that of non-spam information. While the model achieves high precision for spam information, it has low recall. This indicates that the model rarely classifies non-spam information as spam but often misclassifies spam information as non-spam. Such performance leads to the omission of spam information or malicious users. As a result, high-dimensional features based on social attributes are not included as supplementary features for user profiling in this study.
The test results and correlation analysis for the high-dimensional features extracted from all attributes are shown in Table 11. When all attributes are integrated as input, the performance of user profiling significantly improves. The Chi-squared test results for decision trees demonstrate the highest correlation when all attributes are used, as corroborated by the correlation analysis. In Table 11, the high-dimensional features extracted by decision trees show a correlation of over 0.9 with the sample labels.
Table 12 shows the classification results when the high-dimensional features extracted by different classifiers are used as input. The precision for non-spam information exceeds 85% for all classifiers, with Logistic, SVM, and MLP achieving over 90%. Additionally, these three base learners achieve recall values over 90% for spam information, demonstrating their strong capability to support the model when high-dimensional features based on all attributes are used. Therefore, we incorporated the results from Logistic, SVM, and MLP as supplementary features for user profiling.

4.3. Performance Evaluation of User Profiling with Integrated High-Dimensional Features

Based on the analysis in Section 4.2, the final improved user profiling method, which extracts high-dimensional features using stacking-based ensemble learning, is illustrated in Figure 2. The first layer of the stacking model consists of multiple base learners, including logistic regression (Logistic), support vector machines (SVMs), and multi-layer perceptron (MLP), which are used to extract high-dimensional feature representations from different attributes. The high-dimensional features extracted from population attributes are denoted as population_high, those from tweet attributes as tweet_high, and those from all attributes as user_high 1, user_high 2, and user_high 3. These high-dimensional features are then concatenated with the dataset to form a new feature dataset.
To achieve optimal identification performance, a composite neural network model with an attention mechanism is used for training, with its structure shown in Figure 3.
The dataset is divided into training and test sets in an 8:2 ratio to produce the model’s input X = u 1 , , u s 1 , u s T , where u i i = 1,2 , , s represents the feature vector of sample i , and s denotes the number of samples. CNN is used to extract features, with ReLU as the activation function in the convolutional layers and max-pooling applied. The final output O c = o c 1 , , o c s 1 , o c s T , where o c i i = 1,2 , , s represents each sample’s output from the CNN network, is activated using a sigmoid function, following the parameter transmission formula detailed below:
Z = ReLU u W c + b c
P = max Z + b p
o c = s i g m o i d P W o + b o
where Z is the output of the first convolution layer, P is the output of pooling, W c is the weight of the convolution layer, W o is the weight of the output layer, b c is the convolution layer bias, b p is the pooling layer bias, and b o is the output layer bias.
After convolution, LSTM is employed to extract text features. Its output h t is as below:
h t = L S T M o c t 1 , o c t , t 1 , j
where o c t is the value of o c at time t , and j is the length of o c . The output from LSTM is fed into an attention layer, where weights are assigned probabilistically. The attention layer output o t is derived as follows:
e t = u tan h w h t + b
a t = exp e t j = 1 t e j
o t = t = 1 i a t h t
where u and w are weights, b is bias, and e t is probability distribution. The user prediction results Y = y 1 , , y s 1 , y s T are then generated through a sigmoid activation function. The final model’s training results are shown in Figure 4.
Figure 4 presents the training outcomes for models under three scenarios: (1) without high-dimensional features, (2) with basic high-dimensional features (population high and tweet high), and (3) with all high-dimensional features. The test set accuracies achieved are 77.23%, 81.82%, and 86.49%, respectively. Integrating all high-dimensional features yields the highest overall accuracy for the training curve. Although some fluctuations occur, the inclusion of high-dimensional features allows the model to capture more information for effective learning. Using only basic high-dimensional features (population high and tweet high), the initial training curve resembles that of the full-feature model. However, as training progressed, its performance gradually declined and exhibited greater volatility, indicating that relying solely on partial high-dimensional features might be insufficient to sustain model performance throughout training. Without integrating high-dimensional features and using only the raw training inputs, the training curve consistently lagged behind the other two curves, demonstrating that high-dimensional features provide crucial information for accurate profiling predictions.
In summary, integrating multiple high-dimensional attribute features can effectively enhance the performance and stability of user profiling. This finding underscores the importance of considering the depth of profiling and hidden information during the profiling process. However, introducing too many variables could introduce noise, leading to minor oscillations in model training. Therefore, careful consideration of each variable’s contribution to the profiling model is necessary.

4.4. Robustness Analysis

In machine learning and deep learning, robustness refers to a model’s ability to tolerate noise, variability, or inaccuracies in input data while maintaining performance. A robust model effectively handles the complexities of real-world conditions, such as data corruption, operational errors, non-ideal environments, and natural variations in data. Given that the quantity of spam and non-spam information on real-world social networking platforms is often imbalanced, this section evaluates the overall performance of user profiling under such real-world scenarios. The evaluation uses an imbalanced dataset derived from the Apontador dataset, which is further supplemented with high-dimensional features to form a new balanced dataset. To achieve effective identification, the composite neural network model with the attention mechanism designed in Section 4.3 is used, with accuracy serving as the metric to assess the model’s overall training performance. The training results of the model are shown in Figure 5.
Figure 5 sequentially illustrates the training outcomes on the imbalanced dataset under three scenarios: (1) without high-dimensional features, (2) with basic high-dimensional features (population high and tweet high), and (3) with all high-dimensional features. Table 13 provides a comparative analysis of the profiling performance under different inputs.
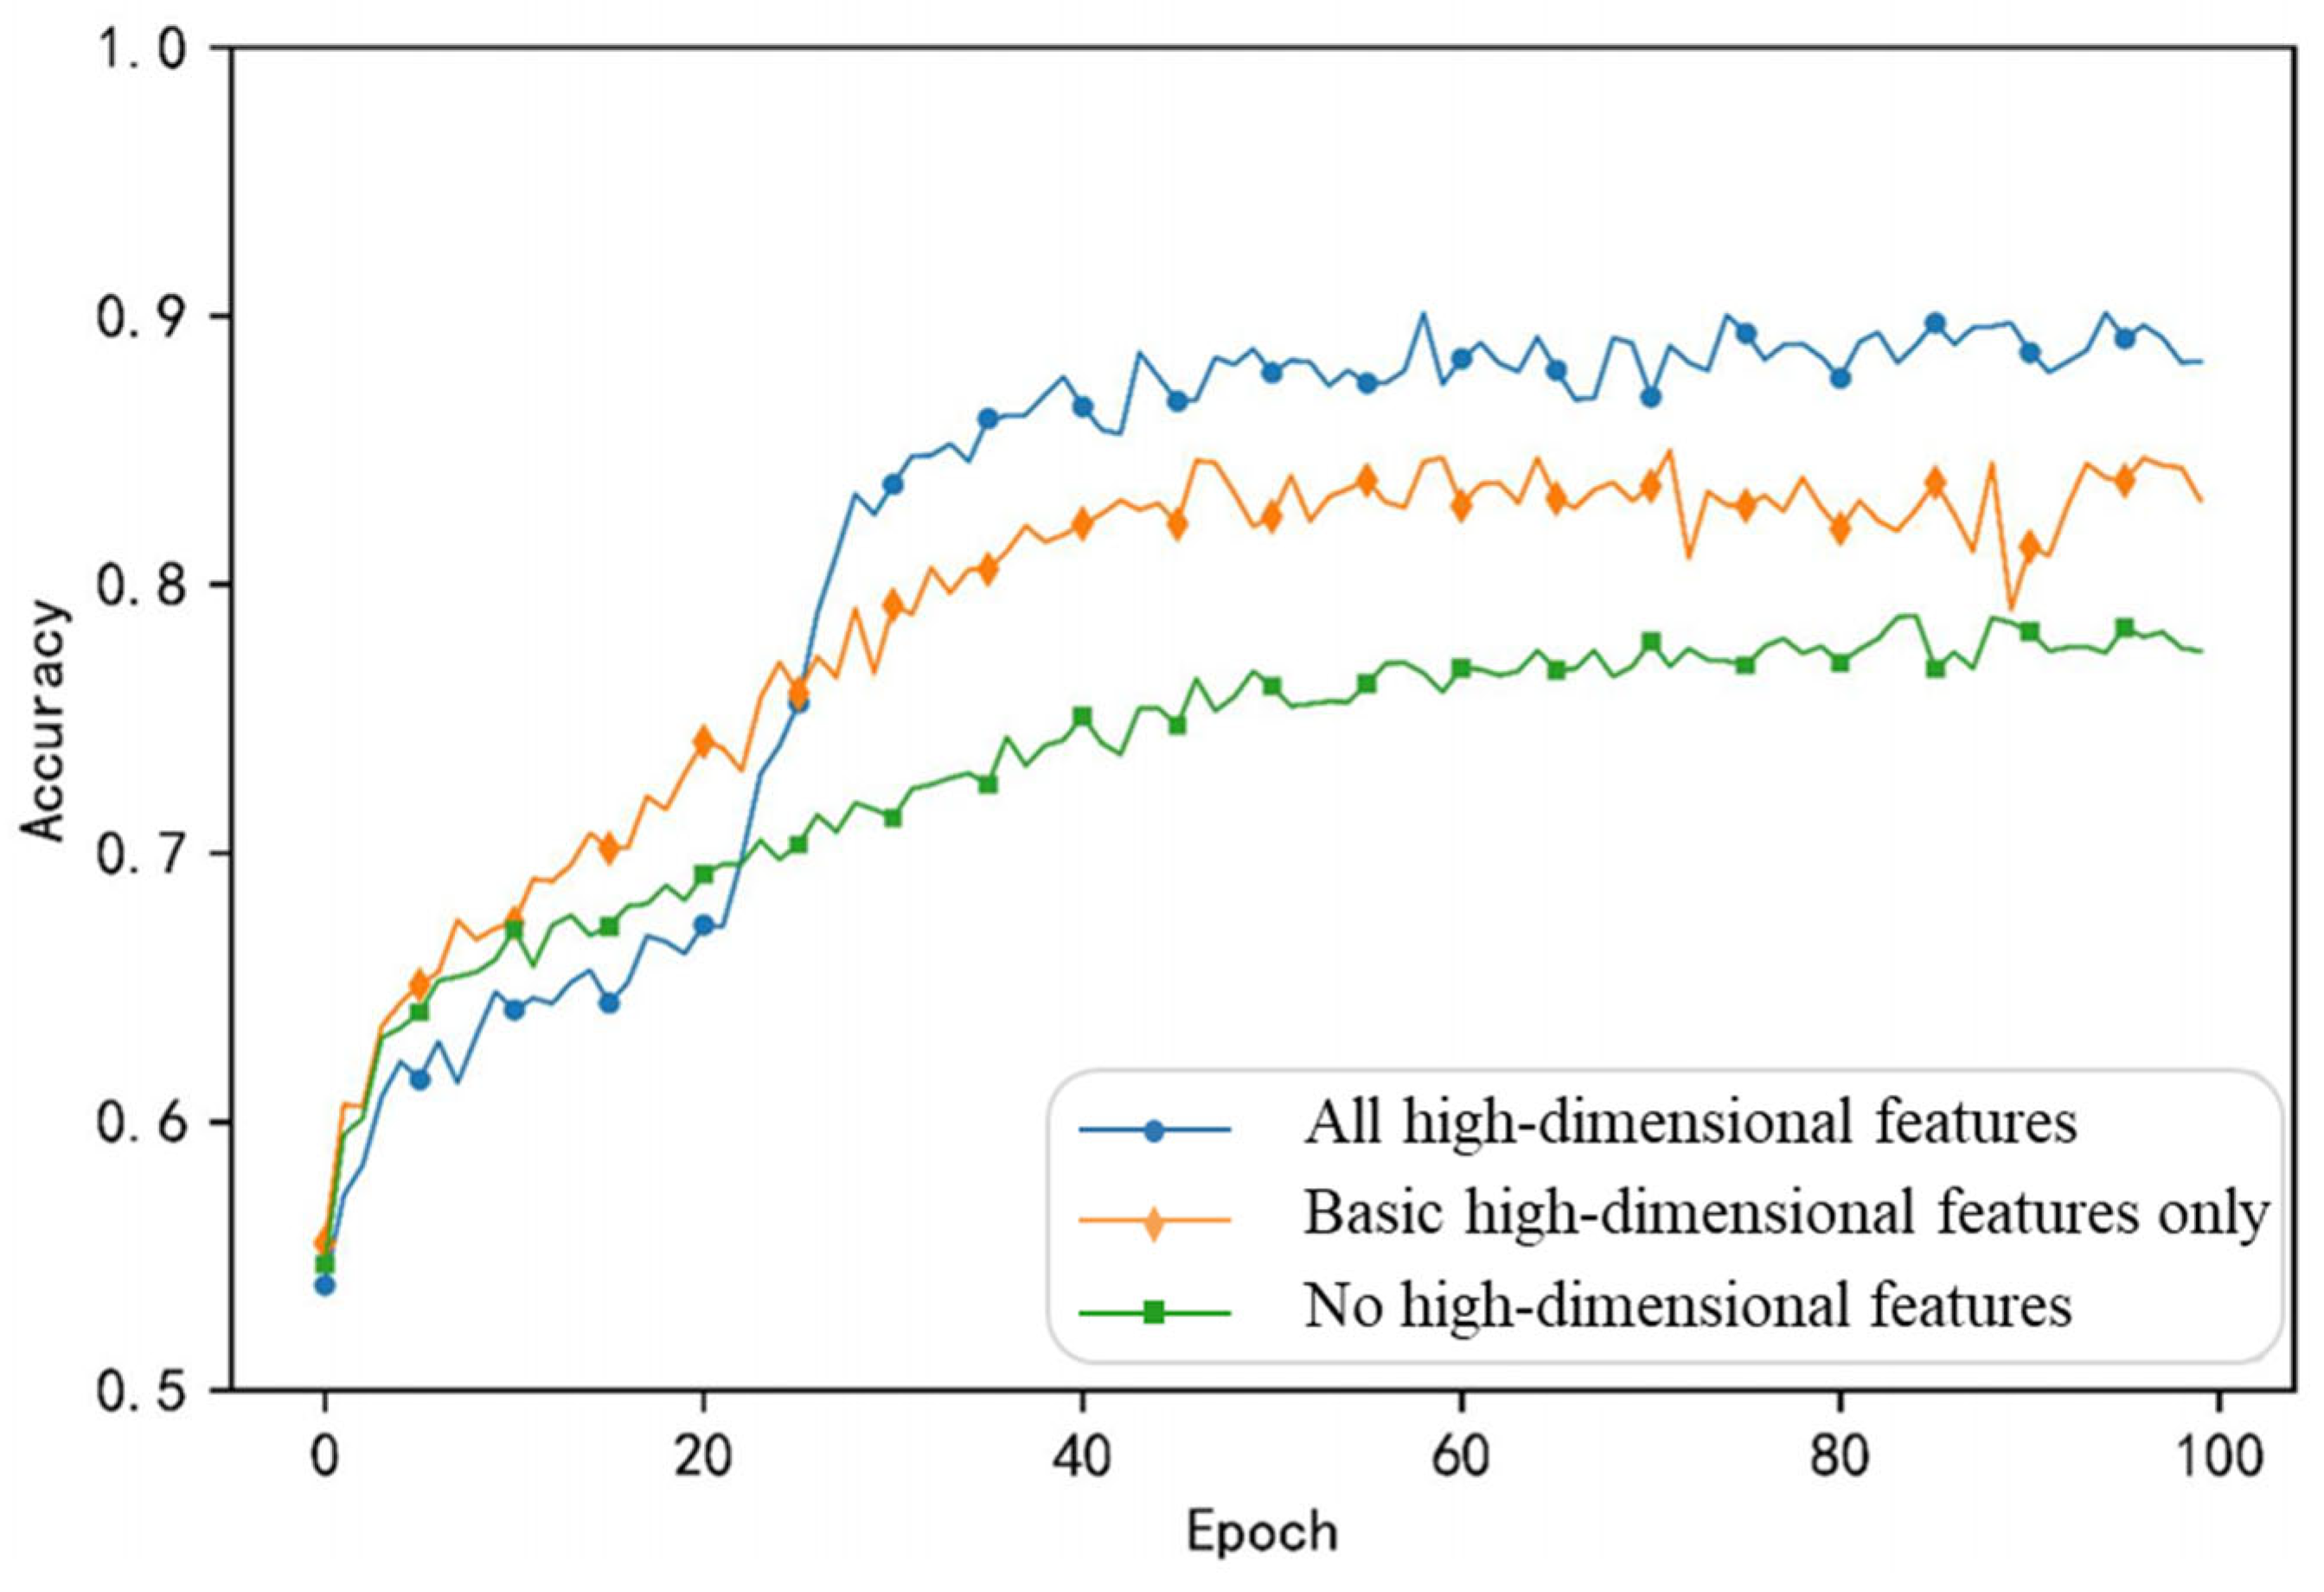
  • When all high-dimensional features are integrated, the training curve fluctuates at a high level, indicating that the profiling model performs well even when incorporating all potential high-dimensional features as input.
  • When only basic high-dimensional features are added, the curve closely follows the blue curve (all features) with similar fluctuations. The profiling model’s performance remains relatively good in this case, but it may lose some information, leading to a slight decline in performance.
  • Without high-dimensional features, the model performs the worst.
Table 13 compares the profiling prediction performance under different inputs on the imbalanced dataset. Combining the observations from Figure 4 and Figure 5, it can be seen that although the inclusion of high-dimensional features improves profiling accuracy to some extent, the improvement is quite limited on imbalanced datasets. Additionally, during training on the imbalanced dataset, the model’s performance exhibits significantly increased fluctuations. This could be due to sample instability or the excessive number of inputs to the model. To address these issues, it is necessary to explore alternative methods for feature fusion or training that amplify the contributions of modal-specific attribute features while minimizing the introduction of noise.

5. Conclusions

Based on the classic 5Cs model of credit assessment, we construct the 3Cs user profiling principles specifically for OSN platforms and successfully associate them with user behavior patterns in this paper. This theoretical innovation expands user profiling from text-based and statistical features to three more specific dimensions: population attributes, tweet attributes, and social attributes. Addressing the limitations of traditional user profiles in handling the data sparsity and behavioral concealment issues of online social network platforms, a high-dimensional attribute feature extraction method for user profiling based on classic stacking ensemble learning is proposed. We then compare user high-dimensional attribute features extracted using logistic regression, SVM, MLP, 1D-CNN, and decision trees. Mathematical analyses are performed, and accuracy, recall, and F1 scores are used as evaluation metrics to identify the most suitable stacking base classifiers for various attribute features. Finally, the performance of user profiles integrating high-dimensional features is experimentally validated on both balanced and imbalanced datasets. The results demonstrate that compared to user profiling methods using only basic attributes, the proposed method incorporating high-dimensional attributes extracted via stacking learning achieves a 9.26% improvement in malicious user prediction accuracy on the balanced dataset. On the imbalanced dataset, the method also achieves a 1.5% improvement in accuracy.
Despite these advancements, challenges remain in handling imbalanced datasets, particularly regarding training stability. Increased fluctuations observed during training suggest that excessive input features may introduce noise. We believe that noise in model training can be reduced by introducing multimodal feature fusion methods. By adding a feature fusion layer to the meta-learner of the proposed stacking model, the various input features can be better unified, maximizing the contribution of meaningful features while minimizing noise. On the other hand, when faced with extremely small sample training, the model is likely to experience overfitting. Therefore, future research could consider using cross-validation or batch training methods to prevent overfitting. Additionally, exploring alternative training methods tailored to imbalanced data scenarios could further enhance the robustness and applicability of the proposed user analysis framework in real-world environments.

Author Contributions

Methodology, Z.W.; project administration, K.H.; software, Z.W.; supervision, L.L. and K.H.; validation, Z.W.; writing—original draft, Z.Z.; writing—review and editing, K.H. and Z.Z. All authors will be updated at each stage of manuscript processing, including submission, revision, and revision reminder, via emails from our system or the assigned assistant editor. All authors have read and agreed to the published version of the manuscript.

Funding

This research was funded by the National Key Research and Development Program of China, grant number No. 2022QY1403.

Institutional Review Board Statement

Not applicable.

Informed Consent Statement

Not applicable.

Data Availability Statement

The data presented in this study are available on request from the corresponding author. The data are not publicly available due to ongoing research and analysis.

Conflicts of Interest

The authors declare no conflicts of interest.

References

  1. Contri, M.; Fissi, S.; Gori, E. Citizen engagement and dialogic accounting through social media: A study of Italian regions. Accounting. Audit. Account. 2023, 37, 866–892. [Google Scholar] [CrossRef]
  2. Stone, J.A.; Flanders, K.J.; Robles, P.; Can, S.H. Strategic measurement and evaluation of municipal social media: Insight from front-line personnel in the United States. Transform. Gov. People Process Policy 2023, 18, 103–117. [Google Scholar] [CrossRef]
  3. Ordóñez, A.G.; Cañada, F.J.A.; Lasso, E.; Sánchez-Torres, J.A.; Escobar-Sierra, M. Analytical model to measure the effectiveness of content marketing on Twitter: The case of governorates in Colombia. J. Mark. Anal. 2023, 12, 962–978. [Google Scholar] [CrossRef]
  4. Bonsón, E.; Perea, D.; Bednárová, M. Twitter as a tool for citizen engagement: An empirical study of the andalusian municipalities. Gov. Inf. Q. 2019, 36, 480–489. [Google Scholar] [CrossRef]
  5. Lincy, N.L.; Midhunchakkaravarthy. The investigation of network security, including penetrating threats and potential security measures. In Advances in Intelligent Systems and Computing; Springer: Singapore, 2022; pp. 107–117. [Google Scholar]
  6. Shang, P. Artificial Intelligence and Criminal Investigation: Historical changes, technical classifications, and future prospects. J. People’s Public Secur. Univ. China (Soc. Sci. Ed.) 2020, 36, 46–54. (In Chinese) [Google Scholar]
  7. Roy, K.P.; Tripathy, K.A. Cybercrime in Social Media: Theory and Solutions; Chapman and Hall/CRC: New York, NY, USA, 2023; p. 276. [Google Scholar]
  8. Anjum; Katarya, R. Hate speech; toxicity detection in online social media: A recent survey of state of the art and opportunities. Int. J. Inf. Secur. 2023, 23, 577–608. [Google Scholar] [CrossRef]
  9. Yiouli, K.; Demestichas, P.; Adamopoulou, E.; Demestichas, K.P.; Theologou, M.; Paradia, M. User Profile Modeling in the context of web-based learning management systems. J. Netw. Comput. Appl. 2008, 31, 603–627. [Google Scholar]
  10. Bui, T.-H. Estimating bounding box for point of interest using social media geo-tagged photos. IEEE Access 2023, 11, 7387–7849. [Google Scholar] [CrossRef]
  11. Yang, X.; Gao, J.; Zheng, X.; Fang, M.; Tang, L.; Zhang, X. Point-of-interest detection from Weibo data for map updating. Trans. GIS 2022, 26, 2716–2738. [Google Scholar] [CrossRef]
  12. Chew, R.; Kery, C.; Baum, L.; Bukowski, T.; Kim, A.; Navarro, M. Predicting age groups of reddit users based on posting behavior and metadata: Classification model development and validation. JMIR Public Health Surveill 2021, 7, e25807. [Google Scholar] [CrossRef]
  13. Emad, E.A.; Jamil, R.A.; Muath, A. Age and gender prediction in open domain text. Procedia Comput. Sci. 2020, 170, 563–570. [Google Scholar]
  14. Tsao, S.; MacLean, A.; Chen, H.; Li, L.; Yang, Y.; Butt, Z.A. Public attitudes during the second lockdown: Sentiment and topic analyses using Tweets from Ontario, Canada. Int. J. Public Health 2022, 67, 82. [Google Scholar] [CrossRef] [PubMed]
  15. Alejandro, H.H.; Mónica, D.R.T.; Esteban, R.S.; Lorenzo, C.; Lencinas, M.V.; Pastur, G.M. Social media reveal visitors’ interest in flora and fauna species of a forest region. Ecosyst. People 2023, 19, 2155248. [Google Scholar]
  16. Alsaqer, M.; Alelyani, S.; Mohana, M.; Alreemy, K.; Alqahtani, A. Predicting location of Tweets using machine learning approaches. Appl. Sci. 2023, 13, 3025. [Google Scholar] [CrossRef]
  17. Roberto, S.; Ludovico, B.; Salvatore, C. Semantic coherence-based user profile modeling in the recommender systems context. In International Conference on Knowledge Discovery and Information Retrieval; SciTePress: Setúbal, Portugal, 2014; Volume 2, pp. 154–161. [Google Scholar]
  18. Roy, P.K.; Chahar, S. Fake profile detection on social networking websites: A comprehensive review. IEEE Trans. Artif. Intell. 2020, 13, 271–285. [Google Scholar] [CrossRef]
  19. Zhaoyang, W.; Li, L.; Ketai, H. Deep User Profile Construction and Behavior Prediction Based on Multimodal Heterogeneous Feature Fusion. In Proceedings of the 2024 IEEE 19th Conference on Industrial Electronics and Applications (ICIEA), Kristiansand, Norway, 5–8 August 2024; pp. 1–6. [Google Scholar]
  20. Samuel, J.; Ali, G.; Rahman, M.M.; Esawi, E.; Samuel, Y. COVID-19 public sentiment insights and machine learning for tweets classification. Information 2020, 11, 314. [Google Scholar] [CrossRef]
  21. Garcia, K.; Berton, L. Topic detection and sentiment analysis in Twitter content related to COVID-19 from Brazil and the USA. Appllied Soft Comput. 2021, 101, 107057. [Google Scholar] [CrossRef]
  22. Boon-Itt, S.; Skunkan, Y. Public perception of the COVID-19 pandemic on Twitter: Sentiment analysis and topic modeling study. JMIR Public Health Surveill 2021, 6, e21978. [Google Scholar] [CrossRef]
  23. Naseem, U.; Razzak, I.; Khushi, M.; Eklund, P.W.; Kim, J. COVIDSenti: A large-scale benchmark Twitter data set for COVID-19 sentiment analysis. IEEE Trans. Comput. Soc. Syst. 2021, 8, 1003–1015. [Google Scholar] [CrossRef]
  24. Tao, W.; Peng, Y. Differentiation and unity: A cross-platform comparison analysis of online posts’ semantics of the Russian–Ukrainian war based on Weibo and Twitter. Commun. Public 2023, 8, 105–124. [Google Scholar] [CrossRef]
  25. Ma, M.; Gao, Q.; Xiao, Z.; Hou, X.; Hu, B.; Jia, L.; Song, W. Analysis of public emotion on flood disasters in southern China in 2020 based on social media data. Nat. Hazards 2023, 118, 1013–1033. [Google Scholar] [CrossRef]
  26. Zhang, Y.; Ji, T. Youth are united online to fight against involution: A study of group cohesion on Weibo. Front. Psychol. 2023, 18, 1014331. [Google Scholar] [CrossRef] [PubMed]
  27. Li, Q.; Zuo, Z.; Zhang, Y.; Wang, X. Exploring sentiment divergence on migrant workers through the lens of Sina Weibo. Internet Res. 2023, 33, 1331–1371. [Google Scholar] [CrossRef]
  28. Kanaparthi, S.D.; Patle, A.; Naik, K.J. Prediction and detection of emotional tone in online social media mental disorder groups using regression and recurrent neural networks. Multimed. Tools Appl. 2023, 82, 43819–43839. [Google Scholar] [CrossRef]
  29. Ni, W.; Du, Y.; Ma, X.; Lv, H. Research on Hybrid Recommendation Model for Personalized Recommendation Scenarios. Appl. Sci. 2023, 13, 7903. [Google Scholar] [CrossRef]
  30. Mubarak, H.; Abdaljalil, S.; Nassar, A.; Alam, F. Detecting and identifying the reasons for deleted tweets before they are posted. Front. Artif. Intell. 2023, 6, 1219767. [Google Scholar] [CrossRef]
  31. Tufchi, S.; Yadav, A.; Ahmed, T. A comprehensive survey of multimodal fake news detection techniques: Advances, challenges, and opportunities. Int. J. Multimed. Inf. Retr. 2023, 12, 28. [Google Scholar] [CrossRef]
  32. Su, X.; Xiao, L.; Li, W.; Liu, X.; Li, K.-C.; Liang, W. DroidPortrait: Android Malware Portrait Construction Based on Multidimensional Behavior Analysis. Appl. Sci. 2020, 10, 3978. [Google Scholar] [CrossRef]
  33. Alarfaj, F.K.; Ahmad, H.; Khan, H.U.; Alomair, A.M.; Almusallam, N.; Ahmed, M. Twitter bot detection using diverse content features and applying machine learning algorithms. Sustainability 2023, 15, 6662. [Google Scholar] [CrossRef]
  34. Xuejian, H.; Gen-sheng, W.; Luo, Y.; Min, L.; Wu, X.-F.; Li, Z.-P. Weibo Rumors Real-time Detection Model Based on Fusion of Multi User Features and Content Features. J. Chin. Comput. Syst. 2021, 43, 1–12. (In Chinese) [Google Scholar]
  35. Ghosh, S.; Reilly, D.L. Credit card fraud detection with a neural-network. In Proceedings of the 27th Hawaii International Conference on System Sciences, Wailea, HI, USA, 4–7 January 1994; pp. 621–630. [Google Scholar]
  36. Rongrong, C.; Guohua, Z.; Zhihua, L. Research on credit card transaction fraud prediction based on XGBoost algorithm model. Appl. Res. Comput. 2020, 37, 111–112, 115. (In Chinese) [Google Scholar]
  37. Donat, B.S.; Onat, K.O. The roles of value preferences and cognitive emotion regulation strategies on prediction of dating violence. Int. J. Psychol. Educ. Stud. 2020, 7, 96–107. [Google Scholar] [CrossRef]
  38. Dinesh, M.; Azath, M.; Bayapa, R.N.; Ramakrishnan, J.; John, R.; Ravishankar, N.; Karthika, P. Deep convolutional neural network based real-time abnormal behavior detection in social networks. Comput. Electr. Eng. 2023, 111, 108987. [Google Scholar]
  39. Xu, Y.; Zhang, P.; Yu, H.; Zhang, F. Detecting group shilling attacks in recommender systems based on user multi-dimensional features and collusive behaviour analysis. Comput. J. 2023, 67, 604–616. [Google Scholar] [CrossRef]
  40. Rosenberg, E.; Gleit, A. Quantitative methods in credit management: A survey. Oper. Res. 1994, 42, 589613. [Google Scholar] [CrossRef]
  41. Costa, H.; Merschmann, L.H.; Barth, F.; Benevenuto, F. Pollution, bad-mouthing, and local marketing: The underground of location-based social networks. Inf. Sci. 2014, 279, 123–137. [Google Scholar] [CrossRef]
Figure 1. Workflow of improved stacking ensemble learning.
Applsci 15 01224 g001
Figure 2. High-dimensional feature extraction based on stacking ensemble learning.
Applsci 15 01224 g002
Figure 3. User profile prediction network.
Applsci 15 01224 g003
Figure 4. Results of user profile on the balanced dataset after adding different high-dimensional features.
Applsci 15 01224 g004
Figure 5. Results of the user profile on the imbalanced dataset after adding different high-dimensional features.
Applsci 15 01224 g005
Table 1. The 3Cs principles and their associated behavioral patterns and representative features.
3Cs Principles Summarized Based on Traditional MethodsLatent Behavior PatternRepresentative Features
CapacityEconomic stabilityAge
Job
Activity
Well educatedEducation
ConditionsBe noticed
Healthy living habitsActive time
IP
CharacterCreative Posting habitsEmotional polarity distribution
Emoji usage frequency
Sex
Length of original text
Prudent and responsiblePost similar content repeatedly
URL chain
Table 2. Division of malicious user profile features on OSNs.
AttributesFeatures
Population Attributesname length, name letter count, name number count, name emoji count, age, sex, educate, IP, name_vec
Tweet Attributesday, hour, origin, topic, topic_vec, url_count, emoji_count, emo, tweet_vec
Social Attributesfollowers, followings, friend_fraction, forward, comment, like, reference, social_connect, exposure
Table 3. High-dimensional attributes of user profiles.
Feature NameDescription
Population_highHigh-dimensional feature obtained by using various classifiers from population attributes
Tweet_highHigh-dimensional feature obtained by using various classifiers from tweet attributes
Social_highHigh-dimensional feature obtained by using various classifiers from social attributes
User_highHigh-dimensional feature obtained by using various classifiers from all attributes
Table 4. Sample distribution of the Apontador dataset.
LabelClassificationCountPercent
SpamLocal marketer106315.1%
Polluter171624.2%
Bad-mouther75910.7%
Non-spamNon-spammer353850%
Total 7076100%
Table 5. Test results of the high-dimensional features extracted from population attributes.
No.Base Learner χ 2 Chi-Squared χ 2  p-ValuePearsonSpearman
1Logistic2008.4205.33 × 10−15.33 × 10⁻¹
2SVM182.891.13 × 10−411.61 × 10−11.61 × 10−1
3MLP2823.0507.01 × 10−17.01 × 10⁻¹
41D-CNN3471.0201.50 × 10−11.50 × 10⁻¹
5Decision tree5512.8608.83 × 10−18.83 × 10⁻¹
Table 6. Prediction results of spam and non-spam information when the high-dimensional features of population attributes are input.
Non-SpamSpam
No.PrecisionRecallF1-ScorePrecisionRecallF1-Score
187.1%75.8%81.0%78.1%88.1%82.8%
287.9%75.6%81.3%78.1%89.2%83.3%
385.6%74.9%79.9%76.3%86.7%81.2%
479.6%76.2%77.9%75.5%80.1%77.7%
579.8%77.8%78.8%77.4%79.8%78.6%
Table 7. Test results of the high-dimensional features extracted from tweet attributes.
No.Base Learner χ 2 Chi-Squared χ 2  p-ValuePearsonSpearman
1Logistic2112.5305.47 × 10−15.47 × 10⁻¹
2SVM1010.211.07 × 10−2213.78 × 10−13.78 × 10⁻¹
3MLP3588.5507.12 × 10−17.12 × 10⁻¹
41D-CNN2959.6606.47 × 10−16.47 × 10⁻¹
5Decision tree5723.9808.99 × 10−18.99 × 10⁻¹
Table 8. Prediction results of spam and non-spam information when high-dimensional features of tweet attributes are input.
Non-SpamSpam
No.PrecisionRecallF1-ScorePrecisionRecallF1-Score
182.1%79.2%80.6%79.4%82.1%80.7%
282.3%82.1%82.2%81.9%82.0%82.0%
382.4%79.8%81.1%79.8%82.3%81.1%
475.8%74.9%75.3%74.2%75.1%74.6%
578.3%75.8%77.0%75.8%78.6%77.2%
Table 9. Test results of the high-dimensional features extracted from social attributes.
No.Base Learner χ 2 Chi-Squared χ 2  p-ValuePearsonSpearman
1Logistic259.811.88 × 10−581.92 × 10−11.92 × 10−1
2SVM394.259.81 × 10−882.37 × 10−12.37 × 10−1
3MLP479.532.70 × 10−1062.61 × 10−12.61 × 10⁻¹
41D-CNN572.351.72 × 10−1262.85 × 10−12.85 × 10⁻¹
5Decision tree686.053.23 × 10−1513.12 × 10−13.12 × 10⁻¹
Table 10. Prediction results of spam and non-spam information when high-dimensional features of social attributes are input.
Non-SpamSpam
No.PrecisionRecallF1-ScorePrecisionRecallF1-Score
157.3%94.5%71.3%81.2%27.8%41.4%
257.1%93.7%71.0%80.1%28.2%41.7%
356.5%92.1%70.0%77.8%28.2%41.4%
457.5%95.8%71.9%86.1%27.6%41.8%
557.6%94.2%71.5%81.7%29.1%42.9%
Table 11. Test results of the high-dimensional features extracted from user attributes.
No.Base Learner χ 2 Chi-Squared χ 2  p-ValuePearsonSpearman
1Logistic2825.8406.32 × 10−16.32 × 10⁻¹
2SVM833.343.03 × 10−1833.44 × 10−13.44 × 10⁻¹
3MLP5983.7109.20 × 10−19.20 × 10⁻¹
41D-CNN3355.860.286.89 × 10−16.89 × 10⁻¹
5Decision tree6260.9209.41 × 10−19.41 × 10⁻¹
Table 12. Prediction results of spam and non-spam information when high-dimensional features of user attributes are input.
Non-SpamSpam
No.PrecisionRecallF1-ScorePrecisionRecallF1-Score
192.1%86.6%89.3%86.6%92.8%89.6%
293.8%85.4%89.4%86.1%93.7%89.7%
390.8%85.8%88.2%85.6%91.8%88.6%
488.8%84.1%86.4%84.7%89.5%87.0%
585.2%85.5%85.3%85.1%85.1%85.1%
Table 13. Comparison of user profile prediction performance with different inputs on the imbalanced dataset.
InputAUCMCC
Original feature0.56650.1862
Add basic high-dimensional features0.60130.2476
Add all high-dimensional features0.60340.2514
Disclaimer/Publisher’s Note: The statements, opinions and data contained in all publications are solely those of the individual author(s) and contributor(s) and not of MDPI and/or the editor(s). MDPI and/or the editor(s) disclaim responsibility for any injury to people or property resulting from any ideas, methods, instructions or products referred to in the content.

