Article

Estimation of Fuel Cell Power Demand on Commercial Vehicles Based on Improved Multiple Grey Prediction Method Considering Dynamic Time Window

by
Yuan Wang
,
Yingjia Li
,
Jianshan Lu
* and
Hongbo Zhou
College of Mechanical Engineering, Zhejiang University of Technology, Hangzhou 310023, China
*
Author to whom correspondence should be addressed.
Appl. Sci. 2025, 15(3), 1213; https://doi.org/10.3390/app15031213
Submission received: 25 December 2024 / Revised: 20 January 2025 / Accepted: 20 January 2025 / Published: 24 January 2025

Abstract

:
A frequently large variation in load conditions is of great impact on the service life of fuel cells during the operation of fuel cell vehicles and further increases the maintenance cost of the system. This study proposed a method of power demand prediction of the proton exchange membrane fuel cell (PEMFC) on vehicles in the actual traffic environment. The hybrid power system topology of fuel cells and power battery on commercial vehicles is selected to build a fuel cell model, and the accuracy of the fuel cell model is verified. An improved multiple grey prediction method is then proposed to predict the power demand during the sampling period of the fuel cell while considering a dynamic time window in the prediction period. Comparisons were made between this proposed model and the other two prediction models as a single-step prediction and multi-step prediction. Data of CHTC-HT and field testing working conditions were used to evaluate these three prediction models in fuel cell power demand. Results showed that the multiple grey method showed a better prediction performance than the other models, indicated by the lowest error value of 16.944% under the CHTC-HT condition, the lowest error value of 2.169% under stable conditions with less variable load and 1.930% under dynamic conditions with frequent load changes in field testing. This study of the demand power prediction can be devoted to pre-tuning the fuel cell system to avoid performance degradation caused by unanticipated power fluctuation.

1. Introduction

A fuel cell is an electrochemical power generation device that converts chemical energy directly into electrical energy [1]. As the main application scenario of hydrogen energy, the emergence of fuel cell technology provides a powerful solution for energy consumption and environmental degradation [2]. The research and commercialization of hydrogen energy and fuel cells are developing rapidly in China, the United States, Japan, and Europe [3]. Proton exchange membrane (PEM) fuel cell vehicles have thus become a major interest in academia and the automotive industry [4]. Presently, the main factors restricting the commercialization of fuel cells include durability and cost [5]. The durability problem of fuel cells is mainly reflected in its components, especially the proton exchange membrane and catalyst, which are easy to age and degrade during long-term operation. This directly affects the service life and maintenance frequency of the battery, increasing the cost of use. Thus, it is necessary to enhance the durability of fuel cells through technological innovation to promote the commercialization of fuel cells.
The degradation of fuel cell performance is a complex problem with multiple coupling, and the harsh working conditions will lead to changes in its electrochemical active area and catalyst structural layer, which will further cause the degradation of fuel cell performance [6]. Conditions that affect the durability of fuel cells mainly include variable load, idle speed, high load, start-stop and other conditions [7]. Among them, variable load conditions are the most serious conditions that affect the durability of fuel cells and account for the highest proportion of performance degradation factors [8]. Therefore, predicting the fuel cell demand power in the next period and then adjusting the fuel cell system in advance when the vehicle demand power changes rapidly can avoid the melting of the catalyst and the polymerization of the catalyst particles caused by an excessive power adjustment rate, thus decreasing the fuel cell performance attenuation.
Accurate parameter prediction plays an important role in the lifetime of the PEMFC. Prediction methods used in the study of PEMFC performance can be divided into three categories: model-driven, data-driven and hybrid methods [9]. Model-driven methods usually use empirical or semi-empirical degradation models, combined with methods such as the extended Kalman filter (EKF) or particle filter to describe the behaviour of the system [10,11]. These methods use a small amount of data, but no accurate model has been established because of an extremely complex system structure of the PEMFC with an indistinct degradation mechanism [12]. Data-driven approaches such as machine learning [13] and data packet processing [14] analyze the currently recorded data to explore the declining trend in PEMFC performance. Based on the short-term change trend of time series data, researchers [15] use the linear regression relationship to extract input and output variables and establish a regression prediction model based on a machine learning algorithm. The hybrid method combines the advantages of model-driven and data-driven methods and makes use of the theoretical basis provided by the model-driven method and the prediction ability of the data-driven method to improve the accuracy and reliability of prediction. This approach is achieved by combining physical models with data-driven models or by integrating different predictive models, but the approach is complex and requires more time and resources to build and debug the model.
Due to its strong ability to deal with complex and nonlinear problems, data-driven methods especially perform well in the face of high-dimensional data and large amounts of historical data. Compared to model-driven approaches, data-driven approaches do not rely on deep understanding and assumptions about the internal mechanisms of the system and are therefore more flexible and adaptable when dealing with unknown or complex systems. At the same time, compared with the hybrid method, the data-driven method is more concise, avoiding the complexity of model combination and high computation. It is more suitable for vehicle application scenarios with high dynamic conditions. Therefore, grey system theory is used for data-driven prediction with the advantages of no requirements of large amounts of data. As a new interdisciplinary research field, grey system theory has achieved remarkable developments [16]. The GM(1,1) model is an important model in grey system theory and is a specific form of grey prediction model. It is an Accumulated Generating Operation (AGO), which can build an approximate linear difference equation to predict data trends. The GM can provide an effective prediction with a small amount of data and can adapt to different operating conditions, so the model can be applied to the research of power prediction. An improved GM (1,1) model has been proposed, which uses cubic spline interpolation to optimize background values and has better prediction accuracy in power investment prediction [17]. Based on the improved failure mode recognition algorithm and GM (1,1) model, a fatigue life prediction method for hyperstatic truss structures was established in one previous study, which proved the effectiveness of the fatigue life prediction method [18]. Researchers also used GM (1,1) to establish a prediction model to predict the future PM2.5 content in Changchun and found that it can be used as an effective method to predict the fog and haze weather [19]. Additionally, the GM (1,1) model has been proven in others’ research to effectively predict the number of regional tourists [20] and predict the freight volume and freight turnover of Luoyang City to provide references for the decision making of logistic industry schemes [21].
A novel grey prediction model, which predicted four typical interval grey sequences, respectively, has effectively extended function transformation technology to the field of interval grey numbers for grey prediction [22]. Based on the Grey Verhulst model, an algorithm was proposed for predicting Internet topic trends with high accuracy [23]. Studies in vehicles found a new and effective method to analyze and predict the sound quality of vehicle internal noise by using grey system theory, and the method can be a useful tool for analyzing and predicting vehicle internal noise quality [24]. An enhanced grey predictive fuzzy controller (EGPFC) was also developed, which has better control performance in enhancing vehicle grip [25]. Especially in the field of fuel cell research, the grey model has been applied. Researchers propose a Grey–Markov chain power prediction energy management strategy for the fuel cell power generation system, which reduces hydrogen consumption in fuel cell power generation systems [26]. Additionally, a GM (1, N) power prediction strategy is proposed and compared with other strategies as a switch control strategy and logical threshold strategy and found that the power prediction strategy based on GM (1, N) is superior to the other two strategies in terms of output efficiency and fuel economy [27]. Thus, the grey system model has the advantages of providing an effective prediction with only a small amount of data and adapting to different operating conditions and environmental changes to be suitable for the study of power prediction.
Given the above, the real-time prediction method of fuel cell demand power is established based on the GM model in this study. With different sampling periods and prediction times, fuel cell power demand on commercial vehicles is estimated with three prediction strategies: single-step prediction, multi-step prediction and multiple prediction. Efficiency of these three strategies is compared under various working conditions, so as to achieve the high-precision prediction of power demand in dynamic changing environment.

2. Methodology

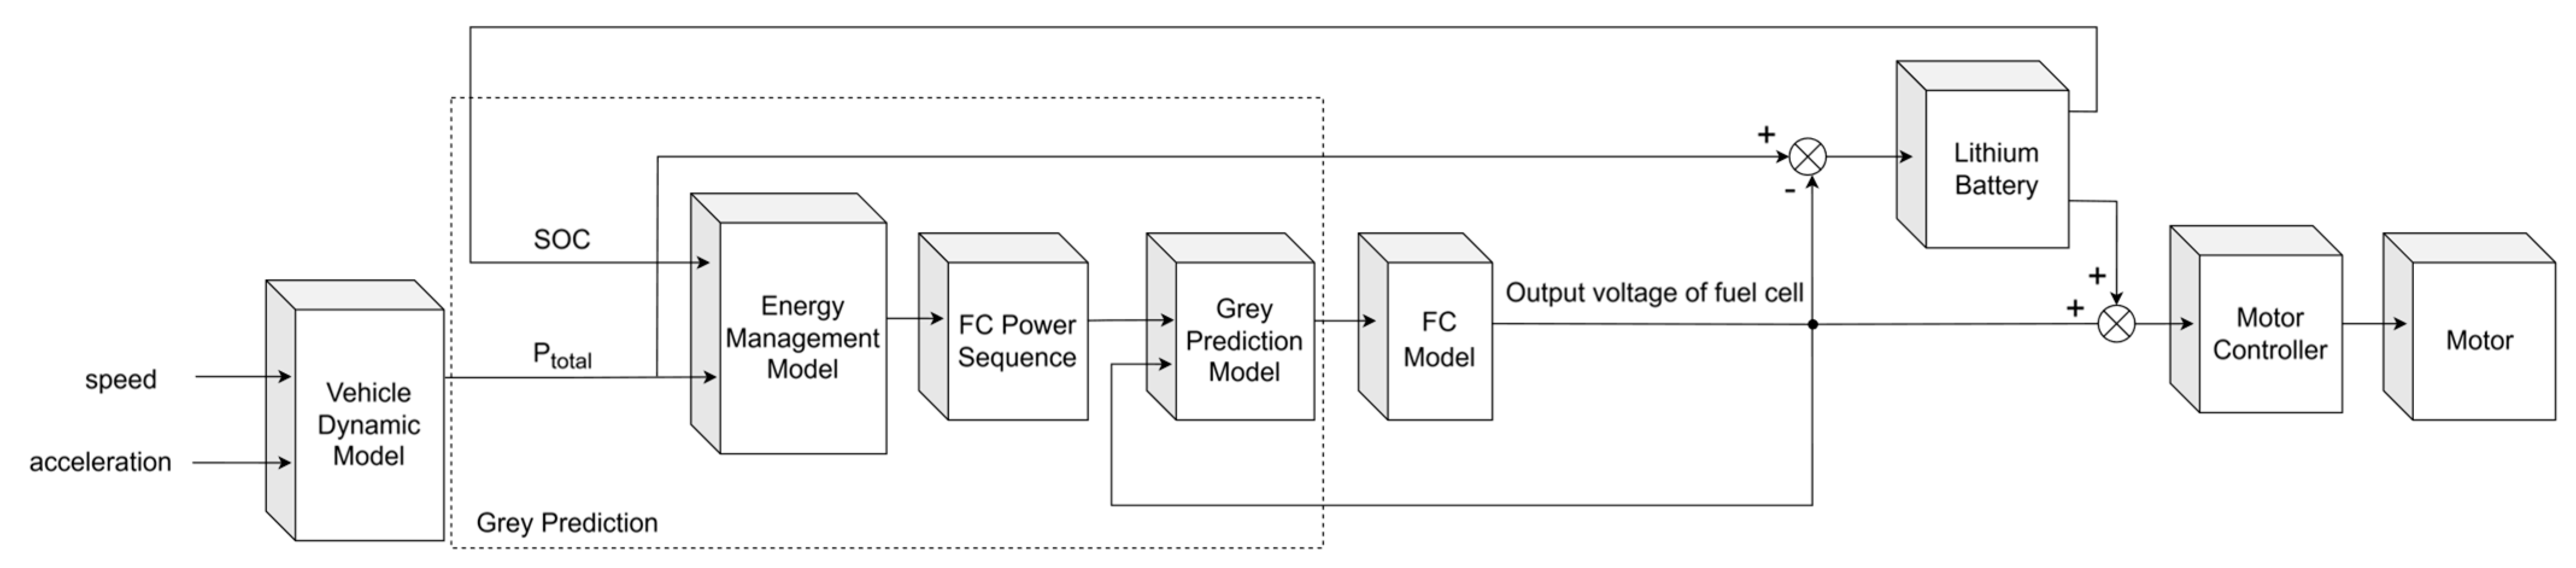
2.1. Fuel Cell Vehicle Power System Modelling

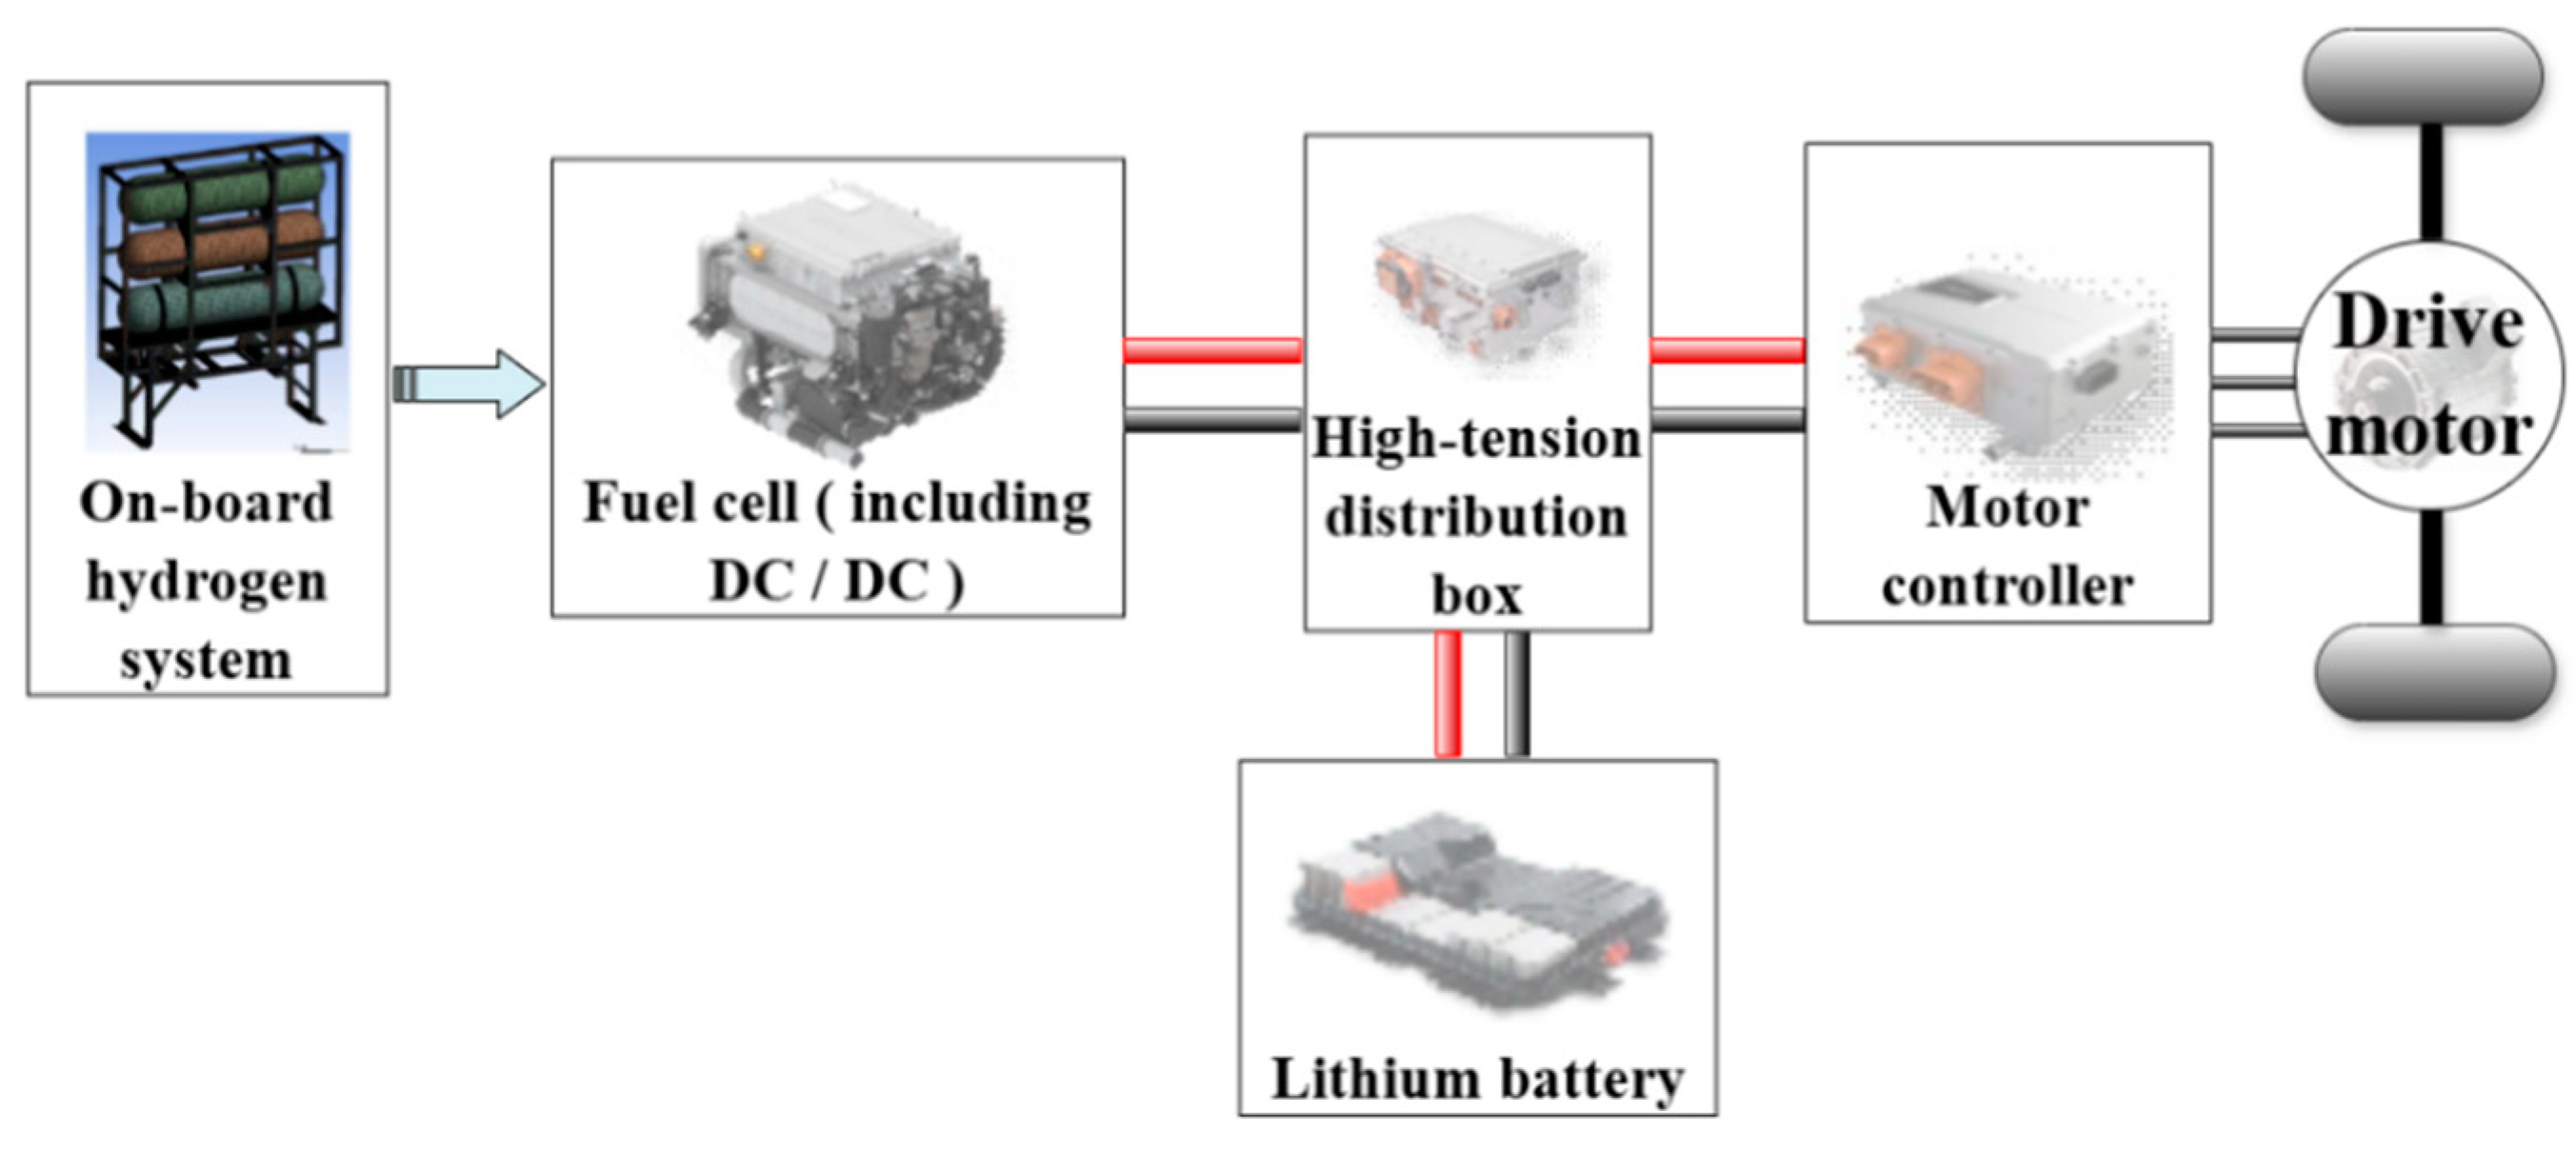
2.1.1. Fuel Cell Power System Topology

Fuel cell commercial vehicles were selected in this study with the lithium electronic battery as an auxiliary power source, forming an electric–electric hybrid power system with the fuel cell. This addition of power sources extends the working range of the power system and gives it more opportunities to work in the efficient area. As shown in Figure 1, the power of the vehicle is provided by the fuel cell and the power battery together, avoiding large fluctuations in the fuel cell load. The power battery can be used when additional power output is needed or when acceleration performance is temporarily improved. Additionally, the power battery can be used to recover the braking energy. By converting the braking energy into electric energy and storing it in the power battery, the energy utilization efficiency can be improved, and the life of the fuel cell can be extended. The main configuration information of the vehicle is shown in Table 1.

2.1.2. Fuel Cell Variable Load Cycle

To optimize fuel cell and power battery collaboration, three key factors were considered as follows:
(i) Fuel cell durability: The durability of a fuel cell is affected by the frequency and magnitude of load changes. Frequent and large load changes will accelerate the accumulation of mechanical and chemical stresses inside the fuel cell, affecting its life. The high variable load speed of the fuel cell will cause the membrane electrode assembly (MEA) to undergo greater mechanical stress and a greater chemical degradation rate, especially when the load changes frequently and greatly. By setting the appropriate variable load period T l o a d , the frequency and amplitude of load change can be controlled. The variable load rate v l o a d is calculated as follows:
v l o a d = Δ P T l o a d
where Δ P  is the variable load amplitude. Long T l o a d  can reduce the rate of reducing each variable load, thereby reducing the impact on the fuel cell membrane electrode assembly and improving its durability.
(ii) Output characteristics of fuel cells: The output characteristics of fuel cells are soft and slow in response. In order to ensure that the fuel cell can supply the current steadily and avoid output instability or reduced efficiency due to frequent or drastic load changes, it is necessary to give the fuel cell sufficient time to adjust the output. The variable load cycle of the fuel cell should be long enough to ensure that its output can gradually adapt to new requirements when the load changes, avoiding the impact on system stability.
(iii) Pulse discharge time of the power battery: The power battery provides peak power when the car encounters high power demand (such as acceleration or climbing), and the pulse discharge time it can provide is usually 30–60 s. As an auxiliary energy source, the power battery can provide high currents in a short period of time, thereby reducing the instantaneous load demand of the fuel cell and extending the variable load cycle of the fuel cell to a certain extent. Therefore, in fuel cell commercial vehicles, during the peak power provided by the power cell, the fuel cell can gradually adjust the output to avoid drastic load changes affecting the durability of the fuel cell. For example, within 30 s of a power battery discharging, a fuel cell can gradually increase its output power without having to immediately reach maximum output in a short period of time.
Based on the above three considerations, the variable load period of the fuel cell can be set to 15 s on the fuel cell commercial vehicle. In this cycle, only the variable load rate of the fuel cell is greater than 10 kW/s, that is, only a lower variable load rate can meet the power needs of the vehicle. This cycle length is combined with the 30–60 s pulse discharge time of the power battery to ensure that the fuel cell can change load in time during each cycle and effectively match the pulse discharge time of the power battery. Specifically, the 15 s variable load cycle is moderate, neither too frequent to cause fuel cell life attenuation, nor too slow to affect the vehicle power performance, to ensure the stable output of the fuel cell at the same time, to avoid damage caused by large variable load.

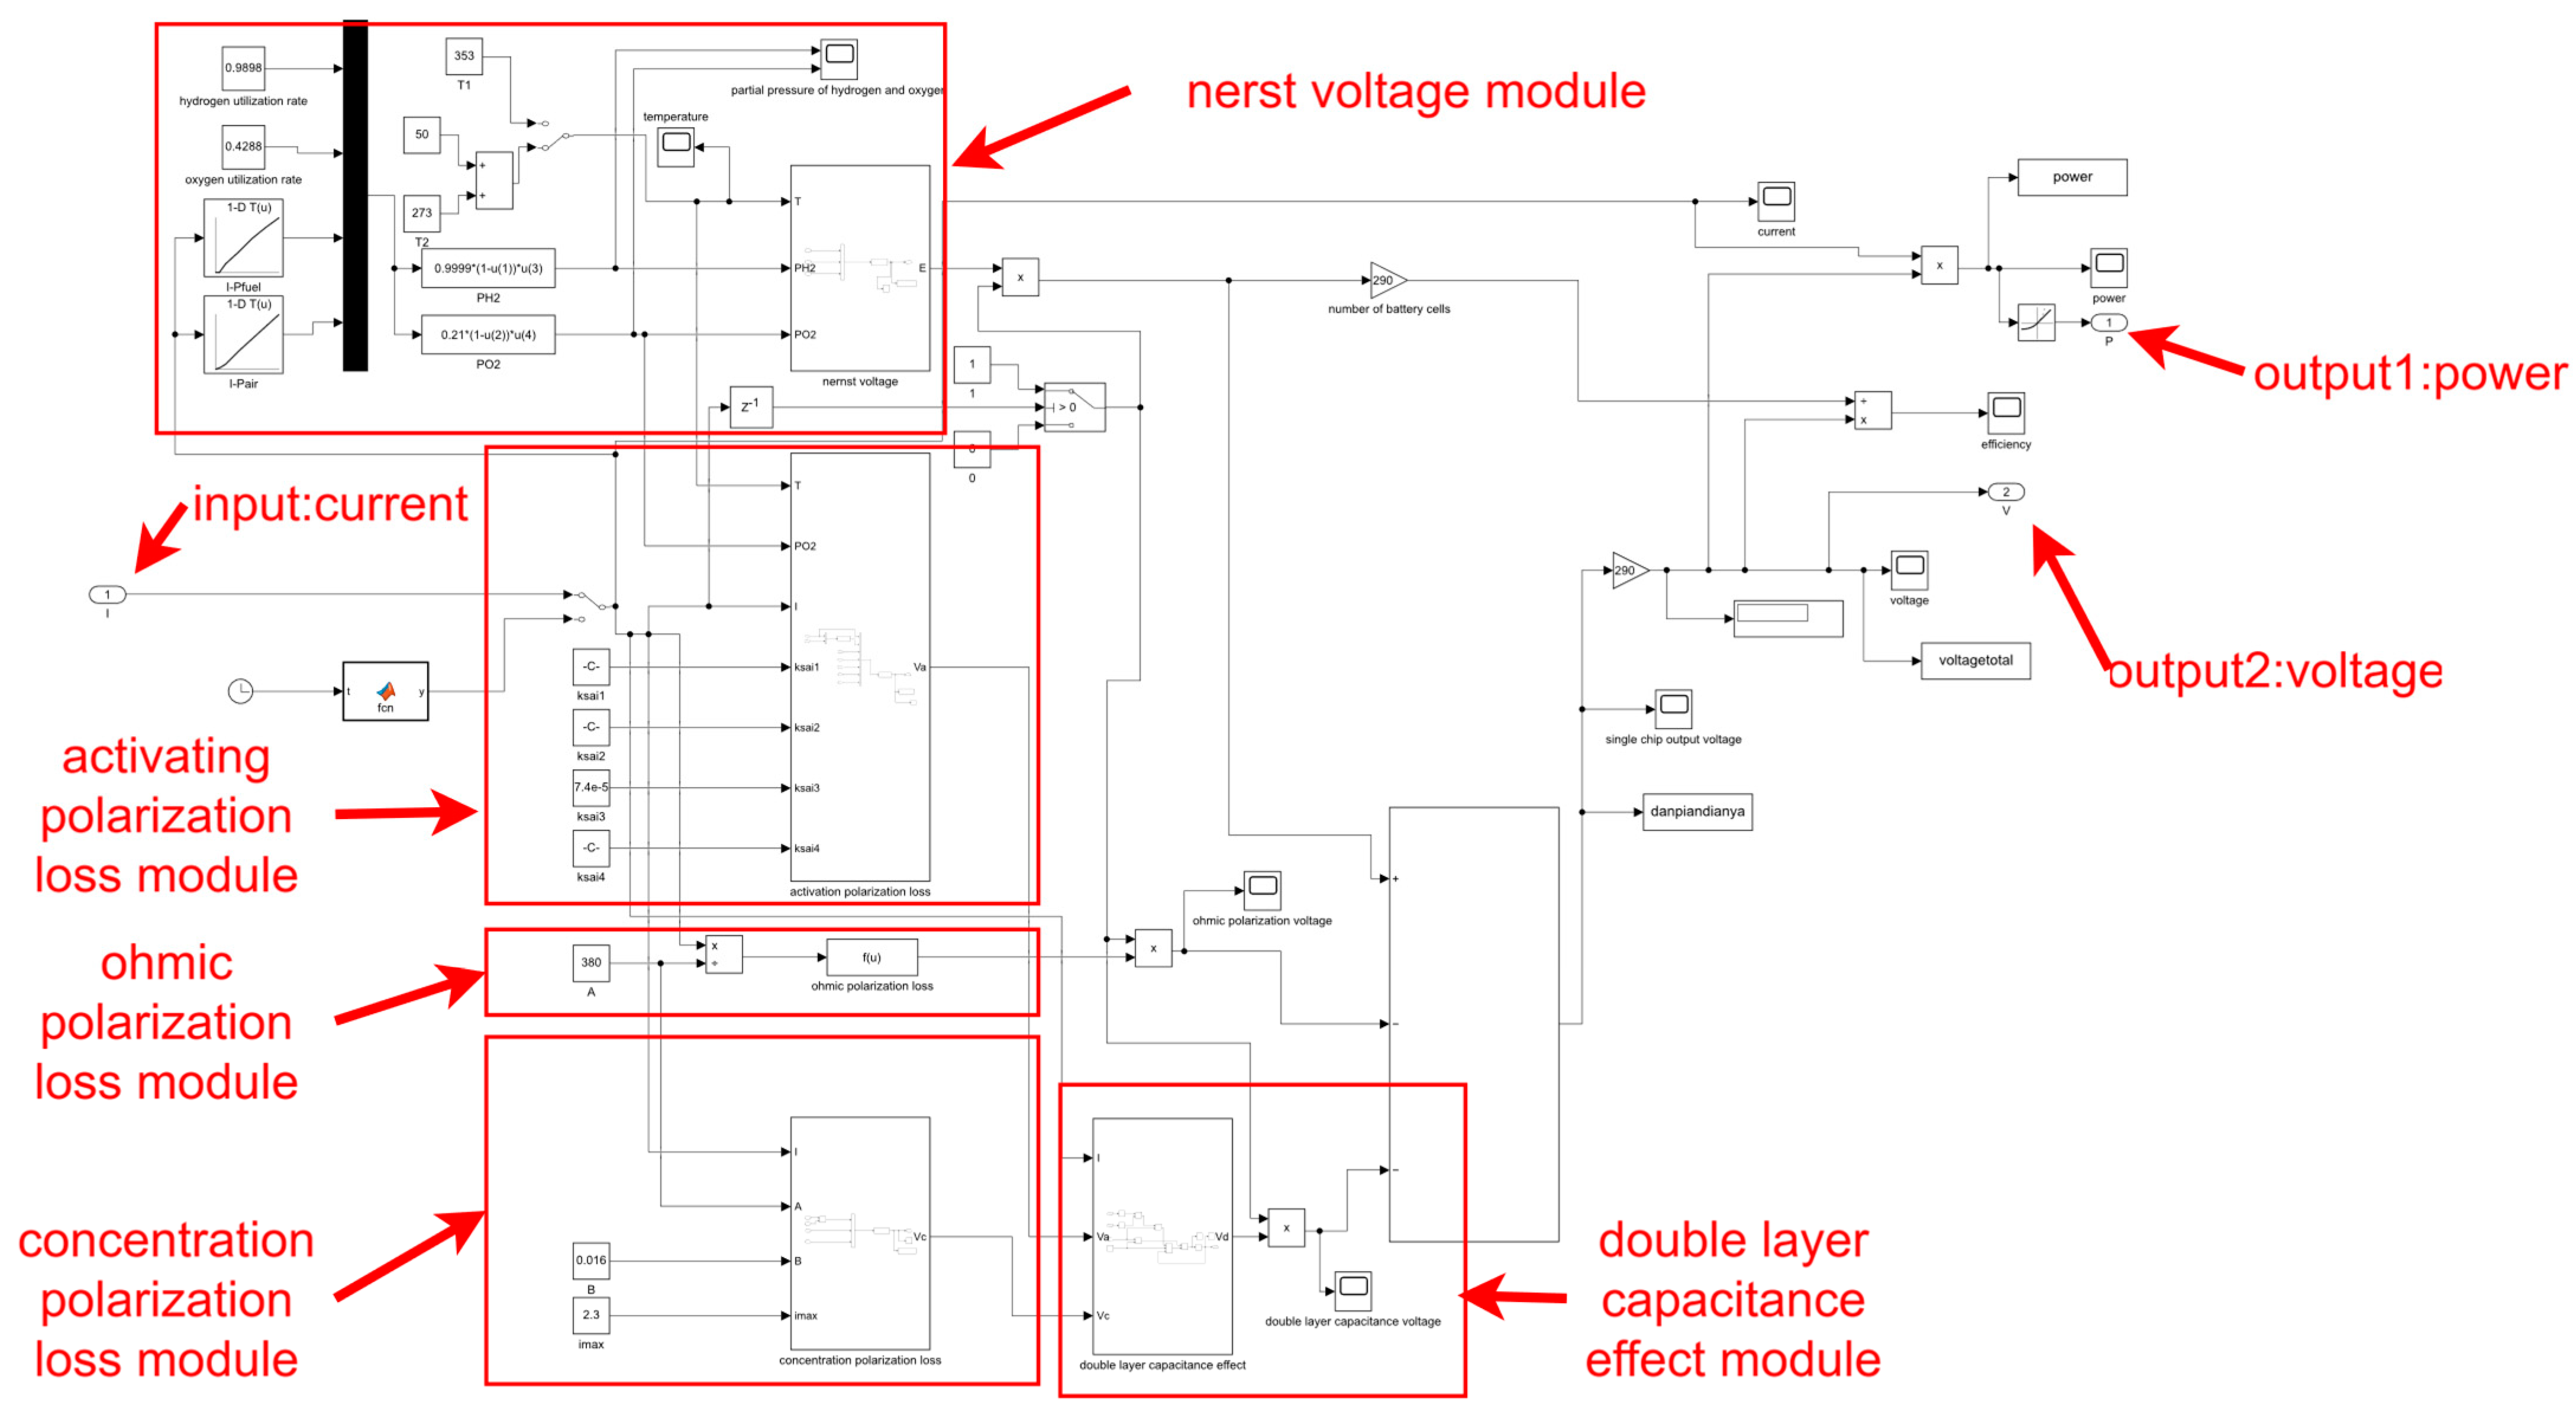
2.1.3. Equivalent Circuit Model

In this study, an equivalent circuit model was constructed to simulate the internal polarization characteristics of the fuel cell by using circuit elements, including activation polarization, ohmic polarization, concentration polarization and a double-layer charge effect, to output the actual voltage and power of the fuel cell (shown in Figure 2).
The fuel cell polarization curve is a key index to evaluate the output performance of the fuel cell. In this study, the reliability and accuracy of the model were verified by comparing the polarization curves obtained under simulation and experimental conditions, in which the experimental conditions were run and tested on the fuel cell test bench.
In this study, the accuracy of the model was assessed by calculating the Mean Absolute Percentage Error (MAPE), a commonly used method to measure the accuracy of a predictive model, especially in the fields of statistics and machine learning. The advantage of this approach is that it generates a dimensionless metric that allows fair comparisons between the data of different sizes or units. In addition, the average relative error provides a visual percentage of error that helps us better understand how far the model is biased in its predictions.

2.2. Grey Prediction Modelling

The GM(1,1) model can convert non-stable data series into stable data series by the Accumulated Generating Operation, which can reveal the inherent regularity and development trend of data. The modelling steps were described in one of our previous papers [27]. GM(1,N) represents a first-order grey model with one dependent variable and N 1 independent variables. It is assumed that there are N sets of sequences composed of non-negative variables x i ( i = 1,2 , N ) , and each set of sequences has m initial values:
x i ( 0 ) = x i ( 0 ) ( 1 ) , x i ( 0 ) ( 2 ) , x i ( 0 ) ( m )
A new first-order cumulative sequence x i ( 1 ) is calculated when each value of the initial sequence accumulates all the values as follows:
x i ( 1 ) = x i ( 1 ) ( 1 ) , x i ( 1 ) ( 2 ) , x i ( 1 ) ( m )
where
x i ( 1 ) ( t ) = j = 1 t x i ( 0 ) ( j ) t = 1 , 2 m
The grey differential equation of GM(1,N) is defined as follows:
d x 1 ( 1 ) ( k ) d t + a x 1 ( 1 ) ( k ) = i = 2 n b i x i ( 1 ) ( k )
where a is the system development parameter, and b i is the driving parameter, representing the influence degree and polarity of the independent variable on the dependent variable. The dependent variable increases as the independent variable increases and vice versa. The grey differential equation can be defined as follows:
x 1 ( 1 ) ( k ) + a z 1 ( 1 ) ( k ) = i = 2 n b i x i ( 1 ) ( k )
where z 1 ( 1 ) ( k ) is defined as
z 1 ( 1 ) ( k ) = x 1 ( 1 ) ( k ) + x 1 ( 1 ) ( k 1 ) 2
The grey parameters of the grey model P N represent the vector set of system development parameters and driving parameters, which can be calculated as follows:
P N = a , b 2 , b n T = B 1 Y n ( m = N + 1 )
P N = B T B 1 B T Y n ( M > N + 1 )
P N = B T B T B 1 Y n ( M > N + 1 )
where
B = z 1 ( 1 ) ( 2 ) x 2 ( 1 ) ( 2 ) x i ( 1 ) ( 2 ) z 1 ( 1 ) ( 3 ) x 2 ( 1 ) ( 3 ) x i ( 1 ) ( 3 ) z 1 ( 1 ) ( m ) x 2 ( 1 ) ( m ) x i ( 1 ) ( m )
Y n = x 1 ( 0 ) ( 2 ) x 1 ( 0 ) ( 3 ) x 1 ( 0 ) ( m )
Then, the solution of Equation (5) can be obtained:
x ^ 1 ( 1 ) ( k + 1 ) = x 1 ( 0 ) ( 1 ) i = 2 n 1 b i x i ( 1 ) ( k + 1 ) a e a t + i = 2 n 1 b i x i ( 1 ) ( k + 1 ) a
Finally, the predicted value of the initial sequence can be obtained:
x ^ 1 ( 0 ) ( k + 1 ) = x ^ 1 ( 1 ) ( k + 1 ) x ^ 1 ( 1 ) ( k )
In this study, the GM (1,1) model is applied to predict the power demand at the future time (that is, after 15 s). At the same time, in order to explore the influence of different prediction steps and prediction times on the prediction accuracy, three predicting strategies are proposed, which are single-step prediction, multi-step prediction and multiple prediction.

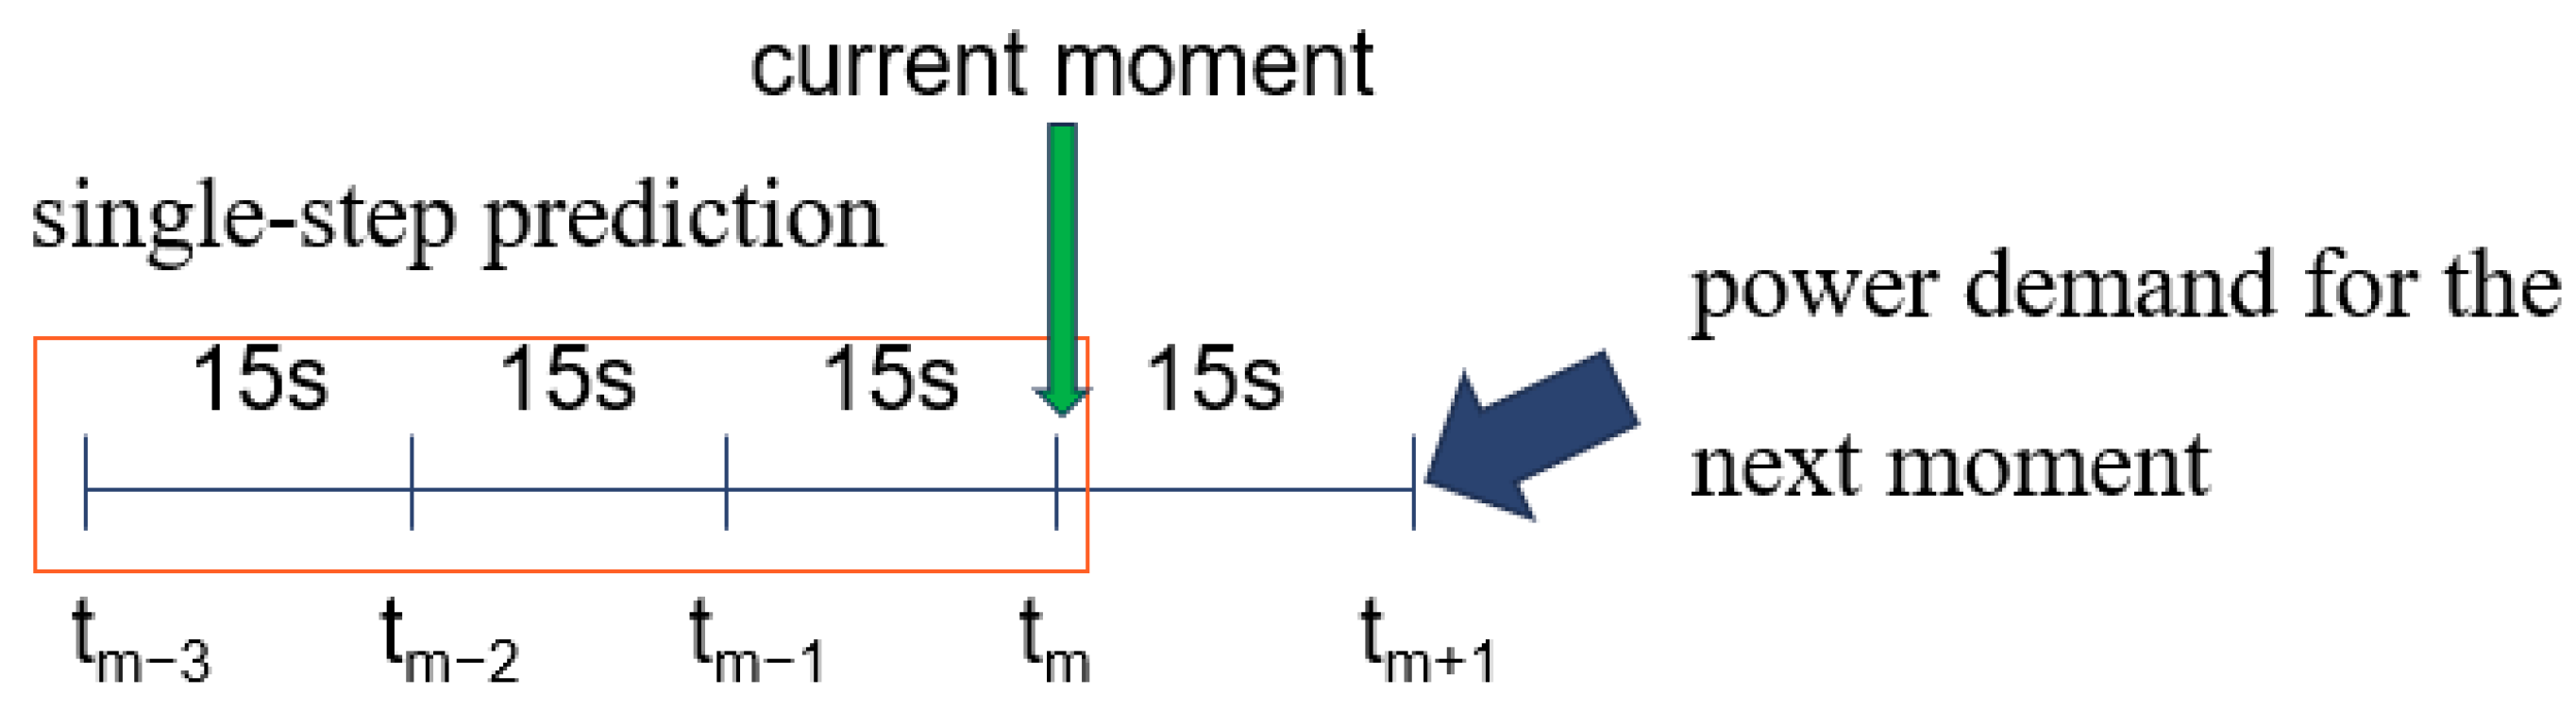
2.2.1. Single-Step Grey Prediction

The process of the single-step grey prediction strategy is shown in Figure 3. The sample period of the power was set as 15 s. The whole power series obtained by sampling cover data of the current moment tm and the three previous moments (tm−1, tm−2, tm−3). Based on a prediction step size of 1, which is called single-step prediction, the prediction of the power demand at a tm+1 moment can be obtained.

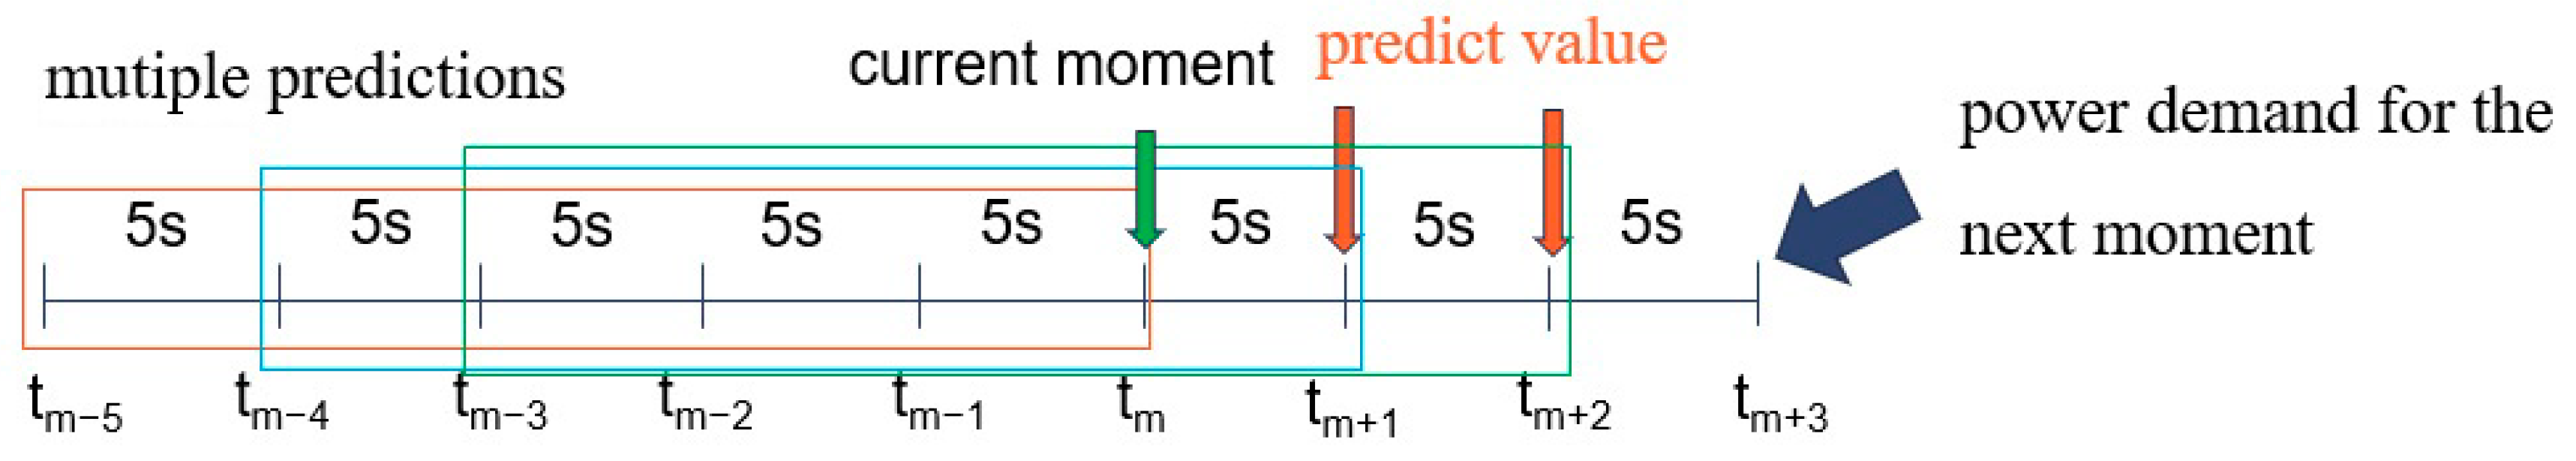
2.2.2. Multi-Step Grey Prediction

According to the multi-step grey prediction strategy shown in Figure 4, compared with the single-step prediction, the GM (1,1) model samples the power on a 5 s cycle, but the sequence of the input model also contains the power demand at four time points. Based on a prediction step size of 3 (i.e., multi-step prediction), the model predicts the power demand at time tm+3.

2.2.3. Multiple Grey Prediction

For the multiple prediction strategy shown in Figure 5, the sampling period is the same as that of multi-step prediction, which is set at 5 s. Compared with the first two predicting strategies, the remarkable feature of this strategy is that the input model sequence of this strategy covers the power demand data of 6 time points and expands the prediction number to 3 times; that is, the power demands of tm+1, tm+2 and tm+3 are predicted. Specifically, the prediction of tm+1 is calculated based on a series of power demands at six time points from tm−5 to tm. The power demand at 6 time points is selected for each step to ensure that the method is consistent with the above two strategies when predicting the power demand at tm+3 time and that there are definite data for 4 known moments.

3. Method Preprocessing

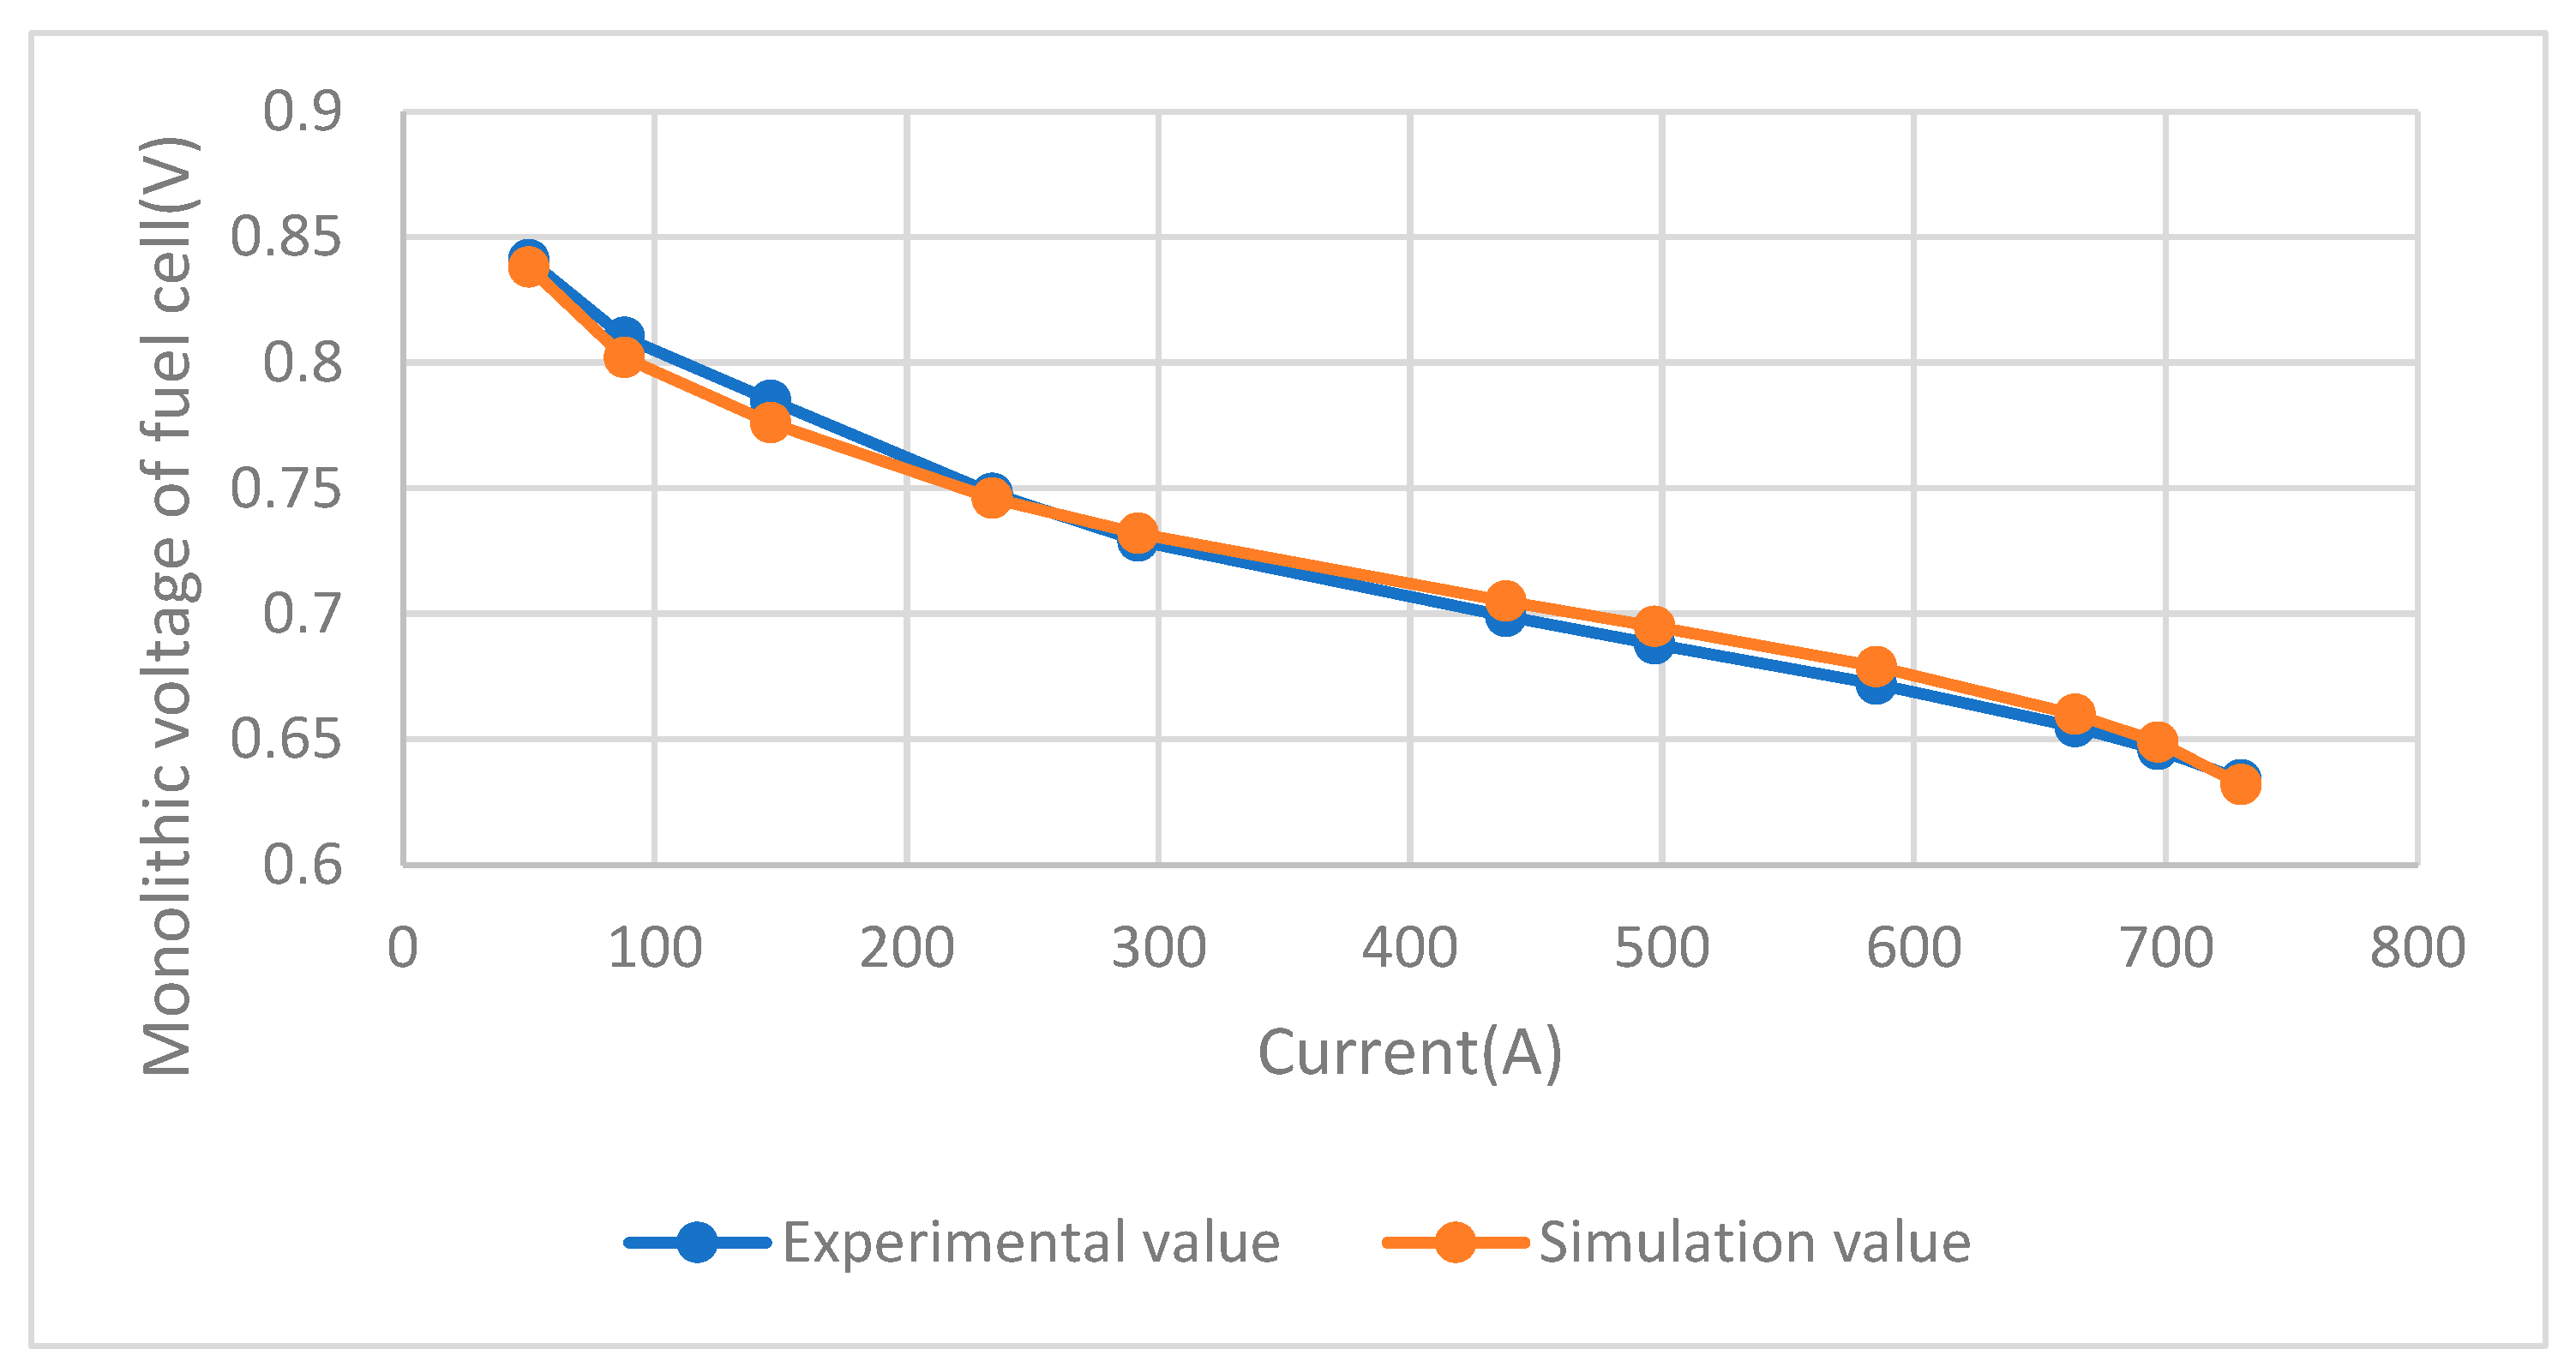
3.1. Fuel Cell Model Equivalent Circuit Model Evaluation

Figure 6 and Table 2 show the accuracy of the model evaluation in terms of fuel cell monolithic voltage and fuel cell stack power, respectively.
In the comparative analysis, the voltage and power performance of a single fuel cell under different current loads is investigated in detail. Figure 6 shows the downward trend of the monolithic voltage as the current increases over the range from 50 A to 730 A. The very low error range between the experimental and simulation data (the average error of 0.69%) indicates that the simulation model has a high accuracy in capturing the dynamic process of voltage changes with the current. Table 2 shows the stack output power performance of the fuel cell in the same current range. The simulation values showed a very low error (0.67%) in this section. In summary, these analysis results confirm the accuracy of the fuel cell model and can meet the needs of this study.

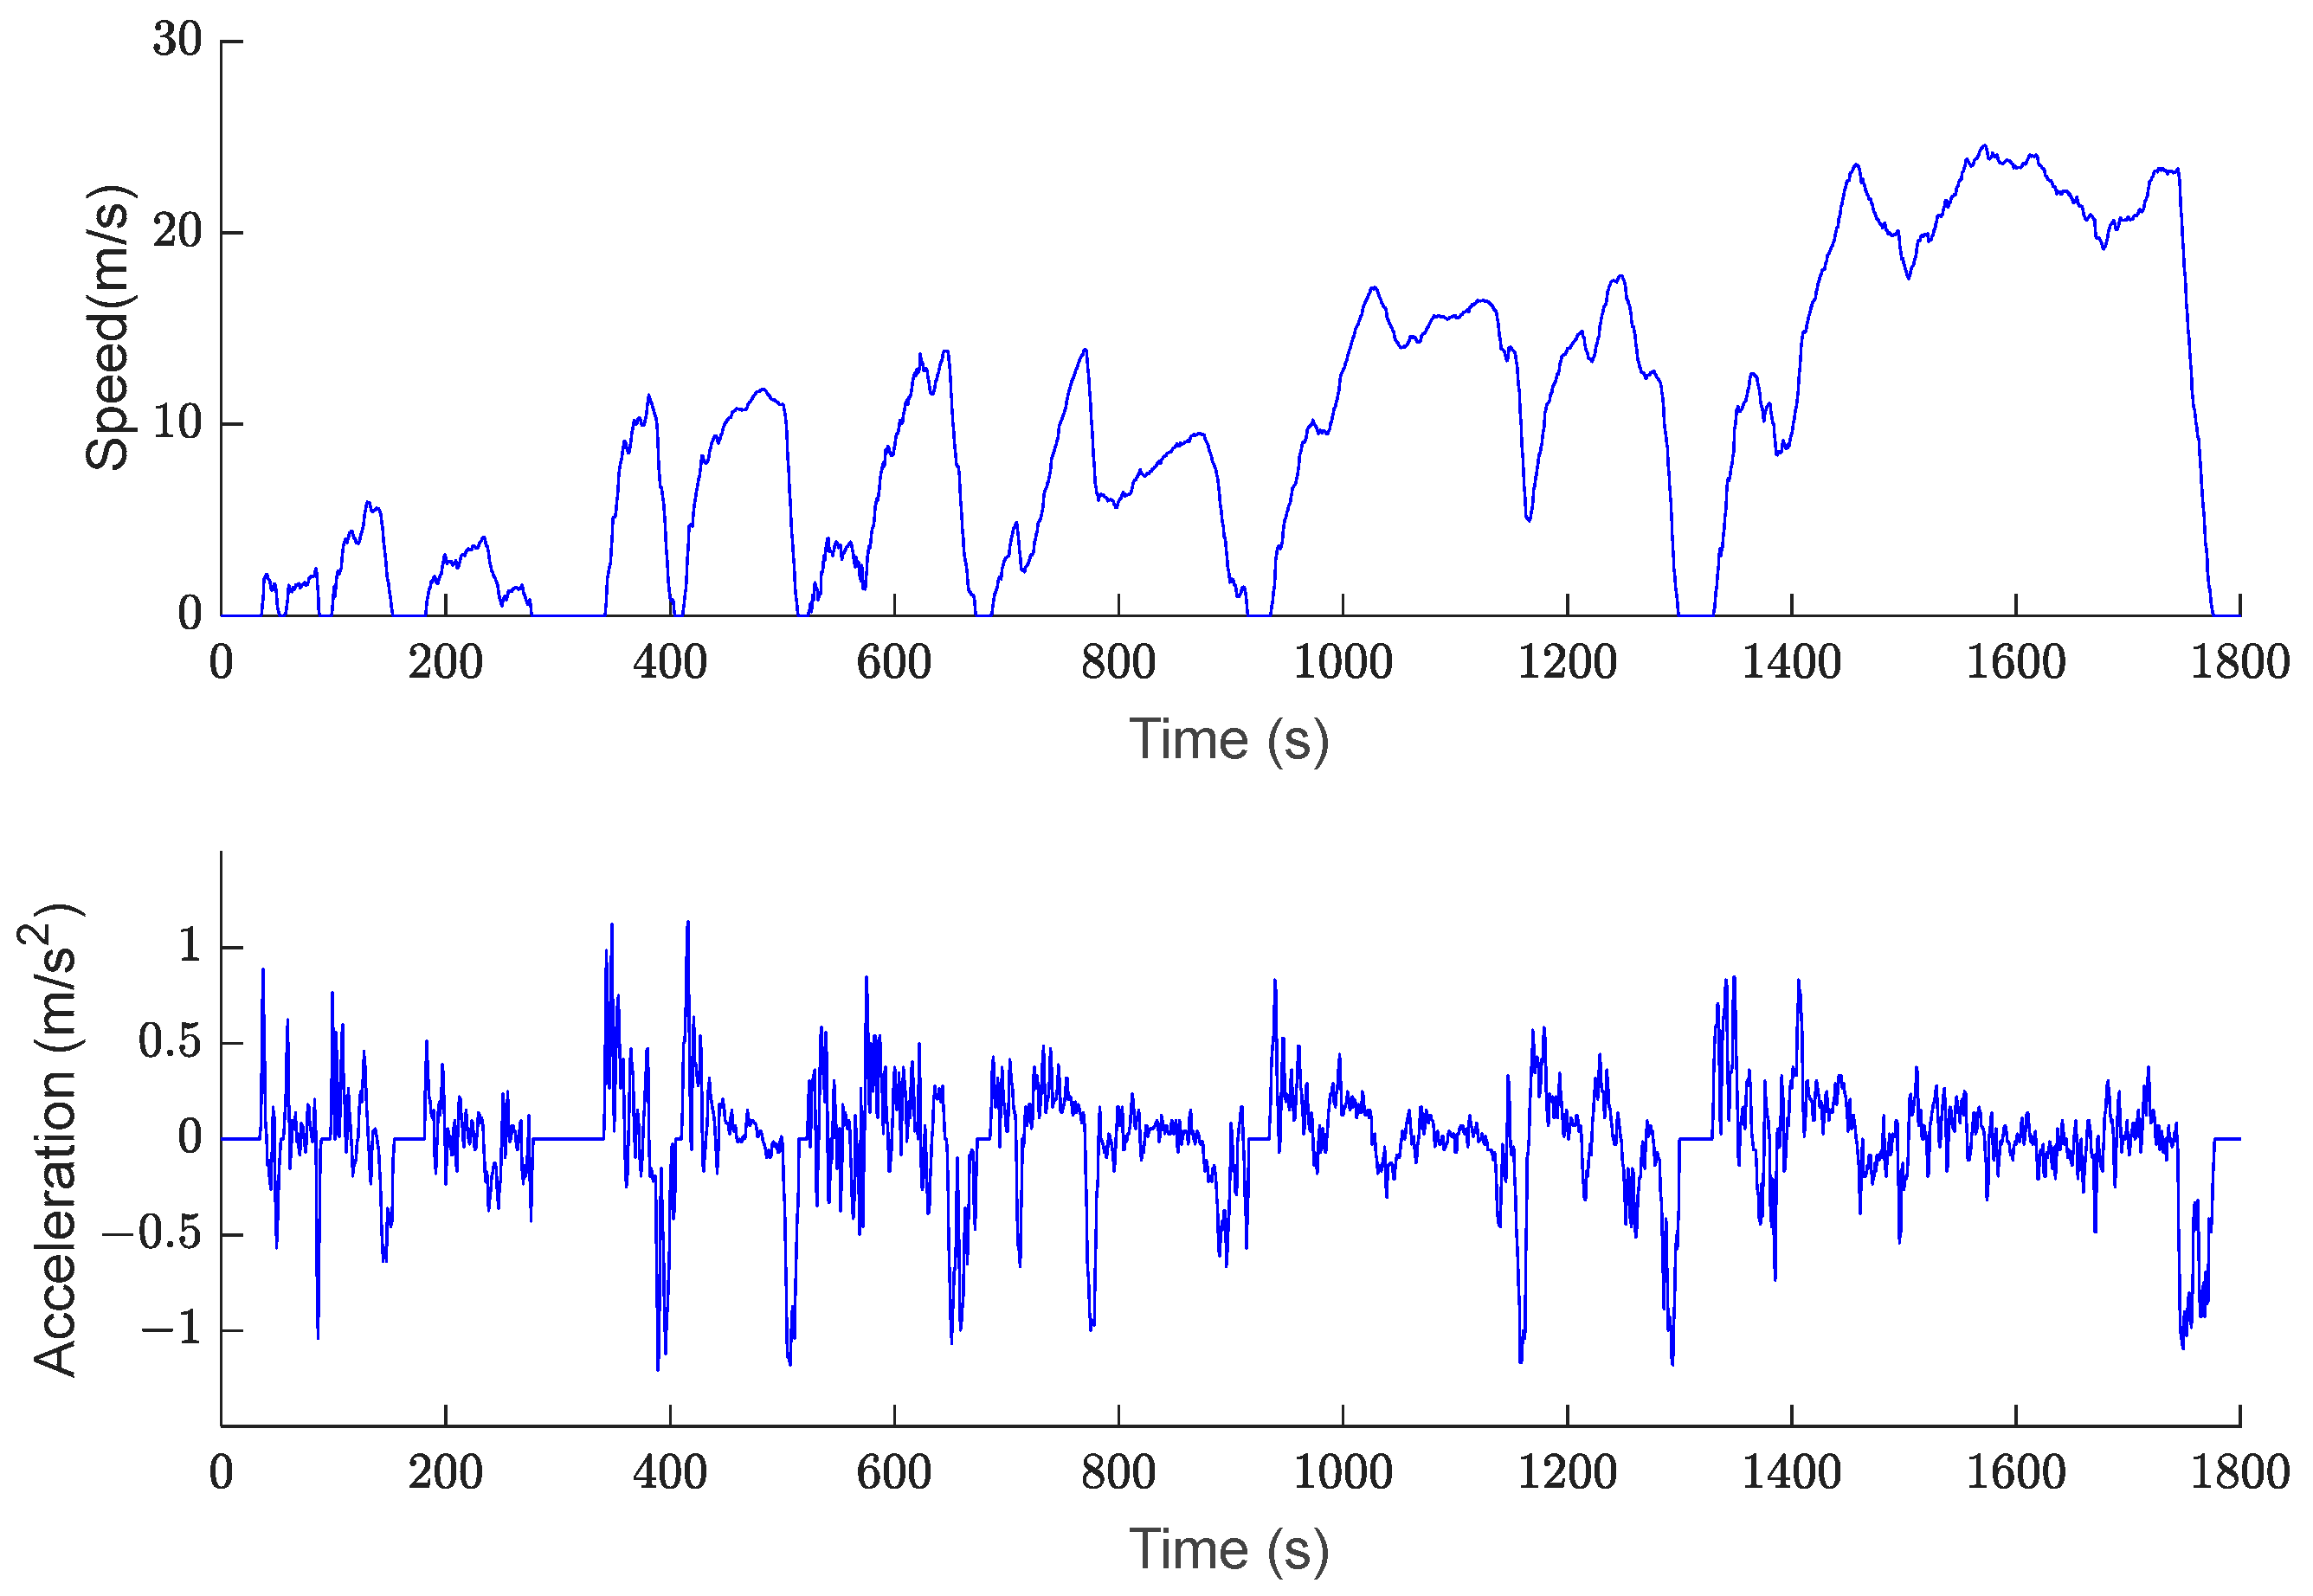
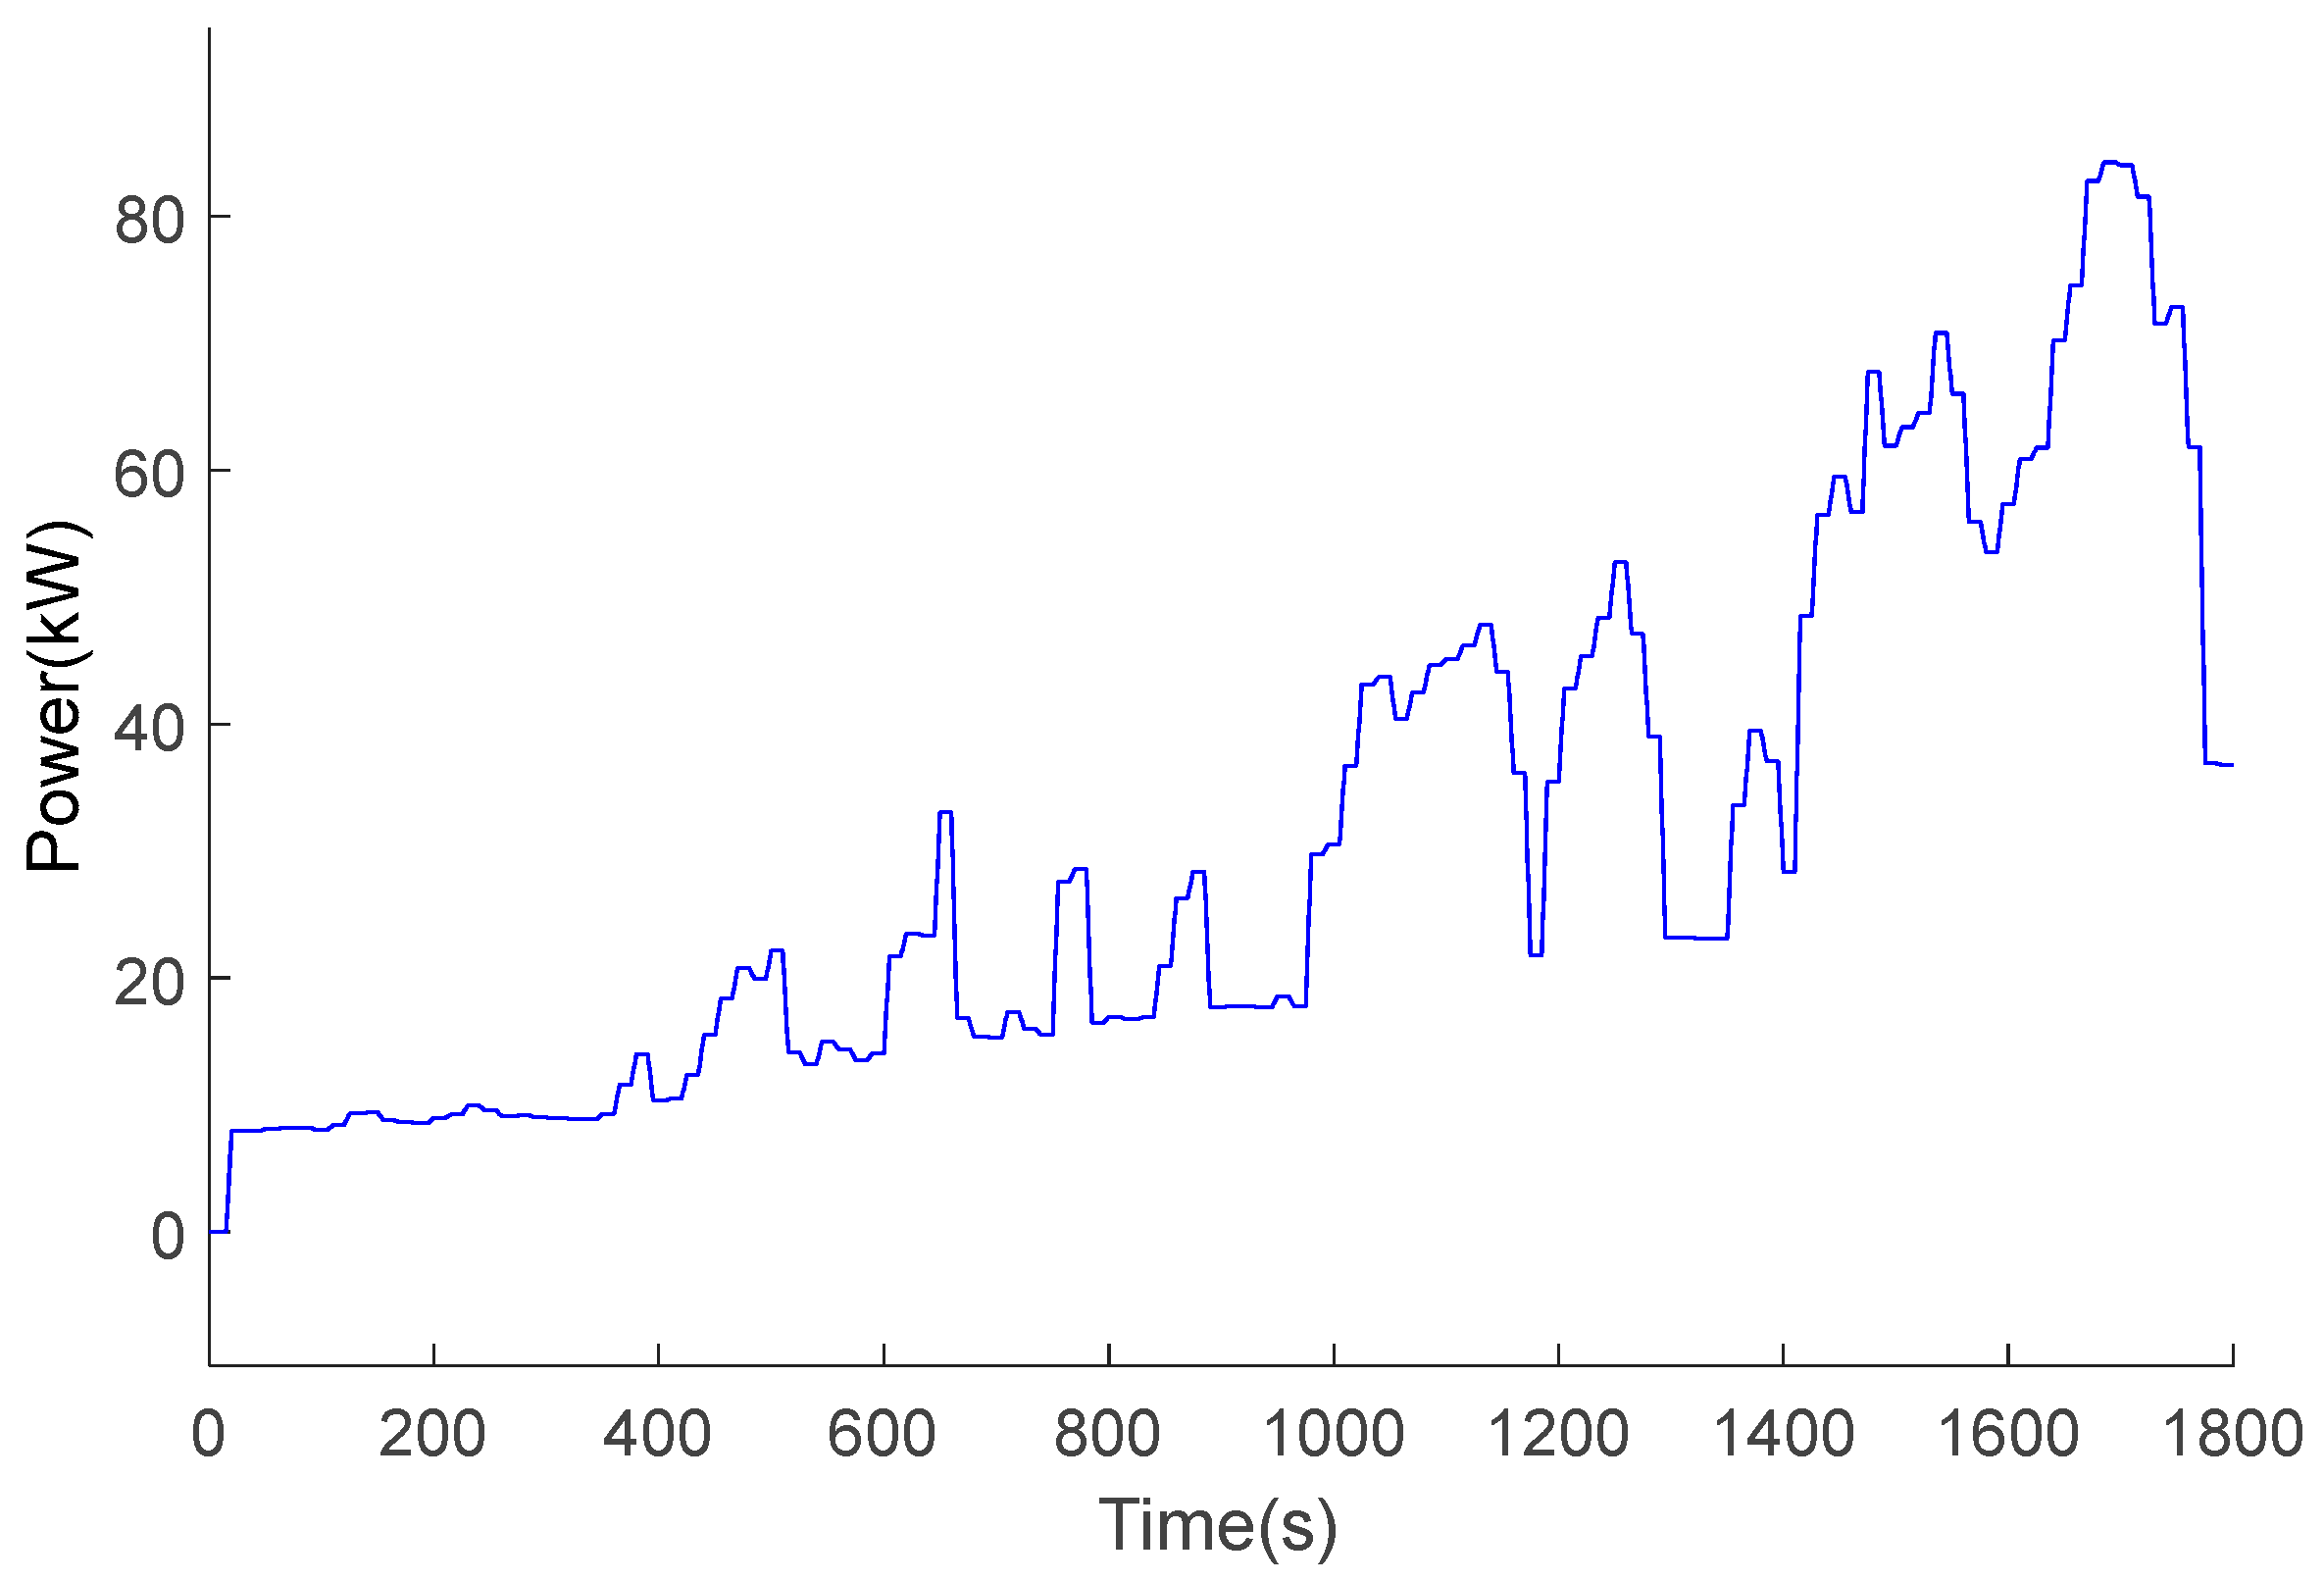
3.2. Model Input Condition

CHTC-HT is one of China’s commercial vehicle-driving-condition standards, which plays an important role in vehicle performance evaluations for commercial vehicle manufacturing and supervision [28]. The working condition input process is shown in Figure 7. In this study, the vehicle dynamic model was used to obtain the vehicle power demand by setting the second-by-second speed data under the CHTC-HT working condition as input. Then, the vehicle power demand was set as the input variable of the fuel cell model, and the fuel cell power demand can be calculated as the output of the model.
Figure 8 shows the velocity and acceleration curves under the CHTC-HT condition. This working condition can be divided into three stages in chronological order. The first stage lasted 342 s as a low-speed operation. The second stage lasted 988 s as a medium-speed operation. The third stage lasted 470 s as a high-speed operation.
The obtained fuel–electric demand power curve is shown in Figure 9. It can be seen that, under the current working condition, the fuel–electric power demand has significant load changes or frequent load fluctuations. Therefore, in order to avoid the fuel cell performance attenuation caused by large load changes or frequent load changes, the power of the fuel cell would be estimated based on the grey GM(1,1) model.

4. Results

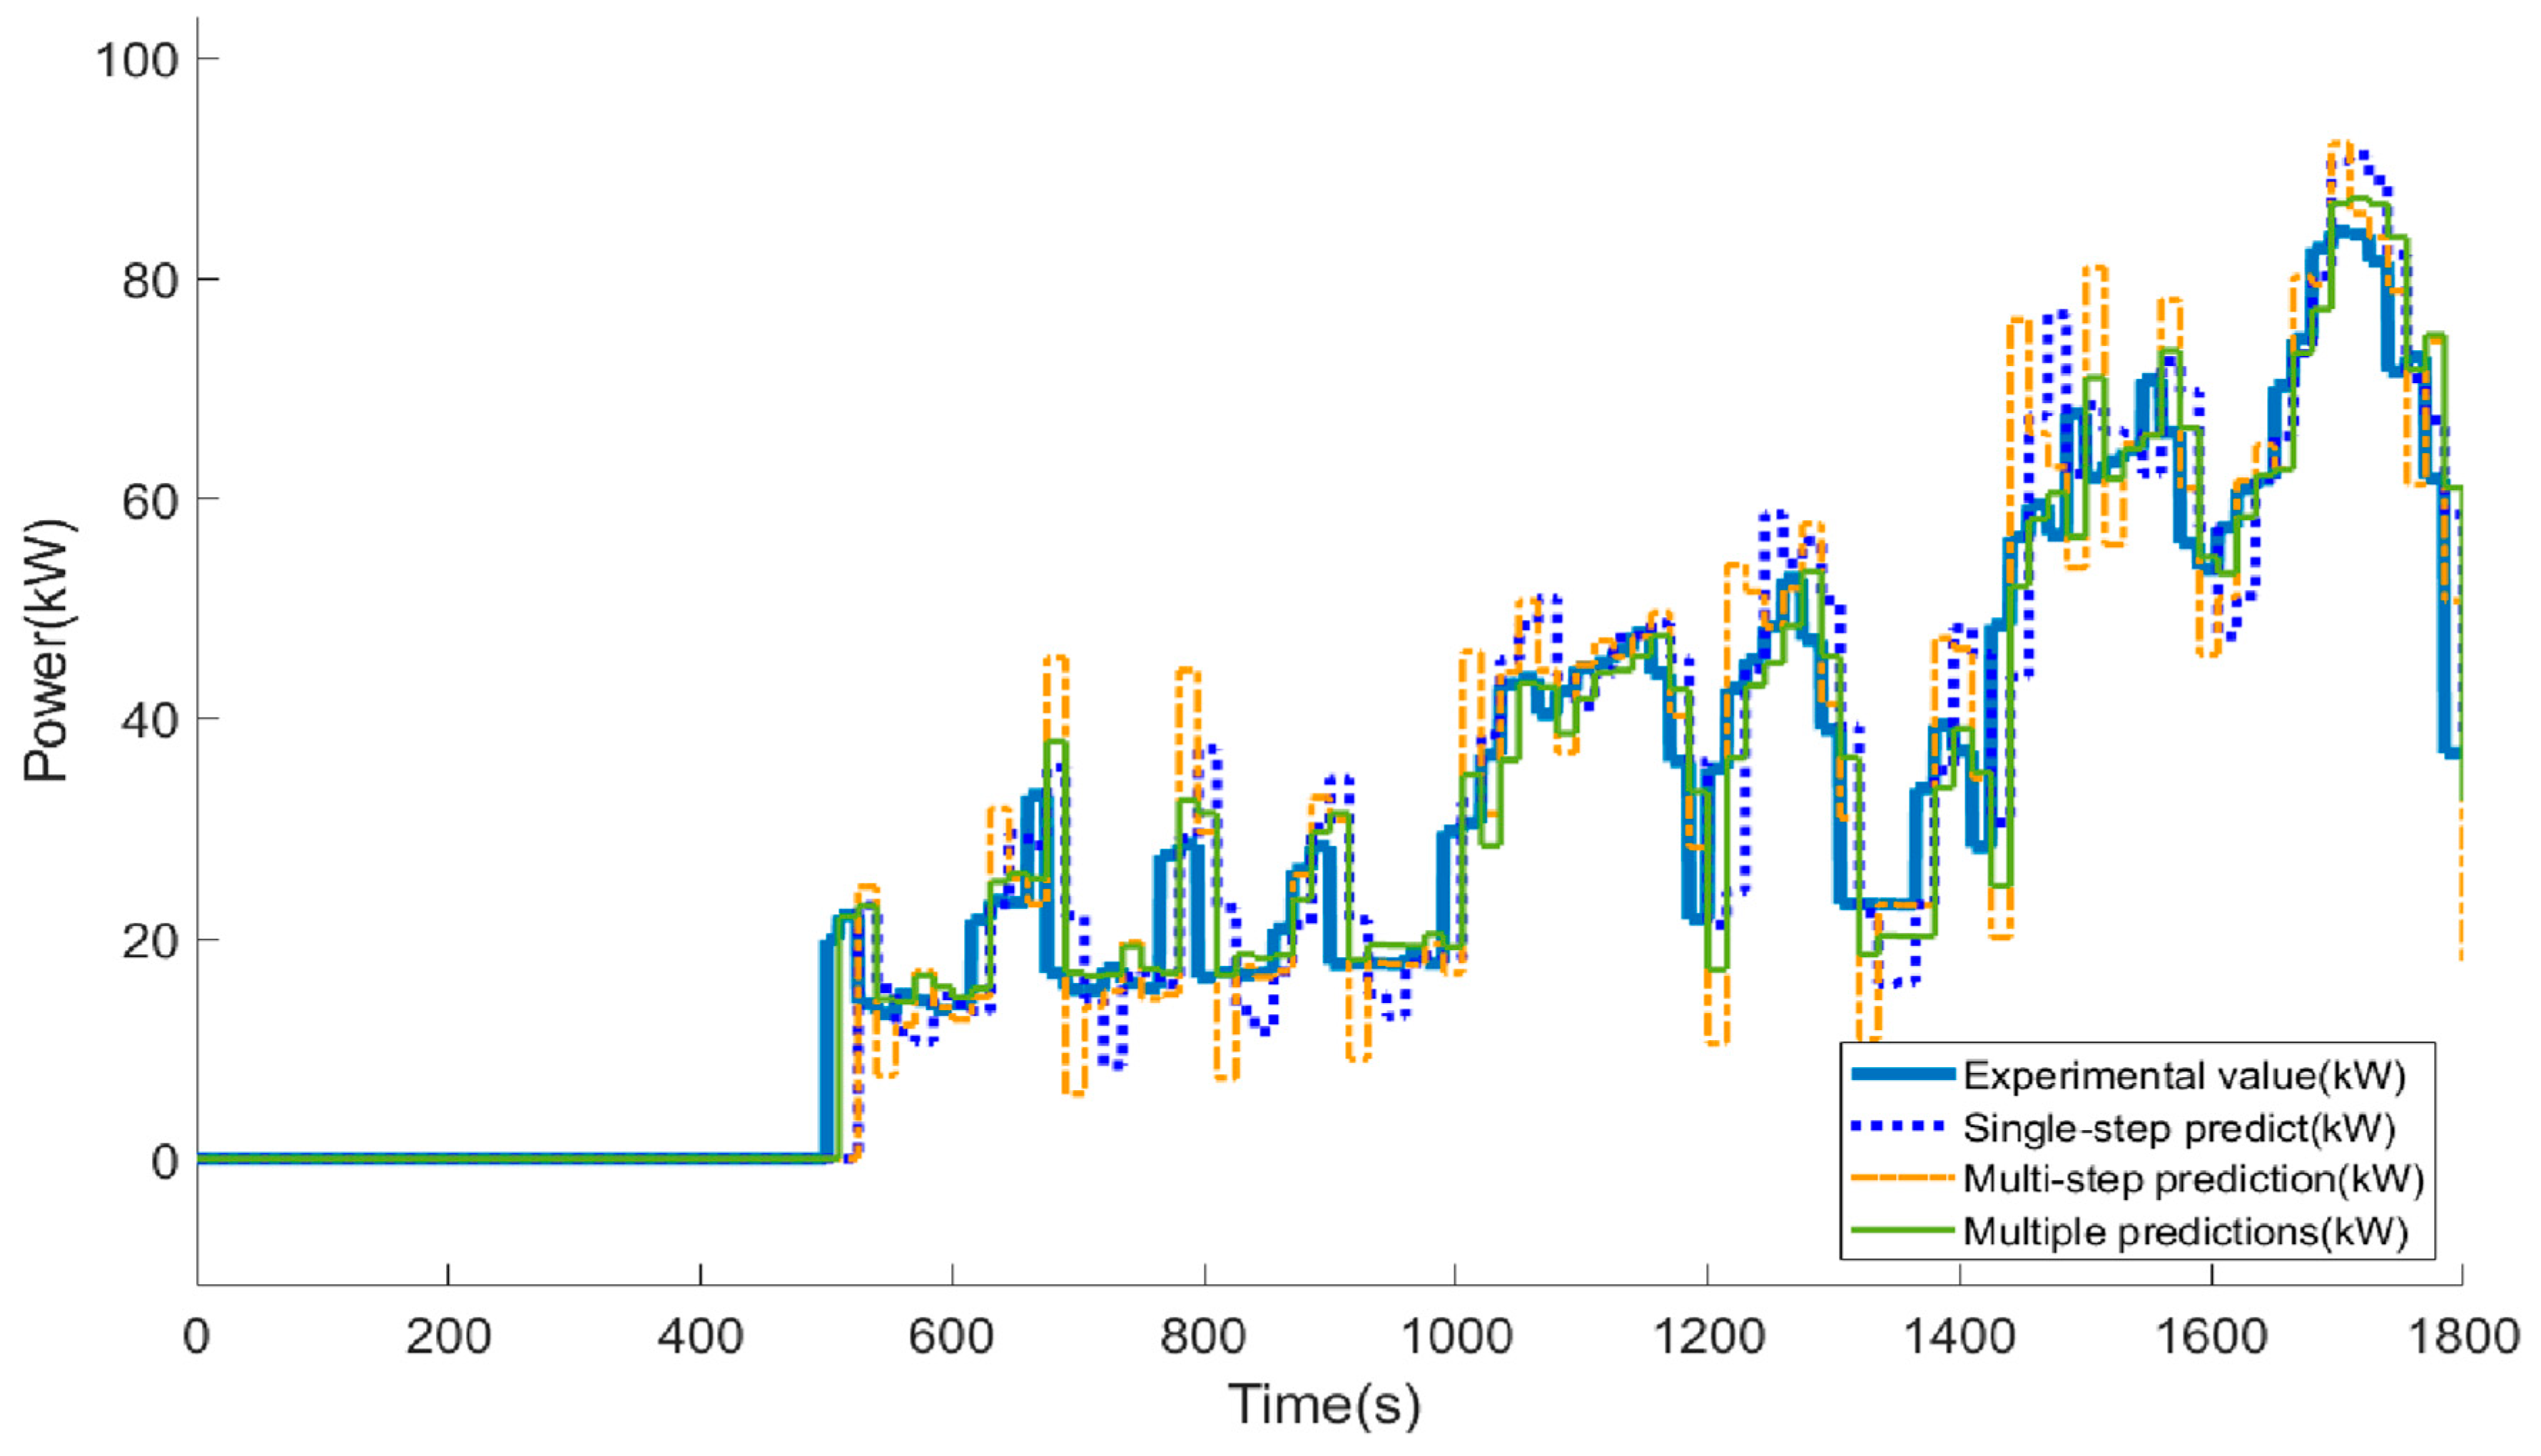
4.1. Under CHTC-HT Working Condition

Since the prediction of the GM(1,1) model requires a certain amount of historical data, in this study, the prediction started from the 500th second of the working condition. Then, the prediction of fuel cell power demand under the CHTC-HT working condition was carried out through the above three prediction strategies (i.e., single-step prediction, multi-step prediction and multiple prediction). Results of the simulation are shown in Figure 10.
In this study, the average relative error is also used to evaluate the advantages and disadvantages of the predicting strategy. Table 3 listed the prediction errors of the three prediction strategies under the CHTC-HT condition. The errors of single-step prediction, multi-step prediction and multiple prediction are 22.957%, 23.366% and 16.944%, respectively. Under this condition, the prediction accuracy of the grey multiple prediction strategy is significantly higher than that of the other two prediction strategies.
As can be seen from Figure 10 and Table 3, single-step prediction can track the experimental value change well at each step, but the performance in the area with large fluctuations may not be ideal, resulting in lag or an inaccurate prediction. When predicting multiple time steps, the accuracy may gradually decrease due to the accumulation of errors, especially in complex and frequently changing periods of time. For example, between 800 and 1400 s under the working condition, the power fluctuation is between 0 and 120 kW. Multiple prediction can smooth short-term fluctuations to a large extent and improve the stability of prediction results. For example, multiple predictions show better stability in regions with large power fluctuations, such as 600 s to 800 s and 1000 s to 1200 s.

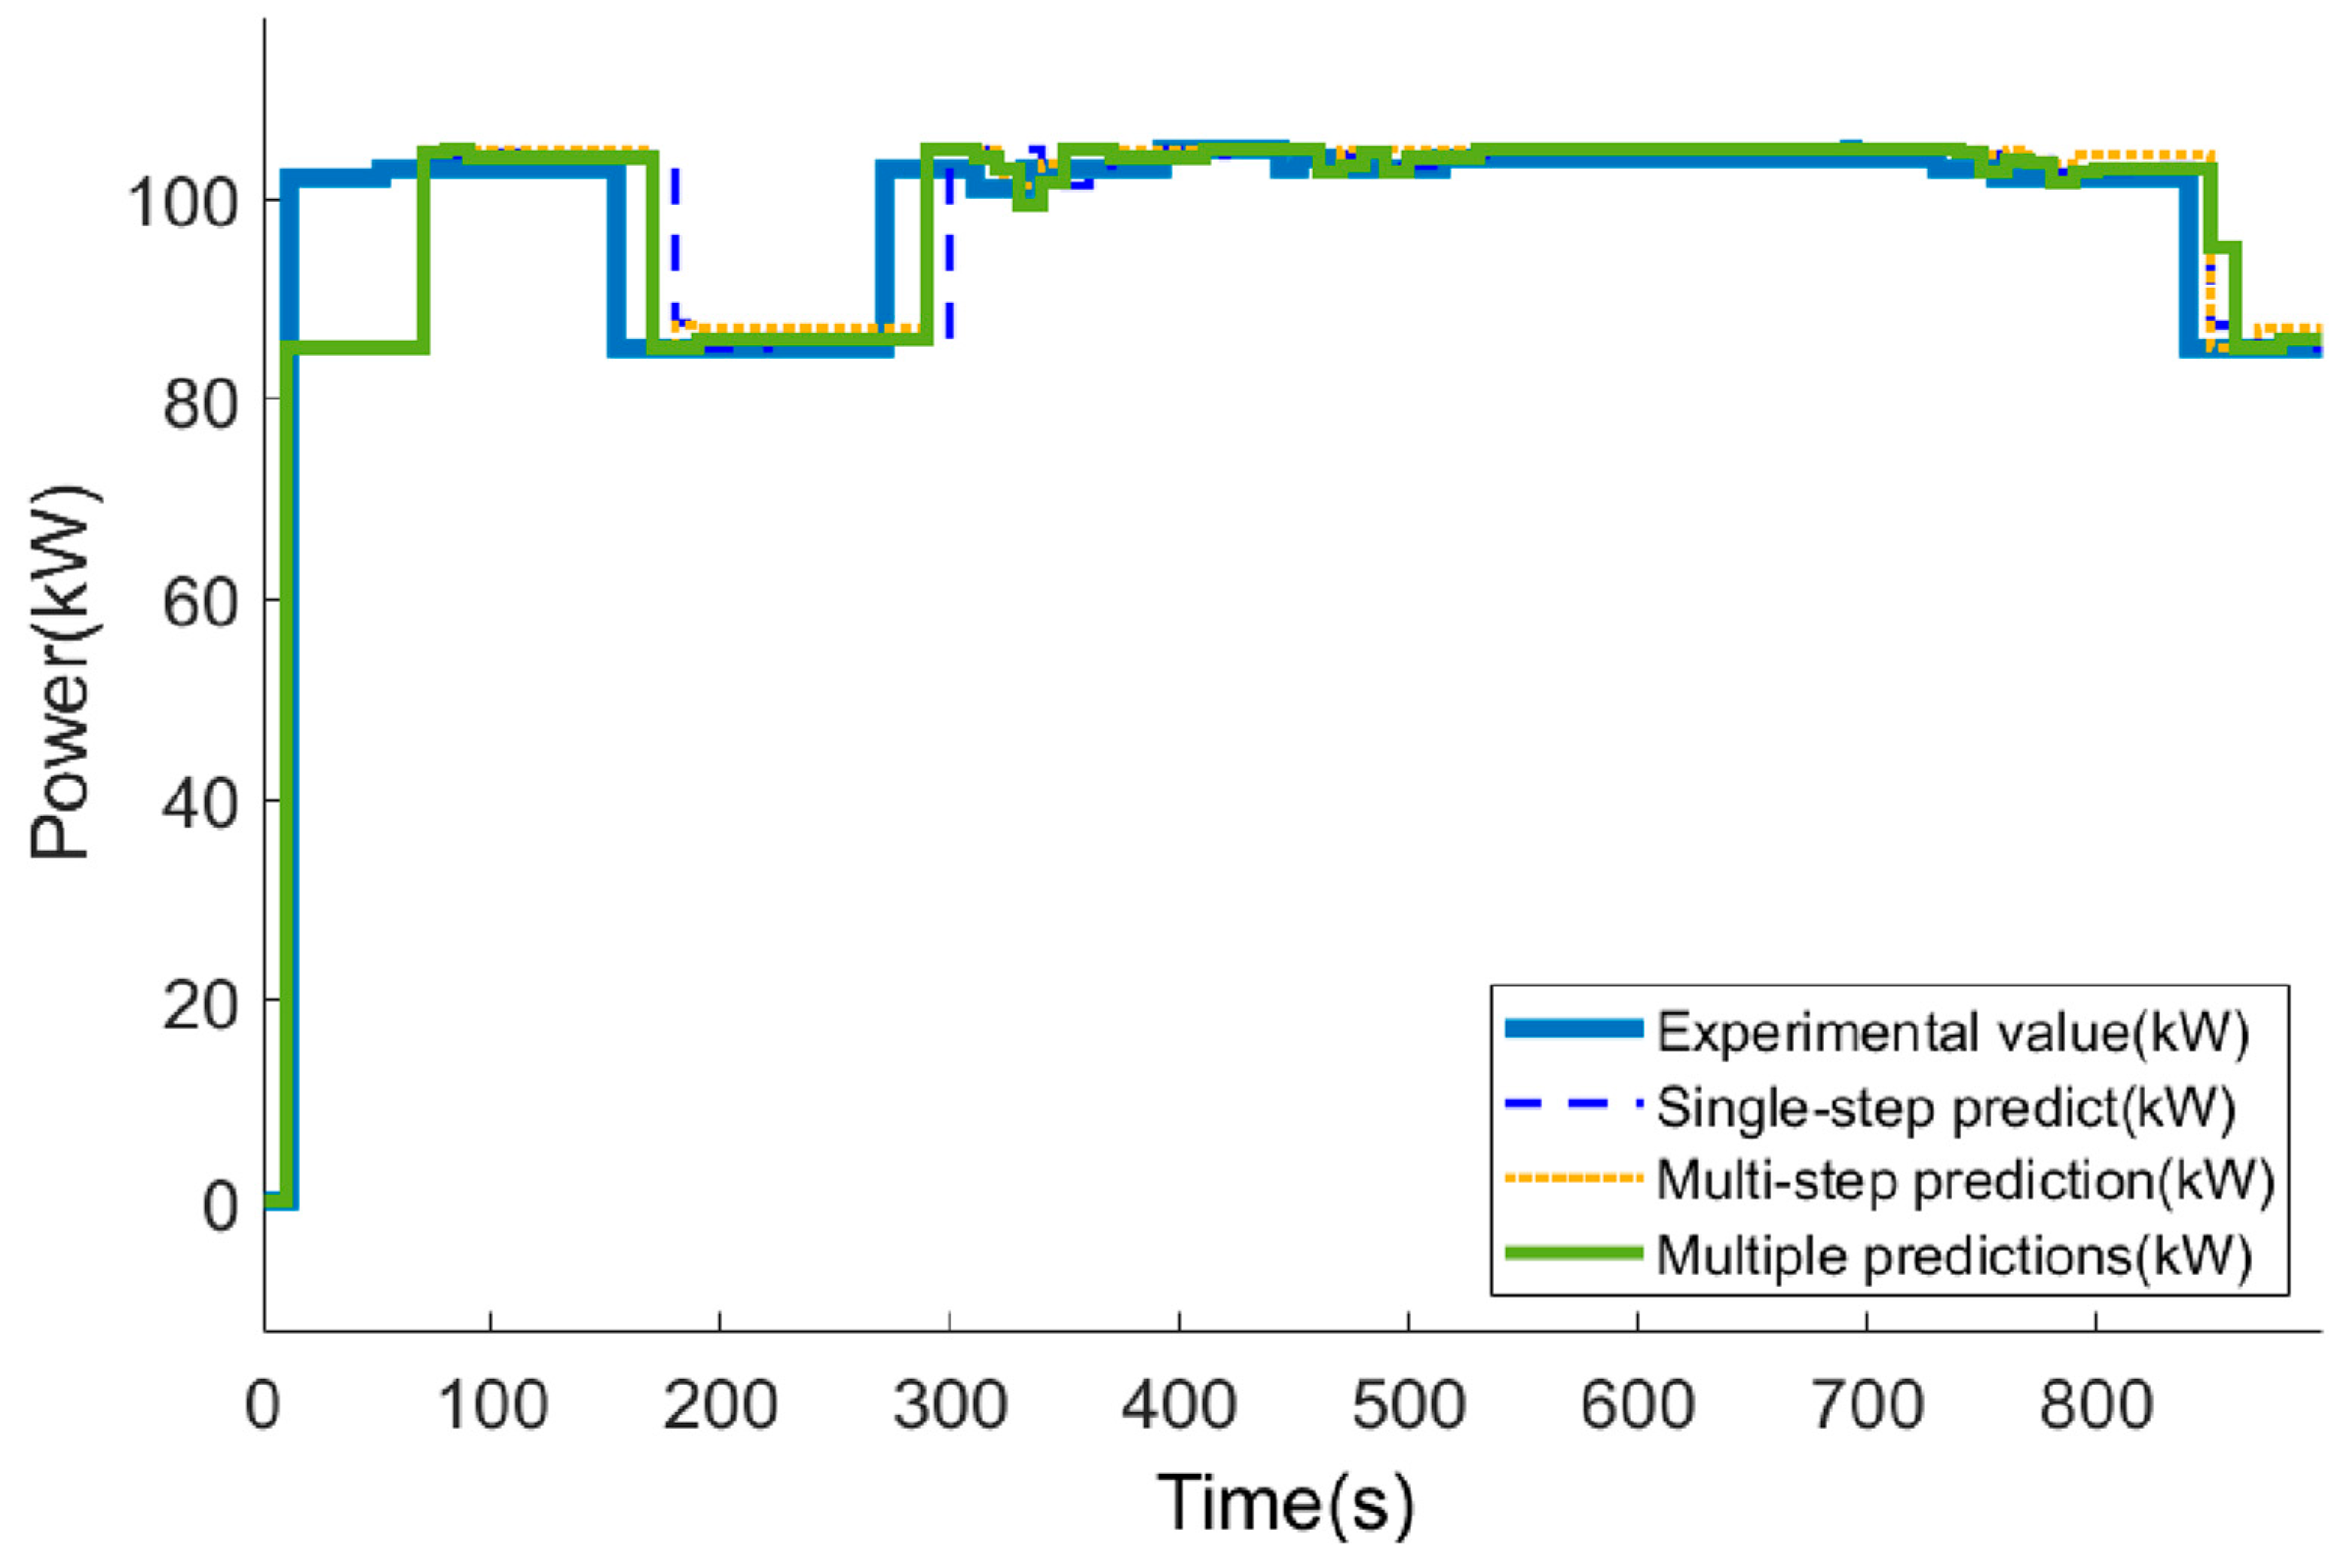
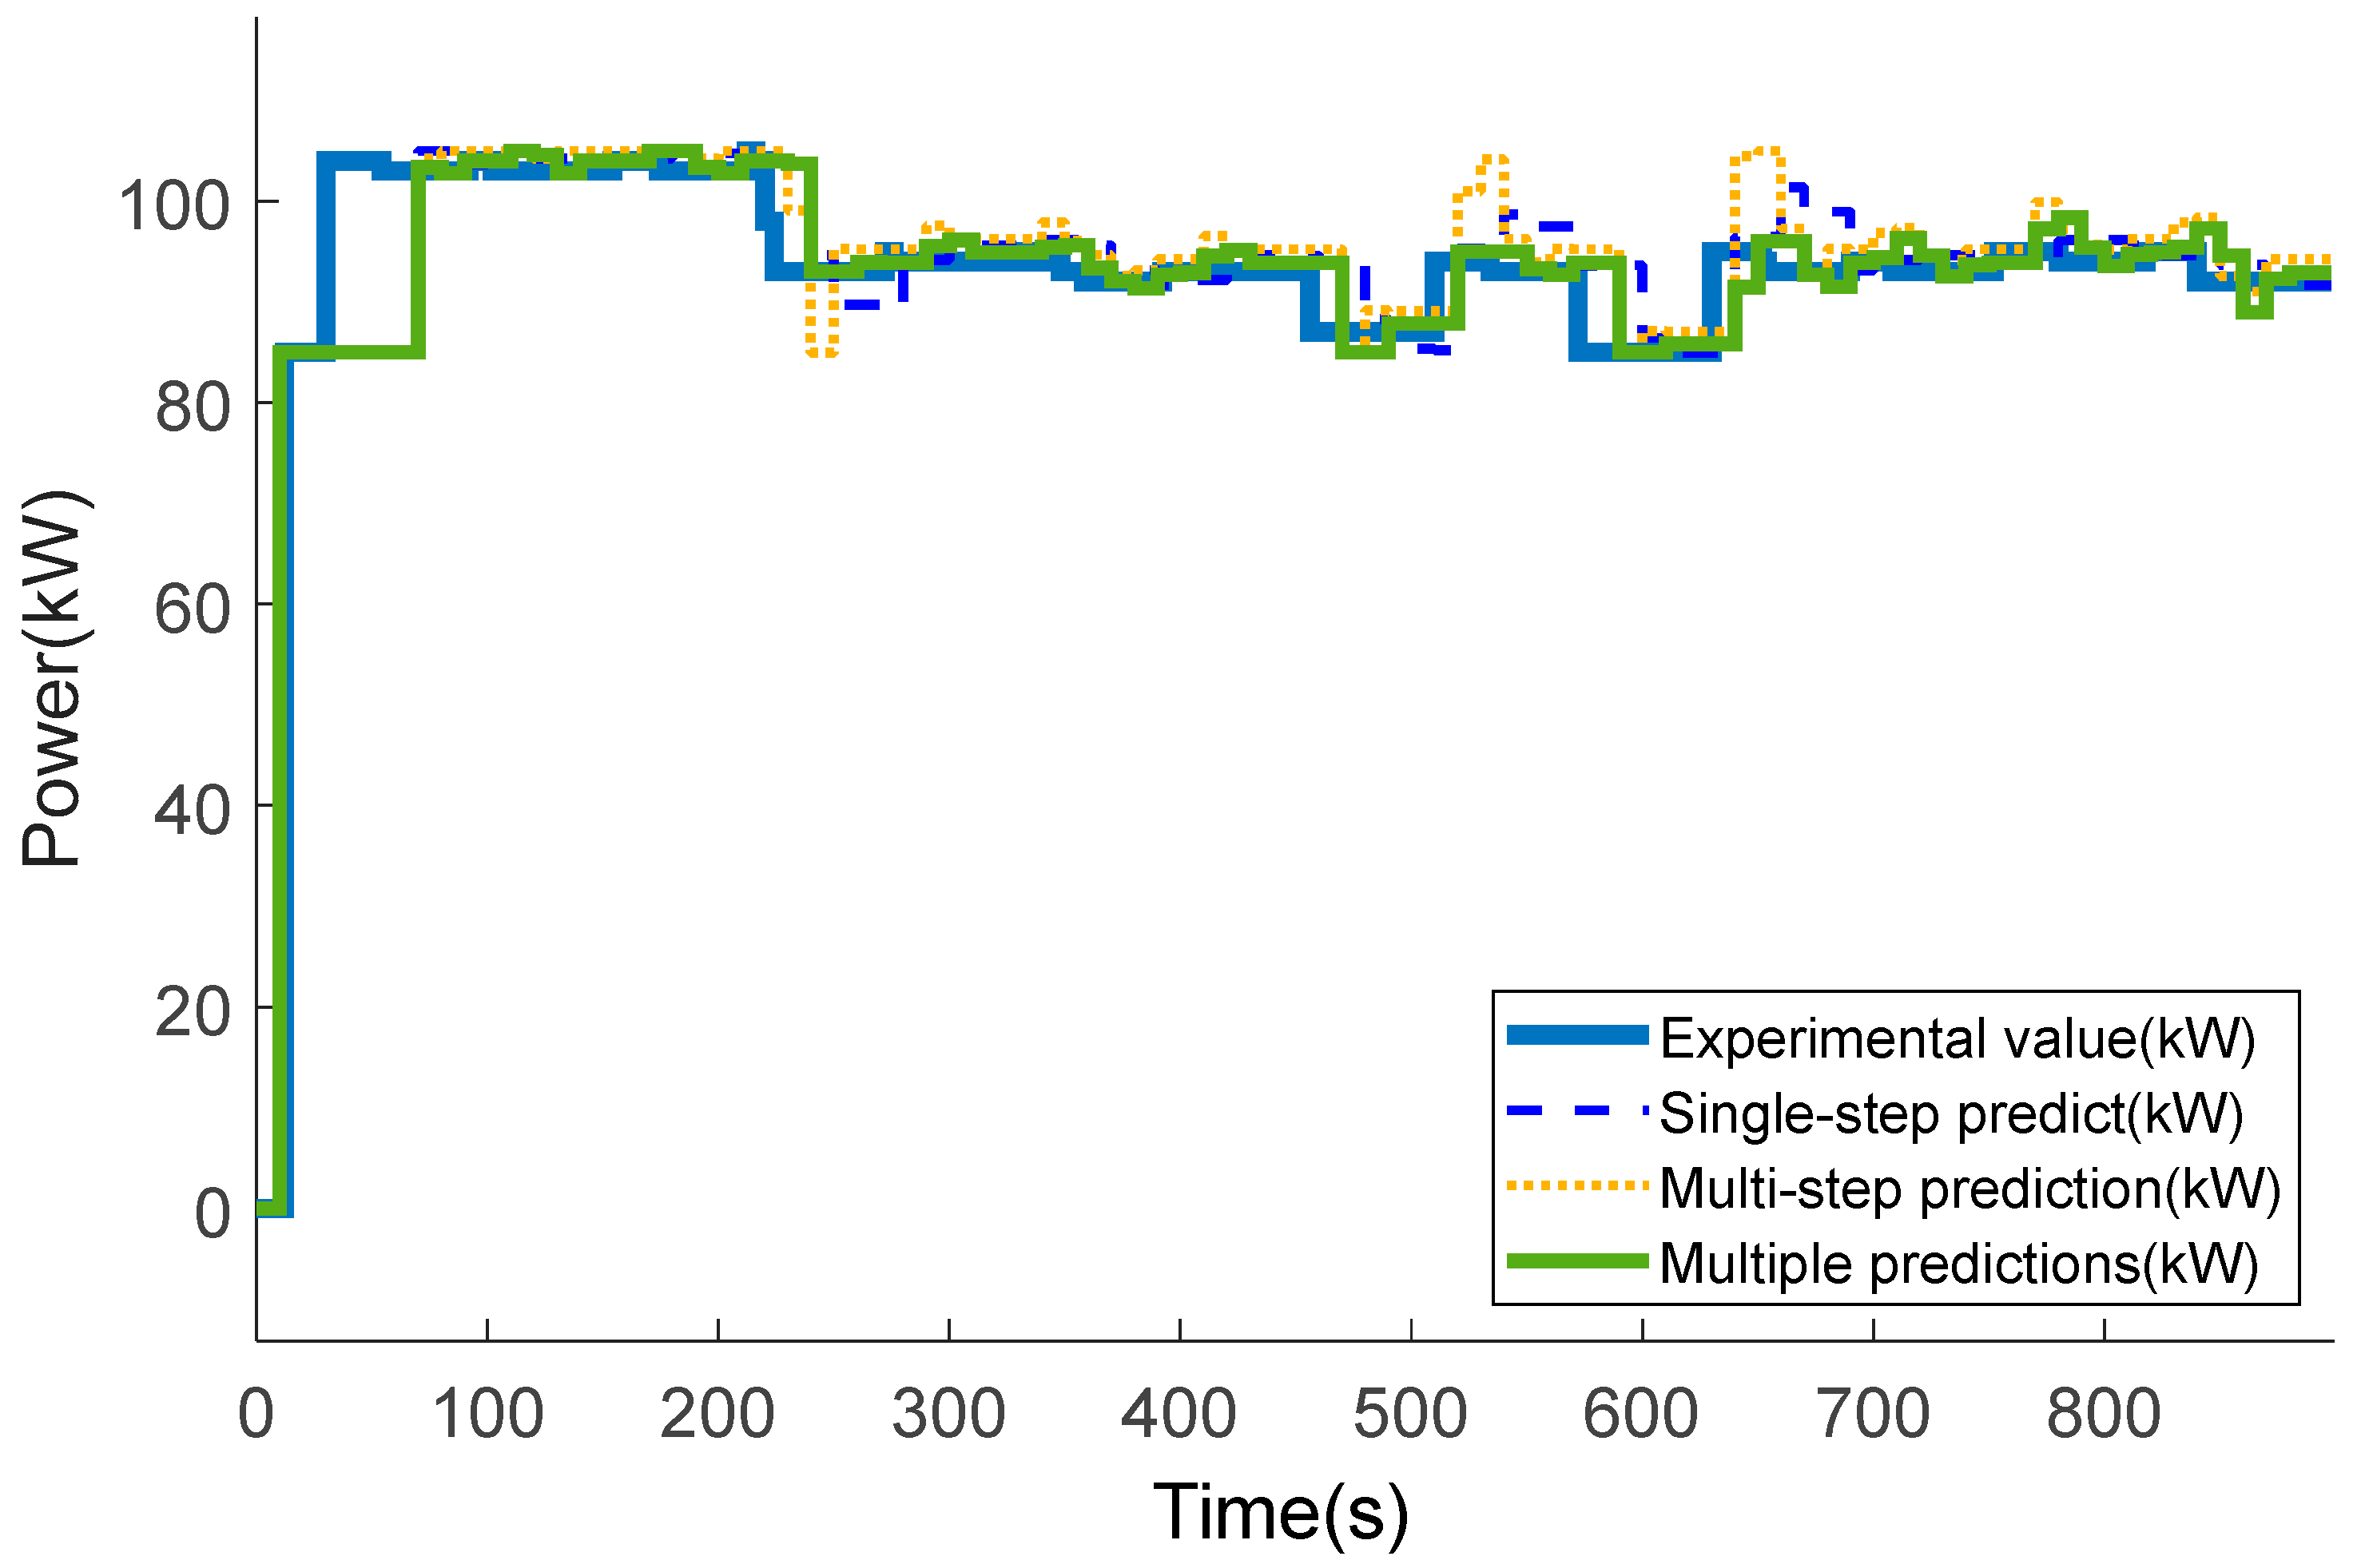
4.2. Under Field-Testing Working Condition

In order to verify the applicability of the above three predicting strategies in real operating conditions, these three strategies were evaluated with the fuel cell operation data of fuel cell vehicles under actual driving conditions. The data used in this study were collected from the operation data of a 49-ton fuel cell heavy truck operating in Hebei Province in China on March 3 in 2024 (shown in Figure 11), providing the power request sent by the vehicle to the fuel cell in real time.
The vehicle power system parameters are mainly used for logistic transportation. The performance and applicability of the proposed strategy under different environmental conditions can be evaluated by selecting the working conditions with different load variation degrees to verify the strategy. Thus, the stability and reliability of the strategy can be evaluated in practical application; further, the robustness can be verified by testing the performance of the strategy under different working conditions.
Two typical working conditions with different power request intensities covering a time span of 900 s in the running process of the vehicle are selected and marked as Working Condition A and Working Condition B, respectively. Under Working Condition A, the number of large load changes or frequent load changes is less, while the frequency of load changes is more frequent under Working Condition B. Figure 12 and Figure 13 separately show the prediction curves of three strategies (single-step prediction, multi-step prediction, and multiple prediction) in field-testing Working Condition A and Working Condition B. And Table 4 and Table 5 list the prediction errors of each strategy in detail.
The analysis results show that, both in Working Condition A with gentle fluctuation and Working Condition B with large fluctuation, the three predicting strategies all have large errors in the first 150 s of the working condition. Due to insufficient historical data at the beginning of the working condition, the three strategies all showed large errors of prediction. But after 150 s, the three strategies all showed better predicting performance.
In the prediction of Working Condition A, the average relative error of the multiple grey predicting strategy is 2.169%, which is the highest accuracy among the three strategies, followed by the single-step predicting strategy with 2.262% and the multi-step strategy with 2.502%. In the prediction of Working Condition B, the prediction error results of the three strategies showed similarly to Working Condition A. The prediction accuracy of the multiple grey predicting strategy was the highest with an average relative error of 1.930%, followed by the average relative error of the single-step strategy with an average relative error of 2.719% and the prediction effect of the multi-step strategy with an average relative error of 3.151%.
Combined with two conditions in field testing above, it can be concluded that, both under the working conditions with less load variation (Working Condition A) and frequent load variation (Working Condition B), the multiple grey strategy performed best in the fuel cell power demand prediction.

5. Conclusions

In this study, a fuel cell model was firstly constructed for commercial fuel cell vehicles, with the lithium electronic battery as an auxiliary power source and forming an electric–electric hybrid power system with the fuel cell. Power of the vehicle is provided by the fuel cell and the power battery. Fuel cell durability, output characteristics of fuel cells and pulse discharge time of the power battery were considered to determine the variable load period of the fuel cell (i.e., 15 s in this study) to optimize fuel cell and power battery collaboration on the fuel cell commercial vehicles.
In order to obtain the power demand of fuel cell, the GM (1,1) model was used based on the grey system method, which is an effective predicting tool to deal with small samples and uncertain information and is suitable for fuel cell systems with incomplete data information. Three different grey predicting strategies were proposed and tested in this study: single-step prediction, multi-step prediction and multiple prediction. In the single-step grey prediction strategy, the whole power series was obtained by sampling cover data of the current moment and previous moments and then was used to predict the power demand based on a step size of one. In multi-step grey prediction, the GM (1,1) model samples the power on a 5 s cycle and predicts the power demand based on a prediction step size of three. In the multiple grey prediction, the input model sequence of this strategy covers the power demand data of six time points and expands the prediction number to three times with a step-moved prediction time window.
Each strategy was simulated under CHTC-HT conditions to evaluate its effectiveness. The simulation results show that the grey multiple prediction strategy has the highest prediction accuracy when dealing with continuously changing dynamic conditions, indicated by the lowest error value of 16.944% when compared to the single-step prediction of 31.14% and multi-step prediction of 35.36%. In order to further verify the adaptability of the grey multiple prediction strategy in field testing, two different working conditions of fuel cell vehicles with more and less variable load conditions were selected (Working Condition A and Working Condition B). Results show that the multiple strategy showed the best prediction performance under stable conditions with less variable load (with the lowest error value of 2.169% compared to the single-step prediction of 2.262% and multi-step prediction of 2.502%) and dynamic conditions with frequent load changes (with the lowest error value of 1.930% compared to the single-step prediction of 2.719% and multi-step prediction of 3.151%), which can adjust the predicting model according to the real-time data and respond to the changes in external conditions in time.
In summary, the grey prediction model is an effective predicting tool in the power management of a fuel cell system, which enhances the adaptability and durability of the system. The power demand and supply of the fuel cell can be effectively predicted and managed based on the proposed multiple grey prediction model considering a dynamic time window. The system performance can further be optimized to improve the fuel efficiency and reliability of the overall operation of the vehicle.

Author Contributions

Conceptualization, J.L.; Methodology, Y.W.; Software, Y.L.; Validation, Y.W. and Y.L.; Formal analysis, Y.L.; Investigation, Y.L. and H.Z.; Resources, J.L. and H.Z.; Writing—original draft, Y.W. and Y.L.; Writing—review & editing, Y.W.; Supervision, J.L. and H.Z.; Funding acquisition, Y.W. and J.L. All authors have read and agreed to the published version of the manuscript.

Funding

This work was funded by [National Natural Science Foundation of China] grant number [52402434], [Zhejiang Provincial Nature Science Foundation of China] grant number [LY22E050018], and [Zhejiang Department of Transportation Science and Technology Plan] grant number [2024017]. And The APC was funded by [52402434].

Institutional Review Board Statement

Not applicable.

Informed Consent Statement

Not applicable.

Data Availability Statement

The original contributions presented in this study are included in the article. Further inquiries can be directed to the corresponding author.

Conflicts of Interest

The authors declare no conflict of interest.

References

  1. Wei, T.; Yu, P.; Xue, B.; Zhang, Y.; Li, W. Modeling, Simulation and Characteristic Research of Proton Exchange Membrane Fuel Cell. Agric. Equip. Veh. Eng. 2022, 60, 41–46. [Google Scholar]
  2. Wang, T.; Li, Q.; Yang, H.; Yin, L.; Wang, X.; Qiu, Y.; Chen, W. Adaptive Current Distribution Method for Parallel-connected PEMFC Generation System Considering Performance Consistency. Energy Convers. Manag. 2019, 196, 866–877. [Google Scholar] [CrossRef]
  3. Qasem, N.A.; Abdulrahman, G.A. A Recent Comprehensive Review of Fuel Cells: History, Types, and Applications. Int. J. Energy Res. 2024, 2024, 7271748. [Google Scholar] [CrossRef]
  4. Zheng, C.; Oh, C.; Park, Y.; Cha, S. Fuel Economy Evaluation of Fuel Cell Hybrid Vehicles Based on Equivalent Fuel Consumption. Int. J. Hydrogen Energy 2012, 37, 1790–1796. [Google Scholar] [CrossRef]
  5. Yang, L. Research on Energy Management Strategy of Fuel Cell Vehicle Considering Battery Life Degradation. Master’s Thesis, Jilin University, Jilin, China, 2022. [Google Scholar]
  6. Hu, Z. Durability Modeling and State Estimation for Vehicular Fuel Cell System. Ph.D. Thesis, Tsinghua University, Beijing, China, 2019. [Google Scholar]
  7. Huang, R.; Peng, Y.; Yang, J.; Xu, X.; Deng, P. Correlation analysis and prediction of PEM fuel cell voltage during start-stop operation based on real-world driving data. Energy 2022, 260, 124930. [Google Scholar] [CrossRef]
  8. Tao, H.; Hu, Z.; Wang, Z.; Li, J.; Xu, L.; Ouyang, M. Working Conditions Analysis and Performance Degradation Estimation of Fuel Cell Buses Based on Real Road Data. In Proceedings of the 2023 7th CAA International Conference on Vehicular Control and Intelligence (CVCI 2023), Changsha, China, 27–29 October 2023. [Google Scholar]
  9. Bahrami, M.; Martin, J.; Maranzana, G.; Pierfederici, S.; Weber, M.; Didierjean, S. Fuel Cell Management System: An Approach to Increase Its Durability. Appl. Energy 2022, 306, 118070. [Google Scholar] [CrossRef]
  10. Bressel, M.; Hilairet, M.; Hissel, D.; Ould Bouamama, B. Remaining Useful Life Prediction and Uncertainty Quantification of Proton Exchange Membrane Fuel Cell under Variable Load. IEEE Trans. Ind. Electron. 2016, 63, 2569–2577. [Google Scholar] [CrossRef]
  11. Jouin, M.; Gouriveau, R.; Hissel, D.; Pera, M.; Zerhouni, N. Prognostics of PEM Fuel Cell in a Particle Filtering Framework. Int. J. Hydrogen Energy 2014, 39, 481–494. [Google Scholar] [CrossRef]
  12. Zhu, L.; Chen, J. Prognostics of PEM Fuel Cells Based on Gaussian Process State Space Models. Energy 2018, 149, 63–73. [Google Scholar] [CrossRef]
  13. Javed, K.; Gouriveau, R.; Zerhouni, N.; Hissel, D. Prognostics of Proton Exchange Membrane Fuel Cells Stack Using an Ensemble of Constraints Based Connectionist Networks. J. Power Sources 2016, 324, 745–757. [Google Scholar] [CrossRef]
  14. Liu, H.; Chen, J.; Hou, M.; Shao, Z.; Su, H. Data-based Short-term Prognostics for Proton Exchange Membrane Fuel Cells. Int. J. Hydrogen Energy 2017, 42, 20791–20808. [Google Scholar] [CrossRef]
  15. Zeng, T. Research on Approach and Application of Short-term Power Demand Prediction in Fuel Cell Vehicles. Ph.D. Thesis, Chongqing University, Chongqing, China, 2021. [Google Scholar]
  16. Liu, S.; Tao, L.; Xie, N.; Yang, Y. On the New Model System and Framework of Grey System Theory. J. Grey Syst. 2016, 28, 1–15. [Google Scholar]
  17. Lin, S.; Wang, R.; Li, M.; Zhou, J.; Deng, Y.; Luo, T.; Zhang, J.; Destech Publicat, I. Power Investment Prediction Based on the Improved GM(1,1) Model. In Proceedings of the International Conference on Electrical, Control, Automation and Robotics (ECAR), Xiamen, China, 16–17 September 2018. [Google Scholar]
  18. Li, Y.; Mei, G.; Gaol, J.; Jiang, C.; Yuan, J. Application of Improved Failure Mode Recognition Algorithms and GM(1,1) Model on Fatigue Lifetime Prediction of Truss Structure. J. Grey Syst. 2014, 26, 85–95. [Google Scholar]
  19. Ai, H.; Shi, Y. Application of GM (1,1) Model in PM2.5 Content Prediction. In Proceedings of the 2016 3rd International Conference on Education, Management and Computing Technology (ICEMCT), Hangzhou, China, 9–10 April 2016. [Google Scholar]
  20. Sun, C. Research on Prediction of Visitors Quantity Based on GM(1,1)Method. In Proceedings of the 3rd Annual 2017 International Conference on Management Science and Engineering (MSE), Guilin, China, 18–20 August 2017. [Google Scholar]
  21. Zheng, X. Application of Grey System Theory to Regional Logistics Demand Prediction. In Proceedings of the World Automation Congress 2012 (WAC), Puerto Vallarta, Mexico, 24–28 June 2012; IEEE: New York, NY, USA. [Google Scholar]
  22. Ye, J.; Dang, Y.; Wang, J.; Yang, Y. Grey Prediction Model of Interval Grey Numbers Based on a Novel Compound Function Transformation. J. Grey Syst. 2017, 29, 155–176. [Google Scholar]
  23. Wang, X.; Qi, L.; Chen, C.; Tang, J.; Jiang, M. Grey System Theory Based Prediction for Topic Trend on Internet. Eng. Appl. Artif. Intell. 2014, 29, 191–200. [Google Scholar] [CrossRef]
  24. Chen, S.; Wang, D.; Liang, J. Sound Quality Analysis and Predicton of Vehicle Interior Noise Based on Grey System Theory. Fluct. Noise Lett. 2012, 11, 1250016. [Google Scholar] [CrossRef]
  25. Sie, W.; Lian, R.; Lin, B. Enhancing Grey Prediction Fuzzy Controller for Active Suspension Systems. Veh. Syst. Dyn. 2006, 44, 407–430. [Google Scholar] [CrossRef]
  26. Fu, Z.; Chen, Q.; Zhang, L.; Fan, J.; Zhang, H.; Deng, Z. Research on Energy Management Strategy of Fuel Cell Power Generation System Based on Grey-Markov Chain Power Prediction. Energy Rep. 2021, 7, 319–325. [Google Scholar] [CrossRef]
  27. Wang, Y.; Lu, J.; Zhu, X.; Ye, J.; Kong, Y.; Hao, W. A GM-Based Energy Management Strategy of Hybrid Power System for Hydrogen Fuel Cell Buses. J. Adv. Transp. 2023, 2023, 6656612. [Google Scholar] [CrossRef]
  28. China Automotive Technology Research Center Co., Ltd. China Automotive Test Cycle-Part 2: Heavy-Duty Commercial Vehicles [Z]; The State Administration for Market Regulation of China: Beijing, China, 2019.
Figure 1. Structure of fuel cell and power battery.
Applsci 15 01213 g001
Figure 2. Fuel cell model structure.
Applsci 15 01213 g002
Figure 3. Process of single-step grey prediction.
Applsci 15 01213 g003
Figure 4. Process of multi-step grey prediction.
Applsci 15 01213 g004
Figure 5. Process of multiple grey prediction.
Applsci 15 01213 g005
Figure 6. Comparison of fuel cell monolithic voltage.
Applsci 15 01213 g006
Figure 7. Process of model input condition.
Applsci 15 01213 g007
Figure 8. CHTC-HT working condition.
Applsci 15 01213 g008
Figure 9. Fuel cell power demand under CHTC-HT condition.
Applsci 15 01213 g009
Figure 10. Prediction curves of fuel cell power demand with three strategies under CHTC-HT.
Applsci 15 01213 g010
Figure 11. Truck route map in field testing.
Applsci 15 01213 g011
Figure 12. Prediction curves of fuel cell power demand with three strategies under Working Condition A in field testing.
Applsci 15 01213 g012
Figure 13. Prediction curves of fuel cell power demand with three strategies under Working Condition B in field testing.
Applsci 15 01213 g013
Table 1. Power configuration of fuel cell vehicle.
Vehicle Type49 Ton Fuel Cell Semi-Tractor
Rated power of drive motor (kW)236
Peak power of drive motor (kW)360
Fuel cell power rating (kW)125
Power battery total energy (kWh)141.312
Power battery nominal voltage (V)614.4
Power battery nominal capacity (Ah)230
Power battery pulse discharge ratio (C)2
Power battery pulse discharge time (s)30
Table 2. Comparison of fuel cell stack power at different currents.
Current (A)Fuel Cell Stack Power (W)Absolute Ratio Error (%)
Experimental ValueSimulation Value
5013.913.80.72
8823.523.30.85
14637.837.41.06
23457.757.60.17
29270.270.10.14
438101.1101.90.79
497112.8113.90.98
585129.7131.11.08
664143.4144.60.84
697148.5149.20.47
730152.7152.30.26
Mean relative percentage error: 0.67%
Table 3. Average relative prediction errors of the three prediction strategies under CHTC-HT.
Grey Prediction StrategiesAverage Relative Prediction Error (%)
Single-step prediction22.957
Multi-step prediction23.366
Multiple prediction16.944
Table 4. Average relative prediction errors of the three prediction strategies under Working Condition A in field testing.
Grey Prediction StrategiesAverage Relative Prediction Error (%)
Single-step prediction2.262
Multi-step prediction2.502
Multiple prediction2.169
Table 5. Average relative prediction errors of the three prediction strategies under Working Condition B in field testing.
Grey Prediction StrategiesAverage Relative Prediction Error (%)
Single-step prediction2.719
Multi-step prediction3.151
Multiple prediction1.930
Disclaimer/Publisher’s Note: The statements, opinions and data contained in all publications are solely those of the individual author(s) and contributor(s) and not of MDPI and/or the editor(s). MDPI and/or the editor(s) disclaim responsibility for any injury to people or property resulting from any ideas, methods, instructions or products referred to in the content.

