Article

An Artificial Intelligence Home Monitoring System That Uses CNN and LSTM and Is Based on the Android Studio Development Platform

Electrical Engineering, National Taipei University of Technology, Taipei 10608, Taiwan
*
Author to whom correspondence should be addressed.
Appl. Sci. 2025, 15(3), 1207; https://doi.org/10.3390/app15031207
Submission received: 6 December 2024 / Revised: 16 January 2025 / Accepted: 21 January 2025 / Published: 24 January 2025

Abstract

:
This paper developed an artificial intelligence home environment monitoring system by using the Android Studio development platform. A database was constructed within a server to store sensor data. The proposed system comprises multiple sensors, a message queueing telemetry transport (MQTT) communication protocol, cloud data storage and computation, and end device control. A mobile application was developed using MongoDB software, which is a file-oriented NoSQL database management system developed using C++. This system represents a new database for processing big sensor data. The k-nearest neighbor (KNN) algorithm was used to impute missing data. Node-RED development software was used within the server as a data-receiving, storage, and computing environment that is convenient to manage and maintain. Data on indoor temperature, humidity, and carbon dioxide concentrations are transmitted to a mobile phone application through the MQTT communication protocol for real-time display and monitoring. The system can control a fan or warning light through the mobile application to maintain ambient temperature inside the house and to warn users of emergencies. A long short-term memory (LSTM) model and a convolutional neural network (CNN) model were used to predict indoor temperature, humidity, and carbon dioxide concentrations. Average relative errors in the predicted values of humidity and carbon dioxide concentration were approximately 0.0415% and 0.134%, respectively, for data storage using the KNN algorithm. For indoor temperature prediction, the LSTM model had a mean absolute percentage error of 0.180% and a root-mean-squared error of 0.042 °C. The CNN–LSTM model had a mean absolute percentage error of 1.370% and a root-mean-squared error of 0.117 °C.

1. Introduction

The number of networks and terminal devices being used worldwide is continually and rapidly increasing. The ability to convey information has kept pace with this proliferation of devices and networks, and the connection between devices has become tighter and more convenient. New sensors are continuously being engineered, and the technologies underlying their operation are constantly improving. Volumes and power losses of devices are decreasing. Sensors can communicate with other devices and upload data to the cloud. They can collect environmental data and make decisions after incorporating the data they receive from other sensors. Internet of Things (IoT) devices can be operated manually but can also be operated using automated systems. Moreover, they can exercise intelligent judgment and take initiative to complete the bulk of the work. IoT devices have created a highly connected world, wherein billions of devices are collecting and communicating data from a range of domains, including home care and health care. Artificial intelligence has become indispensable for interpreting and understanding the enormous volumes of sensor data being generated and for making decisions that yield optimal outcomes [1].
Smart home technologies incorporate IoT devices [2]. Smart home systems feature gateways, which are central hubs that integrate multiple wireless communication technologies and uniformly transmit data to the cloud. To demonstrate the features of a smart home system, a study engineered a smart seawater aquarium system that used artificial intelligence technology specifically to enhance know-how regarding the rearing of seahorses as pets. The smart seawater aquarium system automatically adjusted water quality, water temperature, and oxygen content. Moreover, it changed the water, fed fish, and monitored fish in real time. The system comprised a cloud-based platform and a web-based platform for data transmission and interface control. This approach enabled local as well as remote monitoring of the aquarium, enhancing the convenience of fish rearing [3]. However, the system did not have artificial intelligence technology capable of processing sensor data and improving monitoring, detection, learning, control, and prediction efficiencies.
Our study developed an indoor air quality monitoring system based on cloud-side and end-side collaboration and machine learning. The system was implemented on the edge impulse platform using a convolutional neural network (CNN) and long short-term memory (LSTM). Edge impulse is a leading AI platform for collecting data, training models, and deploying them to edge computing devices. It provides an end-to-end framework that seamlessly integrates into the edge MLOps (machine learning operations) workflow. Additionally, edge impulse integrates effortlessly with other machine learning frameworks, allowing you to scale and customize your models or pipelines as needed. The system analyzed and predicted indoor air quality levels, uploaded information to a message queue telemetry transport (MQTT) server using the Category 0 protocol, and sent notifications to subscribers through a mobile application (app), thereby enabling individuals to monitor and adjust indoor air quality as needed [4]. The system was developed using devices from different vendors and different communication protocols [5]. Hardware and cloud services do not need to be purchased to use this system. Furthermore, the system’s applications can be expanded to create a more comprehensive IoT ecosystem, including integrating smart home devices, energy-efficient systems, mobile apps, and other machine learning models. The experimental results employ min–max normalization (also known as feature scaling) to reduce the impact of unrelated samples on the measured results. While this approach ensures a bounded range, it also results in smaller standard deviations, which may suppress the effects of outliers.
The remainder of this paper is organized as follows: Section 2 describes the architecture of the proposed home monitoring system, Section 3 presents the results of implementing the system and verifying its performance, and Section 4 presents the conclusions of the study.

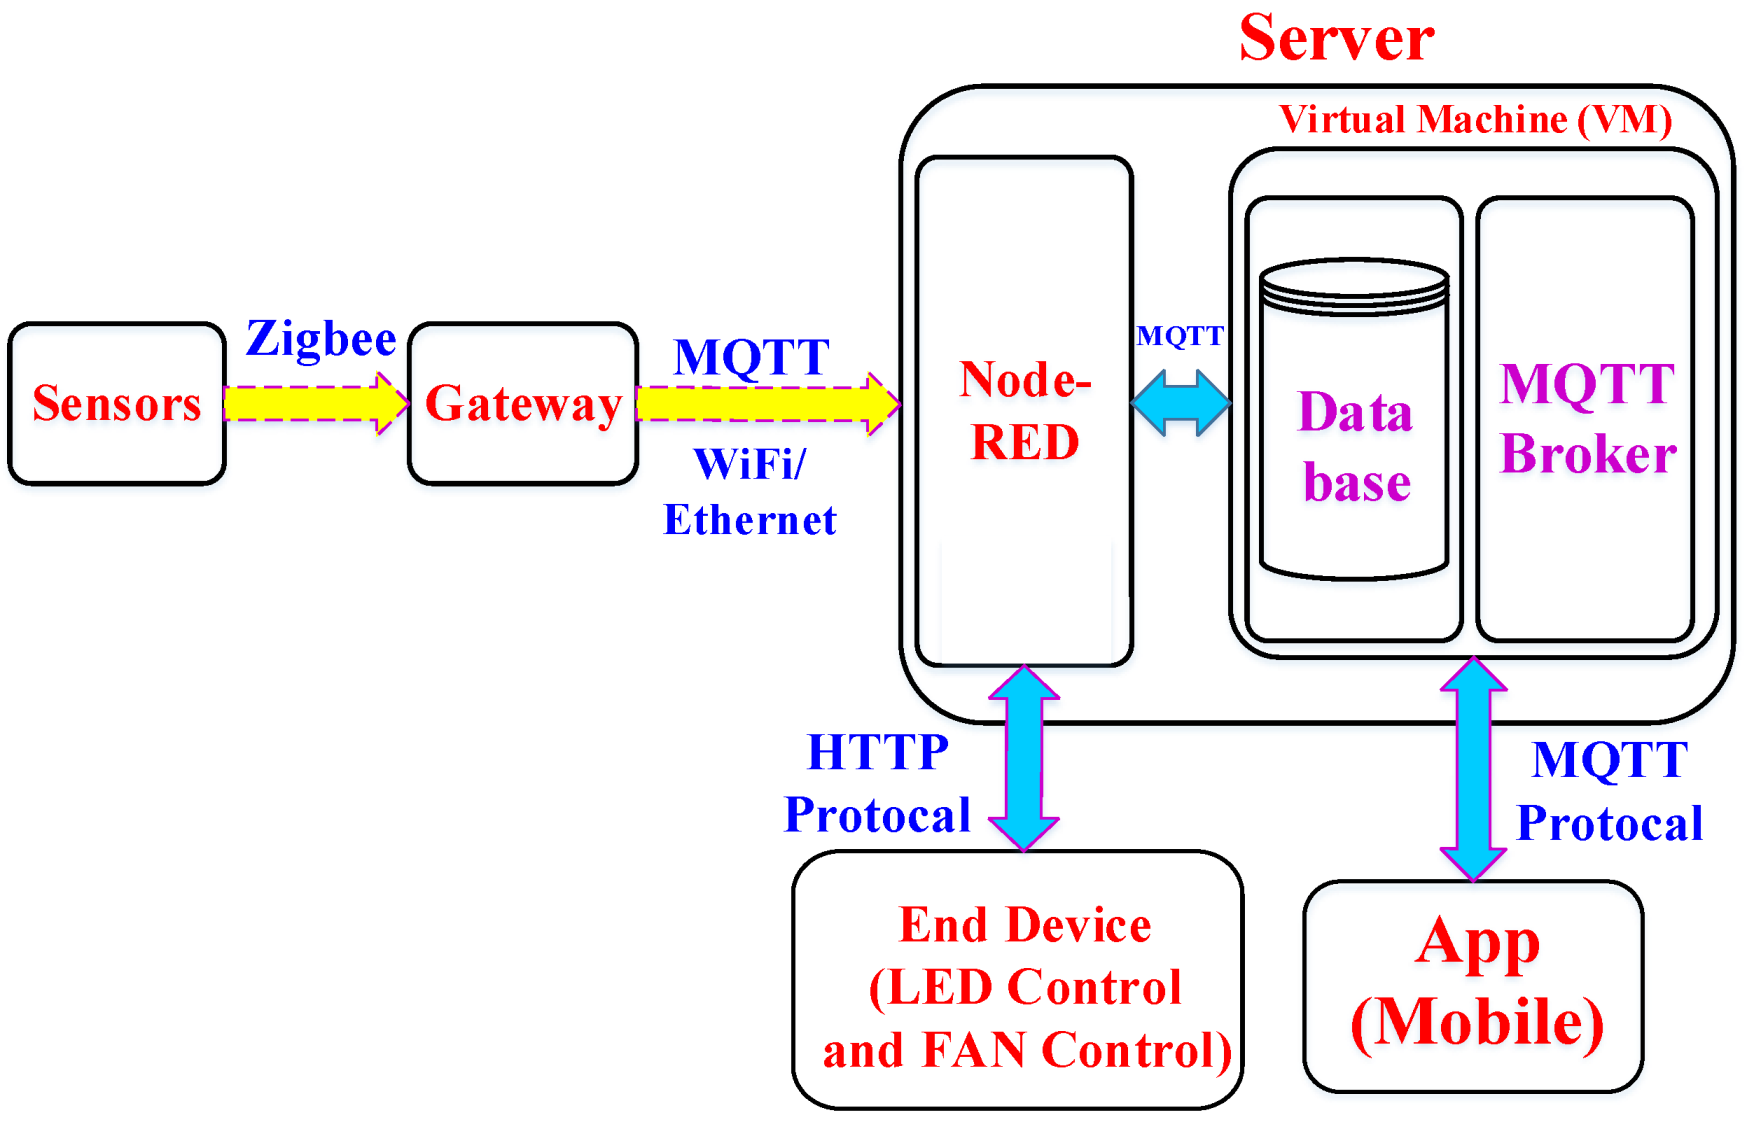
2. System Architecture

This study uses the ZigBee communication protocol for data transmission. Low transmission rates and cost, high energy efficiency and security, and dedicated machine-to-machine (M2M) communication are the fundamental characteristics of ZigBee. The system obtains temperature, humidity, carbon dioxide concentration, motion, and alarm status data. Data are stored in a database using the MQTT protocol. Sensor data can be viewed on a mobile device in real time, and the system can be remotely controlled. Figure 1 illustrates the system architecture of the proposed home monitoring system. According to the network architecture of the system, the proposed architecture can be divided into three parts: (1) sensors that use the ZigBee communication protocol to communicate with a gateway; (2) a gateway that performs data integration and preprocessing; (3) a server that controls the sensors and transmits data to an app.
Figure 2 depicts a flow chart of the operation of the proposed home monitoring system. Briefly, sensors transmit data to the gateway by using the ZigBee communication protocol, which performs packet analysis, comparison, and confirmation for accuracy. The received data are analyzed and sent to the server by using the MQTT communication protocol. Data are transmitted over wired or wireless networks. Node-RED (https://nodered.org/#:~:text=Node-RED%20is%20a%20programming%20tool%20for%20wiring%20together,be%20deployed%20to%20its%20runtime%20in%20a%20single-click) is a programming tool that helps wire together different devices and online services in new and interesting configurations. Node-RED receives sensor data and stores data on the server. An app displays sensor data by using the MQTT protocol. Sensors are controlled using the hypertext transfer protocol. Server virtualization technology is used to allocate resources using a kernel-based virtual machine (KVM) module. The Linux kernel system is endowed with the capabilities of a virtual machine hypervisor. The overall relational architecture of the KVM (kernel-based virtual machine), QEMU (quick emulator), and libvirt development interfaces adopted in this study integrates these program interfaces through the Linux virtualization functionality. The QEMU virtualization software (https://www.qemu.org/), combined with the KVM module, provides hardware acceleration capabilities. Additionally, the libvirt software (https://libvirt.org/) interface is used to manage virtualization functions, achieving integration in the IoT development interface. The server maintains and runs a database and an MQTT broker. Node-RED is used to store and transmit the data. The app displays the status of fans and light-emitting diodes [6] and is used to remotely control sensors. Data are used to train the system. The processing results are returned to the database and displayed in the app.

2.1. Zigbee Communication Protocol

The ZigBee communication protocol was developed by Honeywell [7]. The protocol saves power, is cost-effective, supports large network nodes and multiple networks, and is fast, stable, and secure. The technology used by ZigBee is based on the Institute of Electrical and Electronics Engineers 802.15.4 communication protocol standard, which specifically defines the relevant network architecture for the physical layer and the media access control layer. The ZigBee specification further enhances security by designing additional measures in the upper layers, complementing the IEEE standard. Zigbee and other IEEE 802.15.4-based wireless personal area networks are vulnerable to various security threats and attacks. The IEEE 802.15.4 specification provides security services, such as data confidentiality, message integrity, and protection against replay attacks. The keys used in ZigBee security include master keys, link keys, and network keys. Zigbee has significant potential for deployment in wireless sensor networks and the Internet of Things. The ZigBee Alliance has additionally formulated the network layer and application layer. The ZigBee network supports three frequency bands: 2450 (worldwide), 915 (United States), and 868 MHz (Europe). The features of ZigBee include ultra-low power consumption with low data rate transmission, fewer compatibility issues with devices and platforms, and support for encryption and authentication protocols. Table 1 presents a summary of the international frequency bands of the ZigBee communication protocol. The 2.4 GHz band is a free frequency band specifically designated for industrial, medical, and scientific research purposes (ISM band). It can be used without the need for an application or licensing.

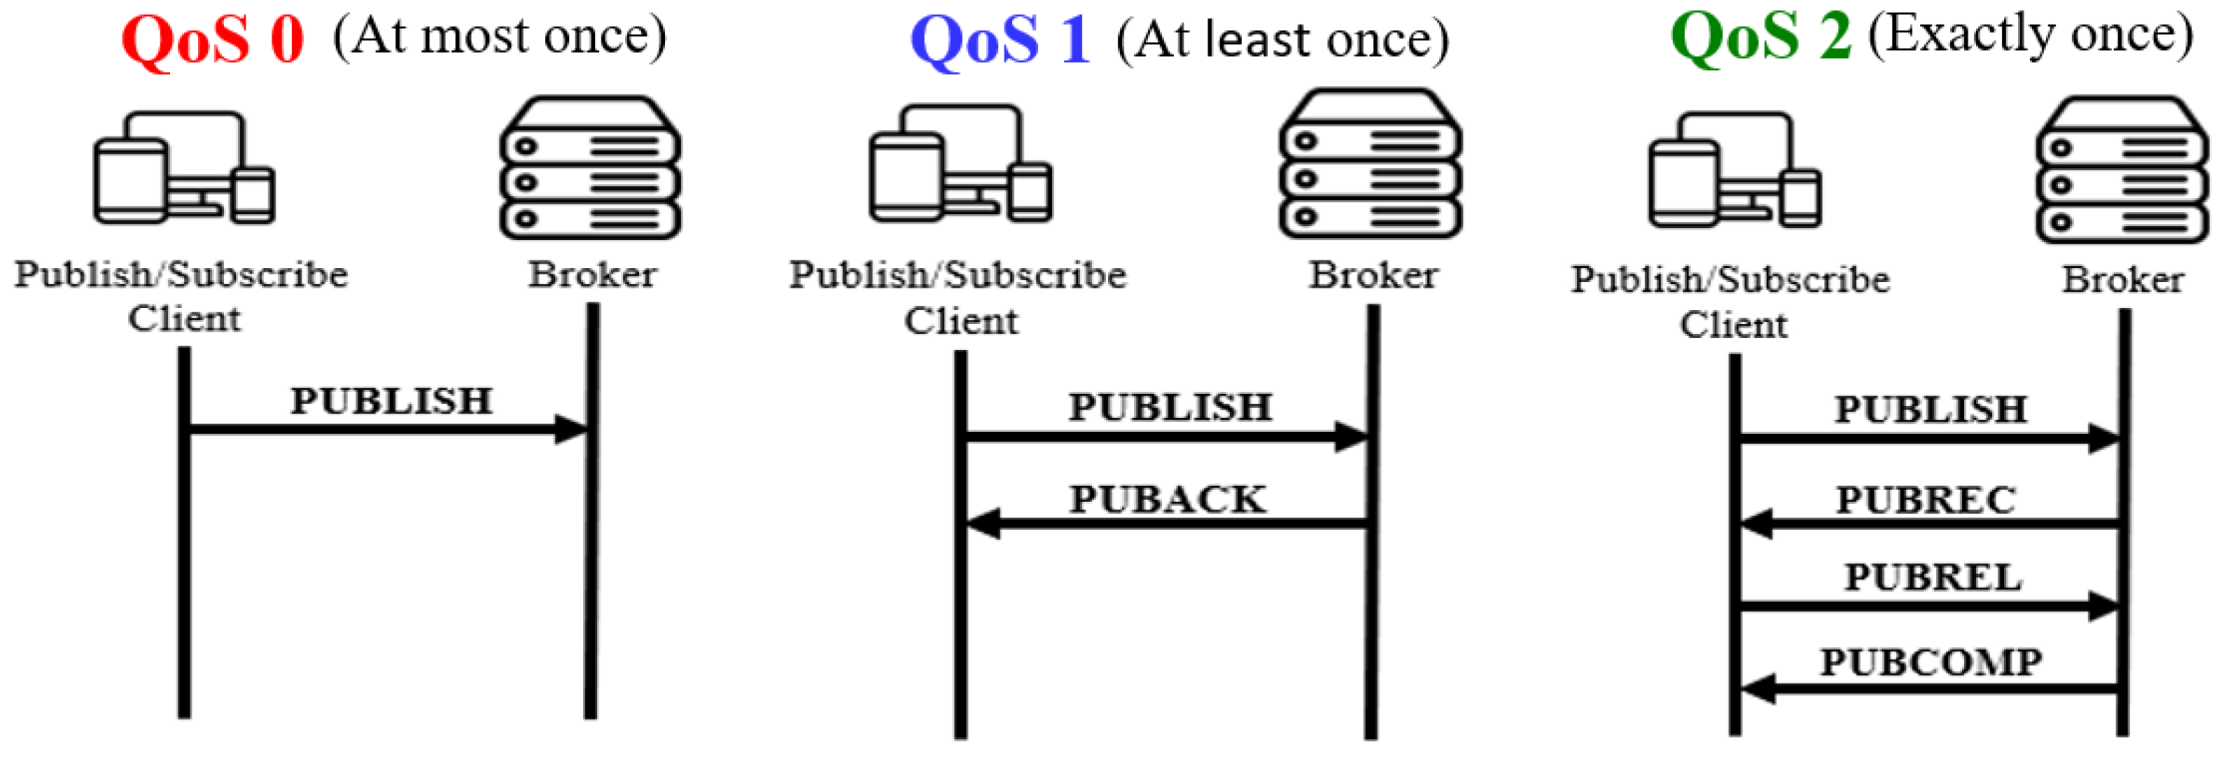
2.2. MQTT Communication Protocol

MQTT clients are very small and require minimal resources, making them suitable for use on small microcontrollers. MQTT message headers are designed to be small, optimizing network bandwidth. MQTT enables messaging between devices and the cloud. It can scale to connect with millions of IoT devices. Many IoT devices rely on unreliable cellular networks. MQTT simplifies encrypting messages using SSL and authenticating clients with modern authentication protocols. MQTT is an extremely portable communication protocol based on the transmission control protocol/internet protocol. MQTT uses a publish/subscribe operational mode. If a received service is initiated, the subscriber subscribes to the topic of the message through the MQTT broker. The publisher is responsible for sending the message, publishing it along with information on the topic to the MQTT broker, and, finally, publishing it to the subscriber [8]. In addition to these publishing and subscribing functions, the MQTT protocol also provides messaging services, which are classified into three types based on the quality of service (QoS): QoS 0, QoS 1, and QoS 2 [9]. The proposed home monitoring system uses the QoS 0 messaging service, namely “at most once”. From the perspective of the subscriber, this service may entail the missing of messages or repeated delivery. According to the seven layers of network communication, the MQTT protocol belongs to the application layer, whereas the packet is handled by the next layer (transmission control protocol). However, the MQTT protocol cannot confirm that the network is successfully connected in the lower layer. Accordingly, such a service is well-suited for environmental monitoring because the correct delivery of transmitted data is not required. The features of MQTT include lightweight message headers, high fault tolerance, low power consumption, support for large-scale concurrent connections, high cross-platform compatibility, and firewall-friendliness. However, it lacks a user management interface and does not support group communication or group management. Figure 3 illustrates the three types of QoS for the MQTT protocol.

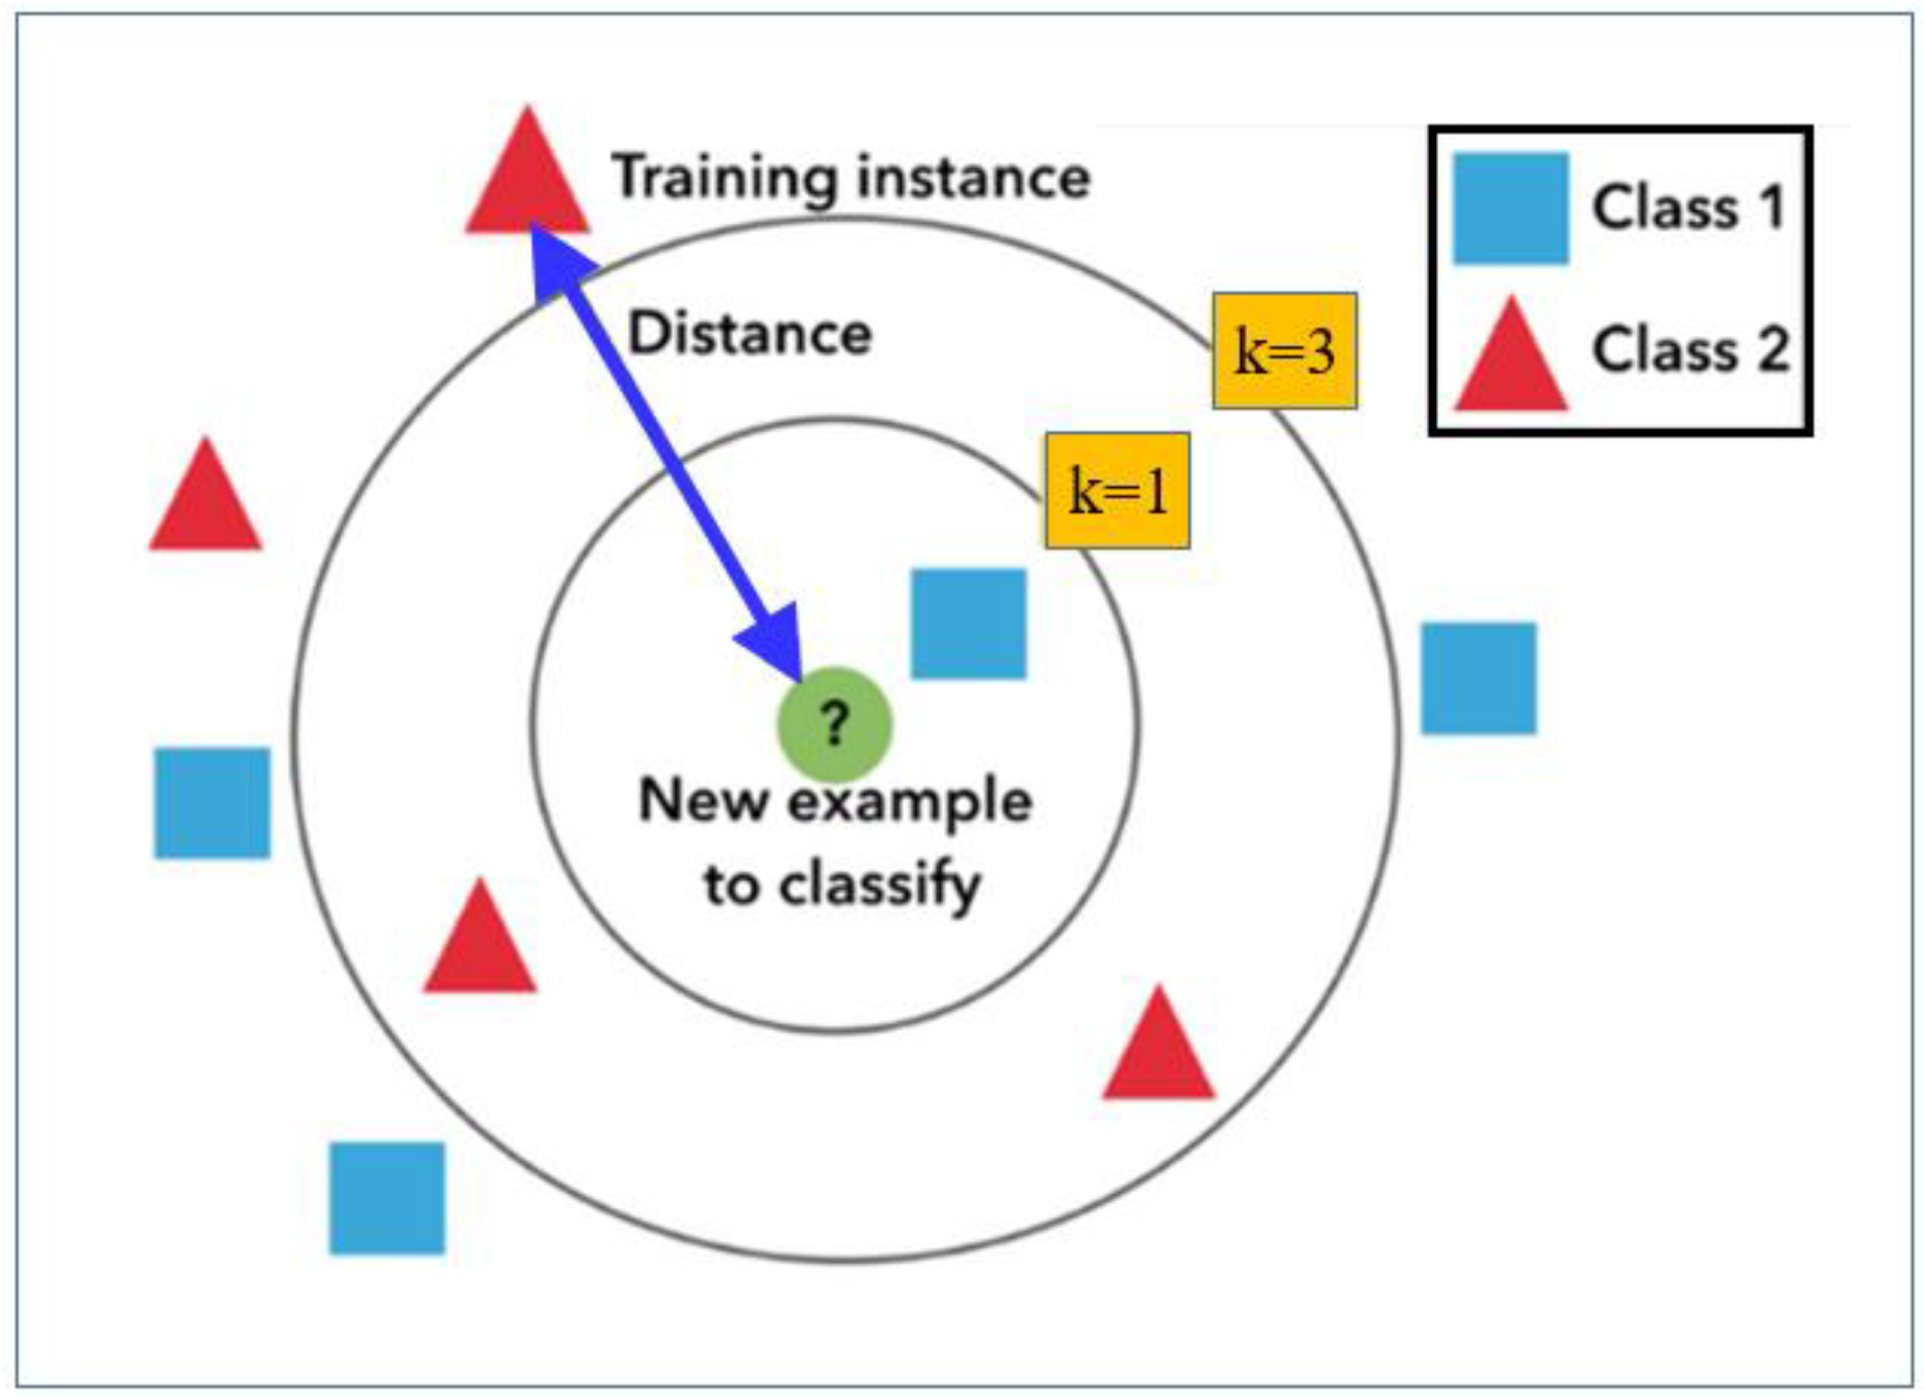
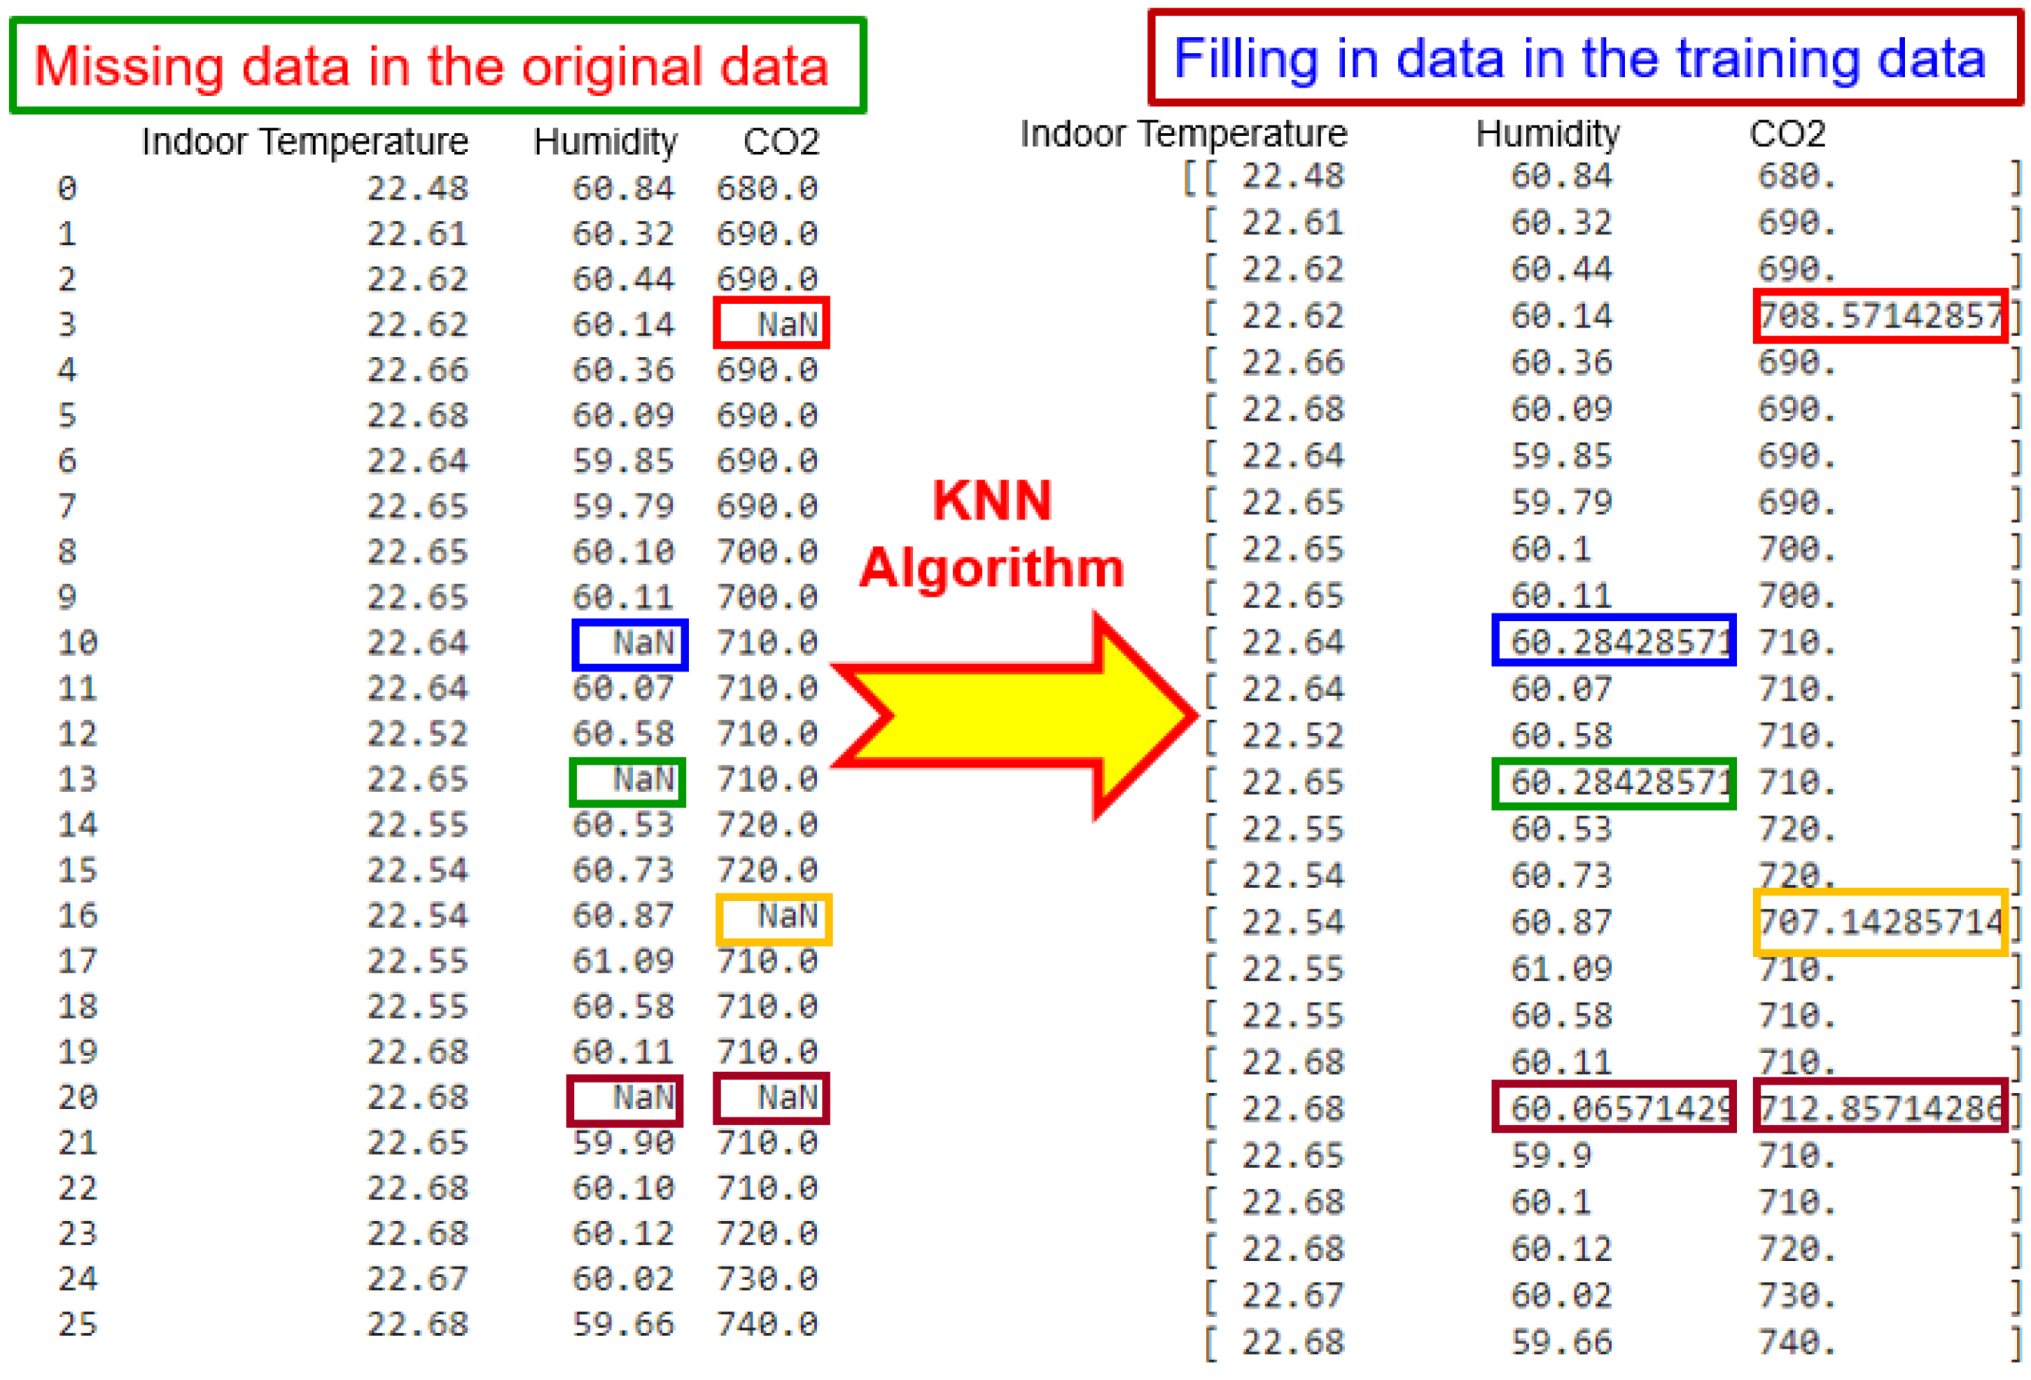
2.3. K-Nearest Neighbor Algorithm

Although the packet rate is low (a few packets per minute), the transmission period should be as short as possible because multiple sensors are operating and collecting data simultaneously. Despite its large size, the sampling data do not cause congestion or exert a burden on the server. The network connection’s status needs to be confirmed to ensure that the sensors are operating without power loss at the interface. If the transmitted data are lost, the sensor data must be repaired to compensate for the missing data. The k-nearest neighbor (KNN) algorithm is a simple method that can be applied to datasets requiring high precision, as it achieves highly accurate predictions. During the training phase, the entire dataset is utilized. Whenever missing values need to be predicted, the algorithm searches for the k most similar data points within the dataset. It then calculates the selected k-nearest training data points as the neighbors of the missing data. Finally, the data point that occurs most frequently among these k neighbors is used as the predicted value for the missing data. The k-nearest neighbor (KNN) algorithm was used to restore missing data [10]. Figure 4 depicts a schematic of the KNN algorithm with Manhattan distance.
As shown in Figure 4, a new test sample to be classified is represented by a green solid circle placed at the center of two concentric circles. For the scenario where k = 1, the inner circle encloses only one blue square sample, representing Class 1. Therefore, the KNN algorithm classifies the green test sample () into the same class as the blue square sample (), namely Class 1. For the scenario where k = 3, the outer circle encloses two red triangle samples, representing Class 2, and one blue square sample, representing Class 1. Therefore, the KNN algorithm classifies the green test sample () into the same class as the red triangle sample (), namely Class 2. When k = 3, the nearest neighbor is the red triangle sample because there are two red triangle samples and only one blue square sample within the outer circle (k = 3). Numerous unrelated samples will be included in the analysis if the selected value of k is too large. According to the example illustrated in Figure 4, four blue square samples and four red triangle samples will be considered if k > 3. The optimal k value to be used can be determined by comparing the training set with the test set.

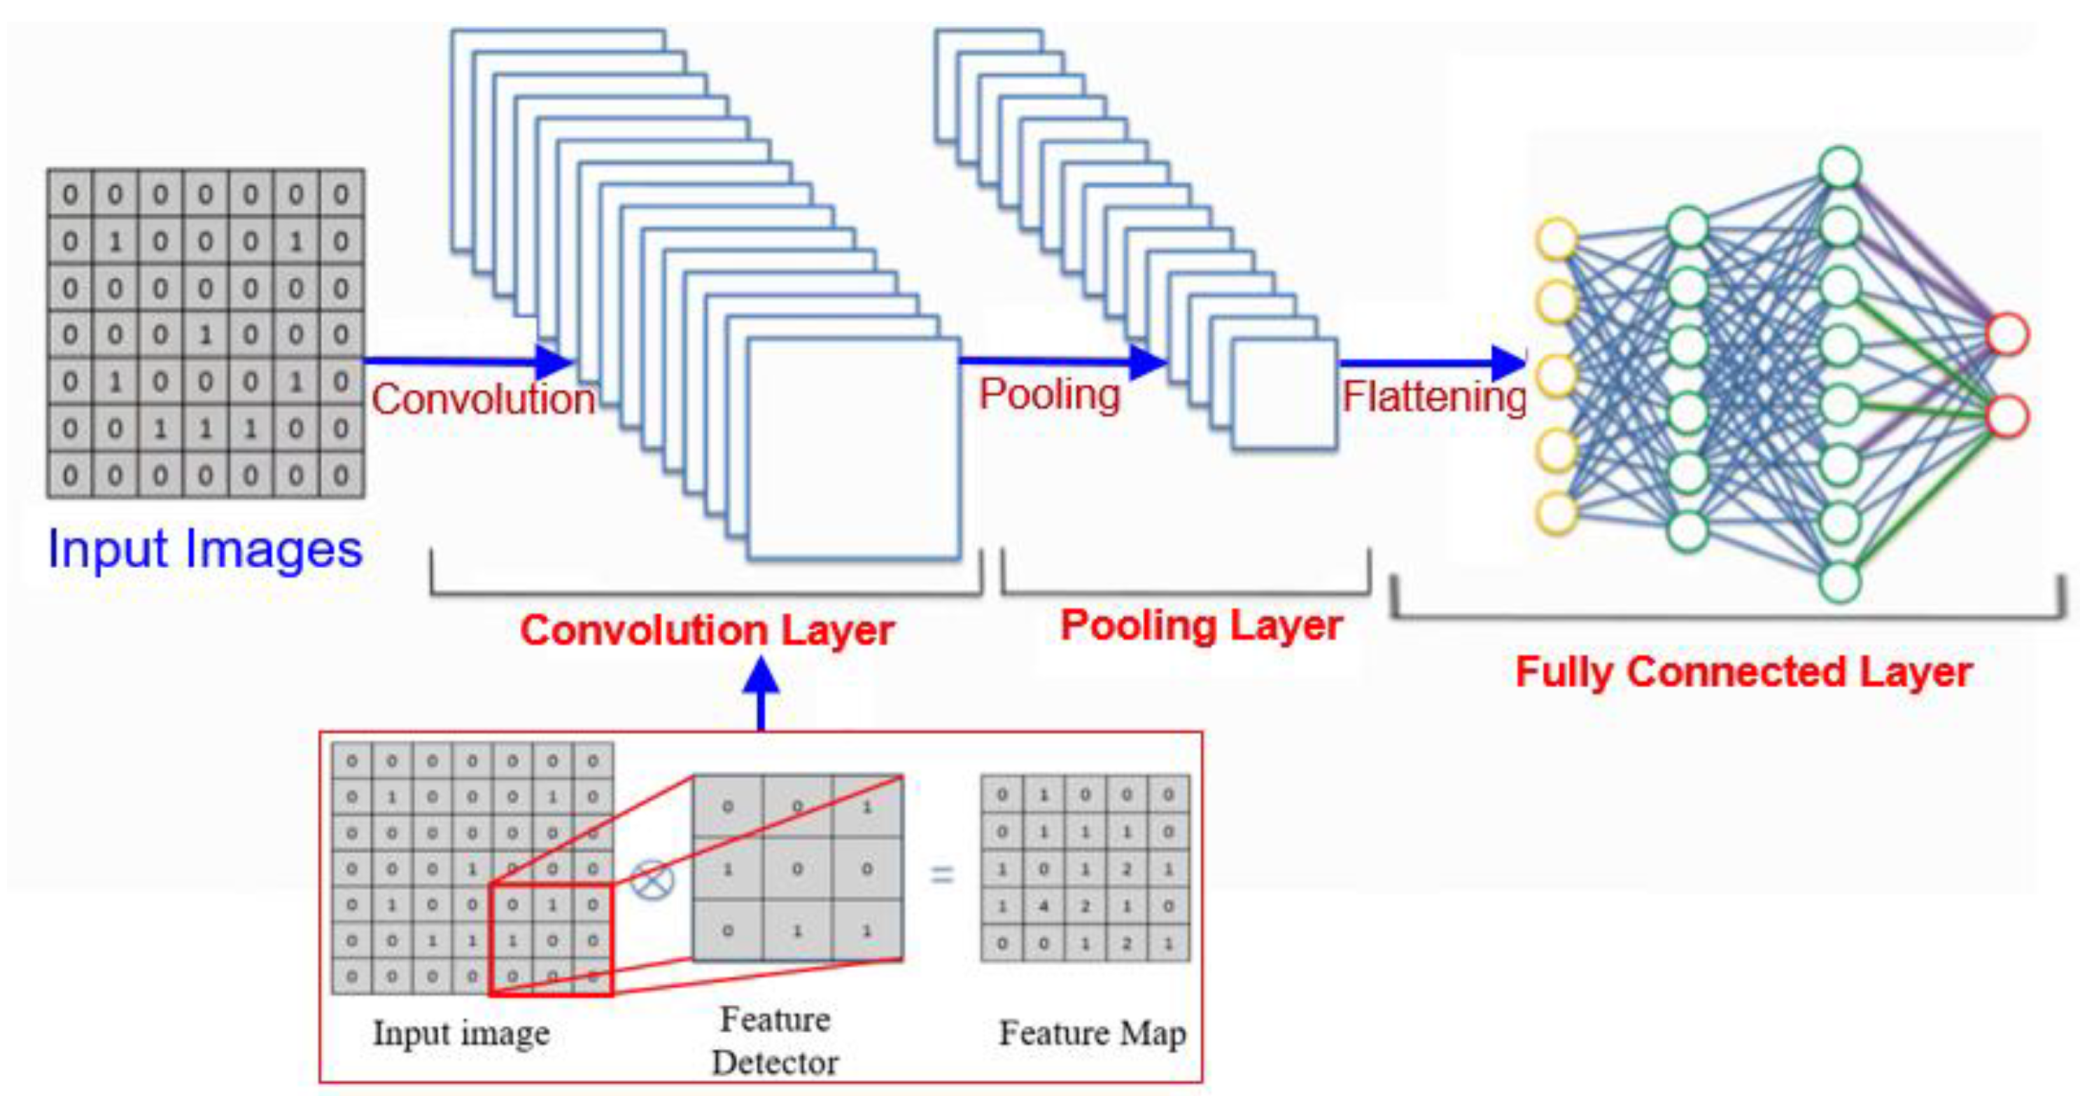
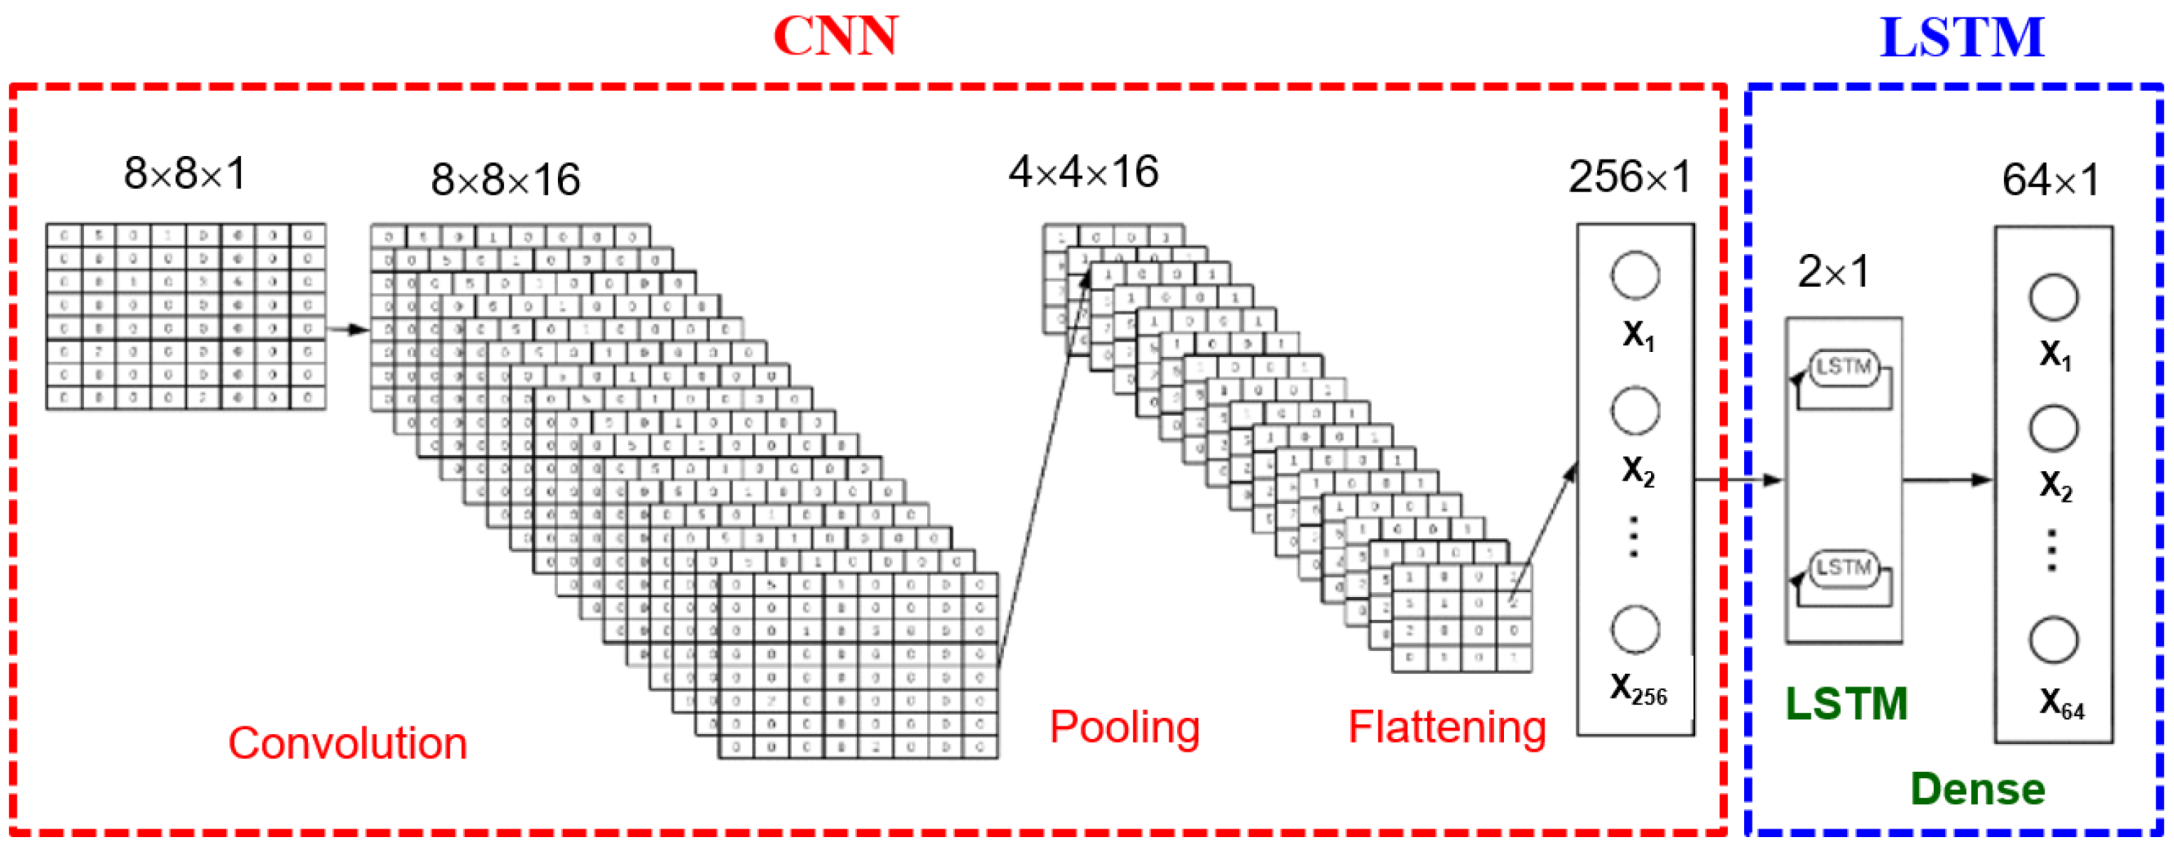
2.4. CNN and LSTM Models

Thermal conformance has recently become a crucial index by which users evaluate home systems. In this study, the collected sensor data were used to train and validate the temperature prediction model established using deep learning techniques [11]. CNNs are specialized neural networks designed for processing structured grid data, such as images. They use convolutional layers to detect features and are highly effective at handling spatial data with minimal preprocessing. However, CNNs are computationally intensive and require large amounts of labeled data for training. They are best suited for applications involving spatial data, such as image processing. The first model used for temperature prediction was a CNN comprising a convolution layer, pooling layer, and fully connected layer [12]. In the convolution layer, the convolution operation convolves the original data with multiple randomly generated filters to extract feature values from the data. After convolution is complete, an activation function is introduced to perform a fitting operation on the data before sending it into the pooling layer. In the pooling layer, the computational load is reduced by averaging the original data to retain crucial features or by executing a maximization process to obtain eigenvalues of dimensionality reduction. Max pooling is primarily used, serving as a good anti-noise function. In the fully connected layer, the output from the max pooling operation is flattened before being input into subsequent parts of the neural network. Figure 5 presents the system architecture of the CNN used in this study.
LSTMs are a type of RNN specifically designed to learn long-term dependencies and retain information across longer sequences. They effectively address the vanishing gradient problem and excel at capturing long-term dependencies in sequential data. However, LSTMs are more complex than standard RNNs, are computationally intensive, and require careful tuning of hyperparameters. They are ideal for processing sequential data that requires handling long-term dependencies. The second model used for temperature prediction was the LSTM network, which is a special recurrent neural network [13,14]. Figure 6 shows the adopted LSTM model. The LSTM network can learn and retain memory tasks over a longer duration compared with traditional recurrent neural networks. It can solve the problem of gradient explosion and disappearance during the long-term memory training process. Figure 6 illustrates the LSTM network used in this study. The network comprises an input gate, an output gate, and a forget gate.
f t = σ W f h t 1 , x t + b f
i t = σ W i h t 1 , x t + b i
C ˜ t = tanh W c h t 1 , x t + b c
C t = f t × C t 1 + i t × C ˜ t
O t = σ W o h t 1 , x t + b o
h t = σ t × tanh ( C t )
where xt, ft, it, C ˜ t , Ct, Ot, and ht represent the input, forget gate, input gate, cell update, cell state, output gate, and output, respectively, at time t. W and b represent the weight and bias metrics, respectively [13,14].

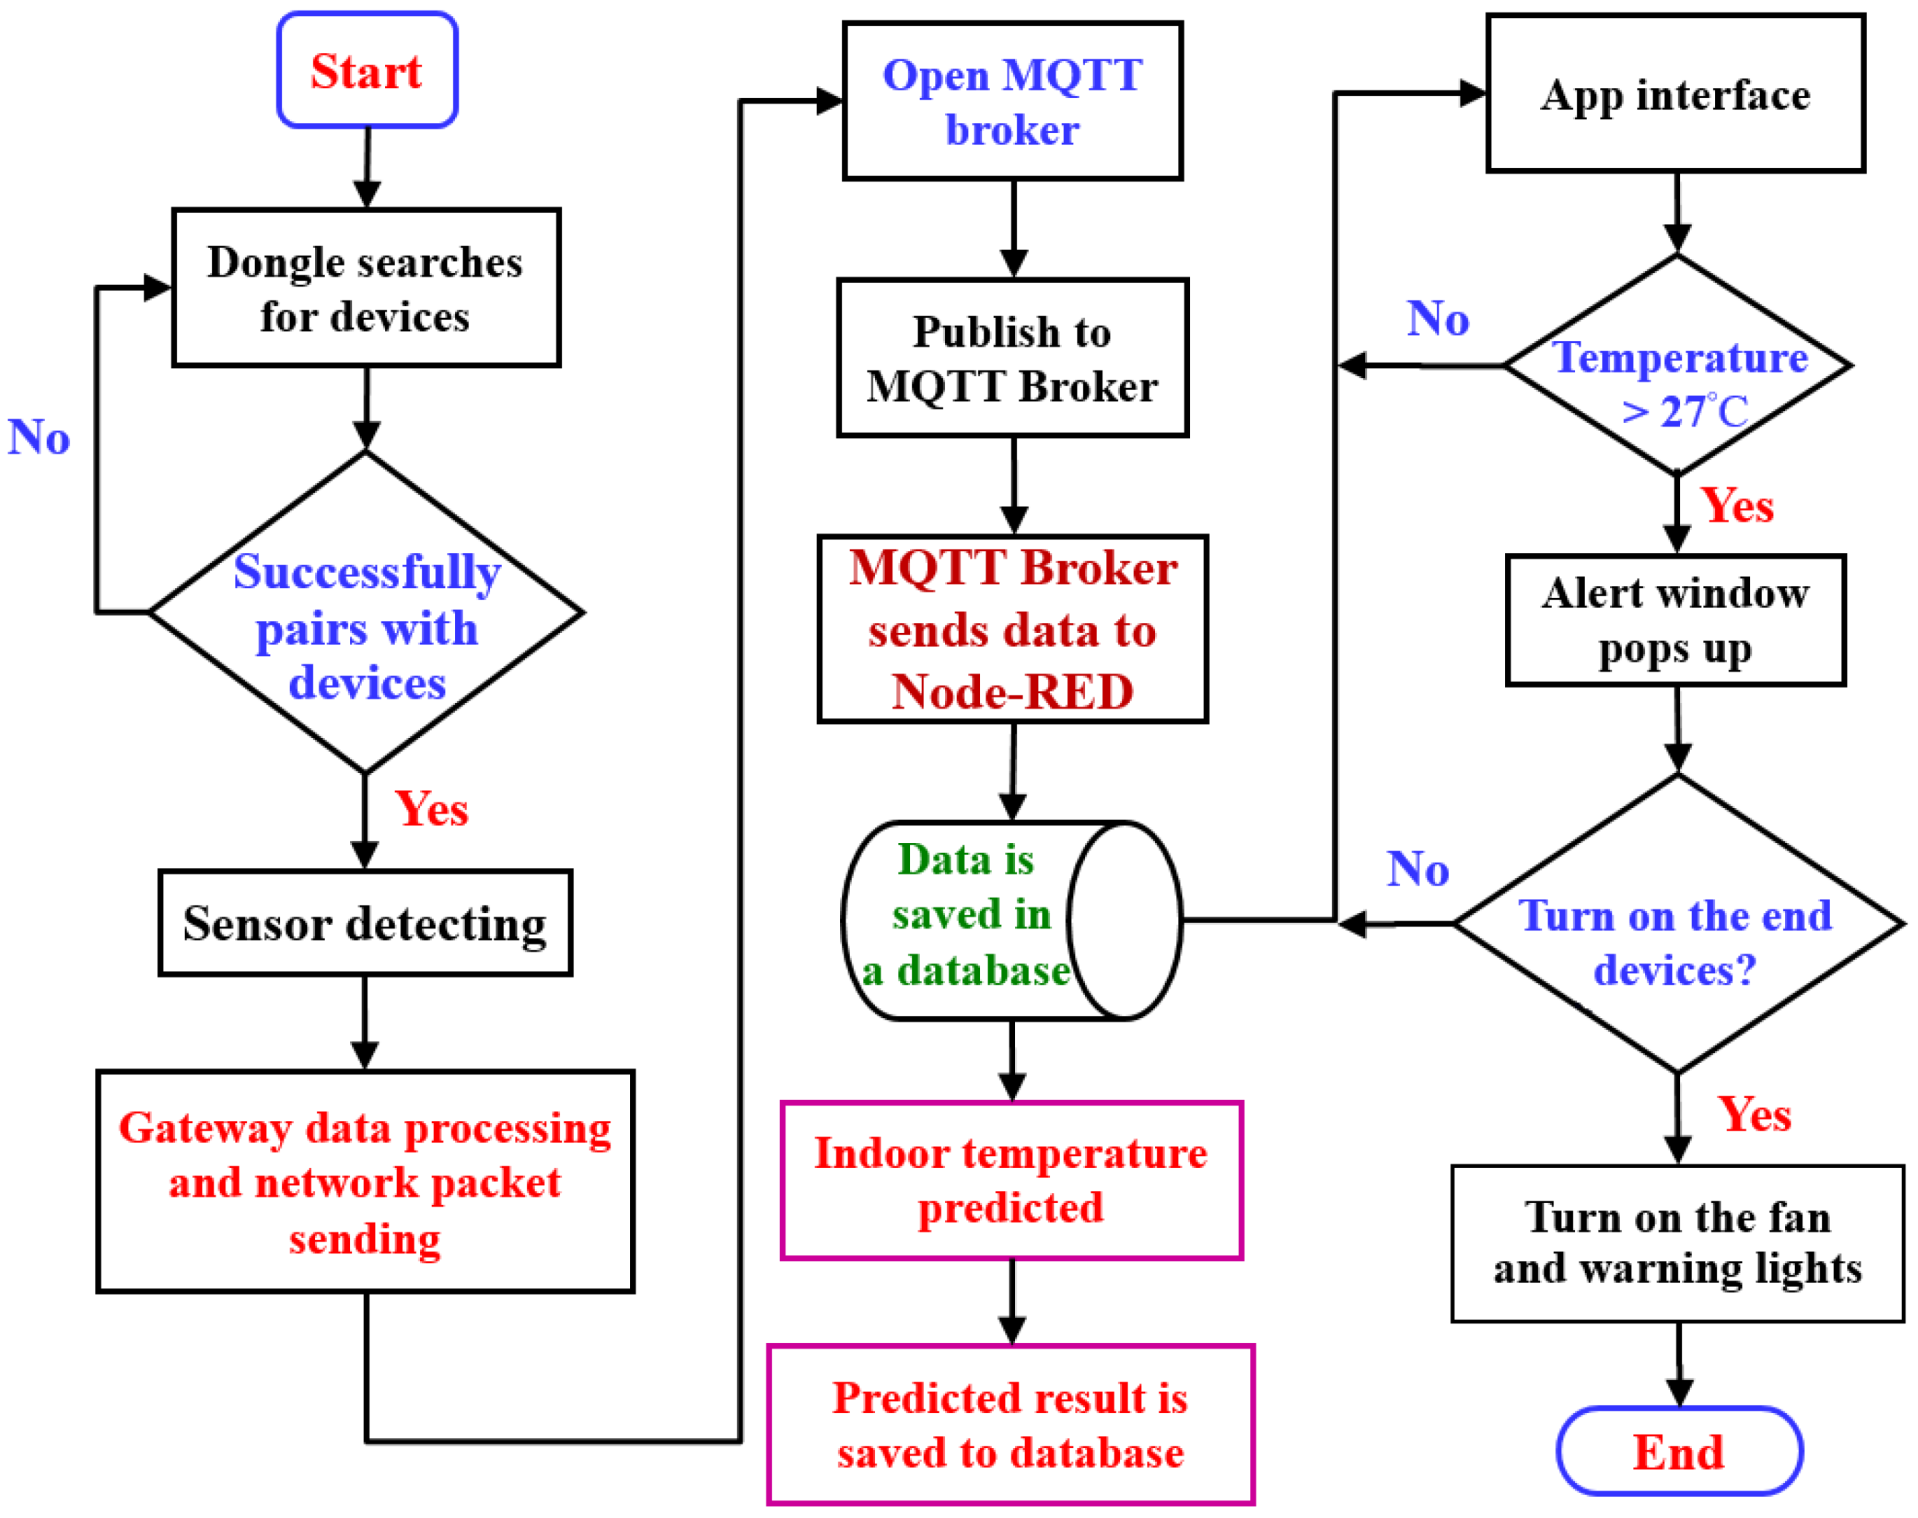
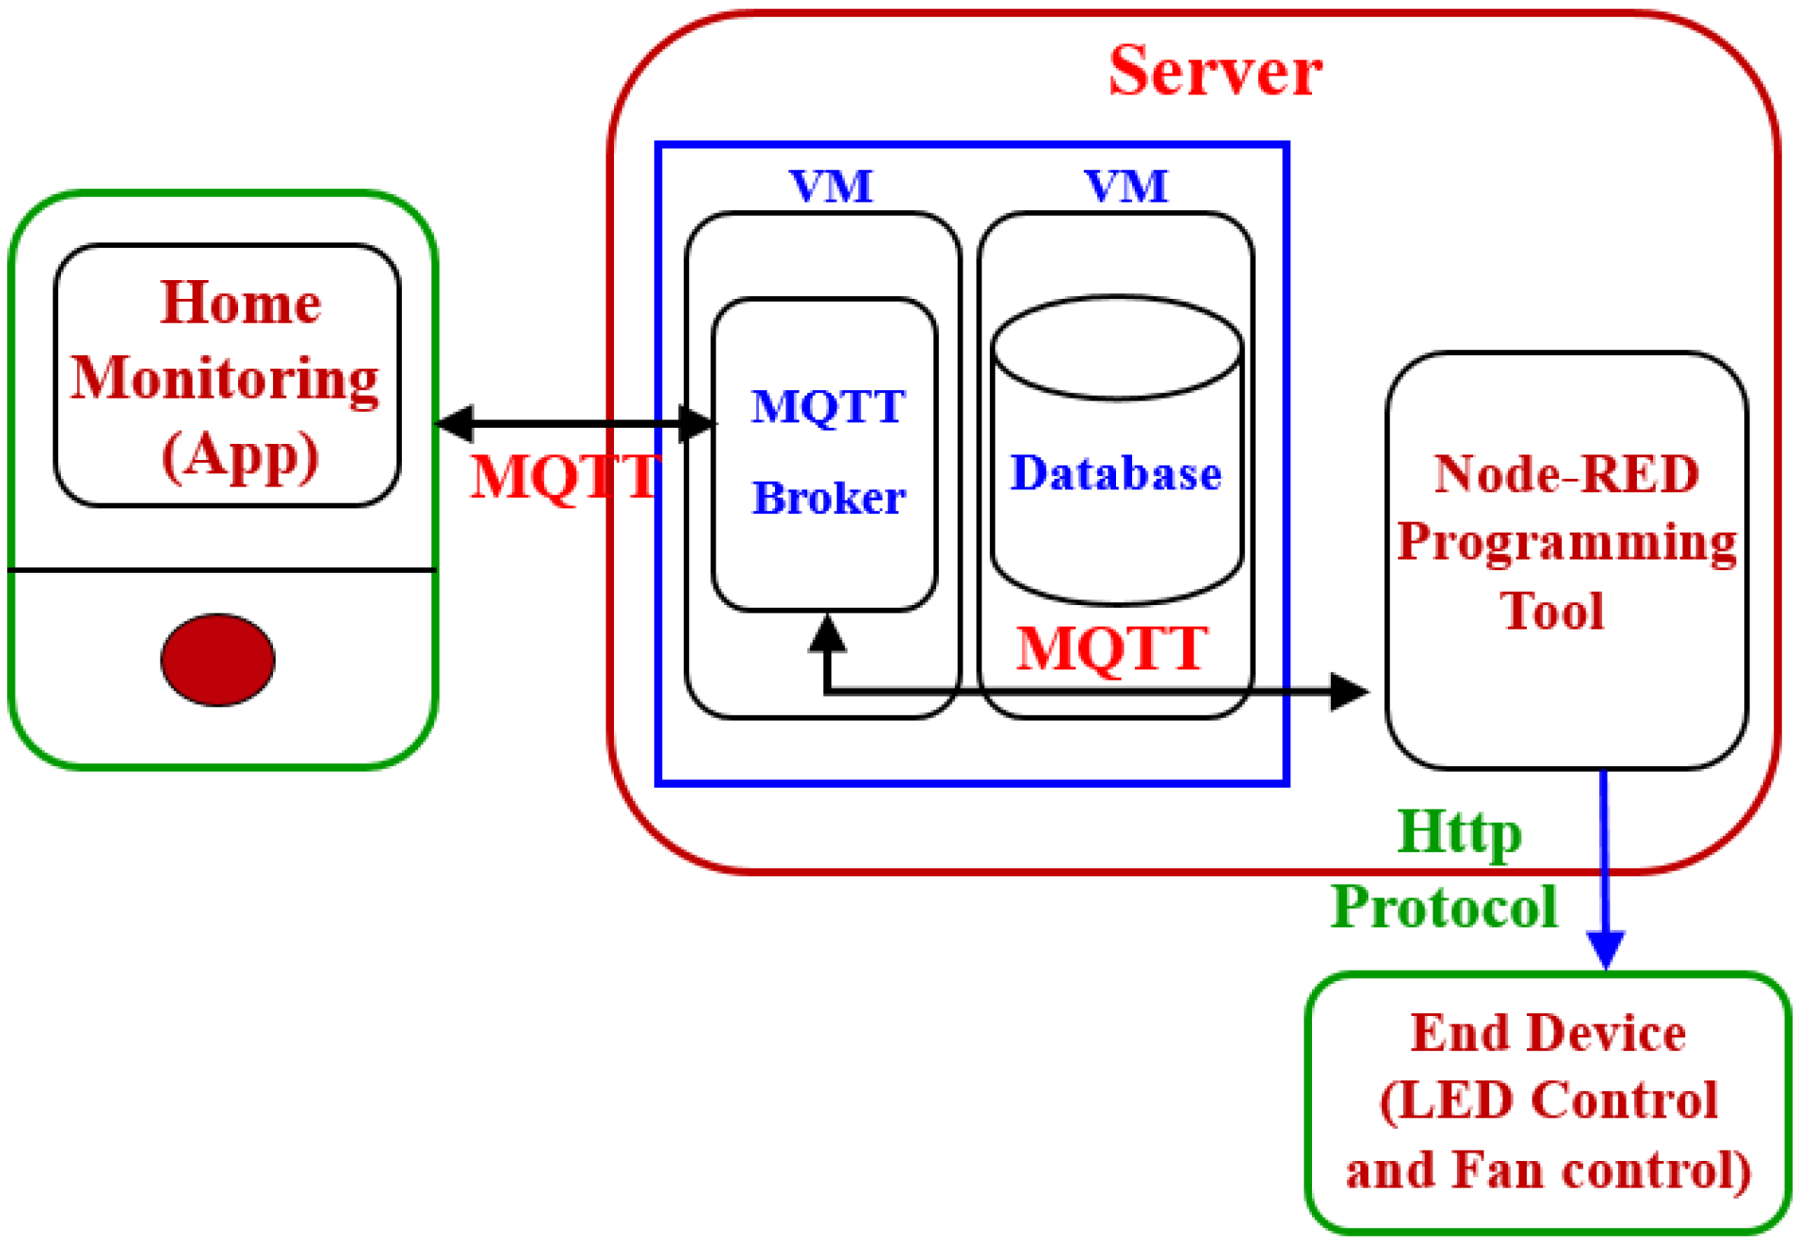
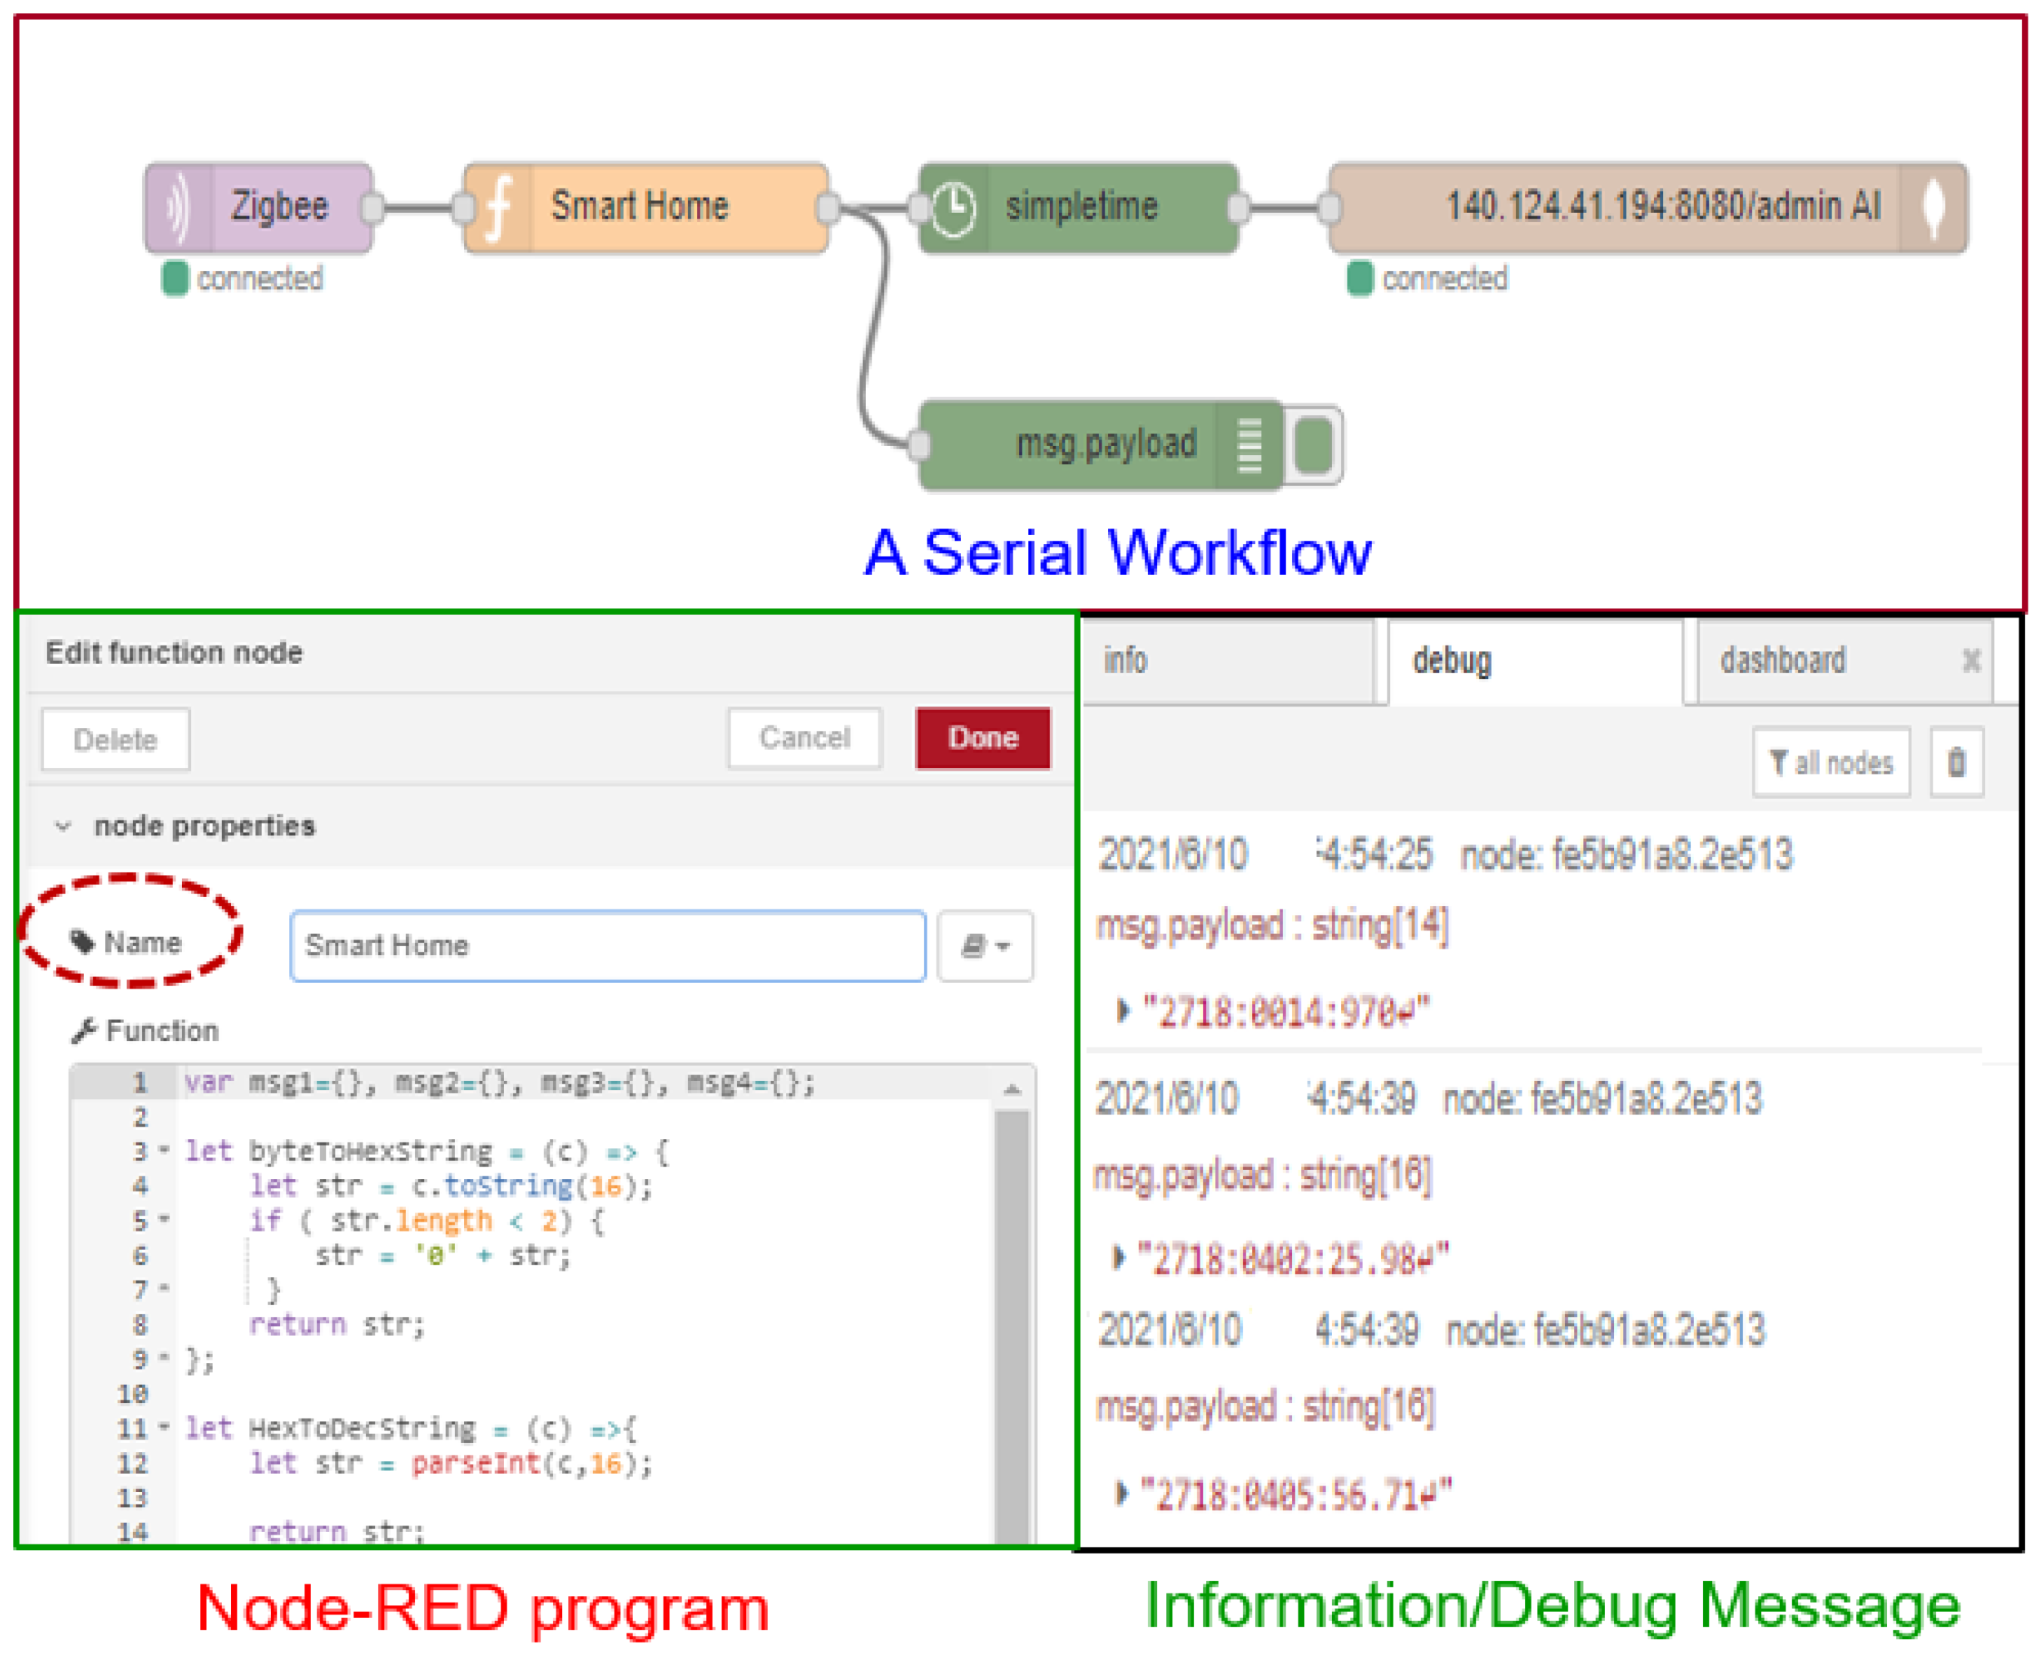
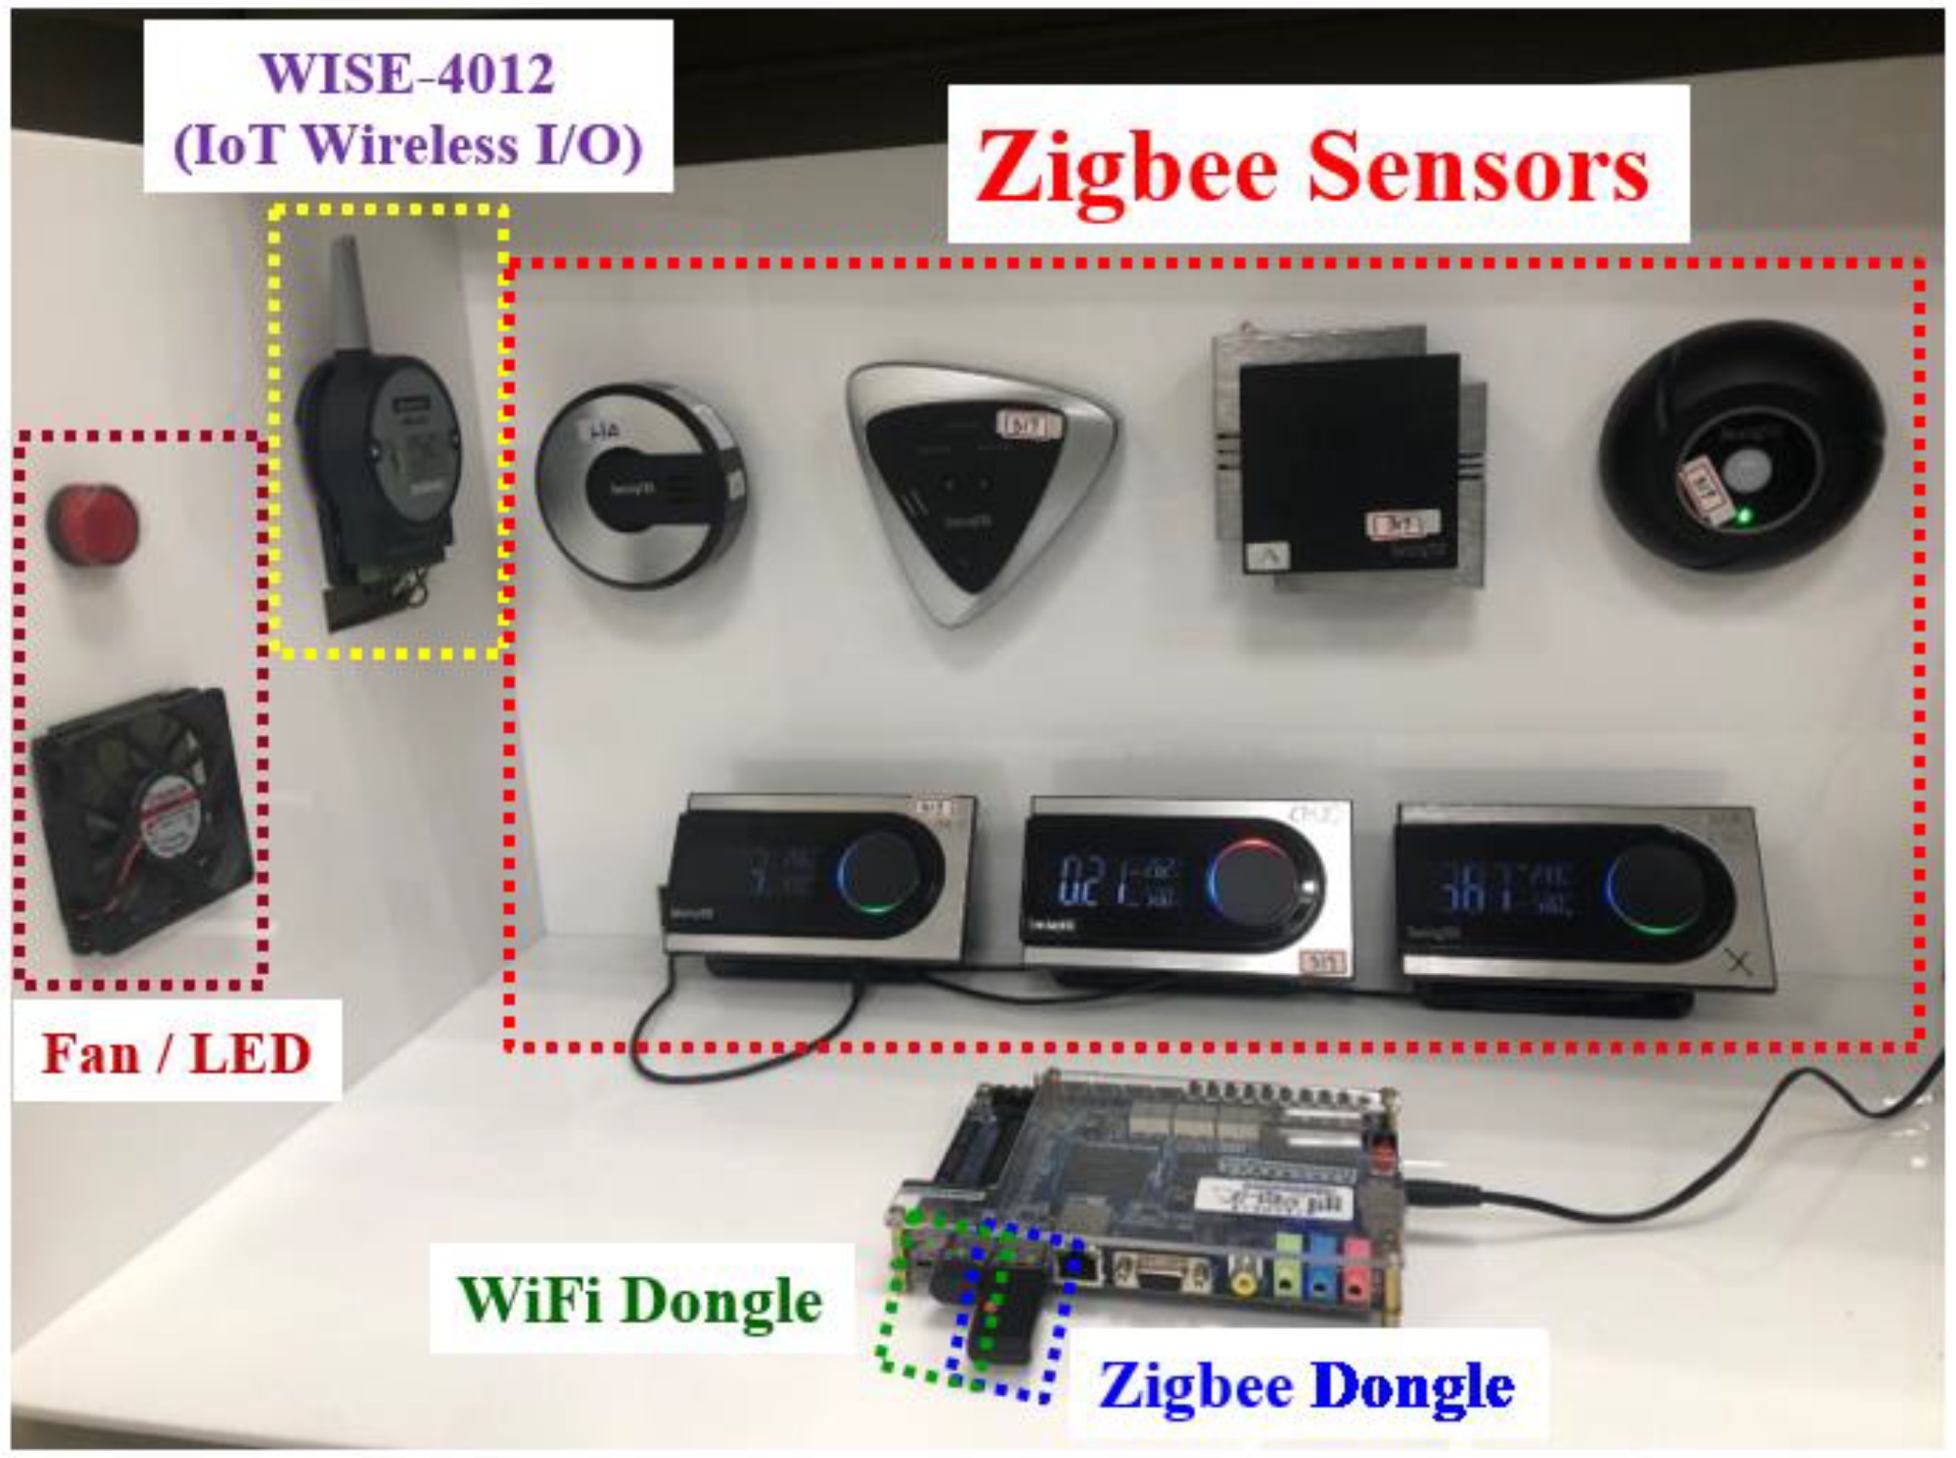
2.5. Home Monitoring System

The system monitors the surrounding environment using sensors and displays data in real time. The mobile app offers easy access to information regarding the environmental conditions inside the house. The app also offers remote functionality. The sensors obtain temperature, humidity, carbon dioxide sensor concentration, gas concentration, infrared light, and air quality data. End devices that can be remotely controlled include alarms, fans, and lights. The home monitoring system continuously accesses data stored in the database using the MQTT communication protocol. The database transmits data to end devices by using the MQTT messaging mechanism. Sensor data is transmitted to the monitoring system every minute. Figure 7 presents a schematic of the connections between the sensors, server, MongoDB database (https://www.mongodb.com/?msockid=1cc7cffd448c63a43077dac1408c6866), and mobile app. The parallel processing method of the simultaneous multithreading sequence was adopted for writing the application program. When the program runs, users can use other functions without interrupting data transmission. The user interface can also be displayed normally without causing a system malfunction.
The end devices in the proposed home monitoring system can be automatically turned on or off by comparing the received environmental data with the assigned threshold value. For example, a warning light can be activated on the mobile app to remind users that the recorded environmental data has reached the warning threshold value. Simultaneously, the monitoring system asks the user whether a particular end device should be turned on or off. Figure 8 presents a schematic of the connections between the mobile app and end devices. To control the end devices, the mobile app sends an action command to the server through the MQTT communication protocol; the server uses the hypertext transfer protocol to issue commands and remotely control the end devices [15]. The server can also automatically control the end devices or transmit the sensor data stored in the database to the mobile app to be displayed.
As shown in Figure 8, the Node-RED programming tool was used to develop the app [16] and control the end device. This tool integrates IoT devices, user development interfaces, and network services, facilitating the establishment of a serial operation for data processing, storage, and transmission, as well as end device control. The Node-RED tool adopts a serial design to write multiple functions into a node, serializing them using the design concept of a flowchart to create a workflow for processing data, controlling equipment, or sending alarms. The nodes can be written using Node.js Design. The designed nodes with different functions can be easily added or removed through the Node-RED library. Figure 9 illustrates the designed program and debug message of the Node-RED programming tool.

3. System Implementation and Verification

Seven devices (sensors) are connected to a single ZigBee network: temperature, humidity, carbon dioxide, gas, PM 2.5, PIR, and smoke sensors. However, only three sensors are considered in this study. First, the environmental data collected by the sensors are received by the ZigBee universal serial bus receiver (ZigBee dongle). The received packets are converted and sent to a wireless universal serial bus dongle, which publishes the processed packets to the local area network. Finally, the MQTT broker transfers the packets to the server. The Node-RED development software is used as an MQTT subscriber to receive processed data and store data in the MongoDB database. Data calculation and equipment control can be evaluated using the Node-RED tool. The app can issue control instructions to the Node-RED tool and execute remote control functions to end devices. The threshold value is set manually based on a rule of thumb and can be changed using the mobile app. Figure 10 illustrates the experimental environment of the proposed home monitoring system.
The ZigBee dongle receives data through the gateway terminal and completes the packet conversion. After receiving the processed data from the gateway through the MQTT node in Node-RED, the MQTT communication protocol releases the data for storage in the database. The processed data is then transmitted to the MQTT broker and the subscriber.

3.1. Data Restoration Using the KNN Algorithm

The system collects environmental data once per minute using multiple sensors that operate simultaneously. Consequently, the system collects a lot of data. Data correction is not a priority. This is the reason for selecting the QoS 0 message transmission in the MQTT protocol. Data loss can occur due to sensor malfunction and power loss. To address these problems, the KNN algorithm was selected for data restoration. First, a data value is entered, making a judgment, dealing with the missing part of the data, and filling in the “not a number” value. Subsequently, the training data are brought into the training set, and the indoor temperature, humidity, and carbon dioxide levels are set as references. The missing data are imputed, and the features of the missing data are compared with the corresponding features of data in the training set. The KNN algorithm is used to extract the most similar data from the training set (nearest neighbors), thereby restoring the missing data [17]. Figure 11 depicts the restoration operation using the KNN algorithm. The experimental results employ min–max normalization (also known as feature scaling) to reduce the impact of unrelated samples on the measured results. Min–max normalization applies a linear transformation to the original data, scaling all values to fall within the range (0, 1). By defining the minimum value Xmin and maximum value Xmax, the scaled data Xscaled is calculated using the formula (XXmin)/(XmaxXmin), where X represents the original measured data. While this approach ensures a bounded range, it also results in smaller standard deviations, which may suppress the effects of outliers.
Figure 12 and Figure 13 present two comparison line charts indicating the frequencies with which different values of humidity and carbon dioxide content were recorded/predicted. The green lines represent the original data; the red lines represent the imputed data predicted using the KNN algorithm. Among the evaluation criteria, MAPE and RMSE are commonly used evaluation formulas. MAPE is calculated by standardizing against the original value yi, meaning that the error is independent of the variation in yi. In contrast, MAE is directly influenced by the variation in yi. Additionally, if the correlation coefficient R needs to be calculated, the sample mean value of a distribution (ӯ) must first be determined, which requires additional computation time. The accuracy of the imputation was determined in terms of the mean absolute percentage error (MAPE), which can be expressed as follows [14].
M A P E = 1 m i = 1 m y i f x i max y i , ε × 100 %
where m represents the total number of times, yi represents the real data, f(xi) represents the predicted data, and ε is a small positive constant used to avoid division by zero. The xi and yi variables represent the features of the sample, such as temperature, humidity, carbon dioxide concentration, or other sensor data. The average relative errors of humidity and carbon dioxide content were calculated to be approximately 0.0415% and 0.134%, respectively.

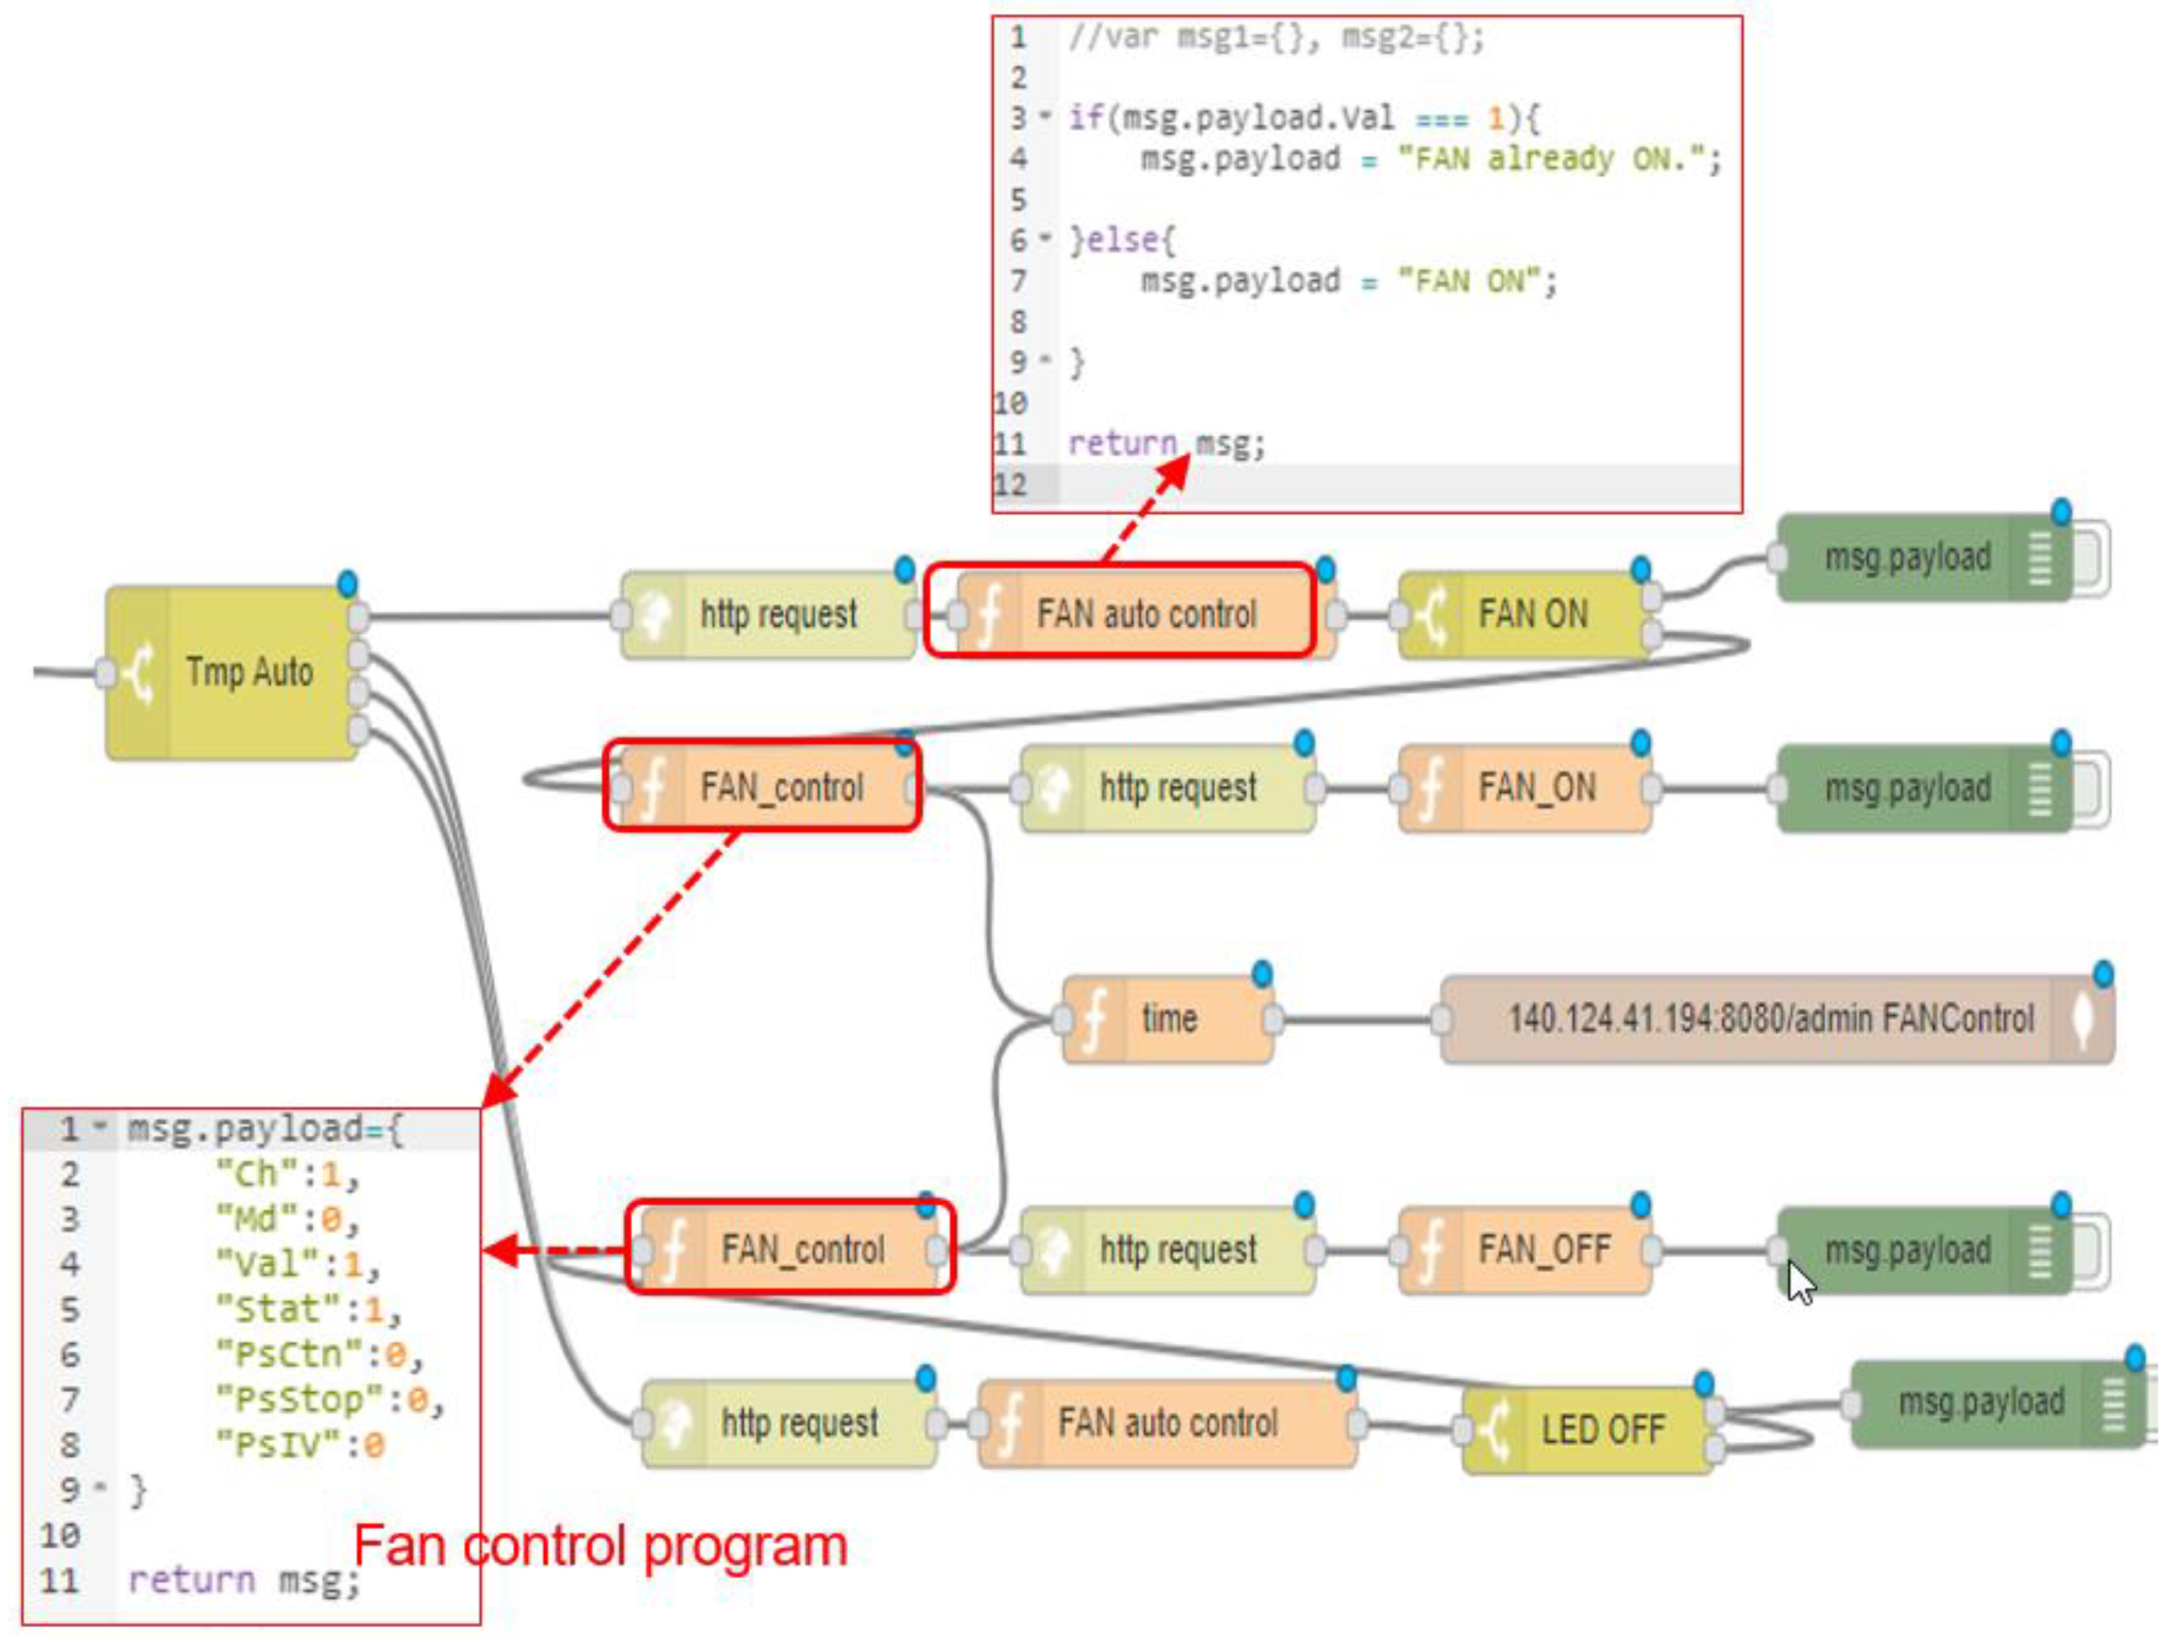
3.2. Automatic Equipment Control

An automatic control system was established by combining the indoor temperature sensor and the fan control equipment. This system was based on the indoor environmental data recorded by the temperature sensor and the judgment function in the server. In the home monitoring system, the fan automatically switches on when the indoor temperature is >28 °C and switches off when the indoor temperature is <22 °C. The indoor temperature can be set within a comfortable range using the automatic equipment control; the user does not need to manually adjust the indoor temperature. Figure 14 illustrates the complete Node-RED flow chart for automatic temperature control of the fan.

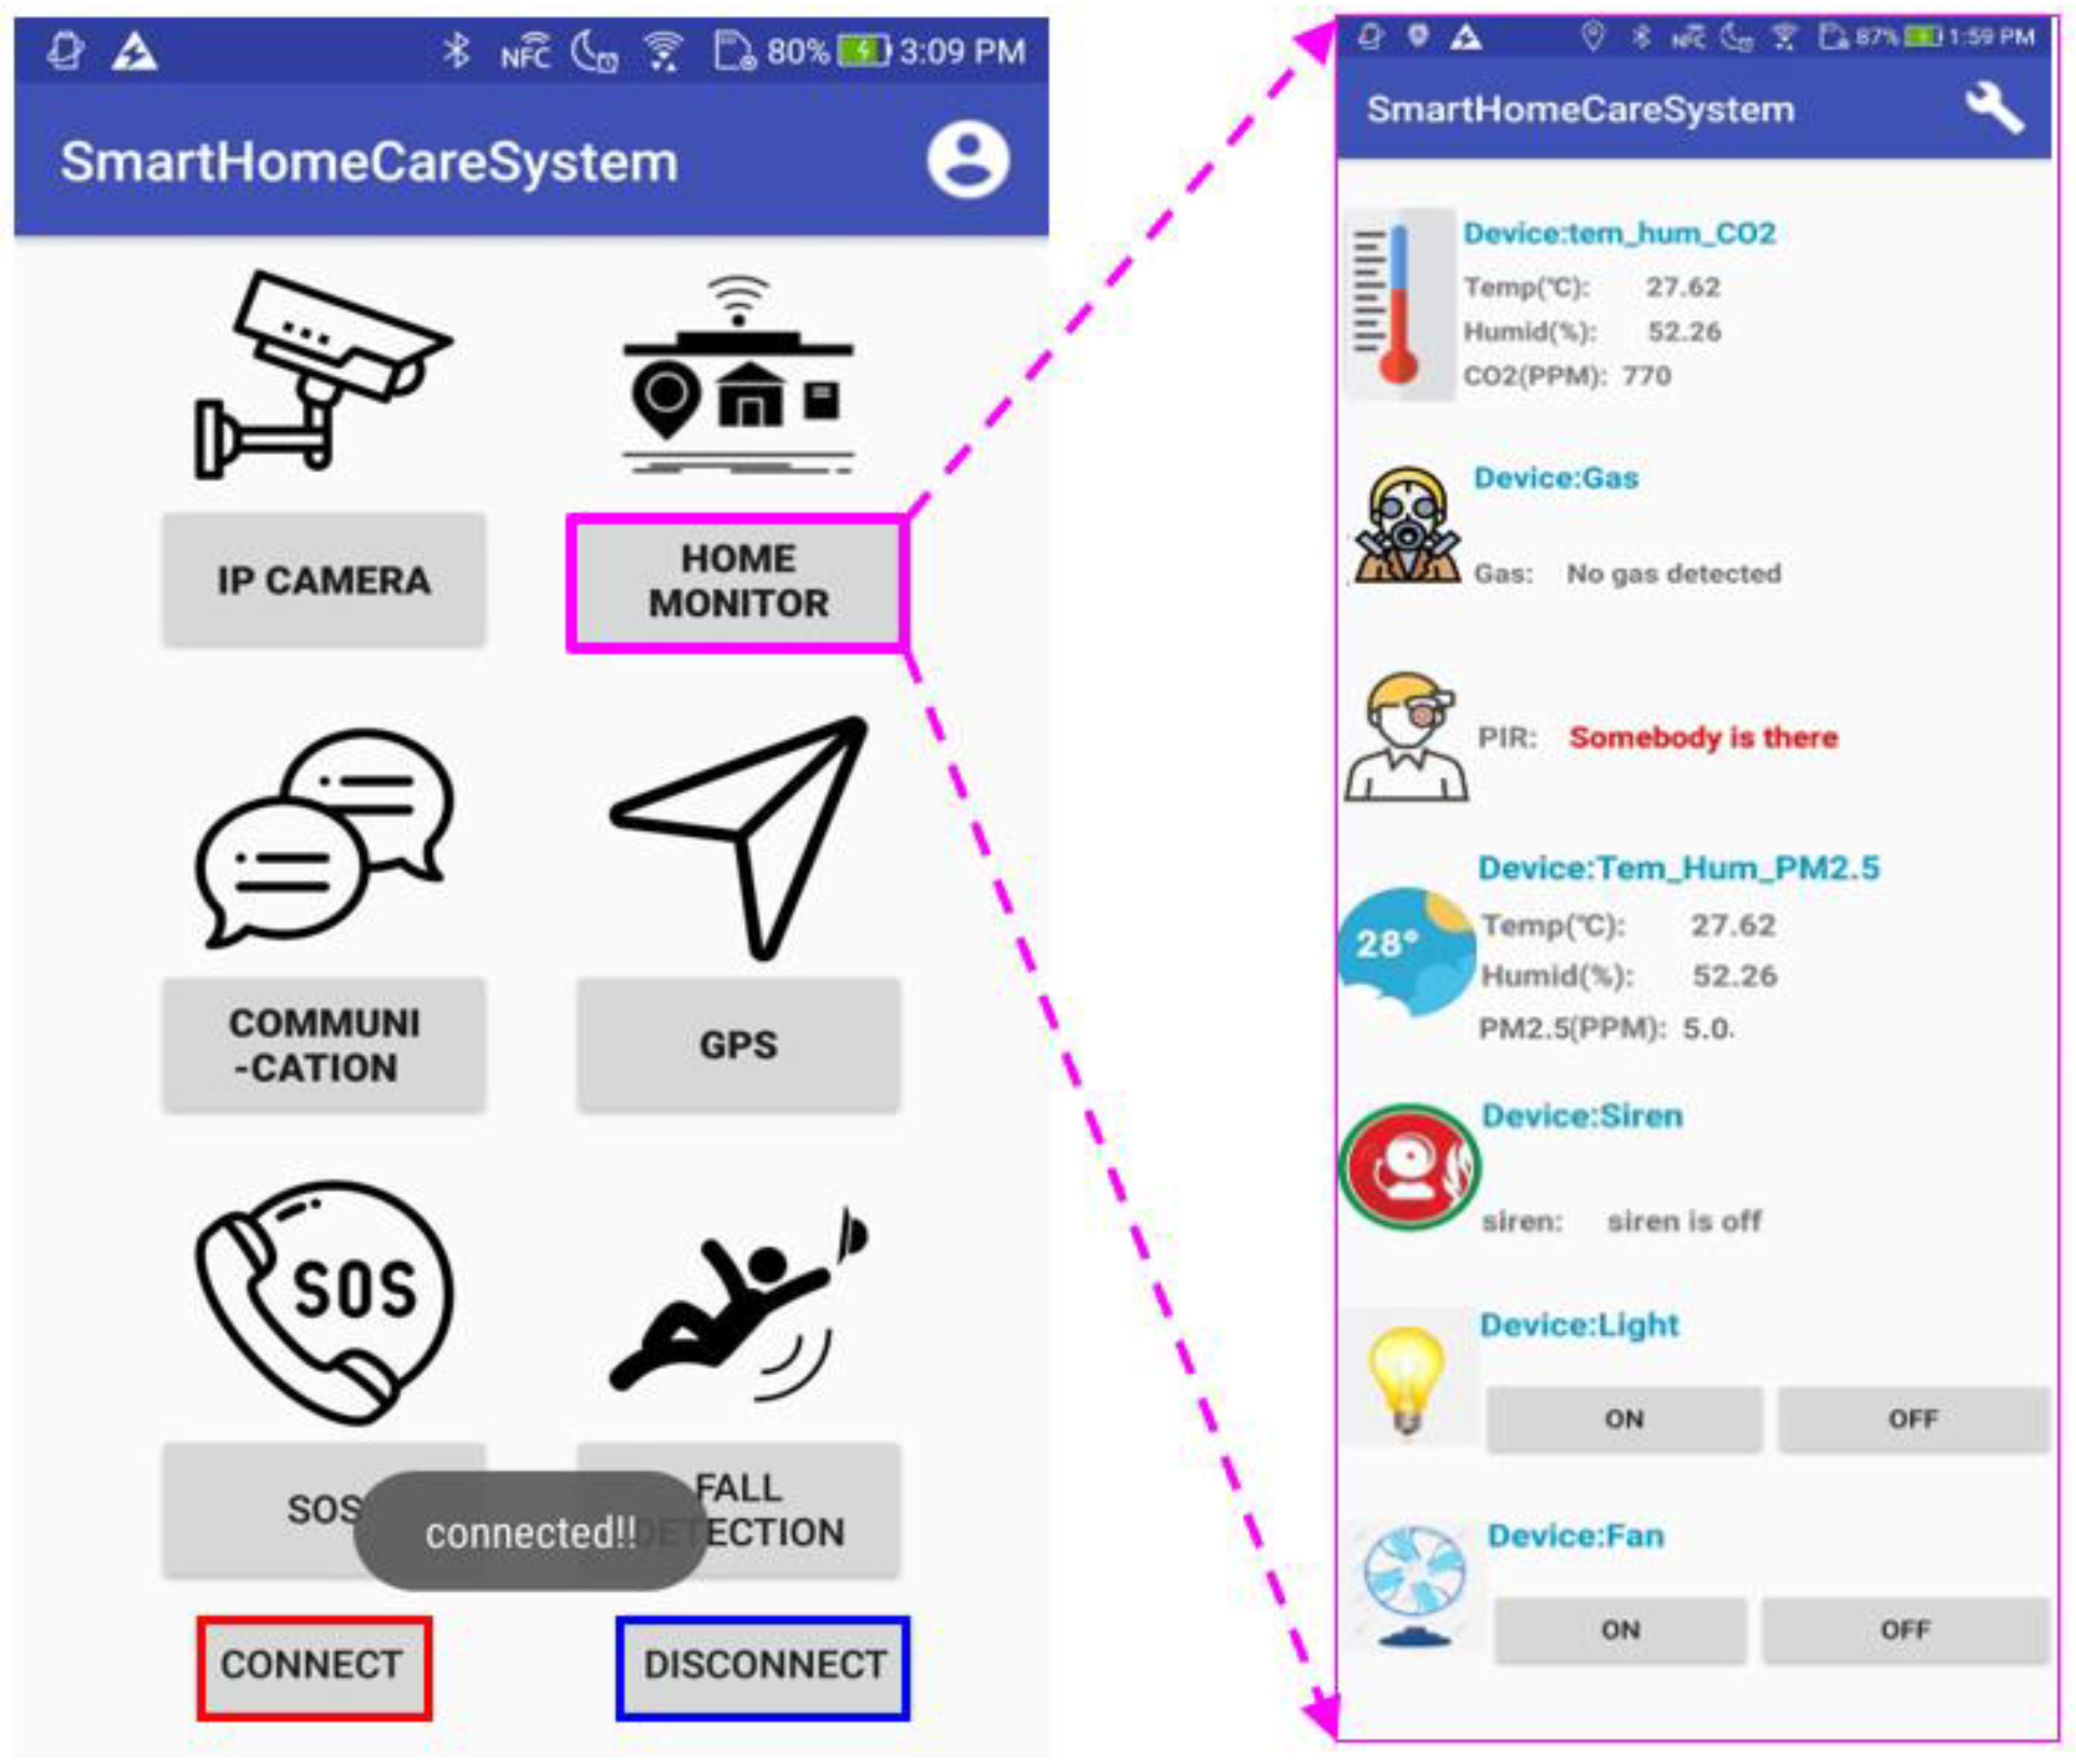
3.3. Mobile App Function

The primary function of the mobile app is to develop data linkages between mobile devices and sensors in the home monitoring system. When users open this app for the first time, they are required to register their user information. Only after registration can they proceed to log in. The registration form includes four fields: username, email, password, and password confirmation. The system will verify whether the email format is correct and whether the password matches the password confirmation. After registration, users will be redirected to the login screen. After visiting the homepage of the app, the user needs to confirm whether the app is connected to the database or not by clicking on the “CONNECT” icon found at the bottom of the homepage. If the “home monitor” icon found in the upper right corner of the homepage is selected, the app will display the status of the devices and sensor data from all the sensors connected to the gateway of the home monitoring system. Moreover, the app can remotely switch on/off the fan or the warning light. When the indoor temperature is >27 °C, the user will automatically be notified with a warning stating that the current ambient temperature is too high. The notification will ask whether the user wishes to switch on the fan. Other functions available on the homepage are “IP CAMERA”, “COMMUNICATION”, “GPS”, “SOS”, and “FALL DETECTION”. Figure 15 illustrates the designed mobile app functions available on the homepage of the home monitoring system.

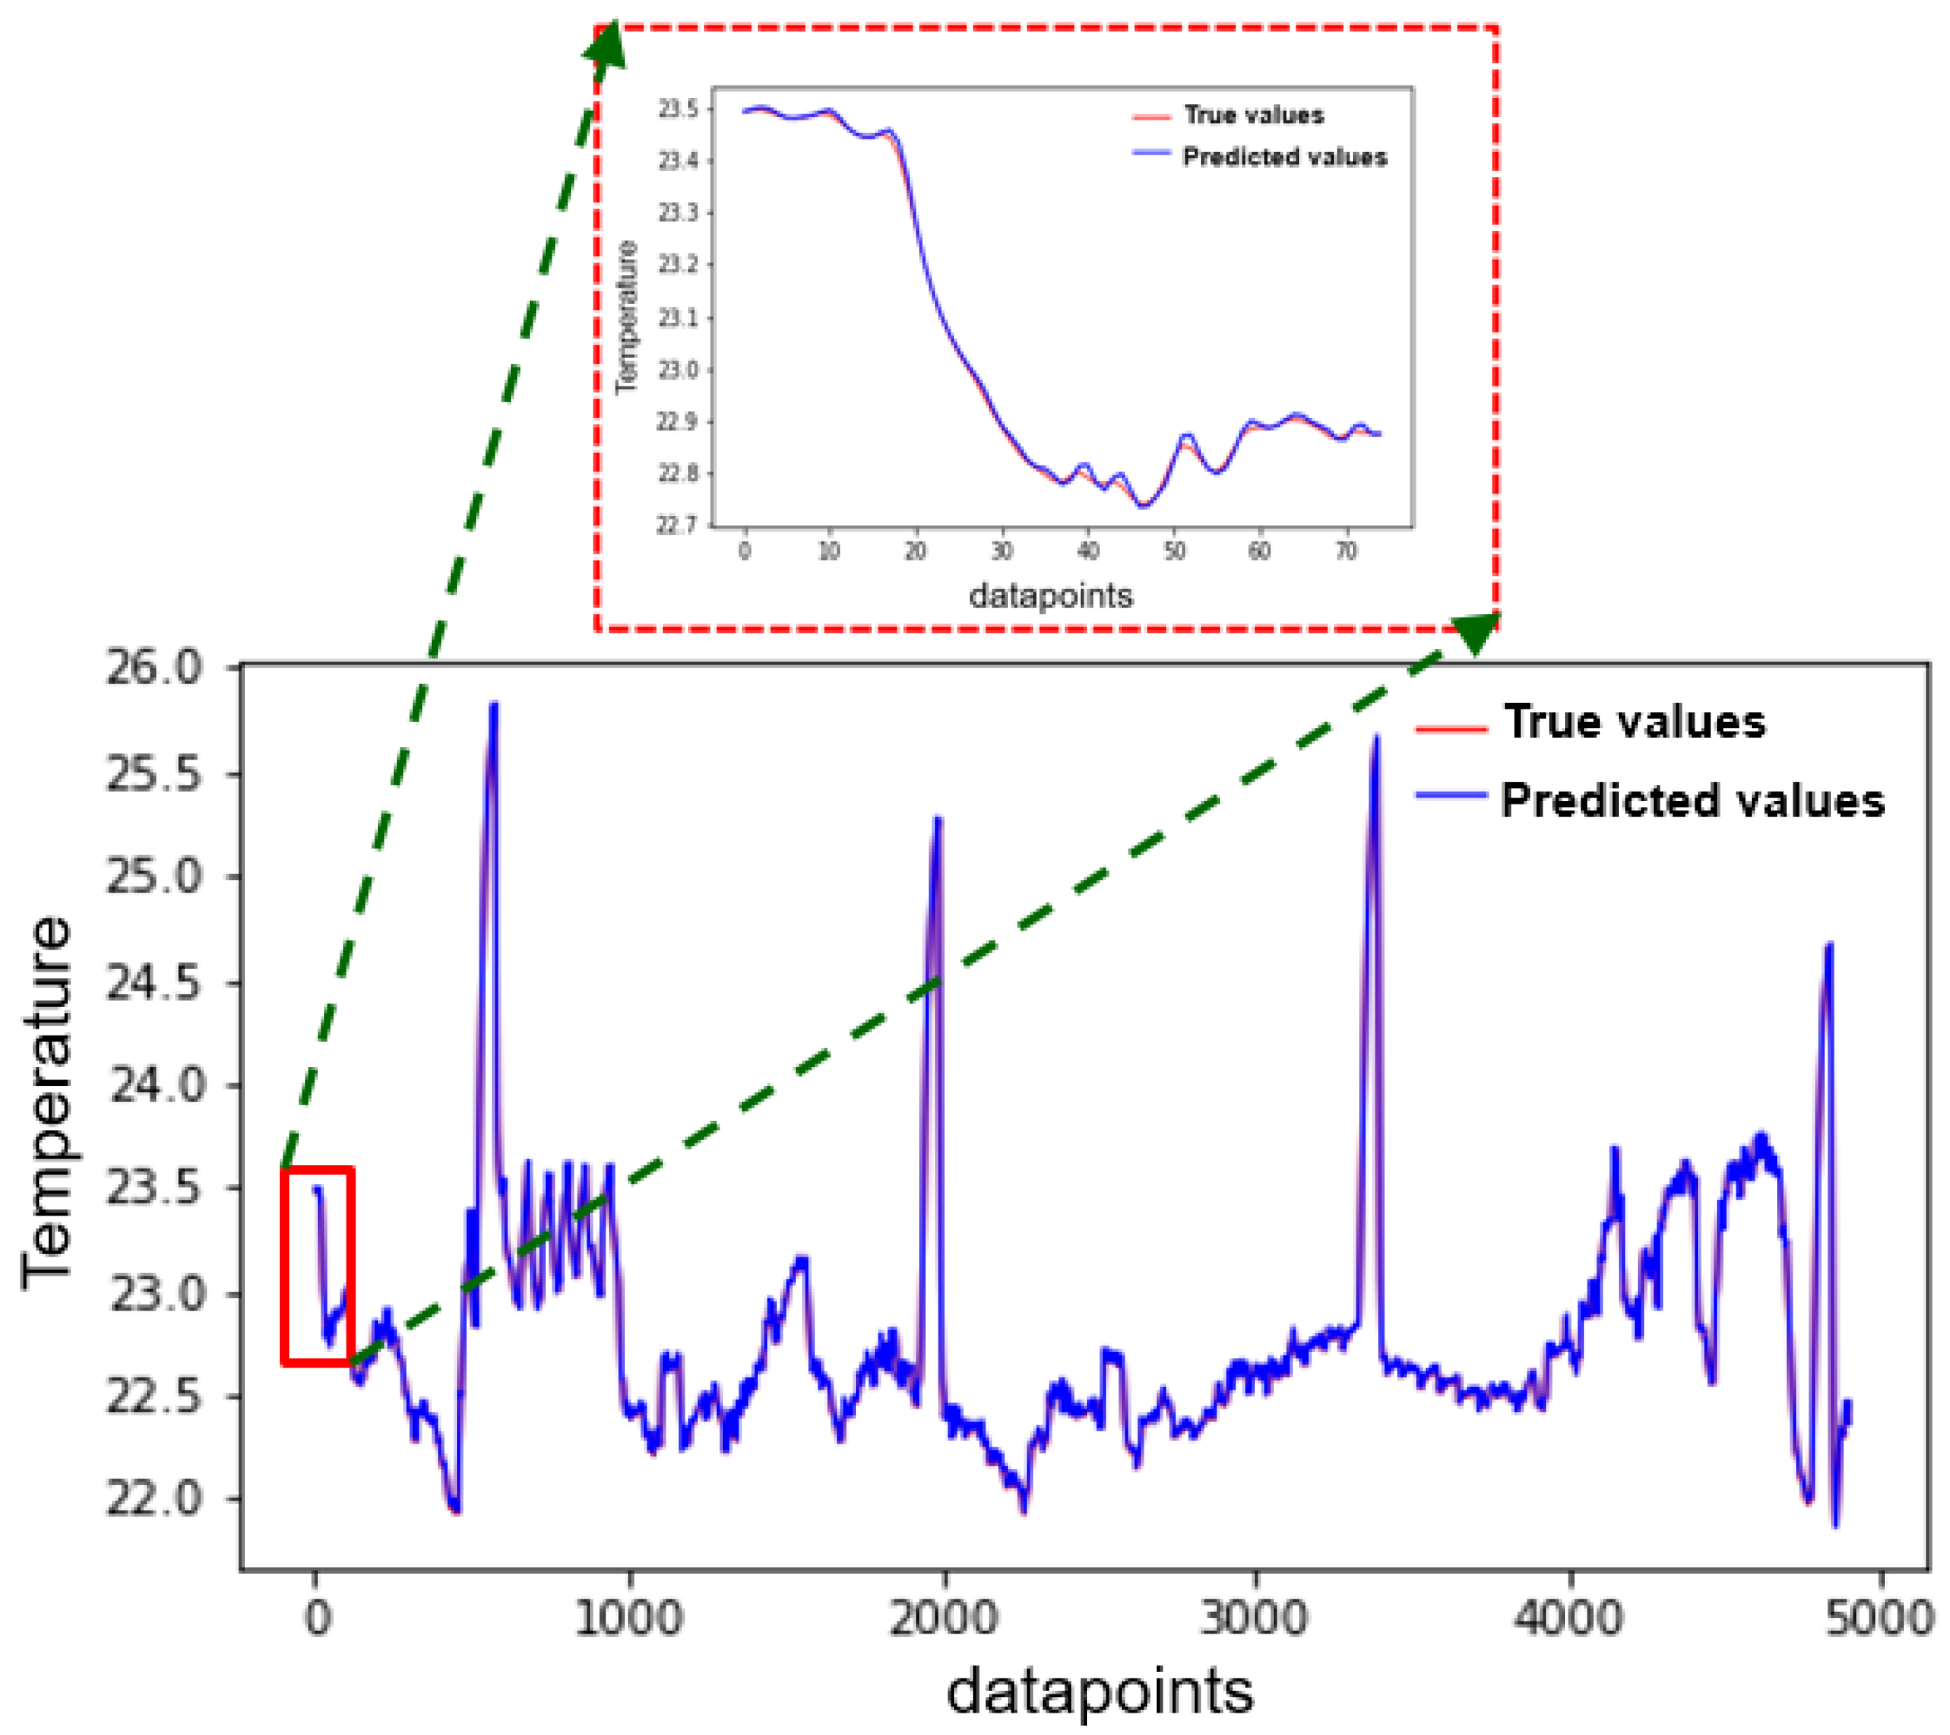
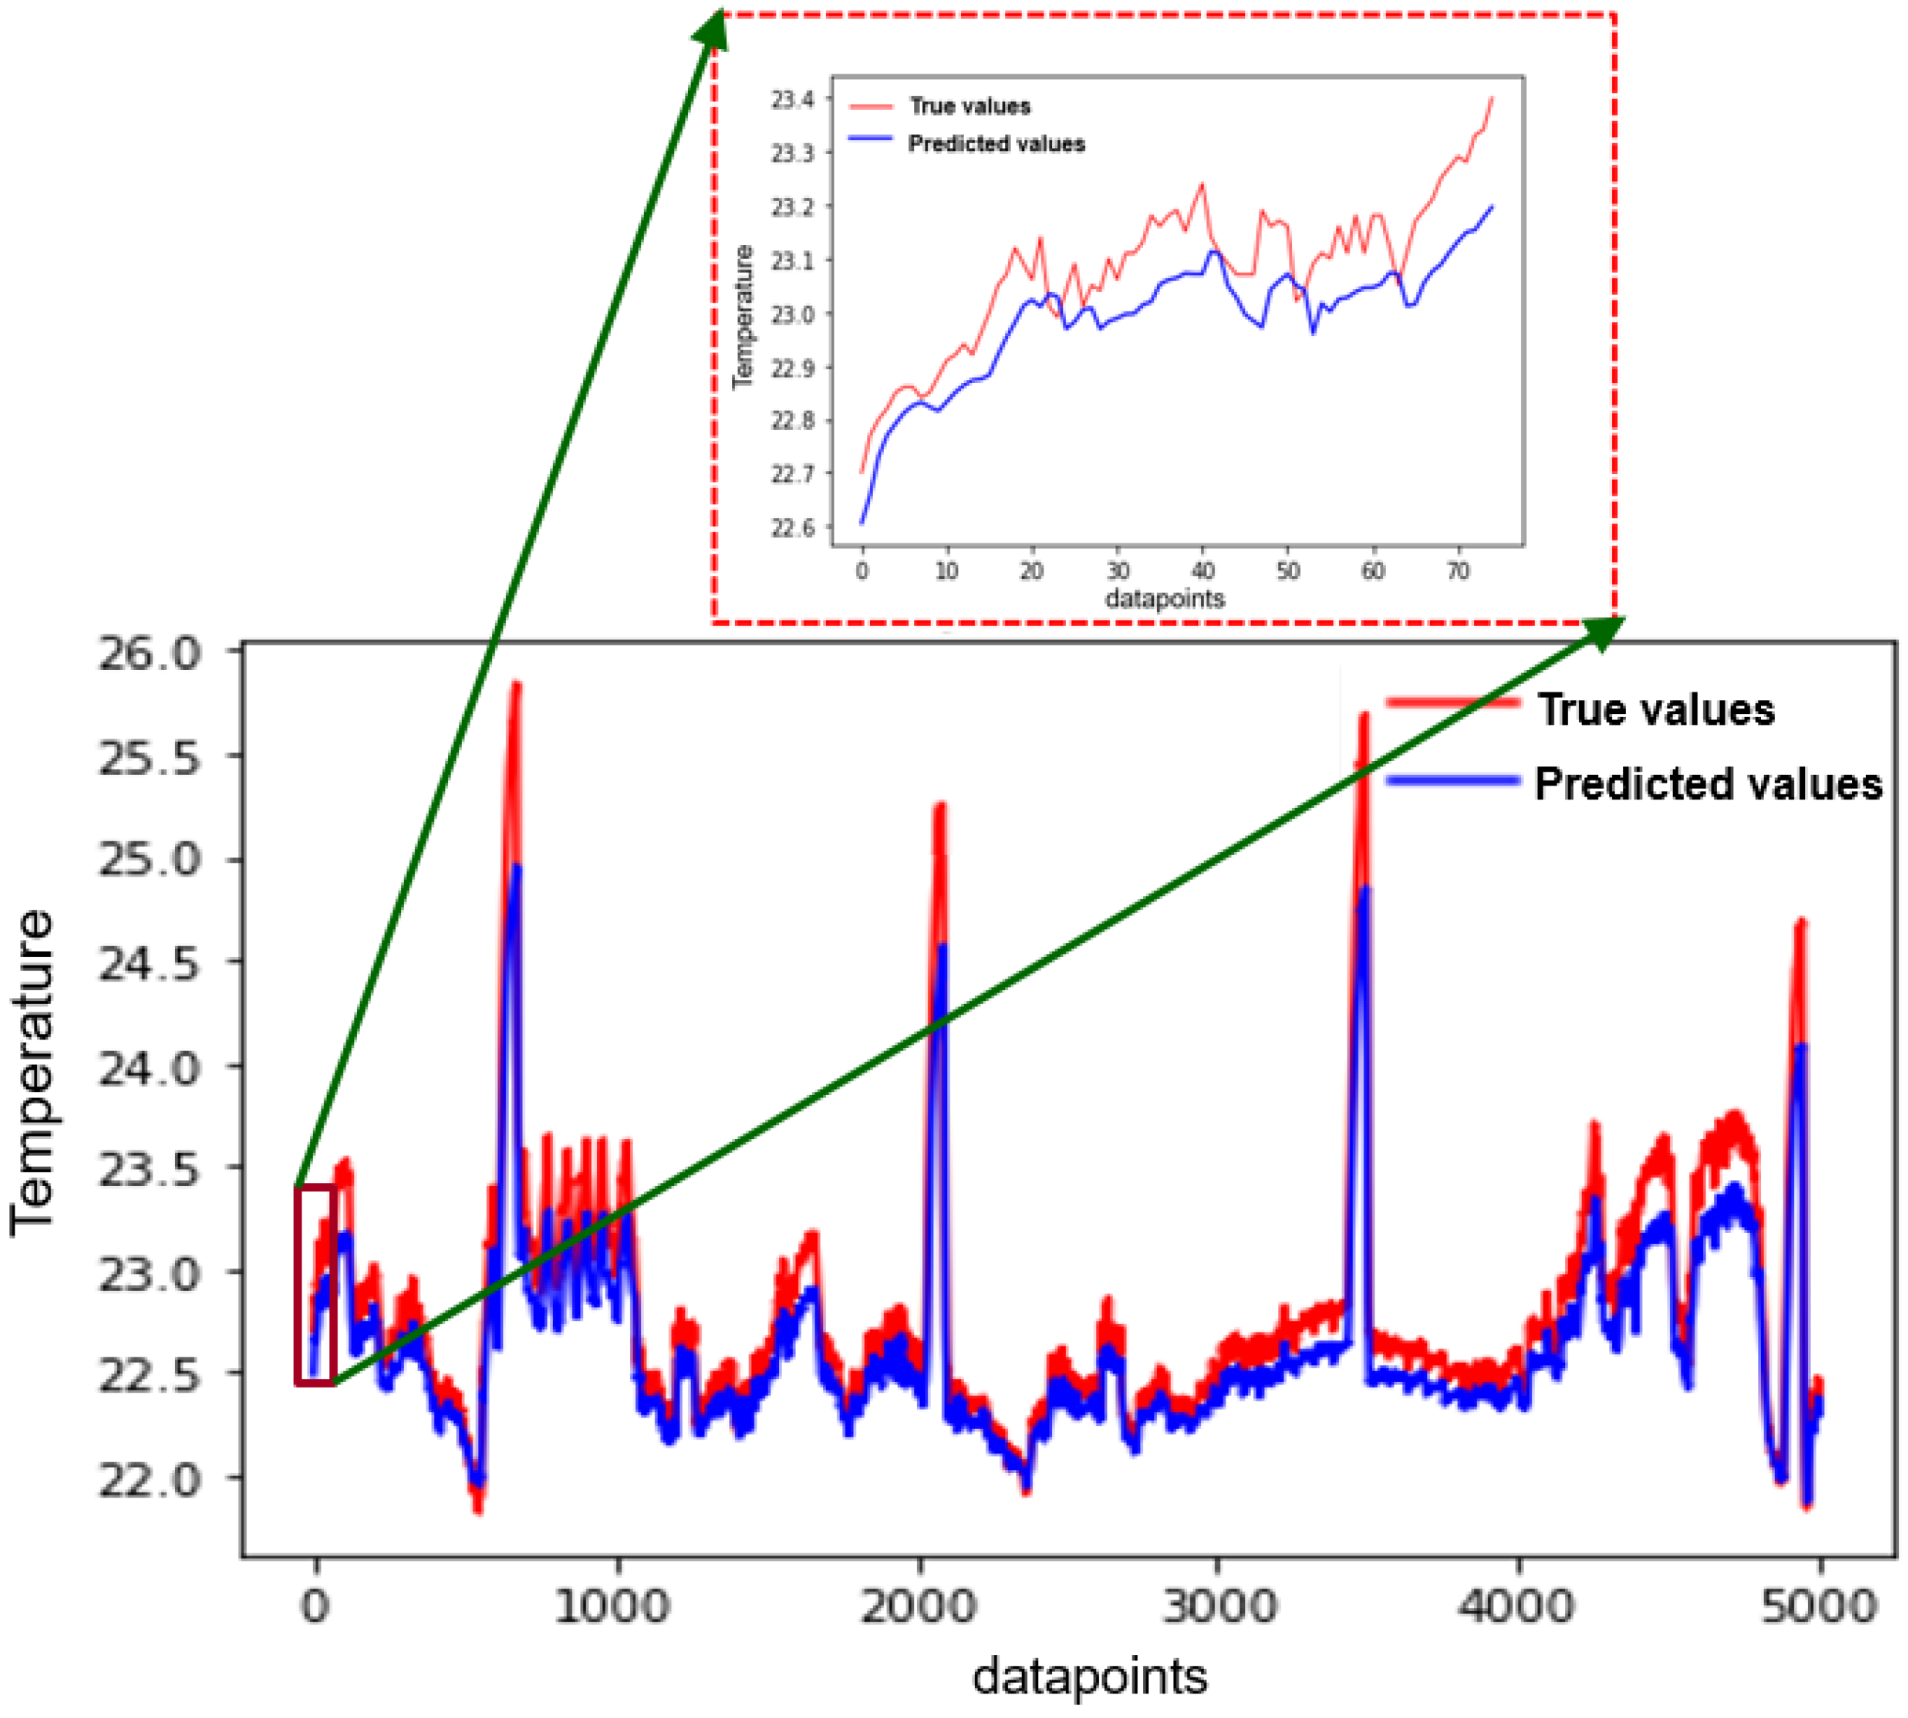
3.4. Temperature Prediction Using the CNN and LSTM Models

To validate the indoor temperature prediction functionality, the LSTM [13] and CNN–LSTM [14] models were used to predict the ideal room temperature after training. For temperature prediction using the LSTM model, temperature data were uploaded to the model as an input vector. The first five-sixths of the data were used for training, while the last one-sixth was used for testing. The LSTM model comprises a 64-layer output dimension, a rectified linear unit (ReLU) activation function, and an Adam optimizer [18]. The training was conducted over 25 epochs. The trained LSTM model was then tested to predict room temperature, which serves as the output vector. Figure 16 presents the results of indoor temperature prediction using the LSTM model. Additionally, the remaining data, such as indoor humidity and carbon dioxide levels, can also be utilized as input and output vectors.
Next, a CNN–LSTM model was used to complete the training. The CNN model comprised a convolution layer, a pooling layer, and a flattening layer. The LSTM model comprised a recurrent layer and a fully connected layer. The CNN model was placed upstream of the LSTM model to reduce training time. Figure 17 illustrates the system architecture of the CNN–LSTM model. The setting parameters of the CNN–LSTM model were similar to those of the LSTM model. Figure 18 presents the results of the indoor temperature prediction using the CNN–LSTM model. A comparison of the results presented in Figure 16 and Figure 18 reveals that the indoor temperature prediction performance of the CNN–LSTM model was comparable to that of the LSTM model. However, the training time of the CNN–LSTM model was much shorter than that of the LSTM model.
The accuracy of the two models was evaluated based on their MAPE and root-mean-squared error (RMSE) [14]. RMSE was calculated using the following formula:
R M S E = 1 n i = 1 n y i y i P 2
where n represents the total number of times, yi represents the real data, and yiP represents the predicted data. The RMSE values of the LSTM and CNN–LSTM models were 0.042 °C and 0.117 °C, respectively. Table 2 presents a comparison of indoor temperature prediction performance across multiple studies, including the present study.
The proposed LSTM and CNN–LSTM models are superior to the models used in other studies [14,18,19,20,21] based on the MAPE and RMSE values. Moreover, the LSTM model is more suitable for indoor temperature prediction. The proposed CNN–LSTM model takes approximately 3 min to complete 25 epochs of training [22]. This training time is 50% faster than that of the LSTM model alone. The model’s key advantage lies in the strong generalization capabilities of CNNs. By utilizing convolutional layers, CNNs efficiently handle large-scale image data, avoiding the excessive computation caused by numerous parameters in traditional neural networks. As a result, the training time for the CNN–LSTM model was significantly reduced compared to the LSTM model.
In other words, the proposed CNN–LSTM model has shorter training and prediction times than the LSTM model. However, the LSTM, as an extended type of recurrent neural network (RNN), inherently achieves higher accuracy. This is why the performance of the LSTM model is superior to that of the CNN–LSTM model, despite the latter’s efficiency in training and prediction.

4. Conclusions

This study developed an artificial intelligence home monitoring system using CNN and LSTM based on the Android development platform. The system monitors and predicts indoor temperature using the LSTM and CNN–LSTM models. The experimental results indicated that the performance of the proposed LSTM model was superior to that of other models [14,18,19,20,21] in terms of MAPE and RMSE. The proposed home monitoring system uses the QoS 0 messaging service “at most once” to speed up communication. The MQTT protocol cannot confirm that the network is connected successfully in the communication layer. A KNN algorithm was employed to impute missing sensor data. The experimental results indicated that the system effectively performed data imputation. The LSTM model is more suitable for indoor temperature prediction because it performs with a small MAPE and RMSE. The CNN–LSTM model takes 50% less time for training compared with the LSTM model. The proposed hybrid CNN–LSTM model can be used in portable devices to reduce the computational burden. Its main feature is the development of a home monitoring system that integrates ZigBee, KNN, CNN, LSTM, min–max normalization, MQTT, Node-RED, and a mobile app. In the future, additional mobile platforms and communication protocols will be explored to enhance compatibility and broaden the scope of applications, with particular emphasis on improving the application interface and user experience. Furthermore, edge computing will be integrated to alleviate computational burdens and improve communication accuracy. Statistical tests, such as t-tests or ANOVAs, will be employed to validate performance differences between models.

Author Contributions

Conceptualization, G.-M.S. and T.-H.C.; methodology, S.D.K. and Y.-J.C.; software, T.-H.C.; validation, G.-M.S., S.D.K., T.-H.C. and Y.-J.C.; formal analysis, S.D.K. and T.-H.C.; investigation, Y.-J.C.; resources, T.-H.C.; data curation, G.-M.S. and S.D.K.; writing—original draft preparation, T.-H.C. and Y.-J.C.; writing—review and editing, G.-M.S. and S.D.K.; visualization, S.D.K.; supervision, G.-M.S.; project administration, G.-M.S.; funding acquisition, G.-M.S. All authors have read and agreed to the published version of the manuscript.

Funding

This research was funded by the National Science and Technology Council (NSTC), Taiwan, grant number NSTC 113-2622-E-027-001.

Institutional Review Board Statement

Not applicable.

Informed Consent Statement

Not applicable.

Data Availability Statement

No new data were created.

Acknowledgments

The authors would like to thank the National Science and Technology Council (NSTC), Taiwan, R.O.C., for financially supporting this research under contract no. NSTC 113-2622-E-027-001. They are grateful to the Taiwan Semiconductor Research Institute (TSRI) for fabricating the test chip. This manuscript was edited by Wallace Academic Editing.

Conflicts of Interest

The authors declare no conflicts of interest.

References

  1. Baker, S.; Xiang, W. Artificial intelligence of things for smarter healthcare: A survey of advancements, challenges, and opportunities. IEEE Commun. Surv. Tutor. 2023, 25, 1261–1293. [Google Scholar] [CrossRef]
  2. Abdmezie, M.R.; Tandjaoui, D.; Romdhani, I. Architecting the internet of things: State of the art. Robot. Sens. Clouds 2015, 36, 55–75. [Google Scholar]
  3. Chen, L.B.; Liu, Y.H.; Huang, X.R.; Chen, W.H.; Wang, W.C. Design and implementation of a smart seawater aquarium system based on artificial intelligence of things technology. IEEE Sens. J. 2022, 22, 19908–19918. [Google Scholar] [CrossRef]
  4. Yu, L.; Lin, Y.; Xu, H.; Yang, J.; Zhao, G. Research on the Design of Indoor Air Quality Monitoring System Based on Cloud–Side–End Collaboration. In Proceedings of the 5th International Conference on Computer Engineering and Application (ICCEA), Hangzhou, China, 12–14 April 2024. [Google Scholar]
  5. Nugur, A.; Pipattanasomporn, M.; Kuzlu, M.; Rahman, S. Design and development of an IoT gateway for smart building applications. IEEE Internet Things J. 2019, 6, 9020–9029. [Google Scholar] [CrossRef]
  6. Venkatesh, K.; Barmada, B.; Liesaputra, V.; Prado, G.R. Resilient Activities Tracking in a Smart Home Using Ultrasonic Sensors. In Proceedings of the IEEE International Conference on Big Data (Big Data), Los Angeles, CA, USA, 9–12 December 2019. [Google Scholar]
  7. Zhang, C.; Zhang, M.; Su, Y.; Wang, W. Smart Home Design Based on ZigBee Wireless Sensor Network. In Proceedings of the 7th International Conference on Communications and Networking in China, Kunming, China, 8–10 August 2012. [Google Scholar]
  8. Lee, S.; Kim, H.; Hong, D.; Ju, H. Correlation Analysis of MQTT Loss and Delay According to QoS Level. In Proceedings of the International Conference on Information Networking 2013 (ICOIN), Bangkok, Thailand, 28–30 January 2013. [Google Scholar]
  9. Spinsante, S.; Ciattaglia, G.; Campo, A.D.; Perla, D.; Pigini, D.; Cancellieri, G. A LoRa Enabled Building Automation Architecture Based on MQTT. In Proceedings of the AEIT International Annual Conference, Cagliari, Italy, 20–22 September 2017. [Google Scholar]
  10. Chethana, C. Prediction of Heart Disease Using Different KNN Classifier. In Proceedings of the 5th International Conference on Intelligent Computing and Control Systems (ICICCS), Madural, India, 6–8 May 2021. [Google Scholar]
  11. Ramapatruni, S.; Narayanan, S.N.; Mittal, S.; Joshi, A.; Joshi, K. Anomaly Detection Models for Smart Home Security. In Proceedings of the 5th International Conference on Big Data Security on Cloud, Washington, DC, USA, 27–29 May 2019. [Google Scholar]
  12. Kreuzer, D.; Munz, M.; Schlüter, S. Short–term temperature forecasts using a convolutional neural network—An application to different weather stations in Germany. Mach. Learn. Appl. 2020, 2, 100007. [Google Scholar] [CrossRef]
  13. Wu, T.; Liu, C.; He, C. Prediction of regional temperature change trend based on LSTM algorithm. In Proceedings of the 4th Information Technology, Networking, Electronic and Automation Control Conference (ITNEC), Chongqing, China, 12–14 June 2020. [Google Scholar]
  14. Nahid, F.A.; Ongsakul, W.; Manjiparambil, N.M. Very Short Term Wind Speed Forecasting Using Convolutional Long Short Term Memory Recurrent Neural Network. In Proceedings of the International Conference and Utility Exhibition on Energy, Environment and Climate Change (ICUE), Pattaya, Thailand, 20–22 October 2020. [Google Scholar]
  15. Patro, S.P.; Patel, P.; Senapaty, M.K.; Padhy, N.; Sah, R.D. Smart Home Automation System Using Arduino Microcontrollers. In Proceedings of the International Conference on Automation, Quality and Testing, Robotics (AQTR), Cluj–Napoca, Romania, 21–23 May 2020. [Google Scholar]
  16. Lekić, M.; Gardašević, G. IoT Sensor Integration to Node–RED Platform. In Proceedings of the 17th International Symposium INFOTEH–JAHORINA (INFOTEH), East Sarajevo, Bosnia and Herzegovina, 21–23 March 2018. [Google Scholar]
  17. Wang, C.; Ren, B.; Li, X.; Chen, L. A CNN–BiLSTM and KNN Based Missing Data Imputation for Wind Power Generation Forecasting. In Proceedings of the IEEE 6th International Electrical and Energy Conference (CIEEC), Hefei, China, 12–14 May 2023. [Google Scholar]
  18. Song, J.; Xue, G.; Ma, Y.; Li, H.; Pan, Y.; Hao, Z. An indoor temperature prediction framework based on hierarchical attention gated recurrent unit model for energy efficient buildings. IEEE Access 2019, 2019, 157268–157283. [Google Scholar] [CrossRef]
  19. Li, C.; Zhang, Y.; Zhao, G. Deep Learning with Long Short–Term Memory Networks for Air Temperature Predictions. In Proceedings of the International Conference on Artificial Intelligence and Advanced Manufacturing (AIAM), Dublin, Ireland, 16–18 October 2019. [Google Scholar]
  20. Yang, J.; Chen, H.; Lin, S.; Chen, L.; Chen, Y. Prediction of Temperature Change with Multi–Dimensional Environmental Characteristic Based on CNN–LSTM–ATTENTION Model. In Proceedings of the 10th Joint International Information Technology and Artificial Intelligence Conference (ITAIC), Chongqing, China, 17–19 June 2022. [Google Scholar]
  21. Ramanujam, E.; Sharma, A.; Hussian, J.J.; Perumal, T. Improving Indoor Occupancy Estimation Using a Hybrid CNN–LSTM Approach. In Proceedings of the International Conference on Intelligent Controller and Computing for Smart Power (ICICCSP), Hyderabad, India, 21–23 July 2022. [Google Scholar]
  22. Ngamakeur, K.; Yongchareon, S.; Yu, J.; Sheng, Q.Z. Deep CNN–LSTM network for indoor location estimation using analog signals of passive infrared sensors. IEEE Internet Things J. 2022, 9, 22582–22594. [Google Scholar] [CrossRef]
Figure 1. Architecture of proposed artificial intelligence home monitoring system.
Applsci 15 01207 g001
Figure 2. Operation of the proposed home monitoring system.
Applsci 15 01207 g002
Figure 3. Three QoS types for the MQTT protocol.
Applsci 15 01207 g003
Figure 4. Schematic of KNN algorithm.
Applsci 15 01207 g004
Figure 5. System architecture of CNN used in this study.
Applsci 15 01207 g005
Figure 6. LSTM model used in this study.
Applsci 15 01207 g006
Figure 7. Schematic of the connections between the sensors, MQTT protocol, MongoDB database, and mobile app.
Applsci 15 01207 g007
Figure 8. Schematic of connections between the app and end devices.
Applsci 15 01207 g008
Figure 9. Designed program and debug message of the Node-RED programming tool.
Applsci 15 01207 g009
Figure 10. Experimental environment of a proposed home monitoring system.
Applsci 15 01207 g010
Figure 11. Restoration function of the KNN algorithm.
Applsci 15 01207 g011
Figure 12. Comparison line chart for humidity, indicating the number of times.
Applsci 15 01207 g012
Figure 13. Comparison line chart for carbon dioxide content, indicating the number of times.
Applsci 15 01207 g013
Figure 14. Complete Node-RED flow chart for automatic control of the fan.
Applsci 15 01207 g014
Figure 15. Mobile app homepage.
Applsci 15 01207 g015
Figure 16. Results of indoor temperature prediction using the LSTM model.
Applsci 15 01207 g016
Figure 17. System architecture of the CNN–LSTM model.
Applsci 15 01207 g017
Figure 18. Results of the indoor temperature prediction using the CNN–LSTM model.
Applsci 15 01207 g018
Table 1. International frequency bands of the Zigbee communication protocol.
Frequency
(MHz)
RegionChannel
(Numbers)
Transmission Rate
(kbps)
868Europe120
915USA1040
2450Global16250
Table 2. Comparison of indoor temperature prediction performance obtained in the present study with that reported in previous studies.
ReferencesMAPE (%)RMSE (°C)
LSTMCNN−LSTMLSTMCNN−LSTM
[14]2.0042.0000.5790.521
[18]0.0240.528
[19]0.9061.237
[20]8.70010.5110.0520.071
[21]0.3490.0980.6110.125
This study0.1801.3700.0420.117
Disclaimer/Publisher’s Note: The statements, opinions and data contained in all publications are solely those of the individual author(s) and contributor(s) and not of MDPI and/or the editor(s). MDPI and/or the editor(s) disclaim responsibility for any injury to people or property resulting from any ideas, methods, instructions or products referred to in the content.

