Article

Structural Health Assessment of a Reinforced Concrete Building in Valparaíso Under Seismic and Environmental Shaking: A Foundation for IoT-Driven Digital Twin Systems

by
Sebastián Lozano-Allimant
1,
Alvaro Lopez
2,
Miguel Gomez
2,
Edison Atencio
2,
José Antonio Lozano-Galant
3,* and
Sebastian Fingerhuth
1,*
1
School of Electrical Engineering, Pontificia Universidad Católica de Valparaíso, Avenida Brasil 2147, Valparaíso 2362804, Chile
2
School of Civil Engineering, Pontificia Universidad Católica de Valparaíso, Avenida Brasil 2147, Valparaíso 2362804, Chile
3
Department of Civil Engineering, Universidad of Castilla-La Mancha, 13005 Ciudad Real, Spain
*
Authors to whom correspondence should be addressed.
Appl. Sci. 2025, 15(3), 1202; https://doi.org/10.3390/app15031202
Submission received: 6 December 2024 / Revised: 13 January 2025 / Accepted: 21 January 2025 / Published: 24 January 2025

Abstract

:
Structural health monitoring is vital for the safety and longevity of infrastructure, particularly in seismic zones. This study focuses on identifying the dynamic properties of a reinforced concrete building in Chile’s Valparaíso region. Using an experimental approach, the study compares ambient vibration records, seismic events (moment magnitude > 4), and data collected during adjacent construction activities. Force-balanced accelerometers were used for vibration measurements. The analysis employs the Stochastic Subspace Identification with Covariances (SSI-COV) method within an operational modal analysis framework to extract the building’s modal parameters without requiring artificial excitations. This technique effectively identifies modal characteristics under different vibration sources, making it suitable for evaluating the structural condition under diverse loading conditions. The findings reveal the building’s modes and frequencies, offering critical insights for maintenance and management of infrastructure. Little to no variations were observed in the identified frequencies of the building when working with different types of input data. These data support the integration of real-time IoT systems for continuous monitoring, providing a foundation for future digital twin applications. These advancements facilitate early deterioration detection, enhancing resilience in seismic environments.

1. Introduction

The evaluation of structural health in buildings is an essential field of study to ensure the safety and durability of critical infrastructures, especially in areas prone to adverse environmental conditions such as seismic activity [1]. This is particularly relevant for reinforced concrete buildings, as their dynamic properties can be significantly influenced by factors such as their location, the type of soil on which they are built, and the environmental loads to which they are exposed [2]. Short-term and long-term damage cause the structures to age and shorten the design life, making the monitoring process an important aspect in their maintenance and repair scheduling [3].
Engineering structures are susceptible to human-induced and environmental factors that speed up the accumulation and propagation of damage and shorten their lifespan [4]. Structural health monitoring using sensing technologies allows for the early and precise identification of potential deterioration or anomalies in buildings [5,6]. Among these technologies, the use of accelerometers to record vibrations has been widely used in the past for assessing a structure’s health, as they capture the dynamic response of a system subjected to environmental excitations without the need for additional loads (e.g., artificially applied forces or controlled vibrations). This technique, known as operational modal analysis, is based on observing structures under their normal operating conditions, utilizing vibrations generated by wind, traffic, or seismic activity [7]. In this study, ambient vibrations, vibrations from adjacent construction, and seismic events were recorded, with data collected during the years 2022, 2023, and 2024.
Output-only or operational modal analysis (OMA) has become very popular, as no artificial vibration source is needed, which is anyhow impossible in many cases. Time domain system identification algorithms like Stochastic Subspace Iteration (SSI) have replaced the obsolete “peak-picking” method [8]. Using an OMA procedure, one can identify the system eigenfrequencies and mode shapes of typical structures excited by unmeasured ambient (broadband) loads. This is beneficial, since the operation of the structure is not obstructed, as it would be in the case of forced vibration testing [9].
The term structural health evaluation is directly focused on verifying the presence of damage in structures [10,11]. Damage can be defined as changes introduced into a system that adversely affect its current or future state. In general, the definition of what is considered damage is limited to changes in the material and/or geometric properties of a system and does not necessarily imply a total loss of system functionality, but rather that the system no longer operates optimally, highlighting the importance of detecting and quantifying any deterioration to maintain structural integrity.
Changes in the dynamic properties of structures are linked to changes in modal parameters, which depend on the stiffness of the structures, a property influenced by the material composition of the structure. Changes in natural frequencies, damping ratios, and mode shapes can therefore be used as features to detect and to identify damage [12].
The problem of quantifying the uncertainty of modal characteristics that are estimated from a single batch of (operational) vibration data gained interest during the past few years, reflecting the complexity of accurately identifying the structural state. Since environmental variations also influence modal properties, a training period that covers the range of environmental changes is required to filter out their effects.
In this context, the objective of this work is to assess the structural health of a reinforced concrete building located in Valparaíso, Chile, a coastal area characterized by the presence of soft soil and a near-surface water table. The focus of this study is a detailed comparative analysis of the building’s dynamic response to three types of records: ambient vibrations, vibrations generated by adjacent construction, and seismic records. The results are examined over time, allowing for the identification of behavioral patterns and possible variations in the structural response to different sources of excitation. In the study, ambient vibrations, vibrations from adjacent construction, and seismic events were recorded, with data collected during the years 2022, 2023, and 2024.
In this study, the Stochastic Subspace Identification with Covariances (SSI-COV) [7] method is employed using a MATLAB toolbox developed by the University of Leuven [13]. This methodological approach facilitates the precise identification of modal parameters, which are essential for a structural health evaluation based on the analysis of recorded vibrations. SSI-COV stands out for its efficiency and accuracy in extracting modal characteristics, even in the presence of noise and without the need for artificial excitations [14]. The implementation of this toolbox enables a robust interpretation of the data obtained, providing critical information for decision-making in infrastructure maintenance and management.
This manuscript addresses the question about the quality of the results of using SSI-COV on the aforementioned building for different inputs. In our case, the inputs have different sources and natures: seismic activity, ambient vibrations, and vibrations from a neighboring construction site. When talking about quality of the results, we mean to compare the output and results of the analysis using all or only some of the available sensors, as well as looking to the characteristics of the modes computed.
This paper is organized into six main chapters covering the methodology, case study, monitoring campaign, and results. Chapter 2 presents the methodology, focusing on the SSI-COV approach and its implementation in MATLAB to analyze the building’s structural dynamics. Chapter 3 describes the building under study, including its structural characteristics, location in Valparaíso, Chile, and the environmental and seismic conditions of the area. Chapter 4 outlines the monitoring campaign, detailing the sensor specifications, characteristics, and arrangement, as well as the measurement dates, which encompass data from ambient vibrations, vibrations from adjacent construction, and seismic records. Chapter 5 presents the results of the analysis, while Chapter 6 provides the conclusions drawn from the study.

Review of the State of the Art

Recent studies in structural health monitoring (SHM) have highlighted the need for research focused on buildings located in seismic zones, where long-term structural monitoring and vibration data collection are essential for understanding damage progression and ensuring structural stability. A notable example is the study of historic buildings in the center of Lucca, Italy [6], which employs an ambient vibration analysis to track changes in dynamic properties without the need for artificial loads—an approach particularly beneficial in densely populated urban areas [15].
A research project led by the Sensor Laboratory (LabSens) at Pontificia Universidad Católica de Valparaíso (PUCV) focused on structural health monitoring of tunnels in Santiago and Valparaiso, Chile, two densely populated areas in a seismically active zone. This project, known as “Shaking Tunnel Vision”, [16] used seismic instrumentation to analyze the dynamic response of underground structures, providing valuable data on their responses during seismic events and ambient vibrations. Similar structural monitoring technologies have been implemented using triaxial sensors to capture both ambient vibrations and moderate seismic activity [4,17].
Other recent case studies include the monitoring of a group of reinforced concrete buildings in Sendai, Japan, located in an area of high seismic activity. This study employed an advanced sensor system, including accelerometers and fiber optic sensors, to capture vibrations and deformations in the structures during seismic events [18]. The application of a continuous monitoring approach in Sendai enabled the assessment of the cumulative impact of moderate earthquakes on structural rigidity and the analysis of how changes manifest over time.
These examples highlight the importance of structural monitoring in seismic environments and show how advanced SHM technologies, such as high-precision accelerometers and fiber optic sensors, make it possible to capture variations in structural responses to seismic events and environmental vibrations. These approaches demonstrate that long-term monitoring in seismic zones not only captures the impact of significant events but also documents gradual changes in the dynamic properties of the structure that may develop over time, thus reinforcing the need for continuous structural monitoring.
Regarding the methodology, structural monitoring approaches have evolved to integrate sensors, such as triaxial accelerometers, which capture dynamic responses along multiple axes without interrupting the operation of the monitored structures. The most commonly used methods include Operational Modal Analysis and the Stochastic Subspace Identification with Covariances (SSI-COV) method [18], which allow the identification of a structure’s modal parameters, such as natural frequencies and mode shapes, based on ambient vibrations. These methods offer a robust solution for real-time analysis, enabling engineers to accurately assess the condition of structures without impacting their daily operation [19].
Regarding the measuring devices, structural health monitoring employs a variety of sensors, with triaxial accelerometers playing a crucial role in structural monitoring, particularly in vibration analysis, as they provide an accurate representation of the structural response to environmental and seismic loads. Long-term structural monitoring is essential for detecting variations in the dynamic properties of structures that emerge over time due to environmental factors and dynamic loads. Recent studies have shown that the early detection of anomalies through continuous monitoring enables the implementation of more effective and sustainable long-term preventive measures [20].
Although numerous studies on structural monitoring exist [21], few have explored the comparison of records obtained from various excitation sources within the same building, such as ambient vibrations, nearby construction activities, and seismic events. Such comparisons can provide useful insights for a more comprehensive structural health assessment by enabling the identification of the structure’s responses to different loads and the study of possible interactions between vibration modes.
Recent international studies have begun to address this gap [22,23], demonstrating that a comparative analysis between multiple excitation sources enables the detection of deterioration or damage patterns that might otherwise go unnoticed. Data fusion techniques in SHM, including approaches that combine ambient and controlled source vibrations, emphasize the importance of integrating data from multiple excitation types to capture a complete dynamic profile of structures. These studies highlight that the lack of combined data sources, such as ambient vibration, traffic, and seismic activity, limits the precision of diagnostics in concrete and steel buildings [24].
A recent study compared records of ambient vibrations and seismic events in a 13-story concrete building, showing how vibration modes and natural frequencies vary depending on the excitation source. The authors emphasize that these differences in response to ambient and seismic loads help identify specific structural vulnerabilities that may not be captured when only a single type of excitation is used [25].
This work emphasizes the importance of adopting a comprehensive approach to SHM, highlighting how the combination of records from multiple excitation sources over time can offer a more detailed and in-depth perspective on structural behavior in complex environments. The application of this model in seismic areas underscores the need for extended structural monitoring that captures not only the impact of major events but also dynamic variations induced by environmental loads and nearby activities.

2. Methodology of SSI-COV

Stochastic subspace algorithms are methods used in signal processing and dynamic system analyses to extract relevant information from observed data. These algorithms focus on matrix decomposition and the identification of subspaces that capture fundamental characteristics of the data to identify the dominant subspaces that may correspond to vibration modes in structural systems [26,27].
One of the key tools in this approach is the Hankel matrix, which provides a structured representation of the system’s dynamics by organizing the output data into past and future observations. This matrix is pivotal for identifying the system’s modal characteristics, as it encapsulates both the temporal correlations and the dynamic interactions of the measured outputs.
The Stochastic Subspace with Covariance [28,29] algorithm uses covariance information between the different measured signals to identify the relevant subspaces that capture the system’s dynamic characteristics. This is especially useful when the system contains noise, as it separates the signal of interest from the present noise. Additionally, SSI-COV can be used when the forces within the system are unknown, meaning that it can be applied to structures under operational conditions without the need for applying known test forces.

2.1. System Model

The stochastic state–space system model is characterized by being rational, discrete, linear, and time-invariant [30], and is denoted as follows:
x k + 1 = A x k + B u k + w k
y k = C x k + D u k + e k
where x k R n × 1 is the discrete state vector of the system, uₖ is the input vector, and y k R m × 1   is the output vector of the system, both sampled in time. A and B   R n × n are discrete state matrices, and C and D   R m × n   are output matrices. w k represents the noise due to system inaccuracies, and e k represents the noise resulting from measurement inaccuracies in the sensors used.
If the measurement is performed with known test forces, uₖ and eₖ would have values close to zero; in other words, they would disappear from Equations (1) and (2). However, u k and e k are not known yet necessary vectors; therefore, their small but influential values in the system are assumed to be white noise, and the equations are modified as follows:
x k + 1 = A x k + w k
y k = C x k + ϑ k
where w k = B u k and ϑ k = D u k + e k , representing process noise and measurement noise, respectively. The covariance matrix of w k and ϑ k is
E ω k ϑ k         ω s T     ϑ s T = Q S S T R δ k s
where E is the expected value operator and δ k s is the Kronecker delta function, indicating that ω k and ϑ k are uncorrelated for k s , modeling white noise.
In this matrix, Q   R n × n is a non-negative matrix that describes the intensity of process noise, R   R n × n is a positive matrix representing measurement noise, and S   R n × n   describes the cross-correlation between the process noise and measurement noise. These properties ensure the stability and consistency of the model, allowing the separation of noise contributions from the system’s dynamic modes.
The use of the covariance matrix is critical for capturing the stochastic dynamics of the system, as it distinguishes noise components from structural responses, even under operational conditions where the excitation forces are unknown. This is especially important for applications such as an operational modal analysis, where the objective is to identify the system’s dynamic modes in the presence of noise.

2.2. Extraction of Modal Characteristics

Matrices A and C represent the system dynamics in the measurement space and capture the system’s modal characteristics. Although the output matrix C describes how the internal state of the system translates to the observed output y k its exact value is not always directly known due to the presence of noise ϑ k . In this context, the Hankel matrix plays a fundamental role, as it provides a comprehensive representation of the system dynamics based on the observation y k .
To achieve this representation, a time estimation spanning n steps is considered, where n   >   2 i . The Hankel matrix is organized into blocks of past output vectors ( Y ,   Y ,   . . . ,   Y ) , and future output vectors ( Y ,   . . . ,   Y ) , ensuring that the system’s dynamics are fully captured. The Hankel matrix is defined as follows:
H = ( 1,1 ) ( 1,2 ) ( 2,1 ) ( 2,2 ) ( 1,3 ) ( 2,3 ) ( i , 1 ) ( i , 2 ) ( i , i )
where each block Δ ( a , b ) is a temporal correlation matrix defined as
Δ ( a , b ) = E ( y k + a     y k + b r e f T )
and represents how the system outputs are correlated at different time instants. The reference output y k + b r e f T is used as a benchmark to evaluate the interactions between the observed data y k + a and the reference output. This correlation captures the dynamic dependencies among the system’s outputs and is pivotal for constructing the Hankel matrix, which is central to identifying the modal characteristics of the system.

2.3. Hankel Matrix Parameters: Dimension and Order

The dimension of the Hankel matrix is directly influenced by the amount of sampled data and the desired resolution for the analysis [31]. The selection of the number of blocks i and j   is determined by the following conditions:
j     m i
i     β ,
where
β = f s   /   f 0    
f 0 represents the system’s lowest frequency, f s is the sampling frequency, and i   can be chosen to be greater than β to ensure complete coverage of the system’s dynamic range.
To guarantee that the Hankel matrix sufficiently captures the system dynamics, the following conditions must also be met:
m i   g     n
m i   h     n
where g and h are the numbers of rows (past blocks) and columns (future blocks) of the Hankel matrix, respectively, and n is the system order. Additionally, m corresponds to the number of sensors [32].
Through the construction of the Hankel matrix, the extended observability and stochastic controllability matrices can be extracted, enabling the determination of the state–space matrices A and C . This approach provides a robust foundation for accurately identifying the system’s dynamic and modal characteristics, which are crucial for structural engineering and vibration analyses [33].

2.4. Implementation of SSI-COV

In the implementation of the Stochastic Subspace with Covariance (SSI-COV) method, the “shmtoolbox” was used, a specialized MATLAB toolbox designed for structural analysis and system identification. This tool provides specific functions for applying SSI-COV, facilitating the configuration of essential parameters, such as the number of blocks and the model order, which are critical for capturing the system’s dynamics.
The toolbox needs the data and the sampling frequency as input information and parameters. To implement the SSI-COV method, a Power Spectral Density (PSD) matrix needs to be created. The signal processing functions in the toolbox facilitate this process automatically. Specifically, the SSI-COV method requires providing the relationship in terms of spectral energy distribution to analyze how the different acceleration signals are interrelated at the frequency component level.
Additionally, SSI-COV requires the number of blocks and the model order as input parameters. In this case, 200 blocks and an order of 25 were selected to optimize the analysis in terms of resolution and precision.
The choice of 200 block rows and a model order of 25 was based on the authors’ experience and the specific requirements of the analyzed structure. Selecting 200 blocks ensures a higher data density in the frequency domain, which enhances the method’s ability to differentiate closely spaced vibration modes. Likewise, a model order of 25 was considered sufficient to accurately capture the system’s essential dynamics while avoiding overfitting or introducing unnecessary complexity.
It is acknowledged that the selection of these parameters can significantly influence the accuracy and precision of modal parameter estimates. The chosen values were deemed appropriate for balancing computational efficiency and the reliability of the results, particularly given the structure’s dynamic characteristics and the dataset under analysis.
The importance of selecting appropriate parameters has been highlighted in the literature, as Rainieri and Fabbrocino demonstrated the influence of these parameters on the accuracy and reliability of stochastic subspace identification methods [34].
With the specified parameters for analyzing the captured vibration data, the SSI-COV method calculates covariance matrices from the data blocks and then extracts the system’s dynamic characteristics using singular value decomposition techniques and clustering algorithms to identify and confirm the consistency of the estimated modes across different model order configurations [35].
Subsequently, to identify the models for all the desired orders, the process begins by iterating over a predefined range of model orders up to the maximum value. For each order, it uses subspace decomposition algorithms to process the covariance matrices derived from the signal data. These algorithms help to extract the vector spaces that represent the dominant dynamics of the system.
To determine the stability of the results, a stabilization diagram was used, which facilitates the selection of the appropriate model order by comparing the dynamic properties across consecutive orders. In this process, the frequencies, relative damping, and Modal Assurance Criterion (MAC) were evaluated.
The Modal Assurance Criterion (MAC) [36] is generally used as a measure of the correlation between two modal shapes. The MAC value corresponding to the   i t h   modal shape, ϕ i j and ϕ i j * , is defined as follows:
M A C i = j = 1 n ϕ i j ϕ i j * 2 j = 1 n ϕ i j 2 j = 1   n ϕ i j * 2
where n is the number of elements in the modal shape vectors. A MAC value close to one indicates a perfect correlation between the two modal shapes, while a value close to zero indicates modal shapes that are orthogonal.
The decision on whether a mode is stable is made by comparing the frequencies, relative damping, and Modal Assurance Criterion (MAC) of neighboring orders. If the relative difference is within the tolerance prescribed by the parameter, it is considered stable.
In this work, the SSI-COV method was applied following a series of detailed steps. Initially, and as a first exploratory step, the method was applied directly to the original raw data that were sampled at 400 Hz. The output is presented in Section 5 and it shows values in frequencies up to 70 Hz, but no noticeable frequencies of interest show up.
Subsequently, time series were downsampled to 30 Hz using MATLAB’s resample function. This has two consequences: the data are considerably reduced, and high-frequency information is eliminated; but, these high-frequency components are not physically significant for this type of structure. Then, the downsampled time series were analyzed with the method. Here, two frequency ranges are visible, one is at 2.5 Hz and the other is at 9.7 Hz. This procedure is presented in Section 5. Both values are used as inputs for the SSI-COV method in MATLAB (MATLAB v.2024a), namely, as the center frequency of optional band-pass filters. Specifically, this filtering process was configured as a band-pass filter with a central frequency f 0 , allowing signals within a certain frequency range to pass while attenuating those outside of it. The filter uses a flat top bandwidth B1 (the range around the central frequency f 0 , where the signal passes unattenuated) and tapering bandwidths B2 on each side, providing gradual attenuation outside the flat top range.
The selections of 2.5 Hz and 9.7 Hz were complementarily confirmed as frequencies of interest based on the results of a modal analysis calculated using a structural model exported from Revit to ETABS. This analysis identifies frequencies with significant modal participation, indicating their prominent contributions to the overall dynamic response of the structure. Modal participation, in this context, refers to the relative influence of each mode on the vibrational behavior of the structure, highlighting the importance of these frequencies in capturing its dynamic characteristics. In Table 1, the results of the modal analysis from the numerical model are presented.
These steps, along with the filter configurations used, are presented in the methodology diagram depicted in Figure 1.
To evaluate the stability of the modes, two scenarios with different tolerance settings were analyzed. In the first scenario, a tolerance of 0.02 was used for the frequency, 0.05 for damping, and 0.02 for the MAC, while in the second scenario, a stricter tolerance of 0.01 was adopted for all parameters, allowing for greater precision in the identification and confirmation of the system’s dynamic modes.
Table 1 shows the results of the modal analysis from the ETABS model, where the mode shapes and corresponding frequencies with significant modal participation are listed. UX and UY represent the percentage of modal participation in the X and Y directions, respectively, indicating the extent to which each mode contributes to the dynamic response of the structure along these principal axes. This distinction allows for a better understanding of how the structure responds to excitations in each direction, aiding in the interpretation of the vibrational behavior.

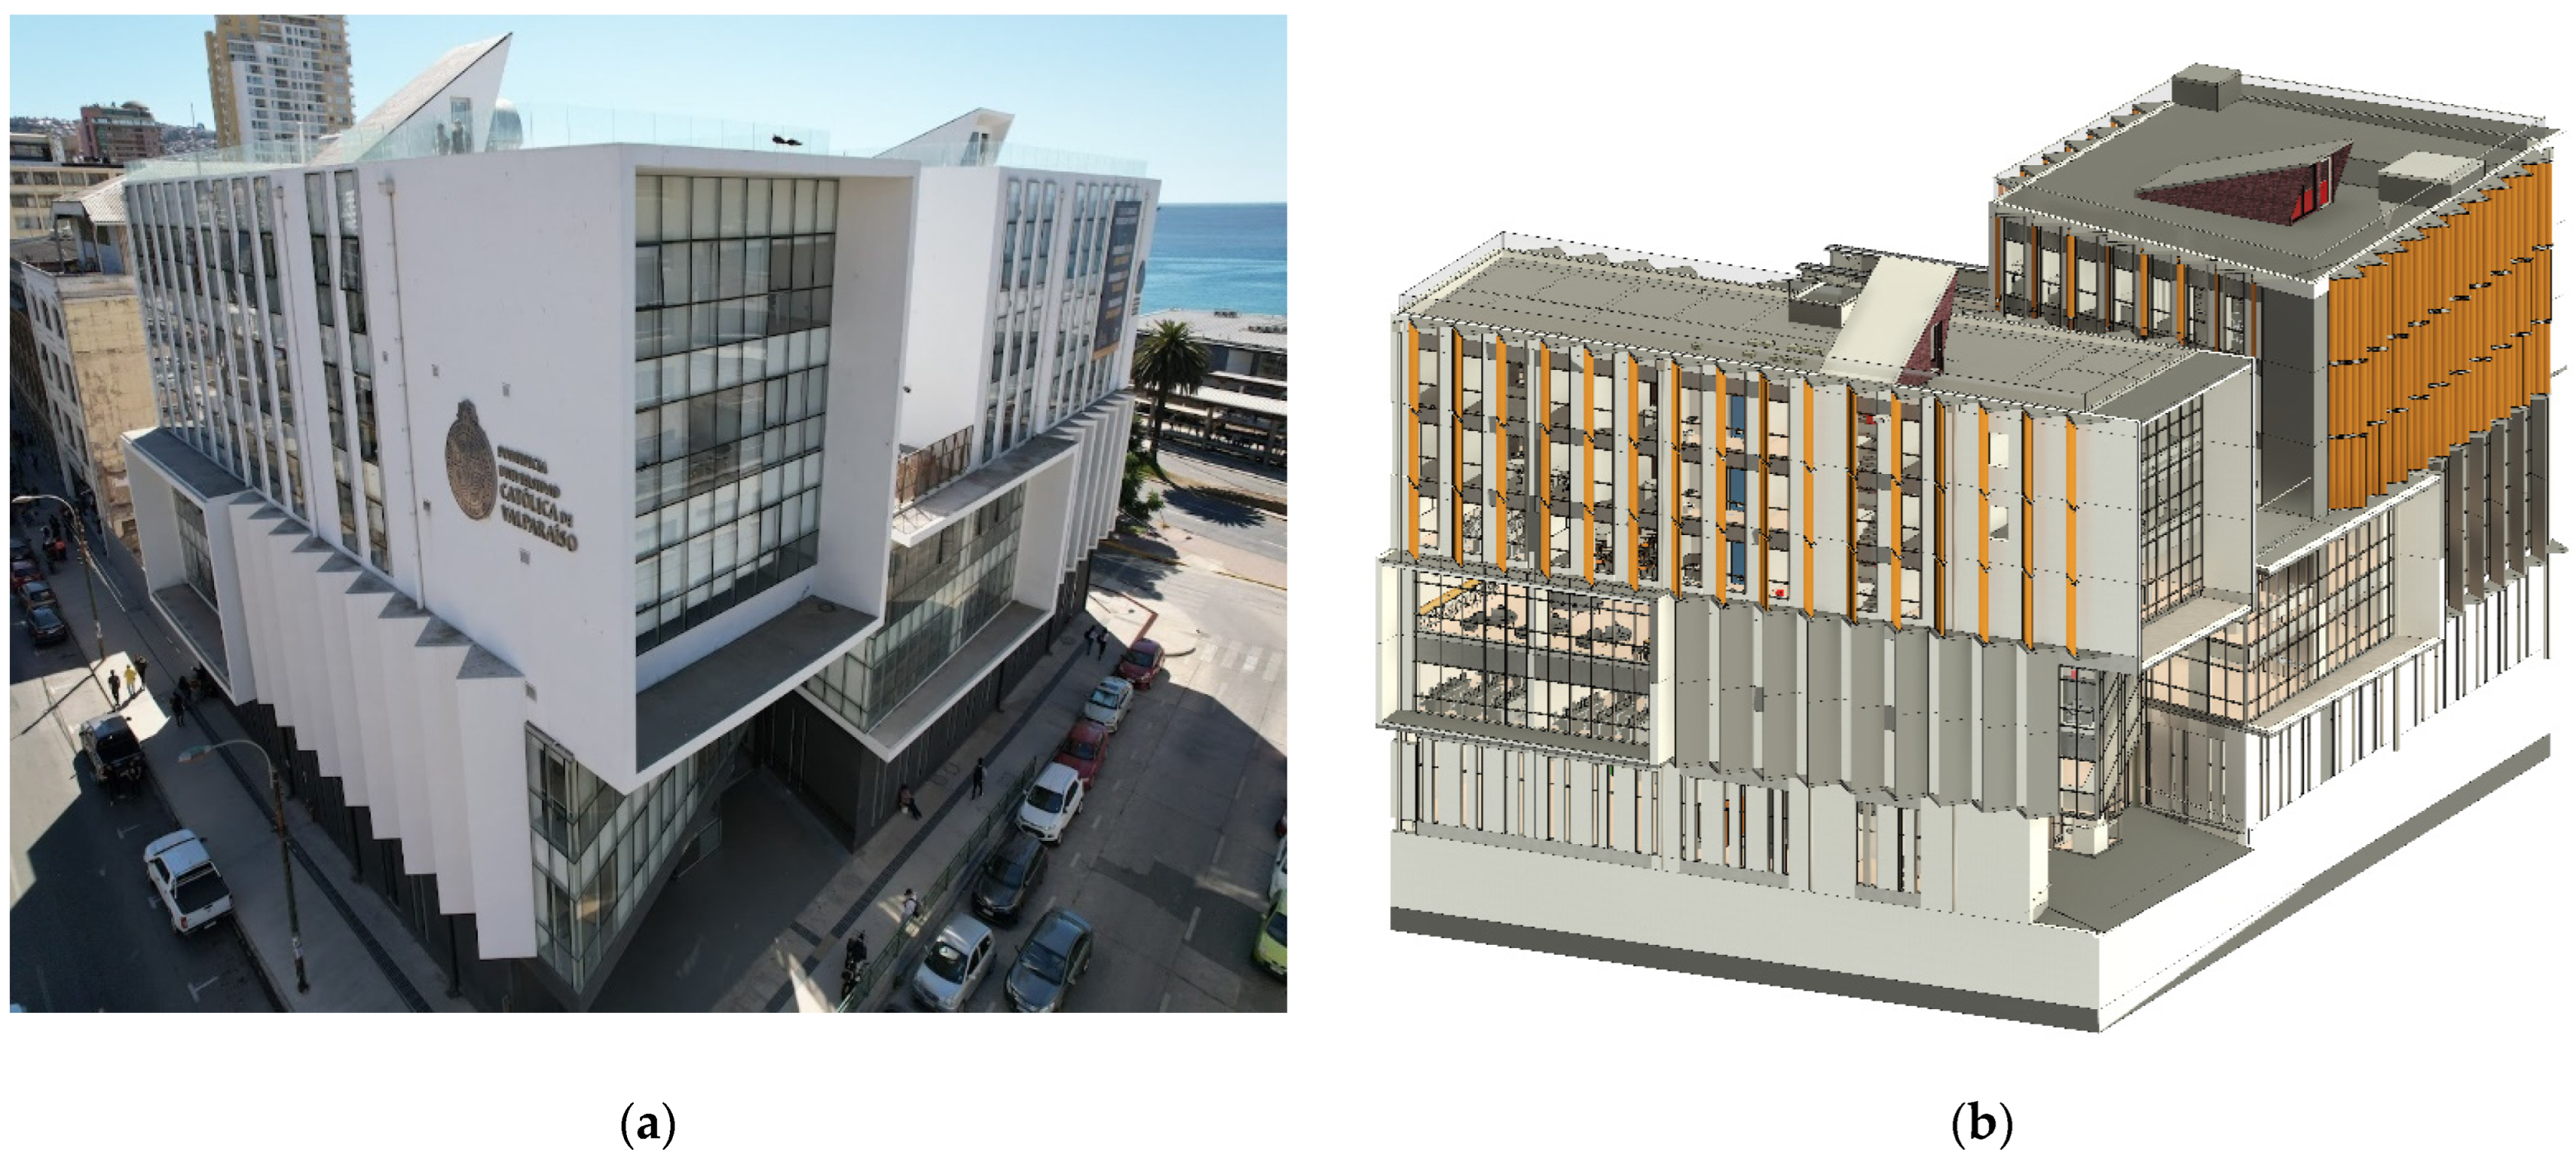
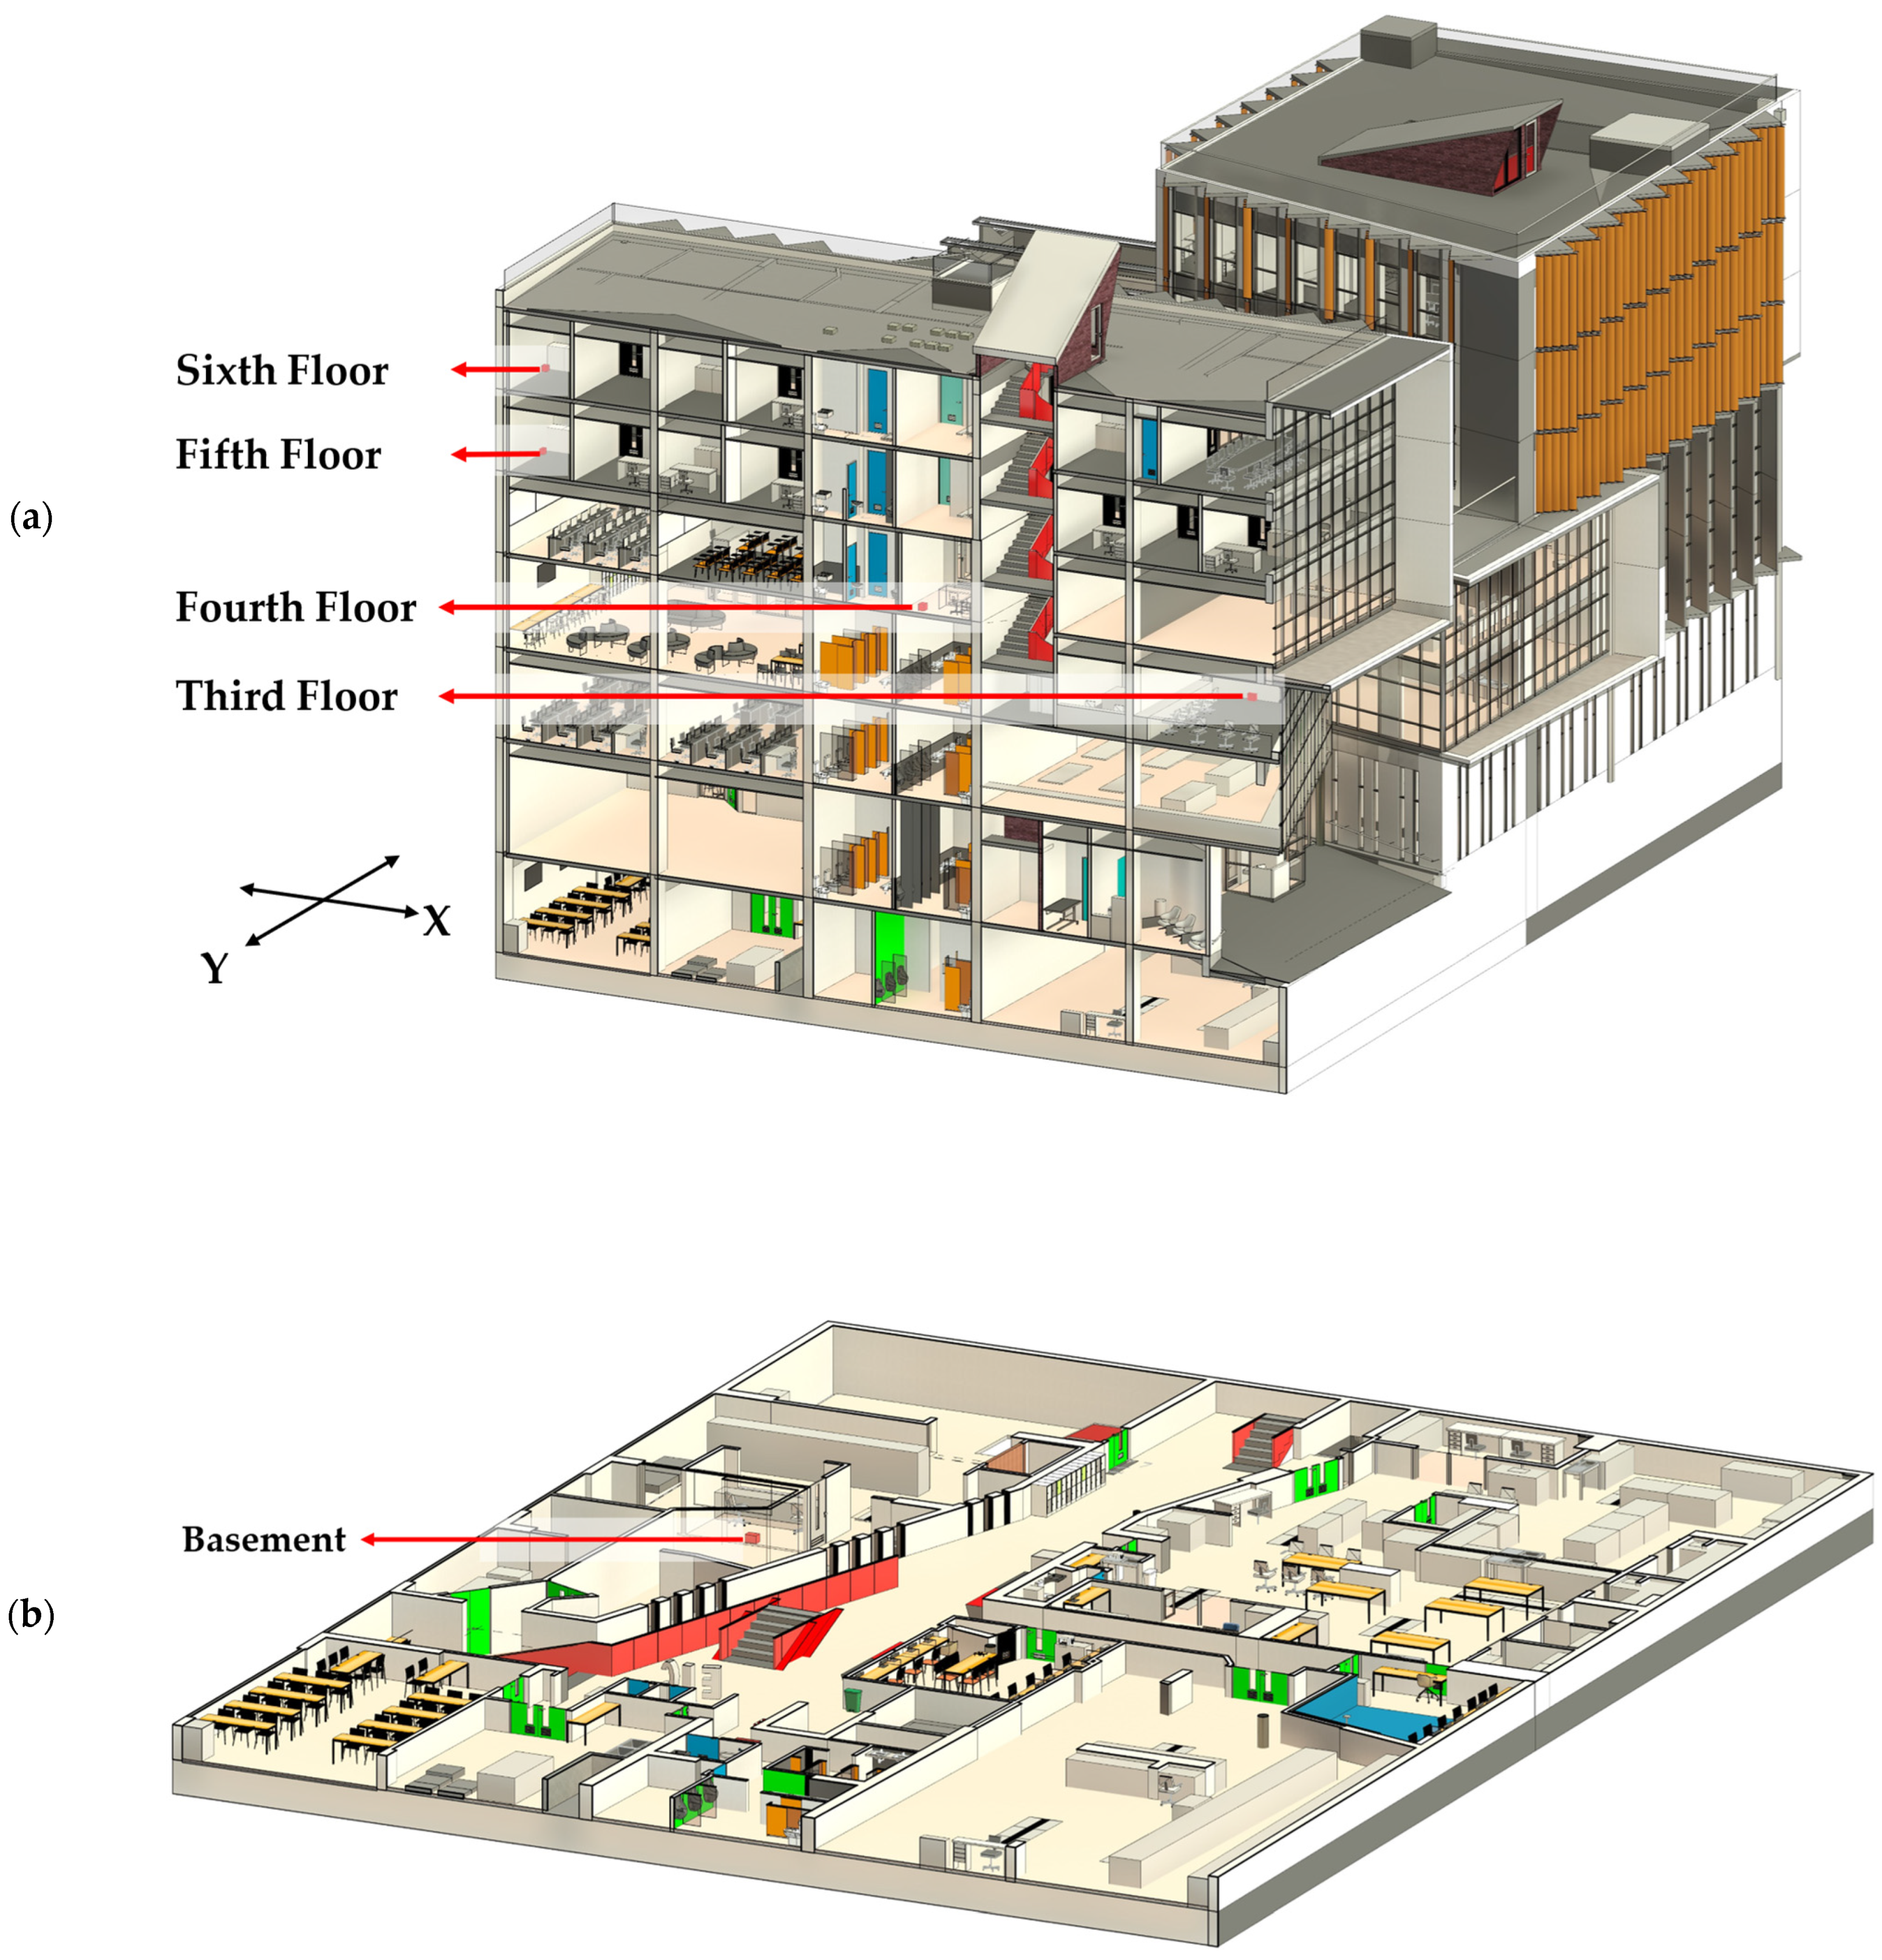
3. Tested Building Description

This study focuses on a 6-story building, including a basement, located at the School of Civil Engineering of the Pontificia Universidad Católica de Valparaíso, in the Valparaíso region of Chile. The building has an approximate height of 22 m and features a structural layout based on RC shear walls. It consists of three separate towers (structurally decoupled), which share the basement and the first three floors. Above this level, two of the towers extend up to the sixth floor, each with a rooftop terrace.
Figure 2 illustrates the building under study. On the left (a), a photograph of the building is shown, while on the right (b), the digital model developed in Revit is presented.
The instrumentation of the building began in November 2022 and extended intermittently until October 2024, allowing for vibration monitoring throughout this period. Levels −1, 3, 4, 5, and 6 were instrumented, with triaxial accelerometers installed to record the dynamic response of the structure. These floors were strategically selected to capture the variability in the dynamic response from the basement to the top of the building.
Figure 3 illustrates the placement of the sensors during the monitoring periods. In part (a), the sensors located on levels 3, 4, 5, and 6 are shown, providing a detailed view of the upper stories. In part (b), the distribution of sensors in the basement is displayed, highlighting the instrumentation at the foundation level.

4. Experimental Procedure

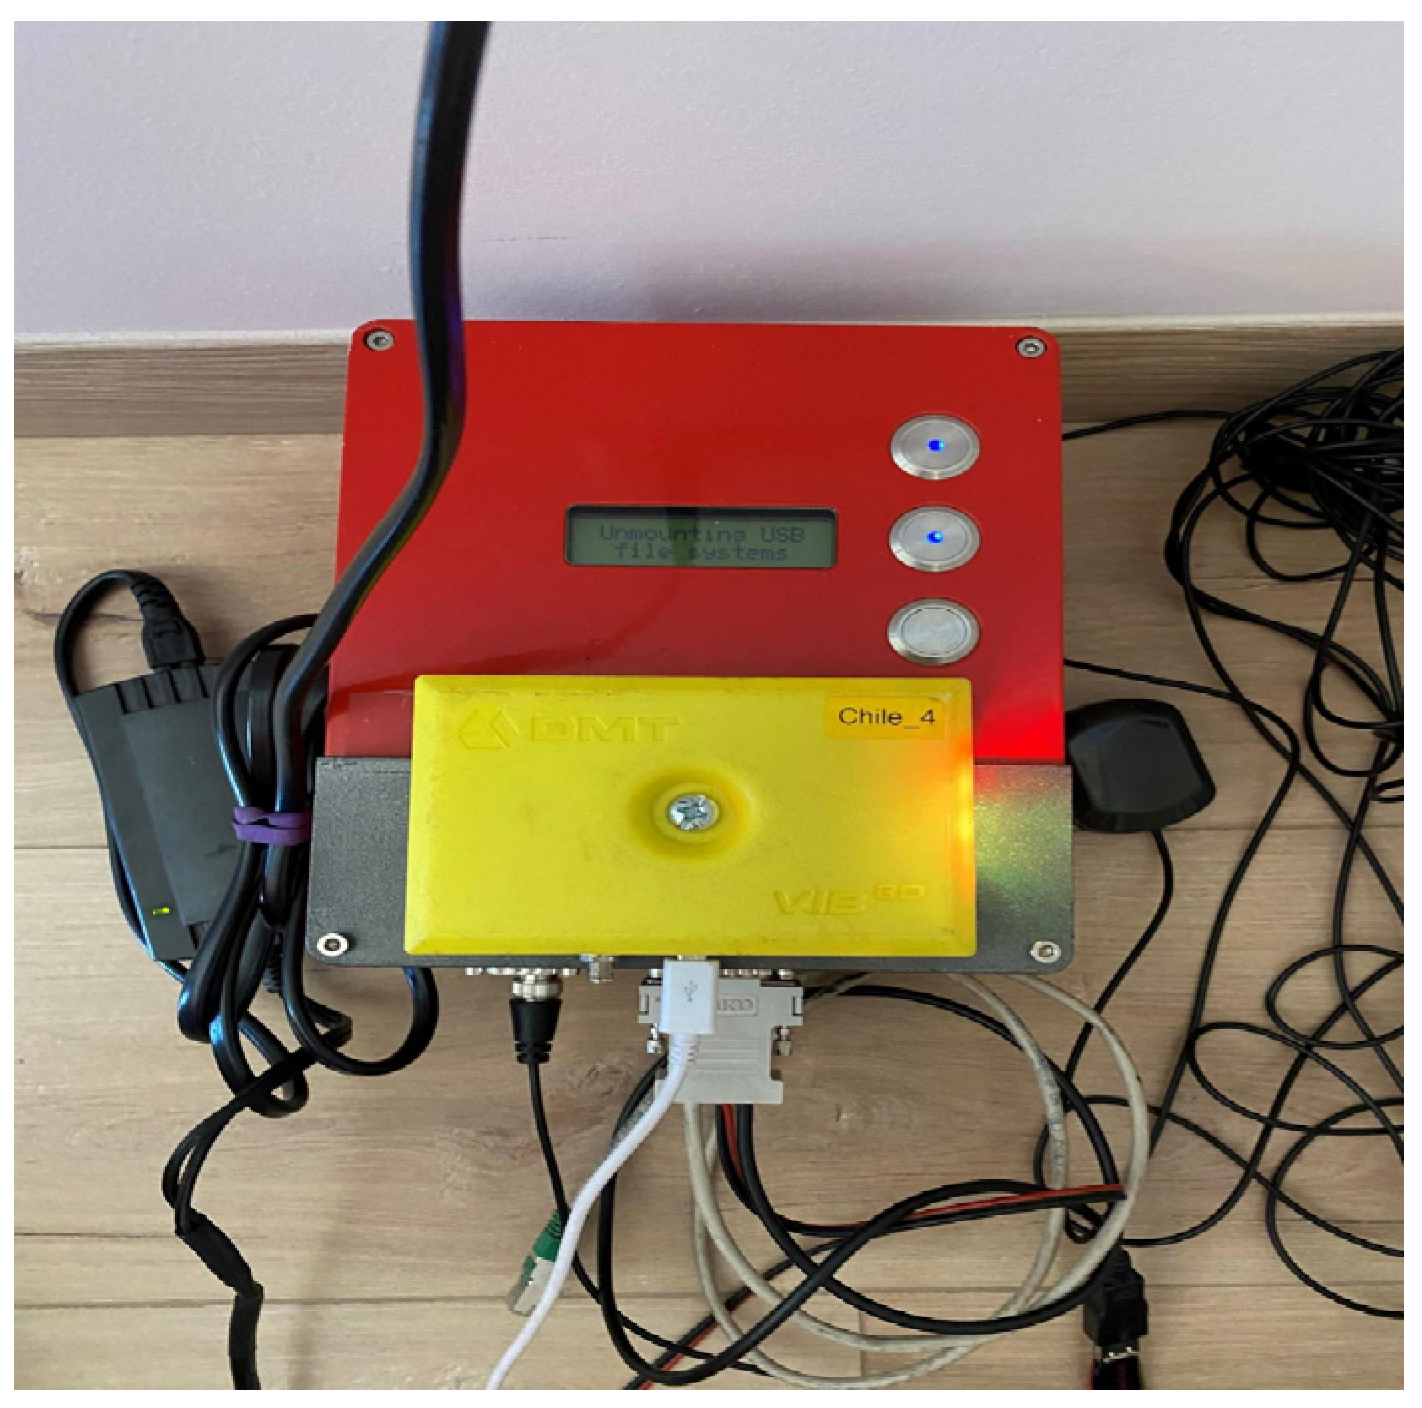
4.1. Instrumentation

For vibration recording, triaxial force-balance accelerometers from the SARA brand, model SL06 ACEBOX, were used. These devices integrate three sensors corresponding to the X, Y, and Z directions, allowing the dynamic response to be captured in the building’s three orthogonal axes. Figure 4 shows an accelerometer installed in the building. Table 2 summarizes the main characteristics of these accelerometers.

4.2. Monitoring Campaign

The monitoring campaign was developed with the objective of capturing the building’s dynamic responses under various loading conditions, including ambient, seismic, and construction-induced vibrations from an adjacent structure [15]. Accelerometers were installed on levels −1 (basement), 3, 4, 5, and 6 of the building, allowing for comprehensive coverage from the basement to the upper floors. To adapt to the operational conditions and optimize data capture, datasets were generated with configurations of two, three, and four synchronized accelerometers. Figure 5 shows acceleration records for ambient vibration, a seismic event, and vibrations from adjacent construction.
While the monitoring campaign was conducted with only four accelerometers due to resource limitations, the placement of the sensors was carefully planned to ensure sufficient spatial coverage of the building’s dynamic response. This approach aligns with previous studies, such as those by Azzara et al. [6] and Ruggieri et al. [37], which demonstrate that limited sensor configurations, when strategically placed, can provide valuable insights into the dynamic behavior of structures.
Nevertheless, it is important to acknowledge that using a reduced number of sensors may introduce a margin of error in the characterization of the building’s dynamic response. Factors such as unmeasured local effects or missed modal contributions could influence the results. However, this potential limitation was mitigated by complementing the accelerometer data with modal frequencies obtained from the numerical model. This combination of experimental and numerical data not only enhanced the accuracy of the dynamic characterization but also helped confirm key frequencies identified through the monitoring campaign, thus increasing the reliability of the findings.

5. Results

In this section, the results of the structural monitoring campaign are presented, based on the number of synchronized sensors during different data acquisition periods. Figure 6 shows the dates corresponding to the synchronized data records for configurations involving two, three, and four synchronized sensors. This visualization highlights the periods during which data acquisition was carried out with each sensor configuration.
The color coding in the figure distinguishes the number of synchronized sensors, with blue lines representing configurations with two synchronized sensors, green lines indicating configurations with three synchronized sensors, and red lines denoting configurations with four synchronized sensors. The continuity of each line indicates the days with complete synchronization, while the gaps reflect periods without recorded data.
Based on the synchronized data, the analysis is conducted to characterize the building’s dynamic responses under different loading conditions, including ambient vibrations, seismic events, and vibrations induced by adjacent construction. For each case, stable frequencies are identified using the SSI-COV method, and their modal participation is evaluated through stabilization diagrams and dispersion plots. These analyses allow the observation of frequency patterns and variability across different model orders, providing information on the stability and dynamic characteristics of the structure.

5.1. Ambient Vibration Results for 2022–2023

The following results correspond to the analysis of vibration data recorded during the 2022–2023 period, analyzed in 10 min intervals. Figure 7 presents the results obtained from the analysis of the raw data with a sampling frequency of 400 Hz using the SSI-COV method. This figure shows the stable frequencies identified for each model order, ranging from order two to twenty-four, for a scenario with four synchronized sensors and for two different tolerance cases. It is important to note that these results correspond to the X direction of the building.
In both subgraphs, each point corresponds to a frequency identified at a specific model order, and the heat map color palette of the points indicates the modal participation of that frequency. It should be noted that in each individual analysis, based on 10 min segments of synchronized data, multiple stable frequencies can be found in different orders, which is essential for understanding the mode identification. The modal participation indicates how dominant or significant that frequency is in terms of its contribution to the system’s dynamics. The color range in the graph, shown in the right-side color bar, visually represents this percentage, where warmer colors (reds) indicate frequencies with higher participation, while cooler colors (blues) indicate frequencies with lower significance.
On the vertical axis, the frequency is represented in Hertz (Hz), while on the horizontal axis, the model order is shown. This representation facilitates the identification of stable modes and allows observations of how the dominant frequencies change as the model order increases. In this context, the tolerance values used play a significant role in determining stability. Specifically, two different tolerance configurations were applied. in the graph on the left, a more relaxed tolerance is applied, with the frequency tolerance f t o l set at 0.01, the damping tolerance ζ t o l at 0.04, and the Modal Assurance Criterion tolerance M A C t o l at 0.01. Meanwhile, in the graph on the right, a stricter tolerance configuration is applied, with all three tolerances ( f t o l , ζ t o l , and M A C t o l ) set at 0.01.
The difference in tolerances allows an examination of the consistency of the identified frequencies. It can be observed that even with a stricter tolerance in the right graph, the resulting identified frequencies remain largely consistent with those in the left graph. This suggests that the stricter tolerance values chosen did not significantly alter the identification of dominant frequencies, implying a robust and stable system response, regardless of the applied tolerances. Analyzing different tolerance cases helps confirm the stability of the identified modes and reduces uncertainties in the results. This also suggests that the initial tolerance configuration might already be sufficiently strict for this analysis.
This observation reinforces the idea that a 400 Hz sampling frequency may be excessive for the type of analysis being conducted, as it introduces high-frequency components that do not provide valuable information about the structural dynamics. This aligns with the notion that a lower sampling frequency might be more suitable, focusing on capturing the dominant modes within a lower frequency range where the actual natural frequencies of the structure are expected to reside. In essence, the presence of high-frequency data that do not correspond to relevant modes suggests that the sampling rate may be unnecessarily high, resulting in the inclusion of extraneous high-frequency information. Therefore, a reduction in the sampling frequency to 30 Hz could be more appropriate for capturing the significant dynamic behavior of the structure, while also requiring less processing.
Next, the results of ambient vibration recordings for the 2022–2023 period are presented after applying downsampling to 30 Hz. This step was carried out with the aim of reducing the frequency range analyzed and focusing on the frequencies that are more relevant to the structural dynamics. Unlike the previous analysis of the raw data, this time, both the X and Y directions of the building were considered to observe possible variations in the identified frequencies along both directions.
Figure 8 presents the results of the downsampling data analysis for both the X and Y directions, considering the two frequencies with the highest modal participation, provided they have a participation percentage greater than 10%. The figure on the left corresponds to the frequencies identified in the X direction, while the figure on the right shows the frequencies identified in the Y direction. In both figures, the tolerance parameters used were a frequency tolerance ( f t o l ) of 0.01, damping tolerance ( ζ t o l ) of 0.01, and MAC tolerance ( M A C t o l  l) of 0.01.
By focusing on the frequencies with the highest modal participation, the analysis seeks to reduce noise and less relevant information, facilitating the identification of patterns in the dynamic behavior of the structure. The selection of the two main frequencies is based on their relevance in terms of modal participation, as they typically reflect the most representative vibrational characteristics of the system.
There is a clear accumulation of frequencies around the value of 2.5 Hz in both directions (X and Y). This concentration indicates the presence of a dominant mode at this frequency, suggesting that this mode is consistent and significant in both directions. The persistence of this mode across different orders reinforces its importance in the building’s structural dynamics.
Another notable point is the clustering of frequencies around 10 Hz, especially in the Y direction, where this concentration seems more pronounced. This could imply the existence of a second important natural mode at this frequency, related to the vibration modes that significantly contribute to the structure’s dynamic response.
Although similarities in frequency concentrations are observed in both graphs, there are also some notable differences. For example, in the Y direction, frequencies higher than 10 Hz show greater dispersion compared to the X direction, where the concentration is denser.
In the frequency range shown (up to 15 Hz), there is a higher concentration of points at lower frequencies, indicating the relevance of these frequencies in the structural dynamics. As the frequency increases, the point density decreases and dispersion increases, especially above approximately 13 Hz, suggesting that lower frequencies are usually more representative of the natural vibration modes in structures of this type.
In summary, the analysis reveals two dominant frequency ranges around 2.5 Hz and 10 Hz that are common in both directions, indicating relevant modes for the structure. The difference in dispersion between the two directions and the lack of concentration at higher frequencies highlight the importance of these dominant modes, while higher frequencies seem to be less significant for the structural dynamics.
Based on these initial results, the analysis was centered on the identified frequency range around 2.5 Hz. A band-pass filter was applied to the original data sampled at 400 Hz, specifically targeting this frequency of interest. In Figure 9 the analysis focused on 2.5 Hz is presented, considering the two frequencies with the highest participation per analysis and those with a participation factor greater than 10%. This approach allows for a more detailed and precise study of the predominant components in the structure, aligned with the previously described methodology.
The graph in Figure 9 shows how the increase in the model order leads to greater dispersion of the data, indicating that as the complexity of the model increases, additional frequencies are identified that are not evident in lower orders. This phenomenon is expected, as higher orders in the SSI-COV method allow for the capture of a greater number of potential modes, although some of these may not be relevant to the analyzed structure.
In higher orders, there appears to be a concentration of frequencies in two ranges, one around 2.4 to 2.5 Hz and another around 2.7 to 2.8 Hz. Specifically, in orders 18, 19, 20, and 21, a prominent band of points can be observed around 2.5 Hz, while in orders 15 and 19, there is an accumulation of points with higher participation in the 2.7 Hz frequency range. This distribution suggests the possible presence of two relevant dynamic modes in these ranges, which could be associated with interactions or coupling between modes in different directions of the building. The identification of these frequencies with notable participation may indicate their importance in the structural dynamics of the building.
Given the observed dispersion, and with the aim of identifying possible boundaries between frequencies at each order, a clustering procedure using the k-means algorithm was applied. This method automatically groups the frequencies based on their proximity and participation, objectively establishing the boundaries between different groups of identified frequencies. Figure 10 presents the results of this clustering analysis, highlighting the boundaries between frequency groups based on the different orders considered.
The presented graph shows the identified frequencies for each order using a filter centered at 2.5 Hz. The colors of the points represent the different groups formed through the k-means clustering method, while the red points indicate the boundaries between frequency groups, which were automatically identified by the algorithm. It is observed that as the model order increases, more groups are formed, suggesting that additional frequencies are being identified as the model becomes more complex.
The presence of these frequency groups within the same order reinforces the idea that there may be different dynamic modes that are coupled or have a predominant influence in the X direction of the building. The persistence of certain groups across multiple orders suggests that these modes are relevant to the structure and may be exhibiting consistent responses through the model.
This differentiation between groups could indicate a significant interaction of these modes with the structure or the manifestation of structural modes influencing different directions or components of the system.
Based on the boundaries identified through the clustering analysis, and with the purpose of analyzing the concentration of data by order, a threshold of 2.5 Hz was established for constructing boxplots for each order. This approach allows for a detailed observation of the dispersion and variability of frequencies. This threshold serves as a differentiating point between frequencies that could be associated with distinct dynamic modes or coupled influences within the structure.
The division at 2.5 Hz aims to provide a more precise approach to analyzing the behavior of frequency dispersion as the system order increases. In Figure 11, the boxplots illustrate the variability within each order and allow for an evaluation of the potential impacts of dynamic modes that manifest below and above this established threshold. This separation is essential for interpreting how these modes may influence the overall structural behavior and for identifying possible correlations or interactions between the detected frequency groups.
The graph presented in Figure 11 facilitates the analysis of the dispersion of identified frequencies, distinguishing two subsets based on the 2.5 Hz threshold. This separation underscores differences in the variability of frequencies across the different model orders. Frequencies exceeding 2.5 Hz exhibit greater dispersion compared to those below this threshold, suggesting the presence of dynamic modes or external factors that increase the complexity of the structural response in this range. Conversely, frequencies below 2.5 Hz display a more uniform dispersion, potentially indicating that the modes in this region are more stable or less affected by dynamic interactions.
The numerous outliers observed in both subsets highlight the presence of frequencies that deviate significantly from the average behavior. For frequencies above 2.5 Hz, the outliers are more widely dispersed and appear across a greater number of orders, supporting the hypothesis that modes in this range are more sensitive to external influences or model complexity. In contrast, frequencies below 2.5 Hz show less dispersed outliers with greater uniformity, indicating a smaller deviation of modes from their central tendencies.
As the model order increases, particularly for frequencies above 2.5 Hz, the boxplots reveal a trend toward greater dispersion. This pattern suggests that higher model orders capture additional modes or reflect more intricate structural responses due to increased model sophistication. Overall, this analysis elucidates the influence of dynamic modes across different frequency ranges and highlights how increasing the model order affects mode identification and frequency dispersion. These findings contribute to a deeper understanding of the structure’s overall behavior and aid in identifying potential correlations or interactions among the detected frequency groups.

5.2. Ambient Vibration Results for 2024

Based on the analysis of the previously obtained results, the 2024 ambient vibration study once again focuses on the frequency range around 2.5 Hz, which was identified as relevant to the structural dynamics. Using a band-pass filter applied to the original data sampled at 400 Hz, the two frequencies with the highest participation per analysis were identified, considering only those with a participation factor greater than 10% and maintaining the same tolerance for the dynamic parameters as in the previous results.
Figure 12 shows the results of the 2024 ambient vibration data, focusing on the frequency around 2.5 Hz. This analysis centers on identifying the dominant frequencies and their participation in the range of interests, using data collected from four synchronized sensors.
Continuing with the analysis, the clustering process is applied to the data to identify frequency boundaries. In Figure 13, it can be observed how the frequencies are grouped into different categories. Consistent with the previously analyzed data, red points represent the frequency boundaries identified for each model order, enabling the observation of dominant frequency ranges and their variations as the model order increases.
When comparing the clustering results between the periods of 2022–2023 and 2024, a similar trend is observed in the stability and grouping of frequencies as the model order increases. In both analyses, the dominant frequencies in the range close to 2.5 Hz show consistency in their identification, standing out as significant modes across different orders. As the model order increases, the frequencies tend to group coherently, and the frequency boundaries, indicated in red, maintain similar values in both periods, reflecting possible stable patterns in the structural dynamics.
To analyze the concentration of data by order, boxplots were constructed while maintaining the 2.5 Hz threshold. Figure 14 presents these charts, allowing a visualization of the dispersion and variability of frequencies in each order, with frequencies above 2.5 Hz shown at the top and frequencies below 2.5 Hz at the bottom.
It can be observed that for frequencies above 2.5 Hz, there is a greater dispersion compared to frequencies below this threshold, suggesting the existence of additional dynamic modes or the influence of factors that increase the complexity of the structural response in this region. In contrast, frequencies below 2.5 Hz show a more uniform dispersion, which could indicate that modes in this region are more stable or less susceptible to dynamic interactions.
The presence of numerous outliers in both subsets highlights the existence of frequencies that deviate significantly from the average behavior. For frequencies above 2.5 Hz, the outliers are more dispersed and observed across a larger number of orders, reinforcing the hypothesis that the modes in this region are more sensitive to external factors or model complexity. In the case of frequencies below 2.5 Hz, the outliers are less dispersed and exhibit greater uniformity, suggesting a lesser deviation of modes from their central behavior.
As the model order increases, especially for frequencies above 2.5 Hz, the boxplots show a tendency toward greater dispersion. This pattern indicates that at higher orders, additional modes are being identified, or the structure exhibits more complex responses as the model becomes more sophisticated. Overall, this analysis allows the interpretation of the influence of dynamic modes across different frequency ranges and how increasing model order can impact mode identification and the frequency dispersion. These results are essential for a better understanding of the overall behavior of the structure and identifying potential correlations or interactions between the detected frequency groups.
Comparing the 2024 results with those from 2022–2023, consistent behavior is observed in the dispersion and stability of modes across different orders and frequency ranges. Both campaigns show greater variability for frequencies above 2.5 Hz and more controlled dispersion for lower frequencies, reinforcing the reliability of the dynamic patterns identified in both analysis periods.

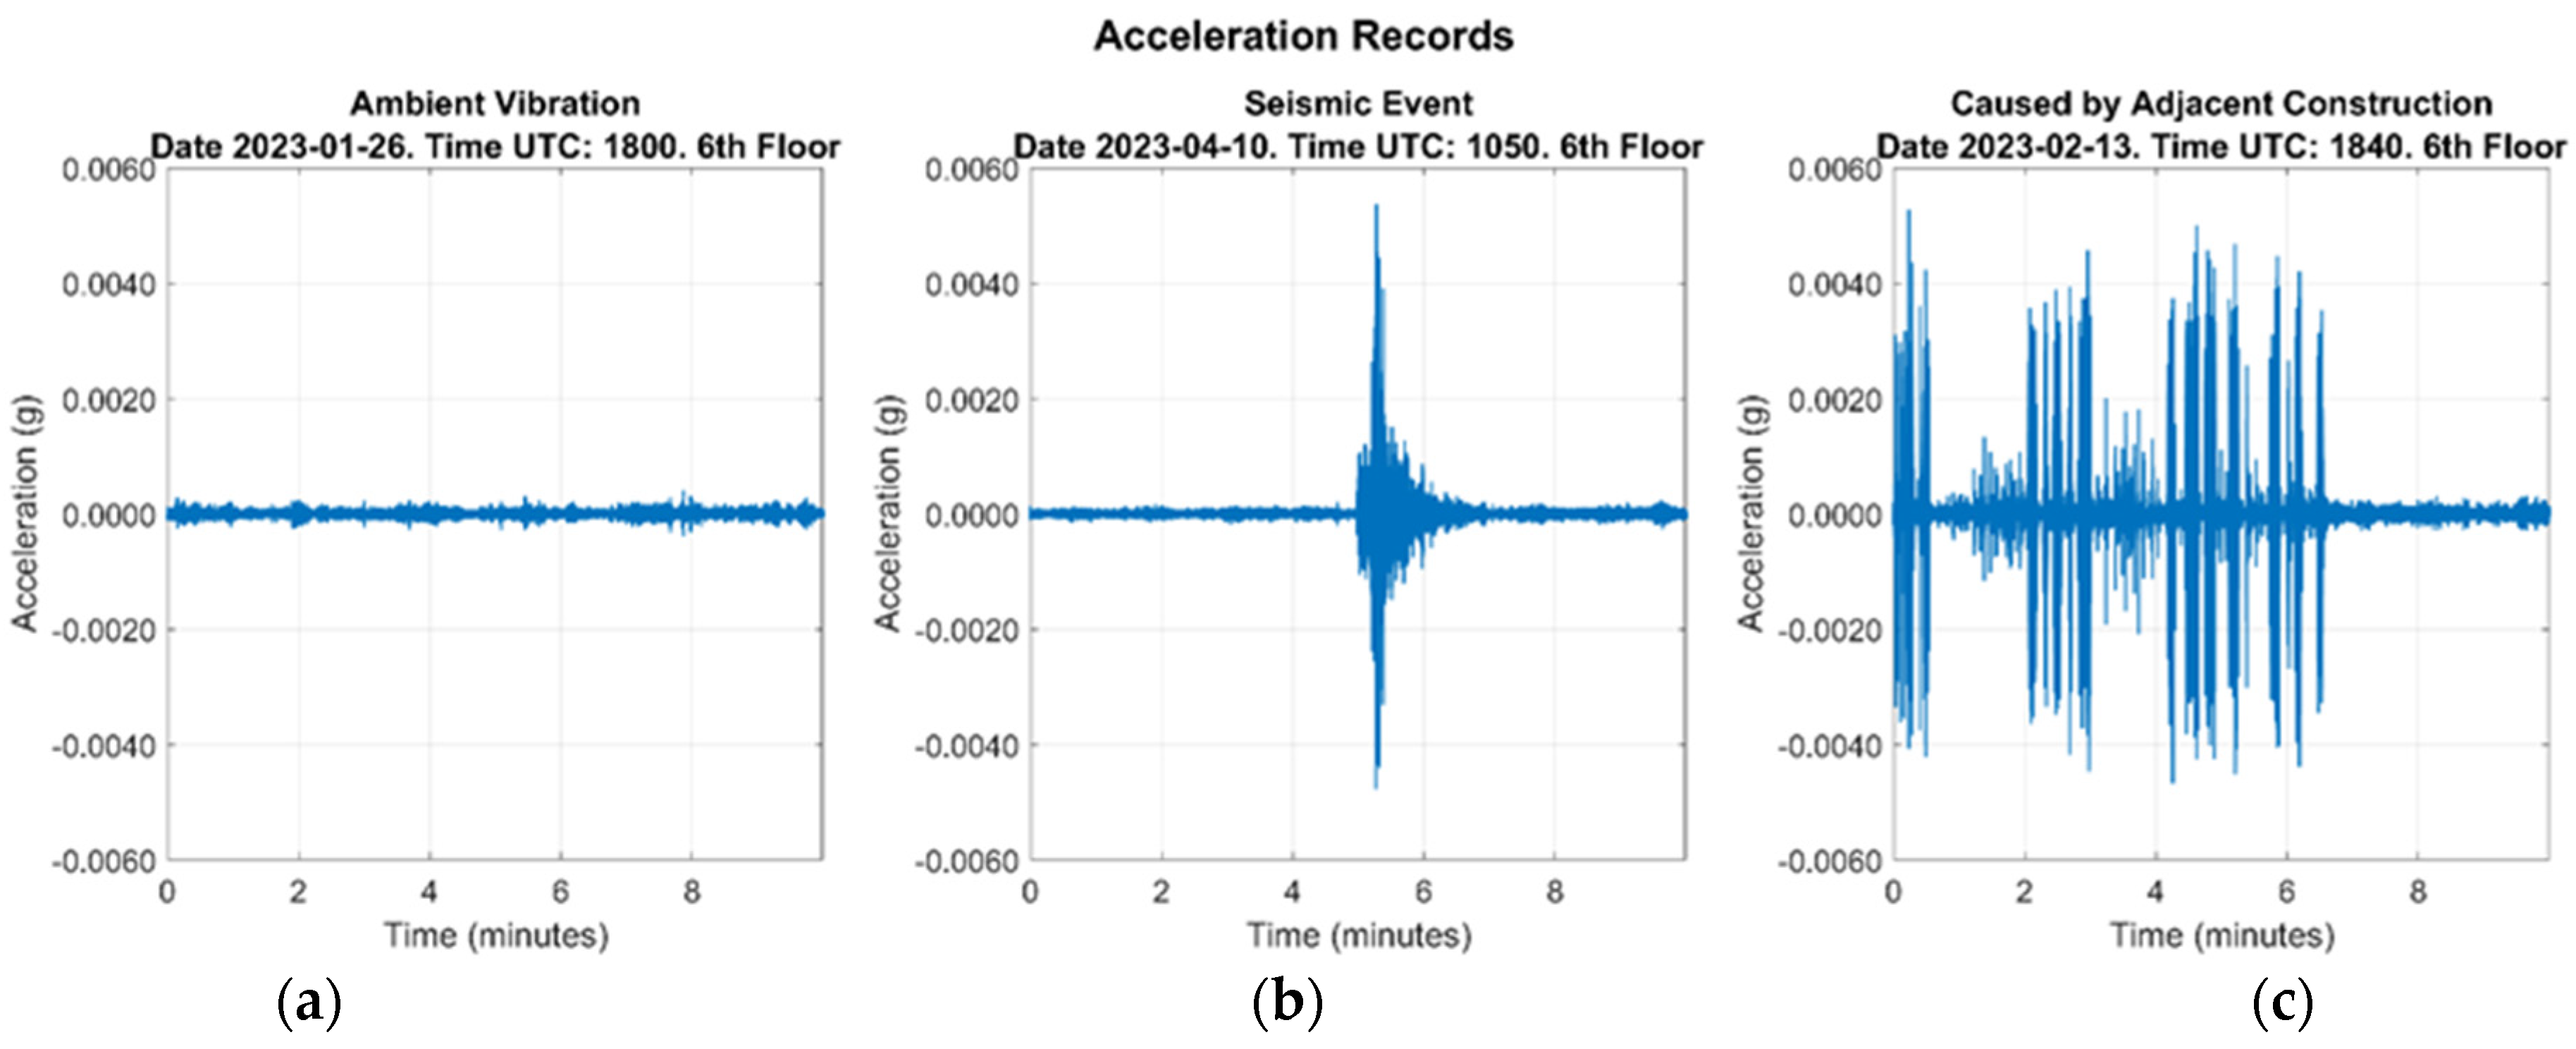
5.3. Seismic Event Results

To begin the analysis of seismic records, a compilation of all recorded events throughout the study was made, given that the amount of individual data is limited. With these unified data, the same analysis approach used for ambient vibrations was continued, focusing on the same frequency range previously identified. This procedure allows a coherent comparison between the dynamic modes associated with seismic events and those obtained in the ambient vibration analysis, thus enriching the understanding of the structural behavior under different conditions.
Based on this approach, the analysis of seismic records now considers all identified frequencies per analysis, focusing only on those with a participation factor greater than 10%. In Figure 15, the graph illustrating these identified frequencies by model order can be observed.
Distinct frequency bands are observed, particularly around 2.4 Hz, 2.5 Hz, and 2.7 Hz, where higher participation factors are noted. This concentration at specific frequencies indicates that these ranges have a notable influence on the structural dynamics.
To analyze the concentration of data by order in the seismic records, boxplots were constructed using the 2.5 Hz threshold as a reference, despite the limited amount of data. This analysis seeks to provide insights into the dispersion and variability patterns for each order, maintaining consistency with the results from the ambient vibration analysis. Figure 16 presents the chart, where frequencies above 2.5 Hz are shown at the top and frequencies below 2.5 Hz at the bottom.
For frequencies above 2.5 Hz, a greater level of data dispersion is evident. The mean values across different orders in this range are higher than those observed in the ambient vibration records, potentially due to the smaller dataset available for the seismic analysis compared to the ambient vibration analysis. This increased dispersion may indicate that the structure exhibits greater variability in its dynamic response within this frequency range.
In contrast, frequencies below 2.5 Hz display more uniform and stable dispersion, suggesting that the modes in this range are more consistent and less affected by dynamic interactions. Within this range, the frequency of 2.4 Hz emerges as a notable and stable value in the structure. This frequency holds particular relevance, as it is consistently identified in both seismic records and ambient vibration analyses, reinforcing its importance in the structure’s dynamic behavior.

5.4. Adjacent Construction Activity Results

For the analysis of vibration records generated by adjacent construction activity, the same procedure previously applied to ambient vibrations and seismic records was followed.
A representative dataset of vibrations generated by construction activity was compiled. These data were processed using the same frequency selection criteria, focusing on those with participation factors above 10%. Figure 17 shows the identified frequencies by mode order in the system, allowing for the observation of relevant frequency bands in the records associated with this specific activity.
The graph in Figure 17 highlights several frequency concentrations, particularly around 2.4 Hz, 2.5 Hz, and 2.7 Hz. These concentrations suggest that these specific frequencies are of notable relevance, as they consistently appeared in previous analyses of ambient vibrations and seismic activity.
To examine the concentration of data by order in the construction records, boxplots were generated while maintaining the 2.5 Hz threshold, consistent with prior analyses. This representation provides a visual interpretation of dispersion and variability patterns across orders, ensuring alignment with the results from ambient vibration and seismic analyses. Figure 18 shows the boxplots, with frequencies above 2.5 Hz at the top and frequencies below 2.5 Hz at the bottom.
The boxplots for frequencies above 2.5 Hz reveal significant data dispersion, which may indicate greater variability in the system’s dynamic response within this frequency range under construction vibrations. In contrast, frequencies below 2.5 Hz display a more uniform and stable dispersion, suggesting greater consistency and reduced susceptibility to dynamic interactions in this range.
The frequency around 2.4 Hz emerges as a notable and stable component of the structure, consistently appearing in the results of ambient, seismic, and construction vibration analyses. This consistency underscores the relevance of this frequency in the dynamic behavior of the structure.
To analyze the time-dependent behavior of the system’s dynamic response, Figure 19 presents a specific study of the frequencies of order 24, filtered in relation to 2.5 Hz, both below and above this threshold. For this visualization, all frequencies of this order were extracted in 10 min intervals, maintaining the previous analyses of the range below 2.5 Hz and adding an additional analysis of the higher range. In each analysis, the frequency with the highest participation within each interval was selected. Then, the daily mean of these maximum frequencies was calculated to observe its evolution over time.
The main objective of this graph is to monitor the consistency and behavior of these specific frequency ranges over time under different sensor synchronization configurations. Independent analyses were conducted using two, three, and four synchronized sensors to evaluate how the mean of these frequencies varies based on the number of sensors used. This comparison helps to understand whether the number of sensors influences the stability or variability of the analyzed frequencies and how they respond to different dynamic conditions over time.
Additionally, diamond-shaped markers were included in the graph to represent seismic events and adjacent construction activities impacting the analyzed frequencies. This allows us to visualize whether these external events have any notable impact on the stability or variability of the frequencies. By analyzing these results, we can assess whether the frequencies in the observed ranges show consistent behavior, which could indicate structural stability, or if they exhibit variations that may signal the influence of external factors or the inherent dynamic response of the system.

6. Conclusions

Structural health monitoring has become a crucial tool for evaluating the safety and performance of critical infrastructure, enabling the early detection of potential damage and supporting maintenance planning. The use of advanced methodologies to analyze dynamic responses under various excitation sources has enhanced the understanding of structural behavior and resilience under environmental conditions and external events.
The results of this study on structural health monitoring (SHM) conducted on a reinforced concrete building in Valparaíso, Chile, can be extended and generalized to other similar cases through several key aspects. The methodology employed, based on the SSI-COV method, provides a robust framework for analyzing structural frequencies, assessing their stability over time, and detecting changes in structural behavior under various excitation sources, such as ambient vibrations, seismic events, and construction-induced vibrations. This approach is adaptable to other infrastructures, including critical facilities like bridges, tunnels, and historical buildings, where early damage detection is vital for safety. Complementing experimental data with numerical models, as demonstrated in this study, enhances the reliability of findings by providing additional insights into modal frequencies and validating the results. Advanced statistical methods, such as probabilistic or Bayesian approaches, could further refine the characterization of dynamic behavior by quantifying uncertainties and enabling the calibration of finite element (FE) models through optimization processes [38,39]. The strategic placement of synchronized sensors ensured sufficient spatial coverage and accurate frequency identification, despite the limited number of sensors. This principle can be generalized to other structures by employing low-cost sensors, enabling real-time monitoring even in regions with limited resources. The study highlights the distinct effects of various excitation sources, emphasizing the importance of monitoring diverse types of vibrations to capture a complete dynamic profile of the structure. Moreover, the consistent identification of the 2.4 Hz frequency across all excitation sources underscores its relevance as a baseline indicator of structural health, which could be tracked in similar structures to detect deviations over time. Integrating SHM data into digital models or digital twins could further enhance real-time monitoring, simulate structural responses under varying conditions, and optimize maintenance strategies, providing a scalable and cost-effective solution for diverse infrastructures. Future improvements could include the integration of advanced statistical methods to improve the interpretation of results, particularly under variable conditions or with limited data, highlighting the potential of combining deterministic and probabilistic approaches for structural monitoring. Finally, expanding SHM systems into regional seismic monitoring networks would enable large-scale assessments of structural stability, providing valuable insights for regional planning and resilience strategies.

Author Contributions

Conceptualization, S.L.-A., A.L., J.A.L.-G. and S.F.; methodology, S.L.-A., A.L., E.A., S.F. and J.A.L.-G.; software, S.L.-A. and M.G.; formal analysis, S.L.-A.; investigation, S.F., A.L., E.A. and J.A.L.-G.; resources, S.F., J.A.L.-G., A.L. and E.A.; data curation, S.L.-A., A.L. and S.F.; writing—original draft preparation, S.L.-A.; writing—review and editing, S.F., A.L., E.A., M.G. and J.A.L.-G.; supervision, S.F., A.L. and M.G. All authors have read and agreed to the published version of the manuscript.

Funding

This research was funded by Ministerio de Economía y Competitividad grant number PID2021-126405OB-C32. Part of this research has also been funded by the Chilean Fondo Nacional de Ciencia y Tecnología, Fondecyt Iniciación en Investigación through Grant #11241507.

Data Availability Statement

The raw data supporting the conclusions of this article will be made available by the authors on request.

Acknowledgments

We sincerely thank the School of Civil Engineering and the LABSENS Laboratory at the Pontificia Universidad Católica de Valparaíso for generously providing the spaces and equipment essential for conducting this research. Their support was instrumental in achieving the outcomes of this study.

Conflicts of Interest

The authors declare no conflicts of interest.

References

  1. Beskhyroun, S.; Navabian, N.; Wotherspoon, L.; Ma, Q. Dynamic behaviour of a 13-story reinforced concrete building under ambient vibration, forced vibration, and earthquake excitation. J. Build. Eng. 2020, 28, 101066. [Google Scholar] [CrossRef]
  2. Farrar, C.R.; Worden, K. An introduction to structural health monitoring. Phil. Trans. R. Soc. A. 2007, 365, 303–315. [Google Scholar] [CrossRef] [PubMed]
  3. Chen, H.; Ni, Y. Structural Health Monitoring of Large Civil Engineering Structures, 1st ed.; Wiley: Hoboken, NJ, USA, 2018. [Google Scholar] [CrossRef]
  4. Avci, O.; Abdeljaber, O.; Kiranyaz, S.; Hussein, M.; Gabbouj, M.; Inman, D.J. A review of vibration-based damage detection in civil structures: From traditional methods to Machine Learning and Deep Learning applications. Mech. Syst. Signal Process. 2021, 147, 107077. [Google Scholar] [CrossRef]
  5. Zhang, L.; Brincker, R.; Andersen, P. An Overview of Operational Modal Analysis: Major Development and Issues. In Proceedings of the 1st International Operational Modal Analysis Conference (IOMAC 2005), Copenhagen, Denmark, 26–27 April 2005. [Google Scholar]
  6. Azzara, R.M.; Girardi, M.; Iafolla, V.; Lucchesi, D.M.; Padovani, C.; Pellegrini, D. Ambient Vibrations of Age-old Masonry Towers: Results of Long-term Dynamic Monitoring in the Historic Centre of Lucca. Int. J. Arch. Heritage 2021, 15, 5–21. [Google Scholar] [CrossRef]
  7. Reynders, E.; Maes, K.; Lombaert, G.; De Roeck, G. Uncertainty quantification in operational modal analysis with stochastic subspace identification: Validation and applications. Mech. Syst. Signal Process. 2016, 66–67, 13–30. [Google Scholar] [CrossRef]
  8. De Roeck, G. Model–Based Methods of Damage Identification of Structures Under Seismic Excitation. In Seismic Structural Health Monitoring; Limongelli, M.P., Çelebi, M., Eds.; Springer International Publishing: Cham, Switzerland, 2019; pp. 237–259. [Google Scholar] [CrossRef]
  9. Kamariotis, A.; Chatzi, E.; Straub, D. Value of information from vibration-based structural health monitoring extracted via Bayesian model updating. Mech. Syst. Signal Process. 2022, 166, 108465. [Google Scholar] [CrossRef]
  10. Zhang, W.; Li, J.; Hao, H.; Ma, H. Damage detection in bridge structures under moving loads with phase trajectory change of multi-type vibration measurements. Mech. Syst. Signal Process. 2017, 87, 410–425. [Google Scholar] [CrossRef]
  11. Gomes, G.F.; Mendez, Y.A.D.; Alexandrino, P.d.S.L.; da Cunha, S.S.; Ancelotti, A.C. A Review of Vibration Based Inverse Methods for Damage Detection and Identification in Mechanical Structures Using Optimization Algorithms and ANN. Arch. Comput. Methods Eng. 2018, 26, 883–897. [Google Scholar] [CrossRef]
  12. Zhelyazkov, A.; Wenzel, D.Z.H.; Furtner, P. A Procedure for Post-Earthquake Damage Estimation Based on Detection of High-Frequency Transients. Int. J. Struct. Constr. Eng. 2018, 12, 11. [Google Scholar]
  13. Samusev, M. Structural Health Monitoring Toolbox (shmtoolbox V.1.2.1). 2024. Available online: https://www.mathworks.com/matlabcentral/fileexchange/68988-shmtoolbox (accessed on 6 March 2022).
  14. Yin, Z.; Lu, Z.-R.; Liu, J.; Wang, L. Quantifying uncertainty for structural damage identification in the presence of model errors from a deterministic sensitivity-based regime. Eng. Struct. 2022, 267, 114685. [Google Scholar] [CrossRef]
  15. Gentile, C.; Saisi, A.; Cabboi, A. Structural Identification of a Masonry Tower Based on Operational Modal Analysis. Int. J. Arch. Heritage 2015, 9, 98–110. [Google Scholar] [CrossRef]
  16. LabSens—PUCV—Structure Health Monitoring. Available online: https://sites.google.com/pucv.cl/labsens/%C3%A1reas-de-trabajo/structure-health-monitoring (accessed on 7 November 2024).
  17. Toh, G.; Park, J. Review of Vibration-Based Structural Health Monitoring Using Deep Learning. Appl. Sci. 2020, 10, 1680. [Google Scholar] [CrossRef]
  18. Olivera-López, J.J.; Oyarzo-Vera, C.A. Diagnóstico estructural de un edificio de hormigón armado basado en su perfil bio-sísmico y un análisis dinámico incremental. Obras y Proy. 2020, 27, 95–106. [Google Scholar] [CrossRef]
  19. Argentino, A.; Bono, F.M.; Bernardini, L.; Romano, N.; Cazzulani, G.; Somaschini, C.; Belloli, M.; Cinquemani, S. Automated OMA Through SSI-COV Algorithm of a Warren Truss Railway Bridge Exploiting Free Decay Response. In Proceedings of the 10th International Operational Modal Analysis Conference (IOMAC 2024); Rainieri, C., Gentile, C., López, M.A., Eds.; Springer Nature: Cham, Switzerland, 2024; pp. 600–608. [Google Scholar] [CrossRef]
  20. Alustiza, D.H.; López, A.; Mineo, M.; Russo, N.A.; Zaccardi, Y.A.V. Introducción a los Sensores de Fibra Óptica para el Monitoreo de Salud de Estructuras Civiles. 2022. Available online: https://portal.amelica.org/ameli/journal/266/2663014002/ (accessed on 6 November 2024).
  21. Sivasuriyan, A.; Vijayan, D.S.; Górski, W.; Wodzyński, Ł.; Vaverková, M.D.; Koda, E. Practical Implementation of Structural Health Monitoring in Multi-Story Buildings. Buildings 2021, 11, 263. [Google Scholar] [CrossRef]
  22. Maas, S.; Nguyen, V.H.; Kebig, T.; Schommer, S.; Zürbes, A. Comparison of different excitation- and data sampling-methods in structural health monitoring. Civ. Eng. Des. 2019, 1, 10–16. [Google Scholar] [CrossRef]
  23. Jiazeng, J.S.; Changhao, Z.; Xi, C.; Cheng, N.L. Model Updating of a Shear-Wall Tall Building using Various Vibration Monitoring Data: Accuracy and Robustness. Struct. Des. Tall Spéc. Build. 2024, 33, e2114. [Google Scholar] [CrossRef]
  24. Gartner Mc Bain, L.F.; Minota Zea, Y.M. Evaluación Preliminar del Comportamiento de Láminas de Caucho Reciclado como Elemento de Apoyo en Modelos de Vigas Simplemente Apoyadas Sometidas a Vibraciones Horizontales. Ph.D. Thesis, Universidad Santo Tomás De Aquino Facultad De Ingeniería, Bogotá D.C., Colombia, 2019. Available online: https://1library.co/es/download/881108955325071362 (accessed on 6 November 2024).
  25. Mancini, A.; Cosoli, G.; Mobili, A.; Violini, L.; Pandarese, G.; Galdelli, A.; Narang, G.; Blasi, E.; Tittarelli, F.; Revel, G.M. A monitoring platform based on electrical impedance and AI techniques to enhance the resilience of the built environment. Acta IMEKO 2024, 13, 1–12. [Google Scholar] [CrossRef]
  26. Bonekemper, L.; Wiemann, M.; Kraemer, P. Automated set-up parameter estimation and result evaluation for SSI-Cov-OMA. Vibroengineering PROCEDIA 2020, 34, 43–49. [Google Scholar] [CrossRef]
  27. Maybeck, P.S. (Ed.) Chapter 4 Stochastic processes and linear dynamic system models. In Mathematics in Science and Engineering; Elsevier: Amsterdam, The Netherlands, 1979; pp. 133–202. [Google Scholar] [CrossRef]
  28. Sun, S.; Yang, B.; Zhang, Q.; Wüchner, R.; Pan, L.; Zhu, H. Fast online implementation of covariance-driven stochastic subspace identification. Mech. Syst. Signal Process. 2023, 197, 110326. [Google Scholar] [CrossRef]
  29. David, N.N.E.; Cherkaoui, S. Simulation Methods, Techniques and Tools of Computer Systems and Networks. 2024. Available online: https://www.sciencedirect.com/science/article/abs/pii/B9780128008874000171 (accessed on 13 October 2024).
  30. Miller, D.N.; de Callafon, R.A. Subspace Identification from Classical Realization Methods. IFAC Proc. Vol. 2009, 42, 102–107. [Google Scholar] [CrossRef]
  31. Pourgholi, M.; Gilarlue, M.M.; Vahdaini, T.; Azarbonyad, M. Influence of Hankel matrix dimension on system identification of structures using stochastic subspace algorithms. Mech. Syst. Signal Process. 2022, 186, 109893. [Google Scholar] [CrossRef]
  32. Wu, R.-T.; Jahanshahi, M.R. Data fusion approaches for structural health monitoring and system identification: Past, present, and future. Struct. Heal. Monit. 2020, 19, 552–586. [Google Scholar] [CrossRef]
  33. Tran-Ngoc, H.; Khatir, S.; De Roeck, G.; Bui-Tien, T.; Nguyen-Ngoc, L.; Wahab, M.A. Stiffness Identification of Truss Joints of the Nam O Bridge Based on Vibration Measurements and Model Updating. In Proceedings of ARCH 2019; Arêde, A., Costa, C., Eds.; Springer International Publishing: Cham, Switzerland, 2020; pp. 264–272. [Google Scholar] [CrossRef]
  34. Rainieri, C.; Fabbrocino, G. Influence of model order and number of block rows on accuracy and precision of modal parameter estimates in stochastic subspace identification. Int. J. Lifecycle Perform. Eng. 2014, 1, 317. [Google Scholar] [CrossRef]
  35. Li, B.; Liang, W.; Yang, S.; Zhang, L. Automatic identification of modal parameters for high arch dams based on SSI incorporating SSA and K-means algorithm. Appl. Soft Comput. 2023, 138, 110201. [Google Scholar] [CrossRef]
  36. Pereira, S.; Reynders, E.; Magalhães, F.; Cunha, Á.; Gomes, J.P. The role of modal parameters uncertainty estimation in automated modal identification, modal tracking and data normalization. Eng. Struct. 2020, 224, 111208. [Google Scholar] [CrossRef]
  37. Ruggieri, S.; Bruno, G.; Attolico, A.; Uva, G. Assessing the dredging vibrational effects on surrounding structures: The case of port nourishment in Bari. J. Build. Eng. 2024, 96, 110385. [Google Scholar] [CrossRef]
  38. Zhang, F.; Ni, Y.; Lam, H. Bayesian structural model updating using ambient vibration data collected by multiple setups. Struct. Control Heal. Monit. 2017, 24, e2023. [Google Scholar] [CrossRef]
  39. Song, M.; Behmanesh, I.; Moaveni, B.; Papadimitriou, C. Hierarchical Bayesian Calibration and Response Prediction of a 10-Story Building Model. In Model Validation and Uncertainty Quantification; Barthorpe, R., Ed.; Springer International Publishing: Cham, Switzerland, 2019; Volume 3, pp. 153–165. [Google Scholar] [CrossRef]
Figure 1. Methodological scheme of the SSI-COV application for structural health monitoring.
Applsci 15 01202 g001
Figure 2. Building representation: (a) photograph of the building and (b) digital model. Courtesy of the School of Civil Engineering, PUCV.
Applsci 15 01202 g002
Figure 3. Sensor distribution in the building: (a) upper floors (3rd to 6th levels), and (b) basement.
Applsci 15 01202 g003
Figure 4. SL06 ACEBOX triaxial accelerometer installed in the building.
Applsci 15 01202 g004
Figure 5. Exemplary acceleration records: (a) ambient vibration, (b) a seismic event, and (c) adjacent construction.
Applsci 15 01202 g005
Figure 6. Dates with synchronized data available for different sensor configurations.
Applsci 15 01202 g006
Figure 7. Stable frequencies in the X direction per order with 400 Hz sampling for 2022–2023 ambient vibration. (a) Tolerances: f t o l = 0.01, ζ t o l = 0.04, M A C t o l = 0.01. (b) Tolerances: f t o l = ζ t o l =   M A C t o l = 0.01.
Applsci 15 01202 g007
Figure 8. Stable frequencies per order in the X and Y directions (downsampling to 30 Hz, >10% participation) for 2022–2023 ambient vibration. (a) X direction: f t o l = ζ t o l =   M A C t o l = 0.01. (b) Y direction: f t o l = ζ t o l =   M A C t o l = 0.01.
Applsci 15 01202 g008
Figure 9. Identified frequencies in the X direction per order for data filtered at 2.5 Hz for 2022–2023 ambient vibration (only frequencies with >10% participation).
Applsci 15 01202 g009
Figure 10. Frequency grouping and boundaries across model orders using k-means clustering.
Applsci 15 01202 g010
Figure 11. Boxplots of orders grouped by a frequency threshold of 2.5 Hz for 2022–2023 ambient vibration. (a) Orders with frequencies greater than 2.5 Hz. (b) Orders with frequencies less than 2.5 Hz.
Applsci 15 01202 g011
Figure 12. Identified frequencies in the X direction per order for data filtered at 2.5 Hz for 2024 ambient vibration (only frequencies with >10% participation are shown).
Applsci 15 01202 g012
Figure 13. Frequency grouping and boundaries across model orders using k-means clustering.
Applsci 15 01202 g013
Figure 14. Boxplots of orders grouped by a frequency threshold of 2.5 Hz for 2024 ambient vibration. (a) Orders with frequencies greater than 2.5 Hz. (b) Orders with frequencies less than 2.5 Hz.
Applsci 15 01202 g014
Figure 15. Identified frequencies in the X direction per order for data filtered at 2.5 Hz for seismic events (only frequencies with >10% participation are shown).
Applsci 15 01202 g015
Figure 16. Boxplots of orders grouped by a frequency threshold of 2.5 Hz for seismic events. (a) Orders with frequencies greater than 2.5 Hz. (b) Orders with frequencies less than 2.5 Hz.
Applsci 15 01202 g016
Figure 17. Identified frequencies in the X direction per order for data filtered at 2.5 Hz for adjacent construction vibrations (only frequencies with >10% participation are shown).
Applsci 15 01202 g017
Figure 18. Boxplots of orders grouped by a frequency threshold of 2.5 Hz for adjacent construction vibrations. (a) Orders with frequencies greater than 2.5 Hz. (b) Orders with frequencies less than 2.5 Hz.
Applsci 15 01202 g018
Figure 19. Temporal evolution of the frequencies for system order 24.
Applsci 15 01202 g019
Table 1. Results of the modal analysis from the ETABS model.
ModeFrequency HZUX %UY%
11.941.940.01
22.2463.070.61
32.740.3666.31
47.301.870
59.3414.381.32
610.101.1917.94
Table 2. Parameters of the SARA SL06 ACEBOX.
ParametersNumerical Value
Standard range2 G
ADC resolution32 bits
Dynamic range144 dB
Sampling frequency400 HZ
Disclaimer/Publisher’s Note: The statements, opinions and data contained in all publications are solely those of the individual author(s) and contributor(s) and not of MDPI and/or the editor(s). MDPI and/or the editor(s) disclaim responsibility for any injury to people or property resulting from any ideas, methods, instructions or products referred to in the content.

