Article

Analysis of Tunnel Lining Damage Characteristics Under the Combined Actions of Fault Dislocation and Seismic Action

1
School of Civil Engineering, Lanzhou Jiaotong University, Lanzhou 730070, China
2
Key Laboratory of Road & Bridge and Underground Engineering of Gansu Province, Lanzhou Jiaotong University, Lanzhou 730070, China
*
Author to whom correspondence should be addressed.
Appl. Sci. 2025, 15(3), 1150; https://doi.org/10.3390/app15031150
Submission received: 16 November 2024 / Revised: 14 January 2025 / Accepted: 22 January 2025 / Published: 23 January 2025
(This article belongs to the Special Issue Advances in Tunnelling and Underground Space Technology)

Abstract

:
Tunnels crossing active faults frequently experience simultaneous exposure to fault dislocation and seismic action during operation. To study the damage behavior of tunnels under the combined effects of fault dislocation and seismic action, a three-dimensional nonlinear finite element model was established. This model simulates fault dislocation superimposed on seismic action in the context of tunnel engineering through active faults. The main conclusions are as follows: (1) The acceleration amplification phenomenon occurs in the tunnels after the superposition of seismic action; at the same time, the degree and scope of tunnel damage increase significantly, in which the increase in tensile damage is more significant. (2) The initial damage from fault dislocation worsens tunnel damage under seismic action, as evidenced by the energy dissipation characteristics. (3) As the initial fault displacement and peak seismic acceleration increase, the extent of lining damage also increases. Notably, compressive damage to the lining is symmetrically distributed along the fault plane, whereas tensile damage is significantly more severe within the fault rupture zone. (4) Even moderate earthquakes can cause severe damage to tunnels crossing active faults. Therefore, tunnel construction in these areas must include disaster prevention and mitigation strategies.

1. Introduction

In traditional engineering practice, engineers typically avoid planning or constructing tunnels in high-seismic intensity areas, and various specifications recommend avoiding tunnel construction near active fracture zones [1,2,3,4,5]. However, the demand for constructing transportation projects, including tunnels, in high-intensity areas is increasingly prominent due to economic development and social needs. In many high-intensity areas, the significant presence of active faults makes it challenging to avoid them by adjusting the tunnel alignment, leading to an increasing number of tunnels crossing active faults [6,7]. Consequently, the damage characteristics of underground structures resulting from active faults have become a prominent research topic in recent years.
The deformation of surrounding rock due to fault dislocation poses a direct threat to the operational safety of tunnels when they intersect active faults. This deformation can damage the tunnel lining, impairing its function and operational safety [6,8,9,10,11]. Fault dislocation types can be categorized based on whether they involve earthquakes: stick–slip dislocation, which is associated with earthquakes, and creep–slip dislocation, which occurs without earthquakes. Stick–slip fault dislocation is often characterized by a sudden displacement of several meters, resulting in severe damage to the tunnel and a loss of operational function. Creep–slip faults involve very slow relative movement between the fault’s moving block and the fixed block. Over time, cumulative displacement leads to tunnel deformation and damage, posing a threat to operational safety. High-seismic-intensity areas often experience the coexistence of stick–slip and creep–slip faults. In such scenarios, tunnels may intersect creep–slip faults while also facing the threat of seismic activity from nearby stick–slip faults. Hence, the damage response of tunnels constructed in these areas should account for the combined effects of both creep–slip faulting and seismic action.
Currently, scholars have conducted extensive research on the response characteristics of tunnels to fault dislocation and seismic action individually. Regarding the tunnel response to fault dislocation, Liu et al. [12,13,14] investigated the effects of positive and reverse fault dislocations on tunneling through a series of modeling tests, elucidating the damage characteristics of tunnel linings and stress distribution laws. Tang et al. [15] enhanced existing numerical simulation methods to achieve refined simulations of the mechanical response and damage characteristics of tunnels under fault dislocation. They also assessed the damage level of tunnel linings under varying fault displacements, fracture zone widths, and intersection angles between tunnels and faults. Yuan et al. [16] examined the impacts of factors including the intersection angle between the tunnel and the fault, soil thickness above the tunnel, tunnel lining thickness, and surrounding rock parameters on tunnel seismic risk. Their research outcomes enabled the quantification of the seismic risk for subway tunnels traversing active faults. Bazia et al. [17] conducted centrifugal modeling experiments to simulate tunnel responses to reverse fault dislocation. Their study investigated the influence of factors such as the relative position of the tunnel and the fault, the relative density of soil above the tunnel, and the stiffness of the tunnel lining on the tunnel’s response pattern to reverse fault dislocation. Regarding the seismic response analysis of tunnels crossing active faults, Cui et al. [18] investigated the damage mechanism of tunnel linings in the context of tunnels traversing active faults affected by the Wenchuan earthquake. They identified the width of fault fracture zones, surrounding rock quality, and rate of fault dislocation as primary factors contributing to seismic tunnel damage. Geng et al. [19] investigated the longitudinal internal force response of tunnels crossing various widths of fault fracture zones subjected to seismic action using numerical simulations and shaking table tests. They proposed a rational longitudinal protection range for tunnels based on the third principal stress principle. Zhang et al. [20] developed a numerical model for tunnels crossing faults of varying widths. Utilizing the principle of releasable elastic strain energy, they proposed seismic impact zoning for such tunnels, demonstrating that a segmental lining can enhance tunnel safety under seismic conditions. Yu et al. [21] examined the influence of changes in surrounding rock quality and tunnel lining stiffness on the longitudinal seismic response of tunnels. They introduced an analytical method to assess the longitudinal seismic response of tunnels passing through the interface of soft and hard rocks. The majority of the aforementioned studies were conducted in isolation, focusing solely on either the effects of fault dislocation or the effects of an earthquake on tunnels. In these studies, it is typically assumed that tunnels remain undamaged before earthquakes. However, tunnels crossing faults with creep–slip faults are susceptible to immediate damage due to the creep–slip activity of the faults upon construction and operation. The cumulative displacement resulting from creep–slip dislocation over the nearly century-long operation of the tunnel leads to significant damage. The tunnel lining structure and surrounding rock are adversely affected by the creep–slip dislocation. Consequently, the damage pattern of tunnels experiencing initial damage from creep–slip dislocation under superimposed seismic effects will differ from that of intact tunnels.
In conclusion, limited research exists on tunnel damage in response to combined fault dislocation and seismic effects. The 2022 Menyuan earthquake in Qinghai, China, exemplifies this issue. It caused significant damage to the Daliang Tunnel and other tunnels in active fault zones, underscoring the urgent need for further study in this area [22]. In view of this, in order to study the damage law of tunnels under the coupled actions of fault dislocation and seismic action, a 3D nonlinear numerical model of fault dislocation superimposed on seismic action was established to analyze the damage response of tunnels under the coupled actions of fault dislocation and seismic action with a background of a tunnel project crossing an active fault and considering the nonlinear damage characteristics of the tunnel lining materials. The research results can provide a reference for the design of tunnels crossing active fault zones.

2. Numerical Modeling

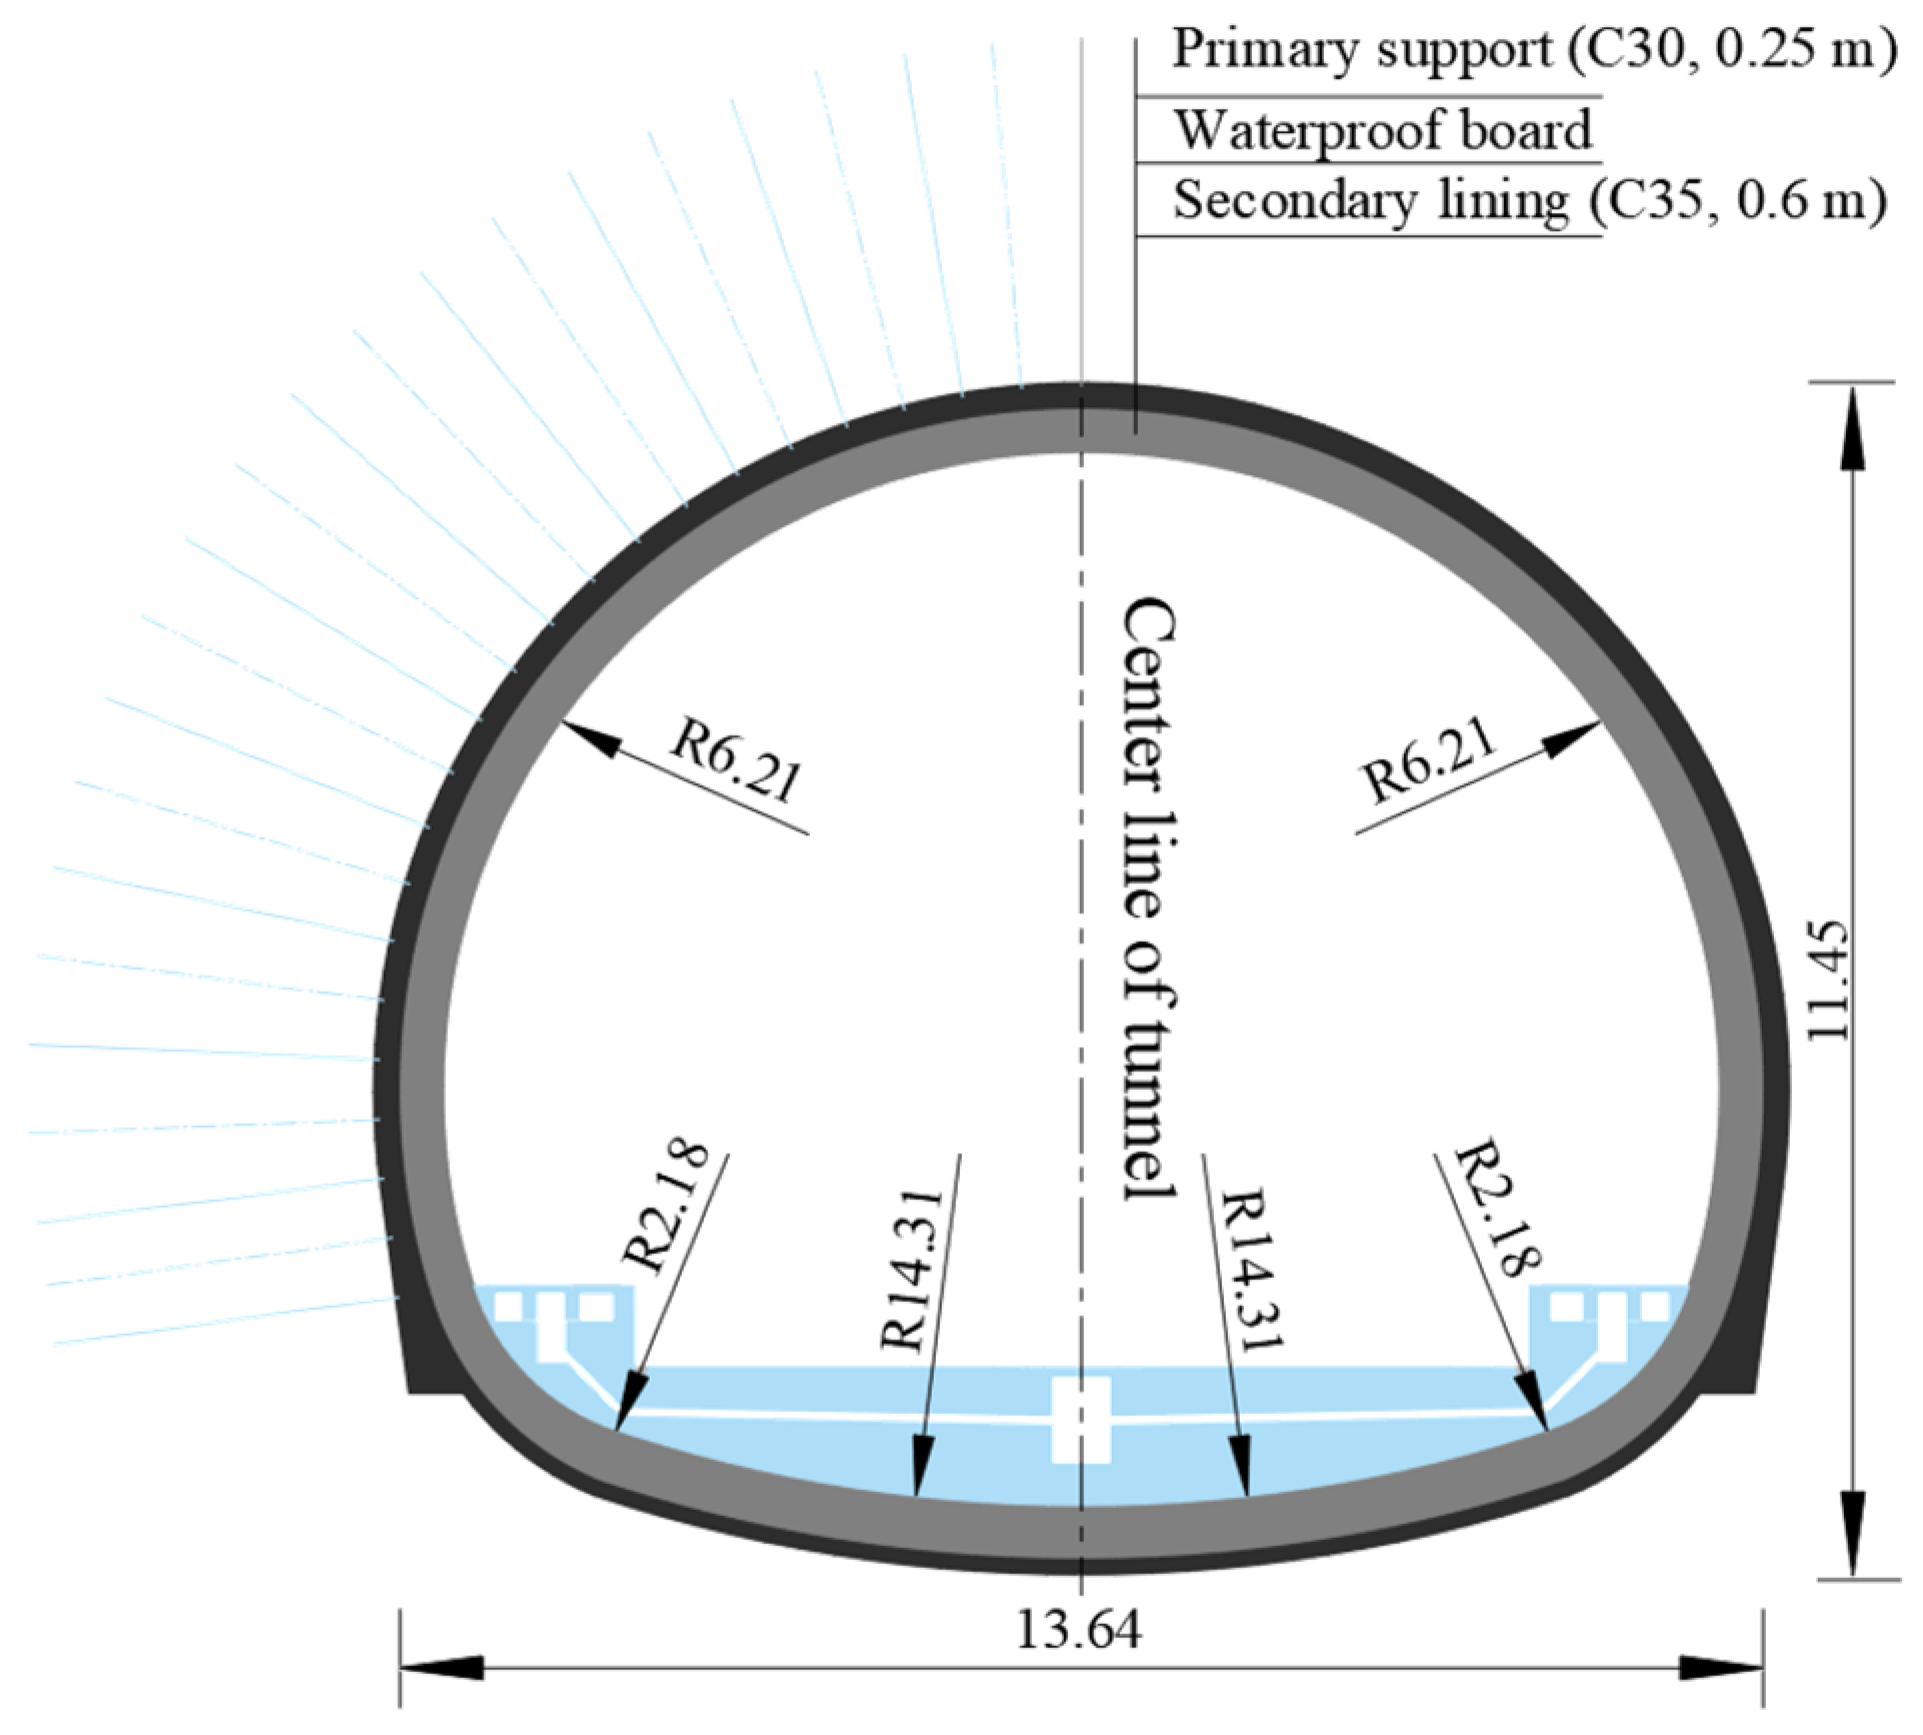
2.1. Model Introduction

This study is based on the Sichuan–Tibet Railway, a tunnel project under construction. The tunnel site conditions are classified as Type II, with a basic seismic intensity of VIII, a characteristic period of 0.45 s for the acceleration response spectrum, and a design peak ground acceleration of 0.20 g. The tunnel length is 12,323.1 m and the maximum burial depth is 1525.4 m; for the single-hole two-lane tunnels, the drill-and-blast method of construction is used with a span of 13.6 m. The tunnel lining consists of a primary support and secondary lining. The primary support is 0.25 m thick, with a concrete strength grade of C30; the secondary lining is 0.60 m thick, with a concrete strength grade of C35, and the tunnel support structure cross-section is shown in Figure 1. The exit section of the tunnel crosses an active fault, which, according to the latest GPS observations by the Institute of Geology of the China Earthquake Administration (CEA), is a right-handed strike–slip fault and is moving at a constant rate of 3 mm per year.
The fault intersects the tunnel at an angle of 70°, with the fault fracture zone spanning 30 m in width. To ensure the computational accuracy of the numerical model, the longitudinal length of the model is set to 400 m based on multiple trial calculations. In the numerical calculation of the nonlinear dynamics of underground engineering, after the width of the numerical model is larger than 5~10 times of the width of the structure, the boundary will not affect the results of numerical analysis [23]. In this study, the width of the numerical model is chosen to be 14.8 times the tunnel width, resulting in a final model size of 400 m × 200 m × 100 m. In the numerical model, C3D8R hexahedral elements in ABAQUS (v.2020) are used to model the surrounding rock, fracture zones, and tunnels. In order to meet the requirements of dynamic calculation accuracy, the maximum mesh size of the model does not exceed 5 m. The numerical model is shown in Figure 2.

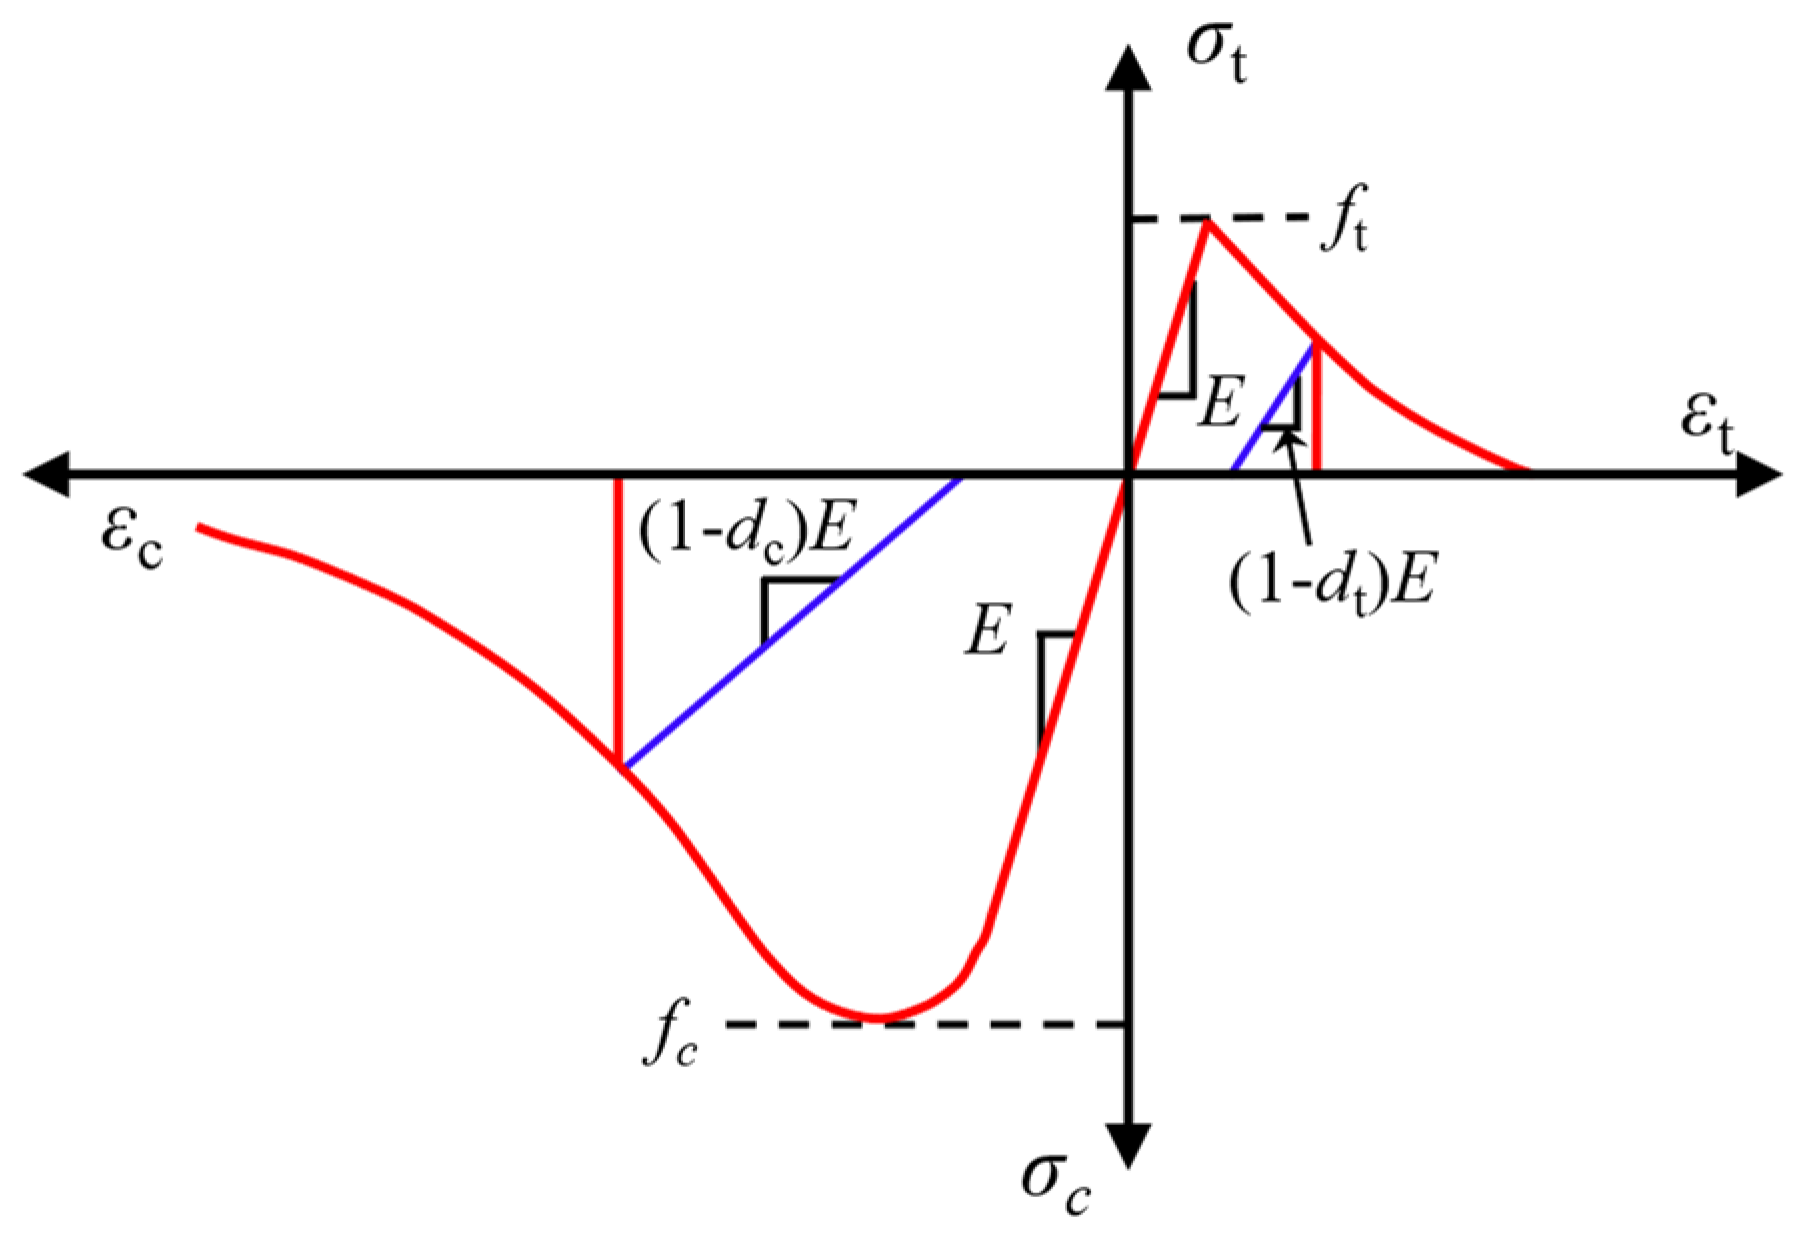
2.2. Materials and Parameters

In this study, the numerical simulation assumes that the physical and mechanical properties of the rock mass and fault fracture zones are highly homogeneous and that joints in the surrounding rock are not considered. The intact rock mass and fault fracture zones are modeled using the Mohr–Coulomb criterion rock damage model. The physical and mechanical parameters of the rock mass are determined based on on-site geological investigation data and the Standard for engineering classification of rock masses (GB/T50218-2014) [24], as summarized in Table 1.
To enhance the characterization of the model’s dynamics, Rayleigh damping is applied to the surrounding rock, with the damping coefficient calculated using Equation (1):
C = α 1 M + β 1 K
Here, α 1 and M represent the mass coefficients and mass matrices, respectively, while β 1 and K represent the stiffness coefficients and stiffness matrices, respectively. α 1 and M are calculated using Equation (2):
α 1 = 2 ξ ω i ω j ω i + ω j , β 1 = 2 ξ ω i + ω j
Here, ω i and ω j represent the i-th and j-th self-oscillation frequencies of the model, respectively, selected as the 1st and 3rd orders in the simulation. ξ denotes the damping ratio of the surrounding rock, set to 0.05 in the simulation [26].
Typically, to realistically simulate the mechanical behavior of tunnels under fault dislocation, it is crucial to account for the nonlinear characteristics of the tunnel lining materials. Given that tunnel damage is associated with concrete cracking and crushing, the tunnel structure in the simulation is modeled using the Concrete Damaged Plasticity model (CDP model) integrated into ABAQUS. The CDP model can simulate the strain softening and stiffness degradation of concrete under loading. It divides concrete damage into tensile and compressive damage, and material stiffness degradation is depicted using two separate normalization indices: tensile damage (dt) and compressive damage (dc). Figure 3 illustrates the tensile and compressive stress–strain relationship of the lining material. Here, E represents the initial modulus of elasticity, fc and ft are the stresses at the material’s failure points, and ε is the equivalent plastic strain. When the material is damaged, the slope of its unloading curve is given by (1−dc(t))E. The stress–strain relationship of the lining material conforms to the design standards for Code for the Design of Concrete Structures (GB50010-2010) [27]. The specific parameters are listed in Table 2.
In tunnel construction, the primary support can effectively integrate with the surrounding rock; thus, the binding constraint in ABAQUS is applied to model the interaction between the primary support and the surrounding rock. Additionally, considering the presence of a waterproof plate between the primary support and the secondary lining, the dynamic analysis must consider sliding, compression, and separation between them. Consequently, the contact algorithm in ABAQUS is employed to define the interaction between the primary support and the secondary lining. The normal contact behavior is defined as “hard” contact, as illustrated in Figure 4a. When a gap exists between the primary support and the secondary lining (h < 0), no contact pressure is generated. When the gap is zero (h = 0), as shown in Figure 4b, a constraint is applied at the contact surface, and only normal contact pressure is transmitted, with no limitation on its magnitude. When the primary support and secondary lining are in contact, a tangential force is generated at the contact surface due to the combined effects of fault dislocation and seismic forces. The classical isotropic Coulomb friction model, based on the penalty function method, is used to describe the tangential mechanical behavior of the contact surface. The red solid line in Figure 4c represents this mechanical behavior. Ideally, relative sliding between the two contact surfaces occurs when the tangential shear stress reaches the critical frictional shear stress τcrit. However, simulating the ideal frictional behavior often presents challenges in numerical calculations. As a result, ABAQUS typically defaults to an adaptive penalty function approach that allows for “elastic slip deformation”, as shown by the blue dashed line in Figure 4c. Equation (3) provides the formula for the critical friction shear stress, where μ is the friction coefficient (set to 0.6), and p is the normal contact pressure [28,29,30]:
τ c r i t = μ   p

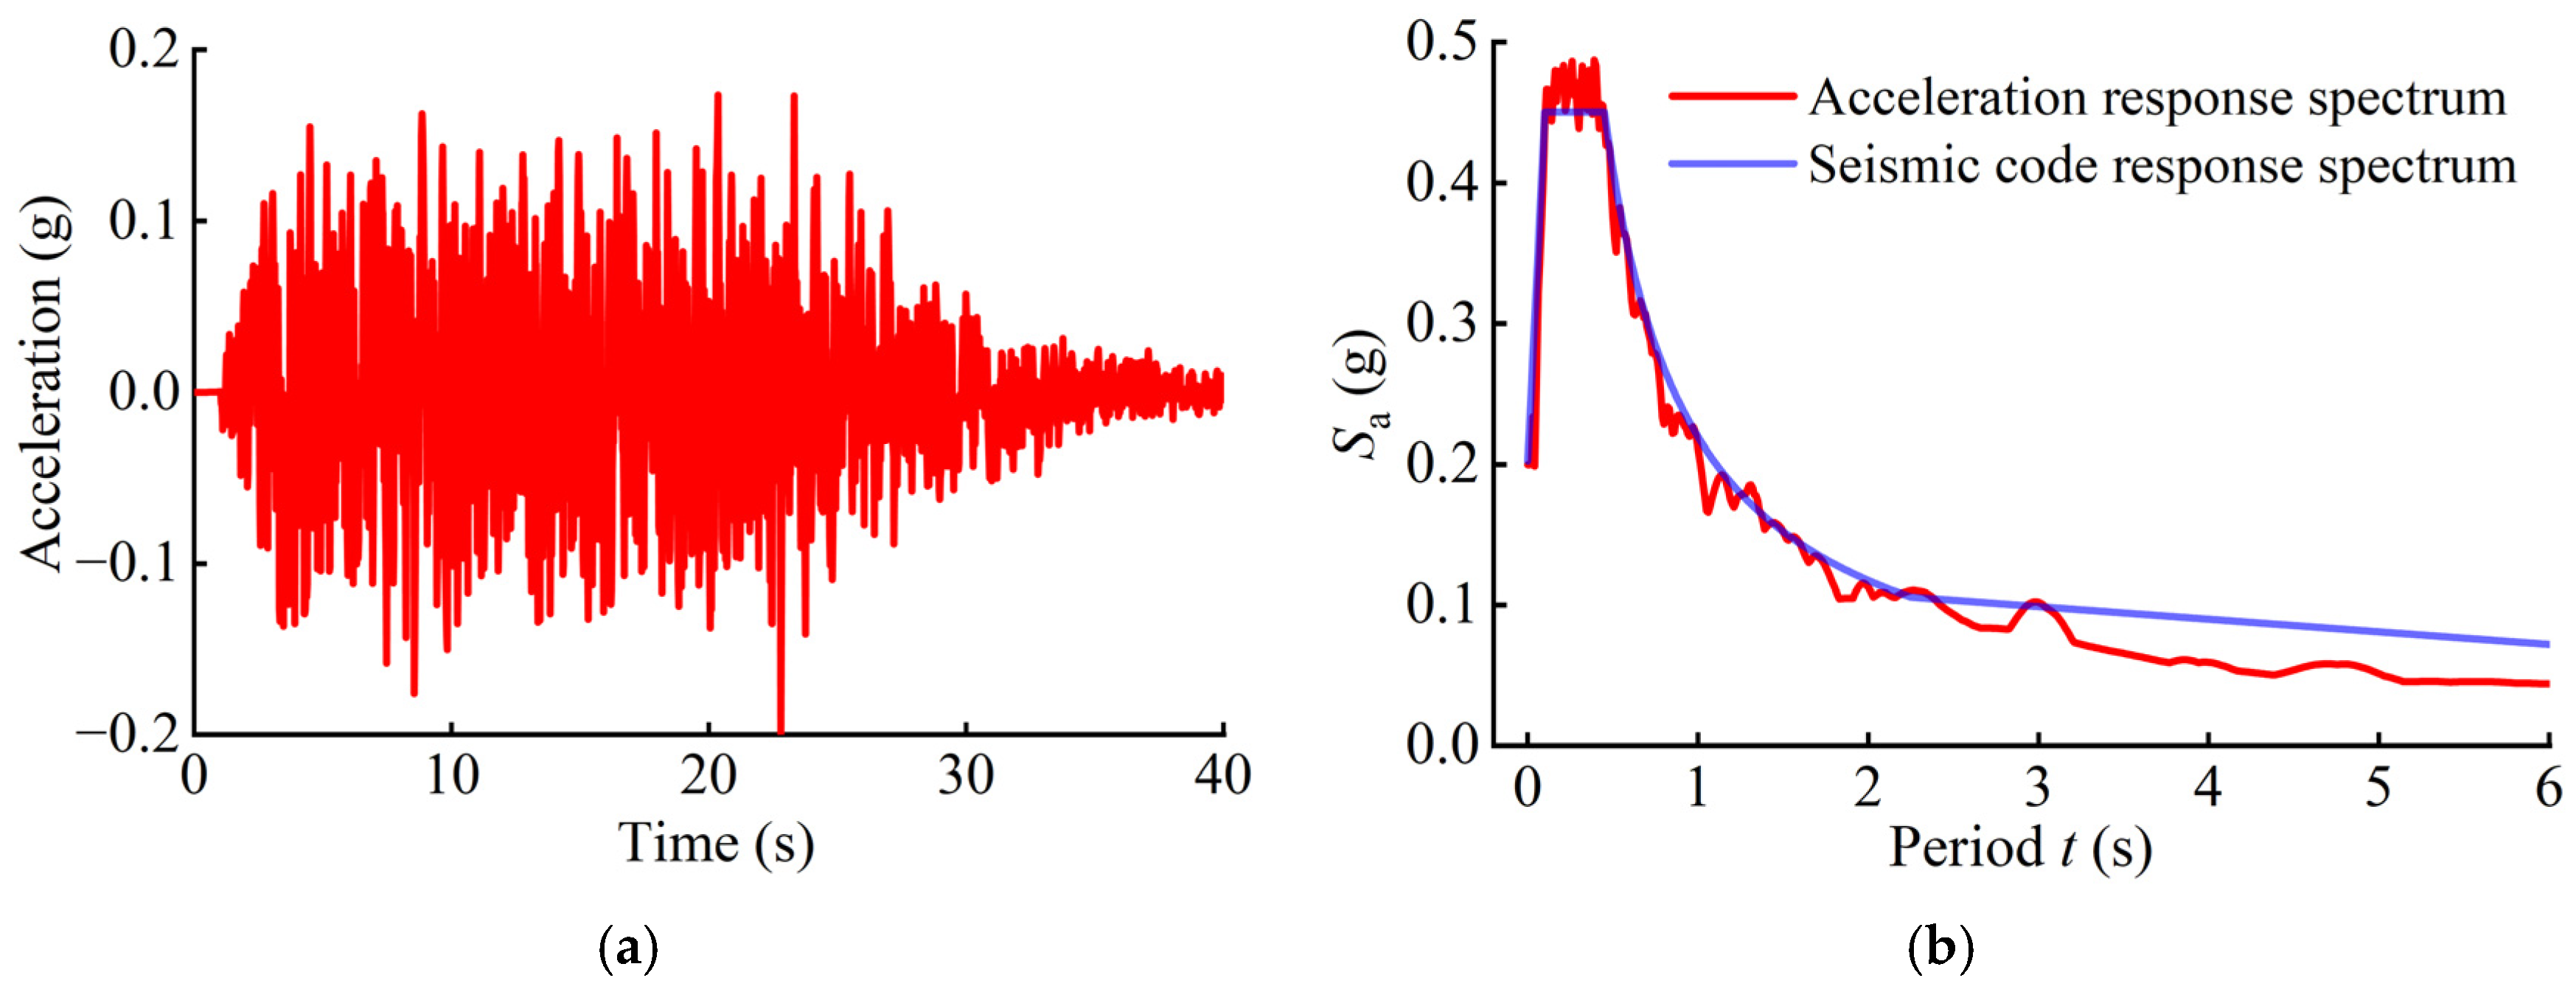
2.3. Ground Motion Processing

In the dynamic response analysis of tunnel engineering, selecting seismic motions that align with the seismic environment of the site is critically important. With advancements in technology, artificial ground motions are increasingly being utilized in seismic analyses of tunnel engineering. The generation method for artificial ground motions is described below.
Using the trigonometric series method, the unsteady seismic acceleration is considered the product of the smooth random process and the outer envelope function considering the unsteady characteristic, as shown in Equation (4):
a ( t ) = f ( t ) a s ( t )
where a ( t ) represents the seismic acceleration time course, a s ( t ) is a stationary random process with a (one-sided) power spectral density function and zero mean, and f ( t ) is the envelope function.
The expression for f ( t ) is given as follows:
f ( t ) = t / t 1 2                                     t < t 1 1                                               t 1 t < t 2 e c t t 2                           t 2 t < t 3 0                                               t 3 t < T
where t1, t2, t3, and T represent the start and end times of the stationary phase, the end time of the attenuation phase, and the total duration of the seismic wave, respectively. c is a constant controlling the attenuation rate, with a value range of 0.1~1.0.
The expression for a s ( t ) is given as follows:
a s ( t ) = k = 1 n C k cos ω k t + φ k
where φ k is a random phase angle uniformly distributed in (0, 2π) and ω k and C k are the frequency and amplitude of the k-th spectral component, respectively. ω k and C k are determined based on the generated power spectral density function using the following equation:
C k = 4 S W k Δ W Δ w = 2 π / T W k = k Δ W
where S ( ω k ) represents the given power spectral density function.
As described above, generating artificial ground motions requires a specified power spectral density function. During the generation process, the power spectral density function is first derived from the design response spectrum specified in China’s Code for the Seismic Design of Buildings (GB 50011-2010) [31]. This power spectral density function is then substituted into the trigonometric series cosine model to obtain the stationary random process, which is subsequently multiplied by the envelope function to generate the seismic acceleration time history. In this study, a MATLAB program was developed to implement the above process, generating artificial ground motions suitable for the seismic environment of the study site.
Figure 5a shows the acceleration time history of the artificial ground motion. The ground motion duration is 40 s, with a time interval of 0.02 s, and the peak acceleration is 0.2 g. Figure 5b illustrates the acceleration response spectrum of the artificial ground motion. As shown in the figure, the acceleration response spectrum of the artificial ground motion closely matches the designed acceleration response spectrum for the site, indicating that the generated artificial ground motion effectively reflects the seismic environment of the tunnel site.

2.4. Analysis Procedure

To investigate the tunnel response under the combined effects of fault dislocation and seismic excitation, the numerical analysis is divided into three main steps.
Step 1: Initial stress equilibrium, tunnel excavation, and support
In this step, gravity is first applied to the entire model, and geostress equilibrium is achieved. Since the primary focus of this study is the tunnel response under the combined effects of fault dislocation and seismic excitation, the tunnel excavation process is simplified, assuming that the tunnel is excavated in a single pass. To address stress release during tunnel excavation, the softening modulus method is employed. This method simulates stress release by reducing the elastic modulus of the excavated rock mass. The process involves sequentially reducing the elastic modulus of the rock mass within the tunnel, adding the tunnel support structure to the model, and finally removing the rock mass to simulate tunnel excavation and support effectively.
Step 2: Fault dislocation
Fault movement is simulated by altering the boundary conditions of the fault block. Specifically, displacement is applied along the fault direction on both sides of the fault block while maintaining normal constraints at the block’s base. Fault creep displacement is treated as a quasi-static process. To minimize the influence of dynamic effects during fault movement, the displacement allowed per time increment is controlled to within 0.01 mm.
Step 3: Seismic excitation
The damaged state of the tunnel following fault displacement serves as the initial condition for this step. Normal constraints are maintained at the model’s base boundary, and artificial seismic loads are applied laterally at the bottom of the model.
The flow chart is illustrated in Figure 6.

3. Results and Discussion

According to the background information of the study, the target fault is moving at a uniform rate of 3 mm per year, and the fault will produce a dislocation displacement of 30 cm during the 100-year design life of the tunnel. In this study, it is assumed that the earthquake occurs in the 50th year of tunnel operation, at which point the fault displacement is 15 cm.

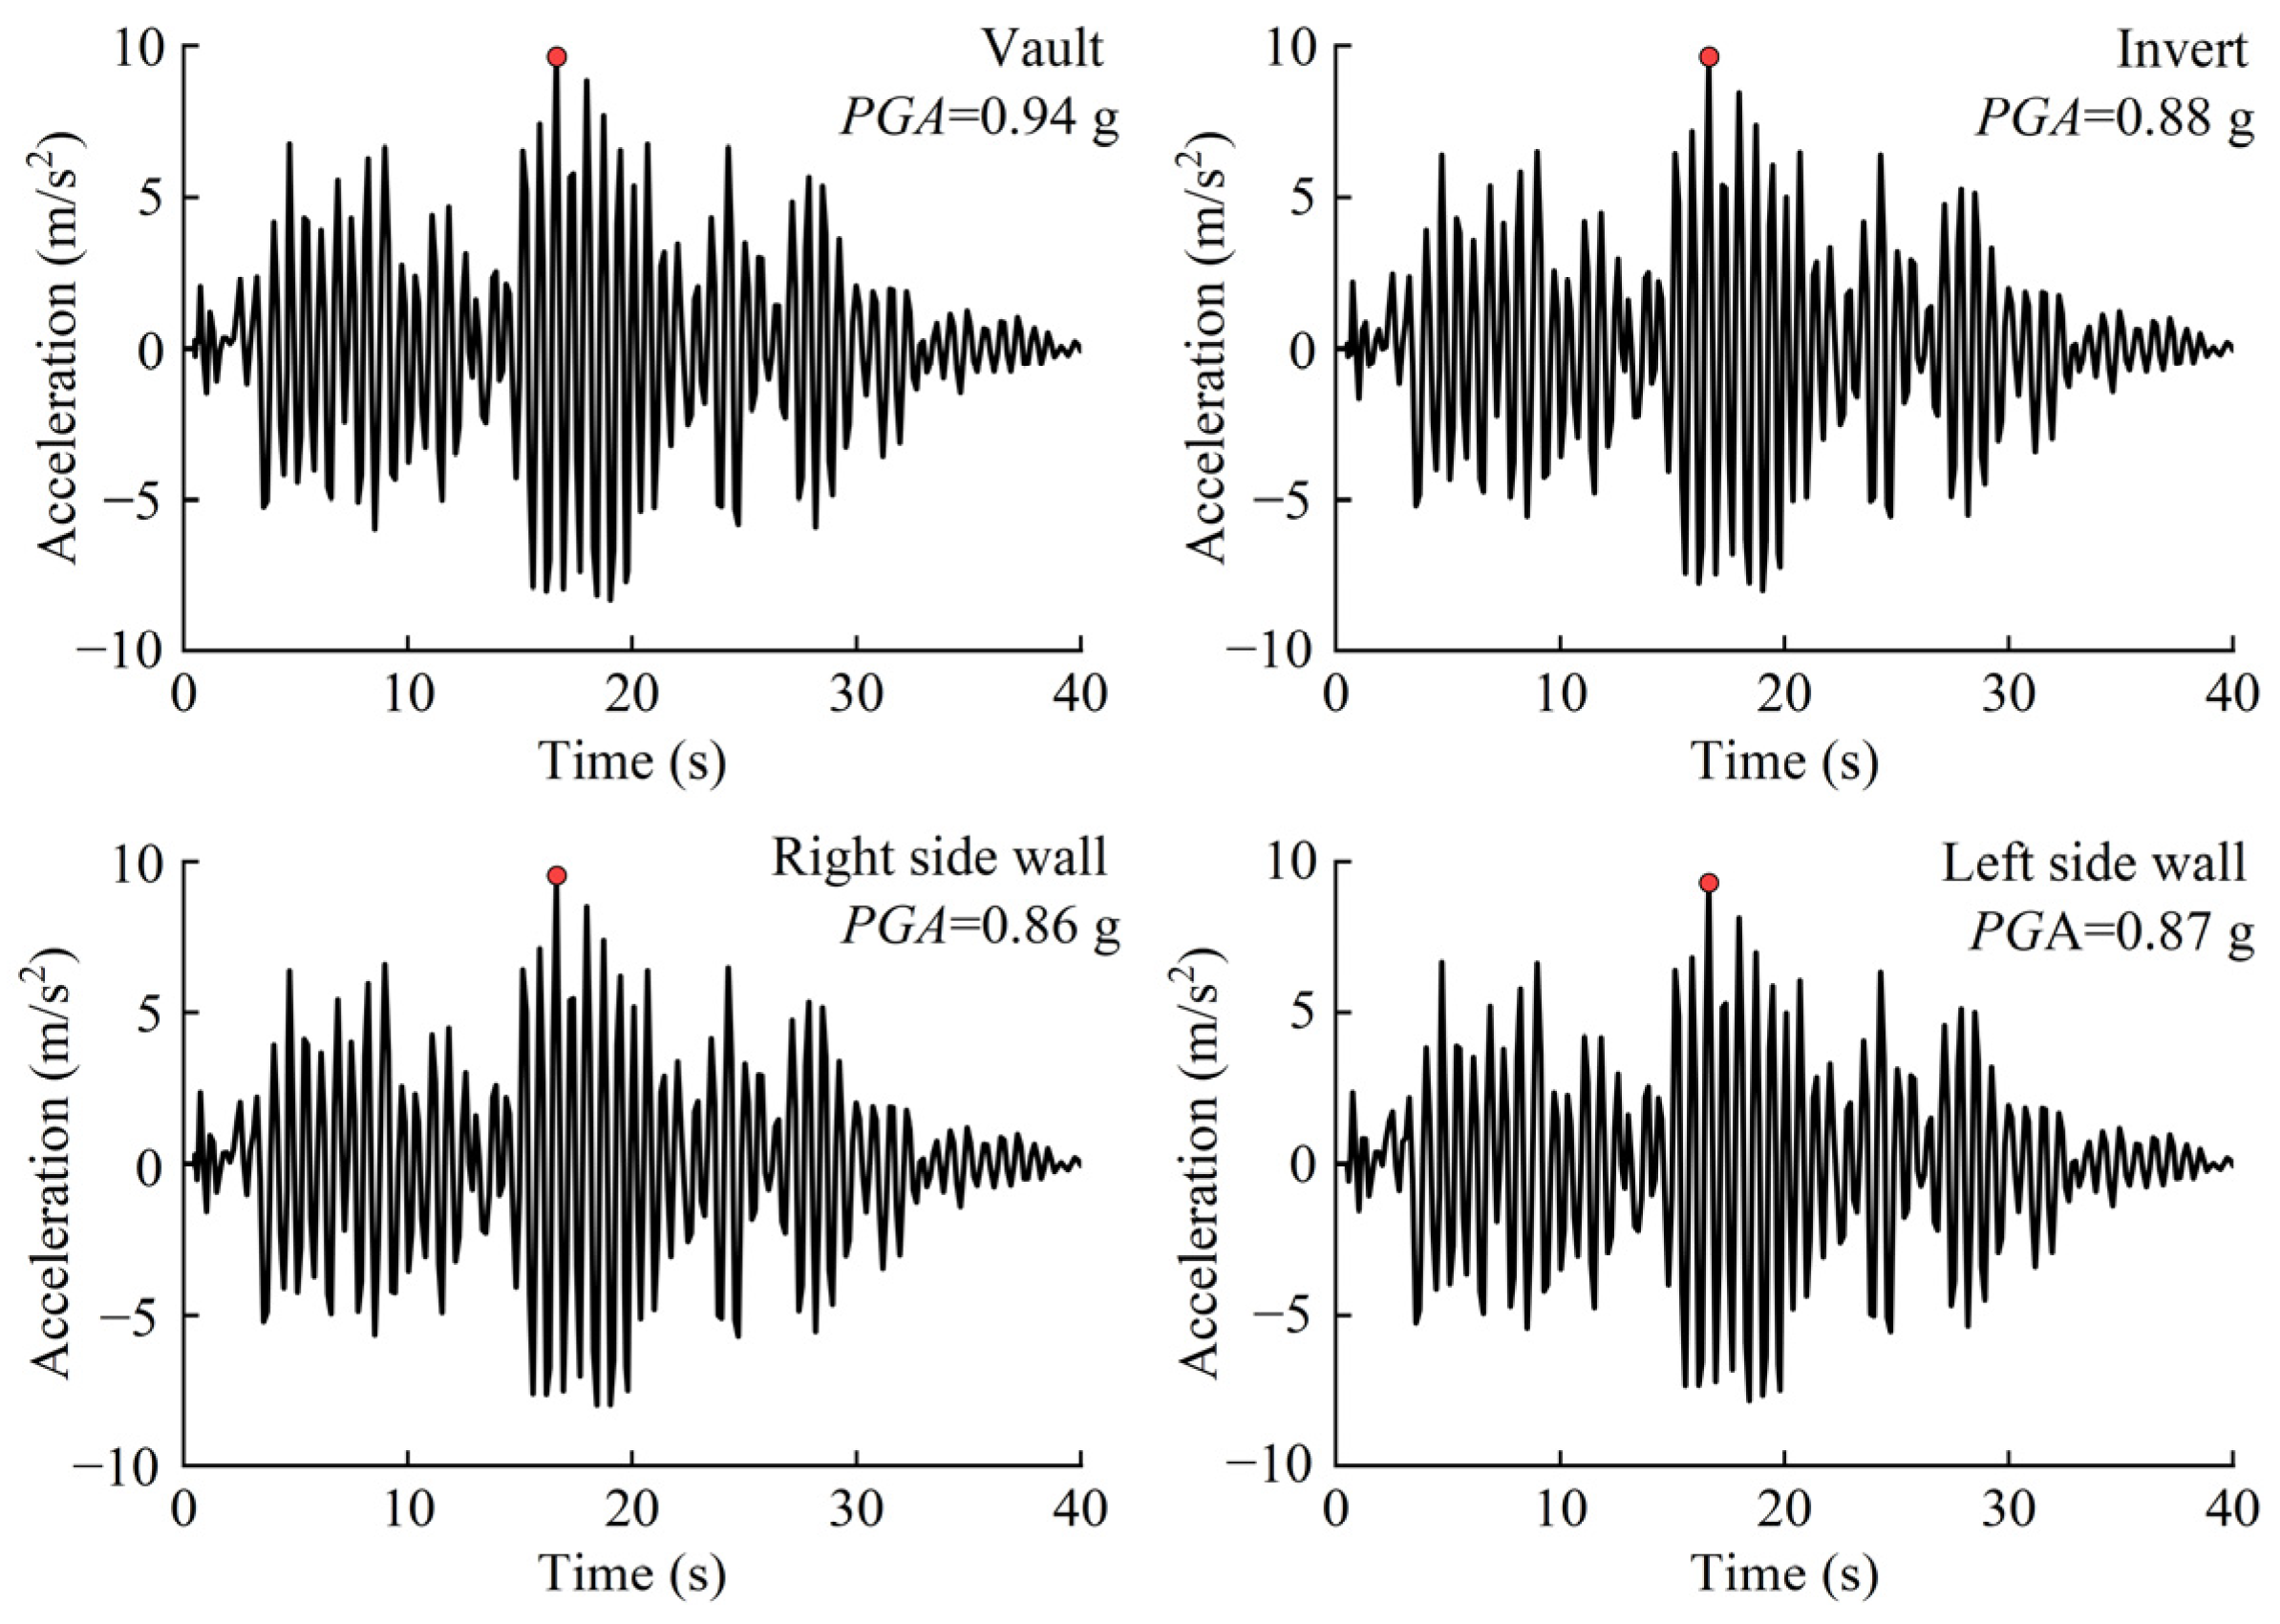
3.1. Acceleration Response

Figure 7 displays the acceleration time history at the tunnel vault, invert, and two side walls along the fault rupture plane. It can be observed that the acceleration peaks at the four monitoring locations are amplified to a certain extent. Notably, the acceleration peak at the tunnel vault is the highest, reaching 0.94 g.
In order to investigate the distribution of the peak acceleration of the tunnel structure at different locations, peak accelerations were extracted at distances of 60 m and 120 m on both sides of the fault plane. These measurements were taken from the tunnel vault, the tunnel invert, and the side walls on both sides of the tunnel, as detailed in Table 3 below.
Table 3 reveals that the acceleration peaks at each monitoring point exceed the peak acceleration of the input ground motion (0.2 g) when the tunnel experiences fault dislocation superimposed with an earthquake. Figure 8 illustrates the distribution curve of the acceleration amplification coefficient (AAC) at each monitoring point, indicating an amplification phenomenon at various monitoring points. The maximum AAC value is 4.7, observed at the top of the tunnel vault at the fault plane.

3.2. Description of the Damage

To better compare the tunnel damage characteristics under the combined effects of fault dislocation and seismic excitation, this study sets up three cases. In Case 1, the tunnel is subjected only to fault displacement; in Case 2, the tunnel experiences both fault dislocation and seismic excitation; in Case 3, the tunnel is subjected solely to seismic excitation.
Figure 9 depicts the cloud diagrams illustrating the compression damage and tensile damage of the lining under the three cases. It is evident that when the tunnel experiences fault dislocation alone, both compression and tensile damage of the lining are predominantly concentrated in the region of the fault fracture zone. The most severe damage occurs at the fault plane, where compression damage is primarily concentrated in the tunnel vault and the tunnel invert, while tensile damage extends from the sides of the tunnel wall toward the direction of the tunnel vault and the invert. When the tunnel is simultaneously subjected to fault displacement and seismic action, both the extent and severity of compressive and tensile damage to the tunnel lining increase. The maximum compressive damage factor, for instance, rises from 0.72 in Case 1 to 0.78. Since concrete is a brittle material, its compressive strength greatly exceeds its tensile strength, which is why, in all three cases, the tensile damage to the tunnel is greater than the compressive damage. Under seismic forces alone, the compressive damage to the tunnel is primarily concentrated near the fault surface, particularly at the tunnel vault and the tunnel invert, with the maximum compressive damage factor reaching 0.15. As shown in the figure, most of the damage factors are less than 0.1, indicating that the tunnel has not experienced severe compressive damage under seismic action. Similar to Case 2, when the tunnel is only subjected to seismic action, the tunnel also exhibits significant tensile damage, with a larger distribution of damage compared to Case 1. On the other hand, the maximum damage factor decreases from 0.98 to 0.89, indicating that while the distribution of tensile damage under seismic loading alone is more extensive than under fault displacement alone, the severity of the damage is reduced.

3.3. Description of Energy Dissipation

In accordance with the principles of thermodynamics, energy transformation is a fundamental aspect of physical processes involving matter, and the destruction of matter is a consequence of energy-driven destabilization of its state [32]. Assume that in an adiabatic system, the energy input into the system by external forces is U, and according to the first law of thermodynamics, all of this energy is transformed into the internal energy UI of the system. This energy can be divided into two parts, the recoverable elastic strain energy UE and the dissipation energy of the element UD. The energy can be divided into two parts, the recoverable elastic strain energy and the dissipation energy of the element. The variation pattern of UD conforms to the second law of thermodynamics, which states that the entropy of the system tends to increase and is irreversible. The damage to concrete structures is accompanied by energy dissipation. Therefore, it can be assumed that UD is strongly correlated with element damage, making UD a suitable indicator for evaluating tunnel lining damage.
Figure 10 depicts the energy dissipation time history of the tunnel lining in Case 2 and Case 3. The total energy dissipation of the lining in Case 2 is approximately 11,500 kJ, with around 6000 kJ dissipated during the fault dislocation stage and about 5500 kJ during the seismic action stage. In Case 3, the tunnel lining dissipated approximately 3000 kJ of energy. Comparing it with Case 2, despite both experiencing the same ground motion input, the tunnel lining in Case 2 releases an additional 2500 kJ of energy, representing nearly an 85% increase in energy dissipation. This shows that the damage to the tunnel caused by the combined effects of fault dislocation and seismicity is not a simple superposition, and the initial damage caused by fault dislocation will aggravate the damage of the tunnel during the seismic stage.

3.4. Damage Assessment of the Tunnel Lining

The tunnel lining experiences intricate mechanical impacts due to the combined effects of fault dislocation and earthquakes, resulting in significant damage to the lining structure. To assess the overall tunnel damage more comprehensively, this study utilizes the overall structural damage index, which is commonly employed in above-ground structures, to evaluate the tunnel lining damage.
In the Concrete Damaged Plasticity (CDP) model, the extent of concrete damage is represented by the compression damage factor C and the tensile damage factor T. These damage factors range from zero to one, where a value of zero signifies no damage to the concrete, and a value of one indicates complete destruction of the concrete. The overall lining damage index can be divided into two parts: the overall lining damage index in compression (OLDC) and the overall lining damage index in tension (OLDT) [33]. OLDC and OLDT are calculated based on the weighted average of the damage values of each cross-sectional element of the tunnel lining in the model, where the dissipated energy of the element serves as a weighting factor. This approach reflects the overall damage condition of each cross-section of the lining. The equations for calculating OLDC and OLDT are as follows:
OLDT = i = 1 n d t i e E i e / i = 1 n E i e
OLDC = i = 1 n d c i e E i e / i = 1 n E i e
According to several studies and in conjunction with the definition of damage states of lifeline projects in earthquake damage statistics [34,35], the damage states can be categorized into four classes based on the overall lining damage index (OLDT and OLDC), including DS1 (slight), DS2 (moderate), DS3 (severe), and DS4 (complete). Table 4 shows the damage characteristics of the tunnel at different damage levels.
Figure 11a displays the distribution curves of OLDC along the axial direction of the tunnel within a 100 m range on both sides of the fault dislocation plane under the three cases. The horizontal coordinate at point zero in the figure corresponds to the location of the fault dislocation plane in the numerical model, and the yellow background area indicates the extent of the fault fracture zone. The figure illustrates that, under the sole influence of fault dislocation, the tunnel lining sustains significant damage (DS3) at the fault plane, with OLDC peaking at 0.54. Adding seismic action, the damage pattern of the tunnel lining remains largely unchanged, albeit with a marginal increase in damage values at each monitoring point. Notably, the fault plane still exhibits the highest OLDC value, now at 0.71. When subjected solely to an earthquake, the tunnel’s OLDC values remain below 0.1, indicating minimal compressive damage.
Figure 11b presents the OLDT distribution curve along the tunnel’s axial direction under different cases. The results indicate that under fault dislocation, severe tensile damage affects the tunnel lining from −10 m to 17 m near the fault plane, with OLDT values peaking above 0.8 at −7 m and 20 m, reaching complete damage (DS4). This shows a marked increase in tensile damage over compressive damage from fault dislocation alone. Additionally, when combined with seismic forces, the damage significantly escalates at each monitoring point, with OLDT values reaching a maximum of 0.97 at 20 m, suggesting a high likelihood of complete shearing at this location. Solely under seismic influence, the tunnel lining shows severe tensile damage, with OLDT peaking at 0.76 at 5 m. Furthermore, OLDT values exceed 0.70 at all monitoring points within the fault fracture zone, highlighting more severe damage there compared to areas in the intact rock mass.

3.5. Lining Damage Under Different Initial Fault Displacements

In order to study the damage response of the tunnel under the superimposed seismic action with different initial fault displacements, the initial fault displacements in Case 4 and Case 5 are set to be 5 cm and 10 cm, and the same seismic excitation is applied to the model.
As depicted in Figure 12, with escalating initial fault displacement, the compression damage intensified, predominantly clustering around the tunnel vault and the tunnel invert at the fault plane, with a proclivity to extend toward the side walls. Concurrently, severe tensile damage afflicted the tunnel lining across all three cases, exhibiting a consistent distribution pattern: a heightened damage concentration adjacent to the fault plane, gradually diminishing as distance from the fault plane increased.
In order to further evaluate the damage level of the tunnel under the action of different initial fault displacements, the distribution patterns of OLDC and OLDT along the axial direction of the tunnel for different working cases are obtained according to Equations (8) and (9), as shown in Figure 13.
Figure 13a illustrates the distribution of OLDC along the axial direction of the tunnel under different initial fault displacements. It is evident from the figure that fault dislocation remains the primary determinant of lining compression damage. As the distance of fault dislocation increases, the degree of damage to the lining escalates. When the initial displacement is 5 cm, the maximum OLDC value is 0.50, reaching moderate damage (DS2). Notably, the lining experiences the most severe damage at the fault surface, with damage gradually diminishing with distance from the fault plane. The damage zone is primarily concentrated within a 14 m radius on both sides of the fault plane.
Figure 13b depicts the OLDT distribution along the tunnel’s axial direction with different initial fault displacements. As can be seen from the figure, with initial displacement, some tunnel areas reach the full damage level (DS4) in all cases. Furthermore, when fault dislocation and seismic forces are combined, the OLDT distribution within the lining is consistent, showing the most severe tensile damage from −20 m to 30 m adjacent to the fault plane. Notably, the maximum OLDT value escalates with the initial fault displacement.
The analysis of tunnel damage with different initial fault displacements reveals that the initial displacement of the fault has a significant impact on the damage characteristics of the tunnel. Under identical seismic excitations, the compressive damage to the tunnel becomes more severe as the initial fault displacement increases. By comparing the OLDC distribution patterns of the tunnel in Case 1, it is evident that the initial damage caused by fault dislocation amplifies the effects of seismic action, leading to a noticeable increase in the maximum compressive damage of the tunnel.
On the other hand, the increase in initial fault displacement does not expand the distribution range of the primary compressive damage to the tunnel. This damage remains concentrated within a 14 m radius on both sides of the fault plane, providing valuable reference information for determining the seismic fortification range of this project.
The tensile damage to the tunnel is significantly more severe, with a distribution pattern primarily characterized by circumferential tensile damage. This indicates that the tunnel is subjected to strong axial tensile stresses. Therefore, in the design of tunnels crossing active fault zones, particular attention should be paid to effectively improving the axial stress state of the tunnel.

3.6. Lining Damage at Different Peak Seismic Accelerations

In order to study the damage response of the tunnel at different peak values of seismic acceleration, the initial fault displacement in Case 6 is set to 15 cm, with the peak acceleration of the artificial ground motion adjusted to 0.4 g for input in the numerical model.
As shown in Figure 14, with a peak artificial ground motion acceleration of 0.4 g, the maximum compression damage factor of the lining increases from 0.78 in Case 2 to 0.92 in Case 6, while the damage range expands from the vault and the invert to both side walls, indicating a significant increase in compression damage under stronger seismic impacts. Additionally, both the extent and severity of tensile damage in the lining increase markedly. In Case 2, tensile damage primarily develops circumferentially around the lining, whereas at 0.4 g of peak acceleration, the damage area at the fault plane further expands, and axial tensile damage appears in the right wall within the fracture zone.
Figure 15a shows the OLDC distribution along the tunnel axis under earthquakes with varying acceleration peaks. As shown, the OLDC distribution range remains largely consistent between Case 2 and Case 6, with both peaking at the fault dislocation plane. However, under stronger seismic activity, the maximum OLDC value increases from 0.70 to 0.81, reaching the threshold for complete damage (DS4).
Figure 15b shows the OLDT distribution along the tunnel axis under earthquakes with varying acceleration peaks. As shown in the figure, the OLDT distribution patterns for Case 2 and Case 6 are similar; however, under an earthquake with a peak acceleration of 0.4 g, the OLDT values across all lining locations increase compared to Case 2.
The analysis indicates that more intense seismic excitations significantly alter the damage characteristics of the tunnel. Regarding compressive damage, a 0.4 g seismic excitation causes the maximum OLDC value at the fault plane to reach 0.81, a damage level suggesting that tunnel collapse is highly likely at this location.
Considering the damage state of the tunnel in Case 1, the OLDC maximum value reaches 0.54 after the tunnel experiences a 15 cm fault dislocation. At this stage, the tunnel is in the DS2 damage state, indicating the presence of cracks only on the surface of the secondary lining. However, when subjected to a 0.4 g seismic excitation, the damage state escalates to DS4, implying a high likelihood of tunnel collapse.
This demonstrates that even minor initial damage can lead to severe tunnel failure when compounded by more intense seismic excitations. Therefore, during the operation of tunnels crossing active fault zones, it is crucial to promptly repair minor damage caused by fault dislocation to prevent catastrophic failures.

4. Conclusions

Taking a tunnel crossing an active fault as the research background, the damage response of the tunnel under the combined actions of fault dislocation and earthquake is analyzed by numerical simulation. The key conclusions are summarized as follows:
(1)
The peak acceleration observed at monitoring points throughout the tunnel demonstrates an amplification effect due to the combined impacts of fault dislocation and an earthquake. This effect is particularly pronounced at the tunnel vault located at the fault plane, with an acceleration amplification coefficient of 4.7.
(2)
The energy dissipation of the tunnel lining in Case 3 is about 3000 kJ; in Case 2, the energy dissipation of the tunnel lining in the seismic phase is about 5500 kJ, which is an increase of 85% compared with that in Case 3. This shows that the damage to the tunnel caused by the combined effects of fault dislocation and seismicity is not a simple superposition, and the initial damage caused by fault dislocation will aggravate the damage of the tunnel during the seismic action stage.
(3)
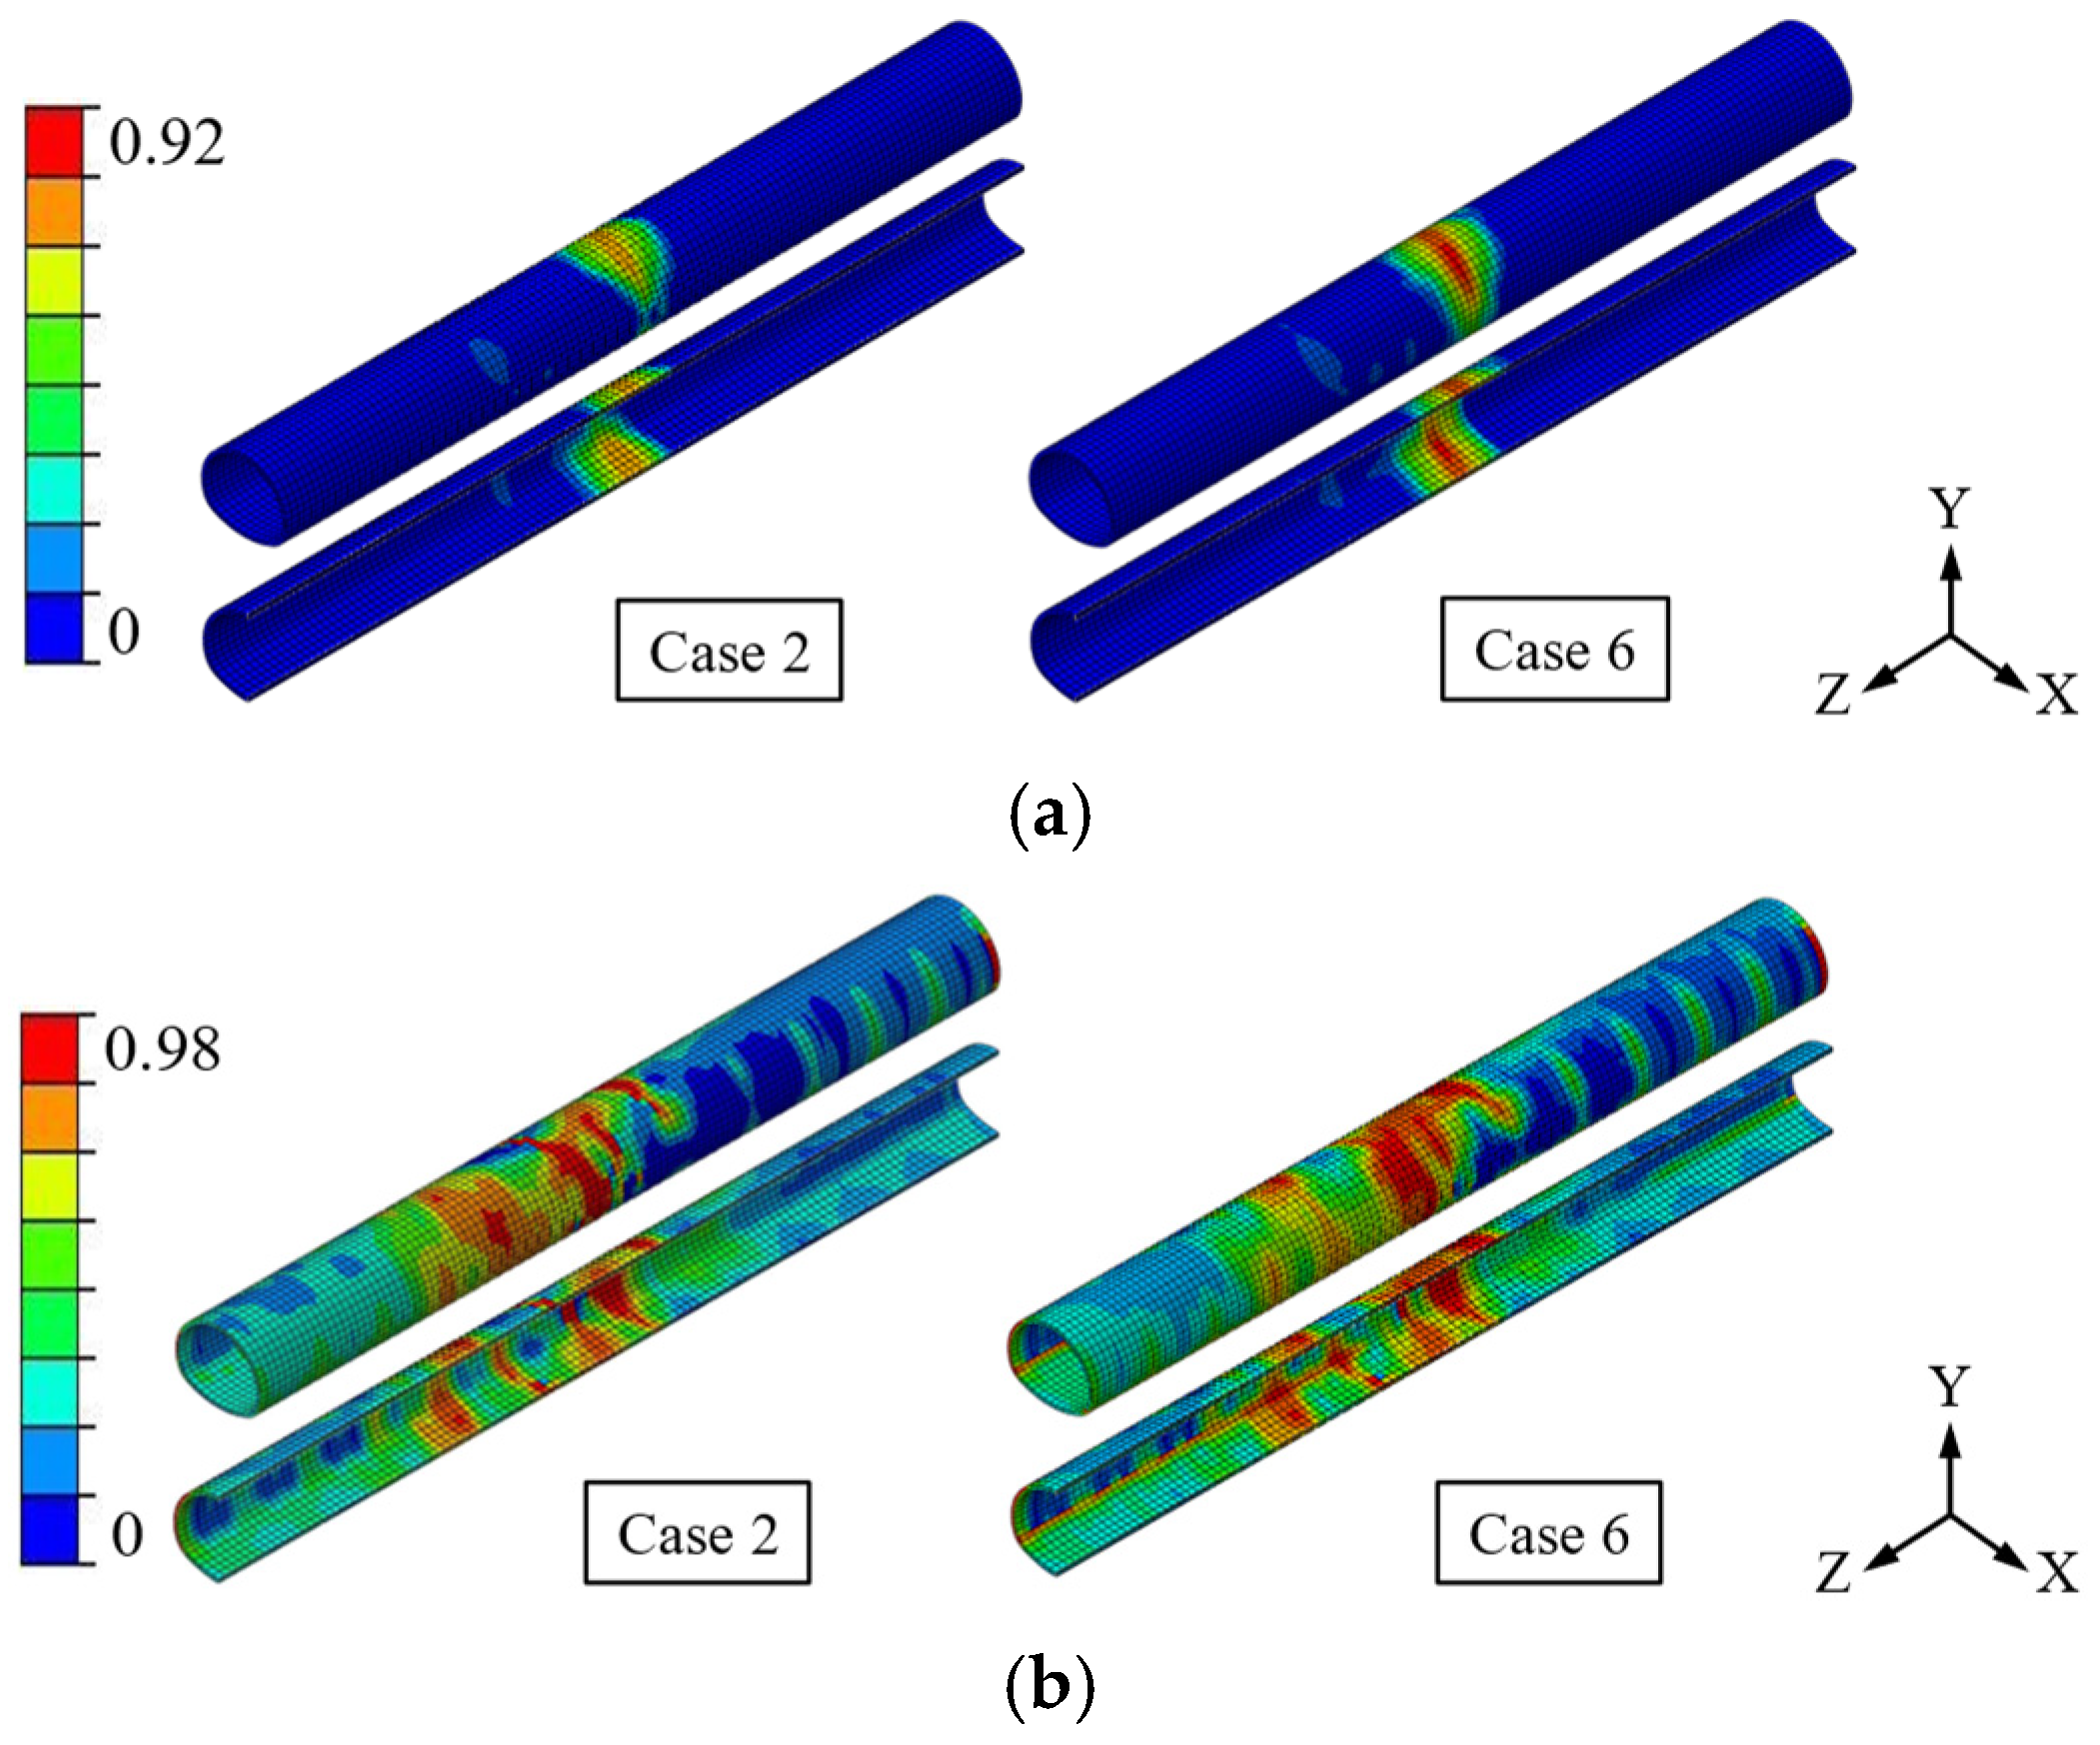
The lining damage is mainly concentrated in the fault fracture zone area under fault dislocation, and after superimposed seismic action, the scope and degree of lining damage increase, and the increase in tensile damage is more significant compared with compression damage, indicating that seismic action is the main cause of tensile damage in the tunnel.
(4)
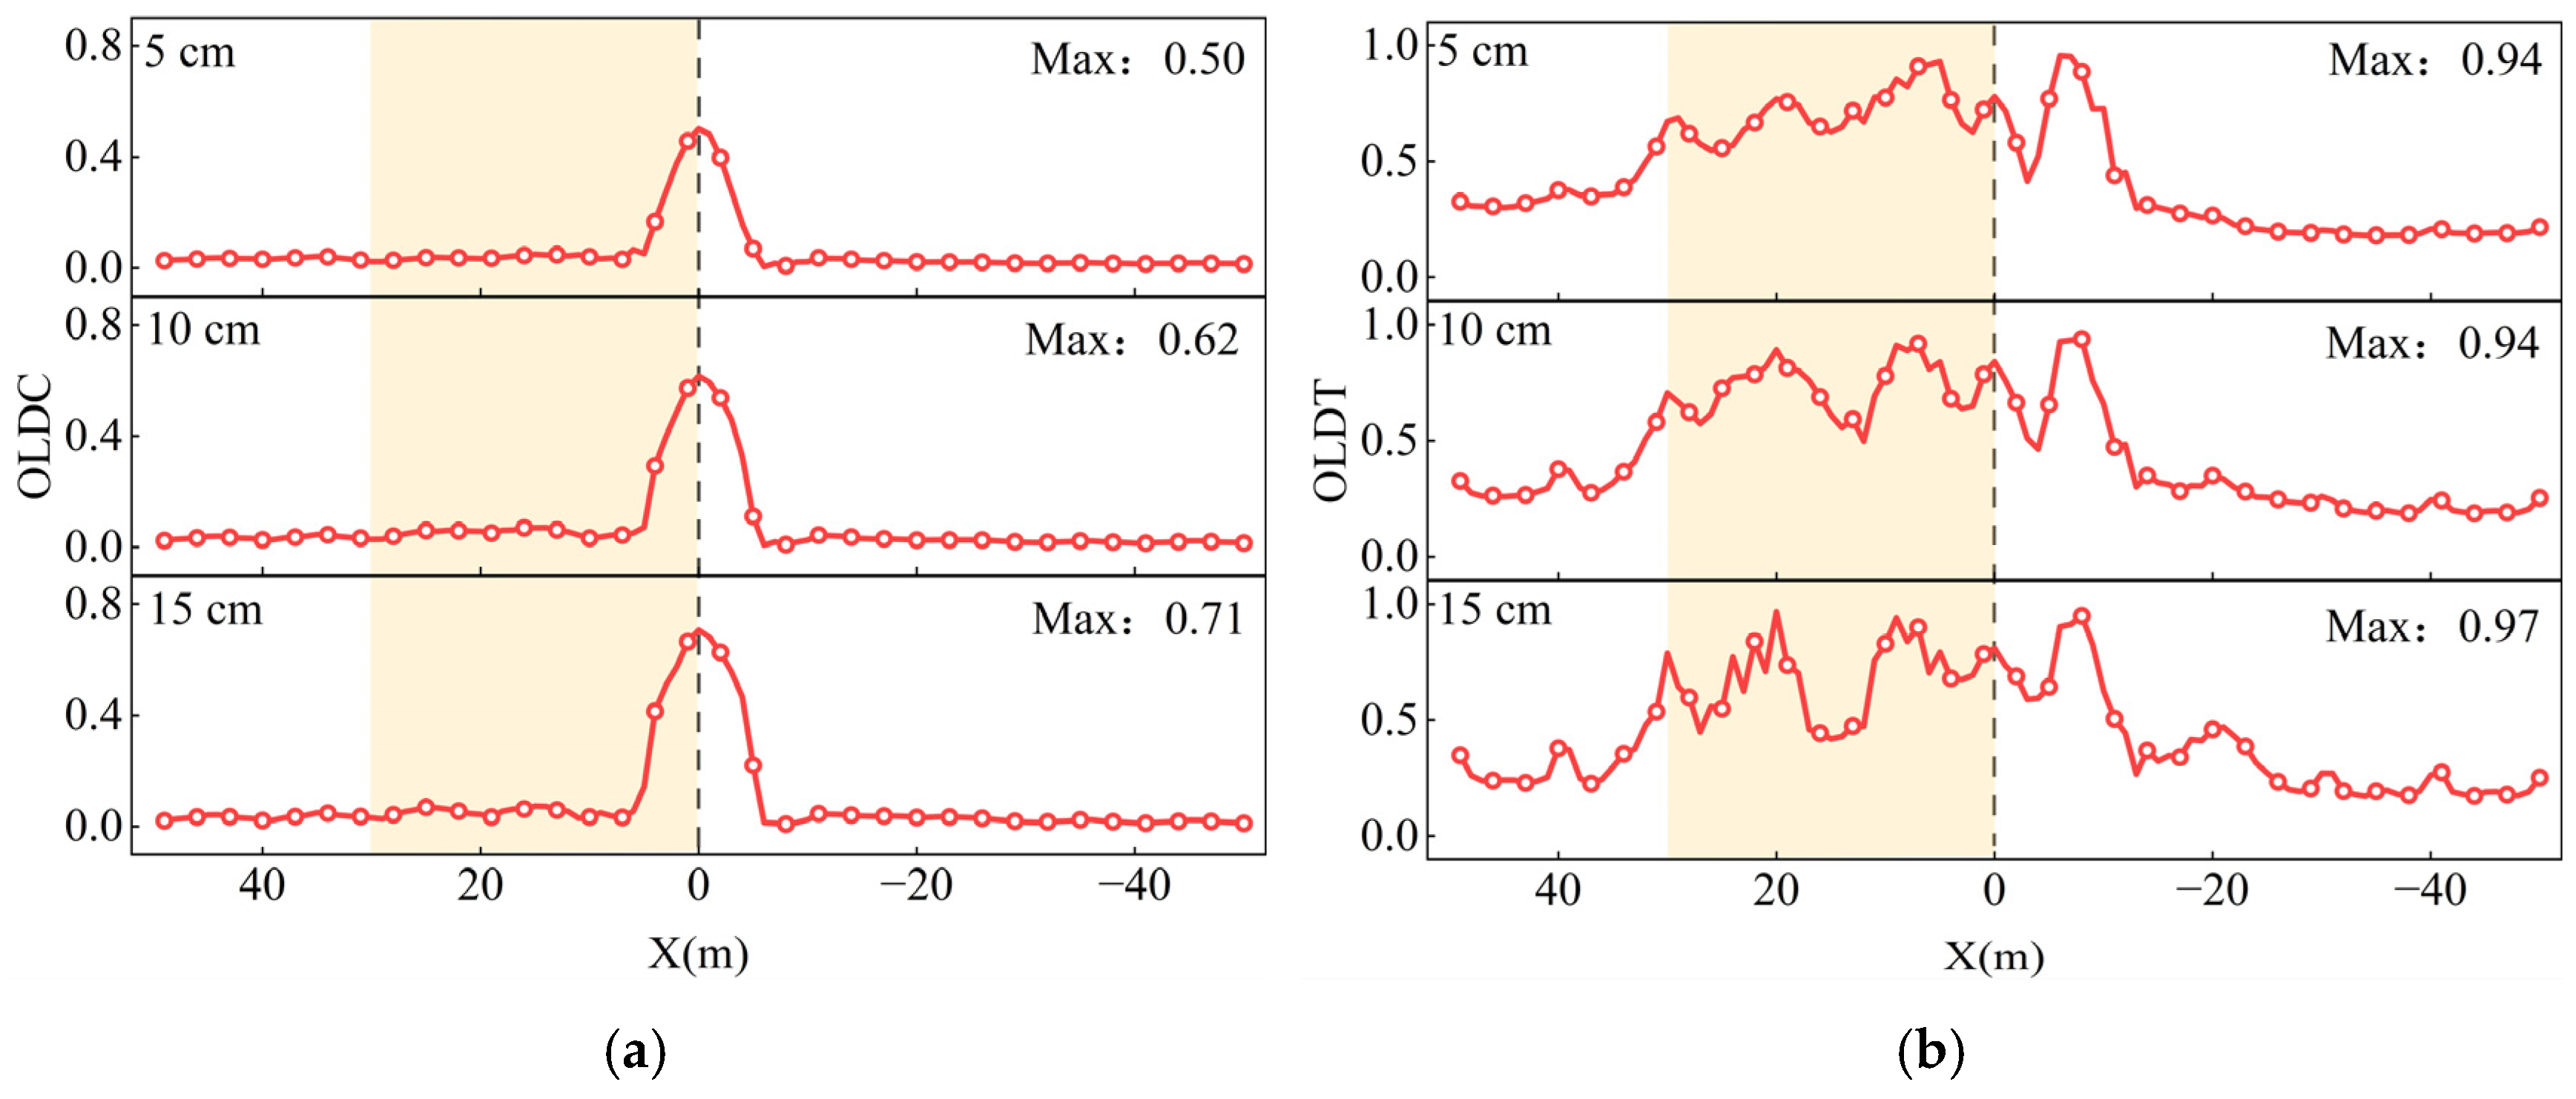
Both the initial fault dislocation and an increase in seismic intensity elevate the damage level of the tunnel. The OLDC index is symmetrically distributed along the fault plane in an inverted V-shape, with damage primarily concentrated within 14 m on either side of the fault plane. Notably, the compressive damage to the lining intensifies under stronger seismic effects. The OLDT index follows a similar distribution pattern, with complete damage (DS4) concentrated within −20 m to 30 m on both sides of the fault plane.
(5)
Due to the limitations of the research methodology, this study only analyzes the tunnel damage characteristics under different fault initial displacements and various peak seismic accelerations. In future work, we will conduct a sensitivity analysis of key parameters under more conditions. Additionally, due to the lack of seismic damage records under fault dislocation-coupled seismic loading, model tests are needed to validate the theoretical results.

Author Contributions

J.D., methodology, software, validation, writing—original draft; S.Y., methodology, supervision, review and editing, formal analysis; W.S., conceptualization, methodology, supervision, validation, review and editing; Y.L., conceptualization, review and editing, formal analysis; M.C., methodology, review and editing, supervision. All authors have read and agreed to the published version of the manuscript.

Funding

This research was supported by the National Natural Science Foundation of China (Nos. 52068044 and 52208392) and the Natural Science Foundation of Gansu Province (No. 21JR7RA309).

Institutional Review Board Statement

Not applicable.

Informed Consent Statement

Not applicable.

Data Availability Statement

Some or all of the data that support the findings of this study are available from the corresponding author upon reasonable request.

Conflicts of Interest

The authors declare no conflicts of interest.

References

  1. Yu, H.; Chen, J.; Bobet, A.; Yuan, Y. Damage Observation and Assessment of the Longxi Tunnel During the Wenchuan Earthquake. Tunn. Undergr. Space Technol. 2016, 54, 102–116. [Google Scholar] [CrossRef]
  2. Dimitrios, L.; Bouckovalas, G.; Papadimitriou, A. Analysis of Fault Rupture Propagation through Uniform Soil Cover. Soil Dyn. Earthq. Eng. 2009, 29, 1389–1404. [Google Scholar] [CrossRef]
  3. FHWA (Federal Highway Administration). Technical Manual for Design and Construction of Road Tunnels-Civil Elements; Publication No. FHWA-NHI-10-034; Department of Transportation, Federal Highway Administration: Washington, DC, USA, 2019.
  4. ISO 23469:2005; Bases for Design of Structures—Seismic Actions for Designing Geotechnical Works. International Organization for Standardization: Geneva, Switzerland, 2005.
  5. ITA (International Tunneling and Underground Space Association). Tunnel Market Survey. 2016. Available online: https://www.tunnel-online.info/en/artikel/tunnel_Tunnel_Market_Survey_2016_3051818.html (accessed on 8 December 2019).
  6. Bao, L.; Wei, F. Study on the Response of Tunnel Lining under Fault Dislocation. Sustainability 2023, 15, 5150. [Google Scholar] [CrossRef]
  7. Ahmadi, M.; Moosavi, M.; Jafari, M.K. Experimental investigation of reverse fault rupture propagation through cohesive granular soils. Geomech. Energy Environ. 2018, 14, 61–65. [Google Scholar] [CrossRef]
  8. Yang, H.; Wang, M.; Luo, X.; Yu, L.; Zhang, X.; Tang, L. Longitudinal and cross-sectional partitioned failure mechanism of tunnels subjected to stick-slip action of strike-slip faults. J. Cent. South Univ. 2024, 31, 250–271. [Google Scholar] [CrossRef]
  9. Zhu, H.; Yu, H.; Han, F.; Wei, Y.; Yuan, Y. Seismic Resilience Design Principles and Key Issues for Tunnels Crossing Active Faults. Chin. J. Highw. Transp. 2023, 36, 193–204. [Google Scholar]
  10. Sabagh, M.; Ghalandarzadeh, A. Numerical modelings of continuous shallow tunnels subject to reverse faulting and its verification through a centrifuge. Comput. Geotech. 2020, 128, 103813. [Google Scholar] [CrossRef]
  11. Yao, C.; Zhang, Y.; He, C.; Kang, X.; Yang, W.; Geng, P.; Wang, T. An anti-rotation shelf to mitigate the rotation of shield tunnels subjected to normal faulting. Comput. Geotech. 2023, 156, 105297. [Google Scholar] [CrossRef]
  12. Liu, X.; Lin, L. Research on model experiment of effect of thrust fault with 75° dip angle stick-slip dislocation on highway tunnel. Chin. J. Rock Mech. Eng. 2011, 30, 2523–2530. [Google Scholar]
  13. Liu, X.; Wang, X.; Lin, L. Model experiment on effect of normal fault with 75° dip angle stick-slip dislocation on highway tunnel. Chin. J. Rock Mech. Eng. 2013, 32, 1714. [Google Scholar]
  14. Liu, X.; Wang, X.; Lin, L. Model experimental study on influence of normal fault with 60° dip angle stick-slip dislocation on mountain tunnel. Chin. Civil Eng. J. 2014, 47, 121–128. [Google Scholar] [CrossRef]
  15. Tang, J.; He, M.; Bian, H.; Qiao, Y. A novel numerical framework to simulate mechanical response and damage characteristics of mountain tunnels under faulting. Eng. Fail. Anal. 2024, 158, 108030. [Google Scholar] [CrossRef]
  16. Yuan, R.; Qiu, Y.; Cheng, Y. A Framework of Probabilistic Seismic Risk Analysis of Urban Shallow-Buried Tunnels Subjected to Active Fault Dislocations. J. Earthq. Eng. 2023, 28, 1312–1330. [Google Scholar] [CrossRef]
  17. Baziar, M.H.; Nabizadeh, A.; Lee, J.; Huang, W. Centrifuge modeling of interaction between reverse faulting and tunnel. Soil Dyn. Earthq. Eng. 2014, 65, 151–164. [Google Scholar] [CrossRef]
  18. Cui, G.; Ji, L.; Jing, H. Damping Shake Technology of the Shock Absorption Layer of Fault-Crossing Tunnels in a Dangerous Mountainous Area with High-Intensity Earthquakes. Chin. Earthq. Eng. J. 2019, 44, 226–291. [Google Scholar]
  19. Geng, P.; Wu, C.; Tang, J.; Li, L. Analysis of Dynamic Response Properties for Tunnel Through Fault Fracture Zone. Chin. J. Rock Mech. Eng. 2012, 31, 1406–1413. [Google Scholar]
  20. Zang, X.; Shen, Y.; Zhou, P.; Qiu, J. Partitions of Seismic Affected Zone and Characteristics of Segmental Lining Based on Energy Principle. J. Cen. South Univ. 2023, 30, 227–242. [Google Scholar] [CrossRef]
  21. Yu, H.; Zhang, Z.; Chen, J.; Bobet, A.; Zhao, M.; Yuan, Y. Analytical solution for longitudinal seismic response of tunnel liners with sharp stiffness transition. Tunn. Undergr. Space Technol. 2018, 77, 103–144. [Google Scholar] [CrossRef]
  22. Zhang, Y.; Yuan, K.; Zhao, W.; Fan, J. Study on structural deformation characteristics and surface crack distribution of girder tunnel across Lenglongling fault caused by Menyuan earthquake. Chin. J. Rock Mech. Eng. 2023, 42, 1055–1069. [Google Scholar]
  23. Zhao, Y.; Guo, E.; Liu, Z.; Gao, L. Damage analysis of urban metro tunnel under strike-slip fault. Rock Soil Mech. 2014, 35, 467–473. [Google Scholar]
  24. GB/T50218-2014; Standard for Engineering Classification of Rock Masses. China Planning Press: Beijing, China, 2014.
  25. Du, J.; Yan, S.; Sun, W.; Cao, M.; Li, Y.; Yang, K. Study on Damage Evolution of Tunnel Lining under Strike-Slip Fault Movements. Geofluids 2023, 2023, 7106729. [Google Scholar] [CrossRef]
  26. Hou, R. ABAQUS Development of Free Field Boundary based on ABAQUS and Its Application of Dynamic Analysis on Tunnel Structure. Ph.D. Thesis, Southwest Jiaotong University, Chengdu, China, 2014. [Google Scholar]
  27. GB 50010-2010; Design Code for Concrete Structures. China Architecture & Building Press: Beijing, China, 2015.
  28. Zhuang, H.; Hu, Z.; Wang, X.; Chen, G. Seismic responses of a large underground structure in liquefied soils by FEM numerical modelling. Bull. Eng. Geol. Environ. 2015, 13, 3645–3668. [Google Scholar] [CrossRef]
  29. Vazouras, P.; Karamanos, S.A. Structural behavior of buried pipe bends and their effect on pipeline response in fault crossing areas. Bull. Earthq. Eng. 2015, 15, 4999–5024. [Google Scholar] [CrossRef]
  30. Demirci, H.E.; Bhattacharya, S.; Karamitros, D.; Alexander, N. Experimental and numerical modelling of buried pipelines crossing reverse faults. Soil Dyn. Earthq. Eng. 2018, 114, 198–214. [Google Scholar] [CrossRef]
  31. GB 50011-2010; Code for Seismic Design of Buildings. Standards Press of China: Beijing, China, 2010.
  32. Xie, H.; Ju, Y.; Li, L. Criteria for Strength and Structural Failure of Rocks Based on Energy Dissipation and Energy Release Principles. Chin. J. Rock Mech. Eng. 2005, 24, 3003–3010. [Google Scholar]
  33. Qiao, Y.; Tang, J.; Liu, G.; He, M. Longitudinal mechanical response of tunnels under active normal faulting. Undergr. Space 2022, 7, 662–679. [Google Scholar] [CrossRef]
  34. Shen, Y.; Gao, B.; Yang, X.; Tao, S. Seismic damage mechanism and dynamic deformation characteristic analysis of mountain tunnel after Wenchuan earthquake. Eng. Geol. 2014, 180, 85–98. [Google Scholar] [CrossRef]
  35. Liu, G.; Xiao, M.; Chen, J. Seismic performance assessment of tunnel structure based on incremental dynamic analysis. Adv. Eng. Sci. 2019, 51, 92–100. [Google Scholar] [CrossRef]
Figure 1. Tunnel support structure.
Applsci 15 01150 g001
Figure 2. Three-dimensional numerical model.
Applsci 15 01150 g002
Figure 3. Stress–strain relationships of the lining material.
Applsci 15 01150 g003
Figure 4. Mechanical behavior of the contact surface. (a) Separation state. (b) Contact state. (c) Tangential mechanical behavior.
Applsci 15 01150 g004
Figure 5. Input artificial ground motion (PGA = 0.2 g). (a) Acceleration time history. (b) Acceleration response spectrum.
Applsci 15 01150 g005
Figure 6. Flow chart.
Applsci 15 01150 g006
Figure 7. Acceleration time history of the tunnel.
Applsci 15 01150 g007
Figure 8. PGA amplification results at different longitudinal distances of the tunnel.
Applsci 15 01150 g008
Figure 9. Damage cloud diagrams of the tunnel lining under different cases. (a) Compression damage. (b) Tensile damage.
Applsci 15 01150 g009
Figure 10. Energy dissipation time history.
Applsci 15 01150 g010
Figure 11. Overall lining damage under different cases. (a) OLDC. (b) OLDT.
Applsci 15 01150 g011
Figure 12. Lining damage under different initial fault displacements. (a) Compression damage. (b) Tensile damage.
Applsci 15 01150 g012
Figure 13. Overall lining damage under different initial fault displacements. (a) Compression damage. (b) Tensile damage.
Applsci 15 01150 g013
Figure 14. Lining damage at different peak seismic accelerations. (a) Compression damage. (b) Tensile damage.
Applsci 15 01150 g014
Figure 15. Overall lining damage at different peak seismic accelerations. (a) Compression damage. (b) Tensile damage.
Applsci 15 01150 g015
Table 1. Rock mechanical parameters [25].
NameDensity/(kg/m3)Elastic Modulus/GPaPoisson RatioInternal Friction Angle/(°)Cohesion/(MPa)
The complete rock mass21003.00.33310.40
Fault fracture zone17001.10.41210.07
Table 2. Mechanical parameters of the lining.
NameDensity/(kg/m3)Elastic Modulus/MPaPoisson RatioCompressive Yield Stress/MPaTensile Yield Stress/MPa
Primary support240030,0000.220.12.01
Secondary lining250031,5000.223.42.20
Table 3. Peak acceleration in various parts of the tunnel.
Location120600−60−120
Name
Vault0.490.620.940.730.57
Invert0.510.630.880.70.55
Right side wall0.480.610.860.680.58
Left side wall0.520.580.870.710.57
Table 4. Damage level classifications.
Damage LevelDescription of Damage CharacteristicsOverall Lining Damage Index
DS1No damage or minor cracks (no repair required).OLDC, OLDT < 0.3
DS2Visible cracking in the lining (surface repair).0.3 < OLDC, OLDT < 0.6
DS3Cracks are widely distributed in the tunnel lining, and some linings are crushed and spalling (need to suspend operations).0.6 < OLDC, OLDT < 0.8
DS4Significant and numerous cracks in the tunnel lining; the lining is sheared off; vault collapse (loss of the operational function of the tunnel).0.8 < OLDC, OLDT
Disclaimer/Publisher’s Note: The statements, opinions and data contained in all publications are solely those of the individual author(s) and contributor(s) and not of MDPI and/or the editor(s). MDPI and/or the editor(s) disclaim responsibility for any injury to people or property resulting from any ideas, methods, instructions or products referred to in the content.

