
Design and Testing of a Gasoline Engine Muffler Based on the Principle of Split-Stream Rushing


Abstract
1. Introduction
2. Materials and Methods
2.1. Evaluation Index
2.1.1. Acoustic Performance Evaluation Index
- 1.
- Transmission Loss
- 2.
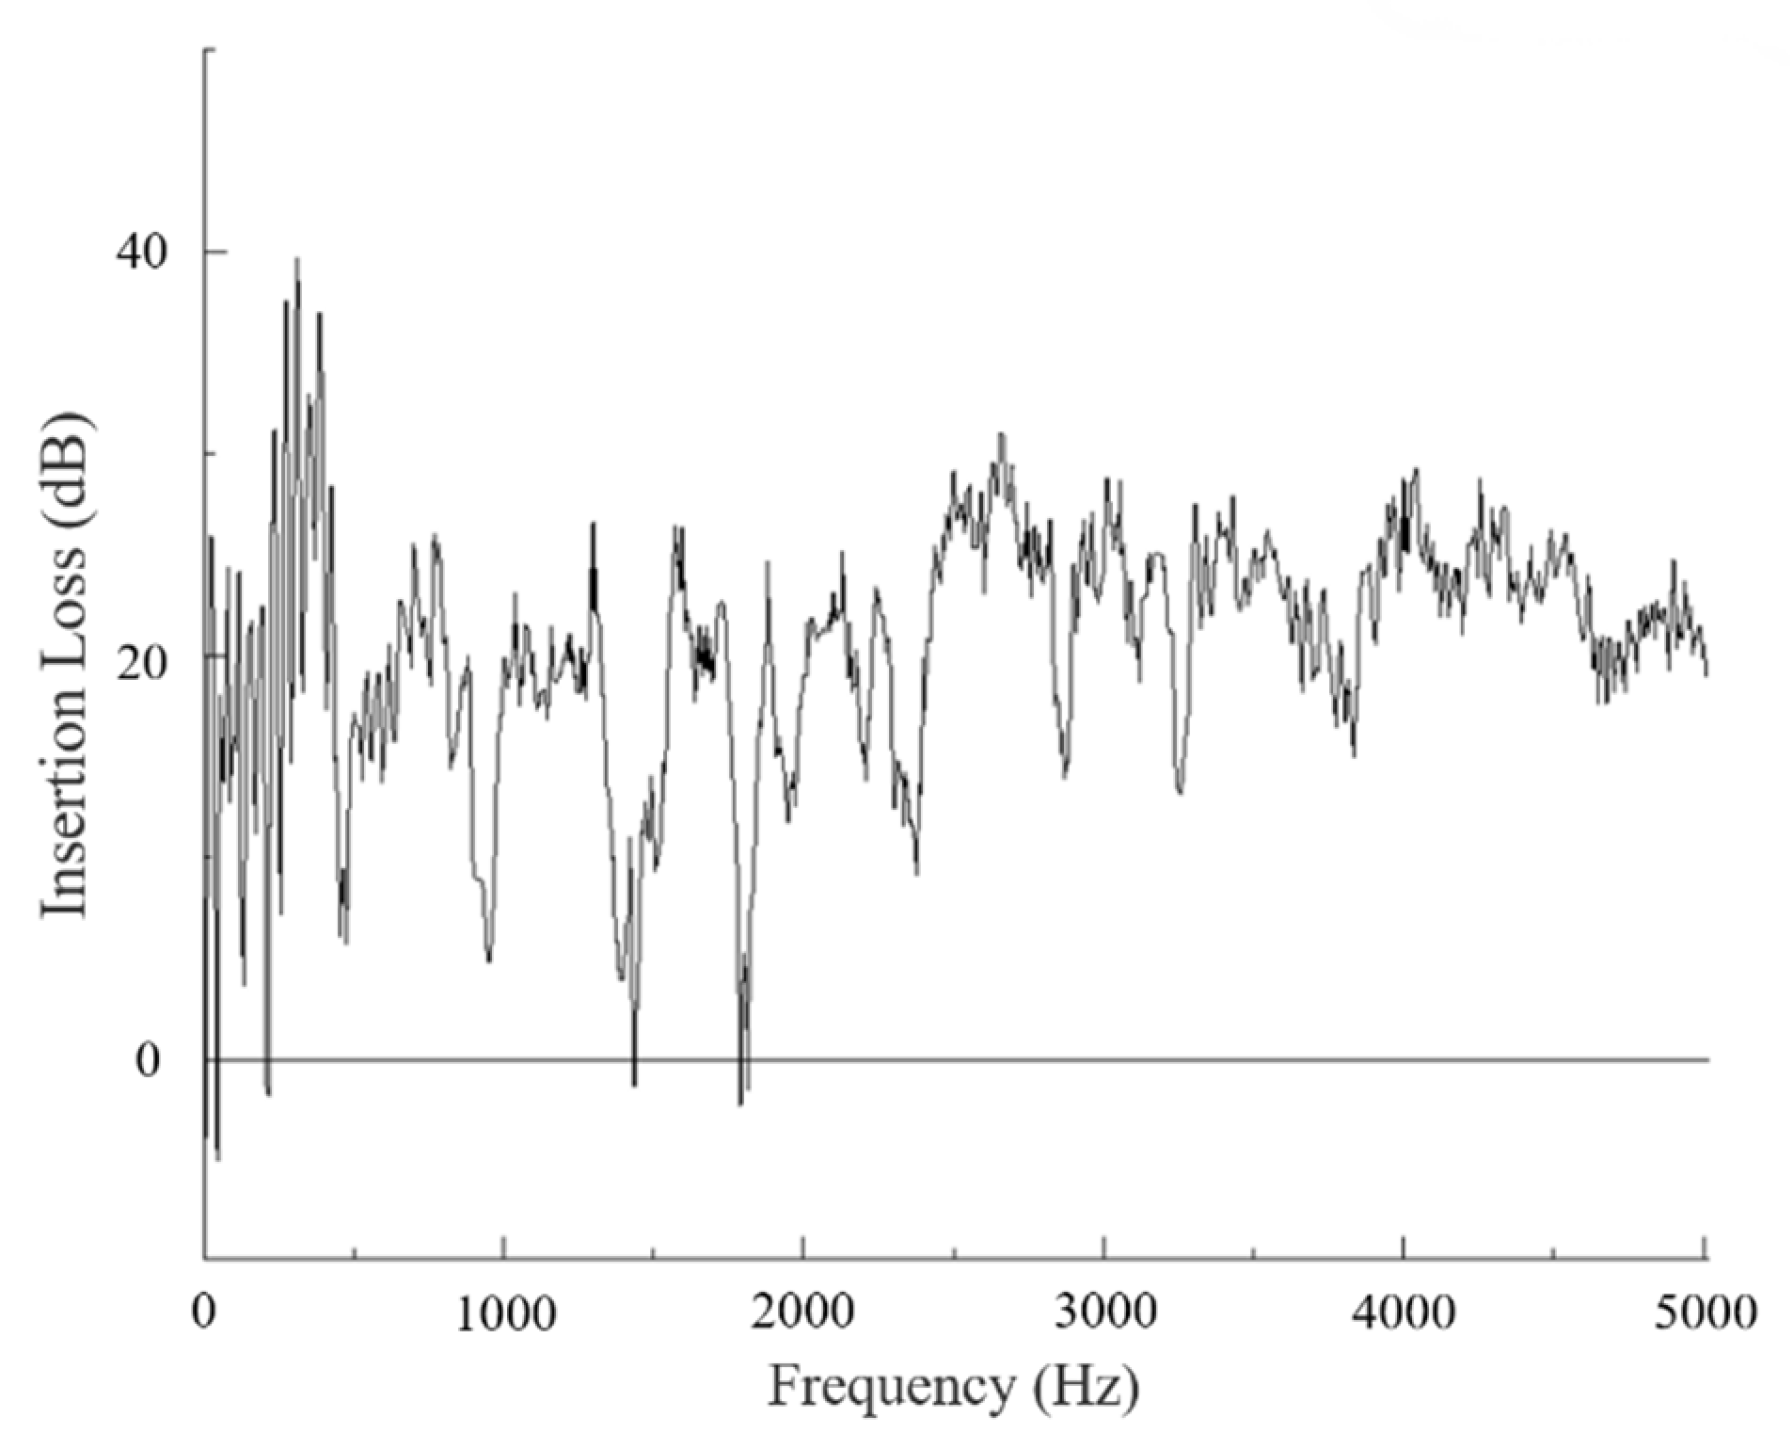
- Insertion loss
2.1.2. Aerodynamic Performance Evaluation Index
- Friction resistance loss
- Local resistance loss
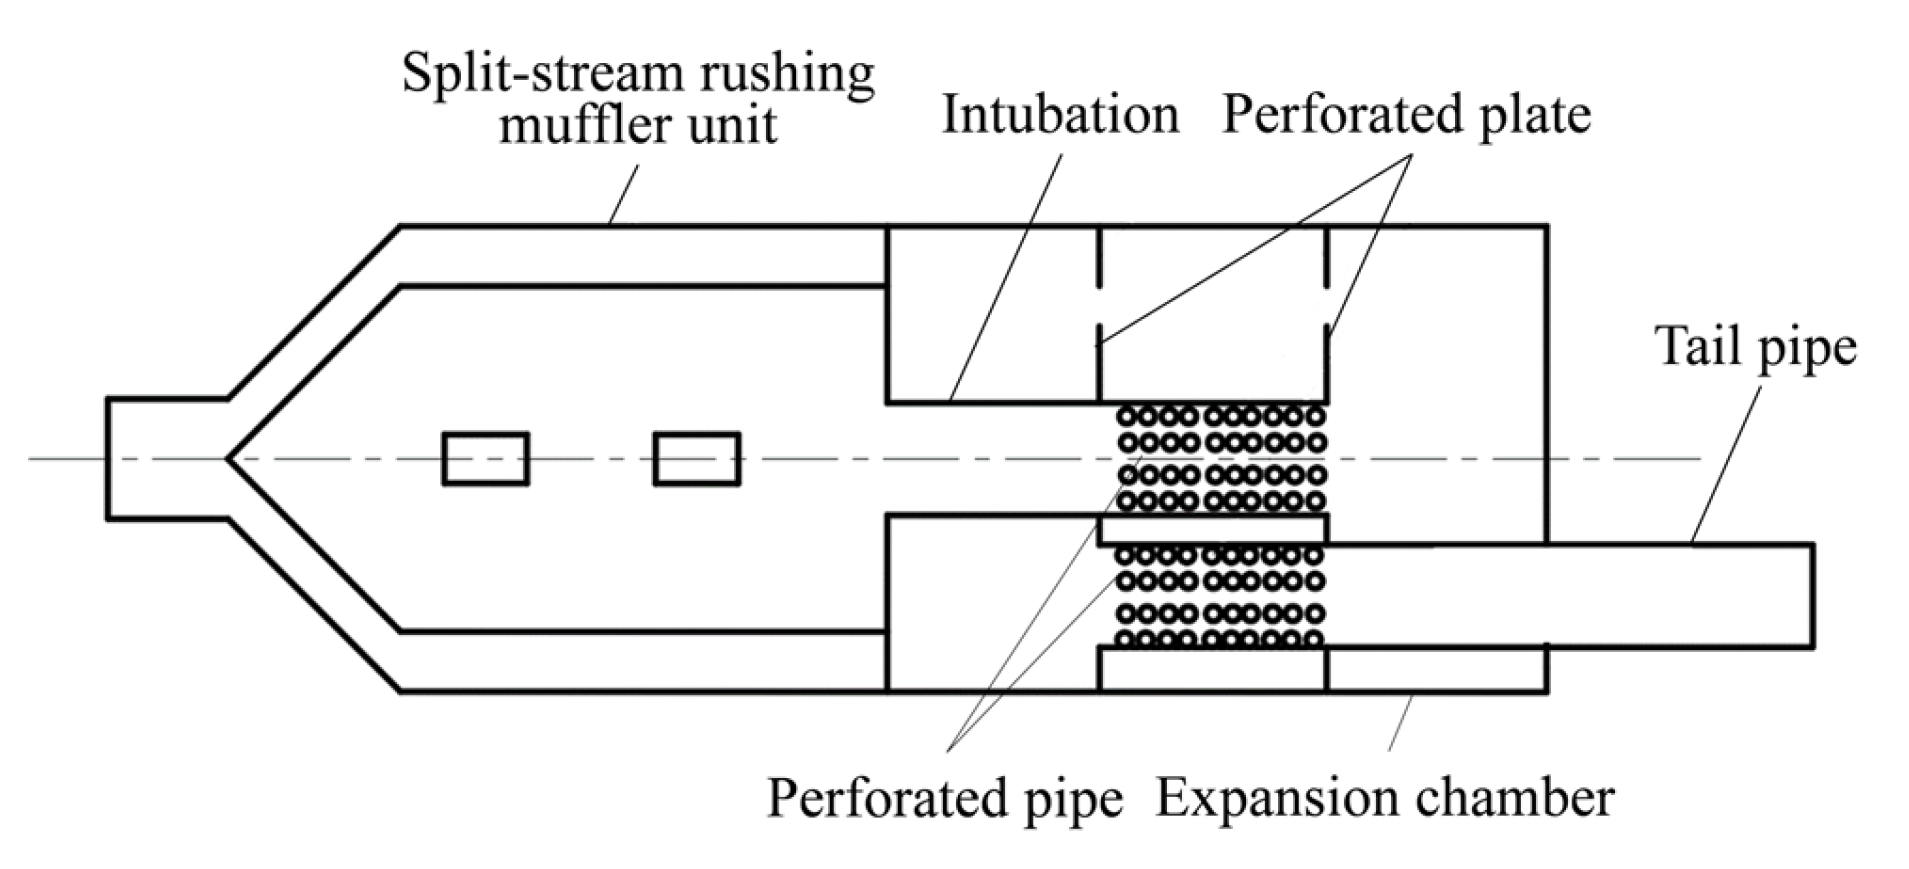
2.2. Working Principle of Split-Stream Rushing Muffler
2.3. Acoustic and Aerodynamic Tests
2.3.1. Gasoline Engine Noise Test and Acoustic Test
- (1)
- After removing the muffler of the target engine, the engine was placed in an open area, and it was ensured that there were no reflectors around the site to reduce inaccurate test results due to sound wave reflection.
- (2)
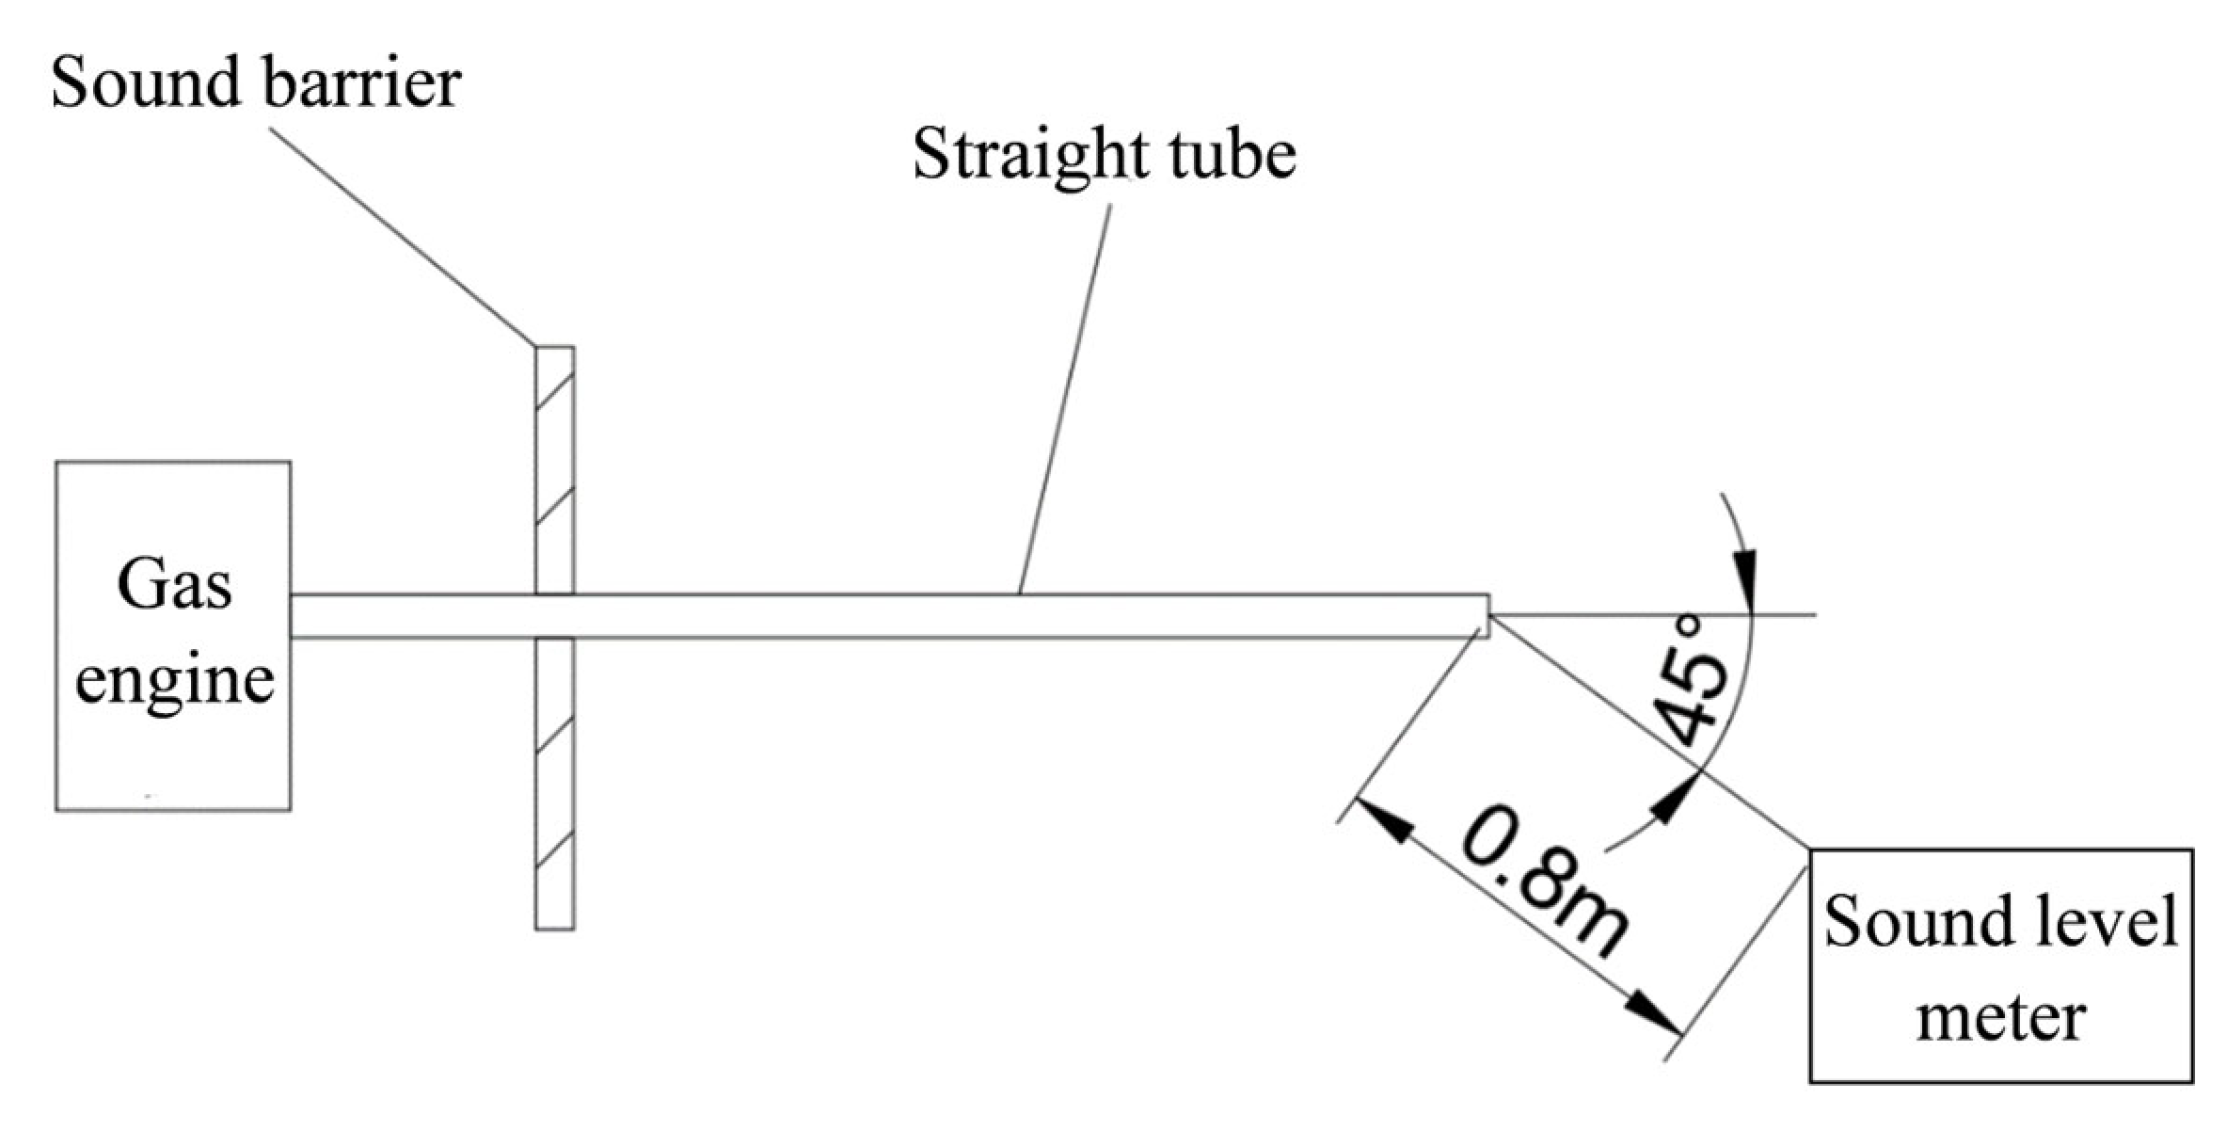
- A straight pipe was connected directly to the engine exhaust. The length of the straight pipe was the same as that of the previous muffler. In order to minimize the influence of other engine noises on the exhaust noise, a whole sound insulation panel with an opening in the middle was used. The straight pipe was passed through the opening and extended out of the sound insulation panel, and the opening of the sound insulation panel was sealed for sound and vibration isolation.
- (3)
- The engine was placed outdoors, and it was ensured that there was no interference from other noise sources. When the outdoor wind speed was greater than 1 m/s, a wind shield was used as required to reduce the impact on noise testing due to excessive wind speed; when the wind speed exceeded 5 m/s, the measurement was stopped to avoid distorted test data, and there were no reflectors within 10 m around the exhaust pipe.
- (4)
- The measurement position was located at a 45° direction of the exhaust port airflow axis, and the measuring distance was selected as 1 m, with one measuring point taken. When measuring the distance, it was ensured that the measuring distance was greater than three times the diameter of the pipe opening and not less than 0.25 m.
- (5)
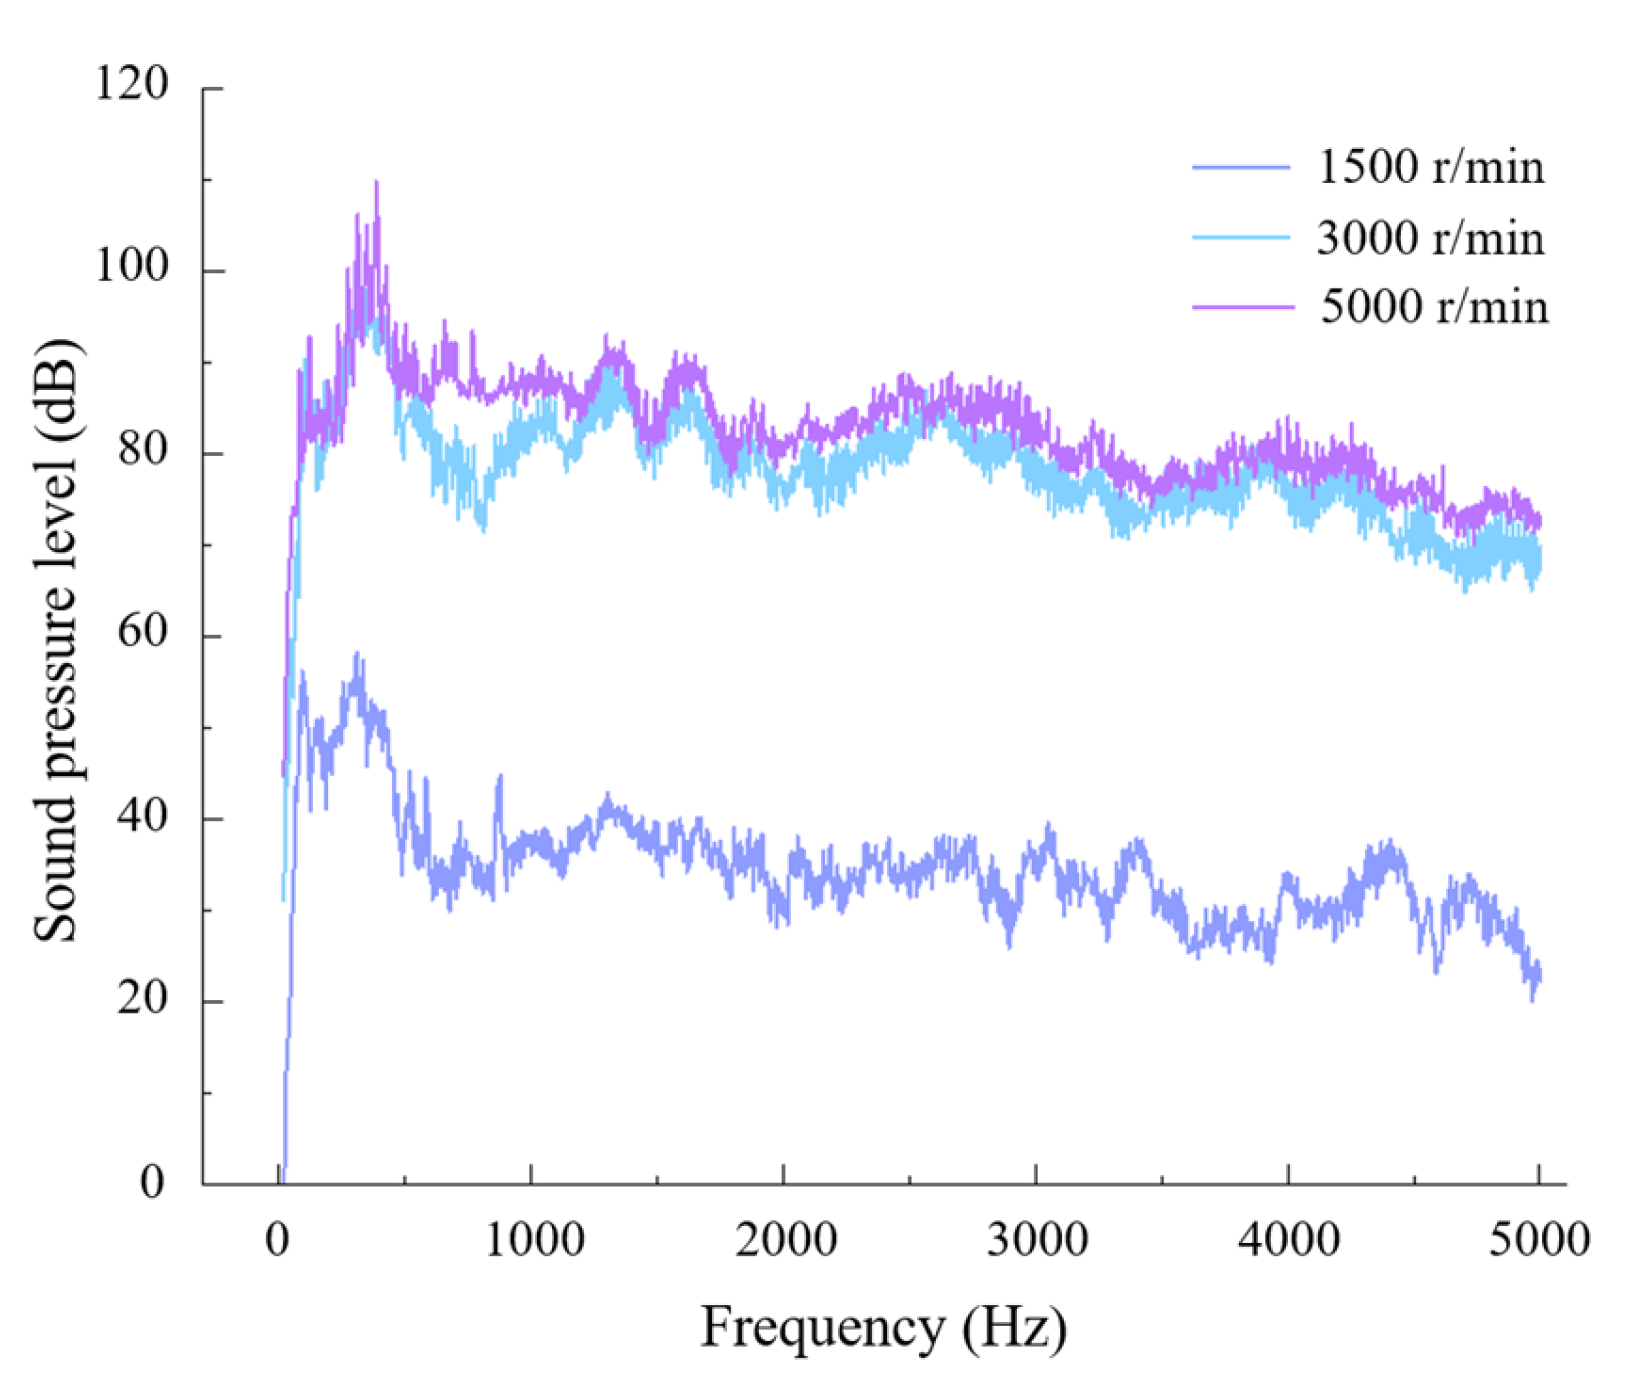
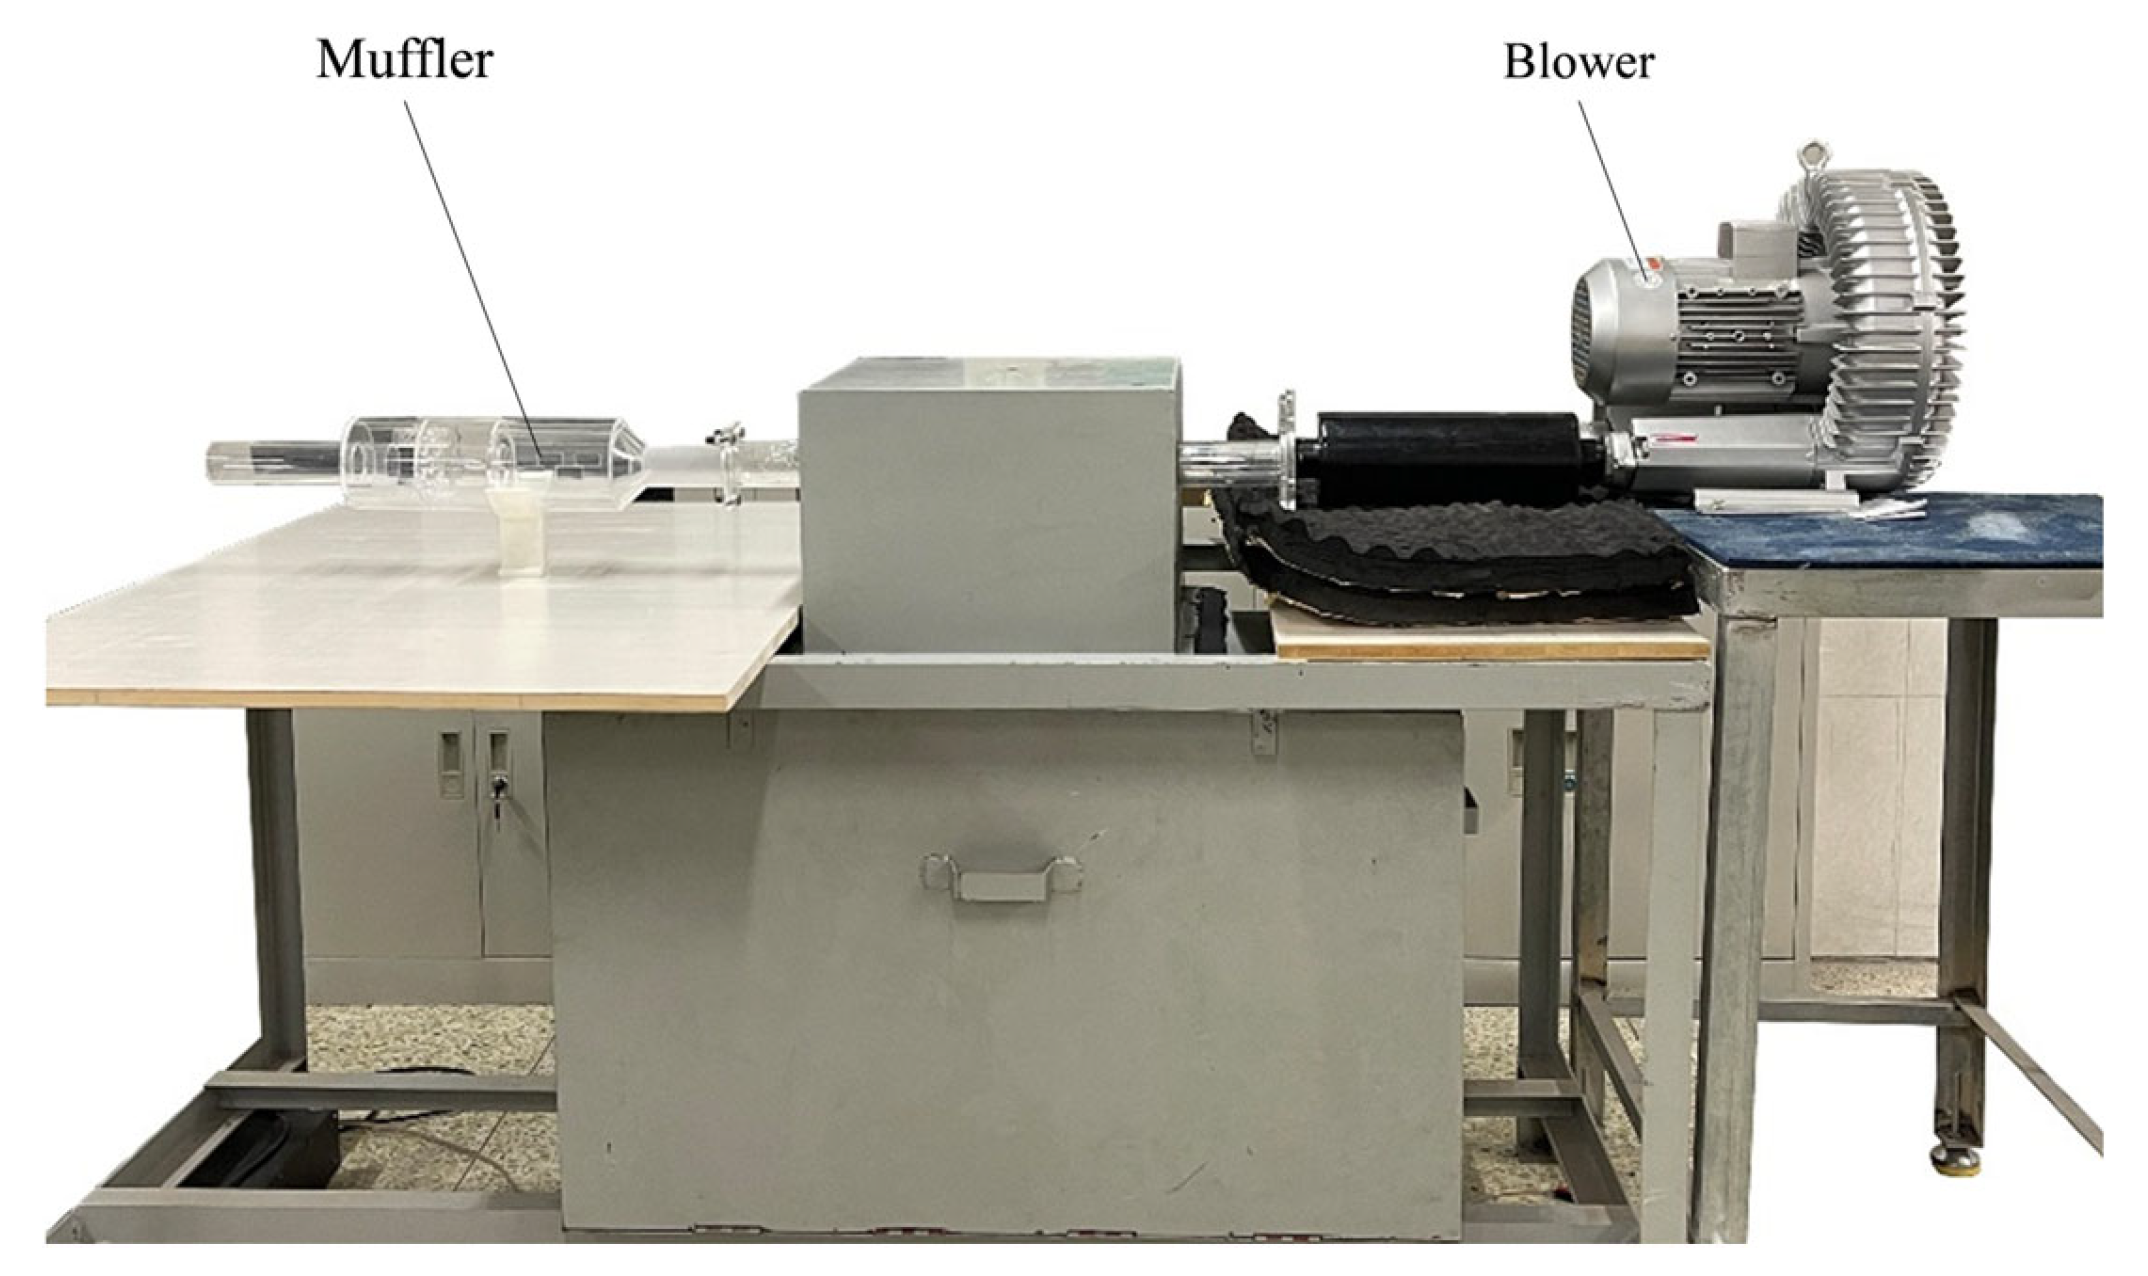
- After the preliminary arrangement work of the test was completed, the engine was started. After the engine had run for 10 min, a sound level meter was used to measure the exhaust noise of the engine at different speeds, namely idle speed, medium speed, and rated speed. During the test, two data measurements were completed, respectively, and the average value of the two data measurements was taken. In one test, two data records were completed, and the parking time interval between the two data records did not exceed 30 min. The test schematic diagram is shown in Figure 3, and the test equipment is shown in Figure 4. The test equipment used in this test was the B&K 2250 sound level meter and the 4231 type calibrator.
2.3.2. Aerodynamic Tests
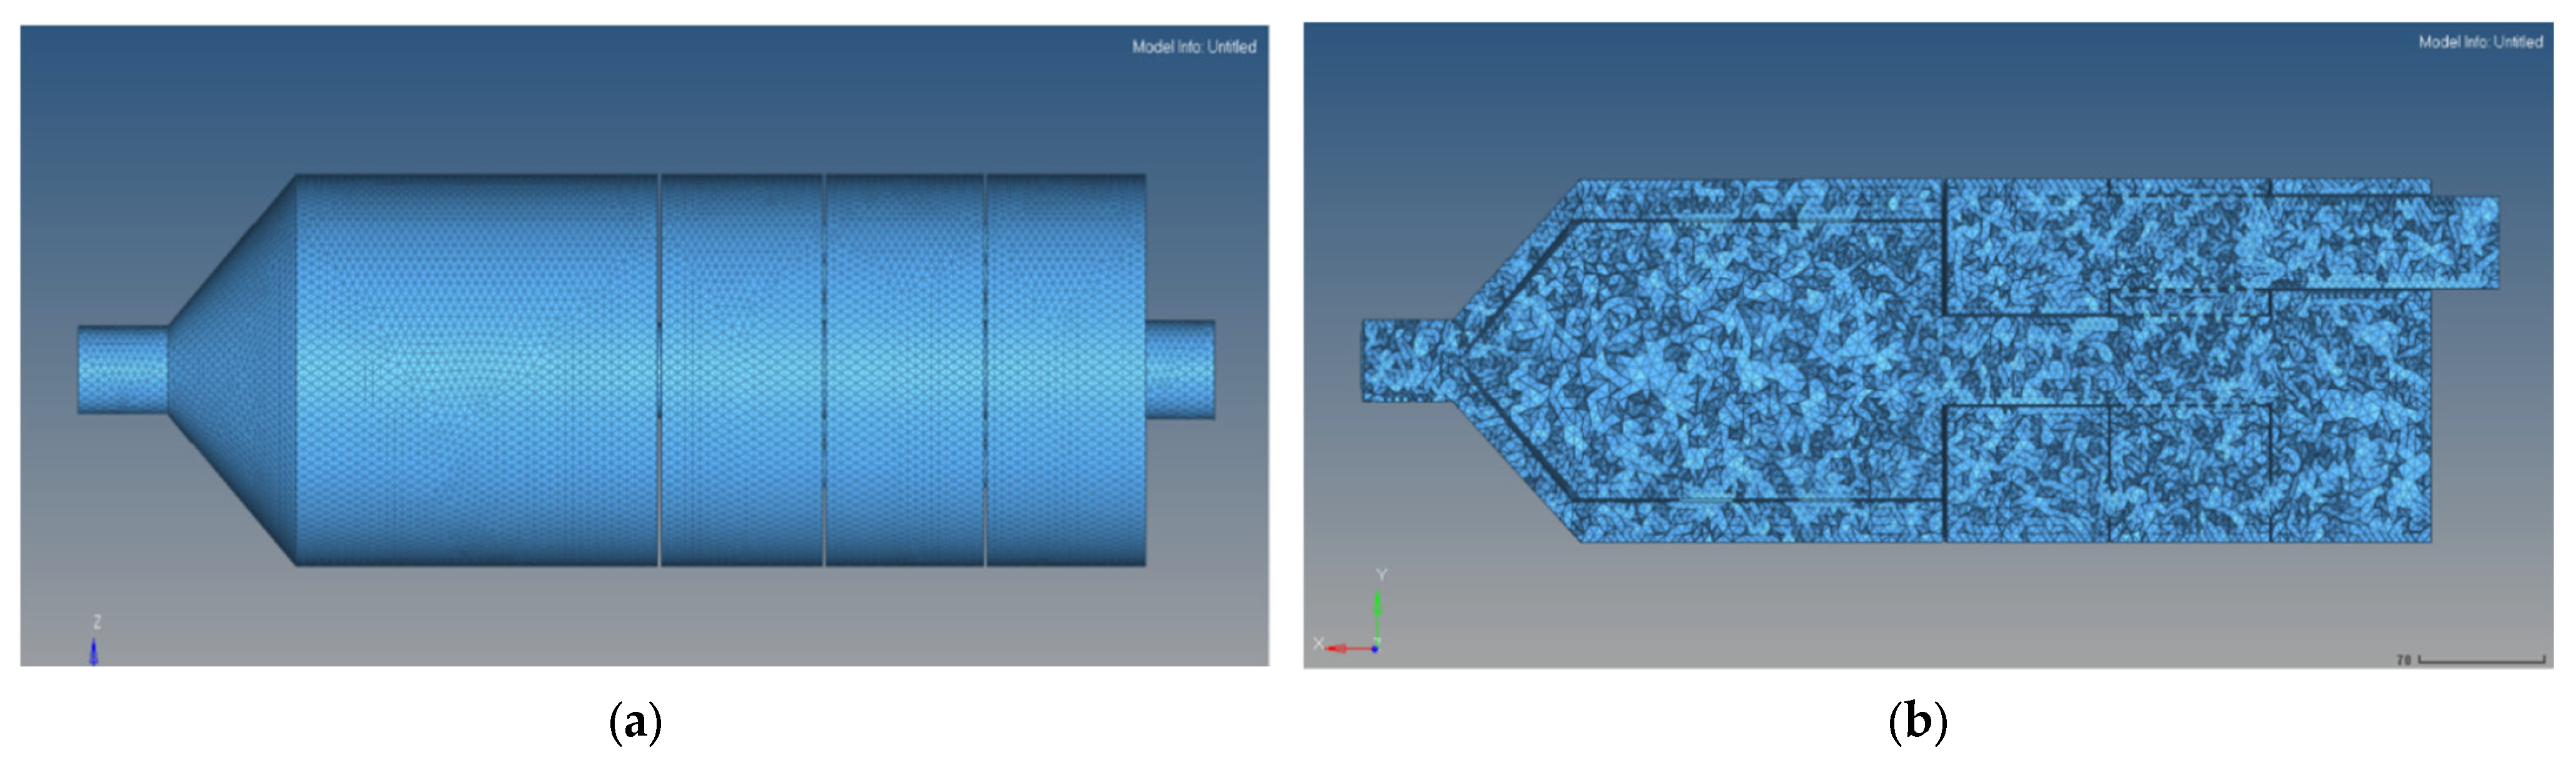
2.4. Structural Coupling of a Split-Stream Rushing Muffler
2.5. Scheme of Orthogonal Tests
3. Results
3.1. Subsection
3.2. Acoustic Performance Analysis of Split-Stream Rushing Muffler
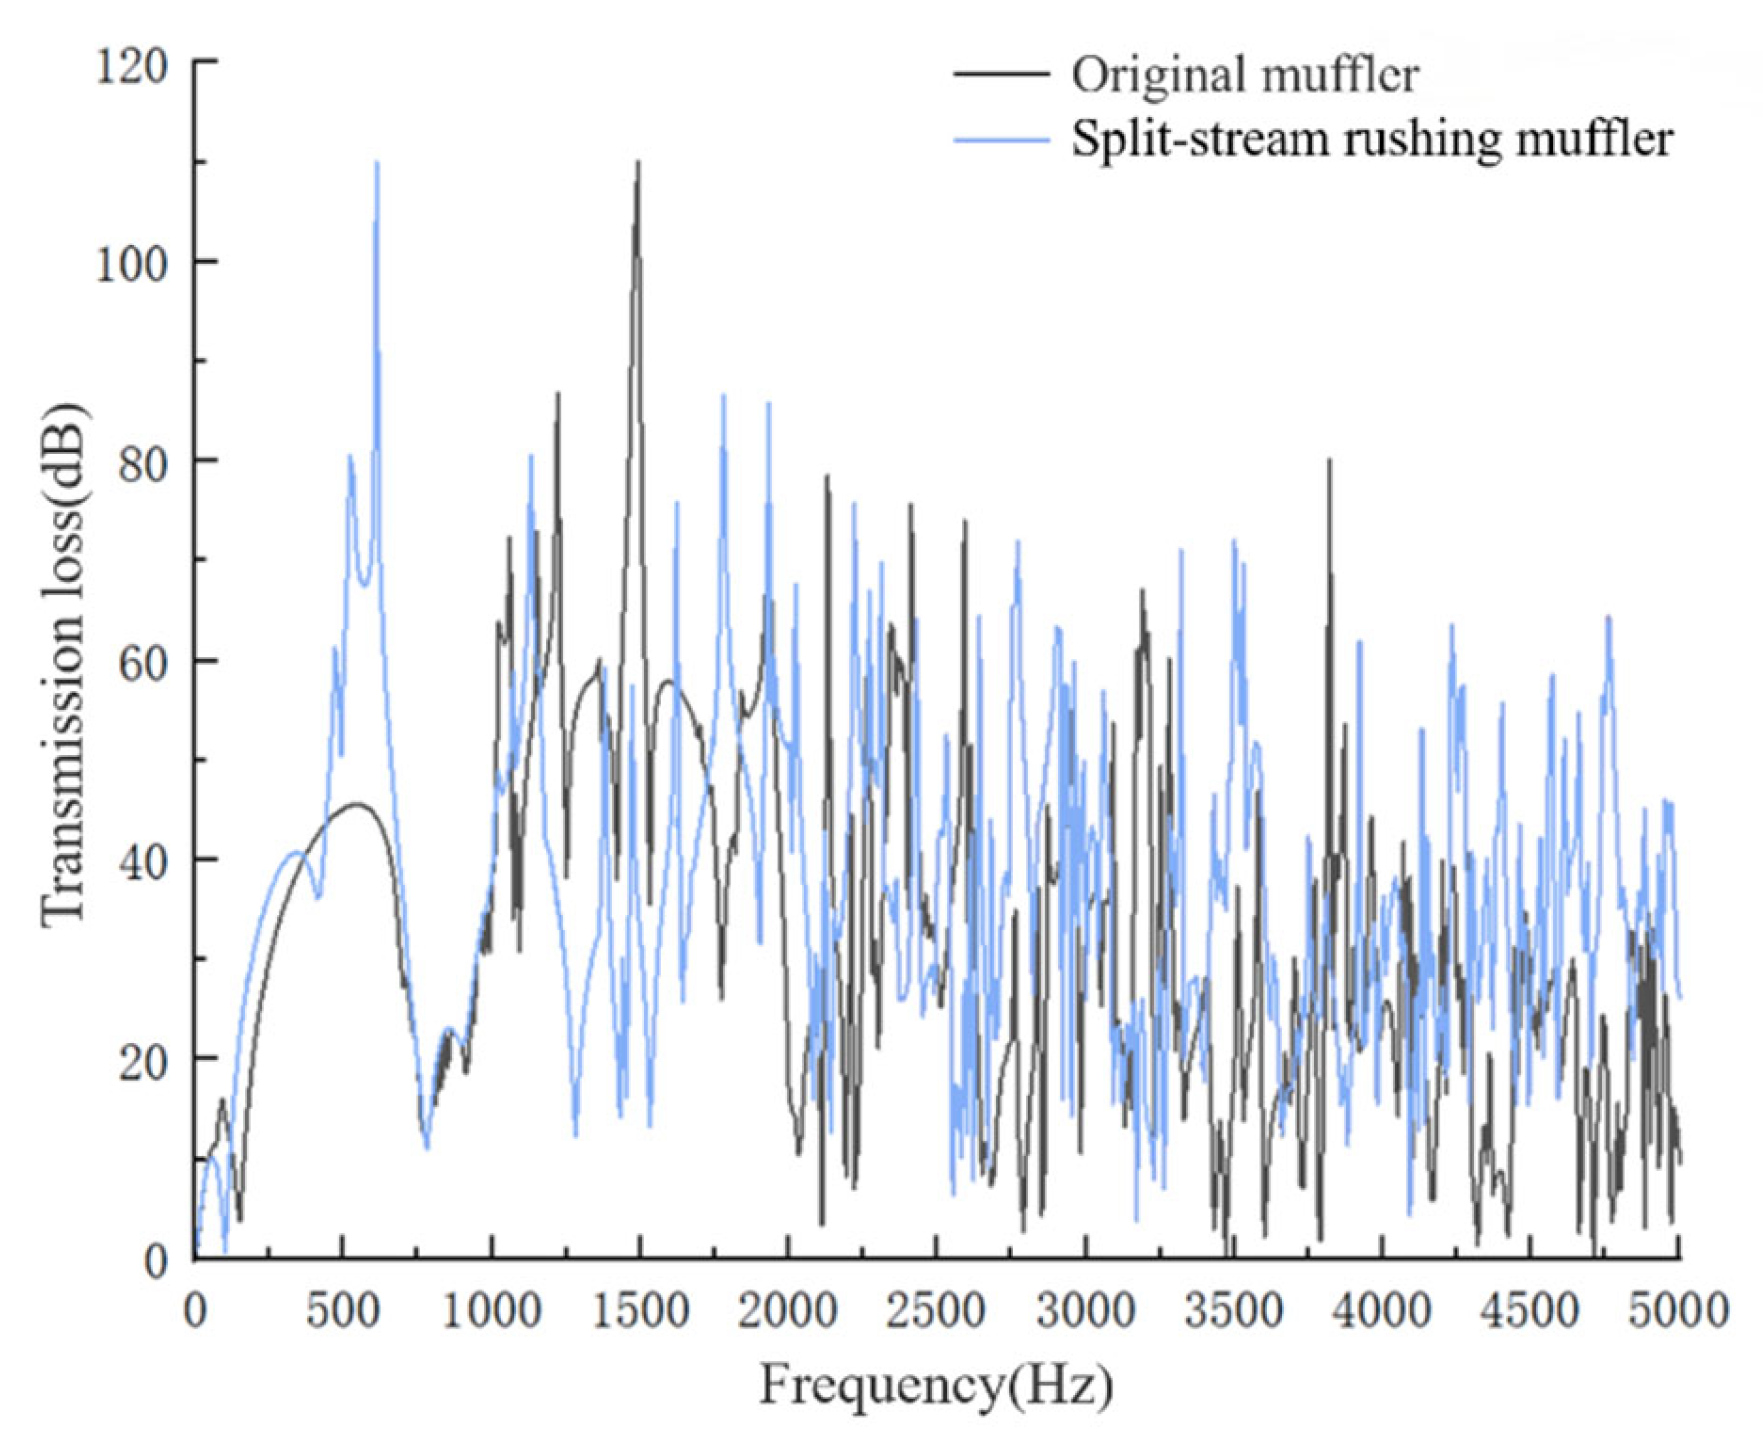
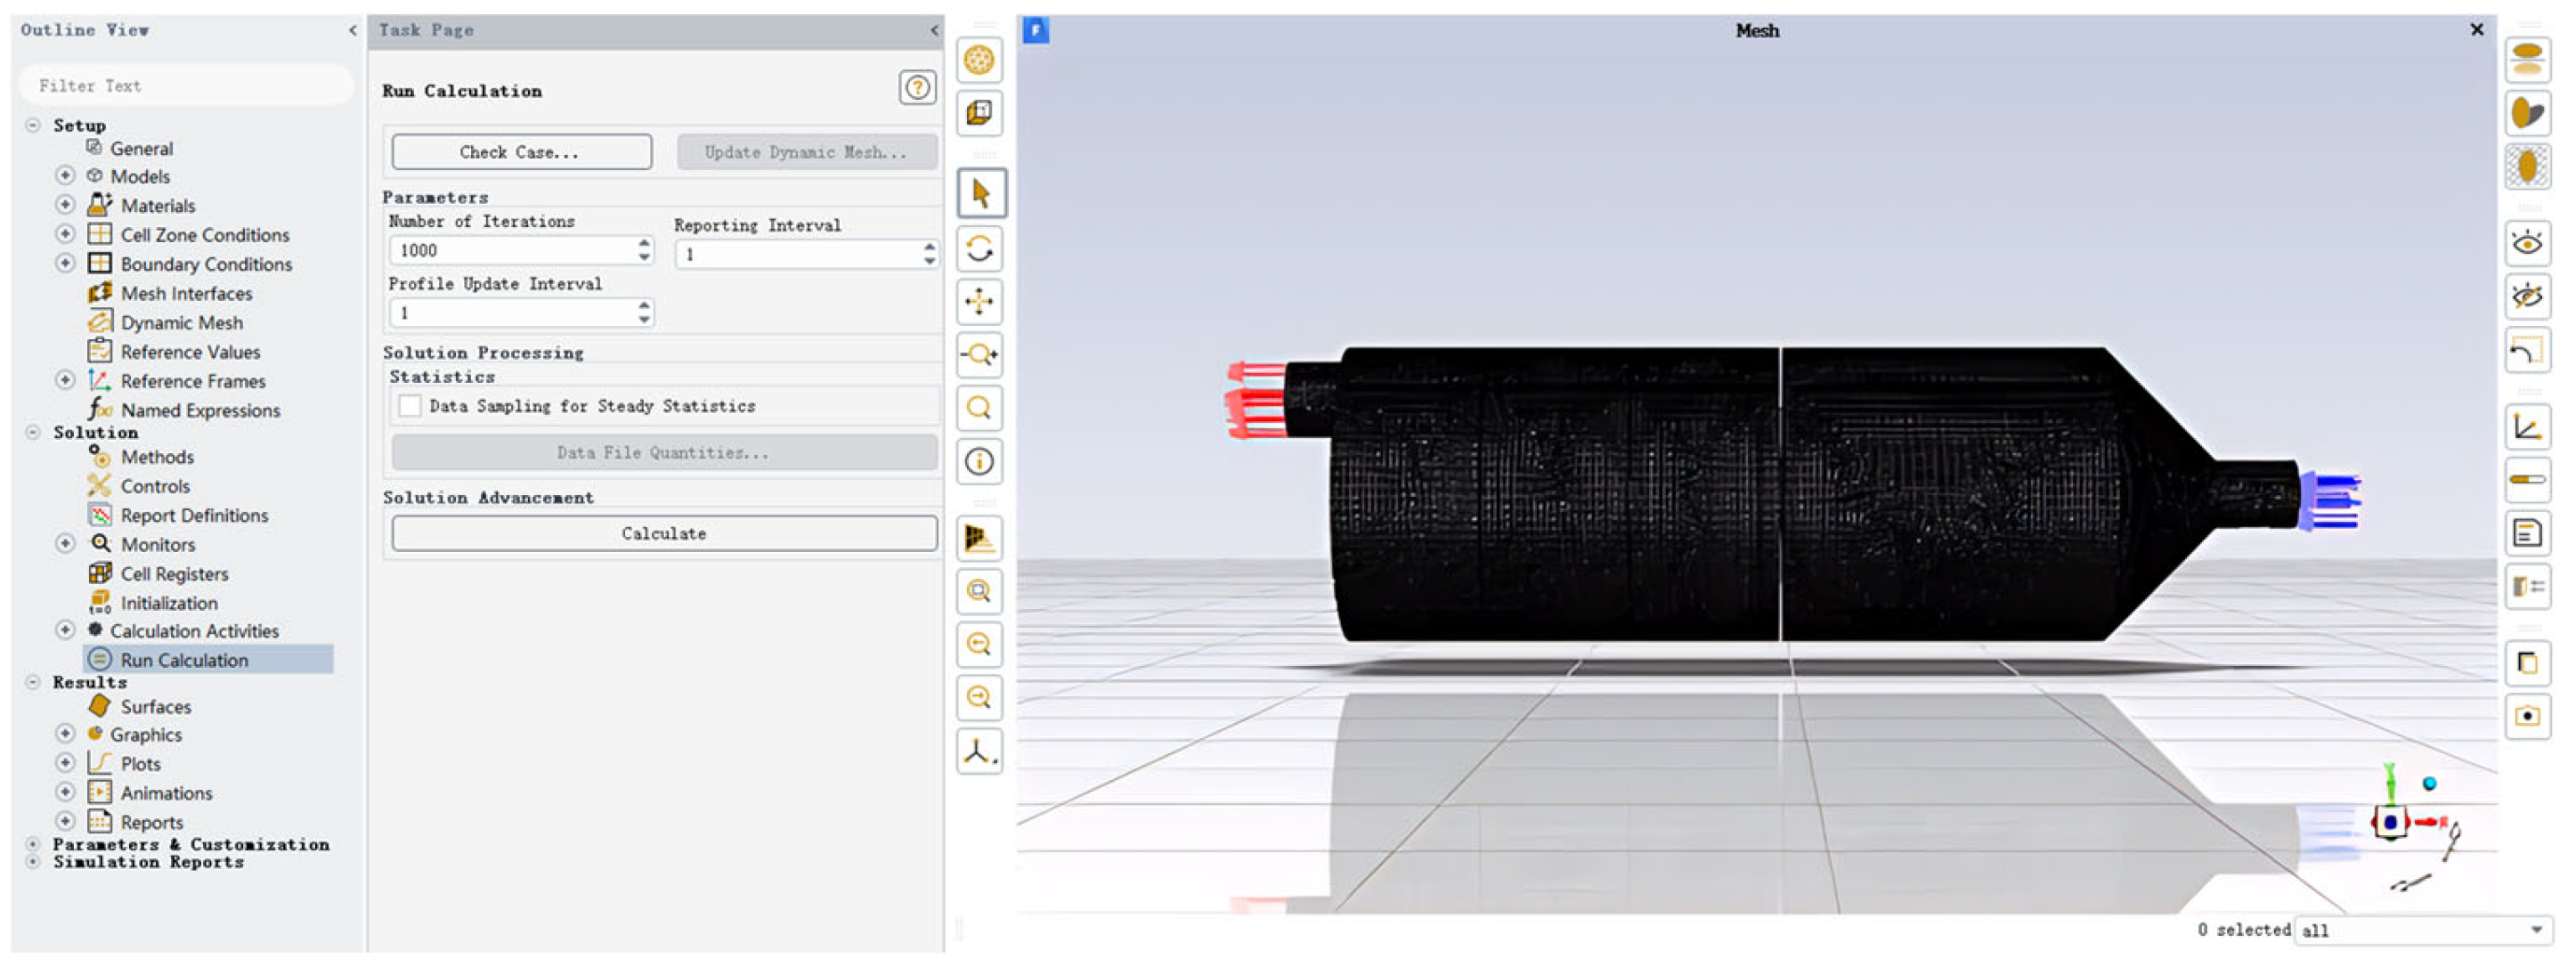
3.2.1. Acoustic Performance Simulation Test Results and Analysis
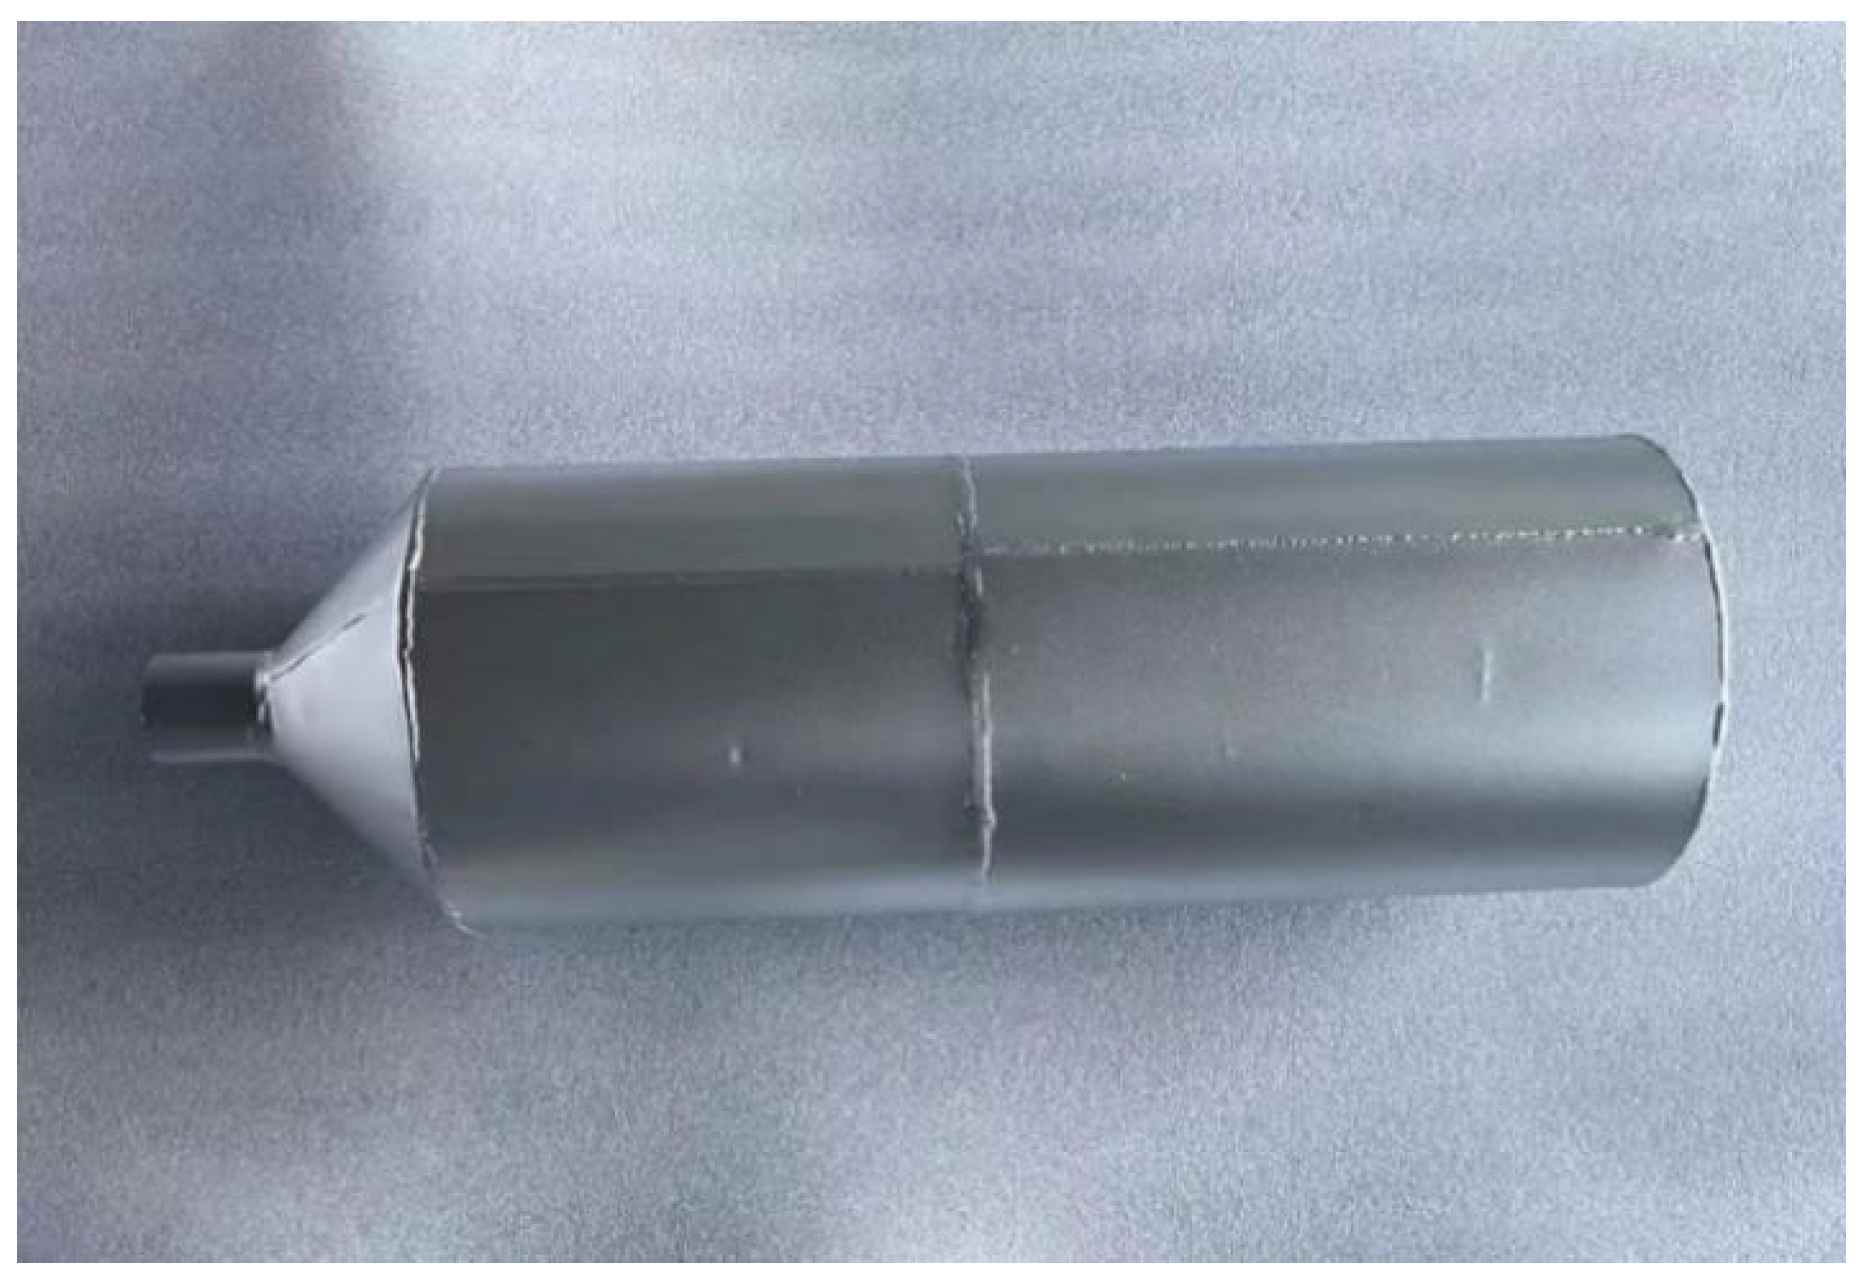
3.2.2. Acoustic Performance Experiment Results and Analysis
3.3. Aerodynamic Performance Analysis of Split-Stream Rushing Muffler
3.3.1. Aerodynamic Performance Simulation Test Results and Analysis
- Analysis of velocity field simulation results
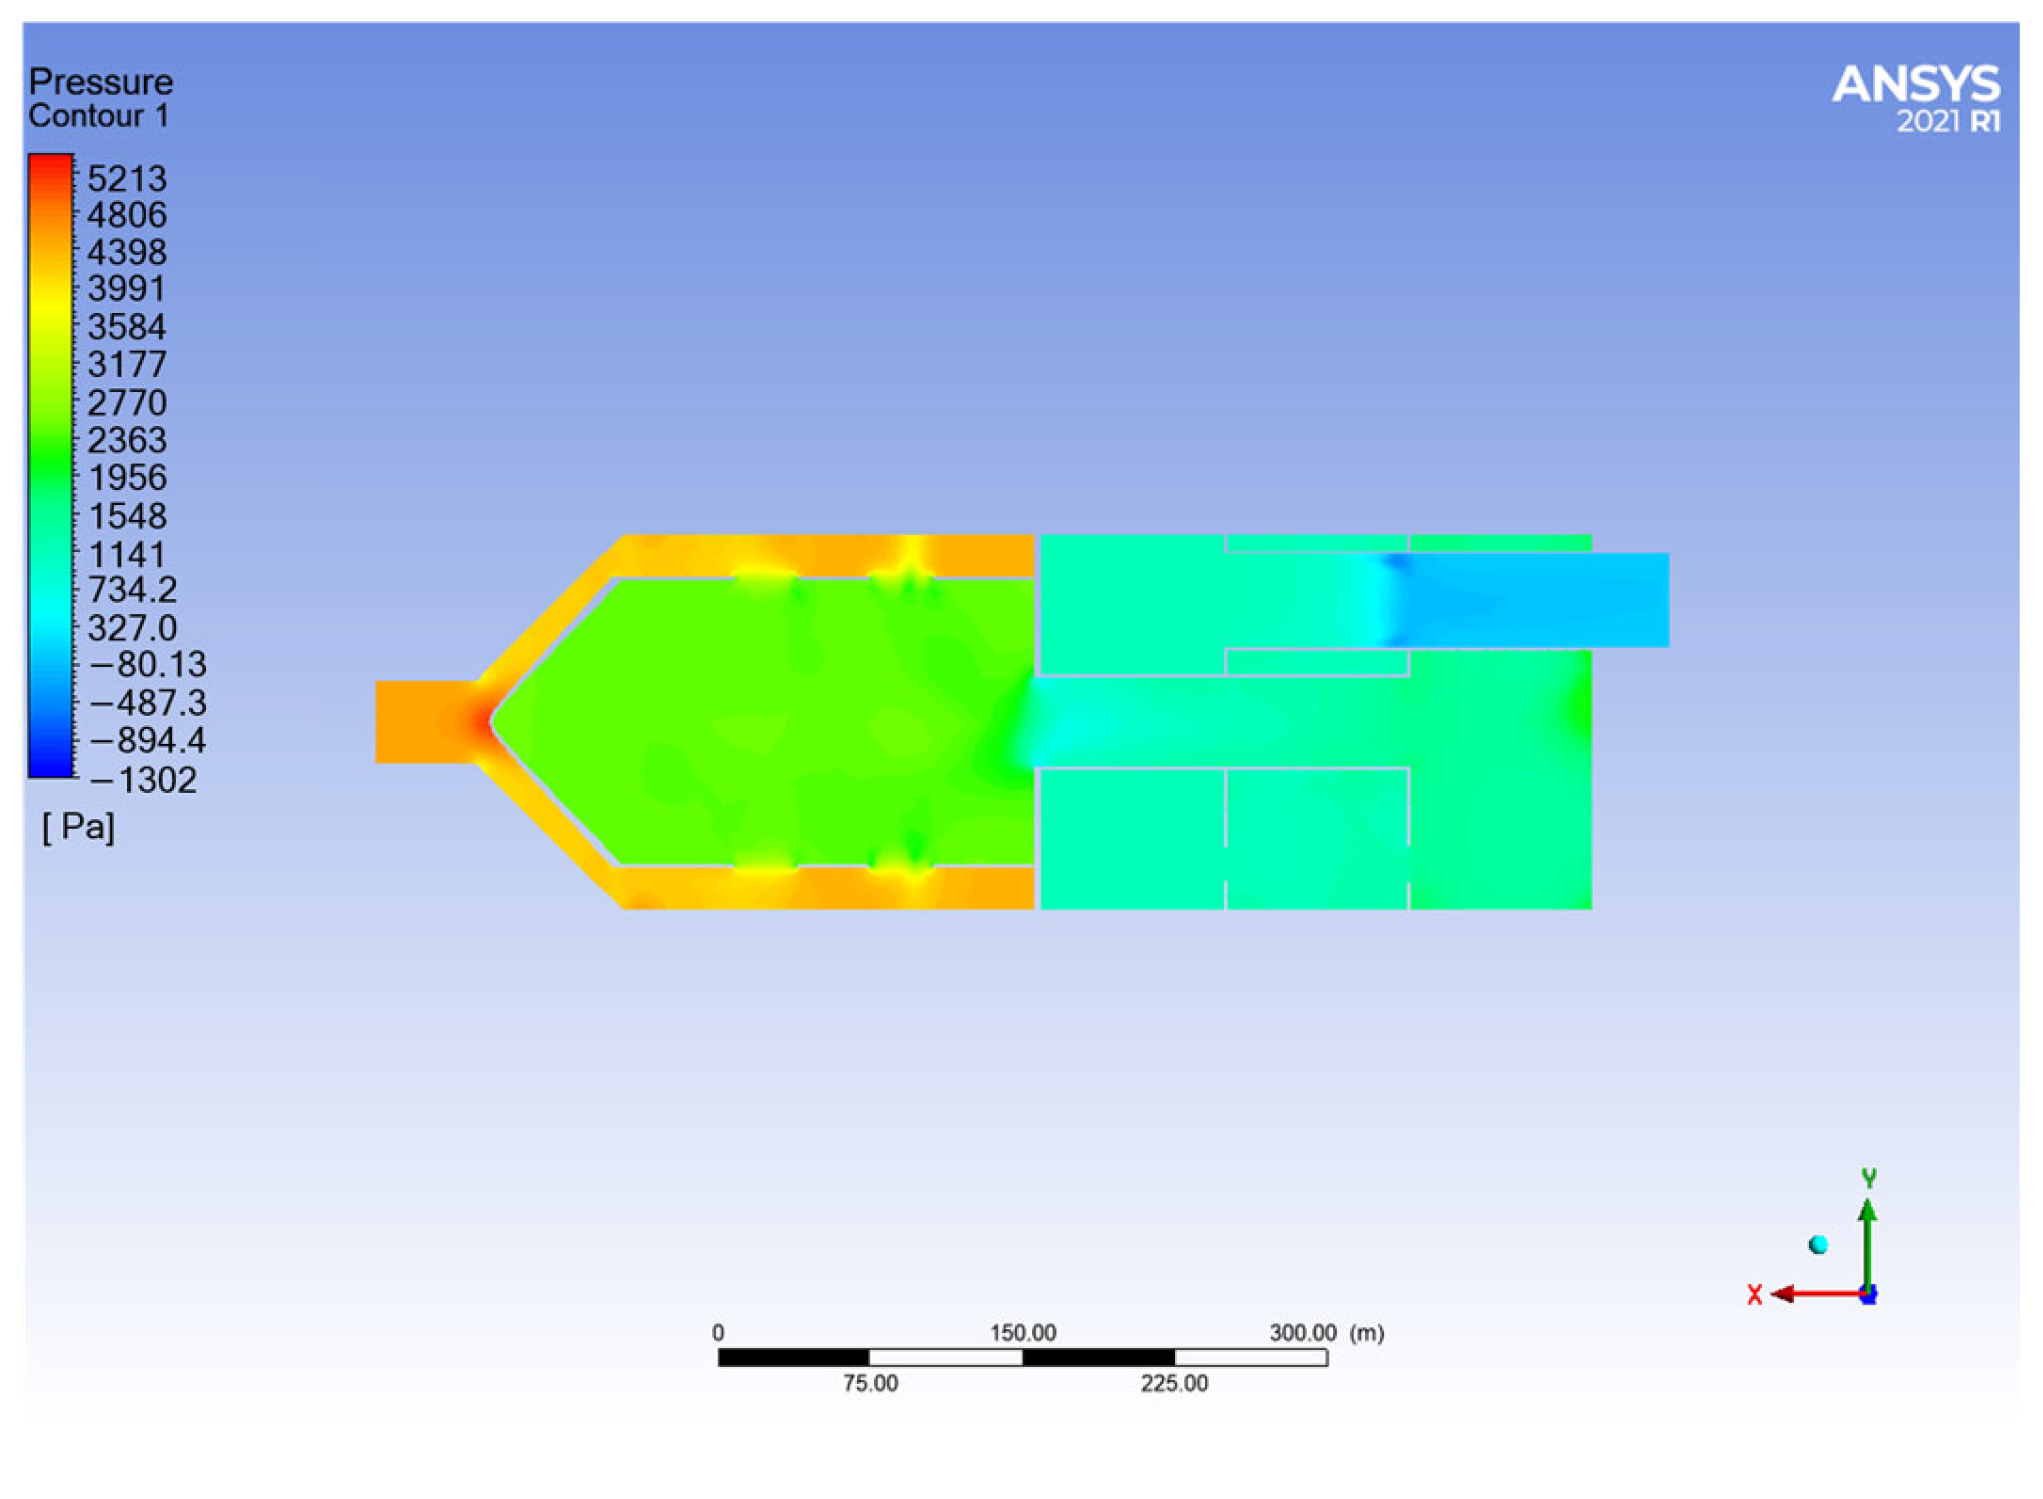
- Analysis of pressure field simulation results
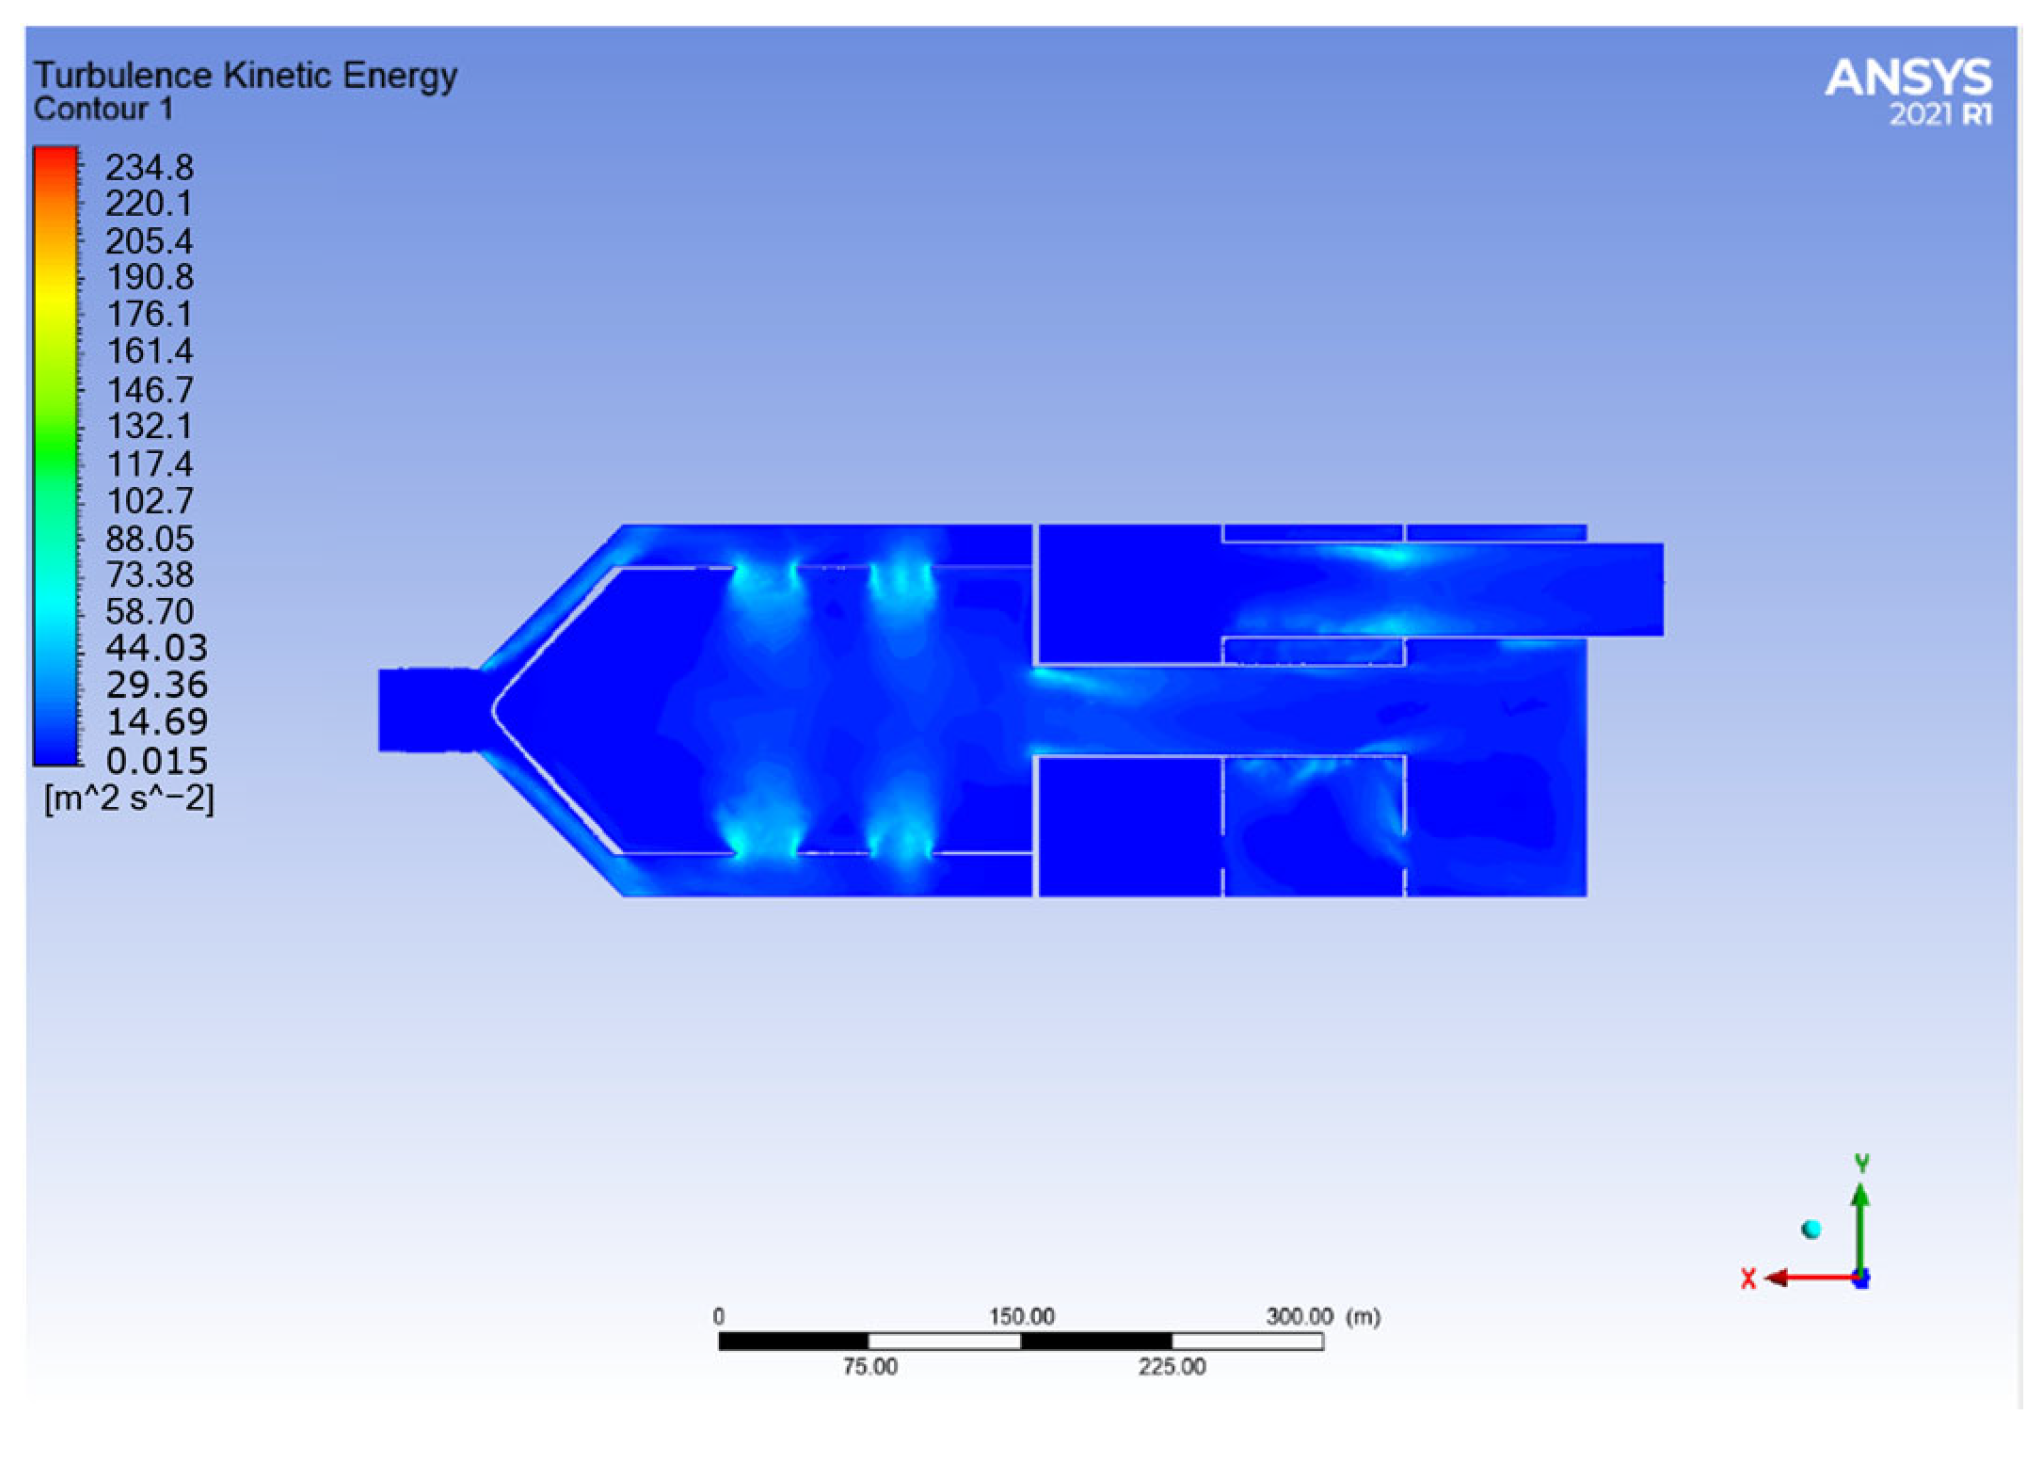
- Analysis of turbulent kinetic energy field simulation results
3.3.2. Aerodynamic Performance Experiment Results and Analysis
4. Discussion
Author Contributions
Funding
Institutional Review Board Statement
Informed Consent Statement
Data Availability Statement
Conflicts of Interest
References
- Sanok, S.; Berger, M.; Muller, U.; Schmid, M.; Weidenfeld, S.; Elmenhorst, E.; Aeschbach, D. Road Traffic Noise Impacts Sleep Continuity in Suburban Residents: Exposure-response Quantification of Noise-Induced Awakenings from Vehicle Pass-Bys at Night. Sci. Total Environ. 2021, 817, 152594. [Google Scholar] [CrossRef] [PubMed]
- Al-Thani, H.; Koc, M.; Isafan, R.J.; Bicer, Y. A Review of the Integrated Renewable Energy Systems for Sustainable Urban Mobility. Sustainability 2022, 14, 10517. [Google Scholar] [CrossRef]
- Mohamed, A.; Paleologos, E.; Howari, F. Noise pollution and its impact on human health and the environment. Pollut. Assess. Sustain. Pract. Appl. Sci. Eng. 2021, 4, 975–1026. [Google Scholar]
- Davis, D.D.; Stokes, G.M.; Moore, D.; Stevens, G.L. Theoretical and experimental investigation of mufflers with comments on engine-exhaust muffler design. Tech. Rep. Arch. Image Libr. 1954, 3, 31–33. [Google Scholar]
- Ji, Z. Muffler Acoustic Theory and Design; Science Press: Beijing, China, 2015; pp. 24–72. [Google Scholar]
- Hujare, P.P.; Mote, V.R.; Mache, A.R.; Hujare, D.P.; Kore, S.S. Analysis for effect of pores on acoustic performance of reactive muffler. Noise Vib. Worldw. 2021, 9, 52. [Google Scholar] [CrossRef]
- Chen, J.; Li, Z.; Huang, W.; Zhong, Y.; Chen, L.; Lu, M.; Chen, Y. Composite muffler based on low-frequency sound absorbing metamaterials. J. Appl. Acoust. 2024, 43, 95–99. [Google Scholar]
- Patil, N.; Chaudhary, S. CFD analysis of exhaust backpressure for four-stroke ci engine. IJRTI 2018, 3, 247–252. [Google Scholar]
- Wang, Z.; Pan, J.; Su, W. Design of Racing Car Muffler in FSAE Based on GT-Power. J. Phys. Conf. Ser. 2021, 1972, 012033. [Google Scholar] [CrossRef]
- Peng, C.; Mao, J.; Feng, J.; Zeng, X.; Li, L. Structure design and simulation analysis of muffler. Automob. Appl. Technol. 2023, 48, 72–78. [Google Scholar]
- Zhang, Y.A.; Wu, P.; Ma, Y.H.; Su, H.; Xue, J. Analysis on acoustic performance and flow field in the split-stream rushing muffler unit. J. Sound Vib. 2018, 430, 185–195. [Google Scholar] [CrossRef]
- Xue, J.; Wu, P.; Su, H.; Zhang, Y.A.; Zhang, H.J. Experimental Research On Comprehensive Performance Of Coupled Muffler Based On Split-Stream Rushing Principle. INMATEH-Agric. Eng. 2020, 62, 29–38. [Google Scholar] [CrossRef]
- Su, H.; Wu, P.; Xue, J.; Zhang, Y.A.; Zhang, H.J. Analysis of flow field characteristics and structure optimization of the split-stream rushing muffler for diesel engine. Noise Control Eng. J. 2020, 68, 101–111. [Google Scholar] [CrossRef]
- Xue, J.; Zhang, Y.A.; Su, H.; Wu, P. Study on the acoustic performance of a coupled muffler for diesel engine. Noise Control Eng. J. 2022, 70, 231–245. [Google Scholar] [CrossRef]
- Li, Z. Automotive Exhaust System Noise and Muffler Design; China Environmental Science Press: Beijing, China, 1991; pp. 10–35. [Google Scholar]
- Guo, R. Acoustic Theory and Application of Mufflers for Automotive Turbocharged air Intake Systems; Tongji University Press: Shanghai, China, 2017; pp. 52–73. [Google Scholar]
- Tang, J.; Liu, Z.; Zhang, K.; Hong, X. Progress in reactive muffler performance research. Constr. Mach. Equip. 2020, 51, 71–76. [Google Scholar]
- Shao, Y.; Wu, P.; Han, B.; Ma, Y.; Zhao, Z. Acoustic characteristics of out-of-phase and split-stream-rushing muffler for diesel engine. Trans. CSICE 2012, 30, 67–71. [Google Scholar]
- Wang, Z.; Su, W.; Wang, S. Ignition and calibration of the KTM 690 single-cylinder engine. Sci. Technol. Innov. 2021, 15, 140–144. [Google Scholar]
- GB/T 33928-2017; Reciprocating Internal Combustion Engines—Measurement Method for Silencers—Sound Power Level of Exhaust Noise and Insertion Loss Using Exhaust Sound Pressure and Power Loss Ratio. National Internal Combustion Engine Standardization Technical Committee: Beijing, China. Available online: https://www.chinesestandard.net/PDF/English.aspx/GBT33928-2017 (accessed on 19 January 2025).
- Li, Y.; Hu, C. Experimental Design and Data Processing; Chemical Industry Press: Beijing, China, 2017; pp. 34–92. [Google Scholar]
- Wang, P. Research on the Influence of Structural Elements on the Aerodynamic Performance and Acoustic Performance of Muffler. Master’s Thesis, Degree-Xihua University, Chengdu, China, 1 June 2021. [Google Scholar]
- Mao, S. Design of Experiment; China Statistics Press: Beijing, China, 2012. [Google Scholar]
- Miao, K. The Numerical Simulation Analysis on Acoustic and Fluid Dynamic Performance of Exhaust Muffler Based on Fluent. Master’s Thesis, Degree-Chang’ an University, Xi’an, China, 6 May 2015. [Google Scholar]


| Parameter | Value |
|---|---|
| Calibrated power (kW) | 45.8 |
| Quantity (kg) | 158.6 |
| Rated speed (r/min) | 5000 |
| Cylinder diameter (mm) | 102 |
| Stroke (mm) | 84.5 |
| Displacement (L) | 0.69 |
| Factor | Level | ||
|---|---|---|---|
| 1 | 2 | 3 | |
| (A) Perforation aperture of the perforated pipe (mm) | 6 | 8 | 10 |
| (B) Perforation rate of the perforated pipe (%) | 5 | 10 | 15 |
| (C) Perforation rate of the perforated plate (%) | 7 | 9 | 15 |
| Test Number | A | B | C | TL/dB | CV/% | PL/Pa | CV/% | Comprehensive Scoring |
|---|---|---|---|---|---|---|---|---|
| 1 | 1 | 1 | 1 | 2591.31 | 0.14 | 4948.29 | 0.11 | 329.43 |
| 2 | 1 | 2 | 2 | 2700.17 | 0.13 | 4716.34 | 0.13 | 475.22 |
| 3 | 1 | 3 | 3 | 2962.92 | 0.16 | 4832.70 | 0.18 | 624.23 |
| 4 | 2 | 1 | 2 | 2664.67 | 0.18 | 4647.83 | 0.15 | 470.92 |
| 5 | 2 | 2 | 3 | 2932.67 | 0.11 | 4525.41 | 0.16 | 695.25 |
| 6 | 2 | 3 | 1 | 2636.91 | 0.16 | 4479.13 | 0.11 | 502.10 |
| 7 | 3 | 1 | 3 | 2921.56 | 0.14 | 4653.74 | 0.17 | 648.97 |
| 8 | 3 | 2 | 1 | 2616.75 | 0.17 | 4639.97 | 0.13 | 439.73 |
| 9 | 3 | 3 | 2 | 2684.00 | 0.19 | 5373.53 | 0.19 | 266.74 |
| K1 | 1428.87 | 1449.32 | 1271.26 | |||||
| K2 | 1668.27 | 1610.20 | 1212.88 | |||||
| K3 | 1355.44 | 1393.07 | 1968.45 | |||||
| Range | 312.83 | 217.13 | 755.57 | |||||
| Order of priority of factors | C > A > B | |||||||
| Optimal parameter combination | A2B2C3 | |||||||
| Inlet Velocity (m/s) | Simulation Value (m/s) | Experiment Value (m/s) | Relative Error |
|---|---|---|---|
| 40 | 32 | 34 | 5.9% |
| Inlet Velocity (m/s) | Pressure Loss (Pa) | Relative Error | |
|---|---|---|---|
| Simulation Value | Experiment Value | ||
| 40 | 4525 | 4211 | 5.9% |
Disclaimer/Publisher’s Note: The statements, opinions and data contained in all publications are solely those of the individual author(s) and contributor(s) and not of MDPI and/or the editor(s). MDPI and/or the editor(s) disclaim responsibility for any injury to people or property resulting from any ideas, methods, instructions or products referred to in the content. |
© 2025 by the authors. Licensee MDPI, Basel, Switzerland. This article is an open access article distributed under the terms and conditions of the Creative Commons Attribution (CC BY) license (https://creativecommons.org/licenses/by/4.0/).
Share and Cite
Ao, S.; Yang, H.; Liu, Y.; Jin, M.; Su, H.; Ma, Y.; Jiao, W.; Xue, J. Design and Testing of a Gasoline Engine Muffler Based on the Principle of Split-Stream Rushing. Appl. Sci. 2025, 15, 1078. https://doi.org/10.3390/app15031078
Ao S, Yang H, Liu Y, Jin M, Su H, Ma Y, Jiao W, Xue J. Design and Testing of a Gasoline Engine Muffler Based on the Principle of Split-Stream Rushing. Applied Sciences. 2025; 15(3):1078. https://doi.org/10.3390/app15031078
Chicago/Turabian StyleAo, Shiyi, Huaiyu Yang, Yikun Liu, Min Jin, He Su, Yanhua Ma, Wei Jiao, and Jing Xue. 2025. "Design and Testing of a Gasoline Engine Muffler Based on the Principle of Split-Stream Rushing" Applied Sciences 15, no. 3: 1078. https://doi.org/10.3390/app15031078
APA StyleAo, S., Yang, H., Liu, Y., Jin, M., Su, H., Ma, Y., Jiao, W., & Xue, J. (2025). Design and Testing of a Gasoline Engine Muffler Based on the Principle of Split-Stream Rushing. Applied Sciences, 15(3), 1078. https://doi.org/10.3390/app15031078