1. Introduction
Ski mountaineering, also known as Skimo, is a skiing discipline that involves climbing mountains by either skiing or carrying skis, depending on the steepness of the ascent, and then descending on skis. In short-duration races, like sprint or vertical races, during the ascending, the athlete can walk or run. The running gesture generally requires lifting the heels while the toes point directly forward to minimize lateral energy loss. Instead, during the walking gesture, the foot lifting is minimal to preserve energy, and toes are often slightly turned outward to increase grip. The unique combination of aerobic and anaerobic exercise, alongside the need for balance, strength, and endurance, distinguishes it from traditional skiing or mountaineering alone.
To date, the scientific literature provides limited insight into the biomechanical and physiological demands of athletes. Most scientific studies on skiing biomechanics focused on alpine skiing [
1] or cross-country skiing [
2], with far less emphasis on the unique and complex nature of Skimo.
Evaluating kinematics in these sport gestures is challenging in both competition and workout, primarily due to equipment limitations and the complexities of the training environment. Snyder and colleagues developed and validated a wearable technology with the specific aim of measuring the edge angle and radial force on skiers during alpine skiing [
3]. Moreover, in their study, they showed that some training protocols can be adapted for indoor assessments, which provide a controlled setup suitable for motion analysis. In these conditions, optoelectronic systems and electromyography can be effectively applied to quantitatively assess joint kinematics and muscular activation. A specific type of indoor training involves simulating the movement of skiing on a motorized treadmill by varying the inclination and speed [
4,
5,
6,
7,
8]. Praz et al. [
9] focused on the evaluation of this type of training and evaluated energy expenditure, as it is considered a more indicative measurement of fatigue assessments. In particular, the cited authors concluded that to minimize the energy expenditure needed to reach the top of a mountain, ski mountaineers should choose a gradient of 24% combined with a speed of 6 km/h. However, the associated joint angle patterns were not provided in the cited study.
The effects of varying heel riser height and slope inclination on parameters such as joint range of motion, stride length, pole force, and energy expenditure during uphill ski mountaineering have been investigated by Lasshofer et al. [
10]. Specifically, the cited study showed that adjusting the riser height, in accordance with the slope gradient, influences the subject–equipment interaction and, consequently, changes the movement patterns. It emerged that the high riser height augments the heel-to-toe drop during the stance phase, shortens step length, and reduces the swing time and range of motion of the knee and ankle joint. Studies on energy expenditure [
11], heart rates, and oxygen consumption [
6,
12] in Skimo identify this sport as a high-intensity activity, showing that even if elite ski mountaineers spend more time at elevated altitudes than recreational athletes, the reduction in the maximum oxygen consumption of elite skiers during incremental tests is more pronounced.
Despite the characterization of muscle activation during various stages of the sport that could be helpful for improving their training efficacy and rehabilitation programs, detailed analysis of muscle activation patterns has not been sufficiently investigated. It could aid in identifying areas of muscular imbalance or fatigue that may predispose athletes to injury, particularly in the knee, hip, and ankle joints, which are highly stressed during uphill and downhill movements. For example, Kim et al. extracted two specific parameters able to estimate muscle fatigue starting from the electromyographic signals: the zero-crossing rate and amplitude of muscle tension [
13]. Despite fatigue assessment being beyond the scope of this research, the cited method represents a possible procedure for fatigue analysis in athletes by means of surface electromyography and in future investigations could provide new insights into muscles’ fatigue during sport gestures. Moreover, studying muscular activation while performing different sport gestures can lead to identifying the muscles involved and, consequently, to targeted training. Finally, it could also provide useful hints for the design of bindings.
Hence, to date, the scientific literature lacks an integrated assessment of muscular activation and kinematics during indoor training, specifically measured by surface electromyography, and an optoelectronic system representing the gold standard technology for motion capture. This gap in the research limits the ability to provide evidence-based recommendations for training, injury prevention [
14], and performance enhancement in this sport.
The aim of this study was to provide a comprehensive analysis of two motor gestures typical of ski mountaineering (walking and running) performed on an inclined treadmill at two different speeds. Indeed, the present study is based on the research hypothesis that the joint kinematics of ski mountaineers and the muscular recruitment during uphill movements are influenced by task typology and speed. Hence, by examining both kinematic and muscular activation patterns in Skimo athletes, this study was designed to characterize the biomechanical demands of these tasks and provide insight into how task typology and velocity influence movement biomechanics and muscular activation.
2. Materials and Methods
2.1. Participants
Four Skimo male national athletes were recruited for this study. The sample had a mean age of 21.4 ± 1.1 years, a mean height of 1.85 ± 0.05 m, a mean body mass of 72.0 ± 5.0 kg, and a BMI of 21.1 ± 2.0 kg/m2.
All participants read and signed a written informed consent form providing information on the purpose and course of this study. This research study was carried out in compliance with the World Medical Association Declaration of Helsinki and was approved by the Ethics Committee of Politecnico di Milano (protocol code 26/2022).
2.2. Instrumentation
Kinematic data, electromyographic signals, and anthropometric parameters for each participant were collected in the Human Performance Lab at Politecnico di Milano, Lecco (LC), Italy. Specifically, kinematic data were recorded through 8 infrared digital cameras connected to a motion capture system (SMART-DX EVO, BTS Bioengineering, Garbagnate Milanese, Milan, Italy). This system ensures a measurement accuracy lower than 0.3 mm and a sampling rate of 100 Hz. Surface electromyography (sEMG) probes (FREEEMG 1000, BTS Bioengineering, Garbagnate Milanese, Milan, Italy), synchronized with the optoelectronic system, simultaneously recorded the muscular activation pattern of twelve muscles, with an acquisition frequency of 1000 Hz. Two TV cameras synchronized with the optoelectronic system recorded the frontal and the sagittal views.
2.3. Experimental Protocol and Procedures
In accordance with the Davis protocol [
15], the following anthropometric parameters were measured on each subject: body mass, height, pelvis width, pelvis height, lower limb length, and knee diameter. Then, the subject wore Skimo racing boots, and the ankle diameter was measured considering the thickness of the footwear. This adjustment of the ankle anthropometric measurement was needed to ensure consistency with the following marker placement on the boot surface.
After the skin preparation of the participant, twelve probes were applied bilaterally on the following muscles: Erector Spinae Longissimus, Rectus Abdominis, Rectus Femoris, Biceps Femoris Long Head, Tibialis Anterior, and Gastrocnemius Lateralis. The choice of the muscles investigated was taken together with the expert trainers to record the electrical activity of antagonist muscles for each main body segment involved during the task. SENIAM guidelines [
16] were applied both for skin preparation and probe placement.
For each subject, once the sEMG probes were placed, and the maximum voluntary contraction (MVC) of each muscle was acquired. In fact, to evaluate the contribution of each muscle, each EMG signal collected during the tests was normalized for all subjects against the signal recorded during isometric maximum voluntary contraction (MVC) against the operator’s resistance.
Specifically, three trials of five-second MVCs were performed for each muscle, with a one-minute rest between contractions to avoid fatigue. For measuring the MVC of the Biceps Femoris muscle, the athlete was in the prone position, with the hip placed in slight external rotation and the knee flexed at 60°. In the meantime, the operator applied resistance on the distal region of the leg. Then, to test the Vastus Lateralis, the participant was placed in a sitting position with the knee flexed at 60° and resistance on the leg distal region. The MVC measurement of the Gastrocnemius Lateralis required the participant to lie down with their knees extended. A rigid cylinder was placed between the table and the tibia, and resistance was provided by the operator while the participant performed a plantarflexion. Instead, for the Tibialis Anterior muscles, the participant was asked to exert isometric ankle dorsiflexion torque. The MVC of the Rectus Abdominis was reached by the athlete in an attempt to lift the trunk from the floor while counterbalancing the external load applied to the chest by the operator. The upper limbs were flexed in the elbow joints, and the hands were placed at the head’s back. In the meantime, the position was stabilized by a second operator by holding the feet at the ankles. For the Erector Spinae, the athlete was required to lie down in a prone position and counterbalance the external load applied near the scapulae by the operator.
Then, according to the Davis protocol [
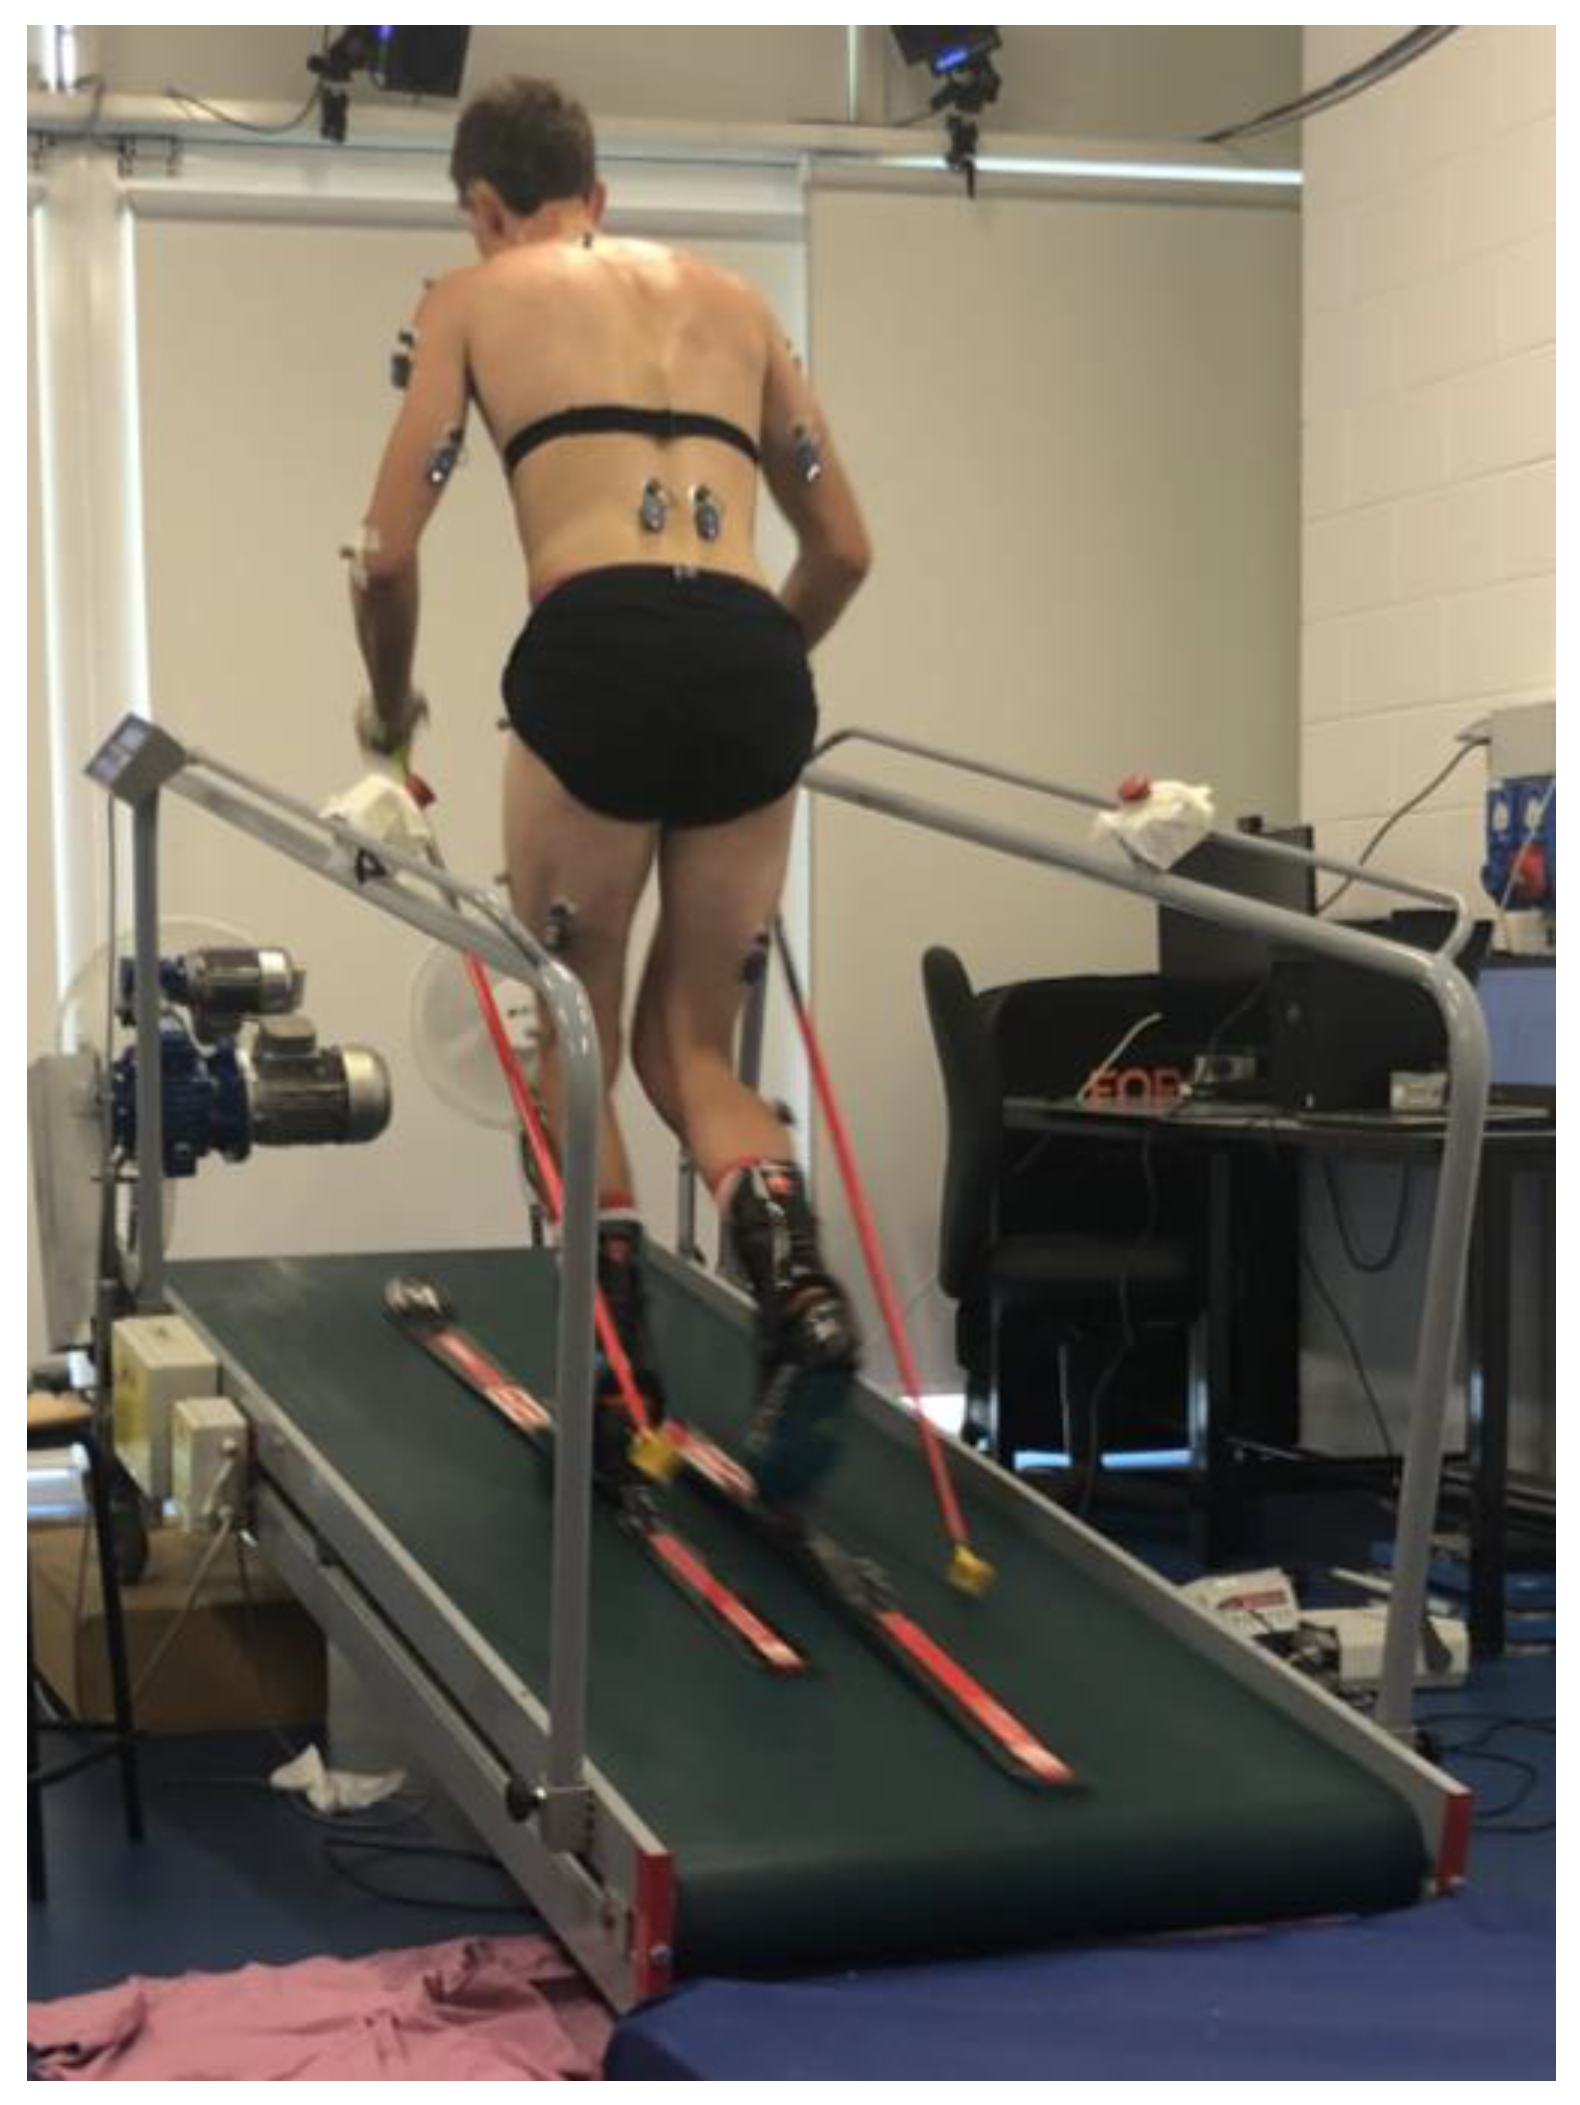
15], twenty-two spherical infrared reflective markers were attached bilaterally on the skin overlying specific anatomical landmarks, except for the markers intended for the lateral malleolus of the ankle, heel, and second metatarsal head, which were instead applied to the boot in positions corresponding to the anatomical points. The same operator was responsible for both anthropometric measurements and marker placement for all subjects to limit inter-individual error. Thereafter, the subject also wore skis and ski poles and took a position on the inclined treadmill (9° of inclination), as reported in
Figure 1.
Each athlete performed a 15 min treadmill warm up, running without skis but wearing typical running shoes, at a speed of 5 km/h set up by the athlete’s trainer according to their typical habits and an inclination of 9°. Then, the experiment started, and the following motor gestures were recorded:
Two-minute walking at 7 km/h (w1);
Two-minute running at 7 km/h (r1);
Two-minute walking at 8 km/h (w2);
Two-minute running at 8 km/h (r2).
A two-minute break was granted between trials. The task order, as well as the tested speed, was suggested by the athletic trainer and applied to all subjects involved in this study. Specifically, the selected speeds were ideal for testing conditions similar to real-sport scenarios while simultaneously avoiding high injury risks.
2.4. Data Analysis
Due to the detachment of some markers or the collision of the sticks with the treadmill frame, three tests were declared invalid and excluded from the data used in this study. The trials deemed valid for the examined sample are reported in
Table 1.
To assess kinematic and muscle activation parameters, collected data were processed by the dedicated software SMARTClinic (v 1.10, BTS Bioengineering, Garbagnate Milanese, Milan, Italy). Specifically, each athlete’s data were assessed in terms of pelvis, hip, and knee angles on the sagittal plane, joint range of motion (ROM), and muscle activation. The joint angles and sEMG data were time normalized on the gait cycle, which was set for each limb as the period between the initial contact of one foot with the ground and the subsequent contact of the same foot. For each subject, data collected from ten subsequent cycles were processed and analyzed.
The sEMG data were processed following a validated protocol in SMARTClinic (BTS Bioengineering, Garbagnate Milanese, Milan, Italy). Initially, a band-pass filter (20–450 Hz) using a Hamming window with a window sampling of 100 samples was applied to the raw signals to eliminate noise outside the relevant frequency range. After rectification, a low-pass filter (3 Hz) with a Hamming window (window sampling of 100 samples) was used to extract the signal envelope.
Raw signals of MVC were processed by adopting the same validated protocol described above, and then, once data envelopes were extracted, the average of the three activation peaks was calculated. Subsequently, MVC values were employed to normalize all the signals recorded during the trials, enabling comparability of data between different subjects. The threshold of activation was defined for each muscle as 25% of the peak value recorded during the entire exercise [
17]; therefore, the muscle was considered active when its amplitude values exceeded this threshold.
2.5. Statistical Analysis
JMP® Pro 17.0.0 (version 17.0.0, SAS Institute, Cary, NC, USA) was used to perform statistical analysis. Specifically, for each sample, data normality was tested by the Anderson–Darling test.
All the ROM values and sEMG envelopes were then averaged on all the subjects to obtain more generalizable results. ROM data were not normally distributed (p ≤ 0.05); hence, to compare right and left ROM for each joint non-parametric analysis, the Wilcoxon test was performed. A statistically significant difference was accepted when p ≤ 0.05.
No differences were found among the right and left sides (
p > 0.05), verifying no asymmetry between contralateral limbs (see
Appendix A). Therefore, ROM and muscle activity data from the right and left sides were ensembled together.
Considering the valid trials reported in
Table 1 and the ten cycles for each task per subject, the Wilcoxon test was applied to investigate differences due to task velocity (w
1 vs. w
2 and r
1 vs. r
2) and task typology (w
1 vs. r
1 and w
2 vs. r
2). These inter-subject tests are designed to determine if there are statistically significant differences in ROM between two different conditions (
p < 0.05). The tests were performed for knee flexion–extension, hip flexion–extension, and pelvic obliquity ROM to test the effect of task typology and task velocity on the different joints.
3. Results
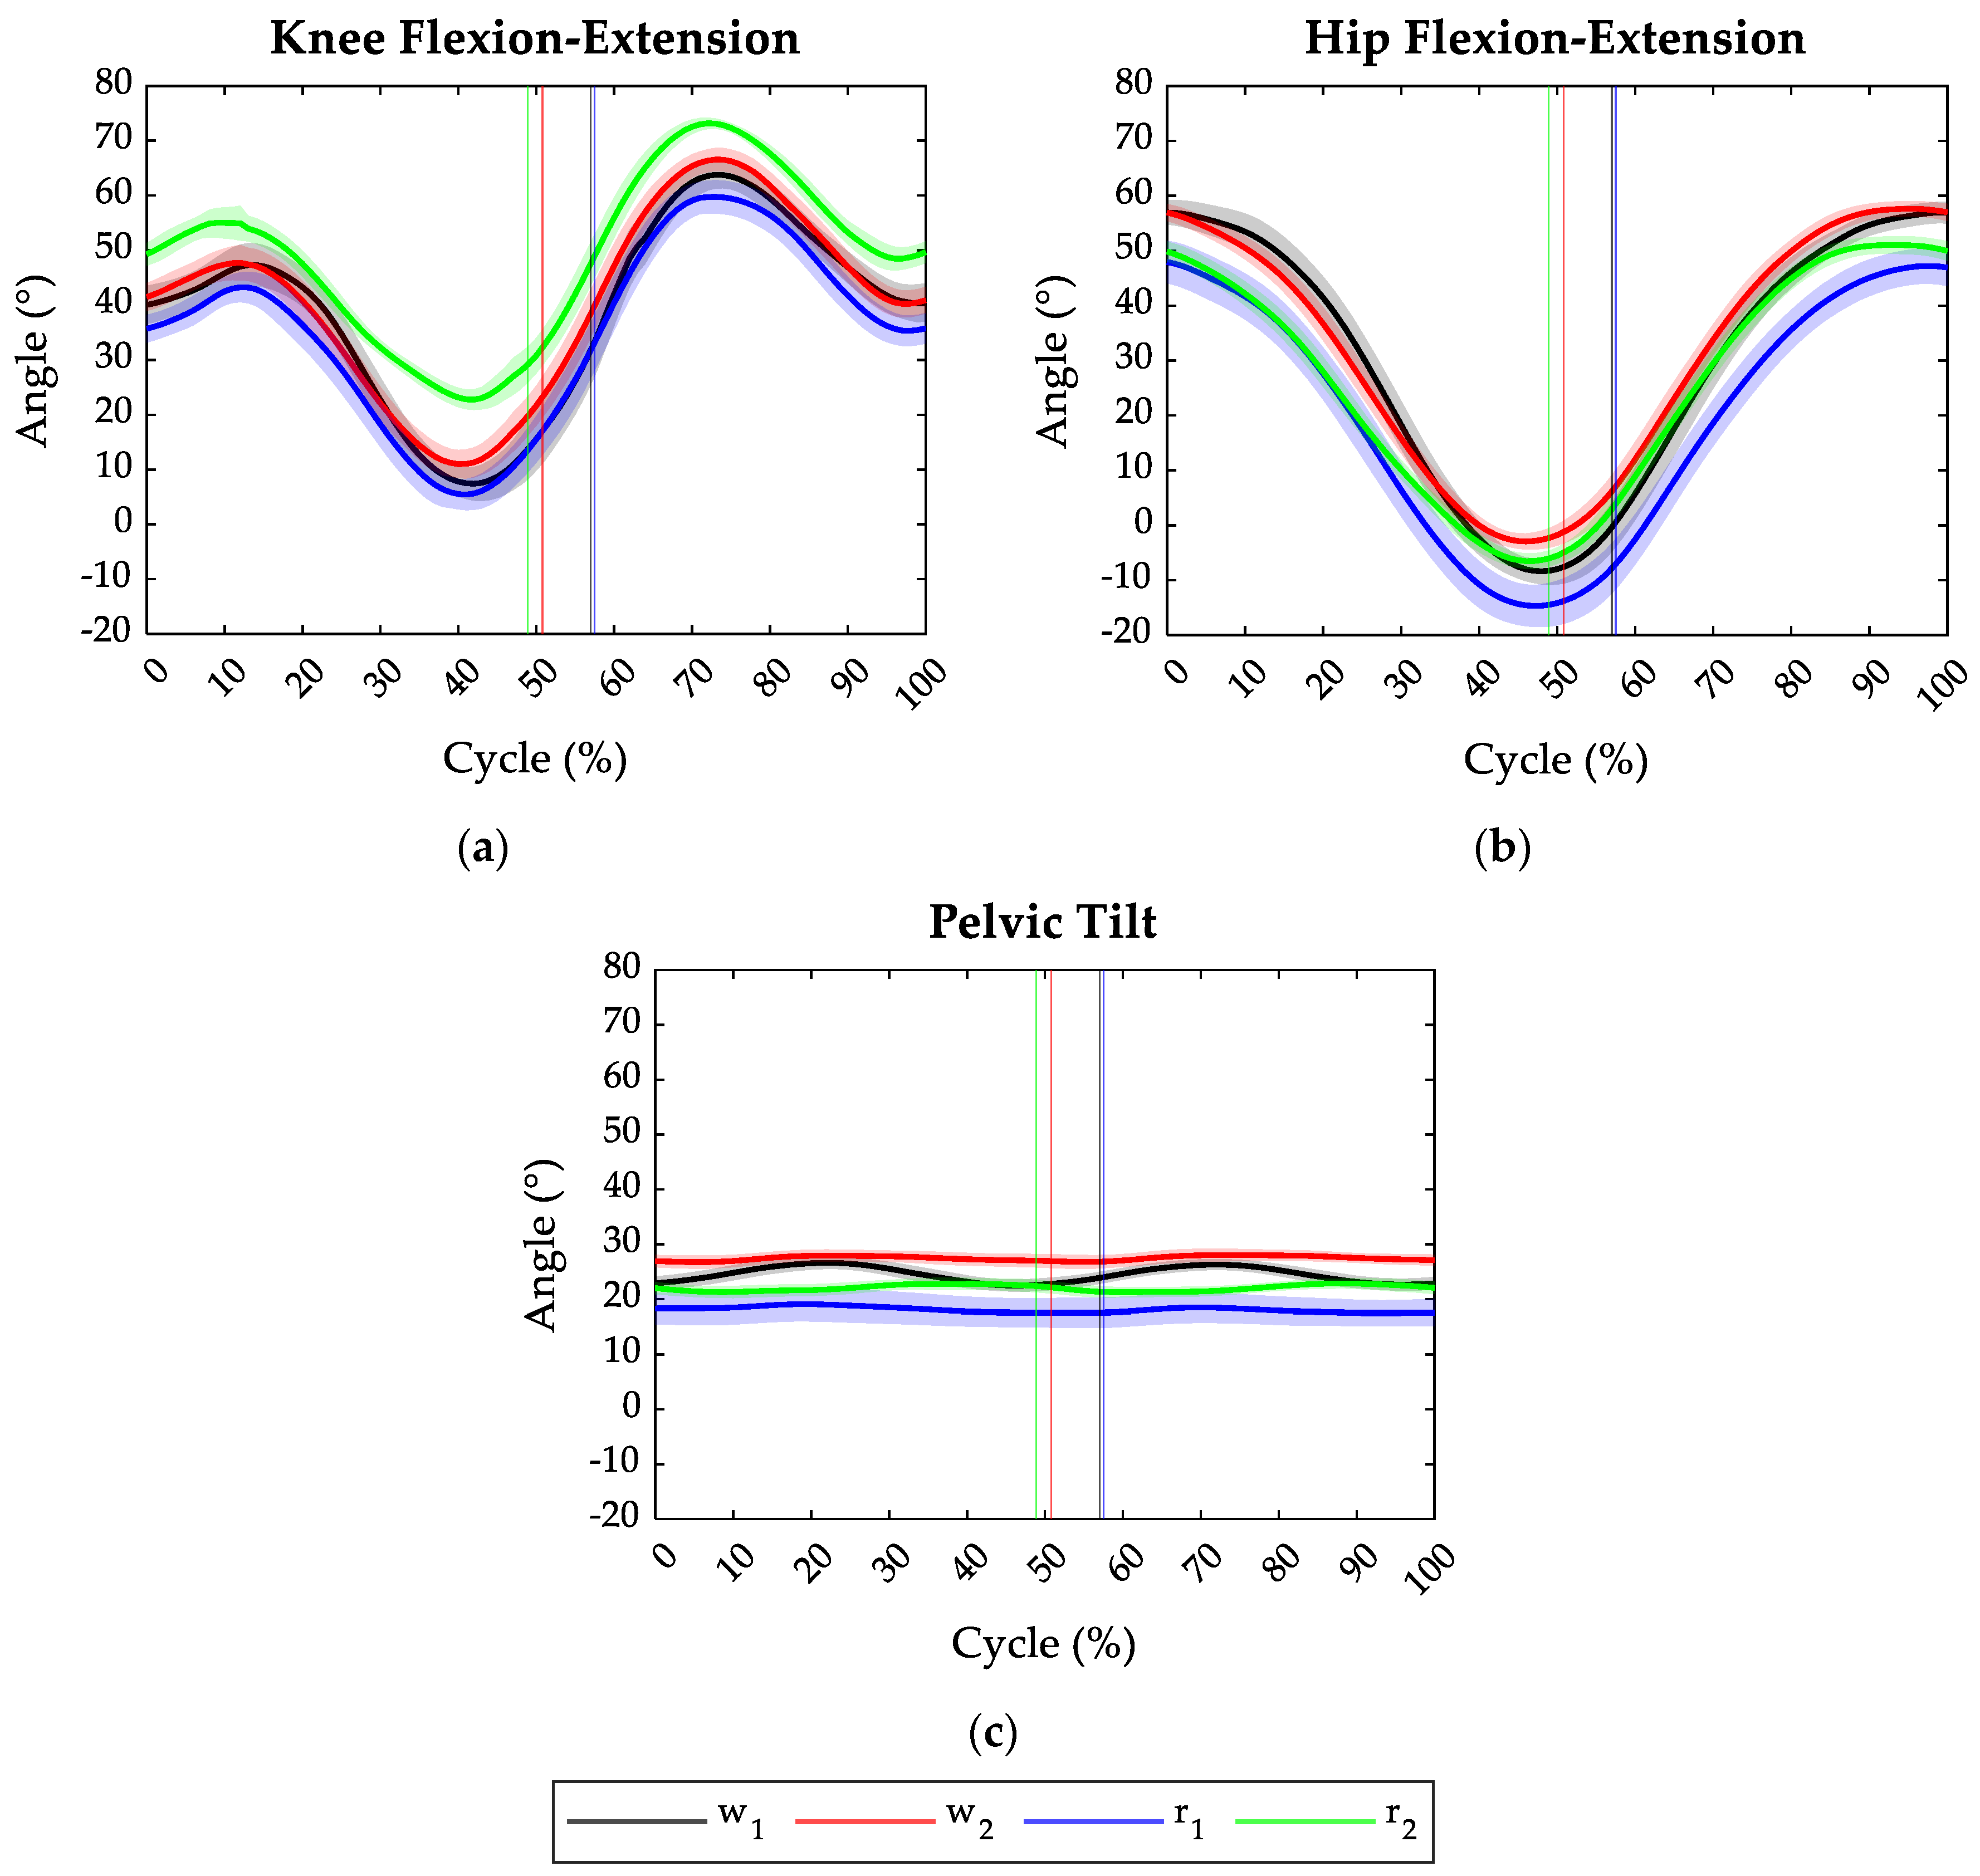
Figure 2 depicts the average angles of the knee, hip, and pelvis joints on the sagittal plane in all the tested tasks and the relative toe-off events. Specifically, considering that some trials were deemed invalid, the angles related to w
1, w
2, r
1, and r
2 resulted from the average of 60, 80, 80, and 40 angle patterns, respectively. Regardless of the motor gesture typology, increasing the treadmill speed from 7 km/h (v
1) to 8 km/h (v
2) shortened the duration of the stance phase.
During the walking tasks (w1 and w2), independently of task velocity, the athletes started the cycle with the knee and hip flexed at 40° and 57° on average, respectively. Instead, in the running task, at the initial contact, the hip appeared less flexed compared to the walking task, having a flexion angle of 48° and 50° on average at 7 km/h and 8 km/h velocity, respectively. The initial knee angle instead changed from 35° at 7 km/h to 50° at 8 km/h.
In all the tested conditions, the athletes preserved the pelvis in anteversion configuration all along the task cycle, as shown in
Figure 2c. However, in the walking gestures, the anteversion angle appeared higher with respect to the running tasks. Specifically, walking at 8 km/h required the highest pelvic anteversion angle (27°).
Increasing the task velocity, both in walking and running gestures, had the effect of reducing the maximum extension reached by the hip and knee joints during the terminal stance phase (see
Figure 2a,b), as well as increasing the pelvic anteversion (
Figure 2c). Moreover, increasing the speed of the motor gestures resulted in increasing the maximum flexion of hip and knee joints during the swing phase. Compared to the other tasks, during running at 8 km/h (r
2), the athletes reached, on average, the highest knee flexion both during the stance and swing phase and the lowest knee extension (23°).
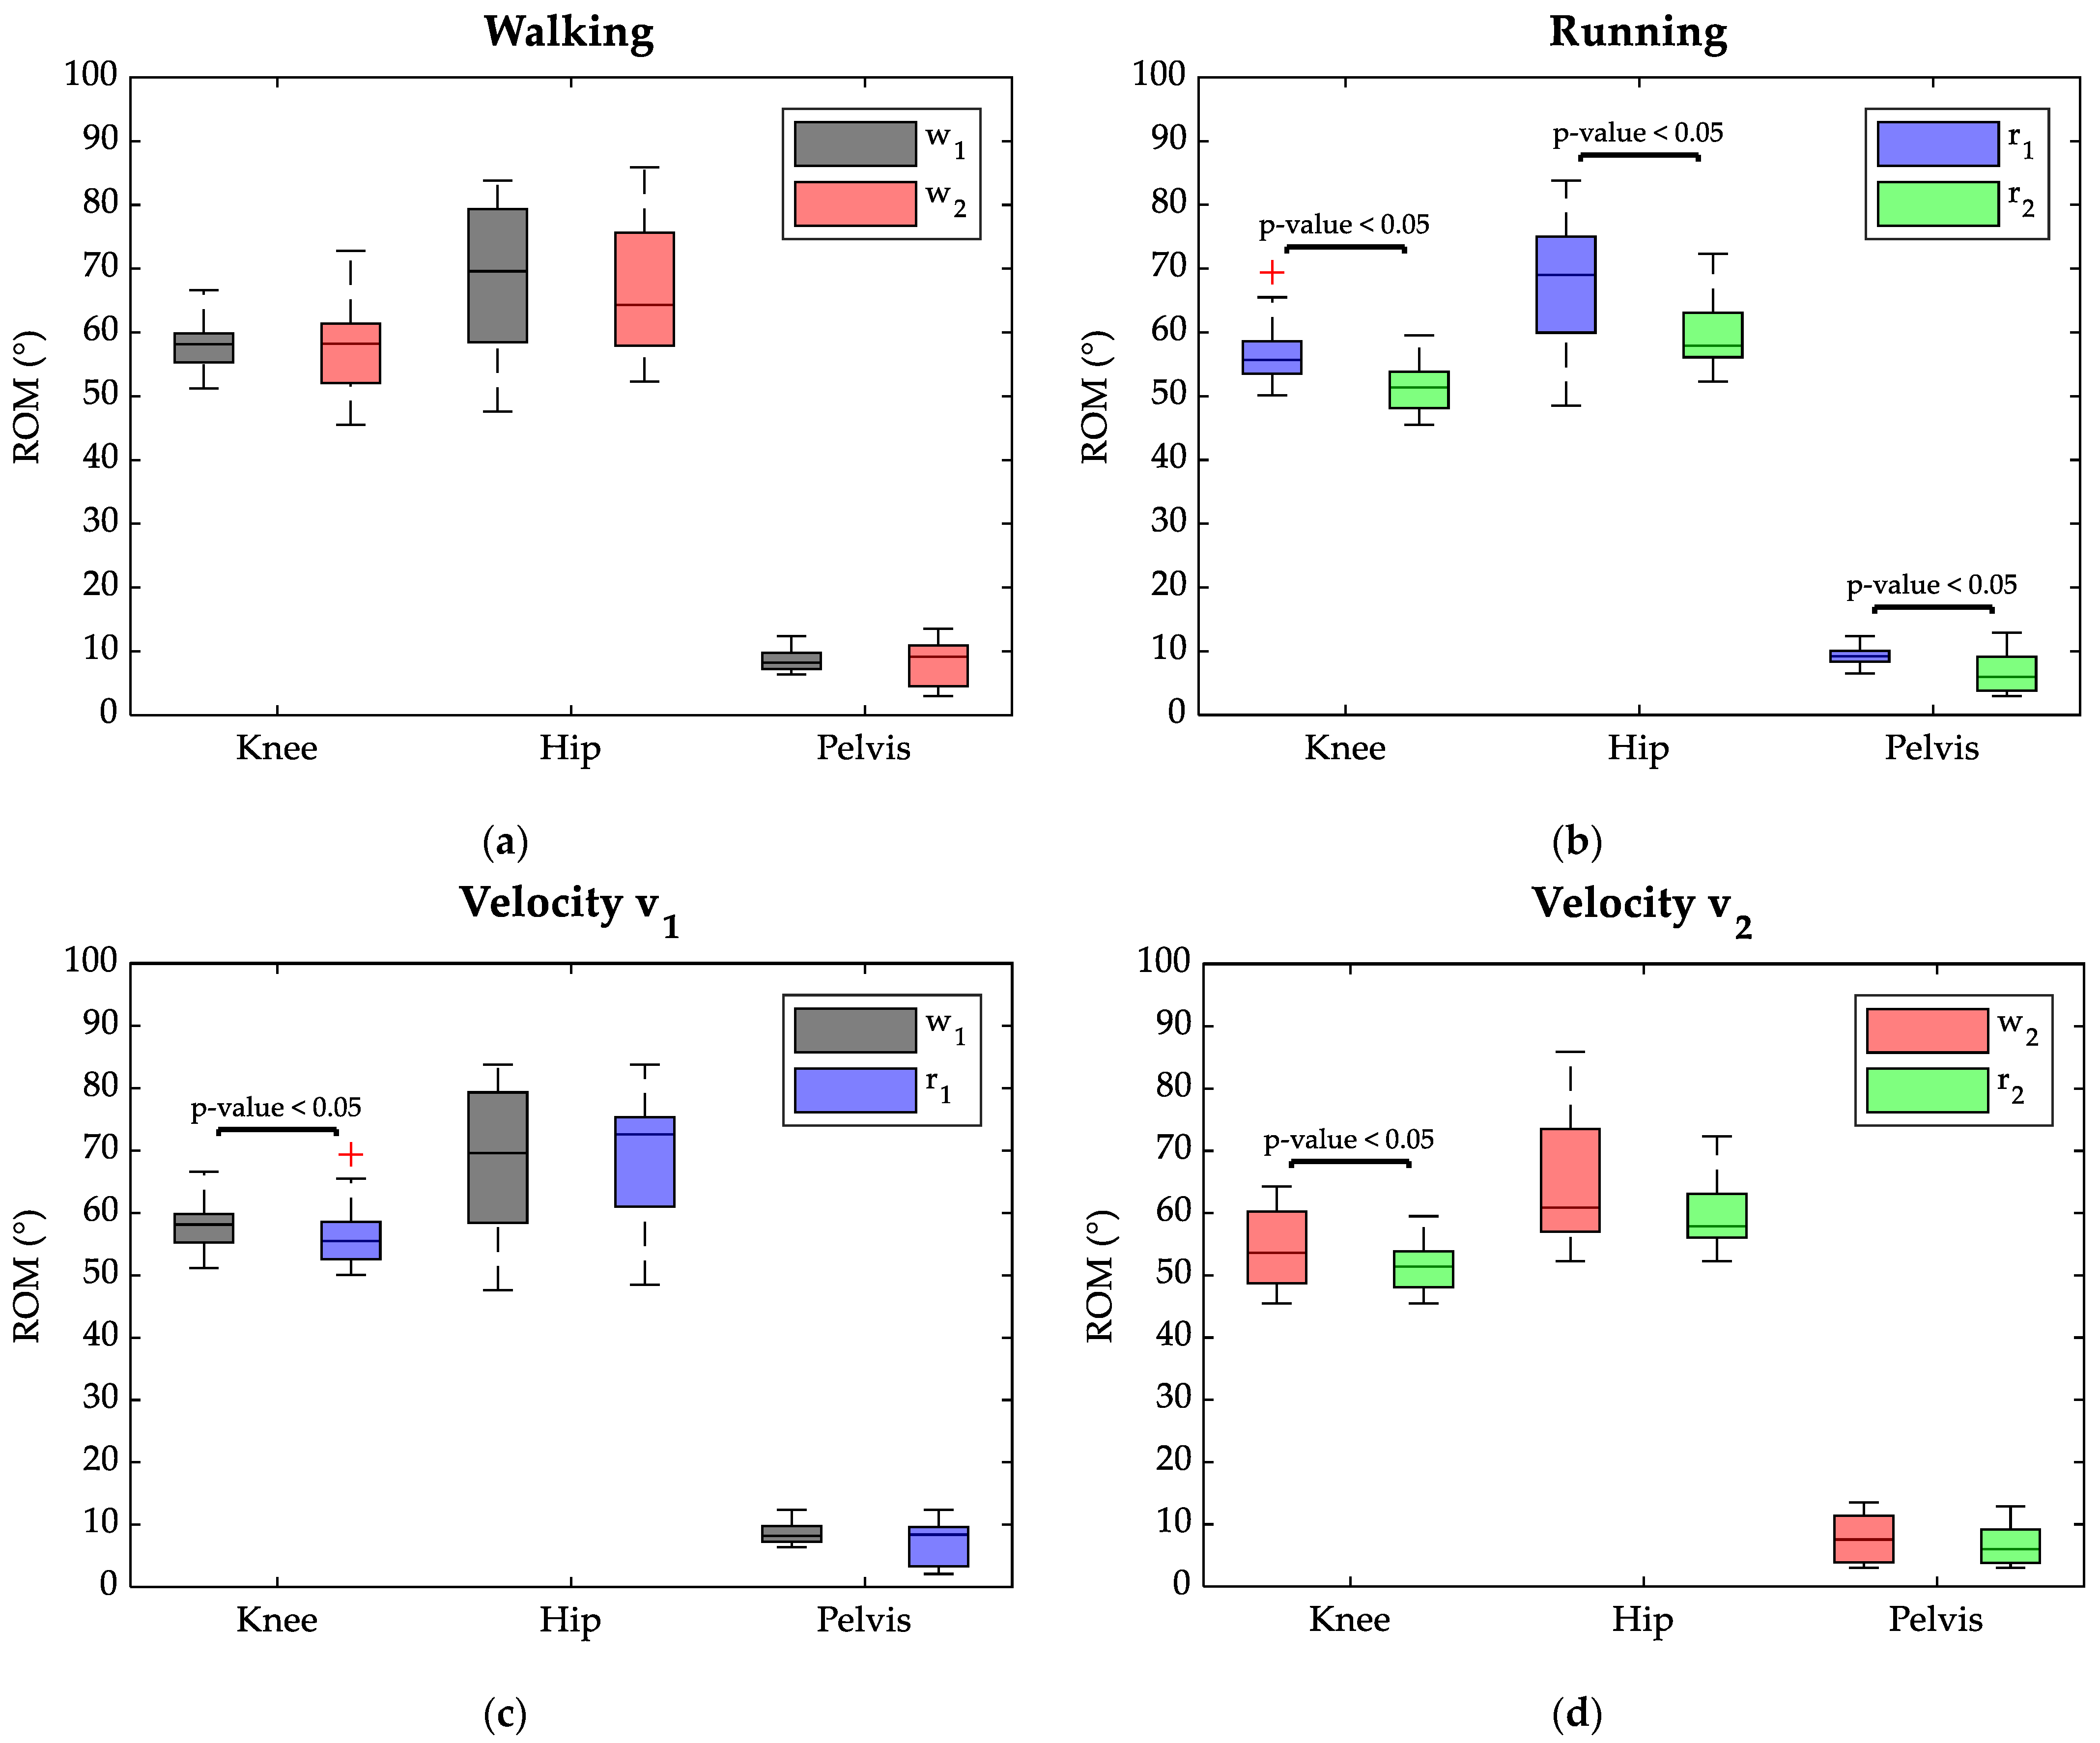
The ROM results on the sagittal plane of the knee, hip, and pelvis joints are shown in
Figure 3. Specifically, in the upper panel, ROMs are compared for each task between the two velocities, while the lower panel reports, the effects of the different motor gestures are compared for each velocity.
Considering the walking tasks (
Figure 3a), no statistically significant differences were found between ROM median values reached by the joints at 7 km/h and 8 km/h. Indeed, during walking, the knee joint showed an ROM median value of 58° at both velocities, while the hip median ROM was 70° at 7 km/h and 64° at 8 km/h. The pelvis also reached a similar ROM independently of task speed during walking: 8° in w
1 and 9° in w
2.
Instead, in the running task changing the velocity resulted in significant variations of all joints’ ROM (
p-value < 0.05), as highlighted in
Figure 3b. Namely, the ROM median value reduced in all joints when switching from 7 km/h to 8 km/h; the knee ROM appeared reduced by 11° (69° in r
1 to 58° at r
2), the hip ROM was lowered by 5° (56° in r
1 to 51° at r
2), and the pelvis ROM dropped by 3° (from 9° in r
1 to 6° in r
2).
As evident in
Figure 3c,d, independently of the task velocity, running required a smaller ROM at the knee joint compared to walking. When speed was set at 7 km/h (
Figure 3c), the knee ROM median varied from 58° in w
1 to 56° in r
1, and the Wilcoxon test indicated a significant difference between the two conditions (
p-value < 0.05). The median values for the hip ROM ranged from 70° in w
1 to 73° in r
2, with no significant difference between the two conditions.
Setting the speed at 8 km/h (
Figure 3d) resulted in a significant difference between ROM values at the level of the knee joint between walking and running, with values of 54° and 51°, respectively. However, no differences were highlighted between ROM median values at the hip joint, showing 61° in w
2 and 58° in r
2. Finally, switching from walking to running, the pelvis preserved median ROM values lower than 10° both at a speed of 7 km/h and 8 km/h.
Table 2 reports the average maximum amplitude (normalized on the MVC) recorded for each muscle during the four motor gestures and the corresponding time point of the task cycle.
The Gastrocnemius Lateralis reached a higher activation during walking (0.84 and 0.68) than running (0.31 and 0.45). Specifically, it showed the maximum activation in the toe-off event for the running tasks and during two different moments of the stance phase for the walking task. The Tibialis Anterior reached the highest activation among all muscles. Its peak of activation was recorded in the early stance phase during the walking task (15% cycle and 12% cycle in w1 and w2, respectively) and appeared shifted to the midstance in the running gesture (31% cycle in r1 and 25% cycle in r2).
The Biceps Femoris Long Head and Rectus Femoris preserved a similar maximum amplitude, independently of the motor gesture typology and task velocity. Their maximum activation was recorded at the initial contact or second contact during the cycle, except for a peak of amplitude expressed by Rectus Femoris during the terminal stance phase (34% cycle) when running at 8 km/h.
The maximum activation of the Rectus Abdominis muscles corresponded to a very low fraction of the MVC (0.06 to 0.10) and took place during the initial swing phase in all the tasks. Lastly, the maximum activation of the Erector Spinae appeared mostly unchanged in all the tasks, except when running at 8 km/h, where it reached a slightly higher value (0.45). Nevertheless, its peak of activation was recorded in a narrow range of the task cycle (51–56% cycle), independently of the type of task and speed.
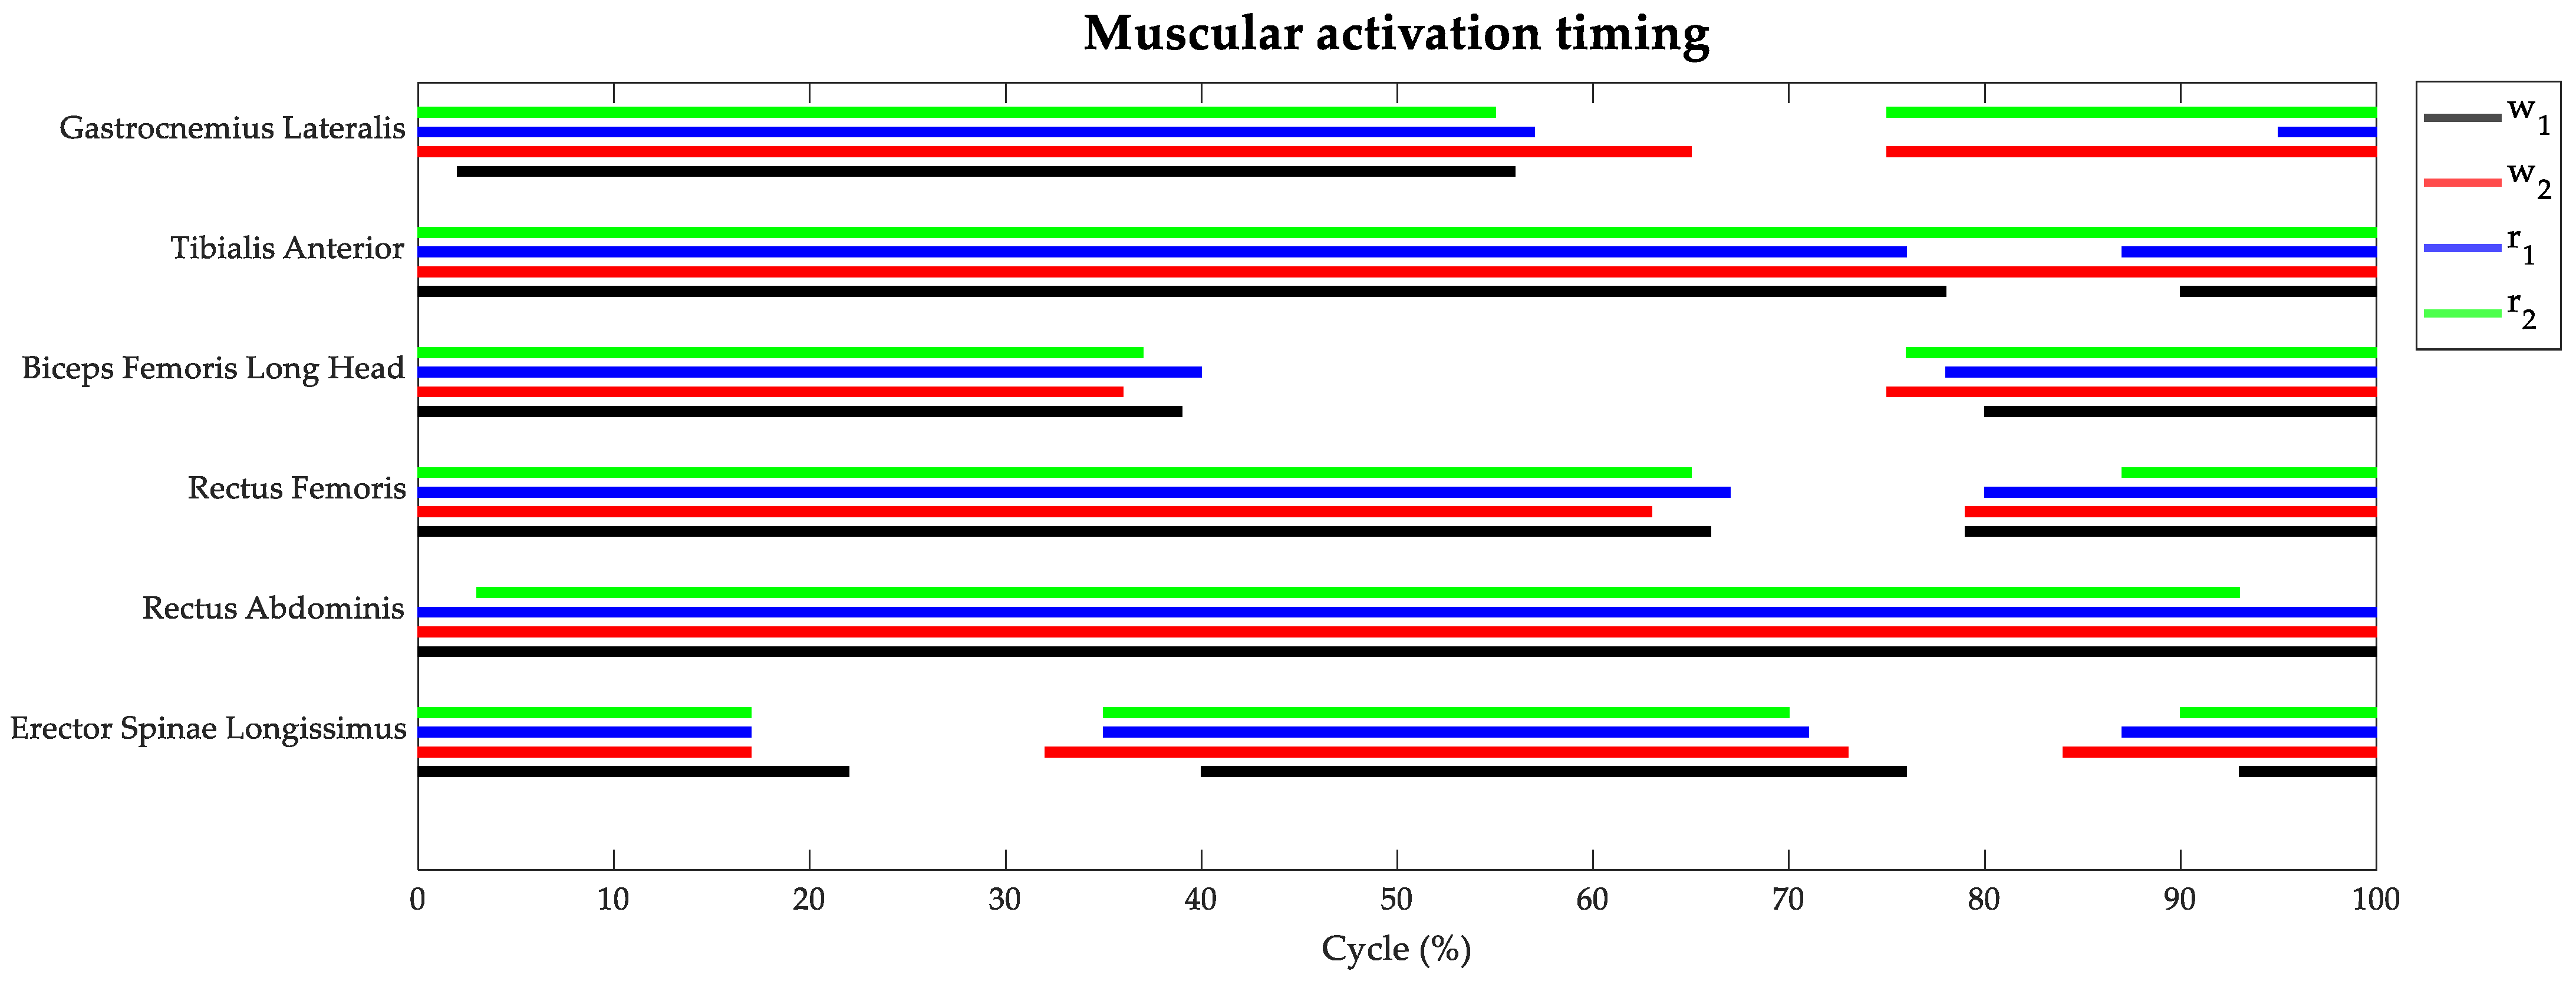
Figure 4 depicts the average muscular activation timing along the cycle of each motor gesture. The task typology did not influence the muscular recruitment period significantly, while the task speed showed some effects on the two antagonist muscles of the lower leg (Gastrocnemius Lateralis and Tibialis Anterior). Indeed, the Gastrocnemius muscle was recruited all along the stance phase, independently of the task typology and speed. However, performing walking and running at a speed of 8 km/h also required Gastrocnemius recruitment in the second half of the swing phase. The Tibialis Anterior appeared activated all along the cycle of the task, except for a 10% interval during the swing phase when the motor gestures were performed at the lowest velocity.
The Biceps Femoris muscle was recruited from the initial contact up to 40% of the cycle and during the second half of the swing phase, without any notable difference between the four tasks. The Rectus Femoris showed the same activation timing as its antagonist muscle, but its activity was prolonged up to the initial swing phase. The Rectus Abdominis appeared always activated in all the tasks, except for a small percentage at initial and terminal contact when the athletes performed running at 8 km/h. Lastly, the Erector Spinae muscles showed similar trends among the four tasks with activation in three main intervals of the task cycle: the initial stance phase, from terminal stance to initial swing, and in the late swing phase.
4. Discussion
The purpose of this study was to analyze two motor gestures typical of ski mountaineering from both kinematic and muscular activity perspectives. Specifically, these aspects were investigated on Skimo athletes during uphill running and walking on an inclined treadmill, each carried out at two different speeds (7 km/h and 8 km/h). Thereby, it was possible not only to characterize the muscular recruitment and kinematics of each task but also to understand how these parameters could be affected by the motor gesture typology and task speed.
From the kinematic point of view, the athletes preserved the same angular pattern at the level of the knee, hip, and pelvis all along the task cycle, independently of the type of motor gesture and speed. Indeed, the athletes started each task cycle with their hip flexed, ensuring the foot was in a position anterior to the trunk, and the knee was slightly flexed, probably due to the incline of the treadmill, but there was also a shock absorption purpose [
18]. In fact, our findings report that the Rectus Femoris and Biceps Femoris were both activated in this phase, which is consistent with the results reported by Moore et al. [
19]. The co-activation of these muscles occurs predominantly during the loading phase of stance and supports knee flexion [
20], especially in running tasks. Furthermore, it is worth mentioning that thanks to the biarticular nature of these muscles, their contraction has effects on the hip and knee joint at the same time. The Rectus Femoris is a hip flexor and knee extensor, while the Biceps Femoris produces hip extension and knee flexion. Then, considering the involvement of further monoarticular muscles and according to the different lever arms between each biarticular muscle and the relative joint center, the resulting muscular moment was a flexor for both the hip and knee, which is consistent with kinematics data. However, the co-contraction of these antagonist muscles would increase the knee joint stiffness and, consequently, keeping the knee slightly flexed, could be a compensatory mechanism adopted by the athletes to limit the transmission of the impact at the initial contact along the kinematic chain.
Then, both the hip and knee reach their maximum extensions almost simultaneously, barely before the toe-off event. In this phase (40–60% cycle), further interesting findings were pointed out. As reported in
Figure 4, the Rectus Femoris is still contracted for extending the knee, while the Biceps Femoris appears relaxed, facilitating the knee extension and reducing the muscular effort at the level of the hip. Indeed, in this phase, the hip extension is facilitated by the sliding of the treadmill belt, as during this phase, the foot in contact with the belt is positioned behind the trunk.
At the end of the swing phase, the kinematic chain recovers the same configuration of the initial contact, and, consequently, the Rectus Femoris and Biceps Femoris appear again activated, in accordance with results in
Figure 4 and consistent with Masaru et al. [
21]. Notably, the peaks of activation of these muscles were detected primarily during the initial stance and late swing phases, except for the r
2 condition.
In fact, among all the tested conditions, running at the highest speed (8 km/h) represents the most demanding scenario, potentially triggering compensatory mechanisms. Indeed, our findings highlight a knee flexion angle markedly higher than other motor gestures all along the task cycle. This could help the athlete lower their body’s center of mass and limit its vertical excursion, thus reducing potential energy variations and, consequently, energy cost. In fact, as shown in
Figure 3, the ROM of the knee joint during running at high speeds is the lowest one recorded among all trials.
As reported by the literature, uphill running significantly increases lower limb muscle activation compared to level running and downhill running [
22]. This prolonged activation can be attributed to the greater mechanical load on the lower limb muscles during uphill running [
23]. Consistently, our results showed that the investigated muscles were activated for a significant portion of the task cycle, indicating prolonged activity. Moreover, it must be considered that compared to simply walking or running on a treadmill, Skimo athletes constantly control the orientation of the skis during the stance phase and support their weight during the swing phase.
Interestingly, both during walking and running, switching from 7 km/h to 8 km/h resulted in an earlier relaxation of the Biceps Femoris during the stance phase and an anticipated contraction during the swing phase. This peculiarity in the activation timing could be explained by also considering the kinematic data reported in
Figure 2. To cope with high-speed tasks, the Biceps Femoris relaxes earlier to allow the knee to anticipate its maximum extension with respect to lower-speed tasks and contracts earlier to rapidly break the hip flexion at the late swing phase in preparation for the new contact (note that the hip reaches and preserves a constant flexion angle in v
2 and r
2, starting from about 85% of the cycle).
Furthermore, the effect of high speed was also evident on the Gastrocnemius muscle; both in running and walking at 8 km/h, it appeared activated at the 75% cycle, contrary to low-speed tasks in which it appeared almost relaxed. The co-activation with the Tibialis Anterior (antagonist muscle) probably helps to stabilize the ankle joint in such demanding motor gestures. Moreover, the Gastrocnemius ensures propulsion during running in the pre-swing phase, independently of the task velocity; its activation closely matches the toe-off event, promoting the lift of the foot off the ground [
24].
During walking at a velocity of 7 km/h, the maximal contraction of the Gastrocnemius muscle appeared at 17% of the gait cycle, contributing to the load acceptance phase, while in walking at a speed of 8 km/h, the Gastrocnemius showed its peak of activity later in the cycle, primarily to support the knee flexion in the pre-swing phase. This reflects its key role in facilitating efficient movement at higher velocities [
24]. In this study, the dorsiflexion–plantarflexion angle of the ankle has not been reported because the ski boot worn by the athletes prevented any significant macromovement at this joint. The rigid structure of the boot maintains the ankle in a dorsiflexed configuration. This, combined with the continuous dorsiflexion required by the inclined treadmill [
25], would explain the constant and prolonged activation of the Tibialis Anterior throughout the cycle in all four tasks analyzed. However, there was a brief period of inactivation during both walking and running tasks, corresponding to the beginning of the late swing phase, before contracting again to prepare the new foot contact. Instead, at 8 km/h, to cope with the high speed of the movement, the Tibialis Anterior preserved its activation in both motor gestures.
As shown by Saunders et al. [
26], the Transverse Abdominal muscles show continuous activation during level running. In our case, we analyzed a more medial abdominis muscle, namely, the Rectus Abdominis, which similarly appears constantly activated (amplitude higher than 25% of its peak amplitude value along the respective task). However, its activation normalized on MVC did not exceed 0.1; hence, its main role seems to ensure the stability of the trunk and pelvis, in response to uphill movements. In contrast, the Longissimus Erector Spinae Longissimus showed a muscular maximum activation amplitude four times higher than the Rectus Abdominis, demonstrating its significant recruitment to ensure a proper trunk posture in relation to the inclined treadmill. Finally, the pelvis appeared stabilized in anteversion throughout the cycle in all tasks thanks to the cooperation of the Erector Spinae [
27] and Biceps Femoris [
28].
This study assessed the muscle recruitment and kinematics characterizing each of the two fundamental gestures in ski mountaineering: running and walking. This knowledge holds significant practical value in training practices, supporting coaches to design targeted muscle-strengthening programs tailored to the demands of these movements. Further investigations into the biomechanics of this sport could be useful for appropriate equipment design in cooperation with manufacturers. Furthermore, the investigation into the specific effects of speed offers coaches additional useful information. They could apply this understanding to avoid exposing athletes to certain speed ranges, for instance, in post-injury rehabilitation scenarios, thereby promoting safer and more effective recovery strategies.
Although gold standard technologies were employed and the athletes involved in this study were high-level performers, national team members, and performed the gestures professionally and accurately, the small sample size represented an important limitation in this study. Therefore, our findings cannot be generalized to every subject or a specific population. Furthermore, it is important to note that our findings may be representative of a very narrow age group, as the four athletes were approximately the same age and exhibited similar physical fitness levels. This homogeneity poses a limitation to the generalizability of the results to broader populations with more diverse age ranges or physical conditions. Hence, further studies should focus on the inclusion of a larger sample, both in terms of number and gender, to allow for broader applicability and generalization of the findings. However, the fact that our small sample consisted of elite athletes provided substantial reliability that the analyzed sport gestures were performed correctly. This allowed us to avoid variables that could arise from improper execution of the motor gesture.
It is worth mentioning that performing the analyzed motor gestures on the treadmill introduces some intrinsic differences with respect to snow. The treadmill can alter the contact between ski boots and the surface, leading to conditions that differ from the natural snow environment. This discrepancy can affect the shear forces applied during skiing and probably would influence the athletes’ energy expenditure [
29]. Furthermore, in snow, the repeated interaction of ski boots with the surface leads to the formation of ridges that can change the skier’s motion and stability over time. This adaptive interaction is completely absent on treadmills, where the surface remains unchanged [
30]. In addition, snow saturation and temperature variability play a significant role in modifying the mechanical behavior of snow. These factors, influenced by weather conditions and skier activity, can affect performance in ways that cannot be replicated on treadmills [
31]. Another critical factor to consider is altitude and the associated reduction in oxygen availability. Skiing often occurs at higher altitudes where environmental conditions, such as wind and cold temperatures, place additional physiological demands. Treadmill conditions, on the other hand, lack these altitude effects and provide a controlled environment that does not fully mimic the metabolic and cardiovascular challenges of natural environments. In addition, outdoor skiing exposes athletes to dynamic weather conditions, including snowfall, wind, and sunlight, all of which affect snow surface characteristics and, subsequently, performance. These variables are absent in treadmill-based assessments. However, the kinematics assessment of sport gestures in their ecological environment is challenging, particularly if marker-based systems are used. In this study, the controlled environment allowed the involvement of the gold standard measurement system (i.e., optoelectronic system) so as to provide accurate data. However, markerless motion analysis could be applied in future studies to analyze a larger sample in a more ecological sport environment. In fact, this technology is emerging as a solution capable of providing an assessment of kinematics in such challenging scenarios [
32,
33,
34]. However, to date, the accuracy of this solution is lower than the gold standard technology for motion analysis.
Moreover, the analysis could be expanded to the upper limbs during the same motor gestures, as well as to potential energy variation to understand if athletes employ specific mechanisms to minimize mechanical work. This investigation would increase the understanding of the energy-saving strategies during uphill movements. In addition, equipping ski poles with force and inertial sensors would allow us to investigate their contribution to overall performance and stability, and the use of metabolic analyzers would provide information about the tasks’ energy costs. This could provide valuable insights for coaches and athletes to help design more personalized training programs and improve performance outcomes.


 ,
, 


