Article

Unraveling the Patterns and Drivers of Multi-Geohazards in Tangshan, China, by Integrating InSAR and ICA

1
Hebei Key Laboratory of Geological Resources and Environment Monitoring and Protection, Shijiazhuang 050021, China
2
Hebei Geological Environment Monitoring Institute, Shijiazhuang 050021, China
3
School of Water Resources & Environmental Engineering, East China University of Technology, Nanchang 330013, China
*
Author to whom correspondence should be addressed.
Appl. Sci. 2025, 15(23), 12584; https://doi.org/10.3390/app152312584
Submission received: 18 October 2025 / Revised: 22 November 2025 / Accepted: 25 November 2025 / Published: 27 November 2025

Abstract

This study establishes an integrated “Detection–Decomposition–Interpretation” framework for geohazard assessment, with Tangshan City serving as a representative case. Using Sentinel-1 SAR images from 2020 to 2024, regional surface deformation was derived via the Small Baseline Subset InSAR (SBAS-InSAR) technique. Six categories of geohazards were systematically identified and classified: landslides, open-pit slope deformation, mining-induced subsidence, spoil heap deformation, tailings pond deformation, and reclamation settlement. A total of 115 potential hazards were spatially cataloged, revealing distinct zonation characteristics: the northern mountainous area is predominantly affected by landslides and open-pit mining hazards; the central plain exhibits concentrated mining subsidence; and the southern coastal zone is marked by large-scale reclamation settlement. For the southern reclamation area, where settlement mechanisms are complex, the Independent Component Analysis (ICA) method was applied to successfully decompose the deformation signals into three independent components: IC1, representing the dominant long-term irreversible settlement driven by fill consolidation, building loads, and groundwater extraction; IC2, reflecting seasonal deformation coupled with groundwater level fluctuations; and IC3, comprising residual noise. Time series analysis further reveals the coexistence of “decelerating” and “accelerating” settlement trends across different zones, indicative of their respective evolutionary stages—from decaying to actively progressing settlement. This study not only offers a scientific basis for geohazard prevention and control in Tangshan, but also provides a transferable framework for analyzing hazard mechanisms in other complex geographic settings.

1. Introduction

Geohazards, including landslides, mining-induced subsidence, tailings pond failures, and land subsidence, represent significant geological problems that pose serious threats to urban safety and sustainable development globally [1,2]. The acceleration of urbanization and the intensification of human engineering activities, such as mining, land reclamation, and large-scale construction, have contributed to a marked increase in both the frequency and spatial extent of such hazards [1,3,4]. Tangshan, a representative resource-based industrial city and a major coastal port in China, faces particularly complex and interconnected geohazard risks. These stem from long-term, large-scale underground and open-pit mining [5], intensive industrial operations [6], and extensive coastal reclamation projects [7,8]. Systematic detection, identification, and mechanistic understanding of the spatiotemporal distribution and deformation behavior of these hazards are therefore essential for informed risk assessment, disaster mitigation planning, and urban safety management.
In recent years, Interferometric Synthetic Aperture Radar (InSAR) has become a widely adopted technique for large-scale, high-precision monitoring of surface deformation [9,10,11]. Compared to conventional surveying methods, it offers distinct advantages such as all-weather, day-and-night operability, broad spatial coverage, and millimeter-to-centimeter accuracy, making it highly suitable for applications such as landslide detection and mining subsidence monitoring [12,13]. However, most existing studies tend to focus on individual types of geo-hazards—for instance, addressing only mining subsidence or landslides—rather than systematically cataloging and analyzing multiple co-occurring hazards within a region. This fragmented approach limits a holistic understanding of regional geohazard distributions and their potential interrelationships [14]. Moreover, a large portion of InSAR-based research remains descriptive, concentrating on deformation visualization. Less attention has been given to separating and quantitatively interpreting the underlying deformation mechanisms—such as distinguishing between settlement driven by building loads and that induced by groundwater extraction—which are often embedded within complex deformation signals.
Independent Component Analysis (ICA), as a blind source separation technique, can decompose mixed InSAR deformation signals into multiple statistically independent components, each of which may correspond to a distinct deformation-driving mechanism [15,16,17,18]. This capability renders ICA a powerful mathematical tool for isolating deformation patterns associated with different causal factors from complex, overlapping signals [19]. Such an approach is particularly valuable in the coastal reclamation area of Tangshan, where ground settlement arises from the interplay of multiple factors—including static building loads, ongoing soil consolidation, and groundwater extraction. These influences superimpose both temporally and spatially, resulting in intricate differential settlement patterns [7,8]. Disentangling these contributing mechanisms and quantifying their individual roles is essential for accurately predicting future settlement behavior and assessing long-term engineering risks.
Based on the above research background, this study establishes an integrated “Detection–Decomposition–Interpretation” framework and applies it to Tangshan City as a representative case to systematically investigate the spatiotemporal patterns and formation mechanisms of multiple geohazard types. The specific objectives are as follows: (1) Employ Small Baseline Subset InSAR (SBAS-InSAR) techniques to derive high-precision surface deformation fields across Tangshan and systematically detect and map various geohazards, including landslides, open-pit slope deformations, mining-induced subsidence, spoil heap deformations, tailings pond deformations, and reclamation settlement; (2) Apply ICA to decompose regional InSAR deformation maps, extracting statistically independent dominant deformation modes to elucidate type-specific deformation characteristics and their underlying physical drivers; (3) Focus on the highly deformational coastal reclamation area and, based on ICA results, isolate and quantify settlement components attributable to different factors—such as building loads, soil consolidation, and groundwater extraction—to reveal their synergistic interactions and contributions.

2. Study Area

Tangshan City is located east of Beijing and borders the Bohai Sea to the south (Figure 1a). It spans a total area of approximately 14,129 km2 and has a resident population of nearly 8 million. The region experiences a temperate monsoon climate. The mean annual temperature ranges from 11 to 13 °C, and the mean annual precipitation is approximately 536 mm, predominantly occurring in summer, which accounts for over 70% of the yearly total [20].
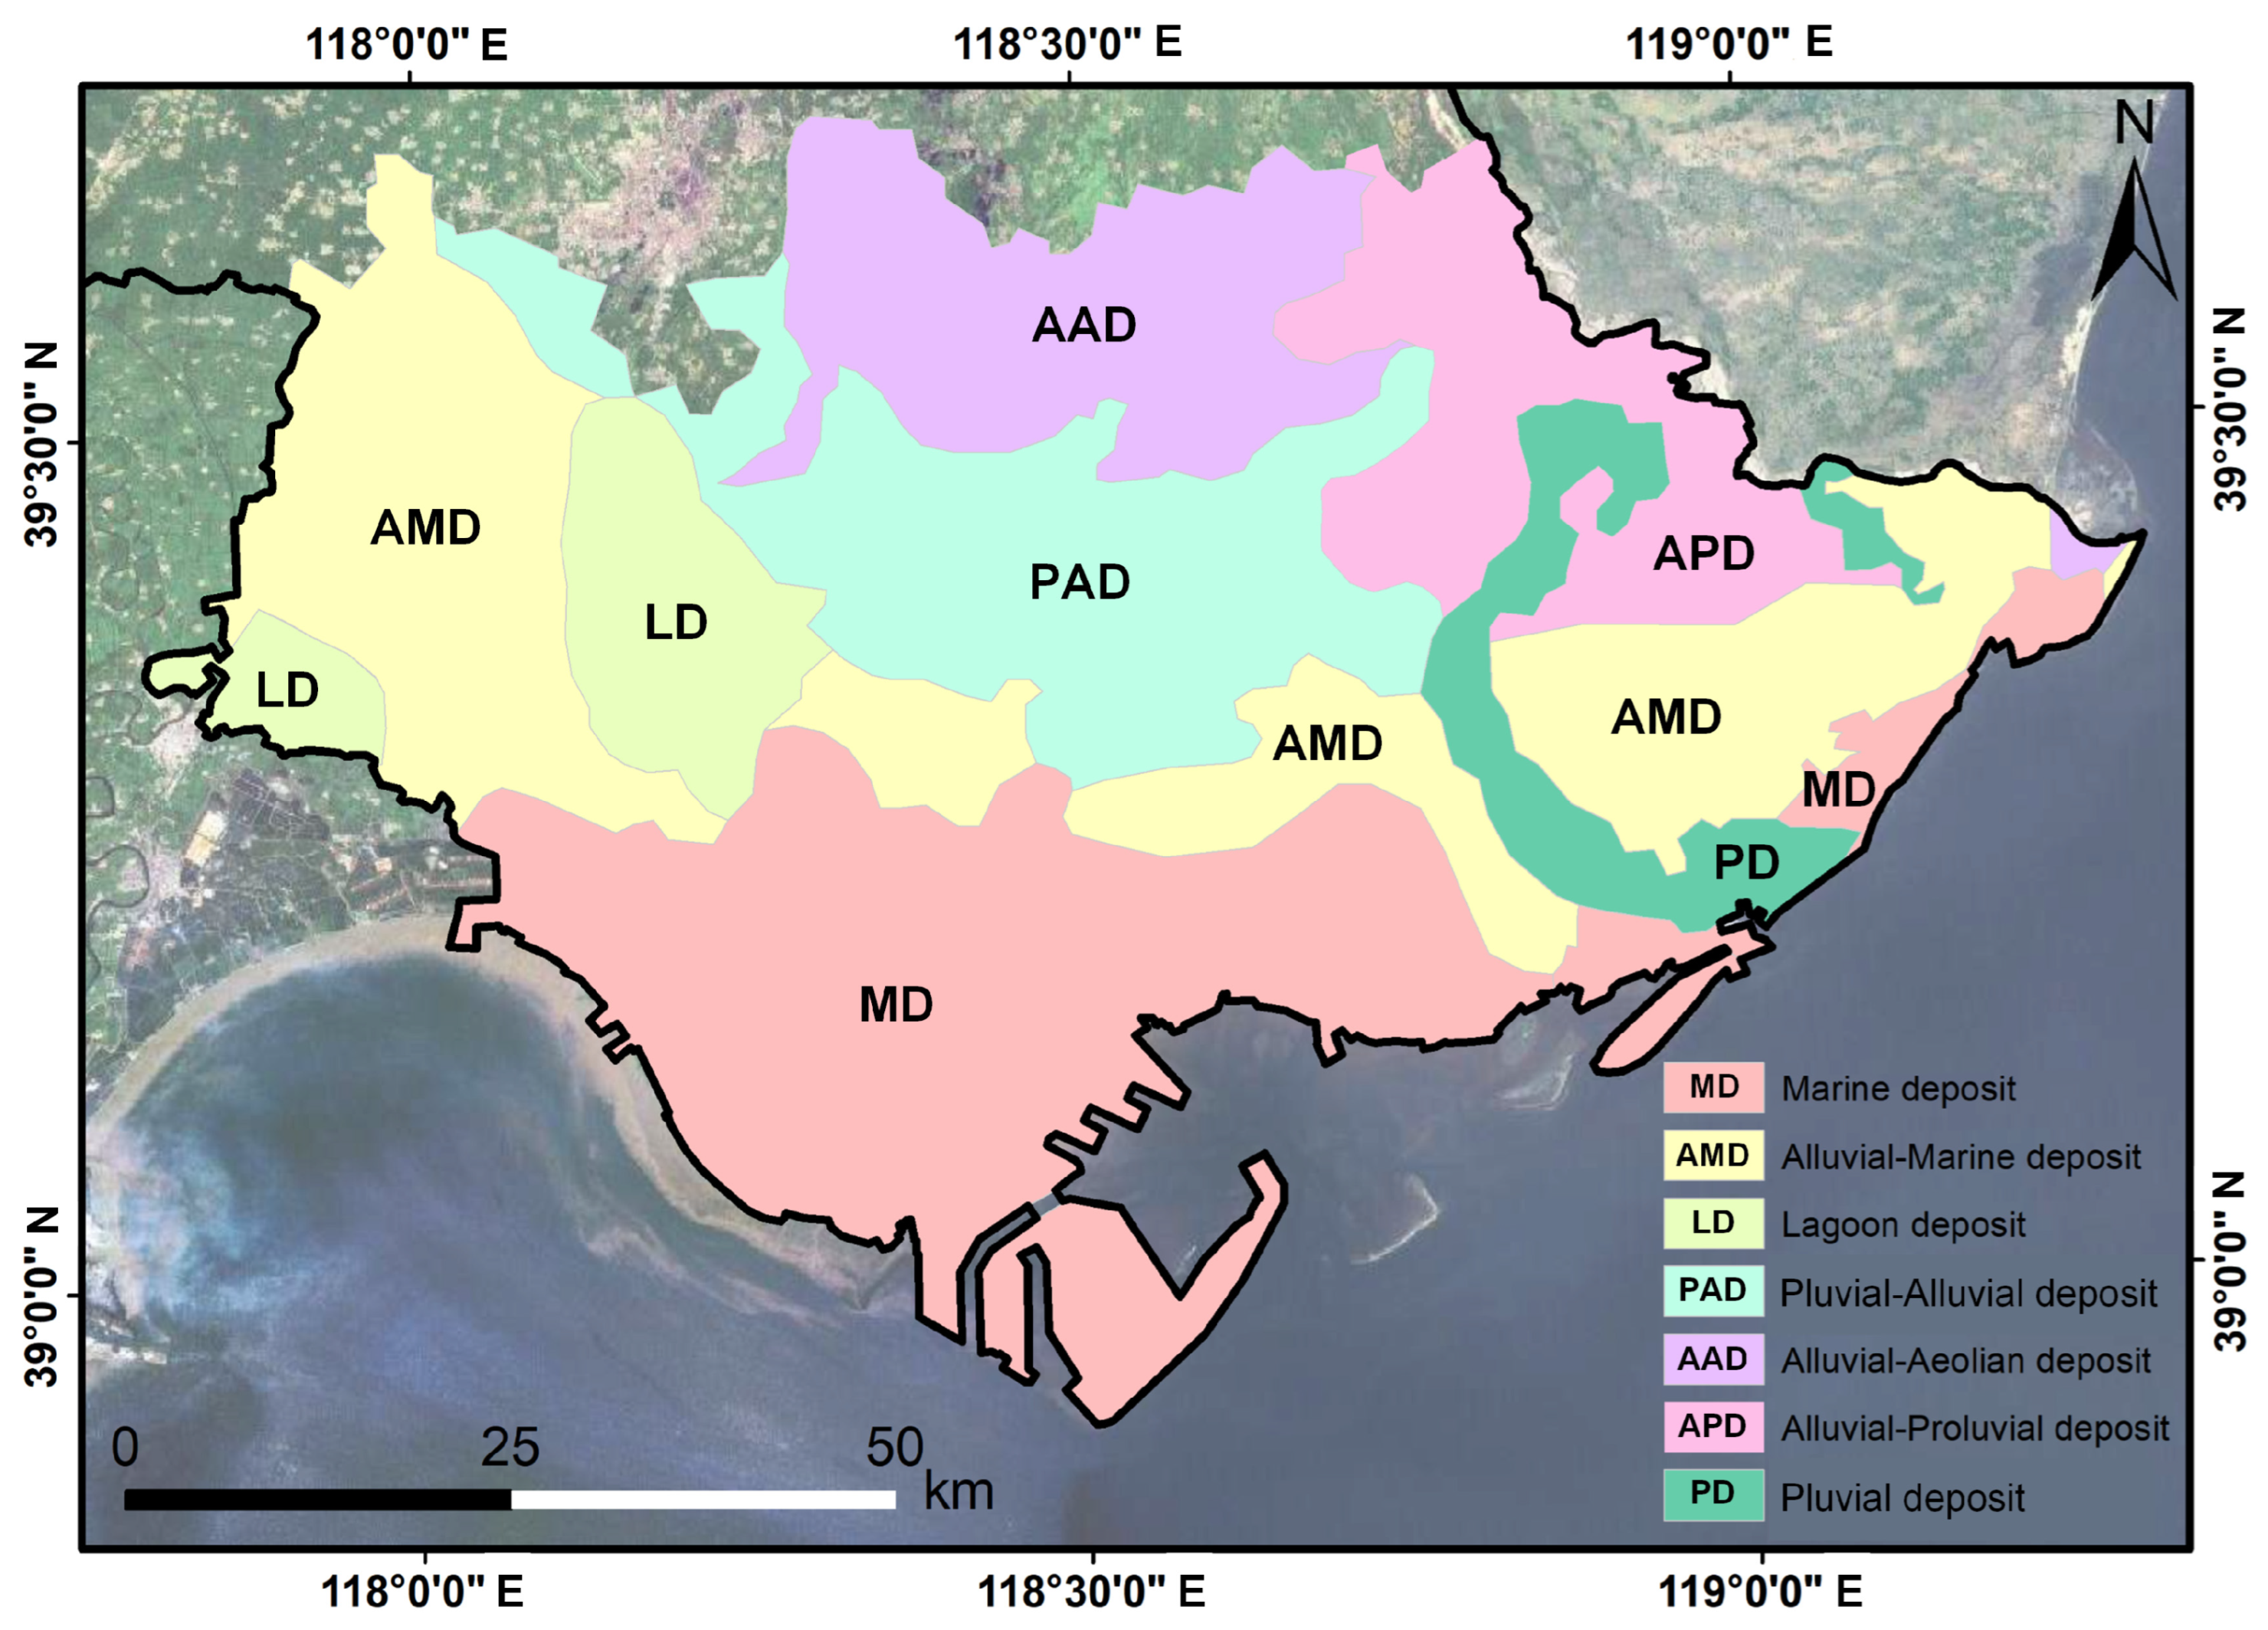
The regional topography exhibits a pronounced ladder-like configuration, descending progressively from north to south (Figure 1b). The northern sector lies within the Yanshan tectonic belt, dominated by low mountains and hills, where complex geological structures and intensely weathered rock masses render the area highly prone to landslides, especially when triggered by rainfall or seismic activity [21,22]. The central and southern areas are primarily underlain by thick alluvial fans, deltaic deposits, and silty coastal sediments (Figure 2). The thickness of Quaternary deposits varies considerably, ranging from several tens of meters in central Tangshan to a maximum of approximately 450 m in the southern coastal zone [23]. This marked gradient in sediment thickness forms the geological basis for the regionally differential land subsidence observed across the study area. This study divides the Tangshan region into three geomorphological units—the northern mountainous area, the central alluvial plain, and the southern coastal reclamation zone—based on topographic gradients, sedimentary characteristics, and the distribution of key geological and anthropogenic processes (including mining, land reclamation, landslides, etc.). The boundaries of these units are clearly delineated in Figure 1b to provide a clear spatial framework and facilitate understanding of the rationale behind this regional subdivision.
As a critical energy and raw materials base in China, Tangshan possesses abundant mineral resources. Over more than a century of intensive mining, large-scale underground goafs and open-pit mines have been formed [24]. Underground mining has triggered extensive ground subsidence and waterlogging, posing serious threats to overlying infrastructure, farmland, and residential areas. Meanwhile, open-pit mining has resulted in high, steep slopes that are prone to progressive deformation and potential failure, endangering both mining operations and personnel safety. In addition, mining activities have produced numerous engineered slopes and accumulations—such as spoil piles, tailings ponds, and industrial stockpiles—whose instability may lead to catastrophic landslides or debris flows.
Figure 2. Geological map of the south-central coastal area in Tangshan City [25]. The optical imagery basemap is from Google Earth.
Applsci 15 12584 g002
Since the early 21st century, large-scale land reclamation projects have been carried out in the southern coastal area of Tangshan, forming new industrial and port zones. This reclaimed land, composed of dredged fill materials, is currently undergoing self-weight compaction and consolidation under building loads, resulting in widespread, significant, and differential ground settlement [26,27]. The primary driving mechanisms include the static load of structures, the natural consolidation of the fill and underlying soft soils, and potential groundwater extraction due to industrial water demand [28].

3. Methods and Datasets

3.1. Datasets

This study integrated satellite remote sensing and ground-based observational data to support InSAR-based surface deformation monitoring, accuracy validation, and driving mechanism analysis. The primary dataset comprised 104 ascending Sentinel-1 SAR images acquired between January 2020 and December 2024. These were mosaicked from two standard frames (Path 69, Frame 129 and Path 69, Frame 124) to ensure full coverage of Tangshan City for deriving deformation time series and compiling the geohazard inventory. This dataset was supplemented by 26 descending-track images covering the northern and central parts of Tangshan from January 2020 to June 2021. Due to the failure of the Sentinel-1B descending sensor after December 2021, no further descending-track data were available for the study area; therefore, the descending dataset was limited to this period and primarily used for cross-validation and two-dimensional deformation analysis. The spatial coverage of both ascending and descending datasets is illustrated in Figure 1a.
The 30-m resolution Copernicus Digital Elevation Model (DEM) was used for accurate topographic phase removal and geocoding. In addition, groundwater level records from January 2020 to December 2021 were collected to analyze the relationship between aquifer dynamics and surface subsidence. To further investigate the influence of land reclamation history and building loads on settlement, high-resolution optical satellite imagery from Google Earth spanning 1984 to 2024 was acquired. A comparison of these multi-temporal images clearly reveals land-use changes, the expansion of reclaimed areas, and the distribution of buildings in the coastal zone. Additionally, this imagery was crucial for assisting in the interpretation of InSAR deformation maps, enabling the systematic identification and cataloging of various geohazards.

3.2. SBAS-InSAR

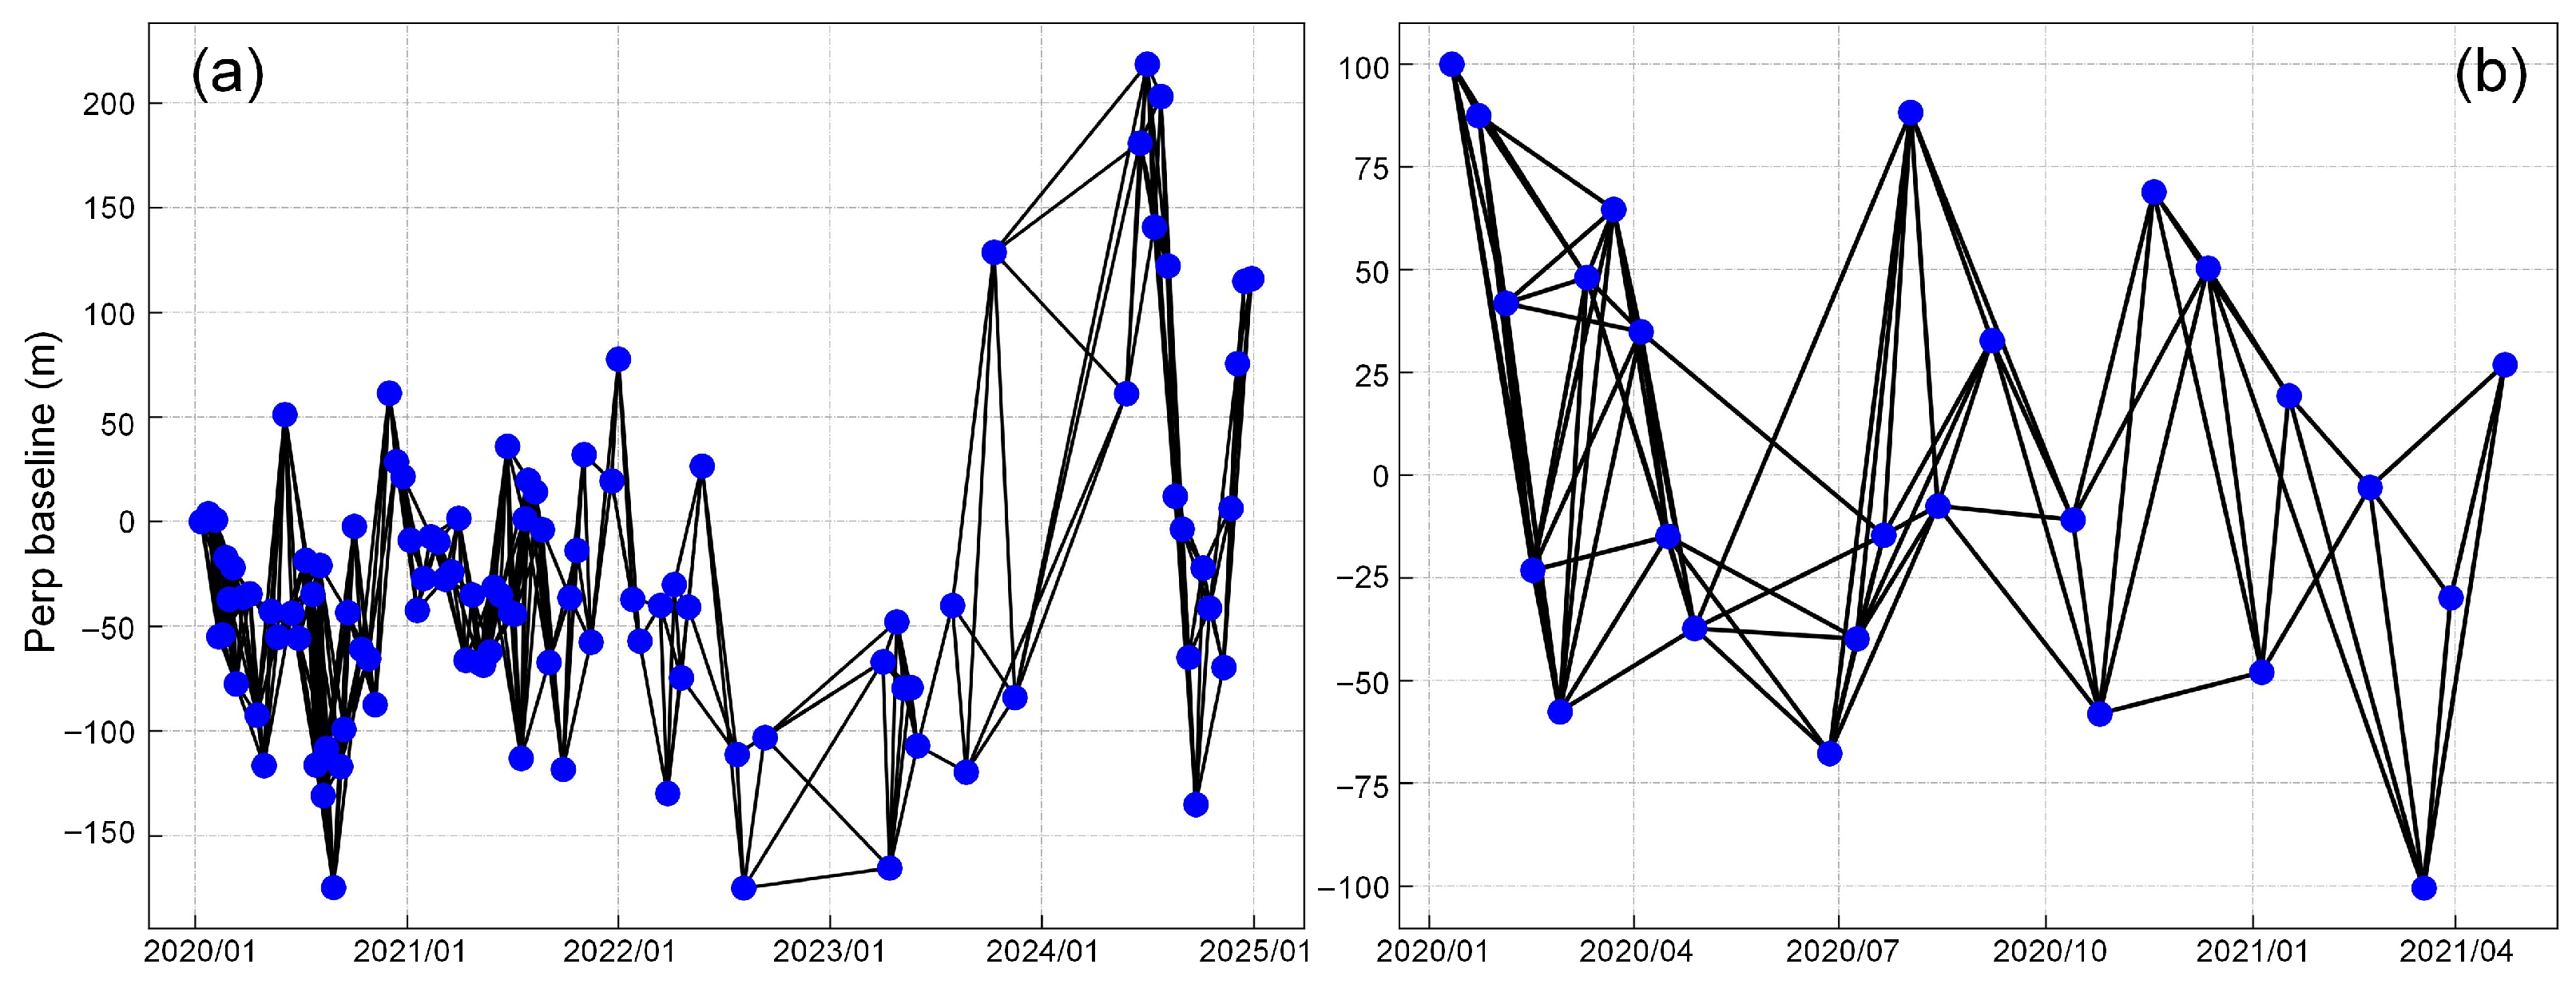
In this study, we systematically applied the Small Baseline Subset (SBAS) InSAR technique to process Sentinel-1 SAR imagery covering Tangshan City. All SAR acquisitions were precisely co-registered to a common master scene (1 January 2022, for ascending and 2 August 2020, for descending) using the GAMMA software package (Software Version: July 2018, GAMMA Remote Sensing AG, 3073 Gimligen, Switzerland), achieving a sub-pixel accuracy better than 1/1000 pixel to ensure high-precision geometric alignment throughout the time series. Interferogram generation was rigorously constrained by baseline parameters to minimize decorrelation, with a perpendicular spatial baseline threshold of 300 m and a temporal baseline limit of 36 days. Under these constraints, an optimized interferogram network was constructed using the 104 ascending SAR images, resulting in 399 differential interferograms (Figure 3a). The topographic phase component was accurately removed from each interferogram using the 30 m resolution Copernicus DEM. During the phase processing stage, a three-dimensional (3D) phase unwrapping algorithm combined with adaptive filtering was employed to effectively isolate deformation signals from noise components such as atmospheric delays and orbital errors [29,30,31]. To further improve the signal-to-noise ratio, low-coherence areas (e.g., water and dense vegetation) were masked, retaining only high-confidence pixels for subsequent inversion. Finally, the Singular Value Decomposition (SVD) method was used to retrieve the time series from the unwrapped phase. This approach effectively addresses the rank deficiency issue caused by sparse baseline configuration, yielding both the deformation time series and the average deformation rate for each high-coherence pixel across the study area [32]. All results were geocoded and unified into the WGS84 coordinate system to support spatial correlation analysis with auxiliary datasets. The same data processing workflow was applied to the descending Sentinel-1 SAR imagery.

3.3. Independent Component Analysis

To extract the latent deformation-driving processes embedded in the InSAR time-series dataset, this study employs Independent Component Analysis (ICA), a classical blind source separation technique. The fundamental principle of ICA assumes that the observed deformation field arises from a linear mixture of several statistically independent source signals [33]. Under the standard ICA mixing model, let S ( T ) = S 1 ( t ) , S 2 ( t ) , , S N ( t ) T denote N unobservable, statistically independent sources, each representing a distinct deformation mechanism. The InSAR observations x(t) can be expressed as:
x ( t ) = A S ( T )
where A is an unknown mixing matrix describing how each deformation source contributes to the Line-of-sight (LOS) displacement recorded at each pixel. ICA aims to estimate an unmixing matrix WA−1 such that
S ^ ( t ) = W x ( t )
yielding statistically independent components (ICs) that best approximate the true deformation sources. This formulation clarifies that ICA performs a linear basis transformation that separates physically distinct deformation processes contributing to the observed time-series signals [34].
The application of ICA to InSAR deformation fields is well justified. InSAR pixels act as spatially distributed “sensors,” each observing a slightly different linear combination of deformation processes such as long-term consolidation, seasonal groundwater fluctuations, and localized engineering activities [35]. These processes are physically independent and therefore compatible with ICA’s independence assumption. Moreover, the combination of spatial diversity and temporal evolution contained in SBAS-InSAR time series provides sufficient variability for ICA to distinguish between these latent deformation sources [36].
In this study, the SBAS-derived deformation time series were reshaped into a two-dimensional observation matrix, where each row corresponds to the deformation history of a single coherent pixel. The variational Bayesian ICA (VB-ICA) algorithm—based on negentropy maximization—was adopted to iteratively separate the mixed signals into independent components [37]. To ensure robustness, multiple candidate numbers of ICs were tested, and each configuration was repeatedly executed with randomized initializations.
Each extracted IC consists of (i) a spatial response map, which highlights the dominant deformation pattern attributable to a specific latent driver, and (ii) a normalized temporal curve, which characterizes the evolution of that driver through time. These spatial–temporal pairs provide a direct means of comparing ICA-derived deformation sources with known geological processes, groundwater dynamics, and anthropogenic activities in Tangshan, forming the analytical basis for the mechanistic interpretation presented in the Discussion section.

4. Results

4.1. Regional Surface Deformation and Cross-Validation of InSAR Measurements

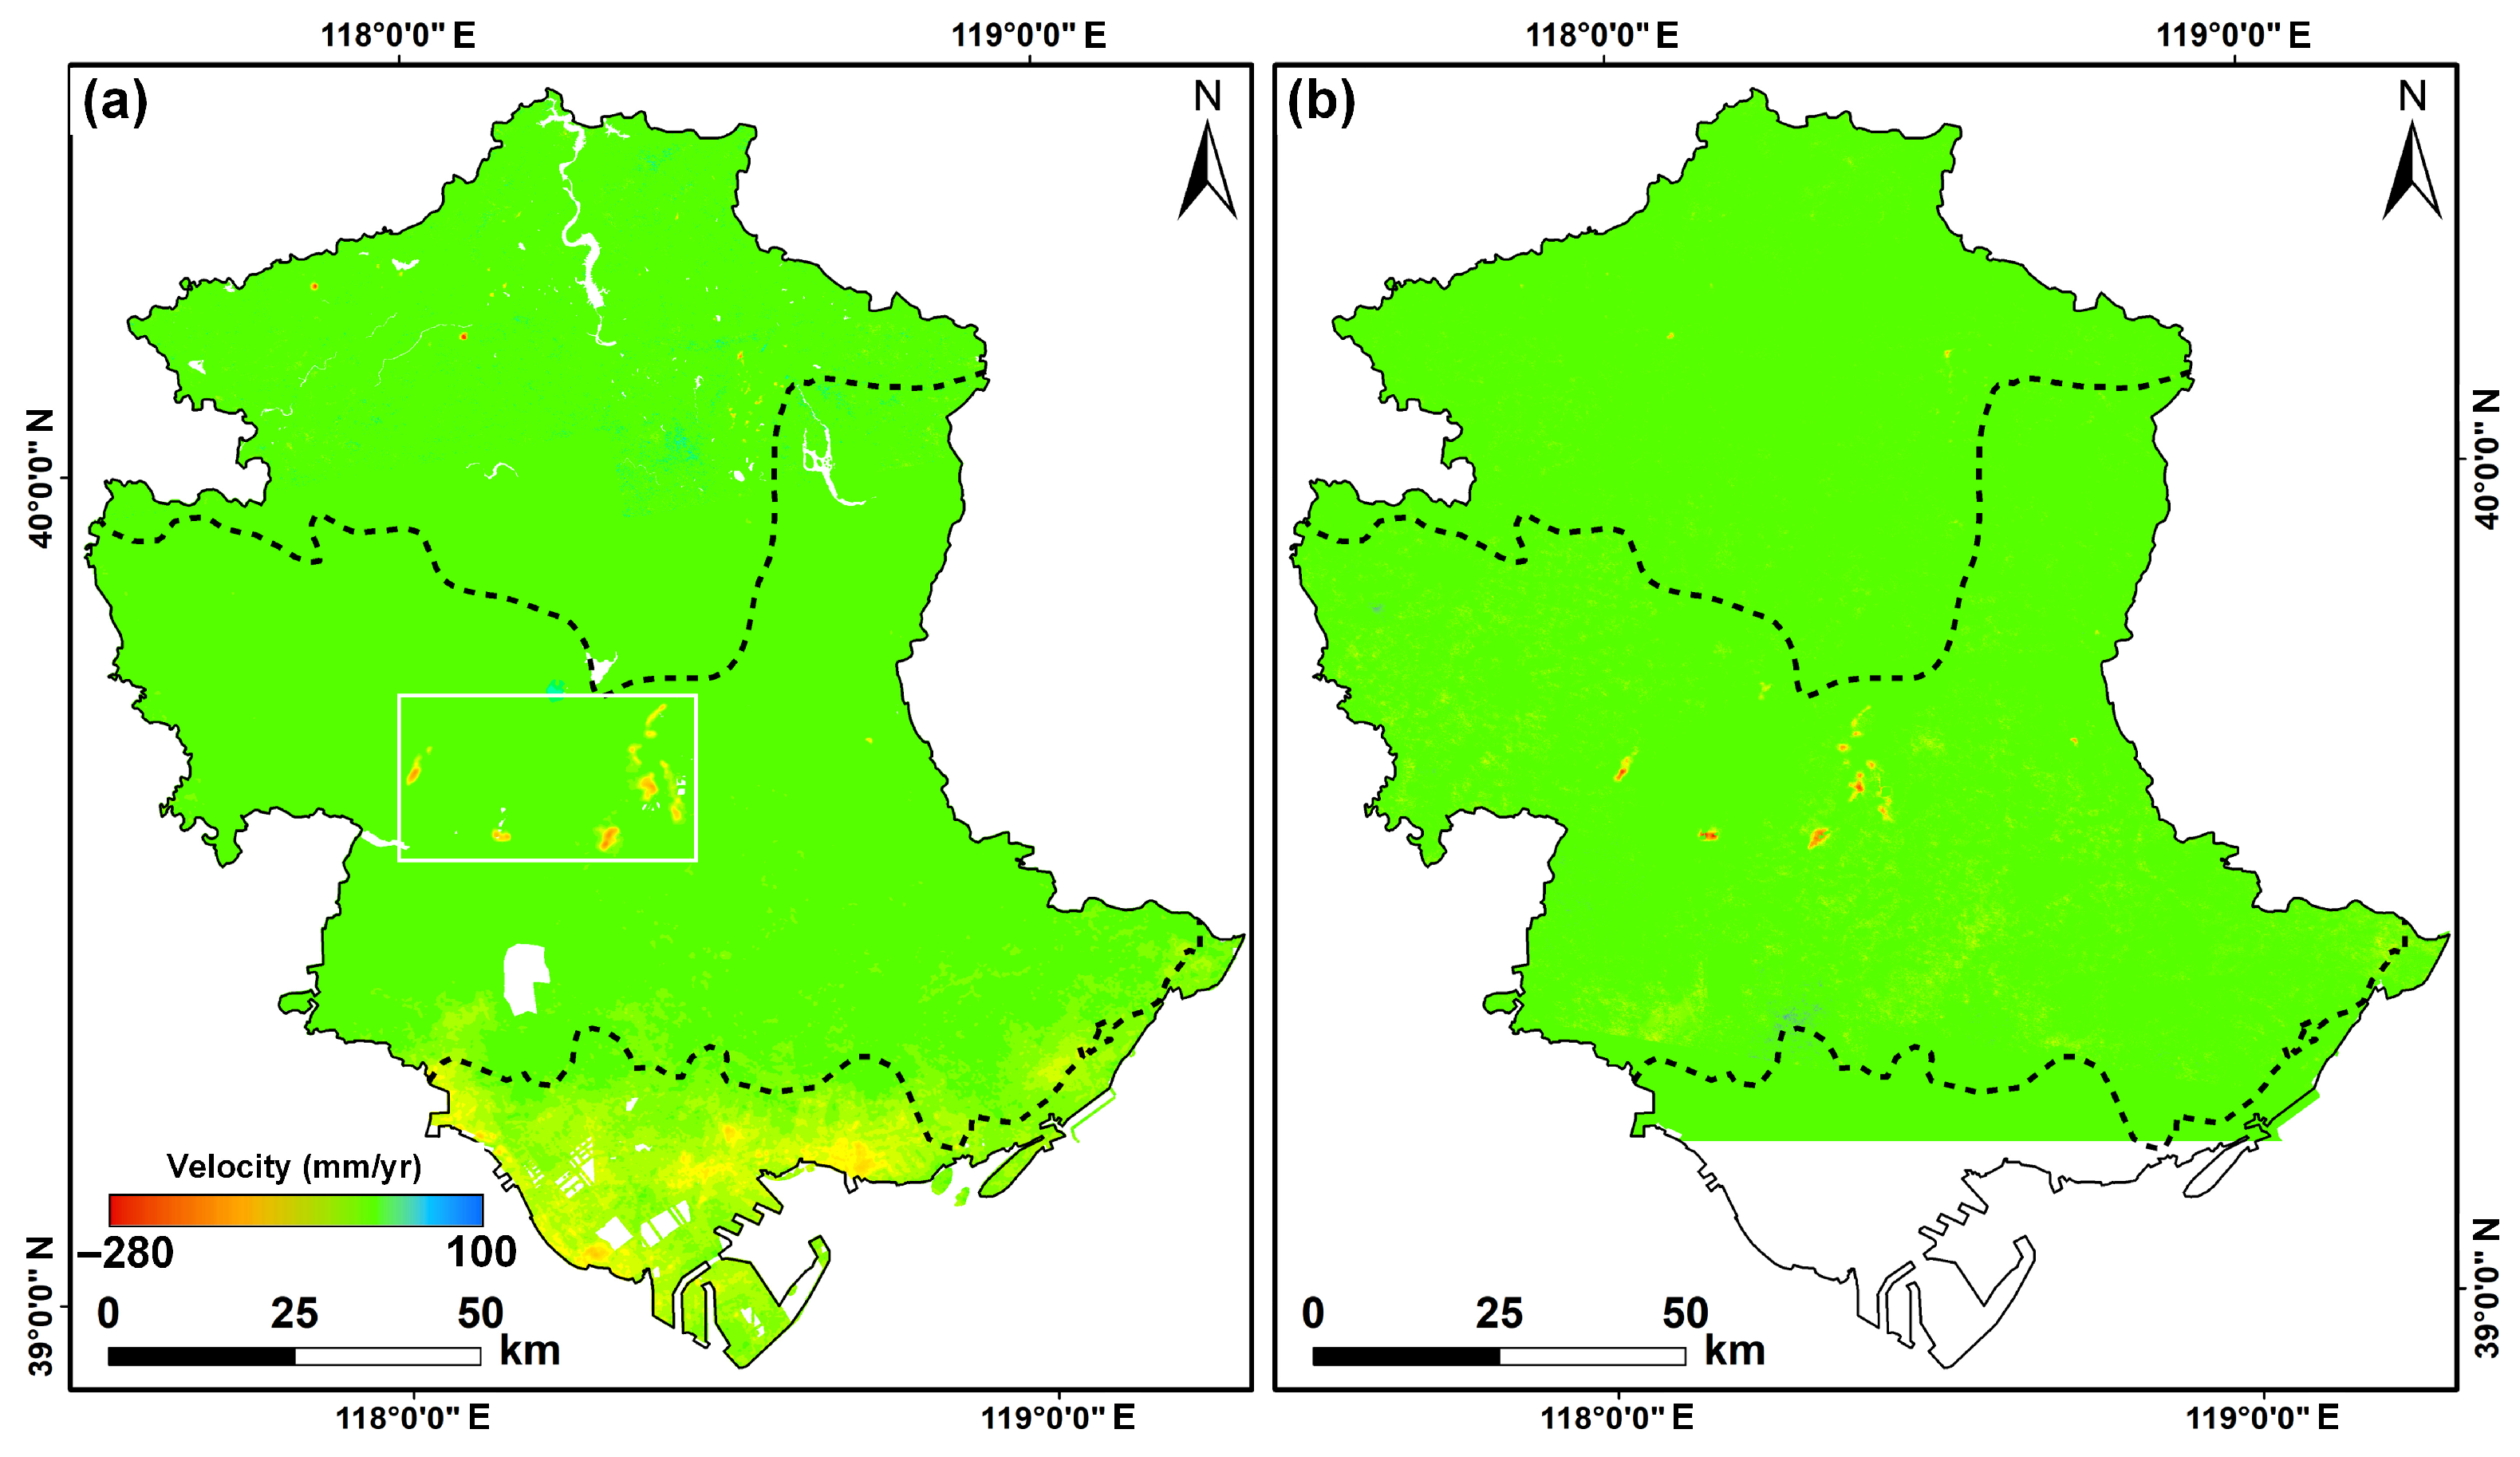
Based on the ascending (January 2020 to December 2024) and descending (January 2020 to June 2021) Sentinel-1 SAR images, the LOS surface deformation across the entire Tangshan City derived using the SBAS-InSAR technique is presented in Figure 4. In the figure, positive values indicate movement toward the satellite, whereas negative values denote movement away from it. The results reveal that the LOS deformation rates in the study area range approximately from −280 mm/year to 100 mm/year, displaying considerable spatial heterogeneity and clearly delineating several distinct zones of significant surface displacement.
Due to the absence of high-precision ground-based measurements (e.g., leveling or GNSS) for direct validation, this study performed cross-validation using both ascending and descending SBAS-InSAR results from January 2020 to June 2021 to evaluate the reliability of the deformation monitoring outcomes. It should be noted that this cross-validation was only conducted in the central plain area of Tangshan City, for the following principal reasons: (1) Surface deformation in the northern mountainous area mainly originates from slope movements, whose actual sliding direction and inclination are uncertain. Under such conditions, projecting ascending and descending LOS deformations onto an assumed direction lacks a reliable geometric basis, making meaningful quantitative comparison difficult [38,39]. (2) Although the key deforming zone in the study area—the mining-induced subsidence region in the central plain—is topographically flat, its deformation mechanism is complex. Previous studies [40] have demonstrated that these areas experienced not only severe vertical subsidence but also significant horizontal displacement. This three-dimensional deformation behavior further complicates the accurate projection of LOS measurements onto any single direction.
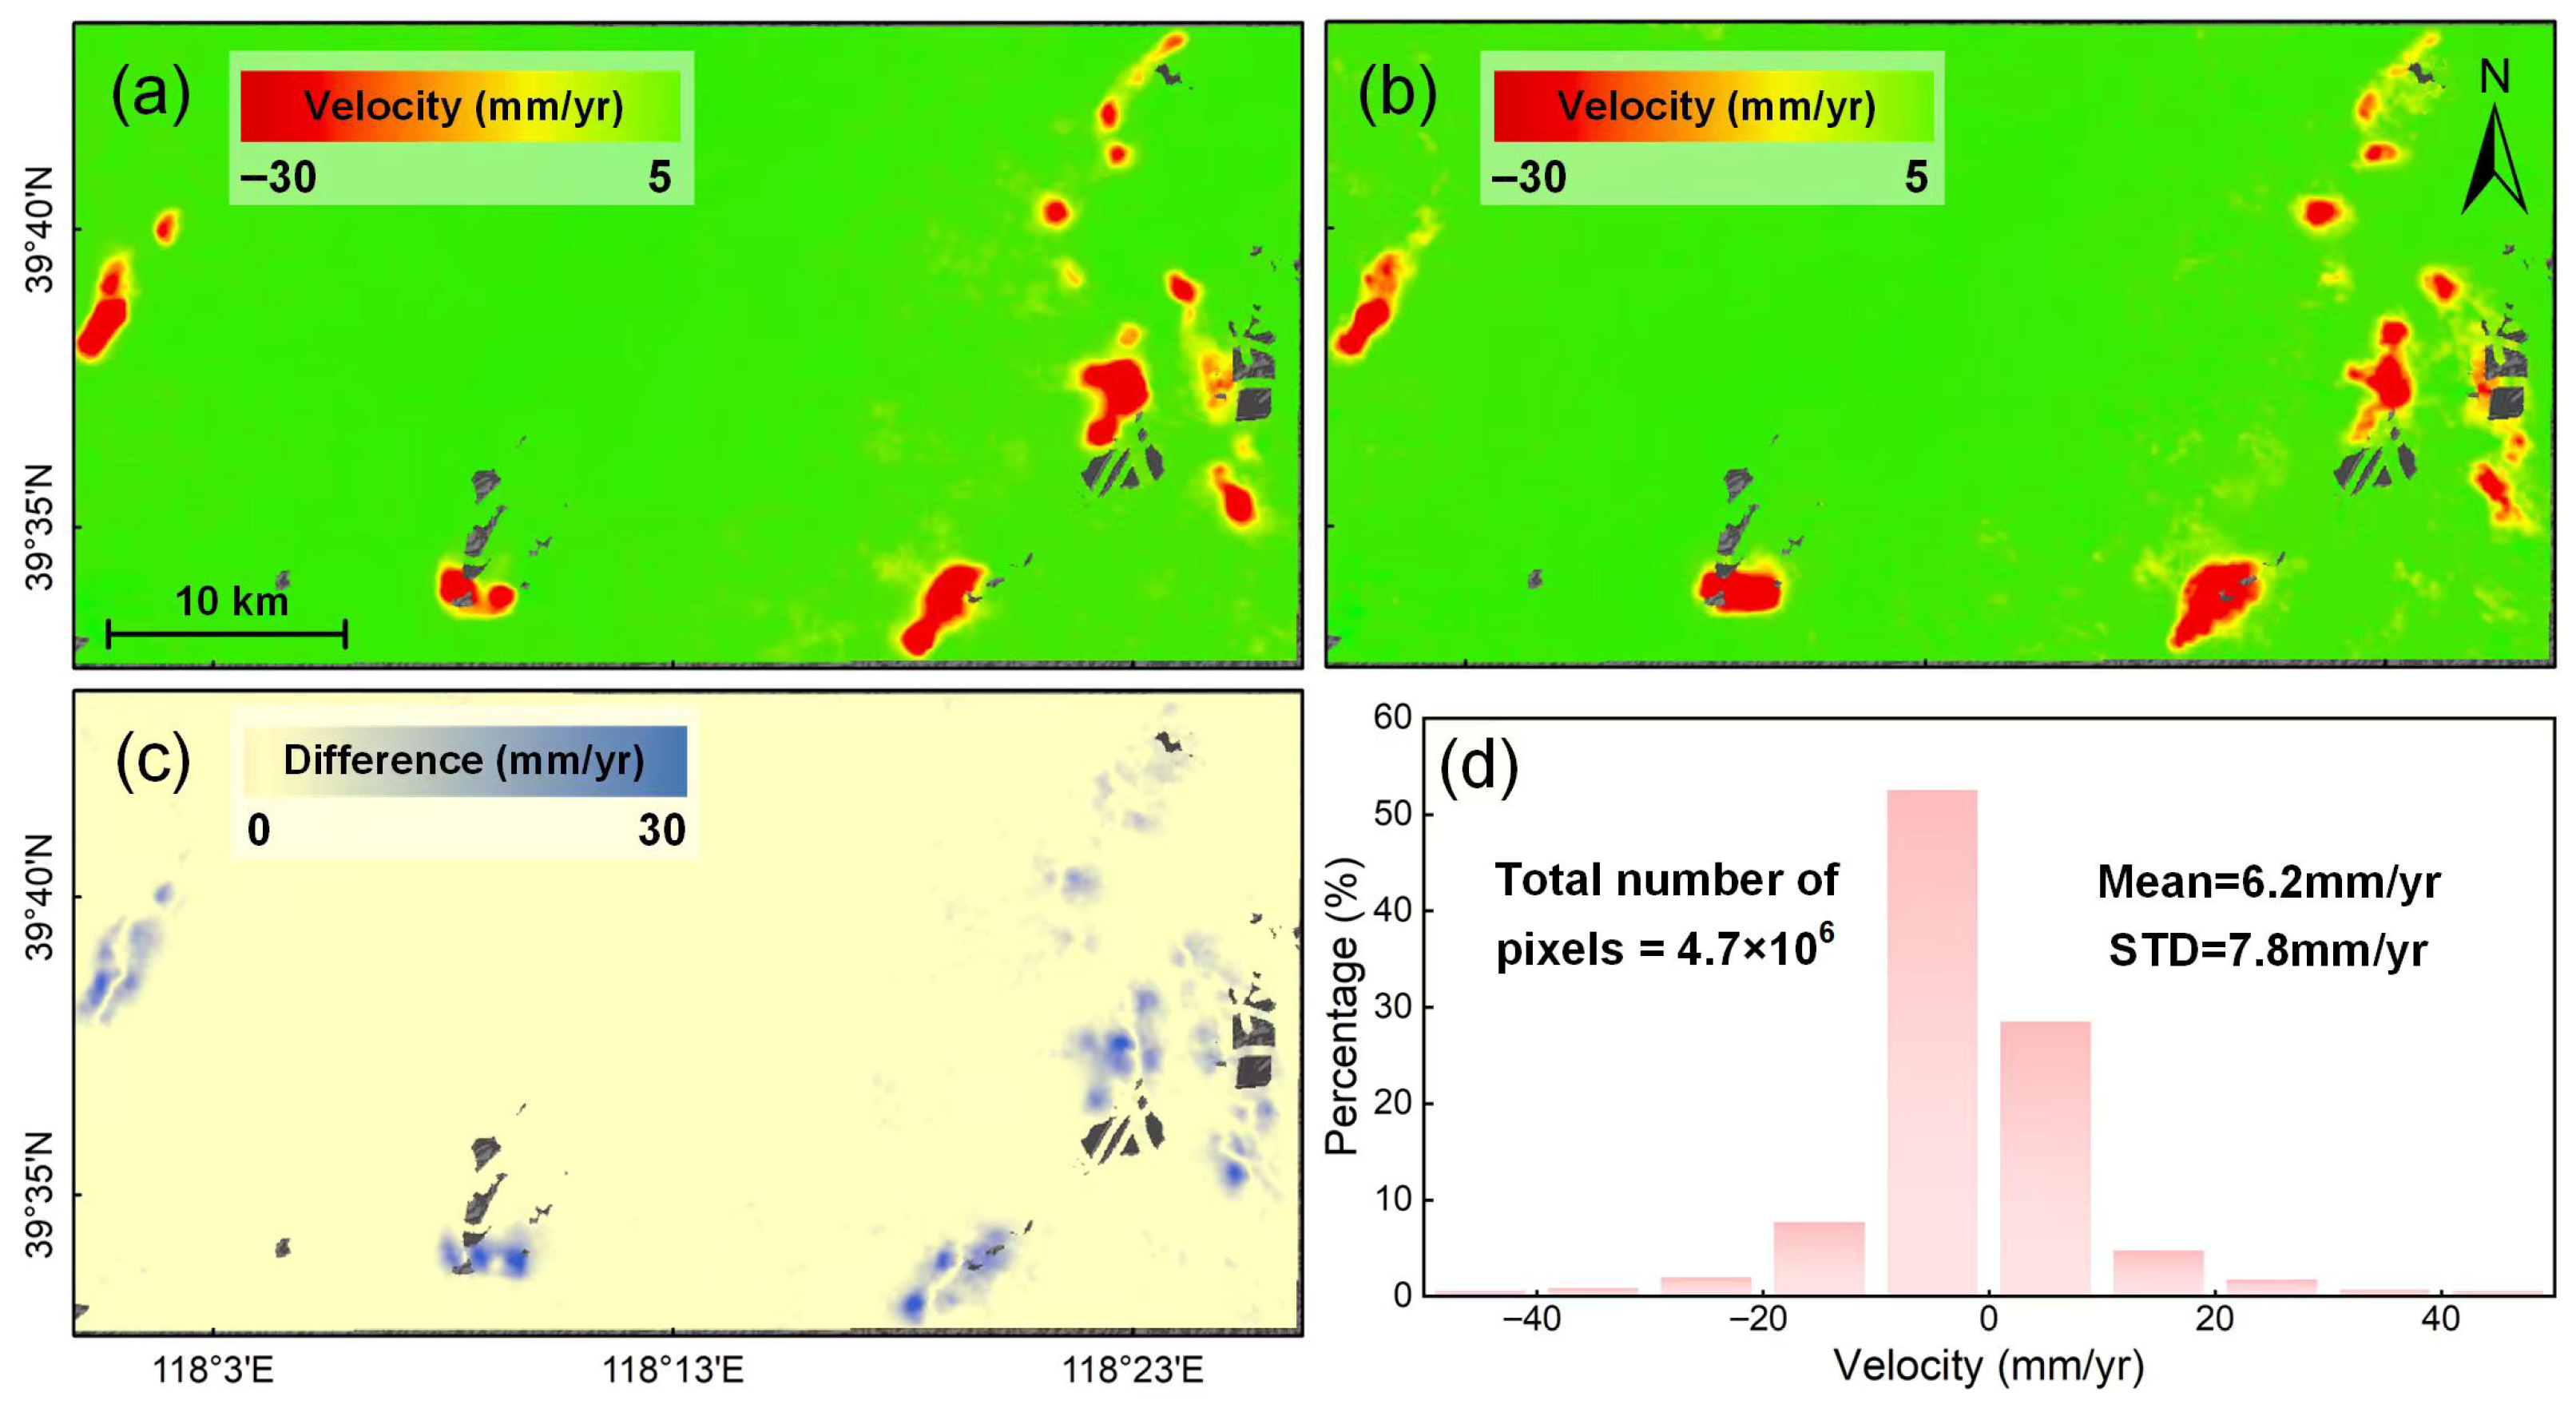
Based on the above considerations and to maximize the rationality and accuracy of the validation, we assumed that in plain areas outside the mining subsidence zones, where the deformation mechanism is relatively simple, surface deformation occurs predominantly in the vertical direction [41,42]. Based on this assumption, LOS deformation rates from both ascending and descending tracks were projected onto the vertical direction and compared. Subsequently, the absolute values of these projected vertical deformation rates were calculated, and their differences were computed. Subsequently, the mean and standard deviation of these absolute differences were statistically evaluated. The validation results are presented in Figure 5. While the cross-validation analysis was performed across the entire plain area, Figure 5 specifically focuses on displaying the results within the rectangular subset delineated in Figure 4a. This deliberate selection serves to enhance the legibility of the ascending/descending InSAR deformation rate maps and their difference map by providing an enlarged view. Zooming in on this representative area allows readers to better discern detailed spatial patterns and more effectively appreciate the general high consistency between the two independent datasets, which might be less distinct in a full-scale regional presentation.
The average difference between the vertical deformation rates derived from ascending and descending InSAR observations, calculated across approximately 4.7 × 106 pixels in the validation area, is only 6.2 mm/yr with a standard deviation of 7.8 mm/yr (Figure 5c). This observed noise level is substantially lower than the typical threshold (e.g., >10 mm/yr [43] or twice the standard deviation [44]) used for identifying significant geohazard-related deformation, confirming that our data possess sufficient sensitivity to clearly distinguish genuine deformation signals from background noise. Such an accuracy level is widely recognized as excellent and reliable in InSAR-based geohazard identification studies [45]. Consequently, these results demonstrate that the SBAS-InSAR measurements obtained in this study exhibit high internal consistency and reliability during the overlapping monitoring period, thus providing a reliable data foundation for the subsequent accurate identification, classification, and mechanistic analysis of geohazards.

4.2. Multi-Geohazards Inventory

Spatially, the deformation field (Figure 4a) can be clearly divided into three distinct zones that align closely with the geomorphology and human activity patterns of Tangshan City: (1) Northern Mountainous Area: This region exhibits overall surface stability but contains several localized deformation signals. These discrete patches often show high deformation rates, interpreted to be associated with potential landslides, open-pit slope deformation, and instabilities of spoil piles or tailings ponds distributed throughout the mountainous terrain. (2) Central Plain Area: A significant and concentrated subsidence zone is observed in central Tangshan, with a maximum subsidence rate of −280 mm/year. The spatial pattern and magnitude strongly suggest a close link to intensive underground mining activities. (3) Southern Coastal Reclamation Area: The most extensive deformation is concentrated in the southern coastal land reclamation area. The widespread distribution and substantial magnitude of deformation pose serious threats to critical infrastructure, industrial facilities, and long-term land usability in this emerging urban district. The complexity of the deformation field—likely resulting from the interplay of multiple factors such as building loads, fill consolidation, and groundwater extraction—makes it a key area for subsequent mechanistic analysis.
We developed a systematic interpretive framework based on spatial, morphological, and temporal diagnostic criteria to classify the identified potential hazards into six distinct categories: reclamation settlement, tailings pond deformation, landslides, open-pit slope deformation, mining-induced subsidence, and spoil heap deformation. This approach minimizes subjectivity and provides a transparent basis for geohazard classification. The specific workflow of the framework proceeds as follows:
(1) Spatial correspondence and contextual consistency: Each deformation signal was verified by spatially overlaying it with high-resolution optical imagery (Google Earth), geological and geomorphological maps, land reclamation and land-use datasets, and official records of mining and engineering activities. A deformation feature was attributed to a specific process only when its spatial extent showed strong geometric consistency with known natural or anthropogenic structures—such as tailings ponds, open-pit mine boundaries, mining panels, spoil heaps, or reclaimed coastal areas.
(2) Characteristic deformation signatures: Distinct deformation patterns served as diagnostic indicators for different geohazard types. Mining-induced subsidence typically appears as large, funnel-shaped subsidence basins with sharp boundaries that align with underground extraction zones; landslides are characterized by arcuate or tongue-shaped downslope displacement aligned with local topography; tailings pond and spoil heap deformation is confined within artificial embankments or fill boundaries; reclamation settlement presents as widespread, uniform subsidence over reclaimed coastal areas, reflecting progressive soil consolidation; and open-pit slope deformation is concentrated along pit walls, often exhibiting opposite displacement directions on opposing slopes. These morphological features serve as diagnostic “fingerprints” for identifying and classifying deformation phenomena in the InSAR results.
(3) Temporal evolution behavior: Where time-series deformation data were available, we analyzed temporal behavior to support causal interpretation. For example, acceleration following rainfall events suggested rainfall-induced slope movements; seasonal fluctuations correlated with groundwater or irrigation cycles indicated hydro-elastic settlement; and monotonic long-term trends reflected processes such as soil consolidation or extraction-induced subsidence.
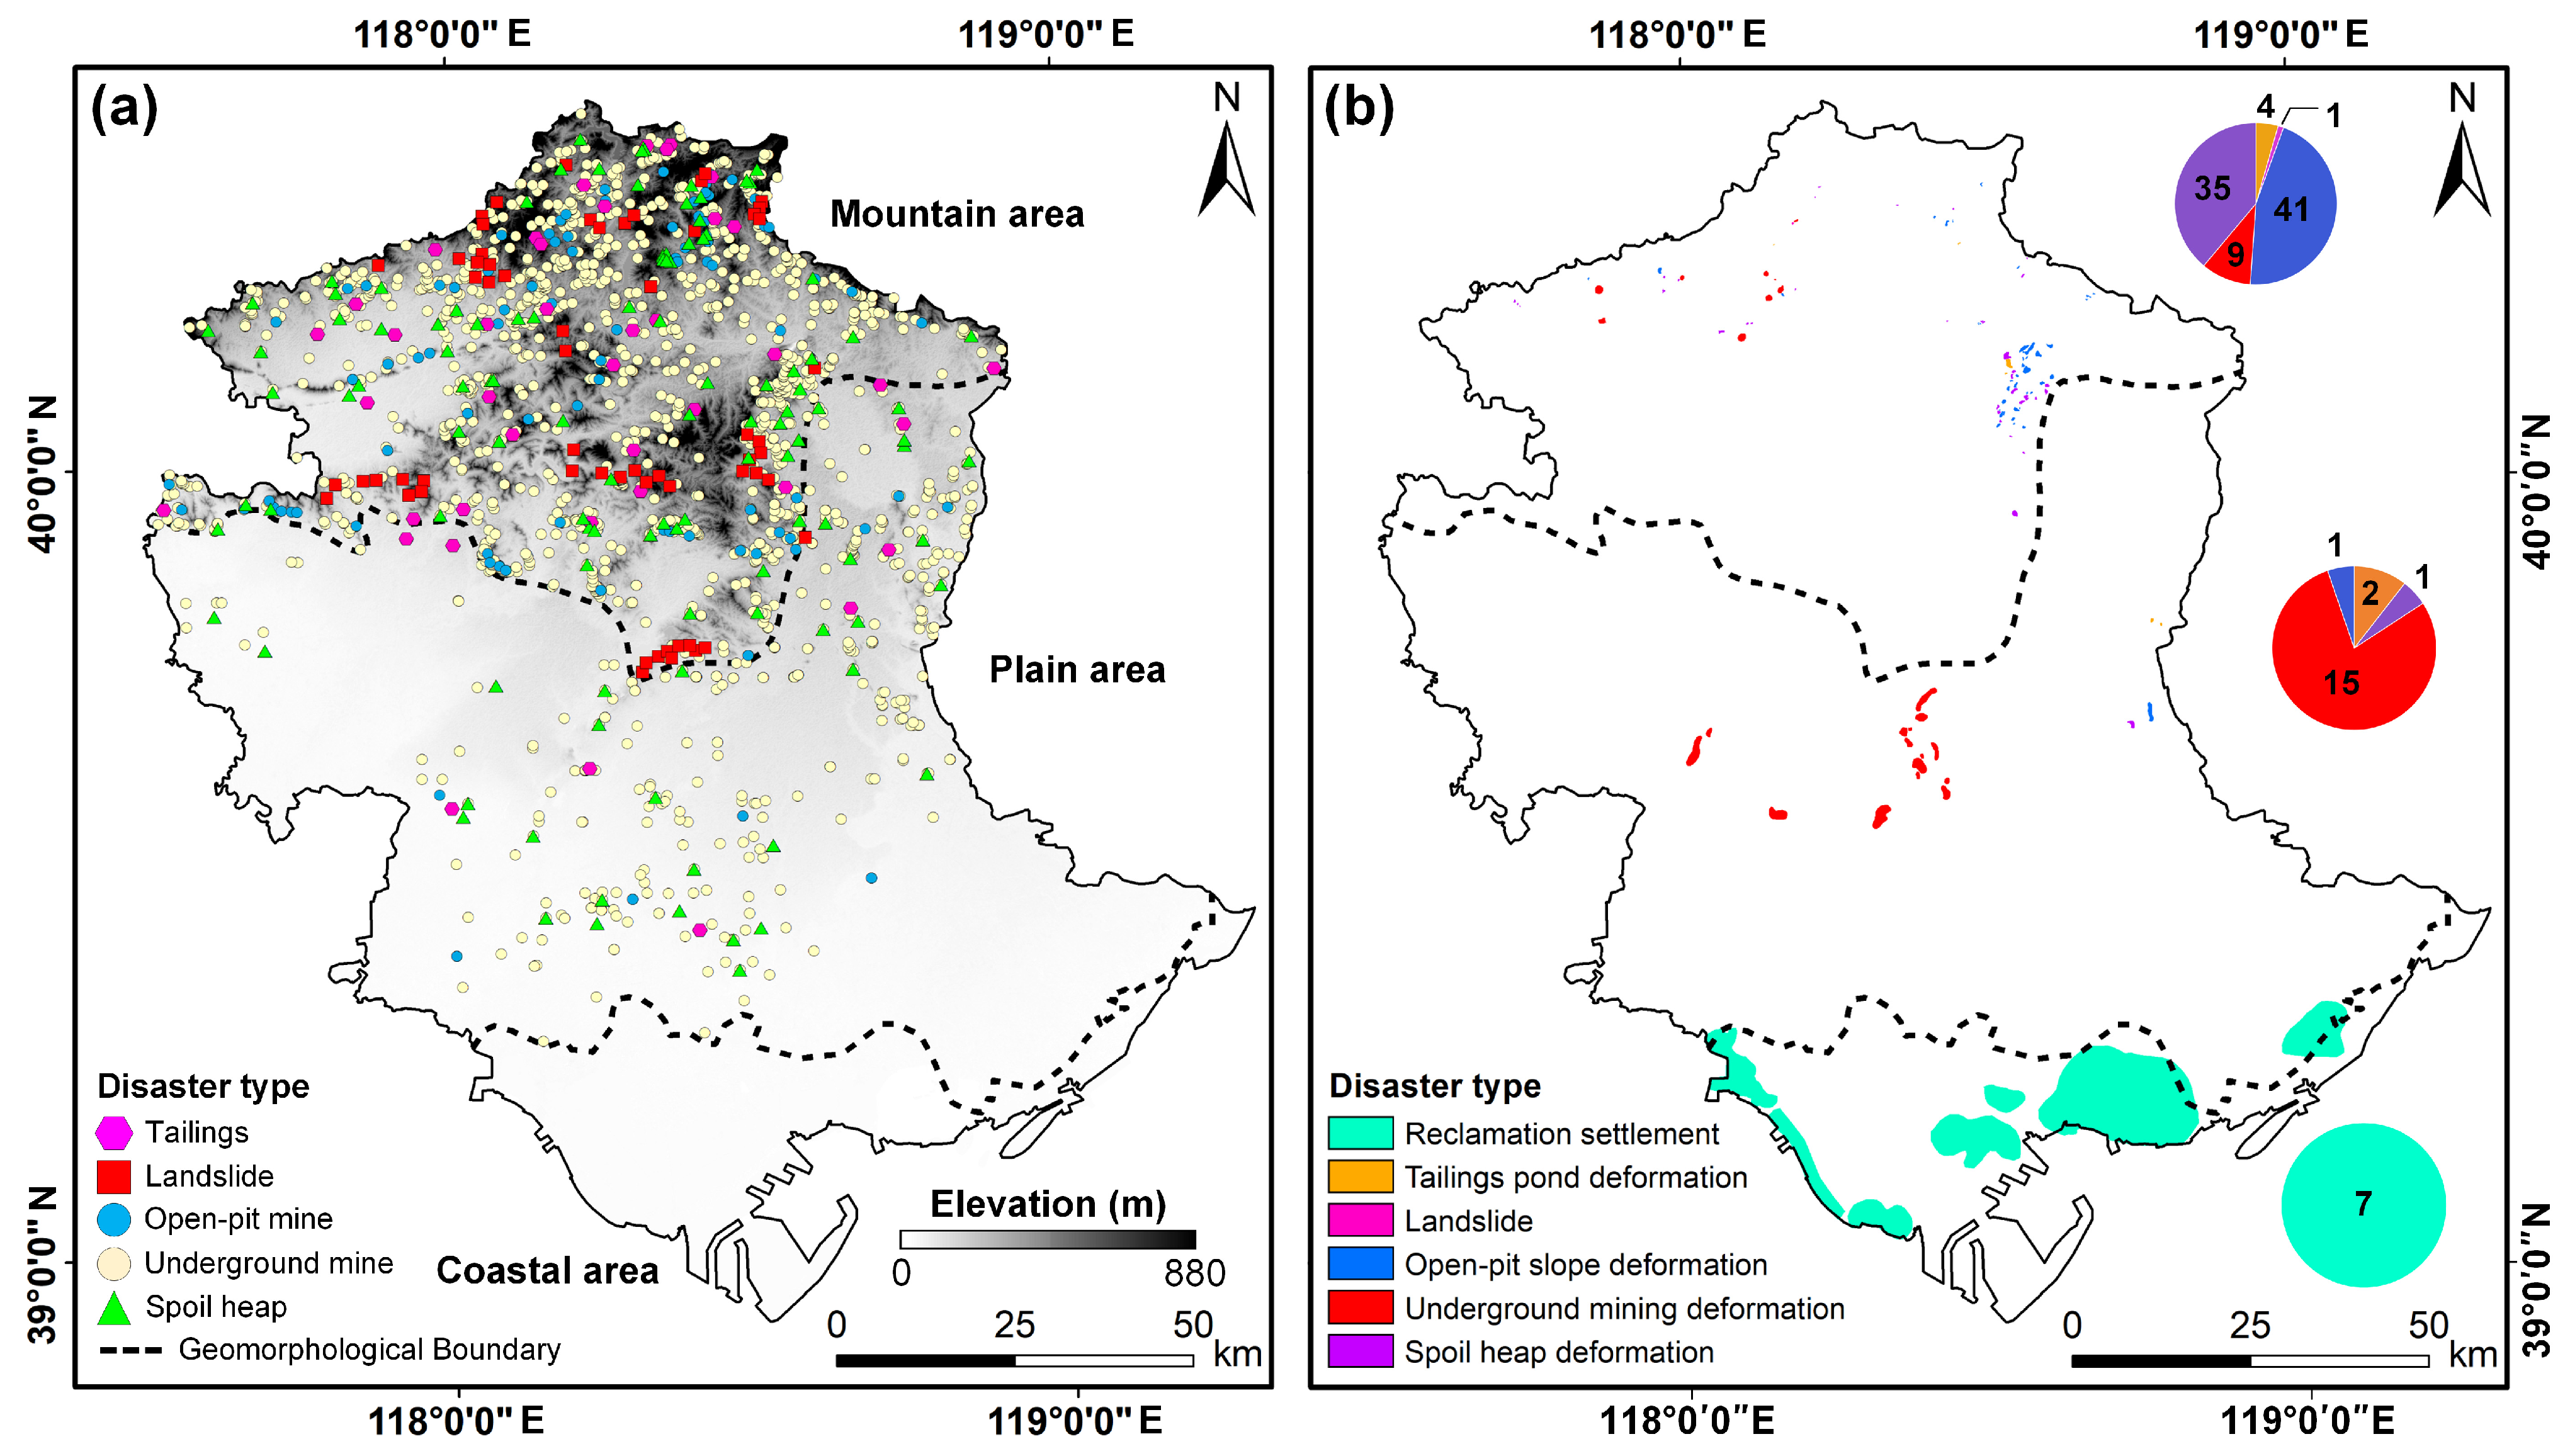
Figure 6a presents the spatial distribution of historically documented hazard sites (https://www.tangshan.gov.cn/zhuzhan/zxdc/20170721/409536.html, accessed on 18 June 2025), while Figure 6b displays the newly identified potential hazards derived from InSAR and optical imagery interpretation. The inventory results reveal that the spatial distribution of geohazards exhibits clear regularity and clustering, strongly correlated with regional topography and human activity intensity. (1) Northern mountainous area: 92 potential hazards were identified in this region. Slope deformation related to open-pit mining (41 sites) and spoil heap deformation (35 sites) dominate, highlighting the substantial impact of intensive engineering activities on the geological environment. Additionally, the area contains scattered occurrences of mining-induced subsidence (9 sites), tailings pond deformation (4 sites), and one landslide. (2) Central plain area: This area is characterized by mining-induced subsidence (15 sites), supplemented by sporadic occurrences of tailings pond deformation (2 sites), open-pit slope deformation (1 site), and spoil heap deformation (1 site). (3) Southern coastal reclamation area: All 7 identified potential hazards are classified as land reclamation settlement.

4.3. ICA-Derived Spatiotemporal Signals of Reclamation Settlement
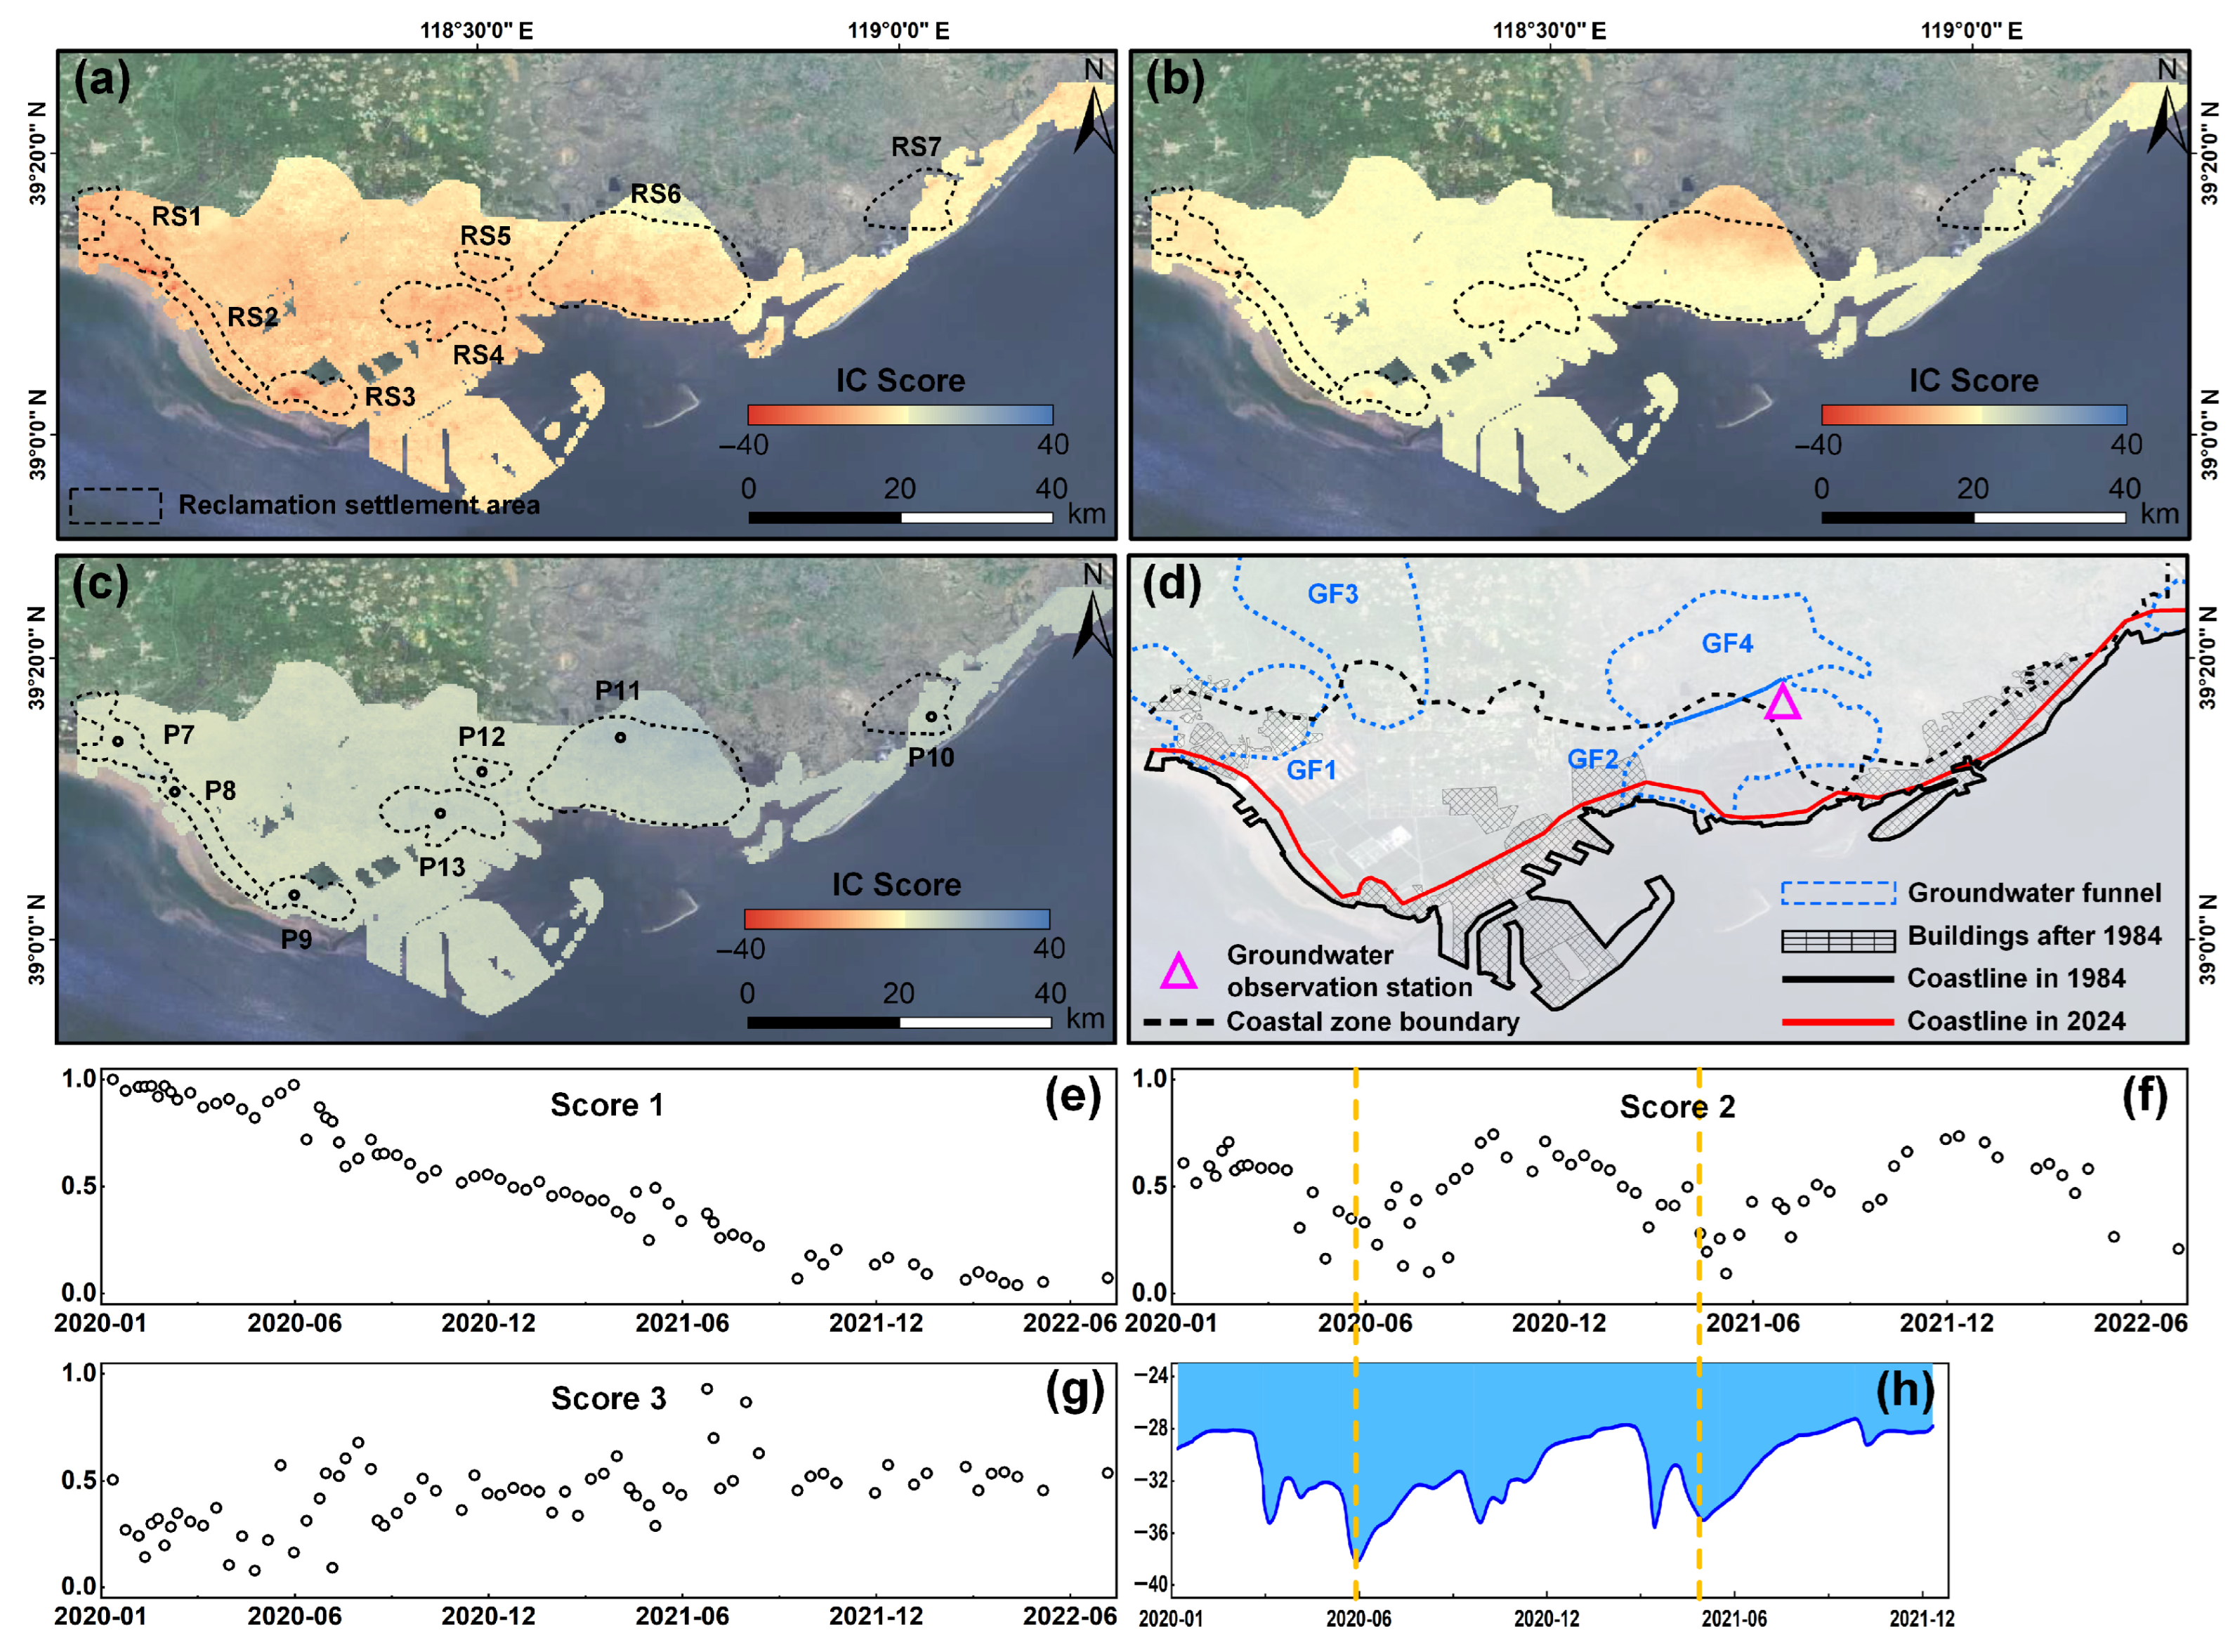
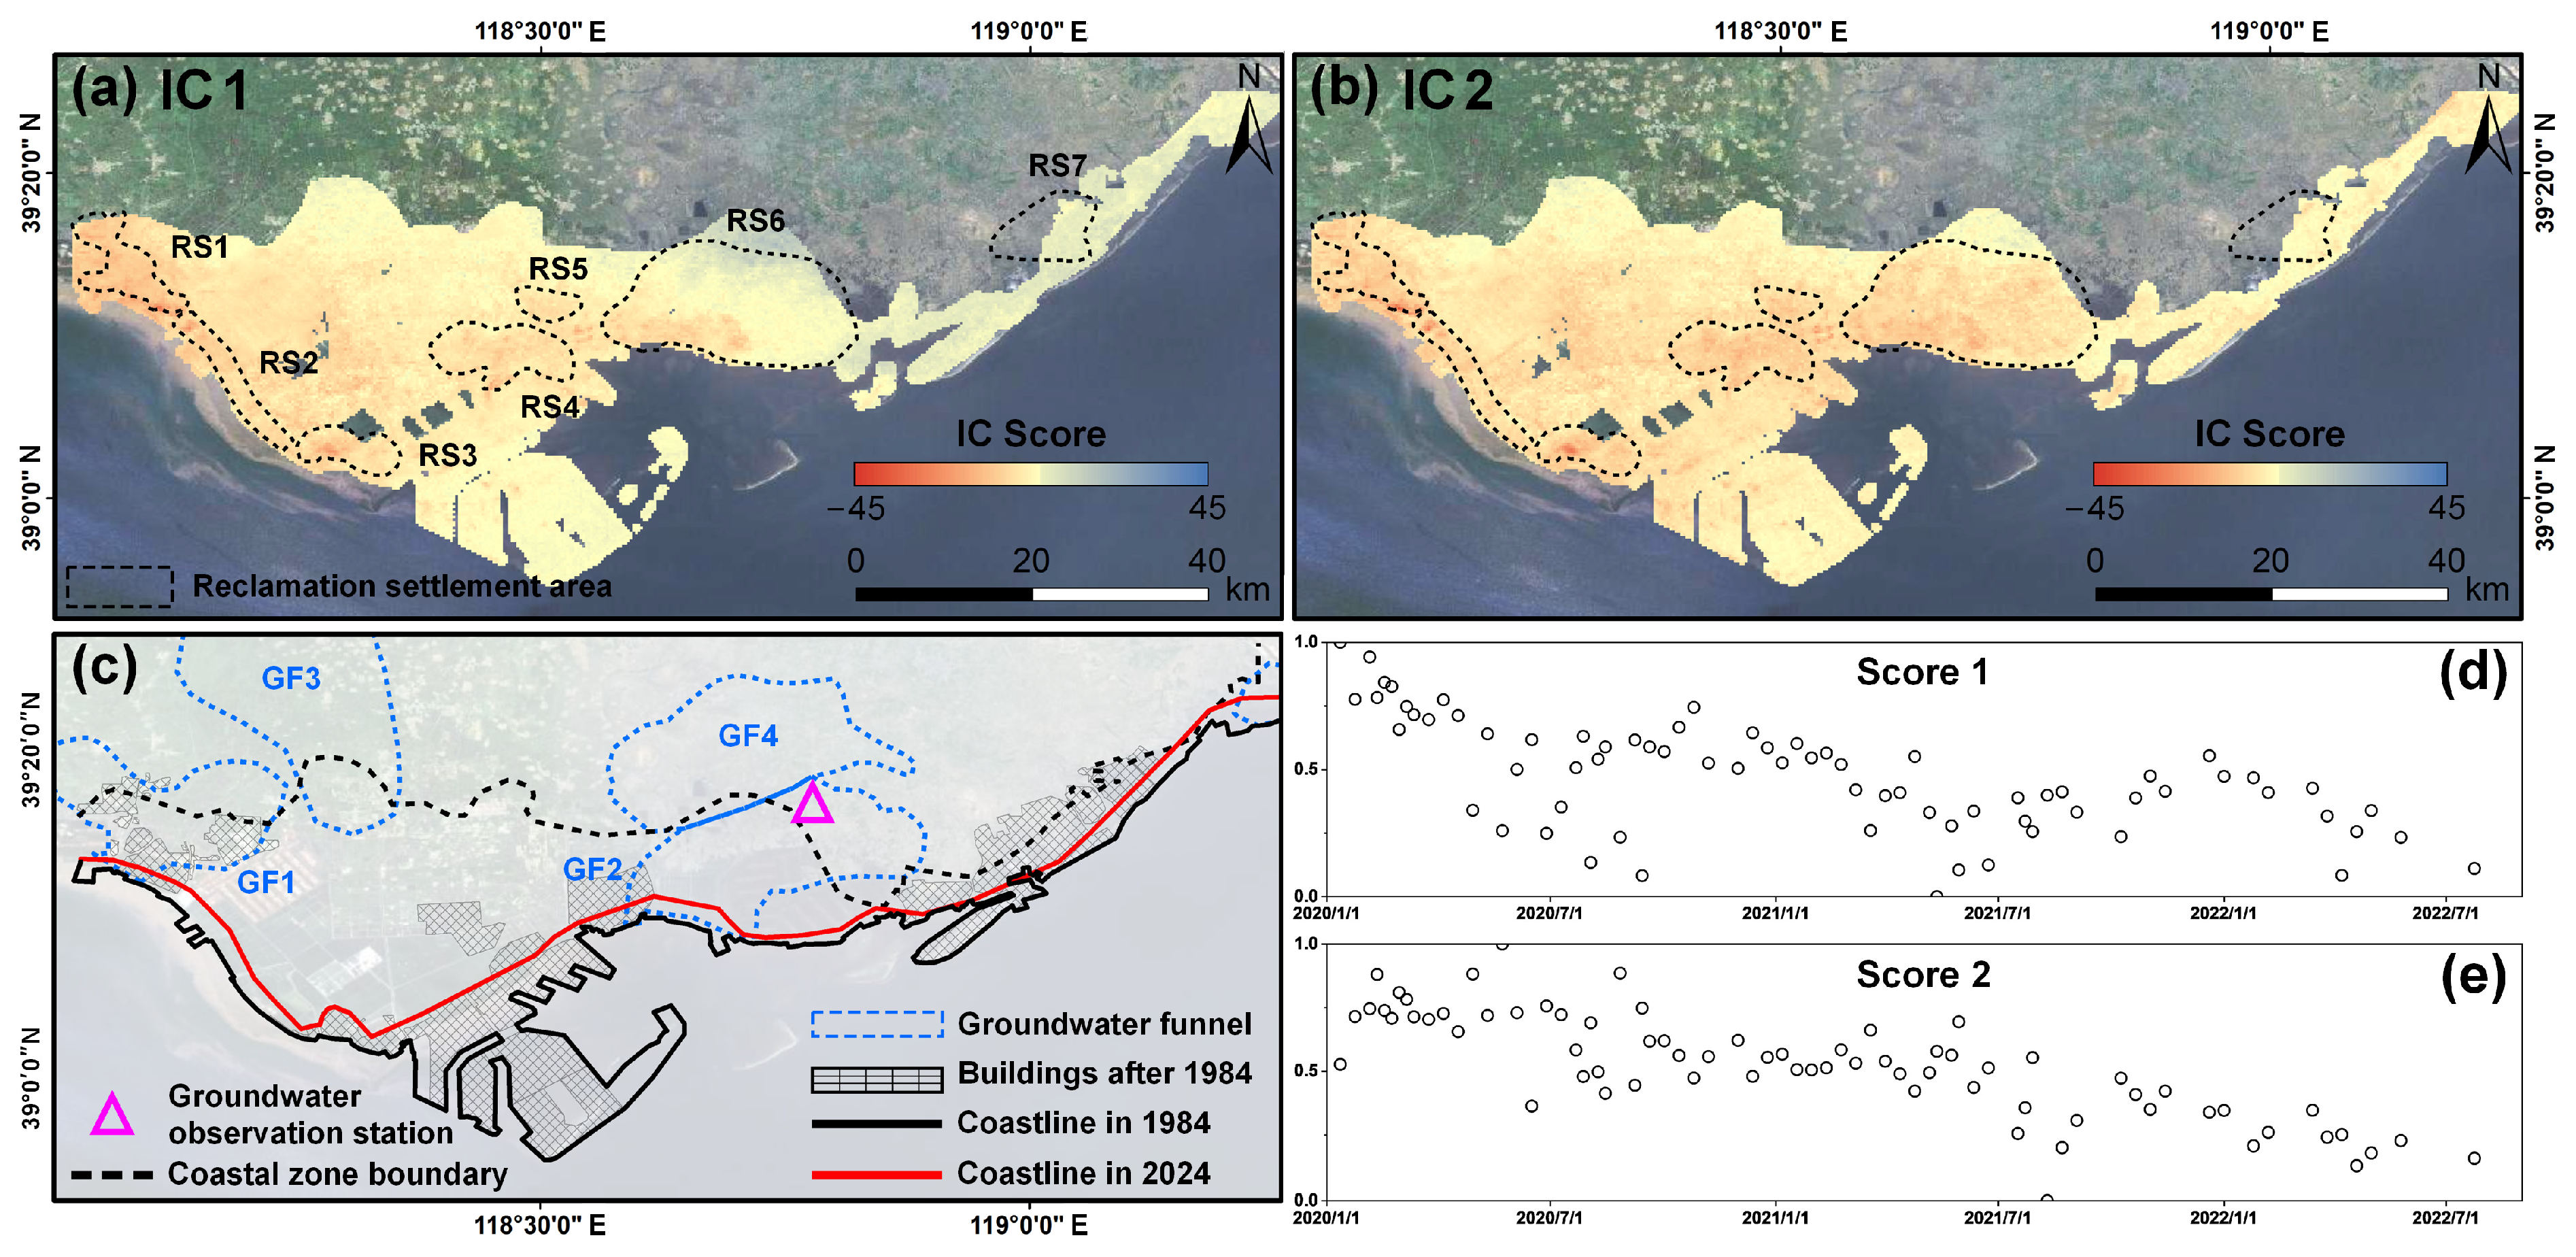
To further elucidate the multi-driver mechanisms underlying land reclamation settlement, we applied ICA to perform blind source separation on the InSAR-derived deformation field, aiming to extract dominant deformation modes with clear physical interpretations. Principal Component Analysis (PCA) was first employed for dimensionality reduction and to determine the intrinsic dimensionality of the dataset. The first three principal components accounted for 95.42%, 1.34%, and 0.47% of the total variance, respectively, collectively capturing the essential characteristics of the deformation field. We systematically tested varying numbers of potential independent components and confirmed that three components yielded the optimal decomposition outcome. The detailed evaluation procedure will be thoroughly elaborated in the Discussion section. Figure 7 presents the three statistically significant ICs separated by ICA from the mixed signals: Figure 7a–c depicts the spatial influence extent and intensity of each IC, while Figure 7e–g shows their normalized temporal scores, revealing distinct evolutionary trends. Together, these components constitute the fundamental spatiotemporal structure of deformation in the study area.
IC1 exhibits a spatially extensive pattern (Figure 7a) that aligns with major settlement zones (RS1–RS7). Its temporal evolution (Figure 7e) demonstrates a near-linear, long-term trend. IC2 shows a spatially localized pattern (Figure 7b) and a clear annual periodic signal in its time series (Figure 7f). IC3 displays a weak and spatially unstructured pattern (Figure 7c), with a temporally noisy and non-periodic evolution (Figure 7g).
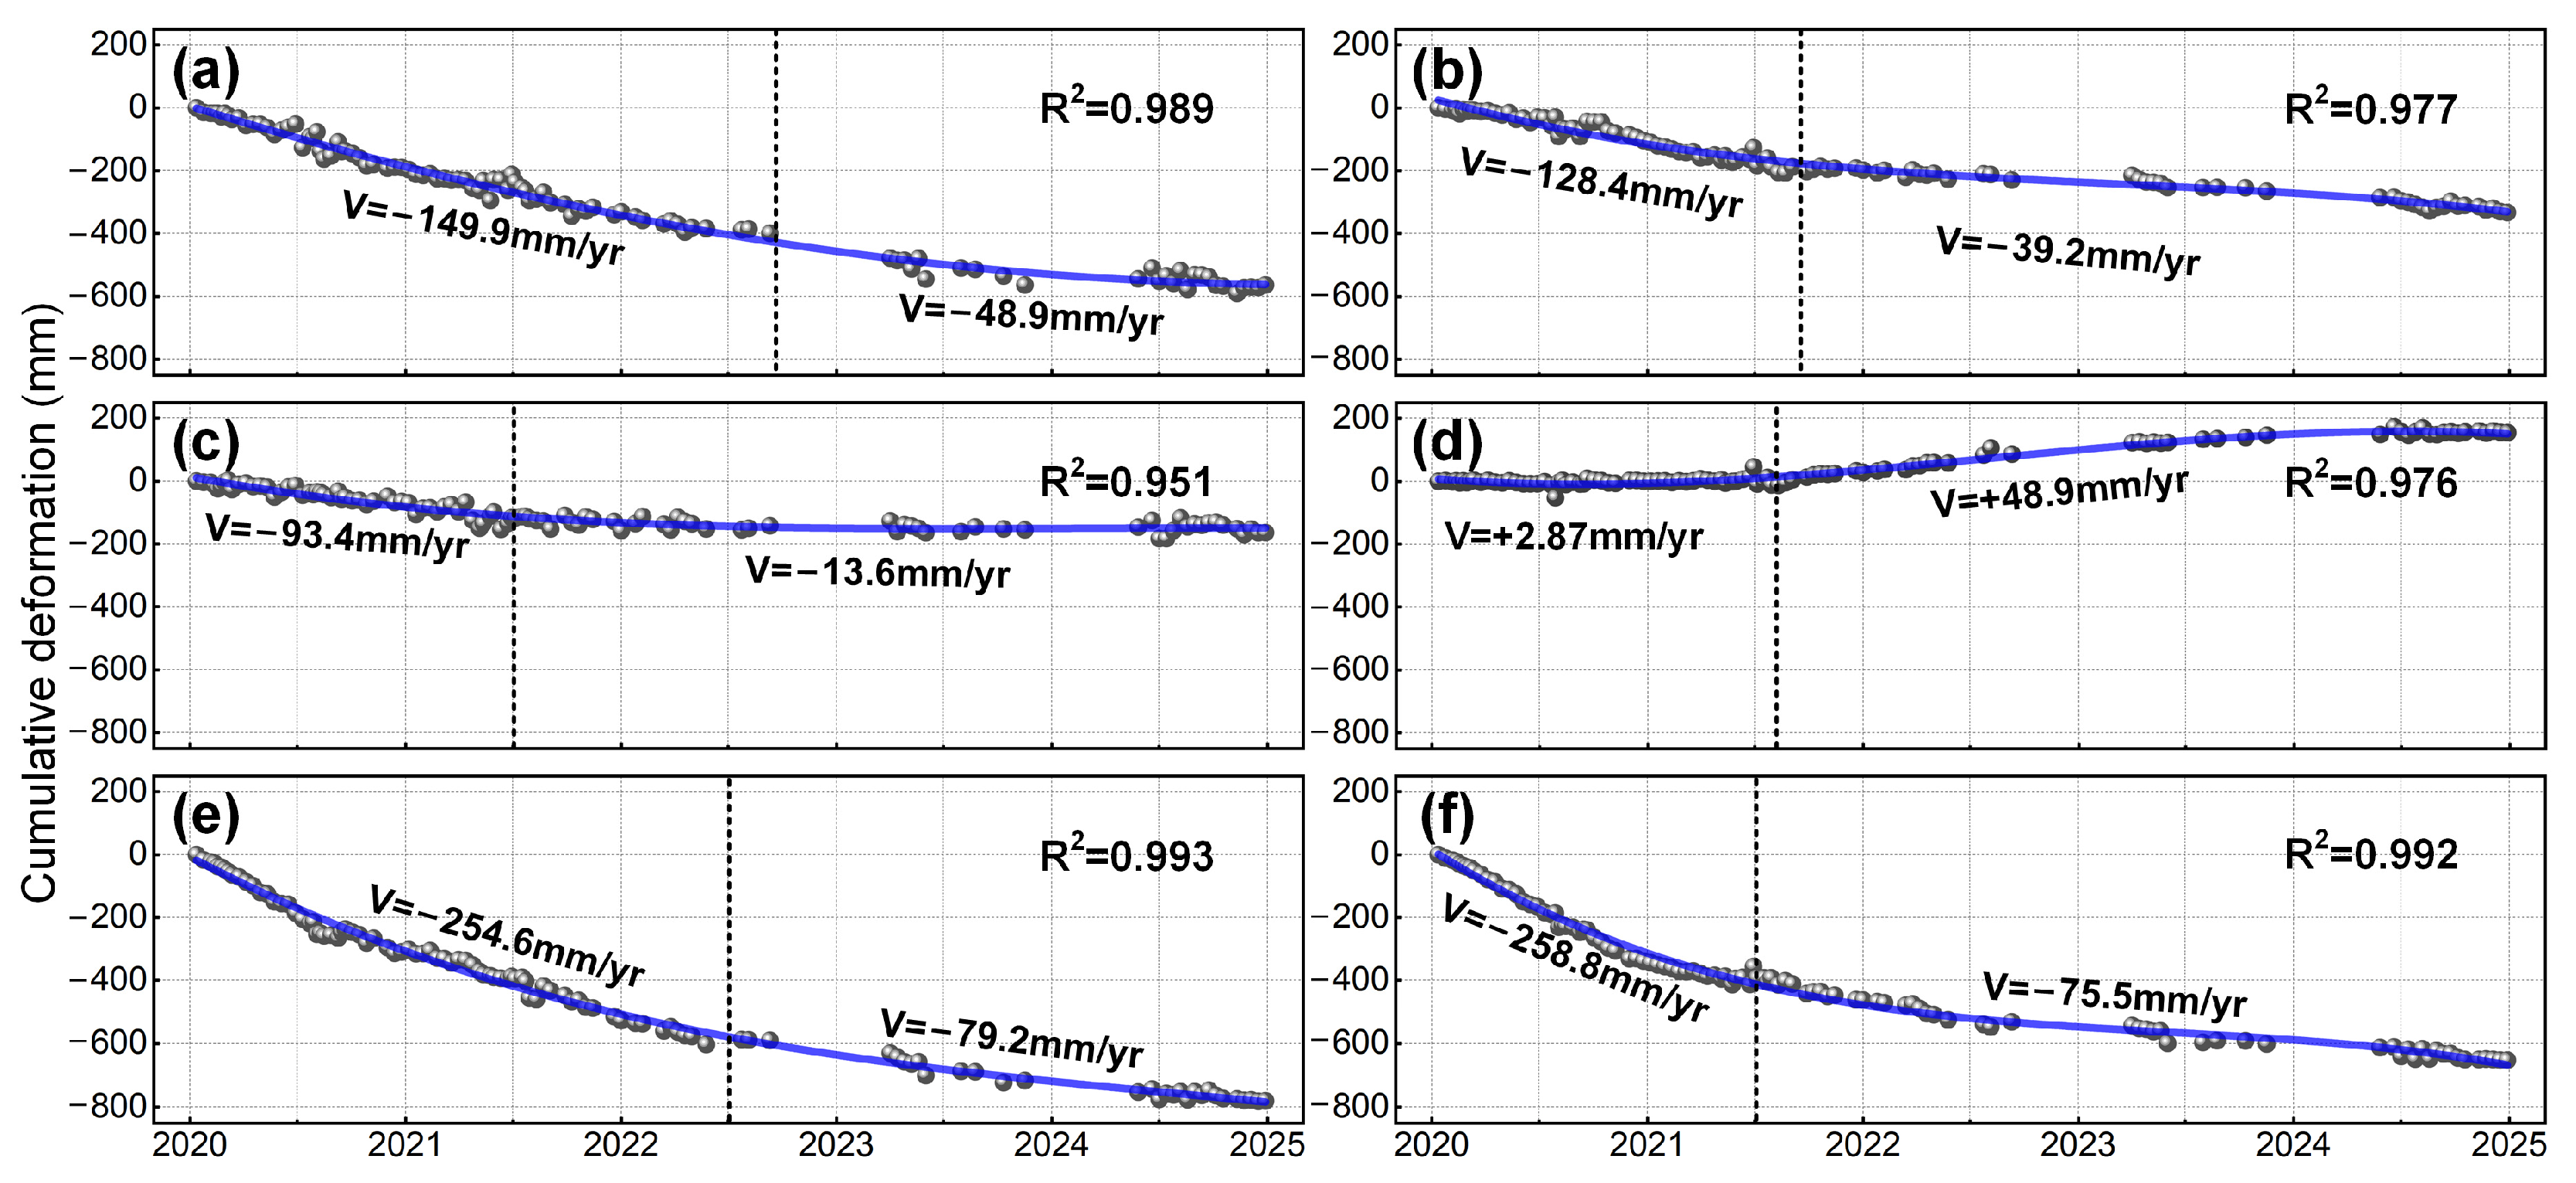
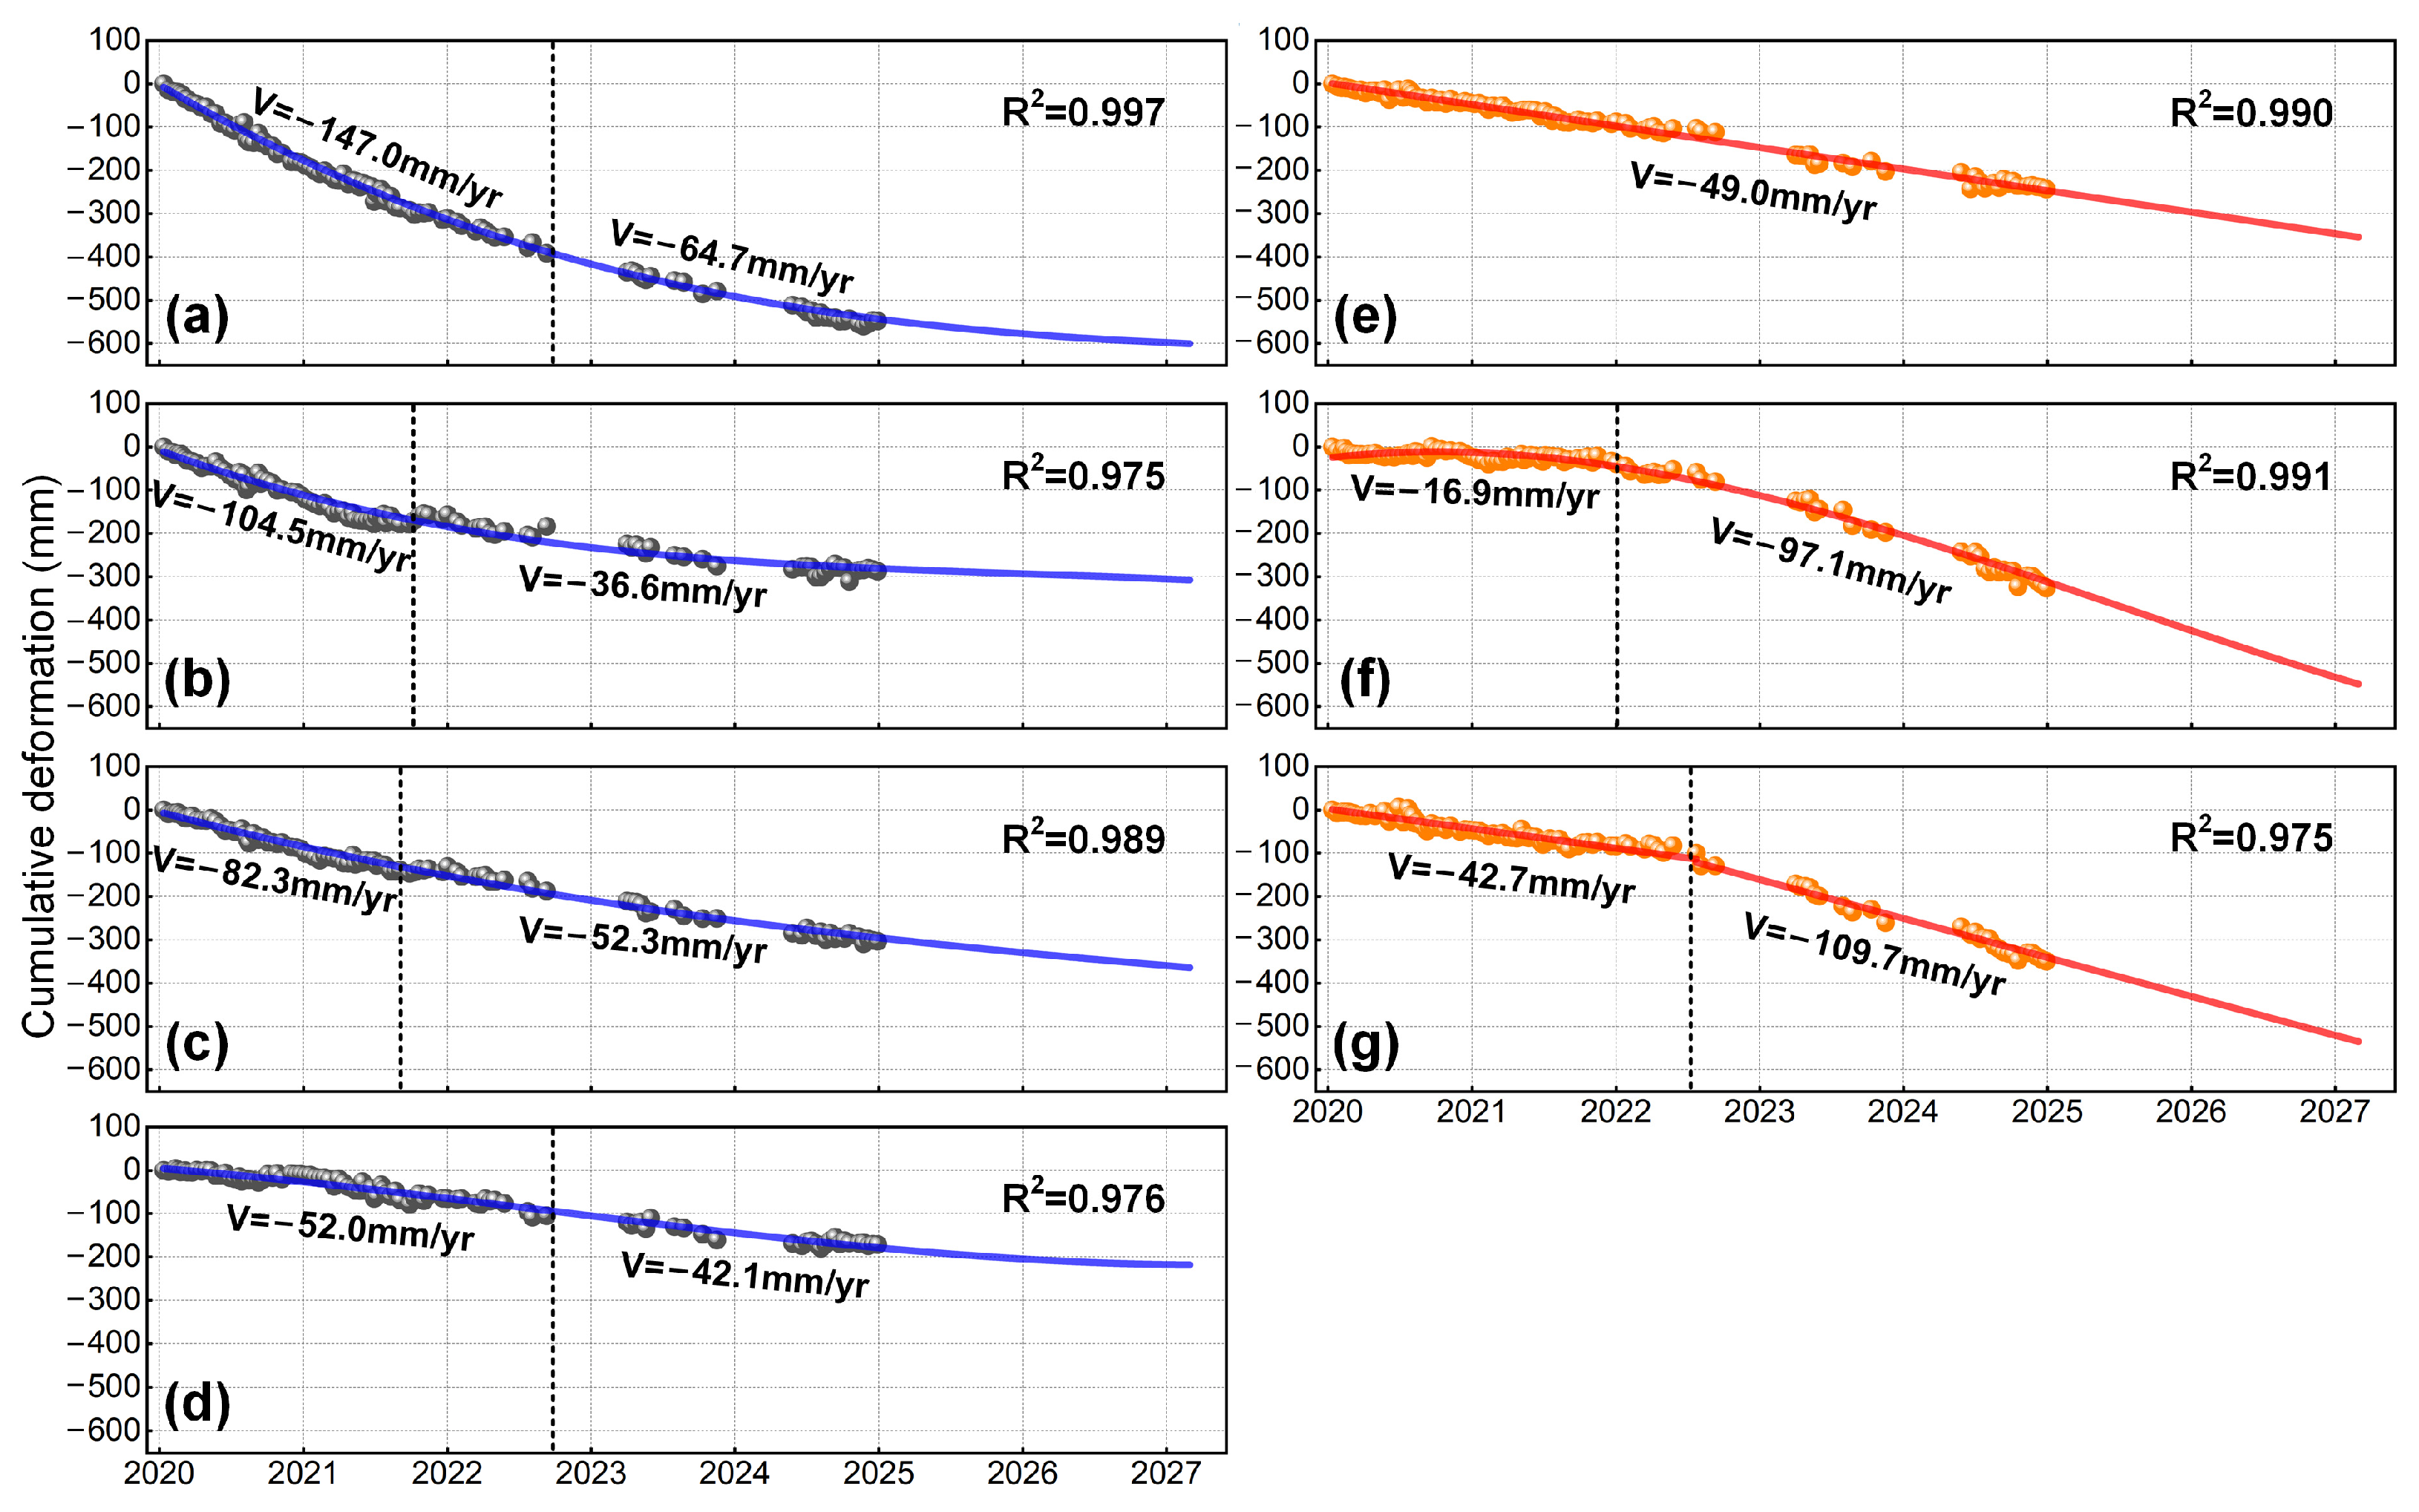
Furthermore, to characterize the local deformation evolution, time-series displacements were extracted from representative sites (P7–P13) within each settlement zone (RS1–RS7). The results, displayed in Figure 8, reveal coexisting decelerating (RS1, RS2, RS3, RS7) and accelerating (RS4, RS5, RS6) subsidence trends across the coastal area.
Figure 8. Time-series deformation at the seven coastal subsidence zones (RS1–RS7). (ag) correspond to results from sites P7 to P13, representing subsidence zones RS1, RS2, RS3, RS7, RS6, RS5, and RS4 (as annotated in Figure 9), respectively.
Applsci 15 12584 g008

5. Discussion

5.1. Implications of 2D Deformation and Validation Strategy in Mining Areas

As detailed in Section 4.1, the mining-induced subsidence zones in the central plain were masked during the cross-validation of ascending and descending InSAR datasets. This decision was premised on existing studies [40] indicating that significant horizontal displacements occur in these areas, violating the fundamental assumption of predominantly vertical deformation required for a meaningful comparison of LOS-derived vertical velocities.
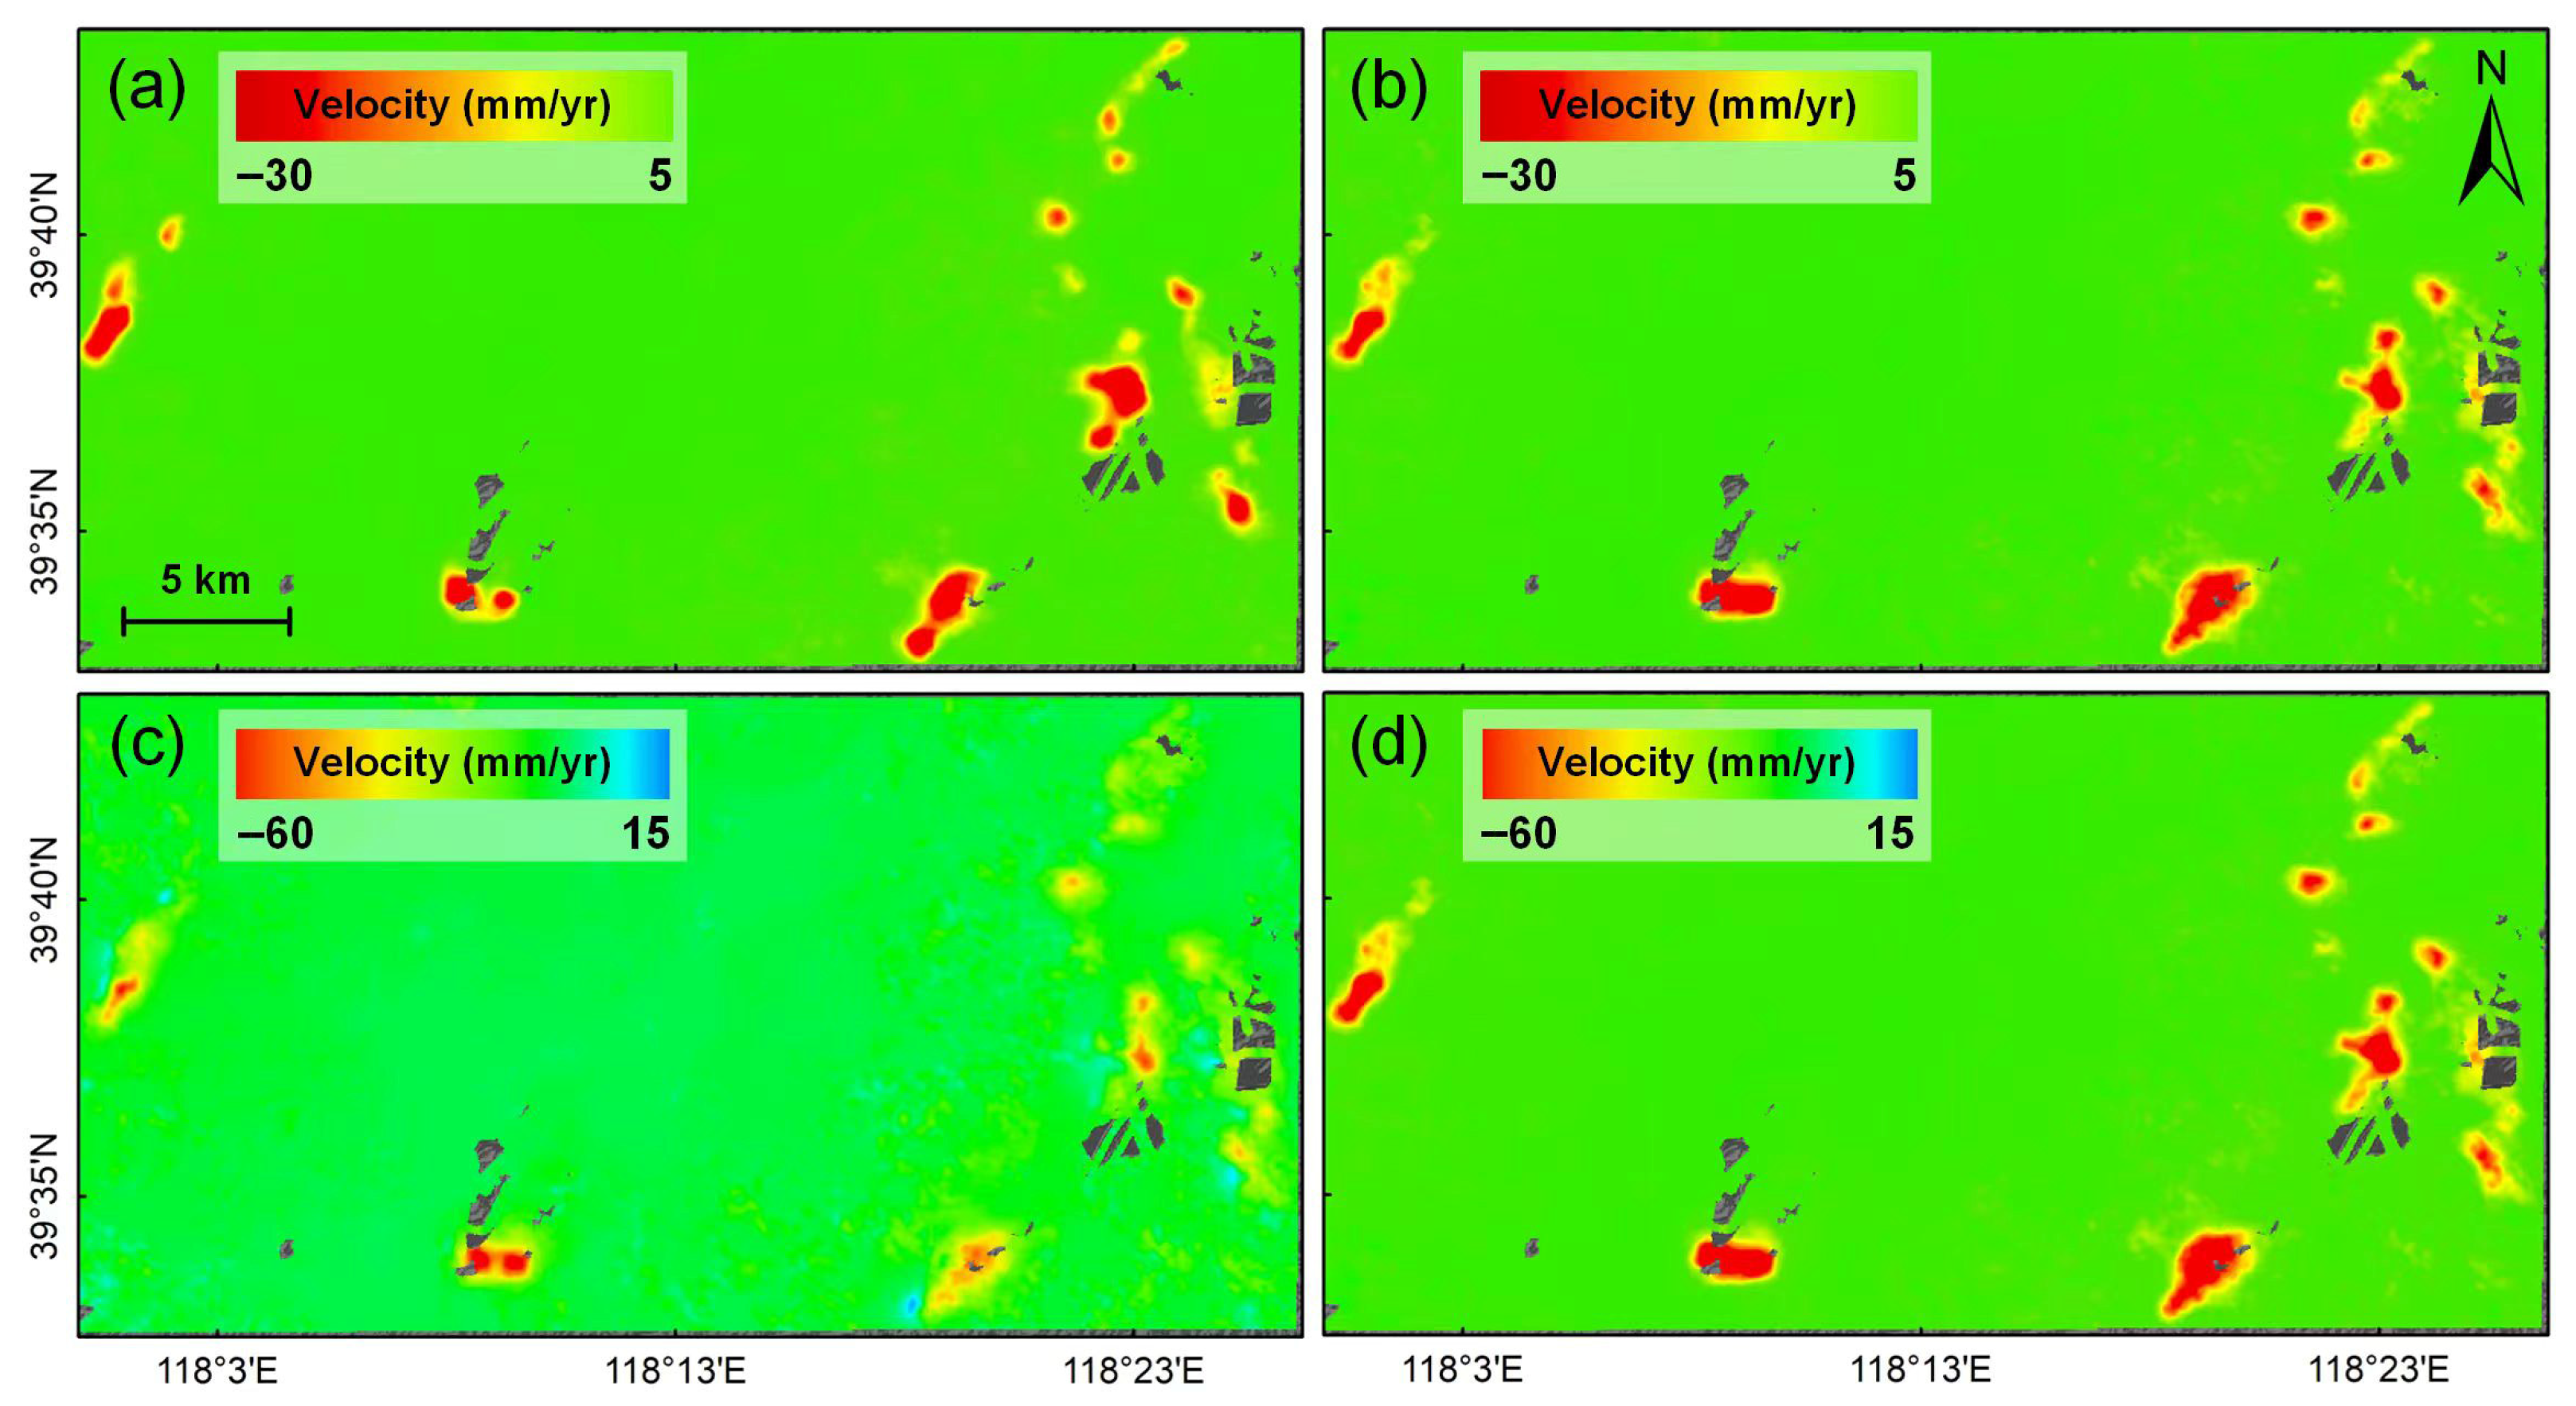
To quantitatively validate this premise and elucidate the full deformation mechanism, we decomposed the LOS measurements from both orbits into vertical and east-west components:
d l o s a s c d l o s d e s c = c o s θ a s c s i n θ a s c c o s α a s c c o s θ d e s c s i n θ d e s c c o s α d e s c d V d E W
where dlos denotes LOS deformation, α the satellite heading angle, θ the incidence angle, dEW the east-west deformation, and dV the vertical deformation, the 2D deformation field (Figure 9c,d) was resolved via least-squares estimation. This provides direct evidence that:
(1) Pronounced horizontal movements: The mining subsidence zones exhibit substantial east-west deformation (Figure 9c), with magnitudes reaching approximately one-third of the vertical subsidence (Figure 9d). This demonstrates that the deformation mechanism is intrinsically three-dimensional, dominated by horizontal strain and lateral movement towards the center of the goaf, rather than simple vertical compaction.
(2) Justification for masking: The presence of such significant non-vertical displacement invalidates the simple projection of LOS observations onto the vertical direction. In areas with complex 3D deformation, the LOS measurement is a composite signal sensitive to both vertical and horizontal movements [46]. Projecting these mixed signals would result in substantial and systematic errors in any cross-validation exercise.
Therefore, the 2D decomposition results robustly confirm that our strategy of excluding these complex deformation zones from the region-wide vertical validation was not only reasonable but necessary. It underscores the importance of diagnosing the deformation mechanism before selecting an appropriate validation methodology. This approach ensures that the reliability assessment of the InSAR results is based on a physically sound foundation and is not biased by areas where the underlying geometric assumptions are violated.

5.2. Spatiotemporal Patterns and Underlying Causes of Multi-Geohazards

Building upon the geohazard inventory systematically compiled in Section 4.2, this section delves into the interpretation of the observed spatiotemporal patterns and explores their underlying causes in the context of the regional geological setting and anthropogenic activities.
1. Spatial zonation and its drivers
The spatial distribution of geohazards in Tangshan City exhibits a pronounced zonation pattern, closely aligned with the tripartite geomorphological structure (Figure 6).
Northern mountainous area: The dominance of slope-related hazards (open-pit slope deformation and spoil heap deformation) is a direct consequence of intensive mining engineering activities superimposed on complex topography and weathered rock masses. The high diversity of hazard types here underscores the severe disturbance of the geological environment by human engineering. The localized, high-magnitude deformation patches are characteristic of slope instabilities and consolidation processes within engineered structures like spoil heaps.
Central plain area: The concentration of large-scale, basin-shaped mining-induced subsidence is unequivocally controlled by the presence of underground goafs resulting from long-term extraction. The immense spatial extent and magnitude of these subsidence zones reflect the scale of underground mining operations and the subsequent ground response.
Southern coastal reclamation area: The exclusive presence of widespread reclamation settlement is a direct outcome of large-scale land creation projects. The spatial congruence between the settlement zones and the historical reclamation boundaries (Figure 6a,d), combined with the substantial deformation magnitudes, points to the ongoing consolidation of dredged fills and the influence of static loads from infrastructure.
2. Deformation mechanisms and temporal evolution
To better understand the deformation patterns and evolutionary behavior of different geo-hazards, Figure 10 and Figure 11 present representative examples and corresponding time-series displacements for the six hazard categories, respectively. In all cases, the InSAR-derived deformation fields correspond well with features visible in optical imagery, confirming the reliability of the inventory. The deformation characteristics of each hazard type are summarized as follows:
  • Reclamation settlement (Figure 10a,b): The time series shows a continuous decelerating trend (Figure 11a), indicating that primary consolidation is in its final phase and that the foundation is likely to stabilize in the near future.
  • Tailings pond deformation (Figure 10c,d): Both the eastern and western dam sections exhibit significant movement away from the satellite, governed mainly by vertical compression and consolidation of the dam materials. The notable slowdown in deformation suggests that consolidation is nearing completion (Figure 11b).
  • Landslide (Figure 10e,f): The slope shows characteristic downslope movement. Since June 2021, the deformation rate has dropped to –13.6 mm/yr, with no seasonal fluctuations linked to rainfall, indicating currently low activity (Figure 11c).
  • Open-pit slope deformation (Figure 10g,h): This case displays typical instability patterns: the western slope moves southeast (away from the satellite) and the eastern slope moves northwest (toward the satellite). After June 2021, the deformation rate accelerated from 2.87 mm/yr to 48.9 mm/yr, reflecting rapid slope degradation that requires immediate monitoring and early warning (Figure 11d).
  • Mining-induced subsidence (Figure 10i,j): This type is marked by large, contiguous subsidence zones with sharp boundaries and high magnitudes. Although the rate decreased from –254.6 mm/yr to –79.2 mm/yr after June 2022, it remains considerable, indicating ongoing risk and the need for continued monitoring (Figure 11e).
  • Spoil heap deformation (Figure 10k,l): Deformation is mainly caused by self-weight consolidation of the piled material. Although the trend is decelerating, the rate remains high (–75.5 mm/yr) (Figure 11f). Given the considerable height of the heap, there is a notable risk of lateral collapse or sliding, necessitating sustained monitoring.
3. Limitations and InSAR Suitability
It is noteworthy that the current InSAR-based inventory did not detect significant deformation signals in Tangshan’s main urban area, a known karst collapse-prone zone. This absence highlights the inherent limitations of InSAR technology in monitoring such geohazards. First, the spatial scale of karst collapse—typically on the order of meters [47,48]—is considerably smaller than an InSAR pixel (approximately 40 m), causing associated deformation signals to be averaged out and undetectable. Second, InSAR is most sensitive to slow, cumulative deformation, whereas karst collapse often occurs as a sudden event, representing a fundamental mismatch in temporal characteristics. Therefore, the present findings only indicate the absence of large-scale, gradual subsidence in this area during the monitoring period and do not preclude the potential risk of sudden collapse. Future monitoring efforts should integrate higher-resolution remote sensing data with ground-based methods to better address this gap.
In summary, the spatiotemporal patterns of geohazards in Tangshan are not random but are systematically governed by the interplay between distinct geomorphological units and the type, intensity, and history of human engineering activities. This understanding is vital for targeted risk mitigation and sustainable urban planning.

5.3. Determination of the Optimal Number of ICA Components

The determination of the optimal number of ICs is a critical step in the application of ICA for blind source separation. In this study, the selection of three components was not arbitrary but was guided by a systematic, data-driven procedure combining statistical criteria and physical interpretability.
1. Preliminary dimensionality estimation via PCA
Prior to ICA, Principal Component Analysis (PCA) was employed to reduce data dimensionality and estimate the intrinsic number of dominant signals within the InSAR-derived deformation field of the southern coastal reclamation area. The first three principal components (PCs) accounted for 95.42%, 1.34%, and 0.47% of the total variance, respectively, resulting in a cumulative variance contribution of 97.23%. This indicated that the first three PCs sufficiently captured the essential characteristics of the deformation data, providing a preliminary statistical basis for setting the number of ICA components to three.
2. Systematic testing and comparative evaluation
We systematically tested models with two (K = 2), three (K = 3), and four (K = 4) independent components, evaluating each based on statistical independence and physical interpretability.
(1) Two-component model (K = 2): inadequate separation
The two-component model proved insufficient for effectively separating the complex deformation signals (Figure 12). Statistically, the two components failed to achieve a high degree of independence, leading to the mixing of distinct physical mechanisms. Specifically, the temporal evolution of IC1 contained both a long-term trend and seasonal oscillations (Figure 12d). Physically, the spatial pattern of IC2 exhibited an anomalous and unexplainable uplift signal in the RS6 area (Figure 12a), which is inconsistent with all known surface processes and the original InSAR measurements. These limitations confirmed that a two-component model was inadequate, leaving key driving mechanisms conflated.
(2) Four-component model (K = 4): redundancy and lack of independence
The four-component model introduced a redundant fourth component. Statistically, the fourth principal component increased the cumulative explained variance only marginally, from 97.23% to 97.86%. The resulting IC4 was not statistically robust; its temporal evolution was weak and noisy, lacking any meaningful trend or periodicity (Figure 13i). This indicates that the fourth component did not represent a new, independent source signal but rather reflected fragmented noise or numerical artifacts from the separation process.
The three-component model was objectively determined to be the optimal configuration for characterizing the deformation mechanisms in the coastal reclamation area. As substantiated by the systematic evaluation against two- and four-component models, the K = 3 configuration provides the most effective balance between model complexity and signal representation. The statistical independence among the three components and their distinct physical interpretability—which will be thoroughly elaborated in Section 5.4—collectively demonstrate that this model successfully captures the primary deformation processes without over-fitting or redundancy. Consequently, the three-component ICA model stands as the optimal representation of the dominant deformation mechanisms in Tangshan’s coastal reclamation area.

5.4. Driving Mechanisms of Coastal Reclamation Settlement Unraveled by ICA

Building upon the spatiotemporal signals of the ICs presented in Section 4.3, this section establishes a rigorous, mechanism-oriented interpretation by correlating each IC with specific physical drivers and their spatial manifestations. The ICA decomposition successfully disentangles the complex settlement signal into three statistically independent components, each representing a distinct deformation mechanism.
(1) IC1: Long-term irreversible settlement component
IC1 characterizes the trend settlement in the southern coastal area of Tangshan from 2020 to 2024. Its spatial distribution (Figure 7a) closely aligns with seven major settlement zones (RS1-RS7), while its time series (Figure 7e) displays an approximately linear long-term trend, indicating a persistent and irreversible settlement process. This process results from the combined effects of the following factors: ① Natural consolidation and compression of reclamation materials under gravity [49,50]; ② Sustained loading from large-scale construction carried out between 1984 and 2024 (Figure 7d) [51]; ③ Increased effective stress due to long-term over-exploitation of deep confined aquifers, where the regional hydraulic head declined by up to 30 m between 1980 and 2015 [52], resulting in plastic (irreversible) compaction of the aquifer system.
Among the seven coastal settlement zones, RS1 and RS3 exhibit the strongest spatial loadings of IC1 (Figure 7a), identifying them as the core areas of long-term irreversible settlement. However, their driving mechanisms differ: RS1 is influenced by all three factors—natural consolidation, building loads, and aquifer compaction induced by groundwater extraction—whereas settlement in RS3 primarily stems from the first two mechanisms, namely natural consolidation combined with building loads. This difference may be attributed to RS1’s location within a densely built-up area overlying a historical zone of intensive groundwater extraction (Figure 7d). In contrast, deformation in RS2 and RS7 is mainly caused by natural consolidation of reclamation materials; RS4 is influenced by building loads; and RS6 is affected by groundwater extraction. Notably, settlement in RS5 cannot be directly attributed to any of the major driving factors identified. Its spatial location does not coincide with densely built areas or groundwater depression cones (Figure 7d), suggesting that localized factors may dominate its deformation behavior. Furthermore, the long-term trend of IC1 shows signs of deceleration, likely associated with restrictions on groundwater extraction implemented during the monitoring period [53], as well as the near-completion of soil compression and consolidation. Nevertheless, creep and permanent compaction of clay layers triggered by historical over-exploitation are expected to persist.
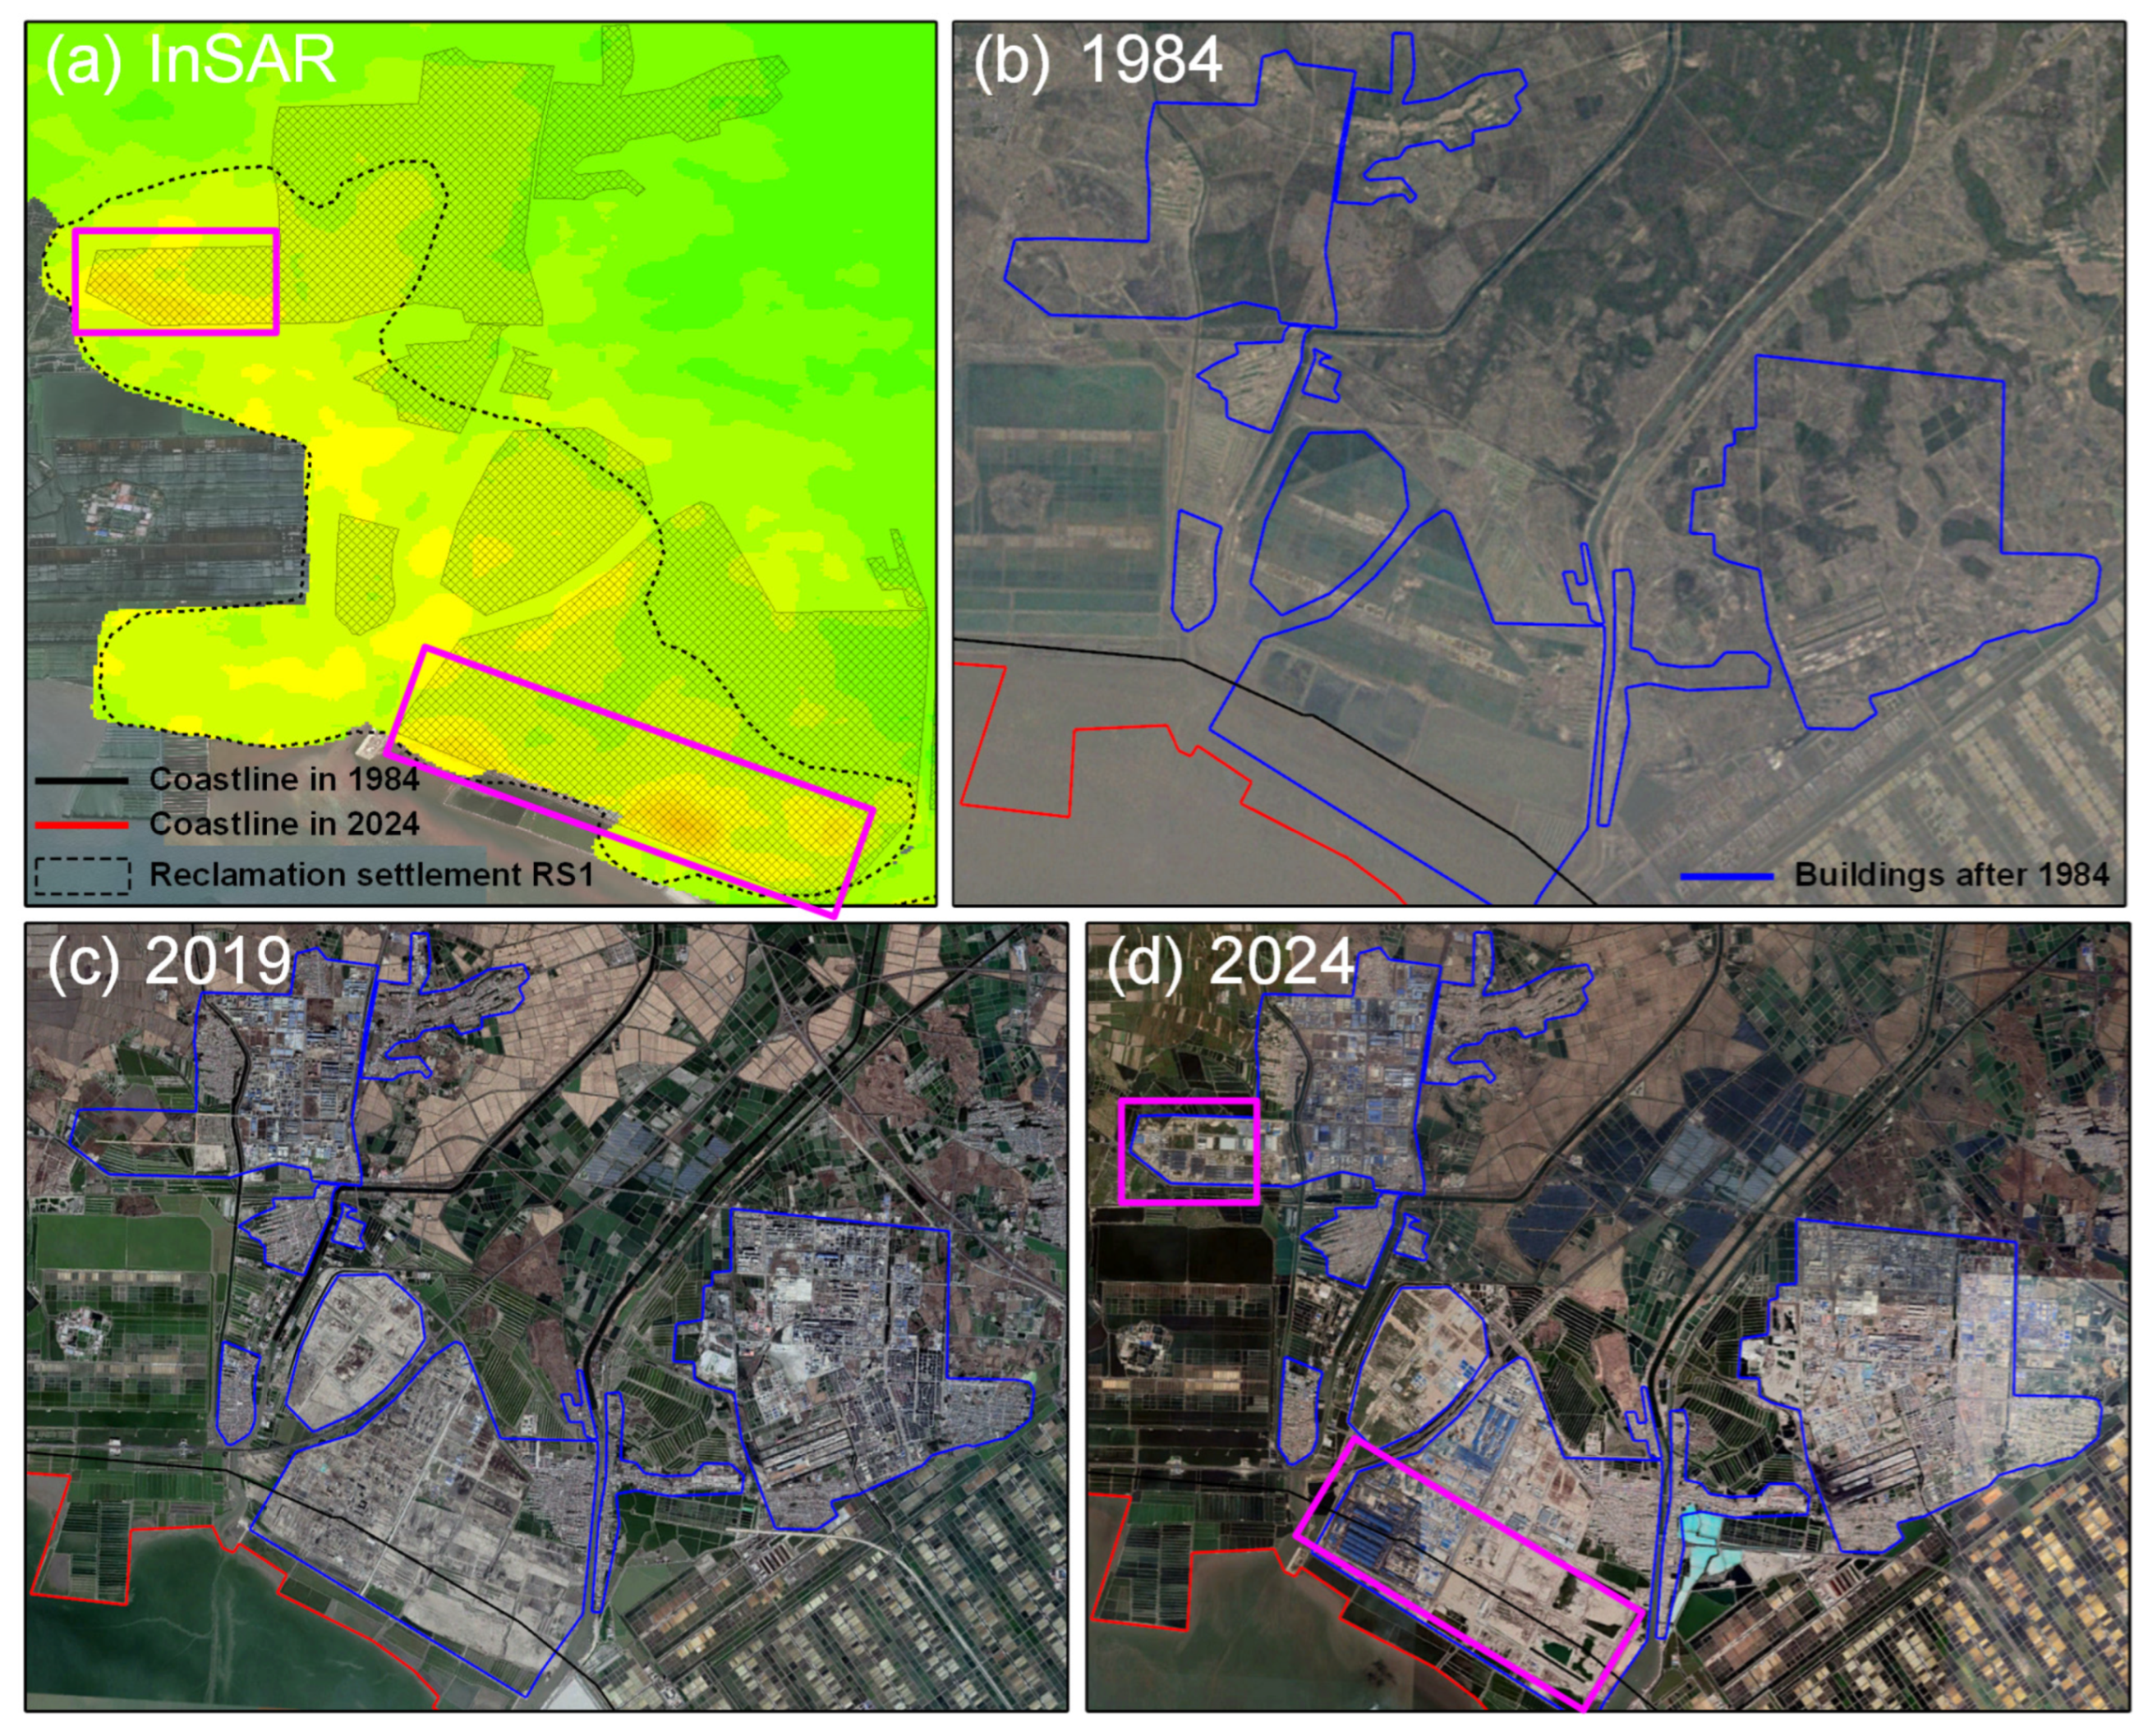
The analysis of Figure 14 reveals a clear correlation between the construction timeline of buildings and the magnitude of recorded surface deformation. Areas developed after 2019 (demarcated by magenta rectangles) exhibit significantly higher InSAR-derived settlement rates compared to zones with older structures. This pattern can be attributed to the time-dependent nature of soil consolidation under building loads. The older buildings, constructed prior to 2019, have already undergone a prolonged period of gradual settlement and subsoil compaction, resulting in a substantially decayed deformation rate. In contrast, the recently constructed areas are still undergoing primary consolidation, where the applied structural loads are actively compressing the underlying foundation materials, leading to more rapid and pronounced subsidence.
(2) IC2: Seasonal deformation linked to hydrological cycles
The spatial distribution of IC2 (Figure 7b) closely matches the extents of groundwater depression cones GF1, GF2, and GF4. Its time series (Figure 7f) exhibits clear annual-period seasonal oscillations. Comparison with in-situ groundwater level data from a monitoring well within the GF2 cone (Figure 7h) shows that this deformation signal closely matches groundwater level fluctuations, with a phase lag of ~15 days. The mechanism is tightly coupled with the regional hydrological cycle: during March–June, agricultural irrigation demand increases while precipitation is low and evaporation is high, leading to intensified groundwater extraction and declining water levels that accelerate surface subsidence. From July to September, reduced irrigation and concentrated rainfall facilitate aquifer recharge, allowing water levels to recover and subsidence to decelerate or rebound slightly.
(3) IC3: Minor signals and residual noise
IC3 corresponds to weak secondary deformation signals and residual noise in the InSAR observations. Its spatial pattern (Figure 7c) shows no clear correlation with major anthropogenic or natural features, and its temporal evolution (Figure 7g) lacks a coherent trend or strong seasonal periodicity. This component likely captures minor unmodeled signals, atmospheric delays, and inherent InSAR measurement errors [25,54]. The successful isolation of the dominant physical mechanisms into IC1 and IC2 is further validated by the unstructured nature of IC3.
Through ICA decomposition, we have successfully deconstructed the complex land reclamation settlement signal into three statistically independent components: long-term irreversible settlement (IC1), seasonal elastic deformation (IC2), and residual noise (IC3). The spatial superposition of these components clearly demonstrates the multi-driver nature of coastal land subsidence in Tangshan City, revealing that it results from the combined effects of natural consolidation of reclamation materials, building loads, groundwater extraction-induced aquifer compaction, and water table fluctuation-driven elastic deformation.
Furthermore, to elucidate the dynamic evolution characteristics of each settlement zone, we extracted deformation time series from representative locations within each area (Figure 8). The results indicate that both decelerating and accelerating subsidence trends co-occur across the study area. This spatial divergence essentially reflects differences in the evolutionary stages of the dominant settlement mechanisms among regions.
Specifically, the markedly decelerating deformation rates in RS1 (Figure 8a), RS2 (Figure 8b), RS3 (Figure 8c), and RS7 (Figure 8d) suggest that their settlement processes are transitioning from a rapidly developing “active phase” to a slowly progressing “decay phase.” These zones are located in earlier completed reclamation areas, where the driving forces of settlement are systematically weakening. In RS1, the effective implementation of groundwater extraction restrictions has significantly slowed aquifer compaction, while consolidation due to primary building loads is also approaching completion. RS2 and RS7, dominated by natural consolidation, exhibit a natural decay in settlement rate over time, consistent with soil consolidation theory. RS3 benefits mainly from the declining consolidation intensity following the main period of building load application.
In contrast, the accelerating deformation trends in RS4 (Figure 8g), RS5 (Figure 8f), and RS6 (Figure 8e) clearly indicate that these zones remain in an “active phase” of settlement or are subject to new disturbances. The acceleration in RS4 is most likely associated with renewed construction activity during the monitoring period, where additional loads have reactivated soil compression. In RS6, acceleration is directly linked to ongoing local groundwater extraction. Although the GF2 and GF4 groundwater depression cones in this area are under management, only a few urban zones are designated as restricted extraction areas under current policies [55]. This incomplete management has failed to fundamentally resolve regional groundwater over-extraction, leading to continued and even intensified aquifer compaction beneath RS6. The persistent anomalous acceleration in RS5 strongly confirms that its settlement is governed by localized, specific mechanisms not captured by the main ICA components. Possible causes include the presence of exceptionally thick, localized soft soil layers or subsurface processes such as concealed seepage, rendering its deformation behavior independent of the regional general pattern.

6. Conclusions

This study established an integrated “Detection–Decomposition–Interpretation” framework to systematically investigate the spatiotemporal patterns and formation mechanisms of multiple geohazards in Tangshan City. The main conclusions are as follows:
(1) Based on the high-precision surface deformation derived from SBAS-InSAR (2020–2024), six major types of geohazards were systematically identified and classified for the first time in Tangshan, including reclamation settlement, tailings pond deformation, landslides, open-pit slope deformation, mining-induced subsidence, and spoil heap deformation. A spatial inventory of 115 specific potential hazards was compiled. The results reveal clear spatial zonation: the northern mountainous area is dominated by open-pit-related slope and spoil heap deformations, showing the highest diversity of hazard types; the central plain is characterized by large-scale, basin-shaped subsidence controlled by underground goafs; and the southern coastal zone exhibits widespread land reclamation settlement.
(2) ICA-based blind source separation of the complex InSAR deformation signals successfully quantitatively resolved the multi-driver mechanisms in the coastal settlement area. These include long-term irreversible settlement (IC1), driven by the combined effects of natural fill consolidation, sustained building loads, and historical groundwater over-exploitation-induced aquifer compaction; and seasonal elastic deformation (IC2), synchronized with agricultural irrigation cycles and governed by groundwater level fluctuations. This approach enabled the quantitative separation of compound driving factors.
(3) The study identified coexisting “decelerating” and “accelerating” deformation trends across the settlement zones. Decelerating areas (RS1, RS2, RS3, RS7) indicate a transition to a “decay phase,” influenced by natural consolidation attenuation and policy interventions such as groundwater extraction restrictions. In contrast, accelerating zones (RS4, RS5, RS6) remain in an “active phase,” driven by renewed construction, localized groundwater extraction, or site-specific geological conditions.
This study not only provides a scientific basis for geohazard prevention and control in Tangshan but also offers a transferable analytical framework for mechanism-based hazard analysis in other complex geographical regions.

Author Contributions

Conceptualization, B.M. and Y.W.; methodology, B.M.; software, B.M.; validation, Y.W., J.Z. and Q.S.; formal analysis, B.M.; investigation, B.M.; resources, Y.W. and Q.S.; data curation, B.M. and Y.Z.; writing—original draft preparation, B.M.; writing—review and editing, Y.W., J.Z., D.Z., Y.Z. and F.J.; visualization, B.M.; supervision, Y.W.; project administration, Y.W.; funding acquisition, Y.W. All authors have read and agreed to the published version of the manuscript.

Funding

This work was supported by the Hebei Key Laboratory of Geological Resources and Environment Monitoring and Protection [Grant Number JCYKT202307].

Institutional Review Board Statement

Not applicable.

Informed Consent Statement

Not applicable.

Data Availability Statement

The data presented in this study are available on request from the corresponding author. The data are not publicly available due to privacy.

Acknowledgments

The authors thank ESA for providing the Sentinel-1 data.

Conflicts of Interest

The authors declare no conflicts of interest.

References

  1. Hasan, M.F.; Smith, R.; Vajedian, S.; Pommerenke, R.; Majumdar, S. Global Land Subsidence Mapping Reveals Widespread Loss of Aquifer Storage Capacity. Nat. Commun. 2023, 14, 6180. [Google Scholar] [CrossRef]
  2. Huning, L.S.; Love, C.A.; Anjileli, H.; Vahedifard, F.; Zhao, Y.; Chaffe, P.L.B.; Cooper, K.; Alborzi, A.; Pleitez, E.; Martinez, A.; et al. Global Land Subsidence: Impact of Climate Extremes and Human Activities. Rev. Geophys. 2024, 62, e2023RG000817. [Google Scholar] [CrossRef]
  3. Wu, S.; Xu, C.; Ma, J.; Gao, H. Escalating Risks and Impacts of Rainfall-Induced Geohazards. Nat. Hazards Res. 2025, 5, 447–454. [Google Scholar] [CrossRef]
  4. Chaussard, E.; Amelung, F.; Abidin, H.; Hong, S.-H. Sinking Cities in Indonesia: ALOS PALSAR Detects Rapid Subsidence Due to Groundwater and Gas Extraction. Remote Sens. Environ. 2013, 128, 150–161. [Google Scholar] [CrossRef]
  5. Ohenhen, L.O.; Zhai, G.; Lucy, J.; Werth, S.; Carlson, G.; Khorrami, M.; Onyike, F.; Sadhasivam, N.; Tiwari, A.; Ghobadi-Far, K. Land Subsidence Risk to Infrastructure in US Metropolises. Nat. Cities 2025, 2, 543–554. [Google Scholar] [CrossRef]
  6. Jasechko, S.; Seybold, H.; Perrone, D.; Fan, Y.; Shamsudduha, M.; Taylor, R.G.; Fallatah, O.; Kirchner, J.W. Rapid Groundwater Decline and Some Cases of Recovery in Aquifers Globally. Nature 2024, 625, 715–721. [Google Scholar] [CrossRef] [PubMed]
  7. Zhang, R.; Liu, A.; Wang, T.; Yang, Y.; Lv, J.; Jiang, H.; Chen, K.; Mao, W. Reclaimed-Land Subsidence Mechanism Analysis and Evolution Prediction of Tianjin Binhai New Area, China Based on Time-Series InSAR Observations. Adv. Space Res. 2025, 76, 1368–1383. [Google Scholar] [CrossRef]
  8. Chen, Y.; Yan, F.; Chen, J.; Fan, X. Detection Ground Deformation Characteristics of Reclamation Land with Time-Series Interferometric Synthetic Aperture Radar in Tianjin Binhai New Area, China. Remote Sens. 2023, 15, 5303. [Google Scholar] [CrossRef]
  9. Ferretti, A.; Prati, C.; Rocca, F. Permanent Scatterers in SAR Interferometry. IEEE Trans. Geosci. Remote Sens. 2002, 39, 8–20. [Google Scholar] [CrossRef]
  10. Crosetto, M.; Monserrat, O.; Cuevas-González, M.; Devanthéry, N.; Crippa, B. Persistent Scatterer Interferometry: A Review. ISPRS J. Photogramm. Remote Sens. 2016, 115, 78–89. [Google Scholar] [CrossRef]
  11. Berardino, P.; Fornaro, G.; Lanari, R.; Sansosti, E. A New Algorithm for Surface Deformation Monitoring Based on Small Baseline Differential SAR Interferograms. IEEE Trans. Geosci. Remote Sens. 2003, 40, 2375–2383. [Google Scholar] [CrossRef]
  12. Cheng, Y.; Pang, H.; Li, Y.; Fan, L.; Wei, S.; Yuan, Z.; Fang, Y. Applications and Advancements of Spaceborne InSAR in Landslide Monitoring and Susceptibility Mapping: A Systematic Review. Remote Sens. 2025, 17, 999. [Google Scholar] [CrossRef]
  13. Crosetto, M.; Crippa, B.; Mróz, M.; Cuevas-González, M.; Shahbazi, S. Applications Based on EGMS Products: A Review. Remote Sens. Appl. Soc. Environ. 2025, 37, 101452. [Google Scholar] [CrossRef]
  14. Zeng, X.; Yu, Y.; Yang, S.; Lv, Y.; Sarker, M.N.I. Urban Resilience for Urban Sustainability: Concepts, Dimensions, and Perspectives. Sustainability 2022, 14, 2481. [Google Scholar] [CrossRef]
  15. Cohen-Waeber, J.; Bürgmann, R.; Chaussard, E.; Giannico, C.; Ferretti, A. Spatiotemporal Patterns of Precipitation-Modulated Landslide Deformation from Independent Component Analysis of InSAR Time Series. Geophys. Res. Lett. 2018, 45, 1878–1887. [Google Scholar] [CrossRef]
  16. Hyvärinen, A.; Oja, E. Independent Component Analysis: Algorithms and Applications. Neural Netw. 2000, 13, 411–430. [Google Scholar] [CrossRef]
  17. Gualandi, A.; Liu, Z. Variational Bayesian Independent Component Analysis for InSAR Displacement Time-Series with Application to Central California, USA. JGR Solid Earth 2021, 126, e2020JB020845. [Google Scholar] [CrossRef]
  18. Tan, W.; Dong, D.; Chen, J. Application of Independent Component Analysis to GPS Position Time Series in Yunnan Province, Southwest of China. Adv. Space Res. 2022, 69, 4111–4122. [Google Scholar] [CrossRef]
  19. Zhu, S.; Huang, J.; Zhao, Y. Coupling Coordination Analysis of Ecosystem Services and Urban Development of Resource-Based Cities: A Case Study of Tangshan City. Ecol. Indic. 2022, 136, 108706. [Google Scholar] [CrossRef]
  20. The 1976 Tangshan Earthquake|U.S. Geological Survey. Available online: https://www.usgs.gov/publications/1976-tangshan-earthquake (accessed on 10 October 2025).
  21. Nábělek, J.; Chen, W.; Ye, H. The Tangshan Earthquake Sequence and Its Implications for the Evolution of the North China Basin. J. Geophys. Res. 1987, 92, 12615–12628. [Google Scholar] [CrossRef]
  22. Chen, J.; Wang, Z.-H.; Wei, T.-Y.; Zhao, B.-C.; Chen, Z.-Y. Clay Minerals in the Pliocene–Quaternary Sediments of the Southern Yangtze Coast, China: Sediment Sources and Palaeoclimate Implications. J. Palaeogeogr. 2014, 3, 297–308. [Google Scholar]
  23. Zhang, L.; Ge, D.; Guo, X.; Liu, B.; Li, M.; Wang, Y. InSAR Monitoring Surface Deformation Induced by Underground Mining Using Sentinel-1 Images. Proc. Int. Assoc. Hydrol. Sci. 2020, 382, 237–240. [Google Scholar] [CrossRef]
  24. Li, X.; Li, Y. Study on Land Subsidence Characteristics and Deformation Evolution Mechanism in Caofeidian New Area, Bohai Bay. Bull. Eng. Geol. Environ. 2023, 82, 96. [Google Scholar] [CrossRef]
  25. Jin, Y.; Shi, X.; Wu, Y.; Ge, D.; Tang, W.; Zhang, L.; Zhang, S.; Zhang, Y. Monitoring Subsidence Characteristics in Southern Tangshan from 2015—2021 Using Multi-temporal Sentinel-1 Data. Geomat. Inf. Sci. Wuhan Univ. 2025, 50, 1648–1656. [Google Scholar] [CrossRef]
  26. Wu, P.; Wei, M.; D’Hondt, S. Subsidence in Coastal Cities Throughout the World Observed by InSAR. Geophys. Res. Lett. 2022, 49, e2022GL098477. [Google Scholar] [CrossRef]
  27. Shi, C.; Wang, Y. Assessment of Reclamation-Induced Consolidation Settlement Considering Stratigraphic Uncertainty and Spatial Variability of Soil Properties. Can. Geotech. J. 2022, 59, 1215–1230. [Google Scholar] [CrossRef]
  28. Lanari, R.; Casu, F.; Manzo, M.; Zeni, G.; Berardino, P.; Manunta, M.; Pepe, A. An Overview of the Small BAseline Subset Algorithm: A DInSAR Technique for Surface Deformation Analysis. In Deformation and Gravity Change: Indicators of Isostasy, Tectonics, Volcanism, and Climate Change; Wolf, D., Fernández, J., Eds.; Pageoph Topical Volumes; Birkhäuser Basel: Basel, Switzerland, 2007; pp. 637–661. ISBN 978-3-7643-8416-6. [Google Scholar]
  29. Goldstein, R.M.; Werner, C.L. Radar Interferogram Filtering for Geophysical Applications. Geophys. Res. Lett. 1998, 25, 4035–4038. [Google Scholar] [CrossRef]
  30. Chen, C.W.; Zebker, H.A. Two-Dimensional Phase Unwrapping with Use of Statistical Models for Cost Functions in Nonlinear Optimization. J. Opt. Soc. Am. A 2001, 18, 338–351. [Google Scholar] [CrossRef]
  31. Casu, F.; Manzo, M.; Lanari, R. A Quantitative Assessment of the SBAS Algorithm Performance for Surface Deformation Retrieval from DInSAR Data. Remote Sens. Environ. 2006, 102, 195–210. [Google Scholar] [CrossRef]
  32. Comon, P. Independent Component Analysis, a New Concept? Signal Process. 1994, 36, 287–314. [Google Scholar] [CrossRef]
  33. Naik, G.R.; Kumar, D.K. An overview of independent component analysis and its applications. J. Inform. 2011, 35, 63–81. [Google Scholar]
  34. Hyvärinen, A.; Oja, E. A Fast Fixed-Point Algorithm for Independent Component Analysis. Neural Comput. 1997, 9, 1483–1492. [Google Scholar] [CrossRef]
  35. Gaddes, M.E.; Hooper, A.; Bagnardi, M.; Inman, H.; Albino, F. Blind Signal Separation Methods for InSAR: The Potential to Automatically Detect and Monitor Signals of Volcanic Deformation. JGR Solid Earth 2018, 123, 10,226–10,251. [Google Scholar] [CrossRef]
  36. Maubant, L.; Pathier, E.; Daout, S.; Radiguet, M.; Doin, M.-P.; Kazachkina, E.; Kostoglodov, V.; Cotte, N.; Walpersdorf, A. Independent Component Analysis and Parametric Approach for Source Separation in InSAR Time Series at Regional Scale: Application to the 2017–2018 Slow Slip Event in Guerrero (Mexico). JGR Solid Earth 2020, 125, e2019JB018187. [Google Scholar] [CrossRef]
  37. Himberg, J.; Hyvärinen, A.; Esposito, F. Validating the Independent Components of Neuroimaging Time Series via Clustering and Visualization. Neuroimage 2004, 22, 1214–1222. [Google Scholar] [CrossRef]
  38. Hu, J.; Li, Z.W.; Ding, X.L.; Zhu, J.J.; Zhang, L.; Sun, Q. Resolving Three-Dimensional Surface Displacements from InSAR Measurements: A Review. Earth-Sci. Rev. 2014, 133, 1–17. [Google Scholar] [CrossRef]
  39. Fuhrmann, T.; Garthwaite, M.C. Resolving Three-Dimensional Surface Motion with InSAR: Constraints from Multi-Geometry Data Fusion. Remote Sens. 2019, 11, 241. [Google Scholar] [CrossRef]
  40. Fan, H.; Wang, L.; Wen, B.; Du, S. A New Model for Three-Dimensional Deformation Extraction with Single-Track InSAR Based on Mining Subsidence Characteristics. Int. J. Appl. Earth Obs. Geoinf. 2021, 94, 102223. [Google Scholar] [CrossRef]
  41. Samsonov, S.; d’Oreye, N. Multidimensional Time-Series Analysis of Ground Deformation from Multiple InSAR Data Sets Applied to Virunga Volcanic Province. Geophys. J. Int. 2012, 191, 1095–1108. [Google Scholar]
  42. Bekaert, D.P.S.; Hooper, A.; Wright, T.J. A Spatially Variable Power Law Tropospheric Correction Technique for InSAR Data. JGR Solid Earth 2015, 120, 1345–1356. [Google Scholar] [CrossRef]
  43. Liu, X.; Zhao, C.; Zhang, Q.; Lu, Z.; Li, Z.; Yang, C.; Zhu, W.; Liu-Zeng, J.; Chen, L.; Liu, C. Integration of Sentinel-1 and ALOS/PALSAR-2 SAR Datasets for Mapping Active Landslides along the Jinsha River Corridor, China. Eng. Geol. 2021, 284, 106033. [Google Scholar] [CrossRef]
  44. Liu, X.; Zhao, C.; Yin, Y.; Tomás, R.; Zhang, J.; Zhang, Q.; Wei, Y.; Wang, M.; Lopez-Sanchez, J.M. Refined InSAR Method for Mapping and Classification of Active Landslides in a High Mountain Region: Deqin County, Southern Tibet Plateau, China. Remote Sens. Environ. 2024, 304, 114030. [Google Scholar] [CrossRef]
  45. Chen, B.; Li, Z.; Song, C.; Yu, C.; Zhu, W.; Liu, Z.; Han, B.; Du, J.; Zhang, C.; Xu, F.; et al. Automatic Detection of Active Geohazards with Millimeter-to-Meter-Scale Deformation and Quantitative Analysis of Factors Influencing Spatial Distribution: A Case Study in the Hexi Corridor, China. Int. J. Appl. Earth Obs. Geoinf. 2024, 131, 103995. [Google Scholar] [CrossRef]
  46. Delbridge, B.G.; Bürgmann, R.; Fielding, E.; Hensley, S.; Schulz, W.H. Three-Dimensional Surface Deformation Derived from Airborne Interferometric UAVSAR: Application to the Slumgullion Landslide. JGR Solid Earth 2016, 121, 3951–3977. [Google Scholar] [CrossRef]
  47. Parise, M.; Lollino, P. A Preliminary Analysis of Failure Mechanisms in Karst and Man-Made Underground Caves in Southern Italy. Geomorphology 2011, 134, 132–143. [Google Scholar] [CrossRef]
  48. Gutiérrez, F.; Parise, M.; De Waele, J.; Jourde, H. A Review on Natural and Human-Induced Geohazards and Impacts in Karst. Earth-Sci. Rev. 2014, 138, 61–88. [Google Scholar] [CrossRef]
  49. Park, S.; Hong, S. Nonlinear Modeling of Subsidence from a Decade of InSAR Time Series. Geophys. Res. Lett. 2021, 48, e2020GL090970. [Google Scholar] [CrossRef]
  50. Xiong, Z.; Deng, K.; Feng, G.; Miao, L.; Li, K.; He, C.; He, Y. Settlement Prediction of Reclaimed Coastal Airports with InSAR Observation: A Case Study of the Xiamen Xiang’an International Airport, China. Remote Sens. 2022, 14, 3081. [Google Scholar] [CrossRef]
  51. Ao, Z.; Hu, X.; Tao, S.; Hu, X.; Wang, G.; Li, M.; Wang, F.; Hu, L.; Liang, X.; Xiao, J.; et al. A National-Scale Assessment of Land Subsidence in China’s Major Cities. Science 2024, 384, 301–306. [Google Scholar] [CrossRef]
  52. Fang, J.; Nicholls, R.J.; Brown, S.; Lincke, D.; Hinkel, J.; Vafeidis, A.T.; Du, S.; Zhao, Q.; Liu, M.; Shi, P. Benefits of Subsidence Control for Coastal Flooding in China. Nat. Commun. 2022, 13, 6946. [Google Scholar] [CrossRef]
  53. Dong, J.; Guo, S.; Wang, N.; Zhang, L.; Ge, D.; Liao, M.; Gong, J. Tri-Decadal Evolution of Land Subsidence in the Beijing Plain Revealed by Multi-Epoch Satellite InSAR Observations. Remote Sens. Environ. 2023, 286, 113446. [Google Scholar] [CrossRef]
  54. Jolivet, R.; Agram, P.S.; Lin, N.Y.; Simons, M.; Doin, M.; Peltzer, G.; Li, Z. Improving InSAR Geodesy Using Global Atmospheric Models. JGR Solid Earth 2014, 119, 2324–2341. [Google Scholar] [CrossRef]
  55. Bekaert, D.P.S.; Walters, R.J.; Wright, T.J.; Hooper, A.J.; Parker, D.J. Statistical Comparison of InSAR Tropospheric Correction Techniques. Remote Sens. Environ. 2015, 170, 40–47. [Google Scholar] [CrossRef]
Figure 1. (a) Geographical location of the Tangshan and spatial coverage of the Sentinel-1 SAR data (ascending and descending tracks). The inset in (a) shows the location of Tangshan City (red rectangle) within China. (b) Topographic map highlighting the three distinct geomorphological units: the northern mountainous area, central plain, and southern coastal reclamation area. The optical imagery basemap is from Google Earth.
Applsci 15 12584 g001
Figure 3. Perpendicular and temporal baselines of Sentinel-1 interferometric pairs for the (a) ascending and (b) descending tracks.
Applsci 15 12584 g003
Figure 4. Mean LOS deformation rates in Tangshan derived from (a) ascending and (b) descending Sentinel-1 observations. The white rectangle indicates the geographic extent of Figure 5. The dotted line is the geomorphological boundary.
Applsci 15 12584 g004
Figure 5. Cross-validation of SBAS-InSAR measurements in central Tangshan: (a) Ascending LOS deformation velocity; (b) Descending LOS deformation velocity; (c) Absolute difference (||dvasc|-|dvdesc||) between vertical deformation rates derived from ascending and descending tracks; (d) Statistical distribution of the differences over the overlapping area (excluding mining zones), based on 4.7 × 106 pixels.
Applsci 15 12584 g005
Figure 6. Spatial distribution and statistical analysis of geohazards in Tangshan City: (a) background of previously documented hazards; (b) newly compiled inventory from InSAR and optical imagery, with pie charts summarizing the type and quantity of InSAR-identified geohazards within each geomorphological unit.
Applsci 15 12584 g006
Figure 7. Decomposition of reclamation settlement signals using ICA. (ac) Spatial patterns of ICs: (a) IC1, (b) IC2, and (c) IC3, with the seven coastal subsidence zones (RS1–RS7) marked. (d) Historical land reclamation extent (1984–2024) and building distribution in Tangshan, with major groundwater depression cones (GF1–GF4) indicated. (eg) Temporal evolution of the independent components, with (e), (f) and (g) corresponding to the spatial patterns shown in (a), (b) and (c), respectively. (h) Measured groundwater level changes in the GF2 region.
Applsci 15 12584 g007
Figure 9. From LOS to 2D deformation in central Tangshan: (a) Ascending and (b) descending LOS velocity maps; Resulting deformation components in the (c) East-West and (d) Vertical directions. Note: Negative values in panel (c) represent eastward motion, while positive values indicate westward motion; Negative values in panel (d) denote downward displacement, while positive values represent upward movement. The spatial extent of this figure corresponds to the white rectangle in Figure 4a.
Applsci 15 12584 g009
Figure 10. Optical imagery versus InSAR-derived deformation maps for six typical geohazards: (a,b) Reclamation settlement; (c,d) Tailings pond deformation; (e,f) Landslide; (g,h) Open-pit slope deformation; (i,j) Mining-induced subsidence; (k,l) Spoil heap deformation. Note, pink arrows indicate the potential downslope movement direction derived from topographic analysis, which was objectively determined by calculating the slope aspect from the 30-m resolution Copernicus DEM. P1–P6 denote representative points extracted from the six hazard types. The optical imagery basemap is from Google Earth. All InSAR-derived deformation maps are extracted from Figure 4a.
Applsci 15 12584 g010
Figure 11. SBAS-InSAR-derived time series deformation at representative sites (Figure 10) of the six classified hazard types. (af) correspond to the results for sites P1 to P6, respectively.
Applsci 15 12584 g011
Figure 12. Decomposition of reclamation settlement signals using ICA. (a,b) Spatial patterns of ICs: (a) IC1 and (b) IC2, with the seven coastal subsidence zones (RS1-RS7) marked. (c) Historical land reclamation extent (1984–2024) and building distribution in Tangshan, with major groundwater depression cones (GF1–GF4) indicated. (d,e) Temporal evolution of the independent components, with (d) and (e) corresponding to the spatial patterns shown in (a) and (b), respectively.
Applsci 15 12584 g012
Figure 13. Decomposition of reclamation settlement signals using PCA. (ad) Spatial patterns of ICs: (a) PC1, (b) PC2, (c) PC3 and (d) PC3, with the seven coastal subsidence zones (RS1–RS7) marked. (e) Historical land reclamation extent (1984–2024) and building distribution in Tangshan, with major groundwater depression cones (GF1–GF4) indicated. (fi) Temporal evolution of the independent components, with (f), (g), (h) and (i) corresponding to the spatial patterns shown in (a), (b), (c) and (d), respectively.
Applsci 15 12584 g013
Figure 14. Correlating settlement with construction history in RS1: (a) Map of surface deformation from InSAR; (bd) Google Earth optical images from (b) 1984, (c) 2019, and (d) 2024 illustrating urban development, where pink rectangles denote post-2019 structures. Note that the shaded areas in Figure (a) denote building areas constructed post-1984.
Applsci 15 12584 g014
Disclaimer/Publisher’s Note: The statements, opinions and data contained in all publications are solely those of the individual author(s) and contributor(s) and not of MDPI and/or the editor(s). MDPI and/or the editor(s) disclaim responsibility for any injury to people or property resulting from any ideas, methods, instructions or products referred to in the content.