1. Introduction
Monitoring changes in surface water bodies is essential for understanding hydrological variability, environmental risk, and territorial development. Remote sensing has been extensively used to characterize rivers, lakes, wetlands, and reservoirs through time, providing consistent and spatially explicit information on their extent, geometry, and condition. Optical approaches such as the Normalized Difference Water Index (NDWI) have traditionally been employed to enhance the spectral response of open water features and support multi-temporal assessments [
1]. However, the reliability of optical observations in tropical and mountainous regions is often reduced by persistent cloud cover, shadows, and illumination variability, which limit the availability of high-quality imagery and hinder continuous monitoring [
2].
Synthetic Aperture Radar (SAR) data provide all-weather, day-and-night observations that overcome many of the limitations of optical sensors. Missions such as ESA’s Sentinel-1 ensure uninterrupted acquisition capabilities, making them particularly suitable for monitoring hydrological features in regions with high cloud frequency [
3]. Nevertheless, SAR imagery alone may not capture all spectral and environmental characteristics relevant for detailed water-body discrimination, especially in areas affected by vegetation, turbidity, or mixed land-cover conditions.
To address these challenges, the integration of SAR and optical data has become an increasingly adopted strategy for strengthening the temporal, spectral, and structural reliability of water-body detection. Recent research demonstrates that fusion approaches can effectively fill temporal gaps, improve classification robustness, and better characterize surface water dynamics under variable environmental conditions [
4]. Comparative analyses also indicate that the combined use of Sentinel-1 and Sentinel-2 imagery enhances the accuracy of surface-water delineation at both regional and reservoir scales, emphasizing the complementarity of radar and multispectral information [
5].
In this context, the present study develops a fully automated and reproducible workflow for detecting changes in surface water bodies in the near-eastern region of Antioquia, Colombia. The methodology integrates Sentinel-1 SAR data and Sentinel-2 multispectral imagery through a set of preprocessing, fusion, and segmentation procedures designed to improve multi-temporal water-body monitoring in cloud-prone tropical environments. The workflow also incorporates despeckling, spectral index computation, and the application of the Segment Anything Model (SAM), enabling consistent analysis across three hydrologically relevant areas.
This paper is organized as follows:
Section 3 describes the region of interest;
Section 4 details the satellite missions and validation strategies;
Section 5 presents the proposed workflow for automatic download, preprocessing, fusion, and segmentation;
Section 6 reports the main findings; and
Section 7 provides conclusions and future research directions.
2. State of the Art
The detection and monitoring of surface water dynamics using remote sensing has evolved significantly over the past three decades, moving from basic band ratio techniques and single-sensor approaches to multi-sensor fusion frameworks and dense time series analysis supported by advanced machine learning. In the optical domain, water indices were the first widely adopted tools for enhancing the spectral signal of water bodies. The Normalized Difference Water Index (NDWI) proposed by [
1] has been extensively used to highlight open water features by exploiting the spectral contrast between the green and near-infrared (NIR) bands. Subsequently, the Modified NDWI (MNDWI) introduced by [
2] replaced the NIR with short-wave infrared (SWIR), reducing confusion with urban features and bare soil, and improving discrimination between water and non-water classes. More recently, the Automated Water Extraction Index (AWEI) was developed by [
6] to address challenges such as shadows and dark surfaces, which often limit the performance of NDWI and MNDWI. Furthermore, adaptive thresholding techniques have been proposed to improve classification accuracy across varying environments and seasonal conditions [
7].
In recent years, research in Colombia has increasingly focused on applying remote sensing techniques to understand land cover dynamics, hydrological variability, and geomorphological processes at regional scales. Reference [
8] developed a comprehensive methodology for the multitemporal analysis of land cover changes and urban expansion using Synthetic Aperture Radar (SAR) imagery, applied to the Aburrá Valley, a densely populated mountainous region with persistent cloud cover. This approach demonstrated the advantages of SAR for continuous monitoring in tropical environments where optical imagery is often unavailable. Complementarily, ref. [
9] analyzed the effects of climate change on streamflow in an Andean river basin characterized by volcanic activity, providing essential insights into how climate variability and anthropogenic factors jointly influence hydrological regimes. Expanding the scope to coastal environments, ref. [
10] utilized Sentinel-1 SAR data to detect patterns of erosion and progradation in the Atrato River delta, highlighting the versatility of SAR-based methodologies for monitoring diverse water-related processes across different ecosystems. These studies collectively illustrate how the integration of SAR data and advanced analytical workflows can address complex environmental challenges, bridging gaps between land cover dynamics, hydrology, and coastal geomorphology.
At regional to global scales, time-series analyses from optical satellites such as Landsat have enabled historical reconstructions of surface water extent with unprecedented temporal depth. The work by [
11] produced the Global Surface Water dataset (GSW), mapping long-term changes in surface water dynamics at 30 m resolution and revealing global trends of water gain and loss. Complementarily, ref. [
12] developed the Aqua Monitor, which uses multi-decadal archives to identify spatial transitions between land and water, providing valuable insights into the effects of climate variability and human interventions. These products established a reference framework for validating local studies and for integrating global baselines into hydrological models.
While optical data are invaluable, persistent cloud cover, shadows, and illumination variability in tropical and mountainous regions often limit their effectiveness. To overcome these constraints, Synthetic Aperture Radar (SAR) has become essential because it is weather-independent and can acquire data regardless of cloud conditions. The open-access Sentinel-1 mission, introduced by [
3], revolutionized operational water monitoring by providing frequent, high-resolution coverage. SAR-based workflows have been developed for near-real-time (NRT) flood mapping, such as the TerraSAR-X-based system presented by [
13] and fully automated Sentinel-1 processing chains by [
14]. Beyond event detection, time-series analysis of SAR imagery enables the reduction of false positives (e.g., caused by wind roughness or topographic effects) and provides stable measurements in heterogeneous landscapes [
15].
Recent advances have focused on optical–SAR data fusion, leveraging the complementary strengths of these data types. Optical imagery contributes detailed spectral information, including turbidity and vegetation signals, whereas SAR offers temporal continuity and sensitivity to surface roughness. Fused workflows have proven especially valuable in complex environments such as tropical wetlands and urban floodplains, where single-sensor approaches are insufficient. Reference [
4] demonstrated the potential of dense water extent time series created through gap-filling fusion techniques, maintaining both spatial resolution and temporal consistency. Similarly, deep learning models have shown significant improvements in noise removal and segmentation for SAR data. For instance, ref. [
16] introduced MADF-Net, a multi-attention deep fusion network specifically designed for SAR-based water body mapping, achieving superior performance compared to conventional classifiers.
Time-series water products have become essential for monitoring spatiotemporal dynamics at multiple scales. Reference [
17] developed a monthly 10 m resolution product for the Yangtze River Basin, demonstrating how harmonizing Sentinel-1 and Sentinel-2 data can capture intra- and inter-annual changes with high reliability. In the Haihe River Basin, ref. [
18] constructed a dataset with high spatiotemporal continuity, a crucial resource for analyzing water surface changes in regions with frequent cloud cover. In addition, the detection of small water bodies, historically constrained by the 30 m resolution of Landsat, has benefited from new approaches such as super-resolution and object-based classification. Reference [
19] highlighted the importance of these methods for accurately mapping ponds, reservoirs, and small lakes, which are critical for local water management.
Validation and inter-sensor comparisons play a vital role in improving reliability and guiding sensor selection. Reference [
5] compared Sentinel-1 and Sentinel-2 for surface water detection, showing that while optical data generally exhibit higher thematic accuracy, SAR provides unparalleled temporal consistency and resilience under cloudy conditions. Moreover, ref. [
20] integrated airborne thermal imagery to validate satellite-derived water maps, demonstrating the value of independent datasets for shallow or narrow water features where spectral mixing is a persistent issue.
Despite the development of sophisticated machine learning models, water indices remain essential in operational workflows due to their simplicity, interpretability, and adaptability. Comparative assessments such as [
21] emphasize that no single index performs optimally across all landscapes; rather, NDWI (Normalized Difference Water Index), MNDWI (Modified Normalized Difference Water Index), and AWEI (Automated Water Extraction Index) each offer specific advantages depending on turbidity levels, urban adjacency, and topographic shading. Best practices now combine multiple indices with temporal rules (e.g., persistence thresholds), quality control masks for clouds and shadows, and SAR-derived features to ensure robustness and consistency over time [
22].
Overall, the current state of the art converges toward reproducible processing pipelines that integrate:
Multi-temporal optical and SAR data streams,
Combined use of spectral indices and SAR-derived metrics (intensity, coherence, texture), and
Advanced classification techniques ranging from dynamic thresholding to deep learning.
These integrated frameworks are supported by multi-source validation strategies, ensuring both temporal and thematic reliability. Such comprehensive designs are essential for addressing key challenges in tropical and mountainous regions, including chronic cloud cover, SAR speckle noise, misclassification due to shadows or dark surfaces, and the need for long-term temporal consistency. As a result, the integration of Sentinel-1 and Sentinel-2 data, combined with robust algorithms and open-access platforms such as Google Earth Engine, now represents the standard reference methodology for detecting and understanding changes in surface water bodies across diverse and complex landscapes [
3,
4,
5,
11,
12,
13,
14,
15,
16,
17,
18,
19,
21,
22].
3. Region of Interest
The Eastern Antioquia Region (Oriente Antioqueño) is one of the nine subregions of the department of Antioquia, Colombia. Occupying about 7021 km
2 (approximately 11% of the department’s area), it comprises 23 municipalities [
23]. Its total population is close to 700 thousand inhabitants, with about 60% living in urban areas and 40% in rural areas [
23].
Geographically, it sits between the Aburrá Valley to the west and the Magdalena Medio basin to the east. The region exhibits a complex topography, typical of the Central Andes, with altitudes ranging from medium valleys to high mountain areas, with a variety of thermal floors (altitudinal/climatic zones): valleys, mountain ranges, and paramo ecosystems. It also has significant hydrographic richness, with major rivers such as the Nare, Rionegro, Calderas, Samaná, and important reservoirs and hydroelectric facilities, as Guatapé, the largest hydroelectric plant in Colombia by reservoir storage capacity [
24,
25].
Economically, the region has experienced accelerated growth due to the development of infrastructure projects such as the José María Córdova International Airport, large-scale hydroelectric plants, and an expanding industrial corridor that integrates with the metropolitan area of Medellín [
26]. Agriculture continues to be a central activity, with the production of flowers, dairy, and staple crops standing out, while tourism has also become a significant driver due to the natural landscapes, reservoirs, and cultural heritage of municipalities such as Guatapé and El Retiro [
25,
27].
In social and cultural terms, Eastern Antioquia combines traditional rural communities with rapidly growing urban centers, reflecting processes of migration, modernization, and territorial reconfiguration. The region is also recognized for its role in Colombia’s recent history, marked by both the challenges of internal conflict and the resilience of its inhabitants, who have fostered peace-building initiatives and local development projects [
25].
The Eastern Antioquia is one of the nine subregions of the department of Antioquia, grouped by geographic, economic, cultural, and environmental similarities [
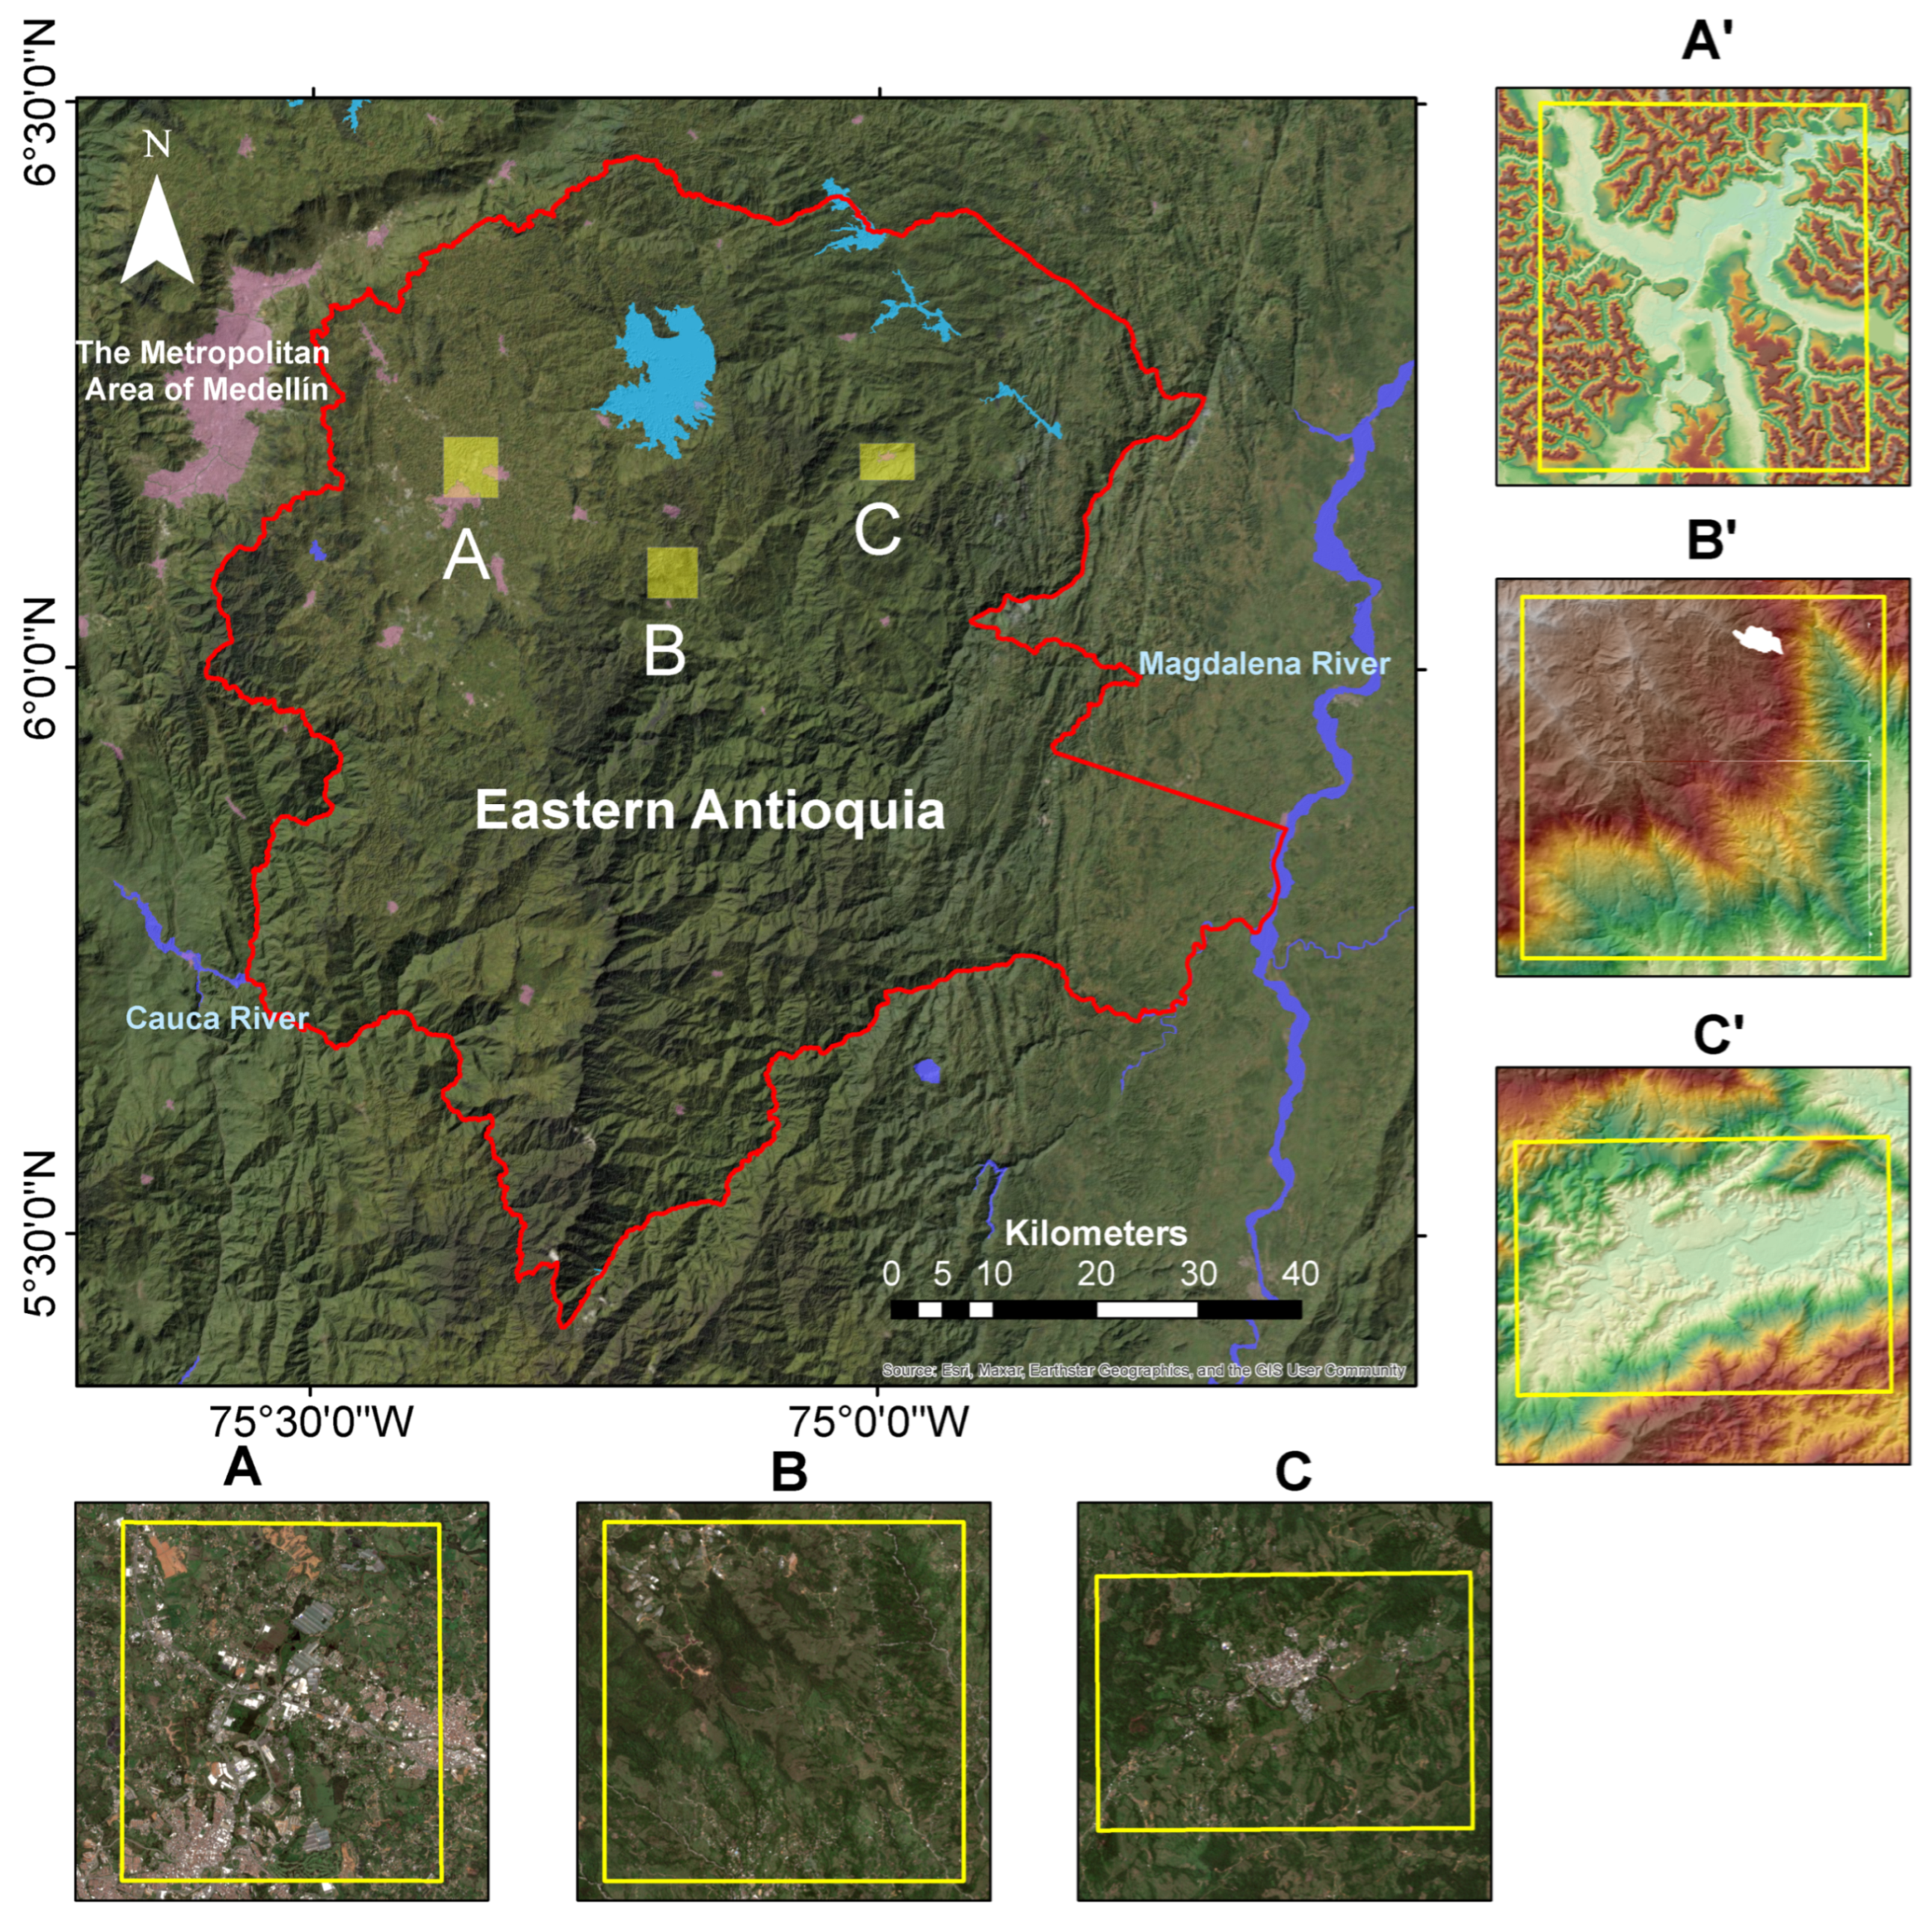
28]. In Eastern Antioquia, environmental authority is exercised by CORNARE (Regional Autonomous Corporation of the Negro and Nare River Basins). CORNARE is a decentralized public entity of the Colombian state, created by law to manage natural resources and oversee environmental policy within its jurisdiction. Its mandate includes regulating land use in environmentally sensitive areas, issuing environmental licenses and permits, promoting conservation projects, and coordinating sustainable development initiatives with local municipalities. As such, CORNARE plays a central role in balancing economic growth—such as agriculture, industry, and infrastructure development—with the protection of ecosystems and biodiversity in the region. In this study area, CORNARE prioritized its interest in three polygons that encompass areas with environmental determinants that have historically generated risk situations, given the increased vulnerability of the population living in these areas or in nearby areas that are related to them [
29]. The area corresponding to Eastern Antioquia, with its complex topography and the areas prioritized by the regional environmental authority, is observed in
Figure 1.
5. Methodology
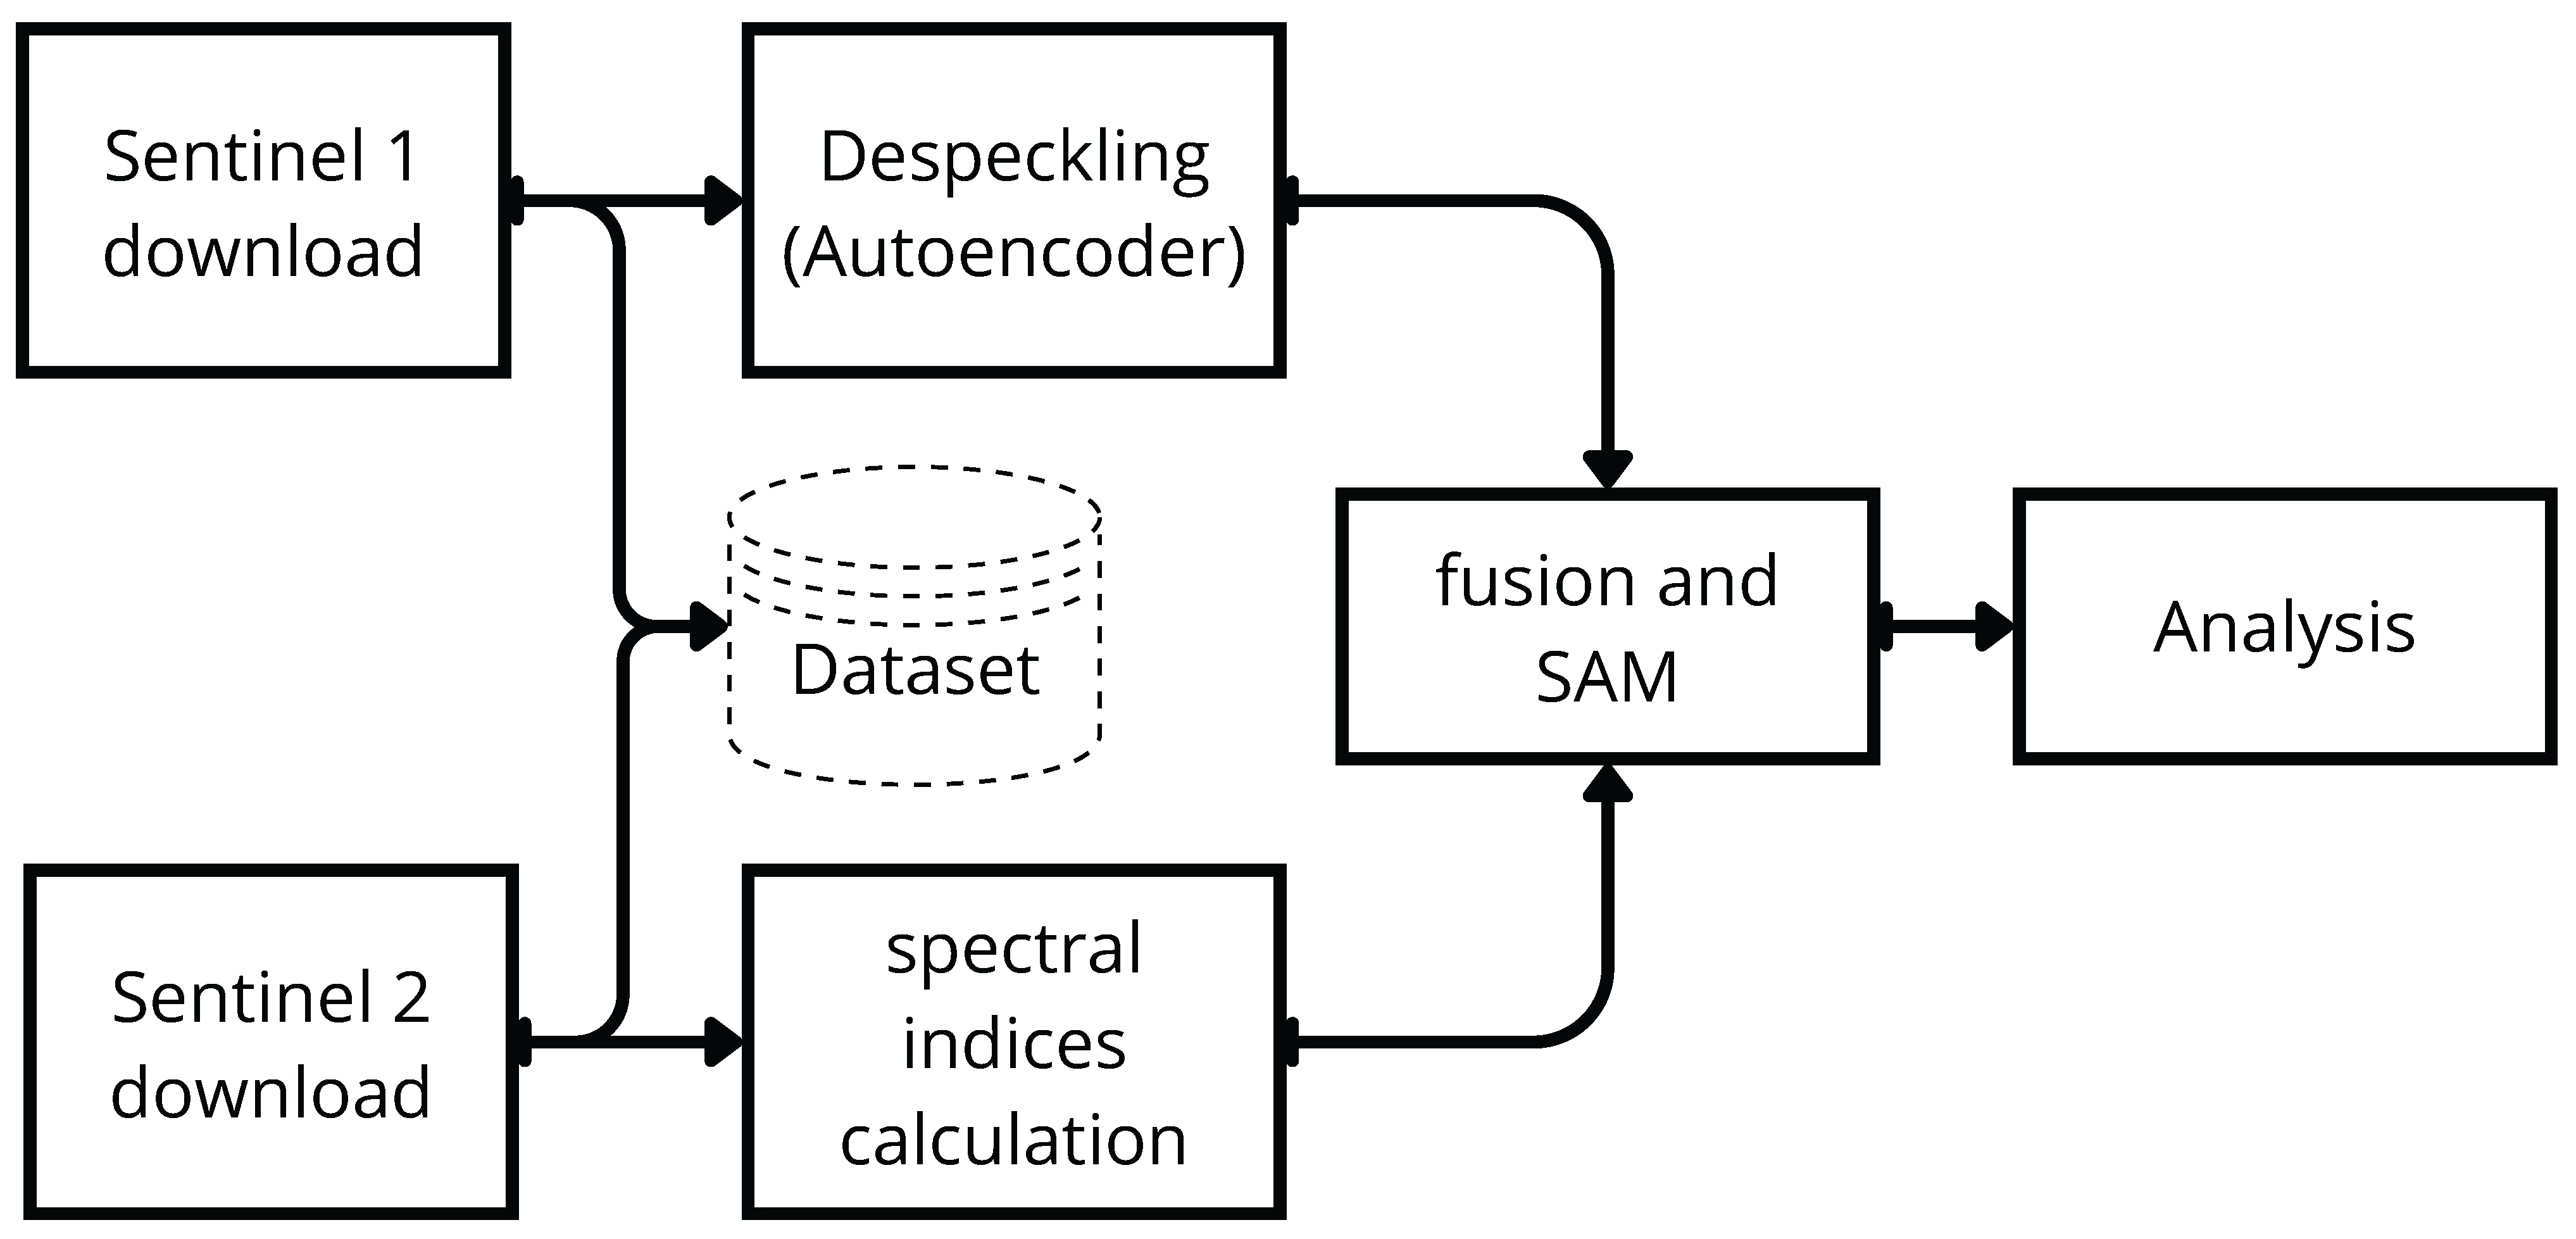
The methodological framework is illustrated in
Figure 3. It is structured into two main branches: the first involves Sentinel-1 data acquisition followed by despeckling, while the second comprises Sentinel-2 data acquisition and the calculation of spectral indices. These processes converge in a fusion stage combined with the Segment Anything Model (SAM), which subsequently enables the analysis of the integrated information. The full workflow implementation is available in the project repository:
https://github.com/AOS-POLI/AOS-POLI-remote-sensing (accessed on 15 November 2025).
5.1. Sentinel-1 Download
Sentinel-1 Ground Range Detected (GRD) imagery was retrieved through Google Earth Engine (GEE) by defining the area of interest (AOI) with its geographic coordinates. For each month in the study period, the first available acquisition covering the AOI was selected, ensuring temporal consistency across the dataset. Both polarizations (VV and VH) were included, and images were collected for both ascending and descending orbits to capture complementary viewing geometries.
Unlike Sentinel-2, Sentinel-1 data did not require extensive pre-download filtering, as cloud contamination is irrelevant in SAR acquisitions. The main preprocessing steps—radiometric calibration, terrain correction, and speckle reduction—were applied locally after download (see
Section 5.2). The exported dataset followed a structured organization by orbit direction and polarization, maintaining both raw and despeckled versions of each scene for traceability.
This approach aligns with best practices for multitemporal SAR monitoring, where systematic acquisitions in dual polarization and multiple orbit directions enhance robustness in applications such as water detection, land cover mapping, and change detection [
3]. By combining ascending/descending passes and VV/VH polarizations, the dataset maximizes sensitivity to surface scattering properties, thus providing reliable inputs for the subsequent despeckling and fusion stages.
5.2. Despeckling
Speckle is an inherent granular noise present in Synthetic Aperture Radar (SAR) imagery, which complicates quantitative analyses by reducing radiometric resolution and obscuring fine spatial details. Traditional approaches such as Lee, Frost, or Gamma-MAP filters provide partial noise suppression but often at the expense of blurring structural features that are critical for environmental monitoring tasks.
In this work, despeckling was carried out using the deep learning-based autoencoder model proposed by Cardona-Mesa et al. [
39], which incorporates variance analysis (ANOVA) and a systematic hyperparameter optimization framework. The best autoencoder architecture obtained in that study consists of four convolutional layers with 64 filters per layer and ReLU activation. In Cardona-Mesa et al. [
39], the model was trained with a batch size of 2, using MSE as the loss function and a learning rate of
. Their training dataset comprised 1600 dual-polarization (VV–VH) scenes of
pixels, yielding 3200 images [
40], split into 3000 samples for training and 200 for validation in four labeled folders. This previously optimized model, obtained using MSE, SSIM, PSNR, and ENL, was adopted in the present work to ensure a balance between noise suppression and structural preservation.
The same family of models has already demonstrated successful performance in practical applications such as the monitoring of coastal erosion and progradation processes in the Colombian Atrato River delta, where deep learning–based despeckling allowed accurate classification and change detection in highly dynamic coastal environments [
10]. These results confirm that AI-driven despeckling methods not only outperform classical filters in terms of quantitative indices but also provide more reliable inputs for downstream analyses.
Recent studies reinforce the effectiveness of deep learning approaches for SAR despeckling. For instance, Cardona-Mesa et al. [
41] compared several generative AI–based filters and highlighted their superiority in preserving fine spatial details, while An et al. [
42] introduced a hybrid tensor-based method showing state-of-the-art denoising results. These findings indicate that autoencoder-based despeckling, as implemented in this study, represents a robust and validated choice for ensuring high-quality Sentinel-1 inputs.
5.3. Sentinel-2 Download
Sentinel-2 Level-2A surface reflectance imagery was accessed and processed through the Google Earth Engine (GEE) platform [
36]. Before export, a cloud and shadow mask was applied directly in GEE by exploiting the Scene Classification Layer (SCL) band, which provides per-pixel semantic classes such as vegetation, water, cloud, and cloud shadow. Pixels flagged as clouds (classes 9 and 10) or cloud shadows (class 3) were excluded from the dataset, ensuring that only valid, analysis-ready reflectance values were retained. This masking step follows recent best practices for Sentinel-2 quality assurance in optical time series.
After masking, all optical bands (B2–B12) were rescaled to surface reflectance values (0–1) and exported only for the predefined Area of Interest (AOI), thereby avoiding unnecessary swath information. To reduce data redundancy and enhance temporal consistency, the valid observations were aggregated into quarterly (3-month) composites generated by averaging all cloud-free images available in each period. These composites served as inputs for subsequent calculation of vegetation and water indices, described in the postprocessing stage.
5.4. Spectral Indices from Sentinel-2
From each cloud-free Sentinel-2 quarterly composite, three normalized difference spectral indices were derived: the Normalized Difference Vegetation Index (NDVI), the Normalized Difference Water Index (NDWI), and the Normalized Difference Built-up Index (NDBI). Indices such as MNDWI or AWEI, although more powerful for identifying bodies of water, do not provide complementary information for vegetation or built-up areas, which in this study are fundamental for interpreting the regional hydrological context. In this regard, it has been decided to use the NDVI, NDWI, and NDBI, which are fully aligned with the need to integrate optical and SAR information, the construction of multi-class RGB composites for automatic segmentation, the spectral stability required in a mountainous and cloudy environment such as the eastern region of Antioquia, and the evidence presented in this study, which shows that these indices were the most representative for fusion. Although MNDWI and AWEI are superior for automatic water extraction, they are not the most suitable for a multisensory fusion approach and multiclase contextual analysis, which is precisely the objective of the study [
2]. These indices enhance the discrimination of vegetation, water bodies, and built-up areas, respectively, and have been widely used in recent environmental monitoring studies [
43,
44,
45].
The general formula for a normalized difference index is given by:
where
and
correspond to surface reflectance values of two spectral bands.
Specifically, the three indices used in this study were computed as follows:
where
,
,
, and
denote the green, red, near-infrared (NIR), and short-wave infrared (SWIR) Sentinel-2 bands, respectively. These indices were calculated for each quarterly composite and stored as additional layers for subsequent analysis.
5.5. Fusion Strategy and SAM Integration
To integrate complementary information from optical and radar sources, three-channel composites were constructed by merging various spectral indices (e.g., NDVI, NDBI, NDWI) and SAR backscatter features (VH and/or VV), depending on the configuration used in each experimental setup. This construction yields pseudo-RGB representations that preserve spatial consistency while remaining compatible with the input requirements of the Segment Anything Model (SAM) [
46]. Although SAM was originally trained on natural RGB images, recent studies have shown that its Vision Transformer encoder can generalize effectively to non-optical domains when inputs are reformatted or adapted for multi-sensor fusion. For example, Yuan et al. [
47] demonstrate that SAM-derived encoders extract stable and transferable features from SAR imagery for object detection. Likewise, Xue et al. [
48] introduce a multimodal and multiscale refinement of SAM (MM-SAM) that integrates multispectral and SAR data through a fusion adapter, showing that SAM-based models can be extended beyond RGB to handle heterogeneous, multidimensional remote sensing inputs. Together, these findings highlight SAM’s robustness to radiometric and geometric variability and support its use as a domain-agnostic boundary delineation tool in fused optical–radar composites. In order to ensure numerical compatibility among the input layers, all indices originally expressed in normalized difference form, which typically range from −1 to 1, were rescaled to a common 0–255 interval. This approach aligns their values with the intensity levels commonly used in color imagery. The SAR VH-VV backscatter were also normalized to the same range. Harmonizing these dynamic ranges allowed the three layers to be combined proportionally within an RGB structure, enabling the composite to behave like a conventional RGB image in which each channel contributes consistently to the resulting color mixture.
By applying SAM to these fused composites, we obtained spatially coherent segments and well-defined boundaries, facilitating the extraction of meaningful patterns from multi-source geospatial data. This strategy provides a flexible, scalable, and reproducible framework for automatic segmentation across heterogeneous landscapes, enabling improved interpretability and operational efficiency in complex environmental assessments.
5.6. Dataset
All inputs and outputs were organized under a reproducible and human-readable directory structure rooted at the Area of Interest (AOI). Raw acquisitions were kept separate from processed products, with Sentinel-1 (S1) and Sentinel-2 (S2) data stored independently by sensor. Filenames systematically encode the AOI, product type, polarization (for S1), orbit direction, processing level, and the acquisition or compositing window. Unless otherwise specified, all rasters are provided as GeoTIFFs cropped to the AOI.
5.7. Analysis
The processed datasets described above were used to perform a multi-source analysis aimed at characterizing water bodies and surrounding land cover dynamics within the Area of Interest (AOI). Sentinel-1 despeckled imagery provided robust backscatter information sensitive to surface roughness and moisture, while Sentinel-2 composites and derived indices (NDVI, NDWI, and NDBI) captured complementary optical features related to vegetation vigor, water extent, and built-up areas.
The analysis proceeded in three stages. First, exploratory visual inspection of SAR backscatter and spectral indices was conducted to identify temporal trends and potential anomalies. Second, fused SAR–optical composites were segmented using the Segment Anything Model (SAM), enabling the delineation of spatially coherent regions of water and land cover classes. Finally, multi-temporal comparisons across quarterly composites were carried out to detect changes in water body extent, vegetation condition, and built-up expansion.
This integrative approach allows the quantification of seasonal and interannual dynamics, supports the detection of abrupt changes, and provides a framework for linking geospatial patterns with environmental drivers. The outputs of this stage serve as the basis for the results presented in
Section 6, where quantitative metrics and visual evidence are reported.
According to [
49], the main findings indicate that analyzing an area using different sources of information, layered as in a multi-source approach, enables a better understanding of the environment starting from its observation as perceived by the human eye (RGB). This facilitates comprehension of the study site over a given period of time, while in some cases revealing the persistence of cloud cover in specific locations. SAR imagery, on the other hand, enhances the understanding of the environment in terms of surface roughness, allowing for the distinction between topographically rugged areas and flat, modified zones associated with riverbeds or built structures.
Data were collected from different study years, enabling proper comparisons between periods with diverse hydrological regimes, although some issues related to cloud cover were partially overcome by combining information from passive remote sensors (affected by cloud interference) with active SAR-type sensors.
The results derived from spectral combinations, where each band incorporates diverse information (such as indices or satellite spectral bands), make it possible to generate, for the same scene, images at different color scales according to the input channel: red, green, and blue (RGB). The color intensities entering through the RGB bands, in turn, reflect the level of each input variable within specific ranges. Thus, such graphics allow for the extraction of summarized information on data related to moisture (associated with NDWI), vegetation (associated with NDVI), infrastructure, or built-up areas (associated with NDBI), as well as data obtained from active sensors such as SAR, all within a single representation.
Since the input indices or SAR data are continuous rasters, the outputs are also continuous rasters, which, when processed using the aforementioned methods, yield results grouped into classes.
5.8. Workflow Summary
The overall workflow begins with the definition of the Area of Interest (AOI) and the temporal range of analysis, which serve as the basis for all subsequent steps. Data acquisition was then conducted through the Google Earth Engine (GEE) platform, where pre-download filters were applied to guarantee quality and temporal consistency. For Sentinel-1, the first available acquisition of each month was selected, including both VV and VH polarizations and both ascending and descending orbits, in order to capture complementary viewing geometries. For Sentinel-2, cloud and shadow pixels were excluded using the Scene Classification Layer (SCL) band, so that only valid reflectance values were retained.
Once the pre-filtered data were identified, Sentinel-1 and Sentinel-2 imagery was exported via the Python–GEE interface. The datasets were subsequently postprocessed locally: Sentinel-1 imagery underwent despeckling through an autoencoder-based model, while Sentinel-2 composites were used to calculate NDVI, NDWI, and NDBI indices. In addition, fusion steps were performed to combine SAR and optical inputs, enabling subsequent segmentation tasks such as those implemented with the Segment Anything Model (SAM).
All outputs were consistently organized following the reproducible directory structure and systematic naming scheme described in
Section 5.6. The entire workflow was implemented through Python scripts and the GEE API, ensuring both reproducibility and scalability of the methodology.
5.9. Software Prototype Development
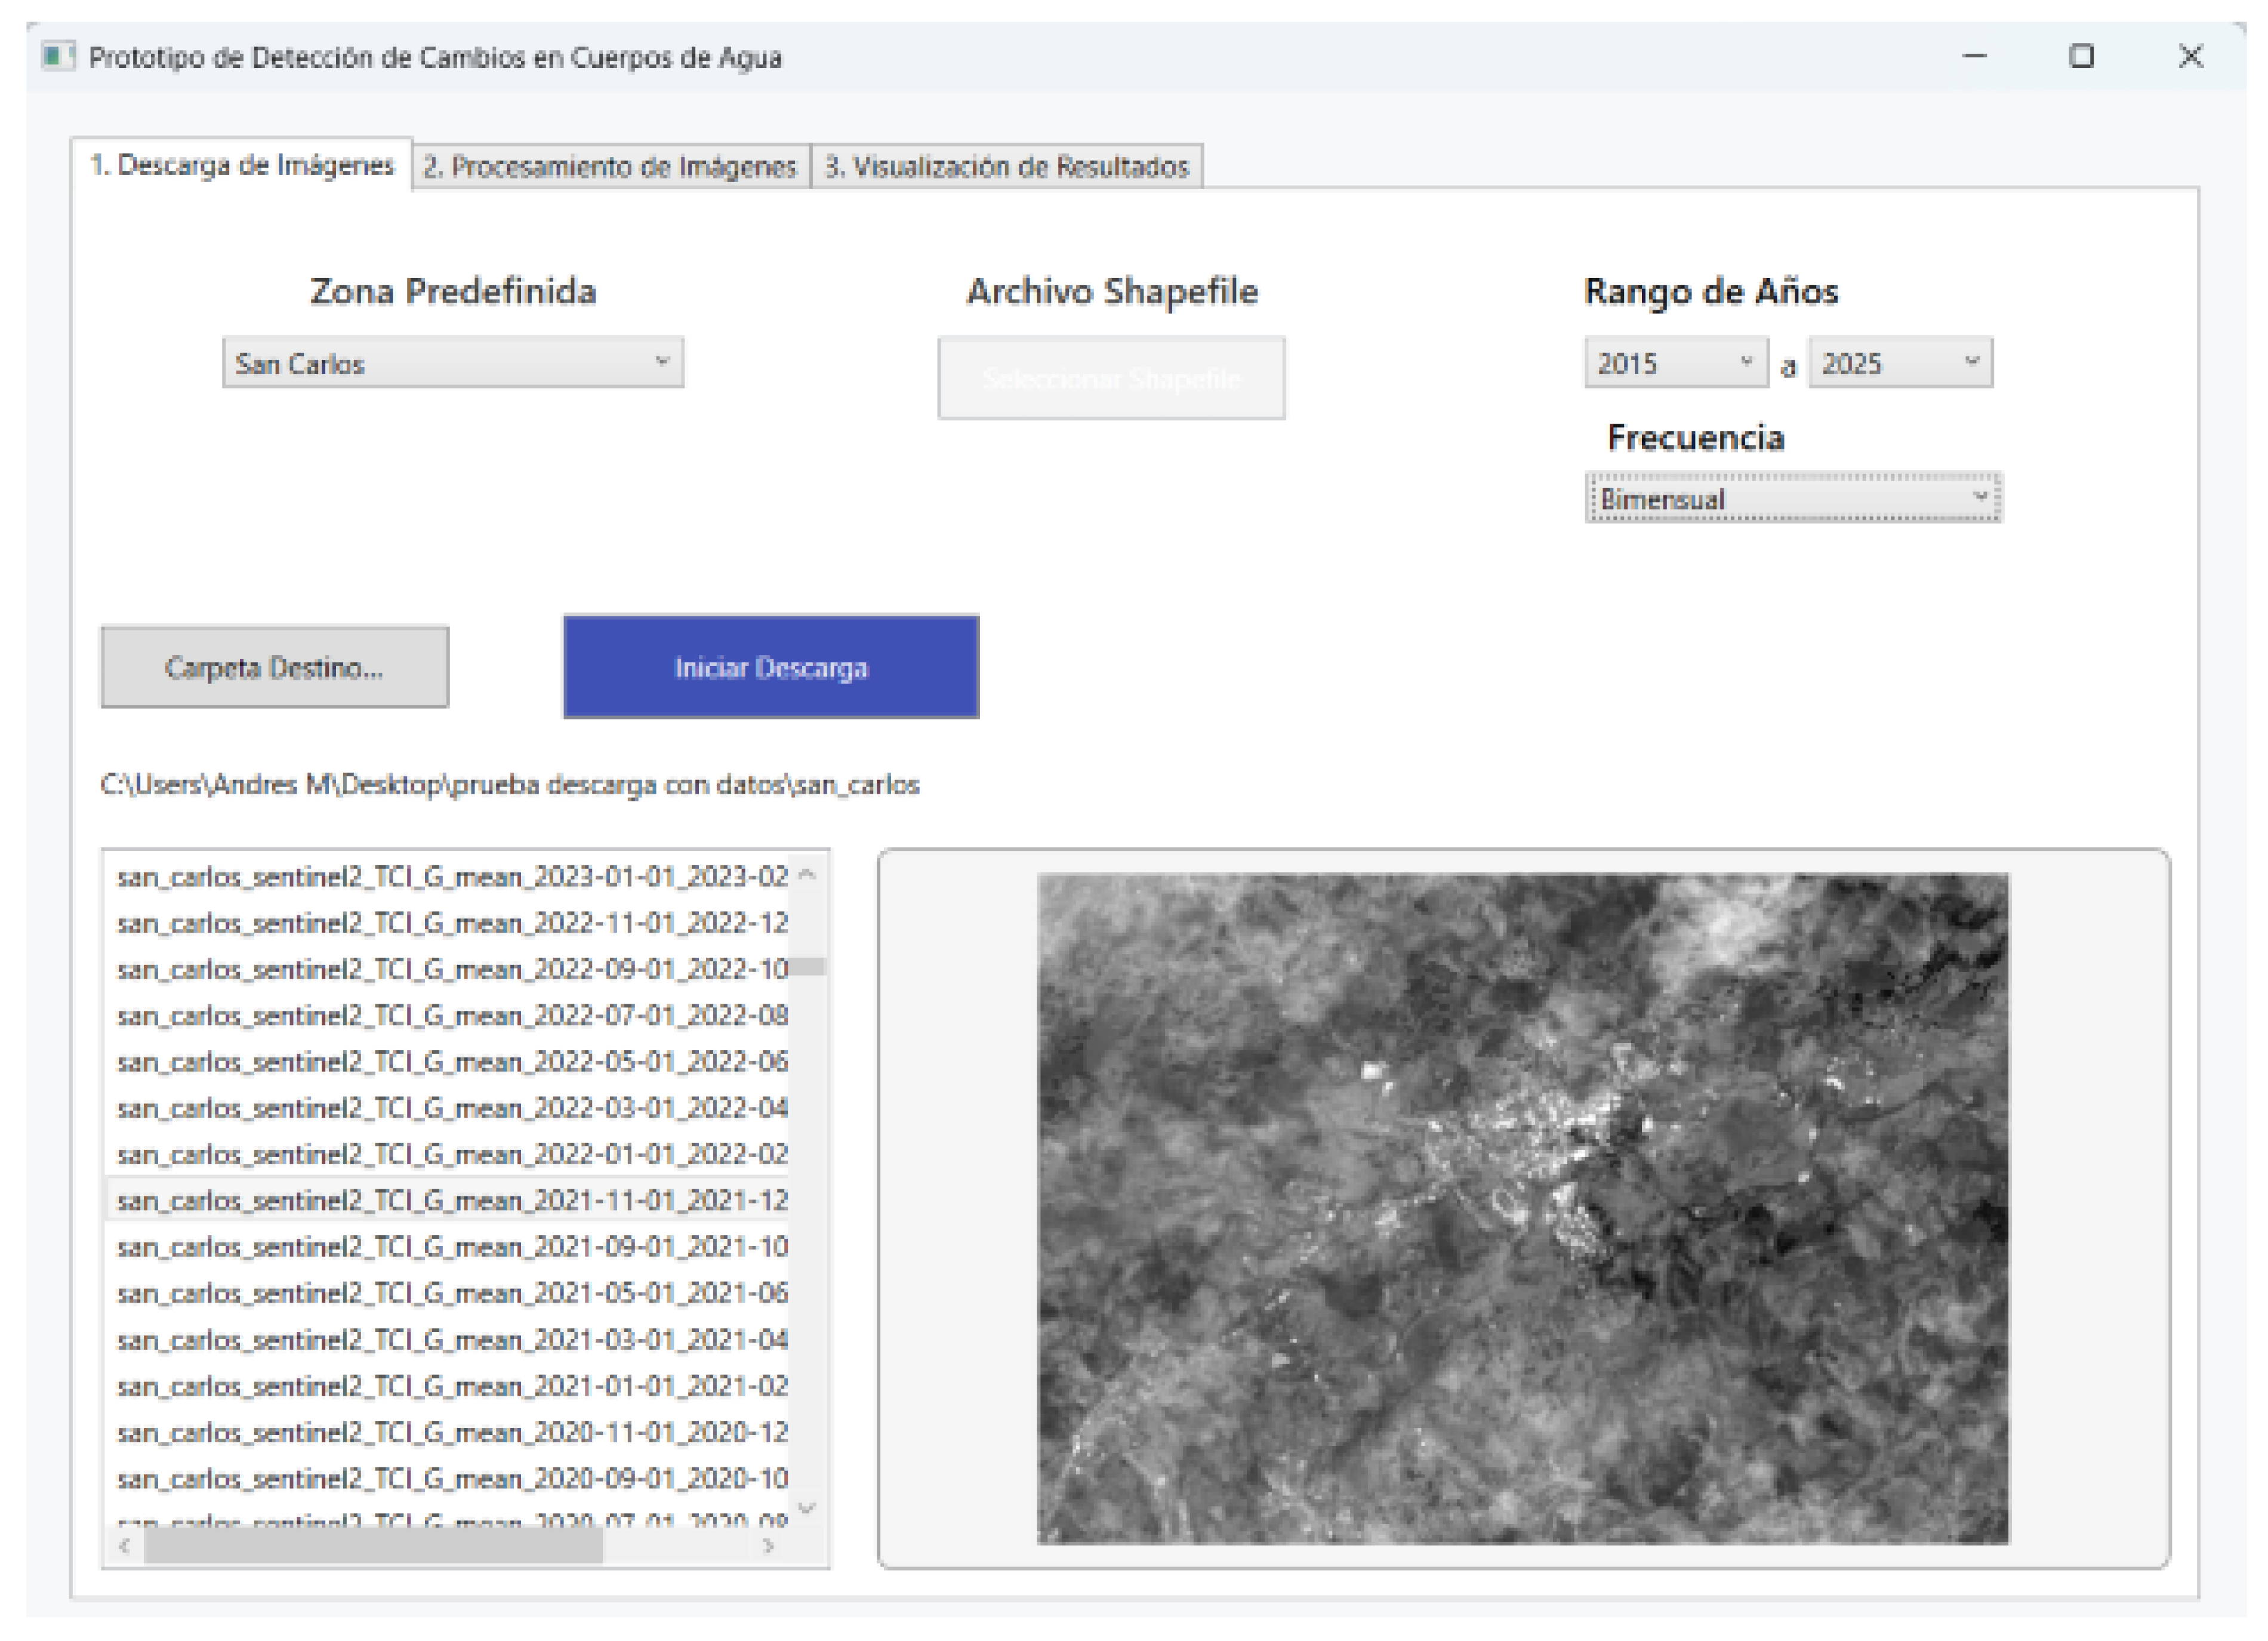
A software prototype was also developed in Visual Studio for downloading, processing, and displaying images, using a modular structure separating business logic, the interface, and external scripts. In this software, the download and processing scripts were compiled into .exe executables using PyInstaller. These executables were embedded in the application’s main executable and extracted and executed at runtime using the ResourceExtractor.cs class, without requiring additional user configuration. The download module allows the user to configure the area of interest, the date range, and the frequency for querying Google Earth Engine. The system also includes a single executable for downloading satellite images. Images are downloaded from Google Earth Engine using Python scripts that employ the earthengine-api and geemap libraries. The images are automatically named, including the area, sensor, band, and time period, facilitating their subsequent identification. Image processing was also centralized into a single executable. This module takes previously downloaded images as input and generates spectral indices such as NDWI, NDVI, and NDBI, using libraries such as rasterio and numpy. The scripts were organized into reusable components that allow calculations to be scaled to different areas or sensors. The processing results are stored as .tif files, and their georeferencing is preserved. For image storage and retrieval, a local SQLite database was used, managed through the ImágenesDB.cs class. This class implements the logic to automatically scan user-selected folders and register available images in the database if they do not already exist. This functionality ensures that the system keeps its internal repository up to date without requiring manual uploads by the user. The interface of the software created is shown in
Figure 4.
6. Results
The results constitute an authentic repository of useful information for the multidimensional analysis of areas of interest. For each area of interest, a set of graphical outputs was generated based on different combinations, thereby providing descriptions of its physical, hydraulic, and even anthropic conditions.
6.1. Exploration of Spectral Indices
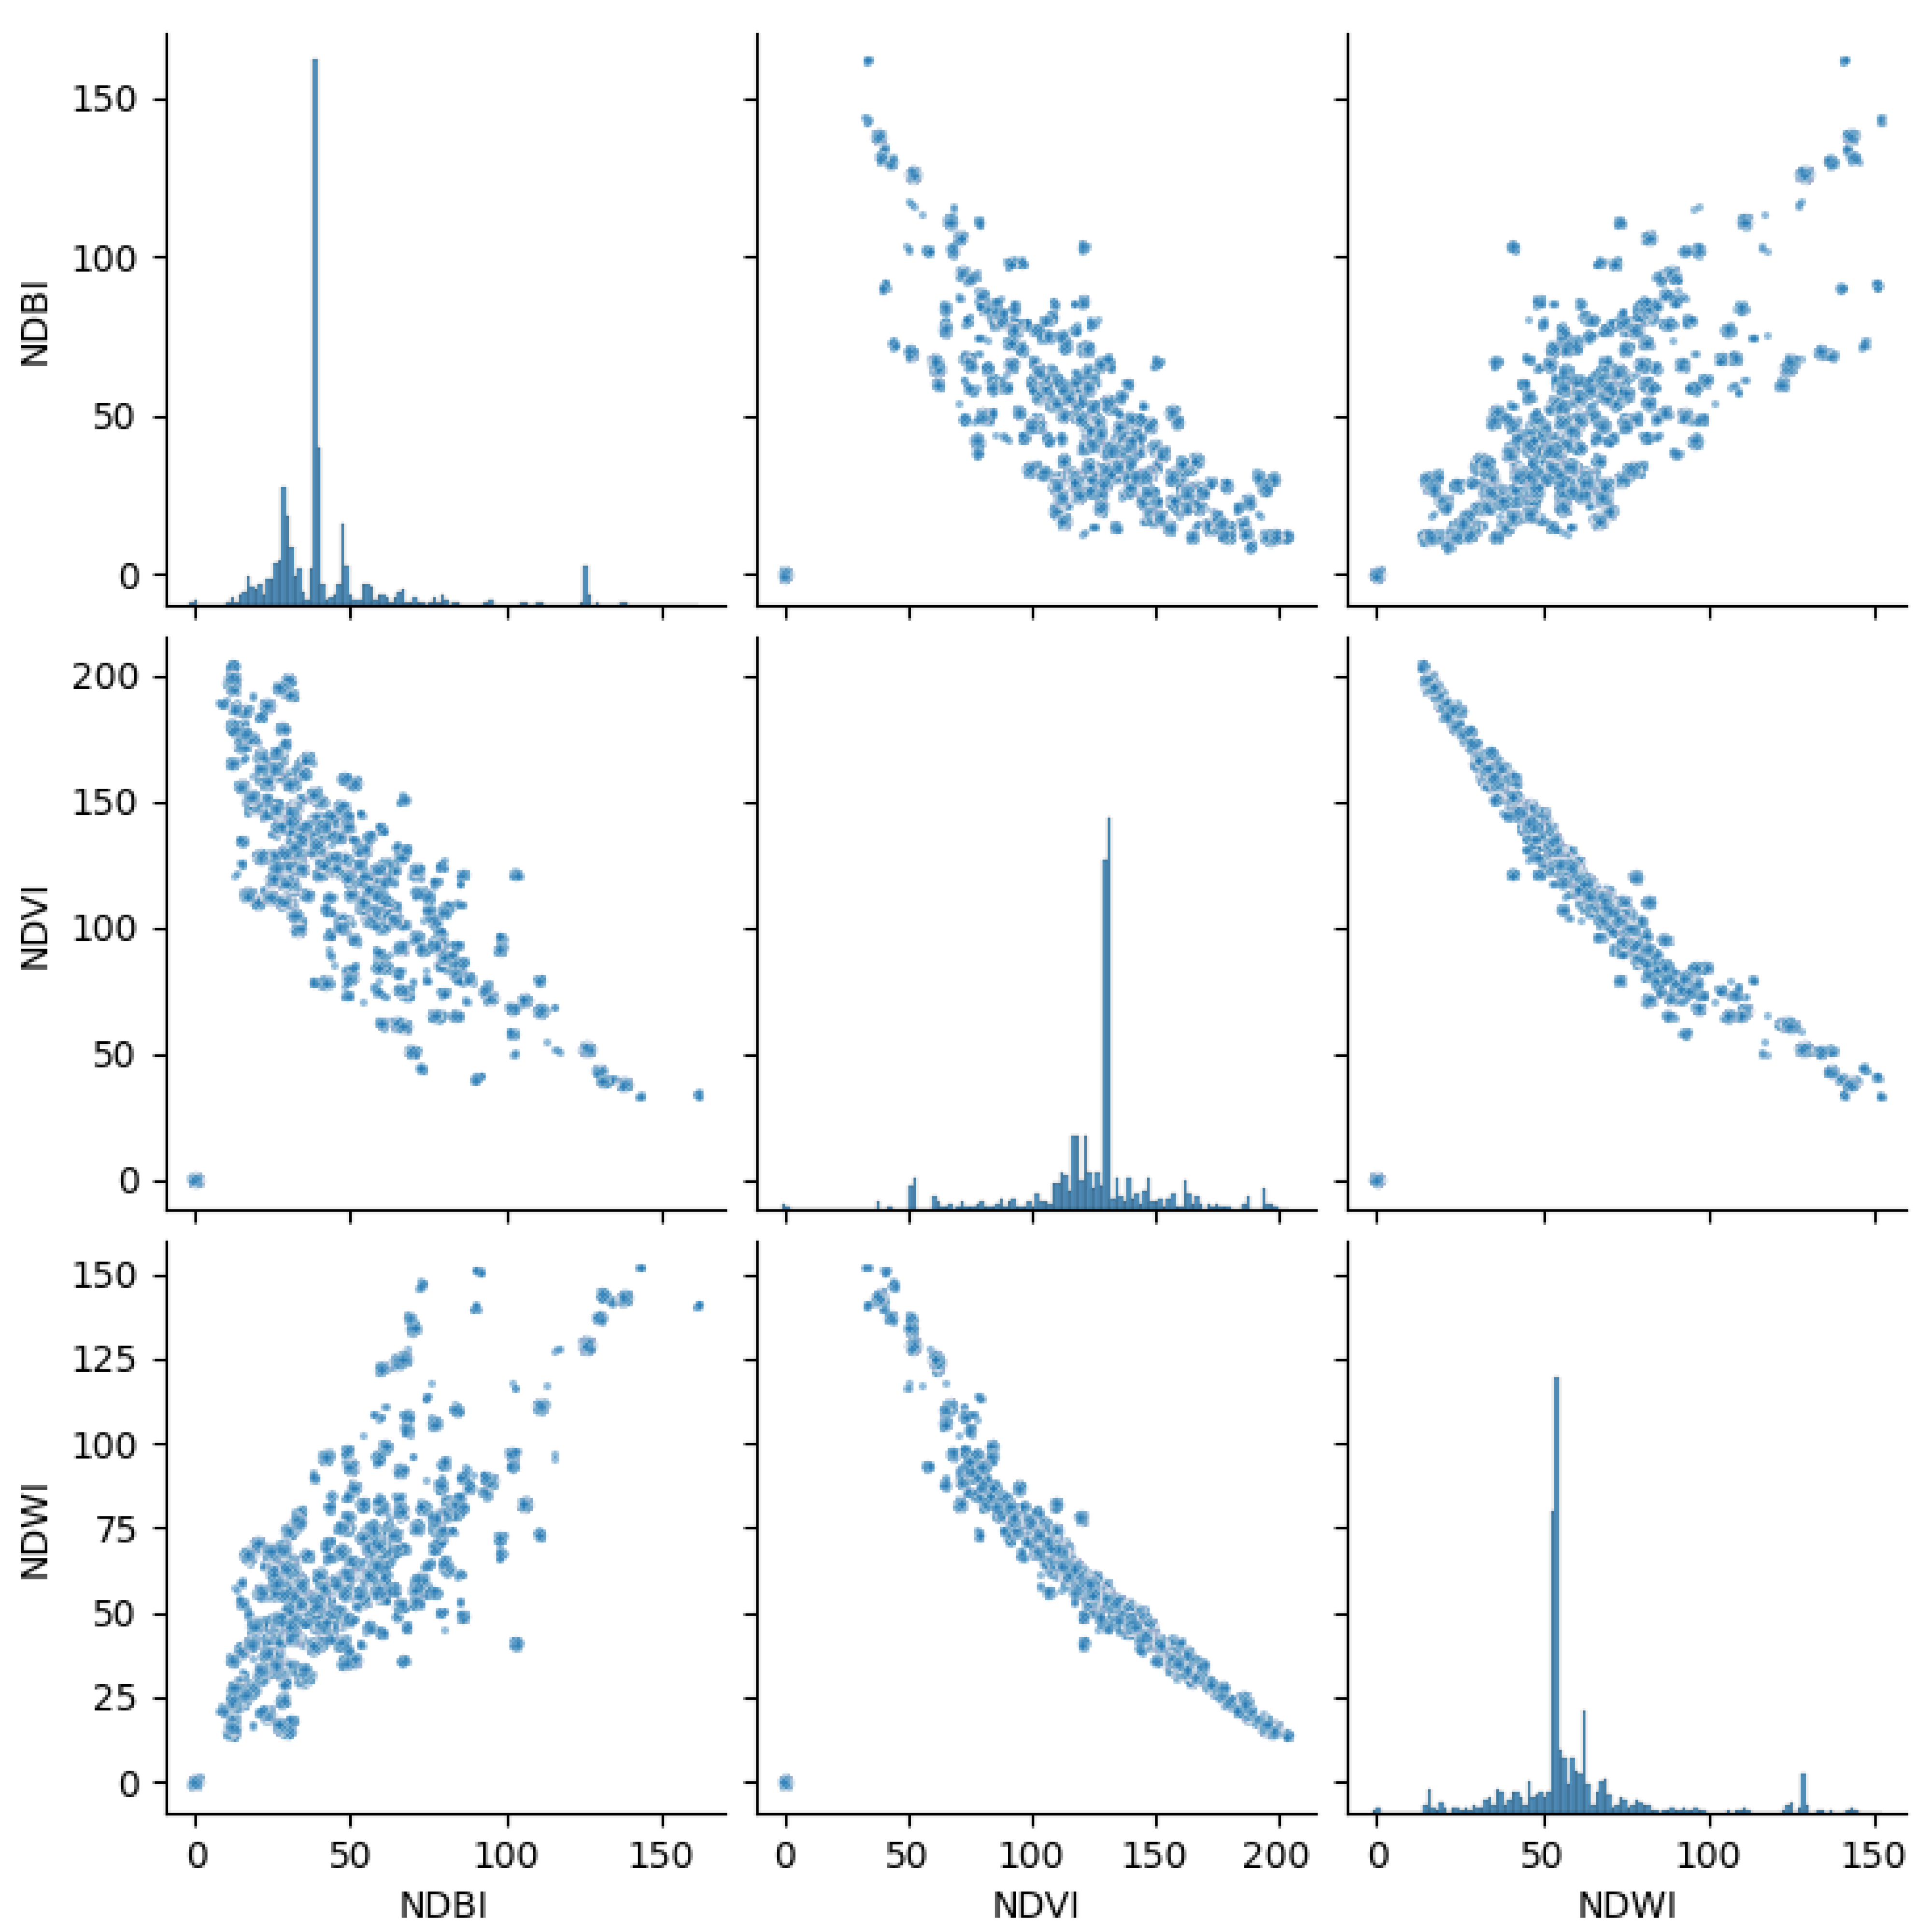
A preliminary exploratory analysis was conducted using a scatter plot of scaled (0–255) versions of the NDWI, NDVI, and NDBI indices derived from Sentinel-2 imagery (
Figure 5). The relationship observed between NDVI and NDWI highlighted NDVI and NDBI as the most representative spectral indices for subsequent image fusion. To enhance structural information, these indices were complemented with Sentinel-1 SAR VH backscatter, enabling the construction of a composite RGB representation. This fused image served as the input for segmentation using the Segment Anything Model (SAM), a state-of-the-art foundation model designed for promptable object segmentation across diverse image domains.
6.2. Confluence of La Mosca Creek and the Negro River
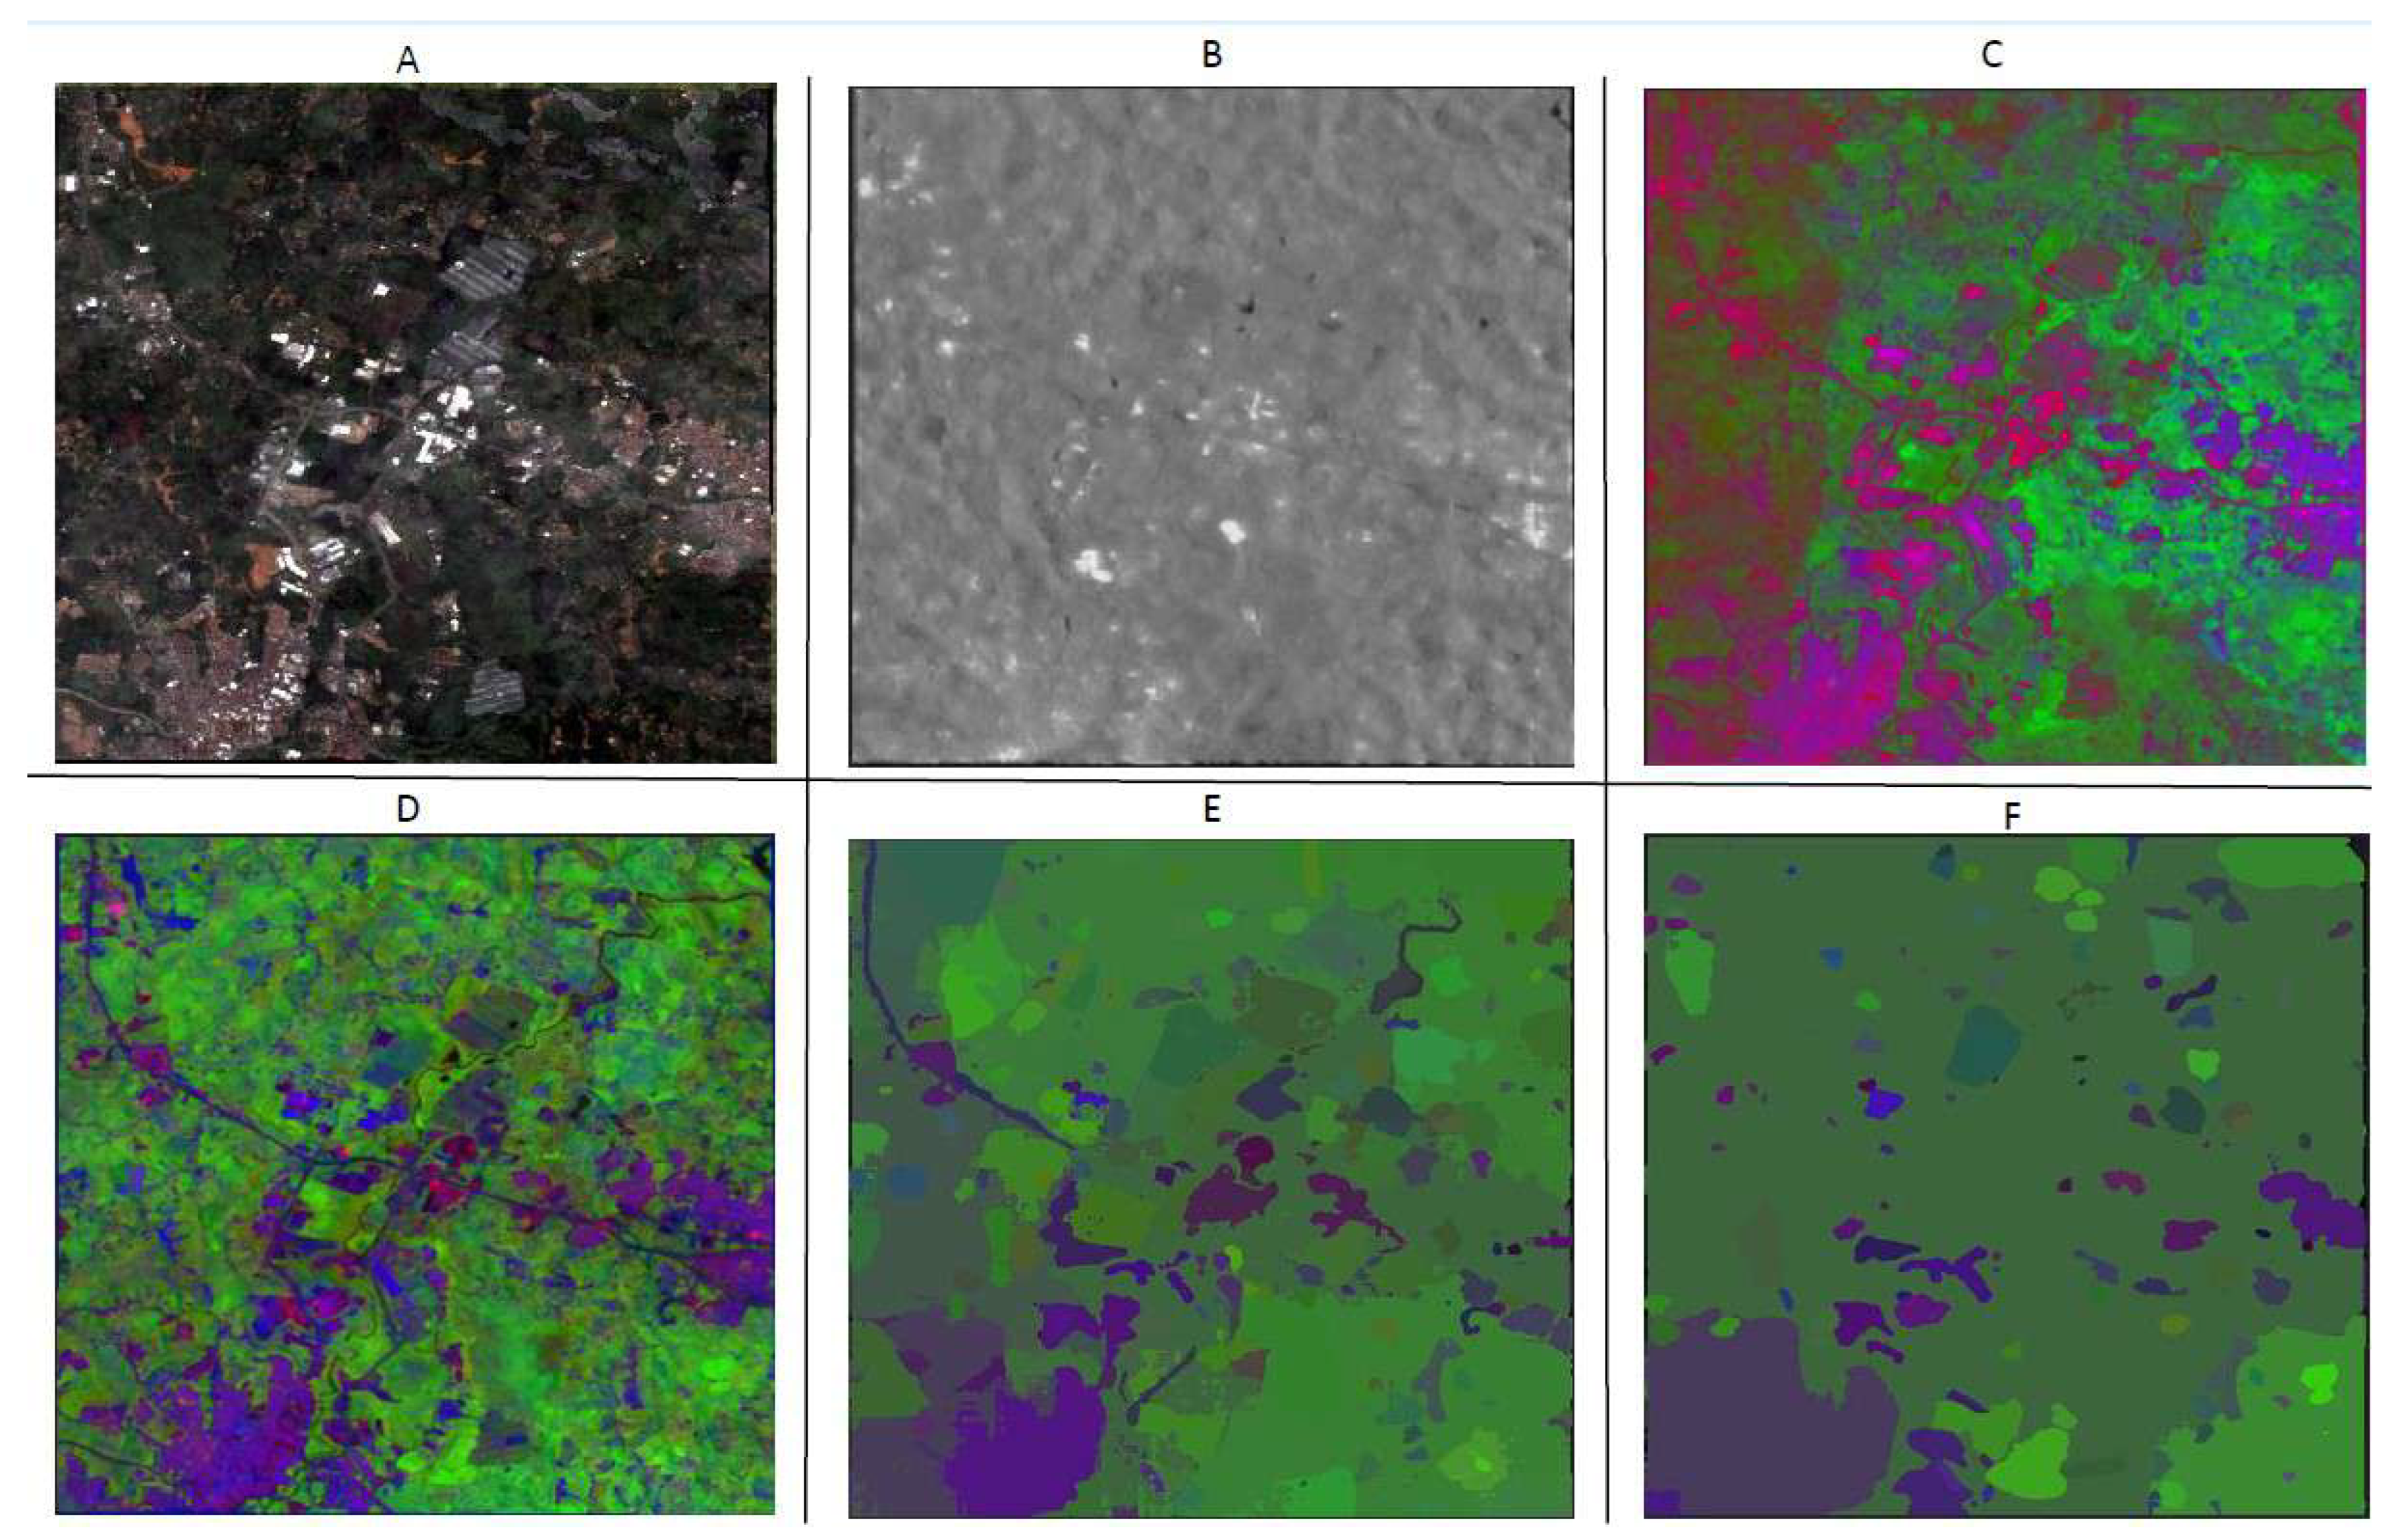
In
Figure 6 the true color image (A) highlights the urbanization and industrialization of the area of interest, which increases the vulnerability of such infrastructure to flooding risks caused by the hydraulic retention of La Mosca Creek when attempting to discharge its waters into the Negro River. The national highway connecting the city of Medellín with Bogotá can also be observed, located very close to the site where flooding events have been recorded.
The SAR scene (B) reveals uniform elements associated with road embankments and the coverings of certain industries, such as the greenhouses in the upper sector, which are common in the area. In turn, the index fusion scene (C) provides a valuable source of information, particularly through the low values of the red band associated with the NDBI, which faithfully reflects the high levels of infrastructure in the area. It also allows for the identification of the Negro River’s course, meandering across the area from southwest to northeast, passing near the national highway and certain constructions at risk of flooding, as they are located in a low-lying confluence zone such as that illustrated in
Figure 2.
The NDVI, meanwhile, distinguishes, through its range of green tones, areas with greater vegetation density from those with little or none. Finally, images D, E, and F—where SAM is applied respectively to RGB, SAR, and the combined indices—facilitated the interpretation of the scene by better discretizing the values that are originally presented in the images, segmenting by similarity.
6.3. Urban Area of the Municipality of San Carlos
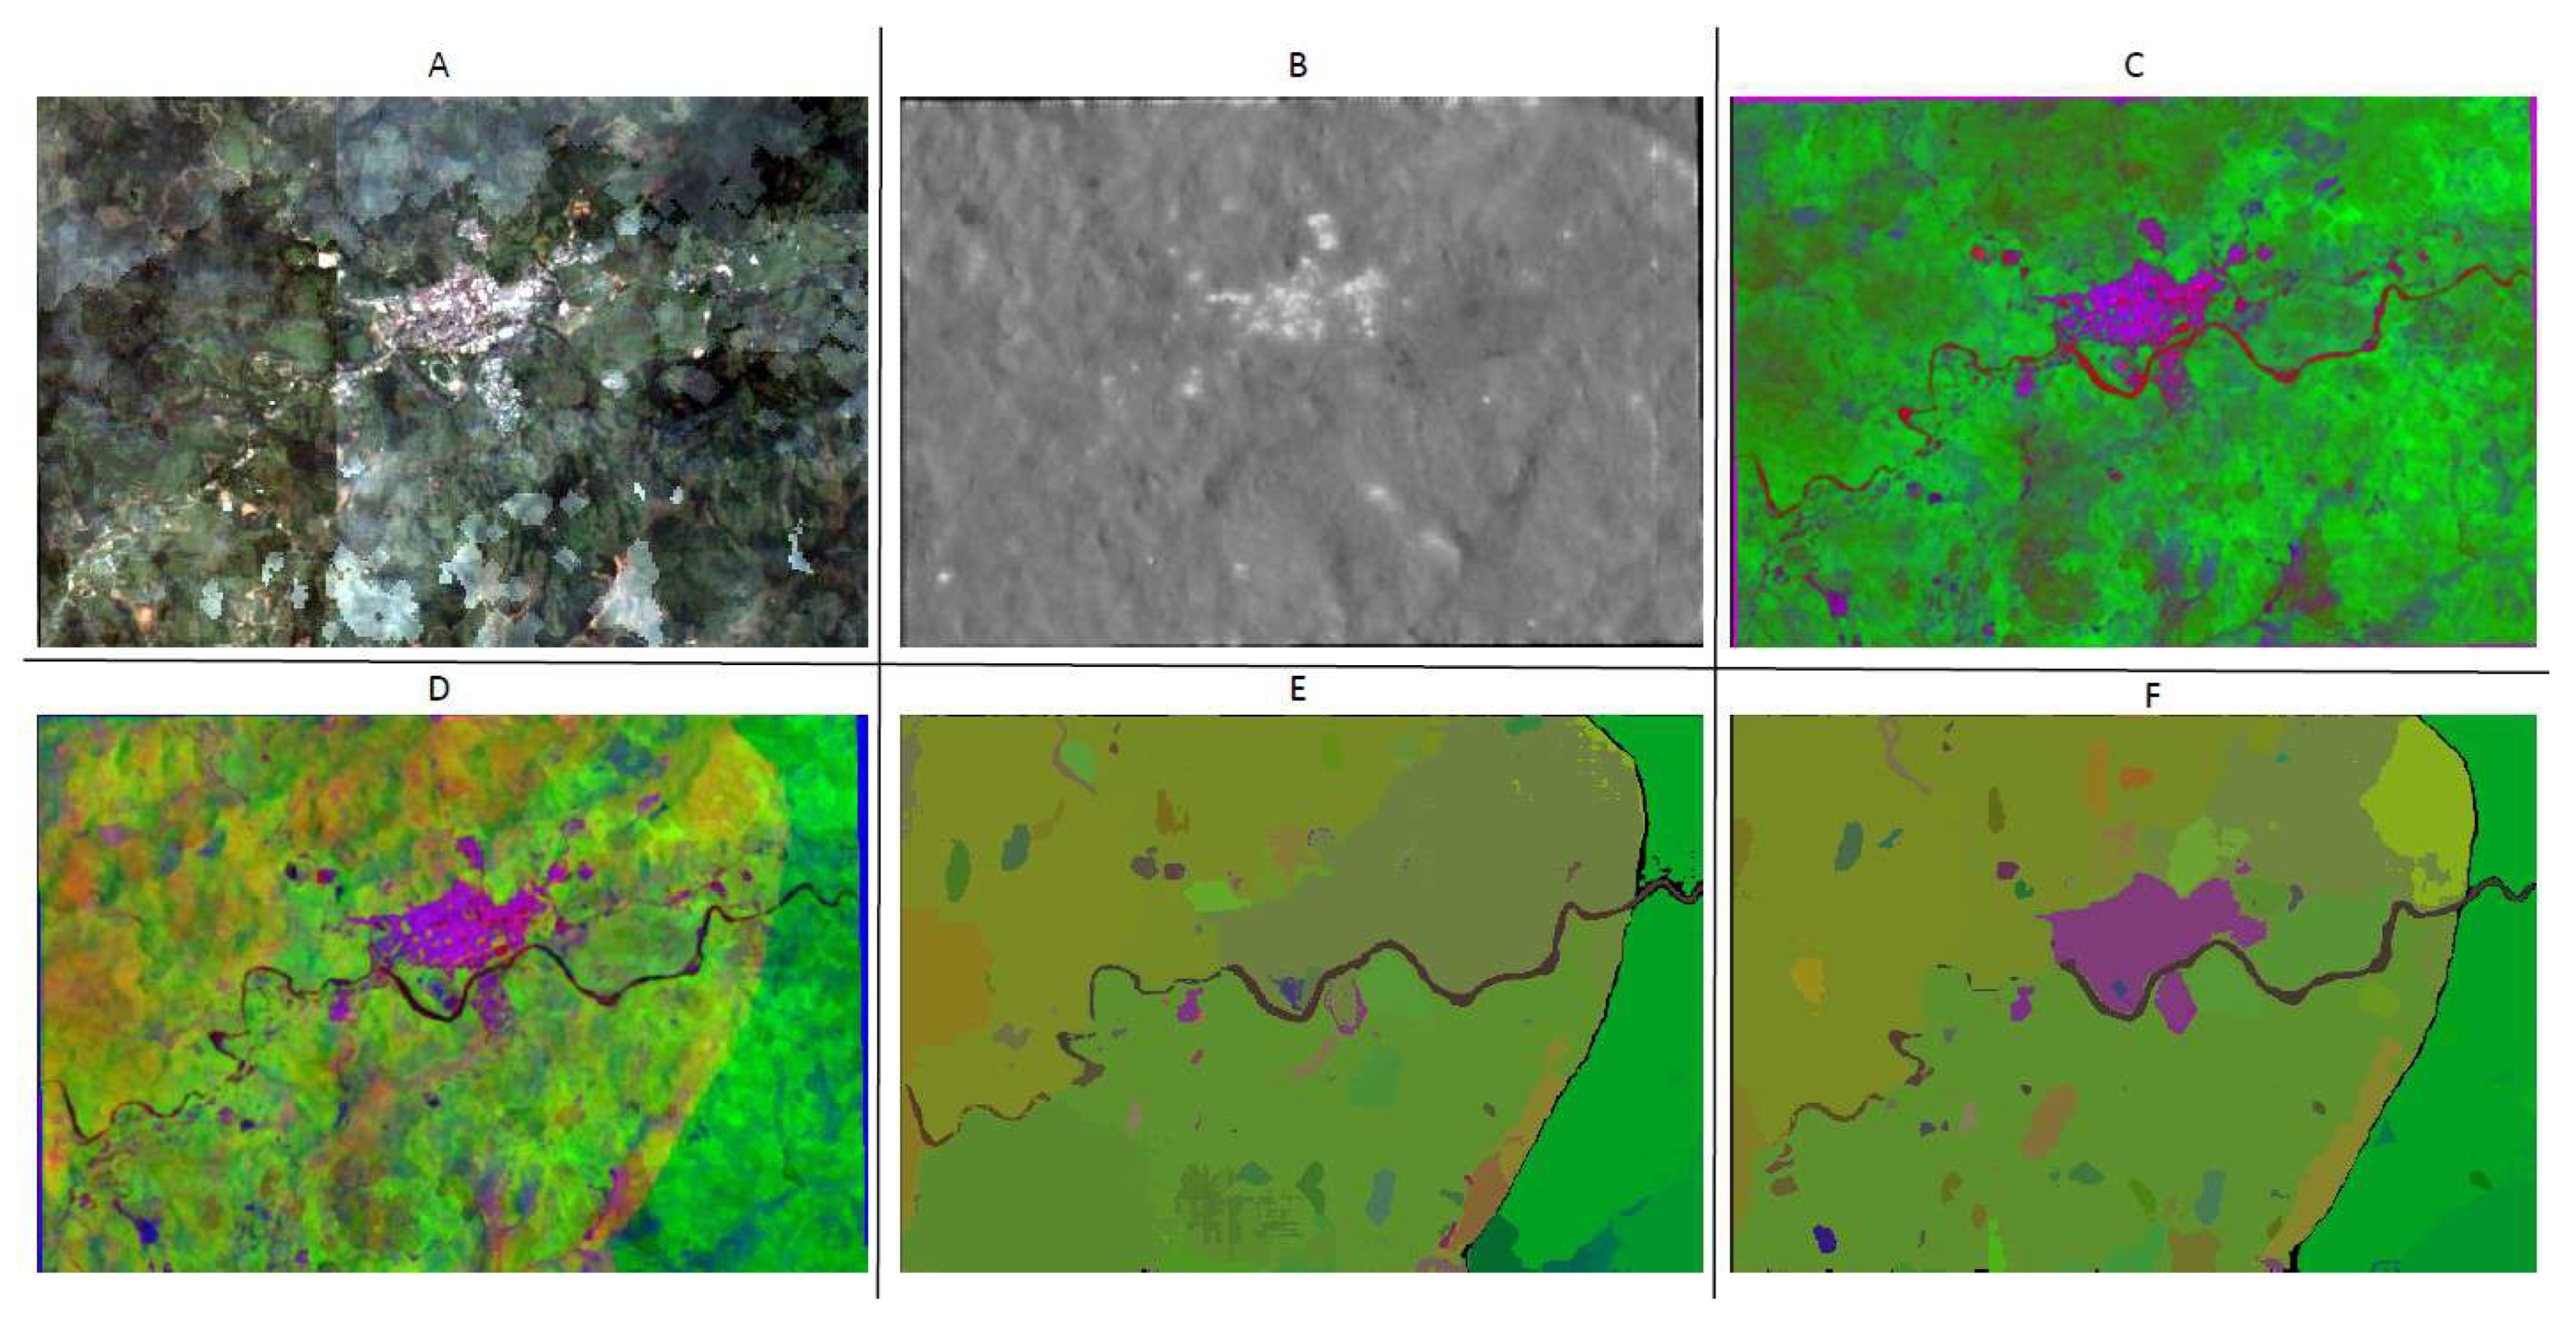
One of the major challenges faced in this area, clearly visible in the true color RGB image (A), is the persistent cloud cover characteristic of the rainy season, such as the one experienced in 2021, the year when these data were captured. The image shows the urban area of the municipality of San Carlos (
Figure 7), with the prominent addition of a human settlement on the opposite bank of the river, associated with flooding events of La Villa Creek at its confluence with the San Carlos River.
In the radar image (B), the typical roughness of the topography can be observed, as well as the SAR response of the urban infrastructure of San Carlos, without the cloud-related issues present in image A. Meanwhile, in image C, where the NDBI, NDVI and SAR-VH indices are combined in the red, green and blue bands, respectively, the spectral response of the San Carlos River is clearly evident, with its meandering behavior characteristic of backwater areas such as the one where the municipality is located (
Figure 2C′).
In addition, the southern part of the municipality, identified as being in a risk-prone area, can be clearly distinguished. This is associated with urban settlements developed without proper land use planning (referred to in Colombia as ‘invasión’), located after a sharp bend of the river and at the mouth of a stream descending from the mountainous area surrounding the city. This stream is shown in blue in image C, flowing from southwest to northeast.
By applying SAM to images A, B, and C, the understanding of the study area and the classes represented in the scene is improved, underscoring the importance of harmonizing the relationship between the urban center and the waterways that cross the area, in light of past hydrological events. In this way, images D, E, and F facilitate the visualization of the winding watercourse of the San Carlos River, the settlements distributed along its riverbanks, and the relative uniformity of vegetation in the area, ranging from moderate to low density.
For this scenario, it becomes evident that the construction of urban areas of San Carlos along the banks of a river with high hydraulic mobility—on its floodplains, also fed by creeks descending from the mountainous region—represents a risk magnified by the increased vulnerability of the population exposed to such hazards.
6.4. Buenos Aires—Cocorná Zone
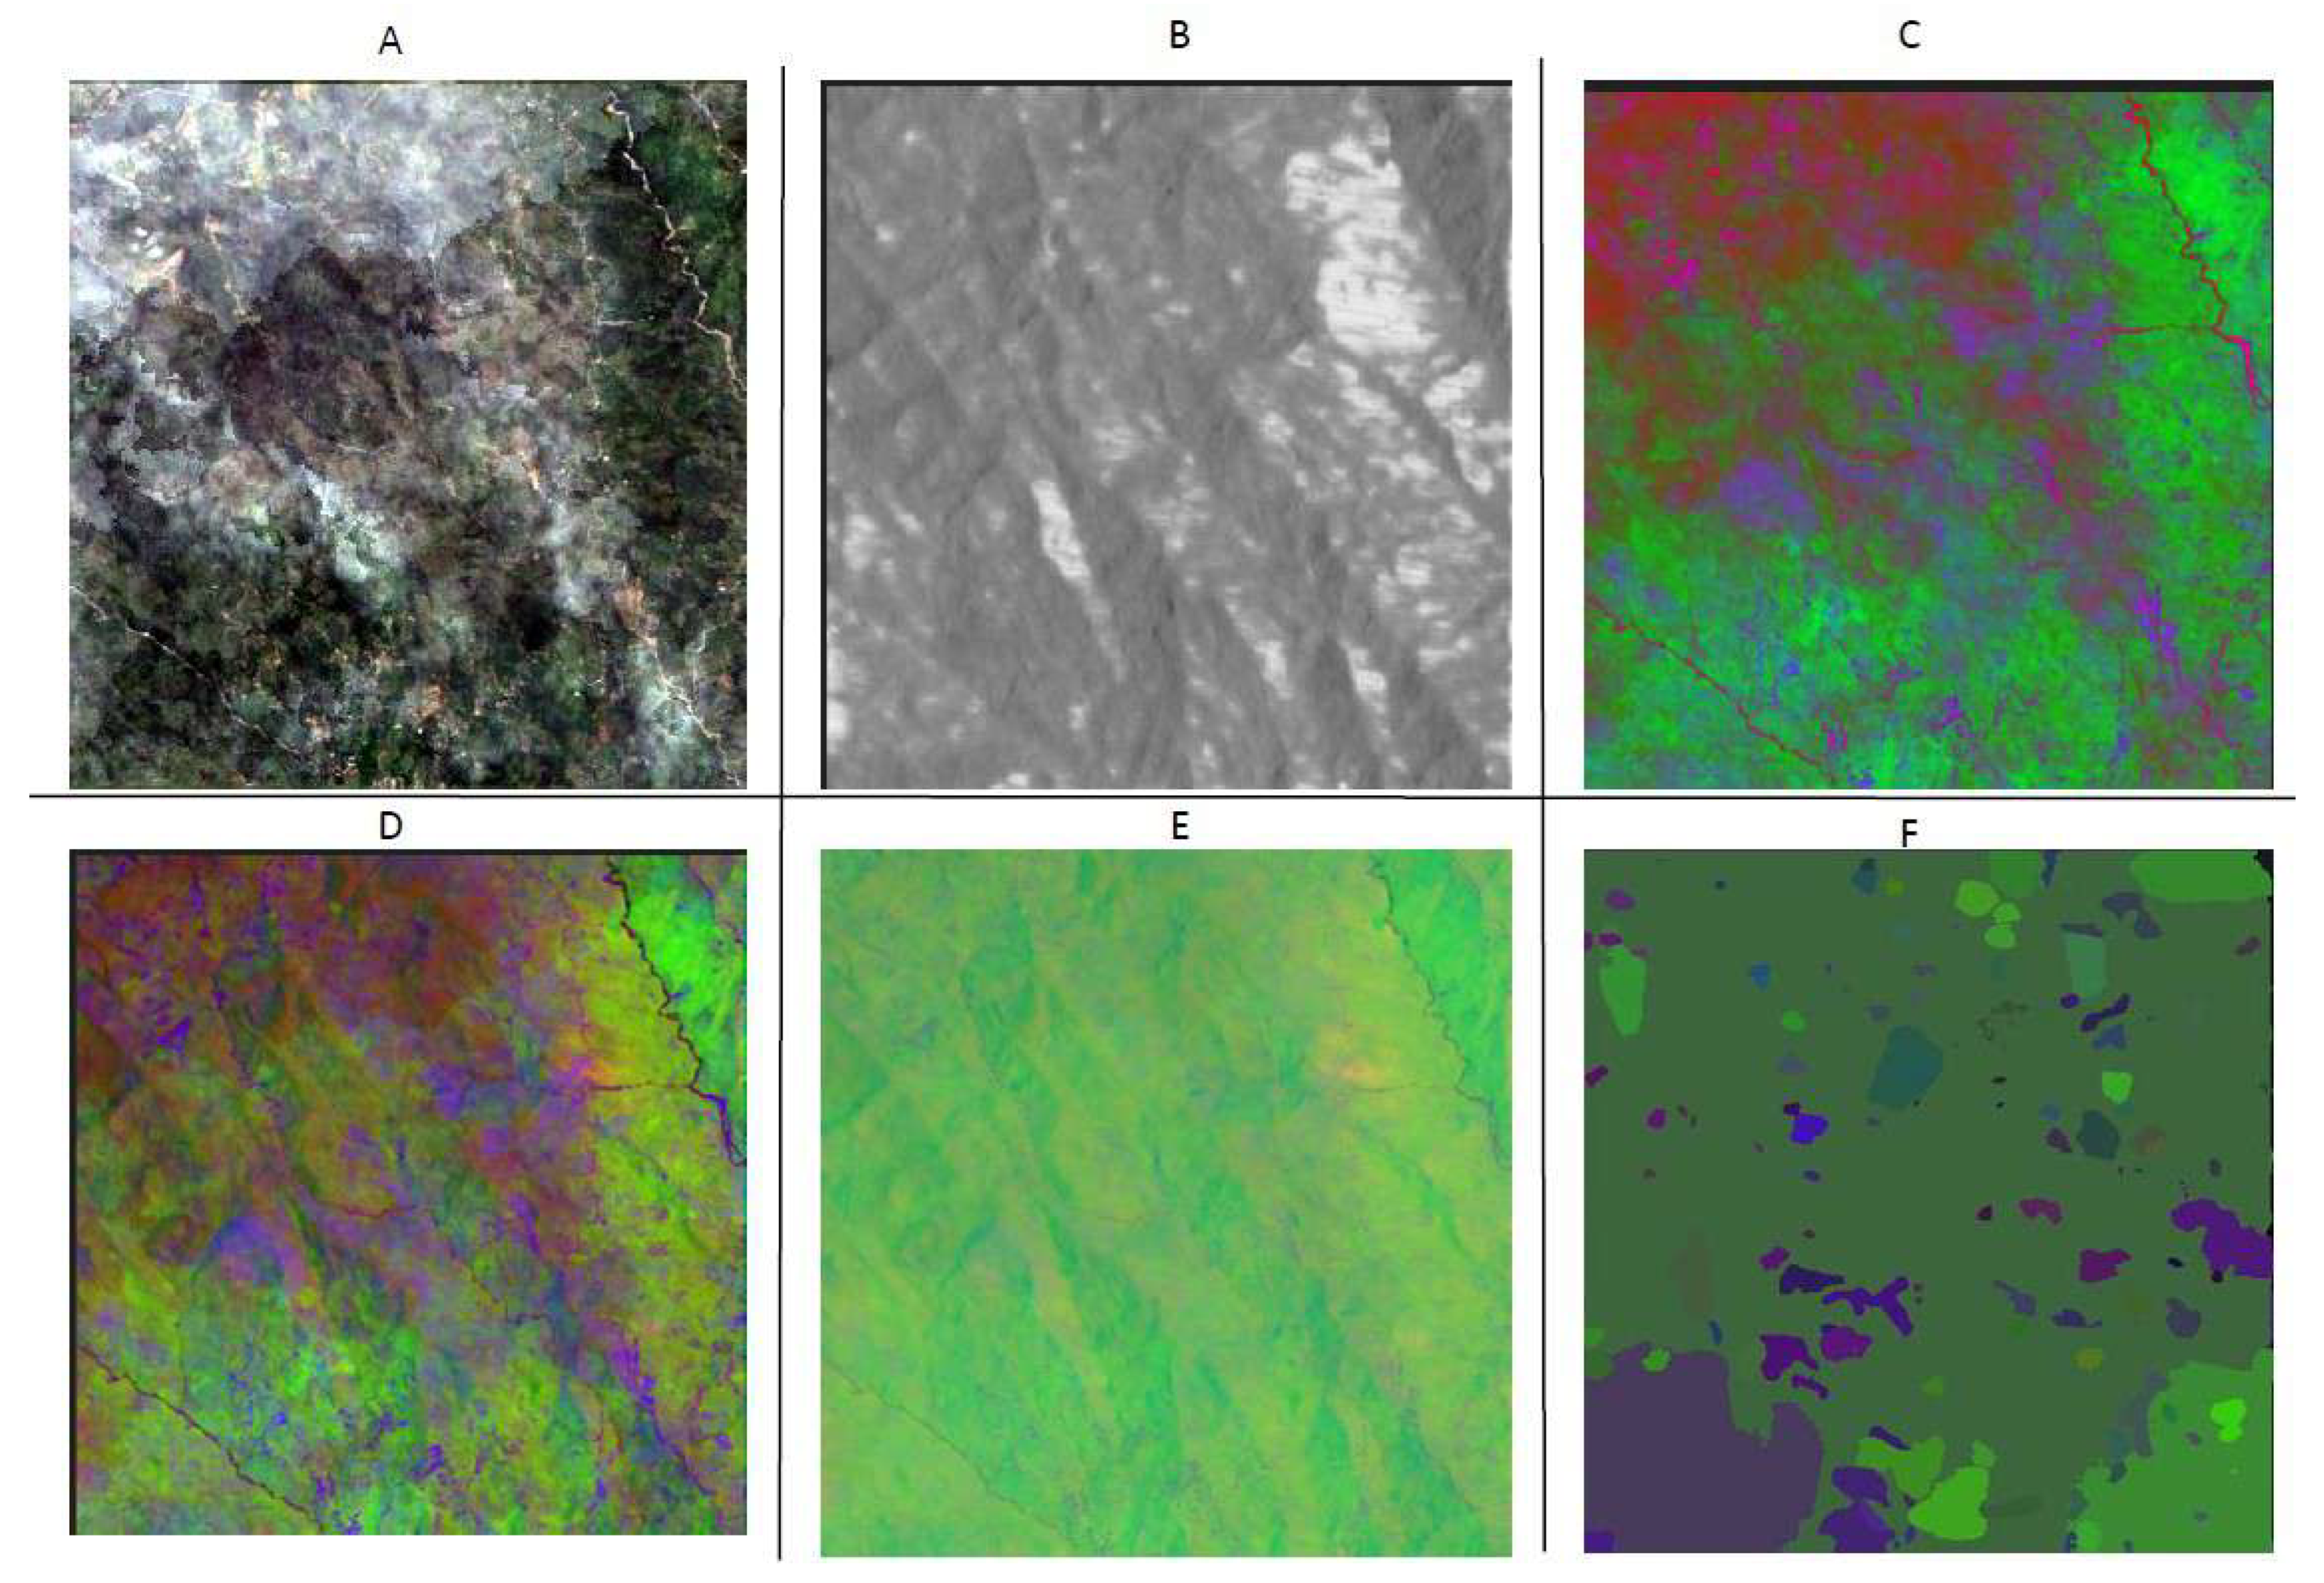
The Cocorná polygon of interest (
Figure 7) represented one of the greatest challenges in this analysis. As it is a headwater zone with highly mountainous terrain (
Figure 8B), the water bodies are not of considerable size and often fall below the spatial detection threshold allowed by the resolution of the sensors employed. Furthermore, the mountainous character of the area, located within the Central Andes mountain range, results in persistent cloud cover, which is evident in ImageA. The true color RGB composition shows clouded intervals that reflect the average atmospheric conditions of the scene.
The radar scan in Image B reveals rugged topography, with notable uniformity in certain areas (bright zones), likely associated with low vegetation along the slopes of local streams, particularly near the San Bartolo River. These conditions may contribute to material transport phenomena during flood events. The index combination in Image C presents challenges due to the aforementioned cloud cover; however, the hydrological network of streams and the river crossing the scene can still be distinguished.
Regarding Images D, E, and F—where segmentation is applied to the RGB image, the SAR image, and the index combination, respectively—the classification analysis proves complex because of the relative uniformity of the scene. Vegetation, and even cloud cover, dominates over other classes such as water bodies, which is especially evident in Image F.
The complexity of this area is thus linked to its rugged relief, where material transport processes prevail in the streams descending not only toward the urban center of Cocorná but also into surrounding areas, having caused flood events in lower-lying zones. Nevertheless, terrain characteristics, the small size of the streams, and the occasional occurrence of landslides, among other factors, complicate the analysis of this particular site.
6.5. Multi-Temporal Study
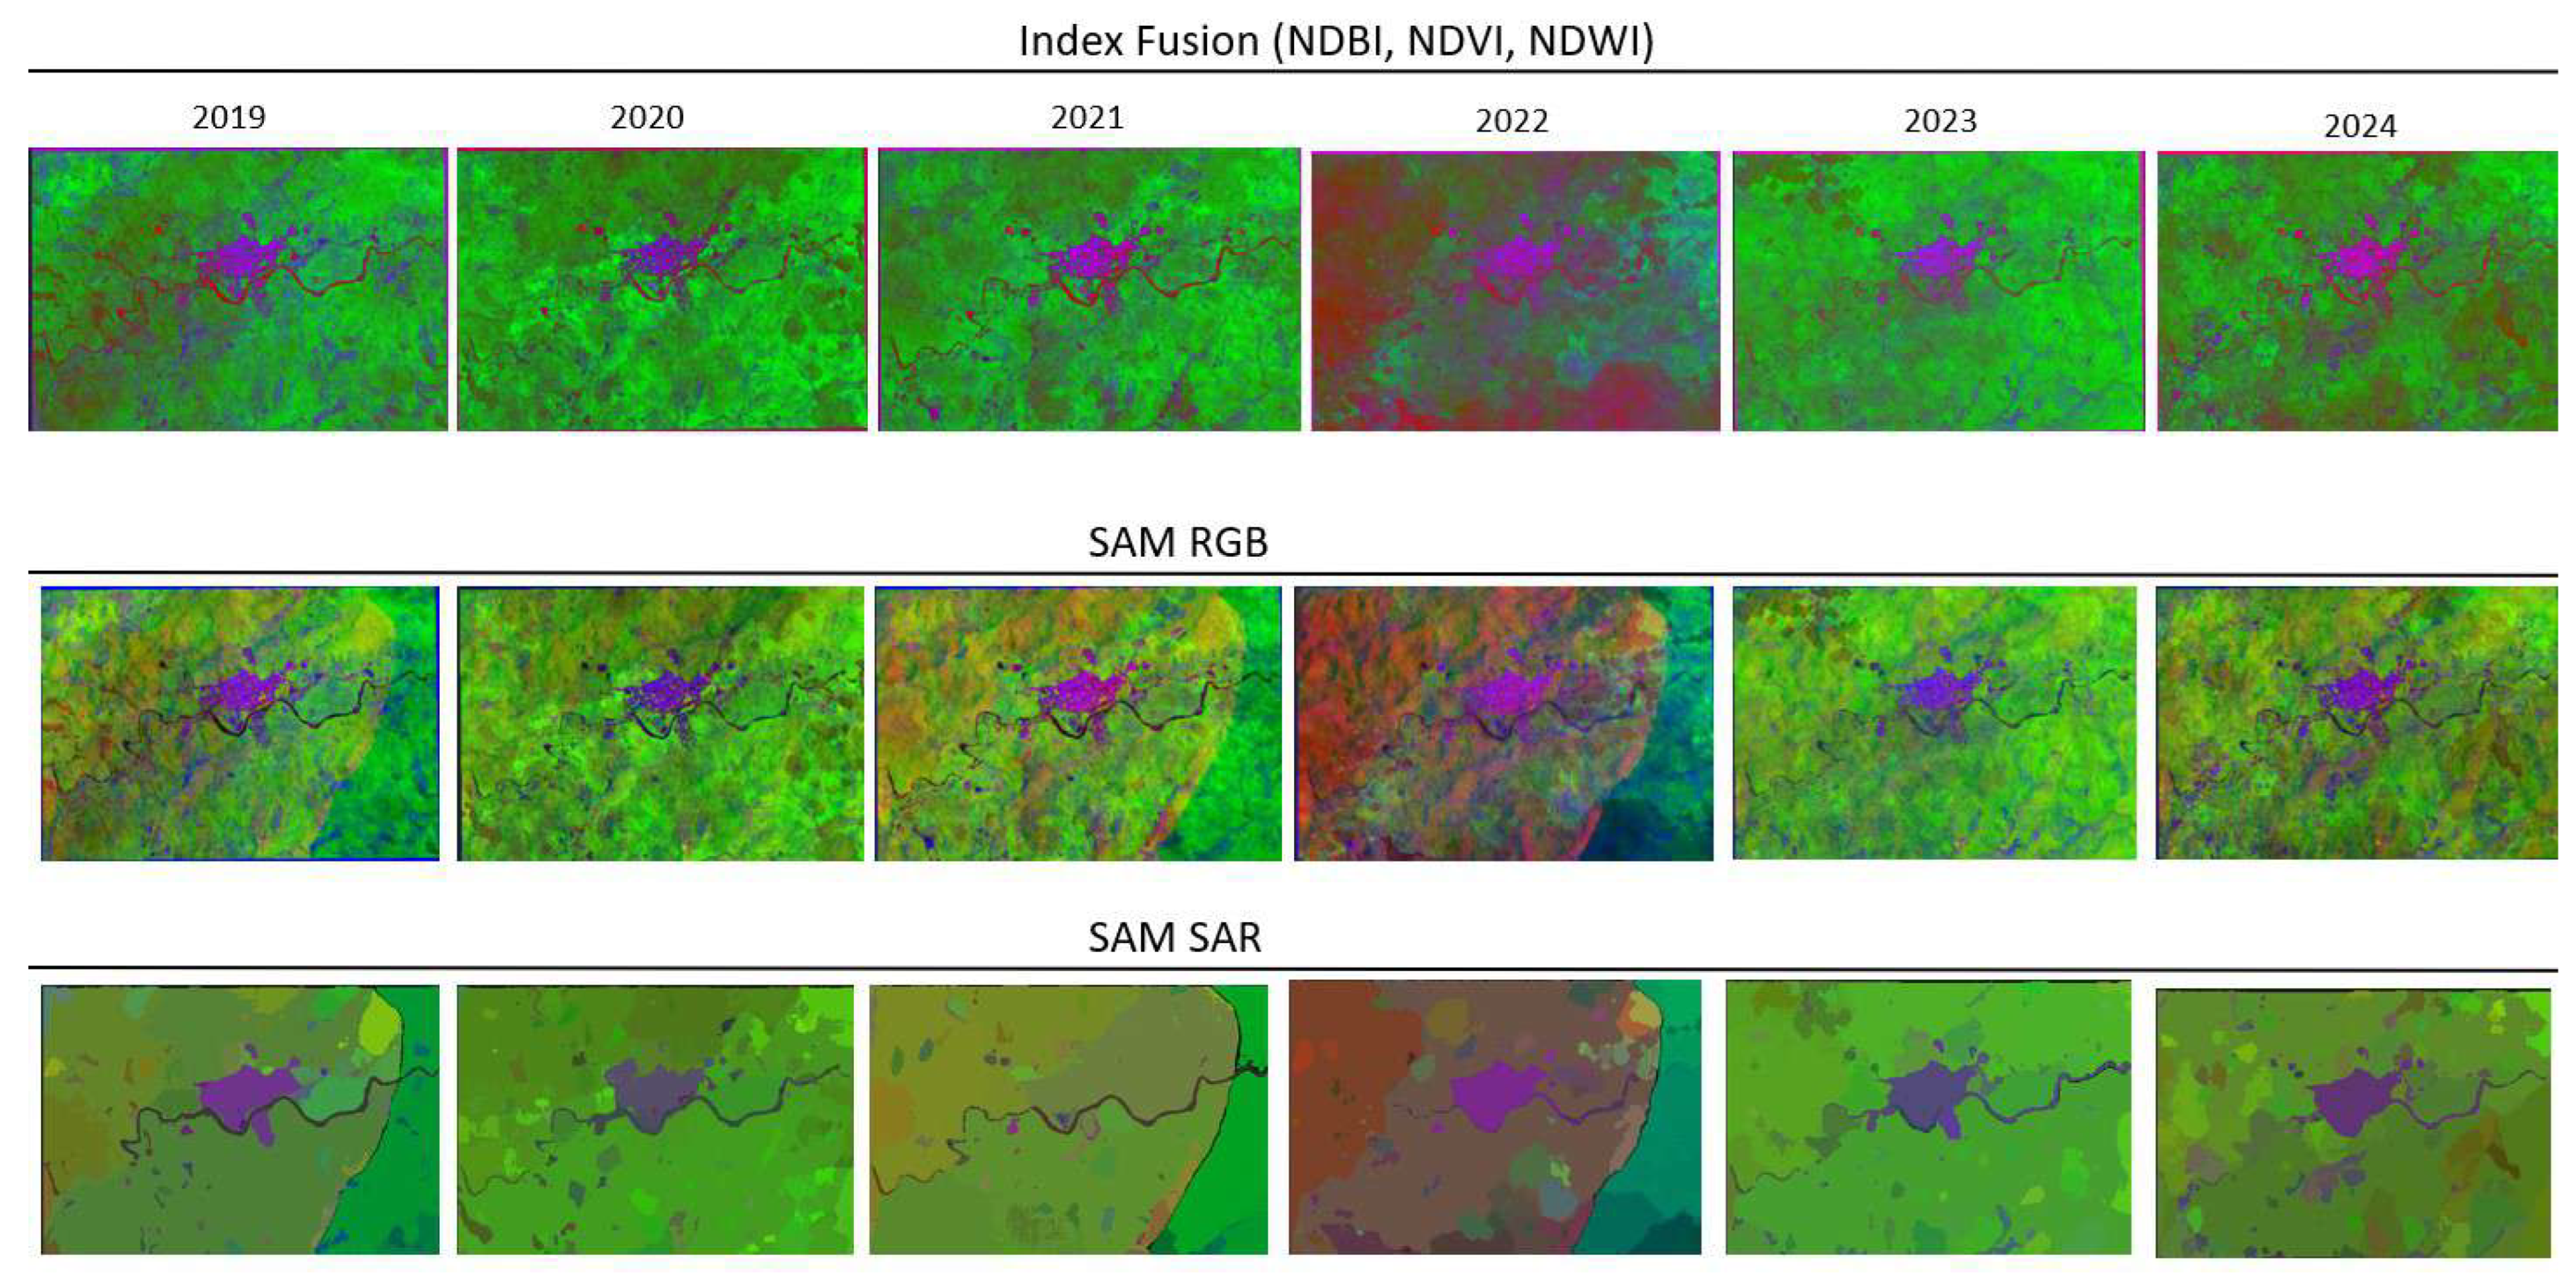
Given that satellite images are generated periodically and allow for the understanding of changes within a given area, the dataset provided was organized by year for each data collection. This organization made it possible to capture variations particularly related to cloud cover, water flows, land cover, and urban expansion. In the case of the municipality of San Carlos, for instance, the multitemporal changes of the indices employed and the SAM models for both RGB and SAR imagery are presented in
Figure 9.
Among the most noticeable variations in the multitemporal study of San Carlos is the change in the river’s width, most likely associated with the hydrological season, which increases or decreases the water surface depending on the amount of water being transported. Additionally, more hydraulically active zones can be observed, as a result of the hydrological configuration through which the river flows. Furthermore, changes are evident in the water dynamics of the La Villa streambed, which is more active in certain years (such as 2024) than in others.
Another notable variation is related to land cover, where the interference of cloudiness is evident due to its association with optical sensors. However, certain vegetation covers exhibit significant variation, most likely as a result of land-use changes associated with crops or the emergence of bare soils. Regarding the expansion of the urban footprint, no major changes are observed, given that the temporal window is relatively short.
With respect to the SAM results, these are consistent with the observations but in a more continuous manner, allowing greater emphasis on the water body and land cover.
Finally, it is worth highlighting the notable difference between the multitemporal analysis capacity of an RGB image processed with SAM and that of a SAR image using the same technique. This difference is directly related to the amount of information contained in the RGB and SAR products.
6.6. Discussion
The methodology developed in this study integrates multi-source data fusion, spectral index analysis, and advanced segmentation using artificial intelligence (AI) to detect and monitor changes in surface water bodies. The results demonstrate that combining Sentinel-1 SAR data with Sentinel-2 optical imagery through pixel-level fusion provides a robust framework for environmental monitoring in complex tropical regions such as Eastern Antioquia, Colombia. This approach allowed for overcoming persistent challenges like cloud cover, which frequently limits the usability of optical sensors alone. The successful application of the Segment Anything Model (SAM) to fused imagery produced semantically interpretable classes, enabling more accurate delineation of hydrological features and surrounding land uses.
A key strength of this work lies in its modular workflow, which ensured reproducibility and scalability across multiple study sites with distinct hydrological and geomorphological characteristics. For instance, the method performed consistently across areas with varied topographic complexity—from the low-lying confluence of La Mosca Creek and the Negro River to the steep headwaters of the Cocorná region—while maintaining high thematic accuracy. This performance is comparable to, and in some cases exceeds, that reported by [
5], who evaluated Sentinel-1 and Sentinel-2 multitemporal water surface detection accuracies at regional and reservoir scales, highlighting the benefits of multi-sensor approaches but without fully leveraging AI-based segmentation techniques.
Compared to earlier single-sensor optical studies that relied primarily on indices such as NDWI or MNDWI [
1,
2], our results highlight the added value of incorporating SAR data to mitigate atmospheric interference and capture surface roughness characteristics. Persistent cloud cover in tropical and mountainous regions has long been a limiting factor for optical monitoring [
11,
12], and the integration of SAR addresses this issue by providing continuous temporal coverage. Similar benefits were observed by [
4], who developed dense water extent time series through optical-SAR sensor fusion. However, our study advances these efforts by introducing a deep learning-based despeckling stage [
8] and the SAM segmentation framework, which together improve the interpretability and quality of the fused products. The application of an autoencoder for speckle noise reduction represents a methodological improvement over traditional filtering techniques, as it preserves fine structural details critical for detecting small and narrow water bodies, a challenge also noted by [
19].
From a comparative perspective, the methodology presented here shares conceptual similarities with global initiatives such as the Global Surface Water dataset [
11] and the Aqua Monitor [
12]. These products emphasize large-scale, long-term analyses, whereas our work focuses on localized, high-resolution applications with real-time operational potential. The temporal granularity achieved in this study—monthly SAR composites and quarterly optical composites—offers an intermediate level of detail between daily near-real-time flood services [
13,
14] and decadal historical datasets. This temporal resolution is particularly relevant for managing dynamic watersheds in tropical settings, where rapid hydrological changes occur in response to rainfall variability and anthropogenic pressures such as urbanization and deforestation.
The fusion of NDVI, NDWI, and NDBI indices with SAR VH backscatter into RGB composites provided a richer analytical perspective by simultaneously representing vegetation, water, built-up areas, and surface roughness. This multi-dimensional view proved especially useful in the San Carlos urban area, where unplanned settlements have expanded into flood-prone zones. The segmented outputs highlighted the spatial relationships between hydrological networks and urban infrastructure, offering actionable insights for risk management. Such integration of spectral and structural information is consistent with the best practices outlined by [
21,
22], who advocate for combining multiple indices and temporal rules to enhance classification robustness.
Despite these strengths, some limitations remain. In highly mountainous areas like Cocorná, the spatial resolution of the available sensors (10–30 m) constrained the detection of very small streams and ephemeral water bodies. Similar limitations were reported by [
18], who addressed them through super-resolution techniques and object-based classification methods. Future research should explore the integration of higher-resolution commercial satellites or UAV-based imagery to complement the current framework. Additionally, while SAM demonstrated considerable flexibility, its performance depends on the quality of the input composites. Persistent cloud cover, even partially mitigated by SAR, occasionally reduced the spectral clarity needed for accurate segmentation, echoing challenges described by [
3] regarding noise and false positives in flood mapping.
Beyond the mitigation of cloud-related limitations, it is essential to position the proposed workflow within the spectrum of recent fusion-based methods that integrate optical and SAR sources for water mapping and land–water discrimination. Several deep learning fusion architectures have demonstrated outstanding performance in complex landscapes, such as the Multi-Attention Deep Fusion Network (MADF-Net) proposed by [
16], which integrates multi-scale attention mechanisms to enhance spatial coherence in SAR–optical composites. While MADF-Net achieves high accuracy in delineating water bodies, it requires supervised training, substantial labeled datasets, and GPU-intensive computation, which may limit its operational use in regions with scarce ground truth or limited infrastructure. In contrast, the workflow presented in this study leverages foundation-model segmentation (SAM) and unsupervised fusion of SAR and spectral indices, allowing its application without the need for local retraining or manually annotated datasets.
Other recent approaches have proposed dense spatiotemporal fusion for optical–SAR water monitoring, such as the harmonized time-series framework of [
18], which achieves high-resolution monthly mapping of the Yangtze Basin. These techniques provide remarkable temporal continuity but rely on complex statistical harmonization models and assume relatively stable cross-sensor relationships, which may not hold in steep Andean terrain characterized by sudden hydrological responses and strong topographic effects. Our method, by employing pixel-level fusion and composite-based normalization of indices, avoids such assumptions and maintains robustness in highly variable tropical mountainous environments.
Furthermore, several studies have explored generative deep learning for SAR denoising and super-resolution prior to fusion, such as the conditional GAN framework of [
50], which enhances fine-scale water boundary detection. Although these models improve the sharpness of fusion products, they exhibit sensitivity to scene-specific artifacts and often require retraining when acquisition parameters vary. The autoencoder-based despeckling adopted in our workflow provides a balance between generalization and structural preservation, producing stable inputs for SAM segmentation across multiple years and acquisition geometries. Altogether, these comparisons highlight that our methodology prioritizes operational scalability, reproducibility, and minimal training requirements, offering a complementary alternative to highly specialized or computationally demanding fusion methods.
When comparing this study to other regional works, such as those by [
10] on coastal erosion and [
8] on land cover change, our methodology complements them and stands out for its ability to capture both temporal and spatial dynamics within a unified workflow. While these studies focused on specific environmental processes, the present work offers a more generalized framework applicable to diverse hydrological contexts. Moreover, by embedding the processing chain into a software prototype, we addressed operational barriers often encountered in applied environmental monitoring. This level of automation is aligned with recent trends toward open-access, reproducible processing pipelines [
36].
In summary, the fusion of optical and radar data supported by deep learning and segmentation algorithms represents a significant step forward in surface water monitoring. The methodological advancements presented here offer a balance between local detail and scalable applicability, filling a critical gap between global monitoring initiatives and site-specific case studies. Nevertheless, further refinement is needed to improve small water body detection, optimize processing speed, and ensure the integration of social and hydrological data for holistic watershed management. Future research should also explore the integration of climate change projections to anticipate hydrological responses, following approaches like those of [
9].
7. Conclusions and Future Work
Based on the results obtained and the analyses conducted, it can be concluded that the methodological approach undertaken proved to be efficient, as it rapidly constructed a data repository combining both directly captured information and data processed through combinations and segmentations (associated with clustering, classifications, and even divisions). The sequential analysis of the scenes—beginning with what the human eye perceives through true-color RGB composition, followed by SAR acquisitions, and then the derivation and subsequent fusion of spectral indices—was highly effective in extracting the greatest possible amount of information. This approach enabled the identification of environmental determinants associated with floods and surges of the water bodies crossing these areas, historically linked to such events.
Subsequently, the application of SAM, through Artificial Intelligence, allowed for the grouping of captured elements, generating scenes with more interpretable classes in certain cases, particularly in areas of high heterogeneity. This was especially useful in the scenes of the confluence of La Mosca Creek and the Negro River, as well as in the urban area of the municipality of San Carlos.
The results derived from index combinations were of particular interest, as they provided in a single image data extracted from normalized band computations (three cases), associated with built-up areas, vegetation, and water. These could then be analyzed according to the intensity of the colors in the three corresponding bands. This type of analysis offers a richer perspective for scene interpretation, especially where multiple elements converge that cannot be assessed solely through true-color representation, given that such indices employ the infrared band, which interacts variably with key aspects of the scene such as those mentioned above. This research thus contributes to the analysis of processed and compiled information, providing both researchers and environmental authorities with new tools for understanding their territories.
Further refinement of methodologies is required to transform raw data captured by passive and active sensors into products that, in turn, serve as inputs for generating outputs capable of compiling large amounts of information into a single graphical representation—summarizing entire scenarios for a clearer understanding of areas of interest. Additional research and case studies are still needed to better comprehend the particularities of such methodologies and to address the challenges posed by persistent cloud cover, high levels of change, high uniformity, and related challenges.
The methodology presented in this study provides a strong foundation for integration with land use and land cover (LULC) change models. By generating high-resolution, multitemporal datasets of surface water dynamics, the approach enables the identification of patterns and drivers of hydrological change associated with urban growth, agricultural expansion, and deforestation. Future research should focus on coupling this methodology with predictive land cover models, such as cellular automata or agent-based simulations, to assess potential future scenarios of water body dynamics under different socio-economic and climate change pathways. This integration would allow for proactive territorial planning and enhance the capacity to design sustainable development strategies at both regional and national levels.
The data products derived from this workflow are ideally suited for use in distributed physically based rainfall–runoff models. By providing spatially explicit, time-series information on surface water extent, vegetation cover, and built-up areas, this methodology improves the parameterization of key hydrological processes, including infiltration, runoff generation, and storage dynamics. Incorporating these data into these models would increase the accuracy of flood forecasting, water resource allocation, and watershed management strategies, particularly in tropical and mountainous regions where ground-based measurements are sparse or inconsistent. This linkage represents an important step toward developing a fully integrated modeling framework for water management in complex basins.
The findings of this study hold significant implications for decision-makers at multiple governance levels. At the local scale, municipal governments in Eastern Antioquia can use the derived datasets to guide urban planning, regulate settlements in flood-prone areas, and design targeted infrastructure interventions. At the regional scale, the Government of Antioquia and the environmental authority CORNARE can leverage these products to prioritize conservation areas, enforce land use regulations, and coordinate cross-municipal water management initiatives. At the national level, institutions such as the Unidad Nacional para la Gestión del Riesgo de Desastres (UNGRD) can integrate this information into disaster risk reduction policies, early warning systems, and climate adaptation programs. By bridging the gap between scientific research and operational decision-making, this methodology strengthens institutional capacities to address the intertwined challenges of urbanization, climate change, and water security.

