Article

Modeling the Coupled Stress Relaxation and SEI Evolution in Preload-Constrained Lithium-Ion Cells

1
Shenzhen Automotive Research Institute, Beijing Institute of Technology, Shenzhen 518118, China
2
National Engineering Research Center of Electric Vehicles, School of Mechanical Engineering, Beijing Institute of Technology, Beijing 100081, China
3
China Automotive New Energy Technology Co., Ltd., Tianjin 300384, China
4
Energy and Transportation Domain, Beijing Institute of Technology, Zhuhai 519088, China
*
Authors to whom correspondence should be addressed.
These authors contributed equally to this work.
Lead contact.
Appl. Sci. 2025, 15(23), 12528; https://doi.org/10.3390/app152312528
Submission received: 27 October 2025 / Revised: 17 November 2025 / Accepted: 22 November 2025 / Published: 26 November 2025
(This article belongs to the Section Energy Science and Technology)

Abstract

This work investigates the role of preload pressure in governing the electro-chemo-mechanical (ECM) behavior of lithium iron phosphate (LFP)/graphite pouch cells during calendar aging. Cells aged at 60 °C under different preload levels were systematically evaluated through in situ monitoring of force evolution and capacity retention. To interpret these behaviors, a coupled model was developed that integrates solid electrolyte interphase (SEI)-induced electrode expansion, viscoelastic relaxation, and stiffness evolution, and it was validated against multi-rate discharge experiments, showing excellent agreement with measured voltage and force responses. The results reveal that higher preload amplifies internal pressure fluctuations, prolongs viscoelastic relaxation, and delays irreversible force recovery, while the overall capacity fade remains largely unaffected. A slight mitigation in capacity loss is observed at high preload, primarily due to suppressed SEI growth resulting from reduced electrode porosity and a decrease in active surface area available for interfacial reactions. Fitting parameters for stiffness correction, relaxation amplitude, and relaxation time exhibited systematic preload dependence. By decoupling irreversible and relaxation forces, the framework enables quantitative analysis of aging-induced pressure accumulation. Overall, this study underscores the critical role of mechanical constraints in long-term battery degradation and demonstrates the predictive capability of the proposed ECM model for guiding preload design in practical modules.

1. Introduction

Lithium-ion batteries (LiBs) are the cornerstone of electric vehicles (EVs) and energy storage systems (ESSs), owing to their high energy density and long cycle life [1,2,3,4]. In practical operation, LiBs often spend a large fraction of their service life in storage rather than cycling, making calendar aging a decisive factor for long-term performance [5].
A central process in calendar aging is the evolution of the solid electrolyte interphase (SEI) on the graphite anode. The SEI continuously forms and thickens, consuming active lithium, decomposing electrolyte components, and altering transport pathways [6]. Early theoretical work by Pinson and Bazant established the link between SEI growth and capacity fade, distinguishing reaction-limited and diffusion-limited regimes [7]. Subsequent advances have expanded this foundation: Wang et al. [8] reviewed multiscale modeling from atomistic to continuum levels, Safari et al. [9] embedded SEI growth into the pseudo-two-dimensional (P2D) framework to predict long-term aging, and Yang et al. [10] incorporated electrochemical–thermal coupling to capture the effect of stress on SEI formation. More recent models explicitly integrate SEI thickness, transport limitations, and interfacial resistance, enabling long-term predictions under varied storage and operating conditions [11]. Beyond electrochemical degradation, SEI accumulation also drives mechanical effects: continuous buildup induces irreversible electrode expansion and stress, coupling mechanical degradation with electrochemical aging [12,13,14,15].
Importantly, the mechanical environment imposed during module assembly further shapes long-term performance [16]. Preload pressure, applied to maintain cell stacking integrity, influences internal stress distributions, electrode contact states, and swelling behavior, thereby affecting degradation pathways and safety margins [17,18,19]. Stress relaxation under preload has emerged as a key phenomenon [20]: short-term relaxation is dominated by viscoelastic creep of binders, separators, and buffer layers, while long-term relaxation arises from SEI thickening, gas generation, plastic deformation, and microstructural damage [21,22,23,24,25]. Pioneering studies by Cannarella and Arnold [26] linked stress relaxation directly to capacity fade, while later work revealed multiple relaxation modes—reversible, irreversible, and progressive pressure growth—in high-capacity pouch cells [27]. Von Kessel et al. [28] further advanced characterization by introducing in situ dynamic mechanical analysis to probe viscoelastic responses of battery stacks. Collectively, these works demonstrate that preload pressure not only governs stress distribution and swelling but also dictates the onset of irreversible deformation, underscoring the critical role of viscoelastic relaxation in long-term reliability.
Stress relaxation profoundly impacts pressure distribution, contact resistance, heat generation, and local degradation, and it also alters mechanical signals used by battery management systems (BMS) for fault detection and early warning [29,30]. Because relaxation evolves over multiple timescales, the concept of an “optimal preload pressure” becomes dynamic: while high preload enhances short-term contact uniformity, it may accelerate delamination, stress heterogeneity, and aging in the long term. These insights highlight the necessity of considering chemo-mechanical relaxation in preload and buffer design to ensure stable operation and extended service life. It is worth noting that recent research has mainly focused on cycling-induced expansion or short-term force responses, while long-term force relaxation and irreversible pressure evolution during calendar storage (especially under static preload) have not been adequately studied in recent years. Since lithium-ion batteries spend most of their time in static storage rather than dynamic cycling in practical applications, it is particularly important to fill this gap in research.
Despite progress in experimental studies on the expansion and relaxation of batteries induced by SEI growth, integrated multiphysics models that couple electrochemical aging, SEI growth, viscoelasticity, and mechanical contact interactions remain scarce. Particularly noteworthy is the lack of a modeling framework that captures the coupled evolution of SEI-driven electrochemical aging and long-term mechanical relaxation under actual preload conditions. To address this gap, we developed an electrochemical–mechanical coupling model for LFP/graphite pouch cells. This model integrates continuous-medium SEI growth and viscoelasticity, and was validated using experimental data on capacity decay and force evolution. This approach provides new insights into the force relaxation mechanism and guidance for rational preload design.

2. Method

2.1. Experiment

To investigate the irreversible force evolution during calendar aging under different preload pressures, 2 Ah LFP/graphite pouch cells (78 mm × 63 mm × 3 mm) were assembled in a custom fixture developed in our laboratory. For these cells, the 1C rate corresponds to a charge/discharge current of 2 A. Preload pressures of 0.1, 0.5, 1.0, and 2.0 MPa were applied by bolt tightening, and the resulting expansion force was continuously monitored using a pressure sensor [31]. The cells employed a graphite anode, LFP cathode, ceramic-coated polyethylene separator, and an electrolyte of 1 M LiPF6 in EC/EMC (3:7 by weight) with 2 wt% VC additives. Aging tests were performed at 25 °C, 45 °C and 60 °C in a thermostat chamber, respectively. For calendar aging, cells were charged to 100% state of charge (SOC), stored under open-circuit conditions, and subjected to reference performance tests (RPTs) every 14 days. The cutoff voltages were set to 2.0 V (lower limit) and 3.65 V (upper limit). By measuring the discharge capacity during each RPT and the pressure at the end of the discharge, the capacity and accumulated irreversible force of the aged cell can be obtained. Due to the use of a custom preload-measurement fixture, only one cell was tested for each preload condition. The capacity tester provides a measurement accuracy of ±0.02% (full scale), ensuring reliable capacity determination throughout the aging process.
For model validation, fresh cells were charged at 0.1 C to 3.65 V, then discharged to 2.0 V at rates of 0.1 C, 0.3 C, 1 C, and 3 C under a preload of 0.3 MPa. The corresponding expansion force signals were recorded and compared with model predictions.

2.2. Calendar Aging Model Description

The electrochemical response of the cell was simulated using a pseudo-two-dimensional (P2D) model, based on porous electrode and concentrated-solution theories, consistent with our previous work [10]. The model captures the distributions of solid-phase lithium concentration (cs), electrolyte concentration (ce), and potentials (ϕs, ϕe) across electrodes and separator, and detailed modeling parameters are shown in Table 1. Governing equations include:
Liquid phase mass transfer equation:
ε e c e t = D e e f f 2 c e x 2 1 t + 0 F i e x
Liquid phase charge conservation equation:
i e = σ e e f f ϕ e x + 2 R T 1 t + 0 F ln c e x
Solid-phase mass transfer equation:
c s t = 1 r 2 r D s r 2 c s r
Solid-phase charge conservation equation:
i s = σ s e f f ϕ s x
Interfacial reaction kinetics equation:
j i n t = a n i 0 exp α a F R T η exp α c F R T η
The SEI initially forms on the anode during early cycling through electrolyte reduction, producing a passivation layer that stabilizes the electrode–electrolyte interface. However, SEI growth continues during long-term storage and cycling, driven by solvent and salt reduction, crack repair induced by mechanical stress, and reactions at newly exposed surfaces. Its thickness and resistance therefore evolve with electrolyte concentration, electrode potential, and temperature. In this study, SEI aging was modeled following our previous framework [32], explicitly linking electrochemical performance with mechanically induced stress.
j S E I = a n F k 0 , S E I c E C s exp α c , S E I F R T ϕ s ϕ e j t o t a R f i l m U S E I
where an is the active specific surface area, k0,SEI is the SEI formation rate constant, USEI is the equilibrium potential of the SEI formation reaction, and c E C s represents the concentration of EC at the graphite surface, which is calculated by the mass conservation:
D E C c E C s c E C 0 δ f i l m = j S E I F
where DEC is the diffusivity of EC, c E C 0 is the bulk electrolyte concentration of EC, and δfilm denotes the thickness of the surface film. The material balance of SEI and lithium metal can be expressed as:
c S E I t = j S E I 2 F
where cSEI is the concentration of SEI generated. The quantities of SEI can be expressed as an equivalent surface film thickness:
δ f i l m = δ S E I = 1 a n c S E I M S E I ρ S E I
In this paper, the decrease in the negative electrode porosity is mainly considered. Porosity was calculated using the formula of Weidner et al. [33], where the right side of the equation is the source term, representing the expansion of the particles, and the left side is the dissipation term, representing that part of the expansion of the particles is converted into a decrease in porosity, and the other part is converted into the expansion of the electrode, and the two are in competition.
1 ε e , d e g t + ( 1 ε e , d e g   ) φ n t = s Δ V ^ θ n n F j t o t
j t o t = j i n t + j S E I
φ n = φ n , c + φ n , e
where εe,deg is the degraded porosity of the anode, s is the stoichiometric coefficient for lithium intercalation, Δ V ^ is the partial molar volume change rate of the electrode, representing the rate of change in particle volume with increasing lithium intercalation, and φn,c and φn,e represent the anode strain caused by external compression and internal expansion, respectively, which will be introduced later.
a n , d e g = a n , 0 1 ε e , 0 ε e , d e g ε e , 0
where an,0 and an,deg are the initial and degraded active material surface area, and εe,0 is the initial porosity.
Therefore, during calendar aging, SEI growth follows a square-root-of-time relationship, and the resulting electrode thickening due to SEI was calculated based on the study by Weng et al. [13].
Δ i r r e v = Δ S E I = N l a y e r s L n R n 1 + V θ n / 3 δ S E I
where Nlayers and Ln are the number of layers and thickness of the cell electrode sheet, respectively, Rn is the particle radius, and V is the strain of the electrode as it changes with the chemical stoichiometric coefficient of lithium intercalation. Based on our previous work [31], the change in electrode thickness during charge and discharge can also be calculated.
Δ r e v = ε s L 0 0 Δ V θ n , a v g Δ V θ 0 d x
Therefore, the total expansion of the cell during aging is the sum of the reversible expansion during the charge and discharge process and the irreversible expansion due to SEI growth.
Δ t o t = Δ r e v + Δ i r r e v
Since the cell is constrained by the preload fixture, it can be approximately regarded as a constant gap, and the cell expansion is converted into the pressure it is subjected to. Therefore, the pressure can be calculated based on the stress–strain curve of the cell electrode material:
Δ t o t k a g e = K n F a g e K n F 0 L n + K p F a g e K p F 0 L p   + K s p t F a g e K s p t F 0 L s p t + F a g e / K C u + F a g e / K A l
where kage is the cell aging stiffness correction factor, which will be introduced later. Kn, Kp, Kspt are the stress–strain curves of the negative electrode, positive electrode, and separator, respectively [34], KCu, KAl are the moduli of copper and aluminum current collectors, respectively. F0 is the initial preload, Fage is the calculated stress on the cell after aging. Similarly, φn,c continues to calculate according to the calculated external force:
φ n , c = K n F a g e K n F 0
Since the growth of SEI in the negative electrode during the aging process causes the porosity to decrease and become denser, the stiffness increases accordingly. The calculation uses the stress–strain curve measured from a fresh cell component, so the stiffness of the cell should be corrected.
k a g e = 0.1 1 + N c y c l e k s
where Ncycle is the number of cycles, and ks is the stiffness aging correction factor.

2.3. Mechanical Relaxation Model Description

The viscoelastic behavior of the pouch cell is modeled by a combination of elastic and viscous components, as schematically illustrated in Figure 1. Each viscoelastic unit is represented by a Maxwell element, composed of a spring with stiffness Ei in series with a dashpot with viscosity ηi. A number of Maxwell elements are arranged in parallel with an additional elastic spring E, forming a generalized Maxwell model that captures stress relaxation over multiple timescales.
For the i-th Maxwell element, the stress–strain relationship can be written as:
σ i ( t ) = E i ε i ( t ) + η i ε ˙ i ( t )
The total stress of the system is the sum of the stresses from all Maxwell elements and the long-term elastic component:
σ ( t ) = σ + i = 1 n σ i ( t )
Defining the relaxation time of the i-th element as τi = ηi/Ei, and under a unit step strain input ε(t) = H(t), where H(t) is the Heaviside function, the stress response of each Maxwell element exhibits exponential decay:
σ i ( t ) = E i e t / τ i
F r e l a x a t i o n = k a exp t k t
where ka and kt represent correction factors for the pressure relaxation amplitude and relaxation time of the aged cell, respectively.
Finally, the total force on the aging cell is the sum of the aging expansion force and the relaxation force.
F t o t = F a g e + F r e l a x a t i o n

3. Results and Discussion

3.1. Model Validation

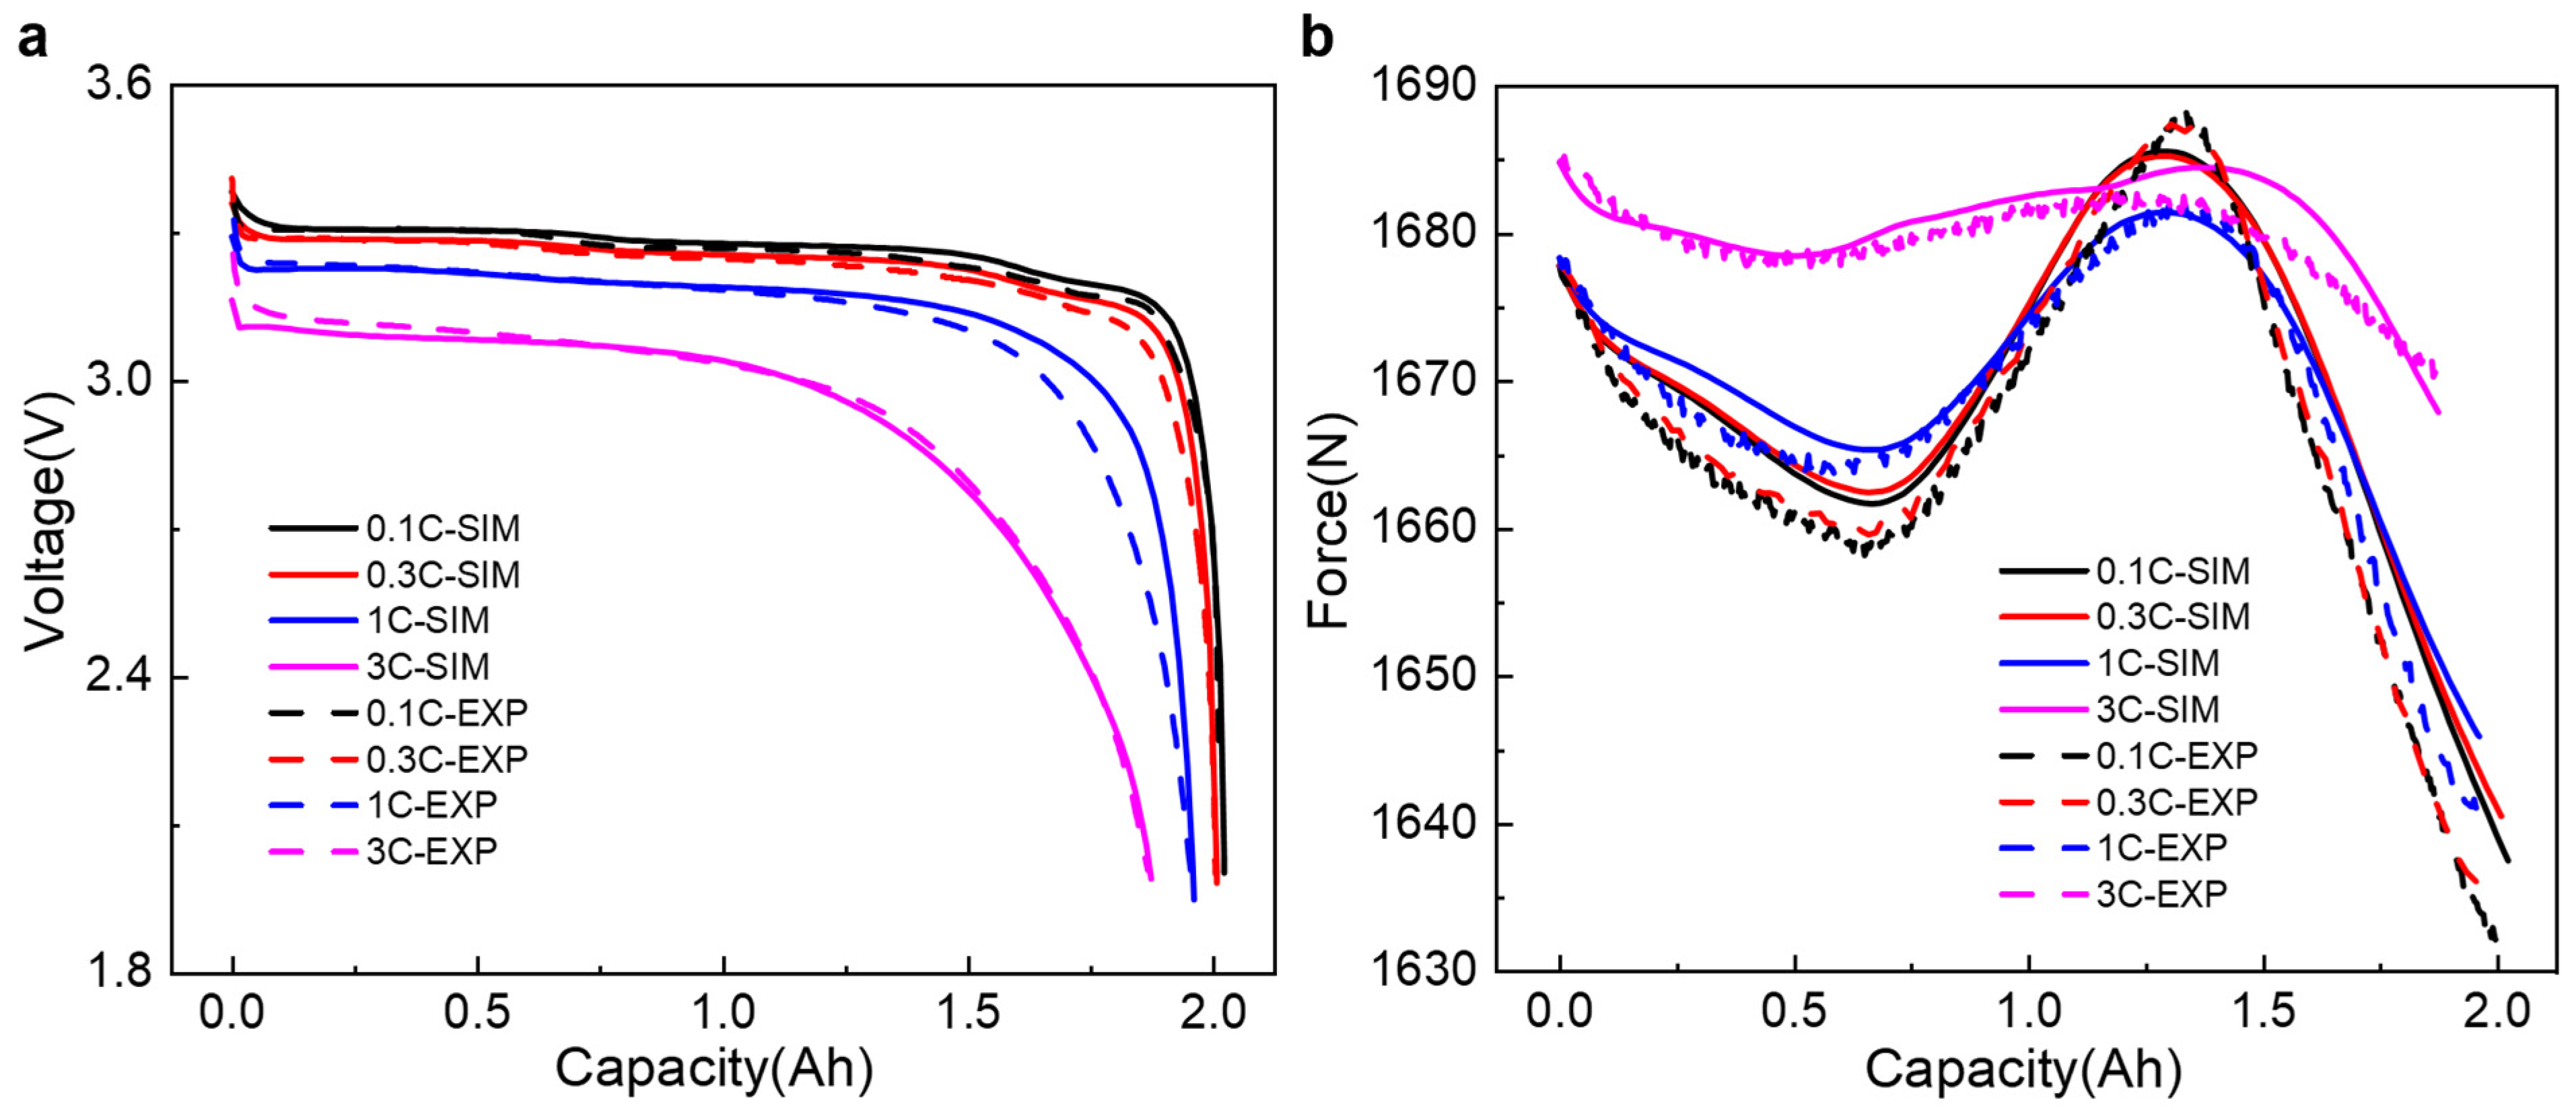
The validity of the coupled electrochemical–mechanical model was first assessed against experimental measurements using fresh cells subjected to discharge at 0.1 C, 0.3 C, 1 C, and 3 C. Both the voltage and expansion force responses were compared with experimental data, as shown in Figure 2. Across all tested C-rates, the model captured the experimental behavior with excellent fidelity. This level of agreement demonstrates that the integrated framework successfully accounts for the key governing processes, including lithium intercalation kinetics, charge transport in the electrolyte, and stress generation in electrodes.
As the discharge rate increased, the model reproduced the expected polarization effects, manifested as progressive voltage drop and reduced accessible capacity. These phenomena arise from the interplay of concentration gradients within particles and electrolyte transport limitations, consistent with widely reported experimental trends for LFP/graphite systems. In parallel, the mechanical response also evolved systematically: pressure fluctuations during cycling became smaller, and the sharp peak in the expansion force profile that was prominent at low rates diminished significantly at high C-rates. Mechanistically, this attenuation reflects the suppression of phase transitions and staging behavior in graphite at high current densities. Under slow cycling, graphite exhibits well-defined staging plateaus as lithium intercalates into specific crystallographic sites, producing stepwise volumetric expansion. At higher rates, however, the staging sequence becomes kinetically constrained, and lithium insertion is governed instead by quasi-solid-solution behavior dominated by diffusion and interfacial charge-transfer kinetics [35,36]. The resulting mechanical signature is smoother, lacking the sharp oscillations observed under conditions where equilibrium staging is accessible.
To further probe the coupling between preload and electrochemical expansion, the force evolution was monitored during the first 0.33 C charge–discharge RPT under calendar aging (Figure 3a). A clear dependence on preload was observed. Increasing the applied preload from 0.1 to 2.0 MPa enhanced the apparent stiffness of the cell, translating the same intrinsic electrode expansion into larger recorded force fluctuations. This relationship can be described by Hooke’s law (F = kx), where external confinement amplifies the mechanical manifestation of a given expansion displacement. In essence, preload pressure does not alter the fundamental magnitude of electrode swelling but modifies how strongly that swelling is reflected in the external force signal.
Relaxation behavior further highlighted the role of preload. At 0.1 MPa, the force decreases rapidly due to early relaxation, but the force in this operating condition shows an upward trend. Therefore, most viscoelastic relaxation had already dissipated before the calendar aging, leaving a net irreversible increase of ~9 N (Figure 3b). This condition, nearly free from confounding relaxation effects, is particularly useful as a calibration baseline for the chemo-mechanical model. In contrast, at higher preloads (0.5–2.0 MPa), relaxation dominated the early force response, producing irreversible decreases of ~1.5 N, 113 N, and 230 N, respectively, compared to the initial state. These strong relaxation processes effectively obscured the smaller irreversible force contributions from parasitic side reactions, complicating direct interpretation of aging-induced stress buildup. The comparison across preload levels illustrates the dual challenge of extracting meaningful mechanical signals from batteries: low preload offers cleaner access to intrinsic chemo–mechanical behavior, while high preload amplifies the force signal but simultaneously introduces substantial relaxation artifacts.

3.2. Capacity Retention and Aging Pressure Response

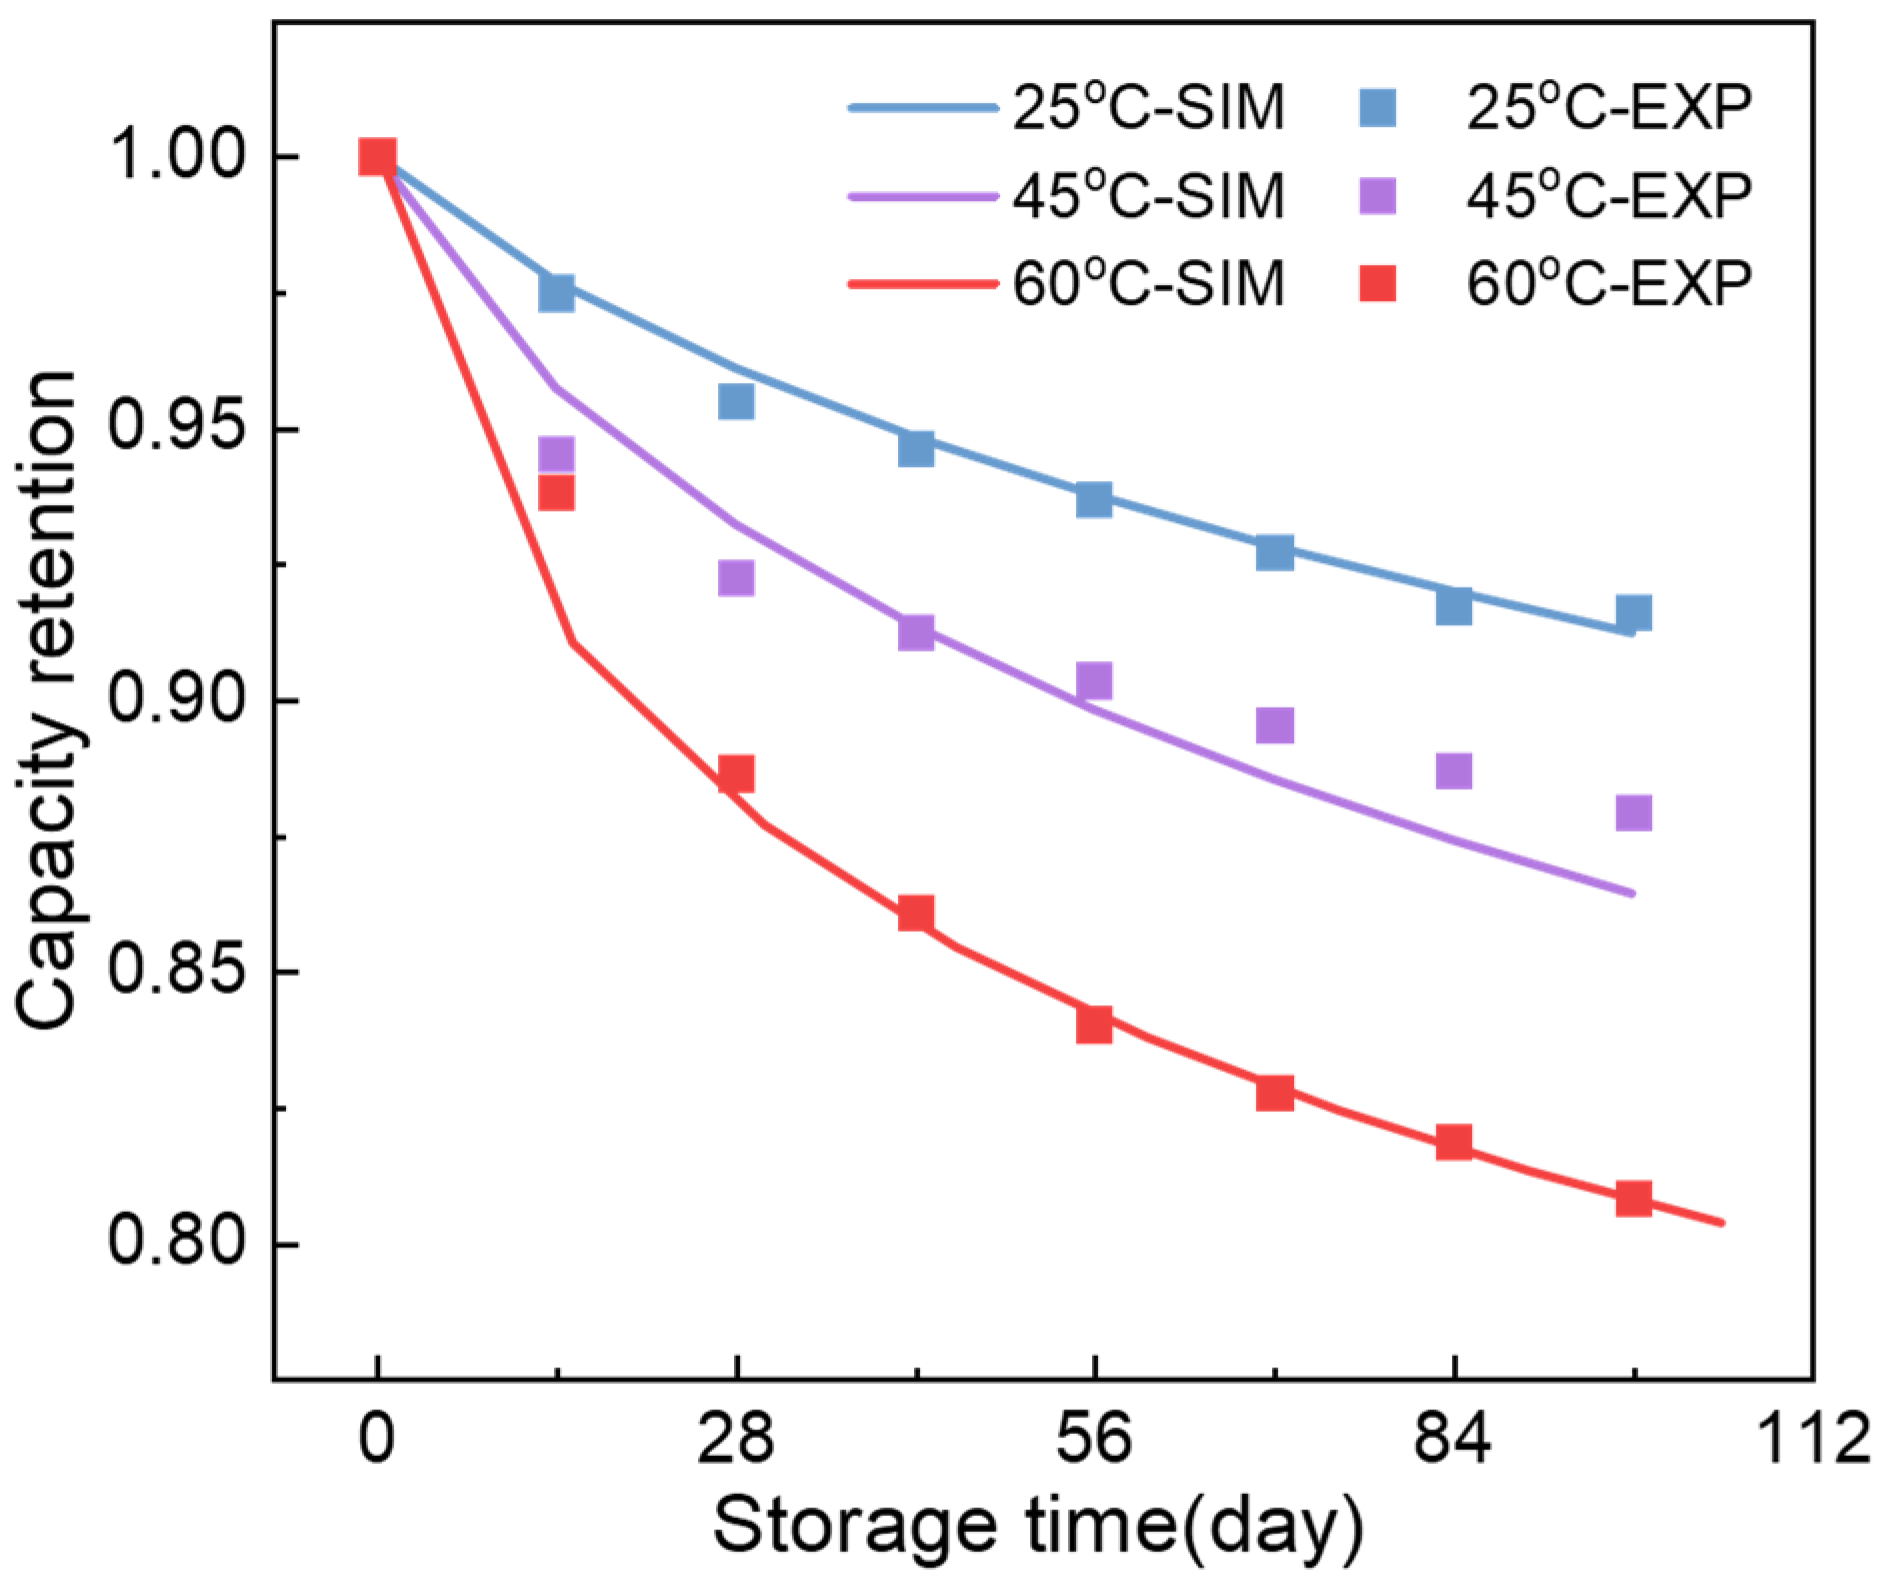
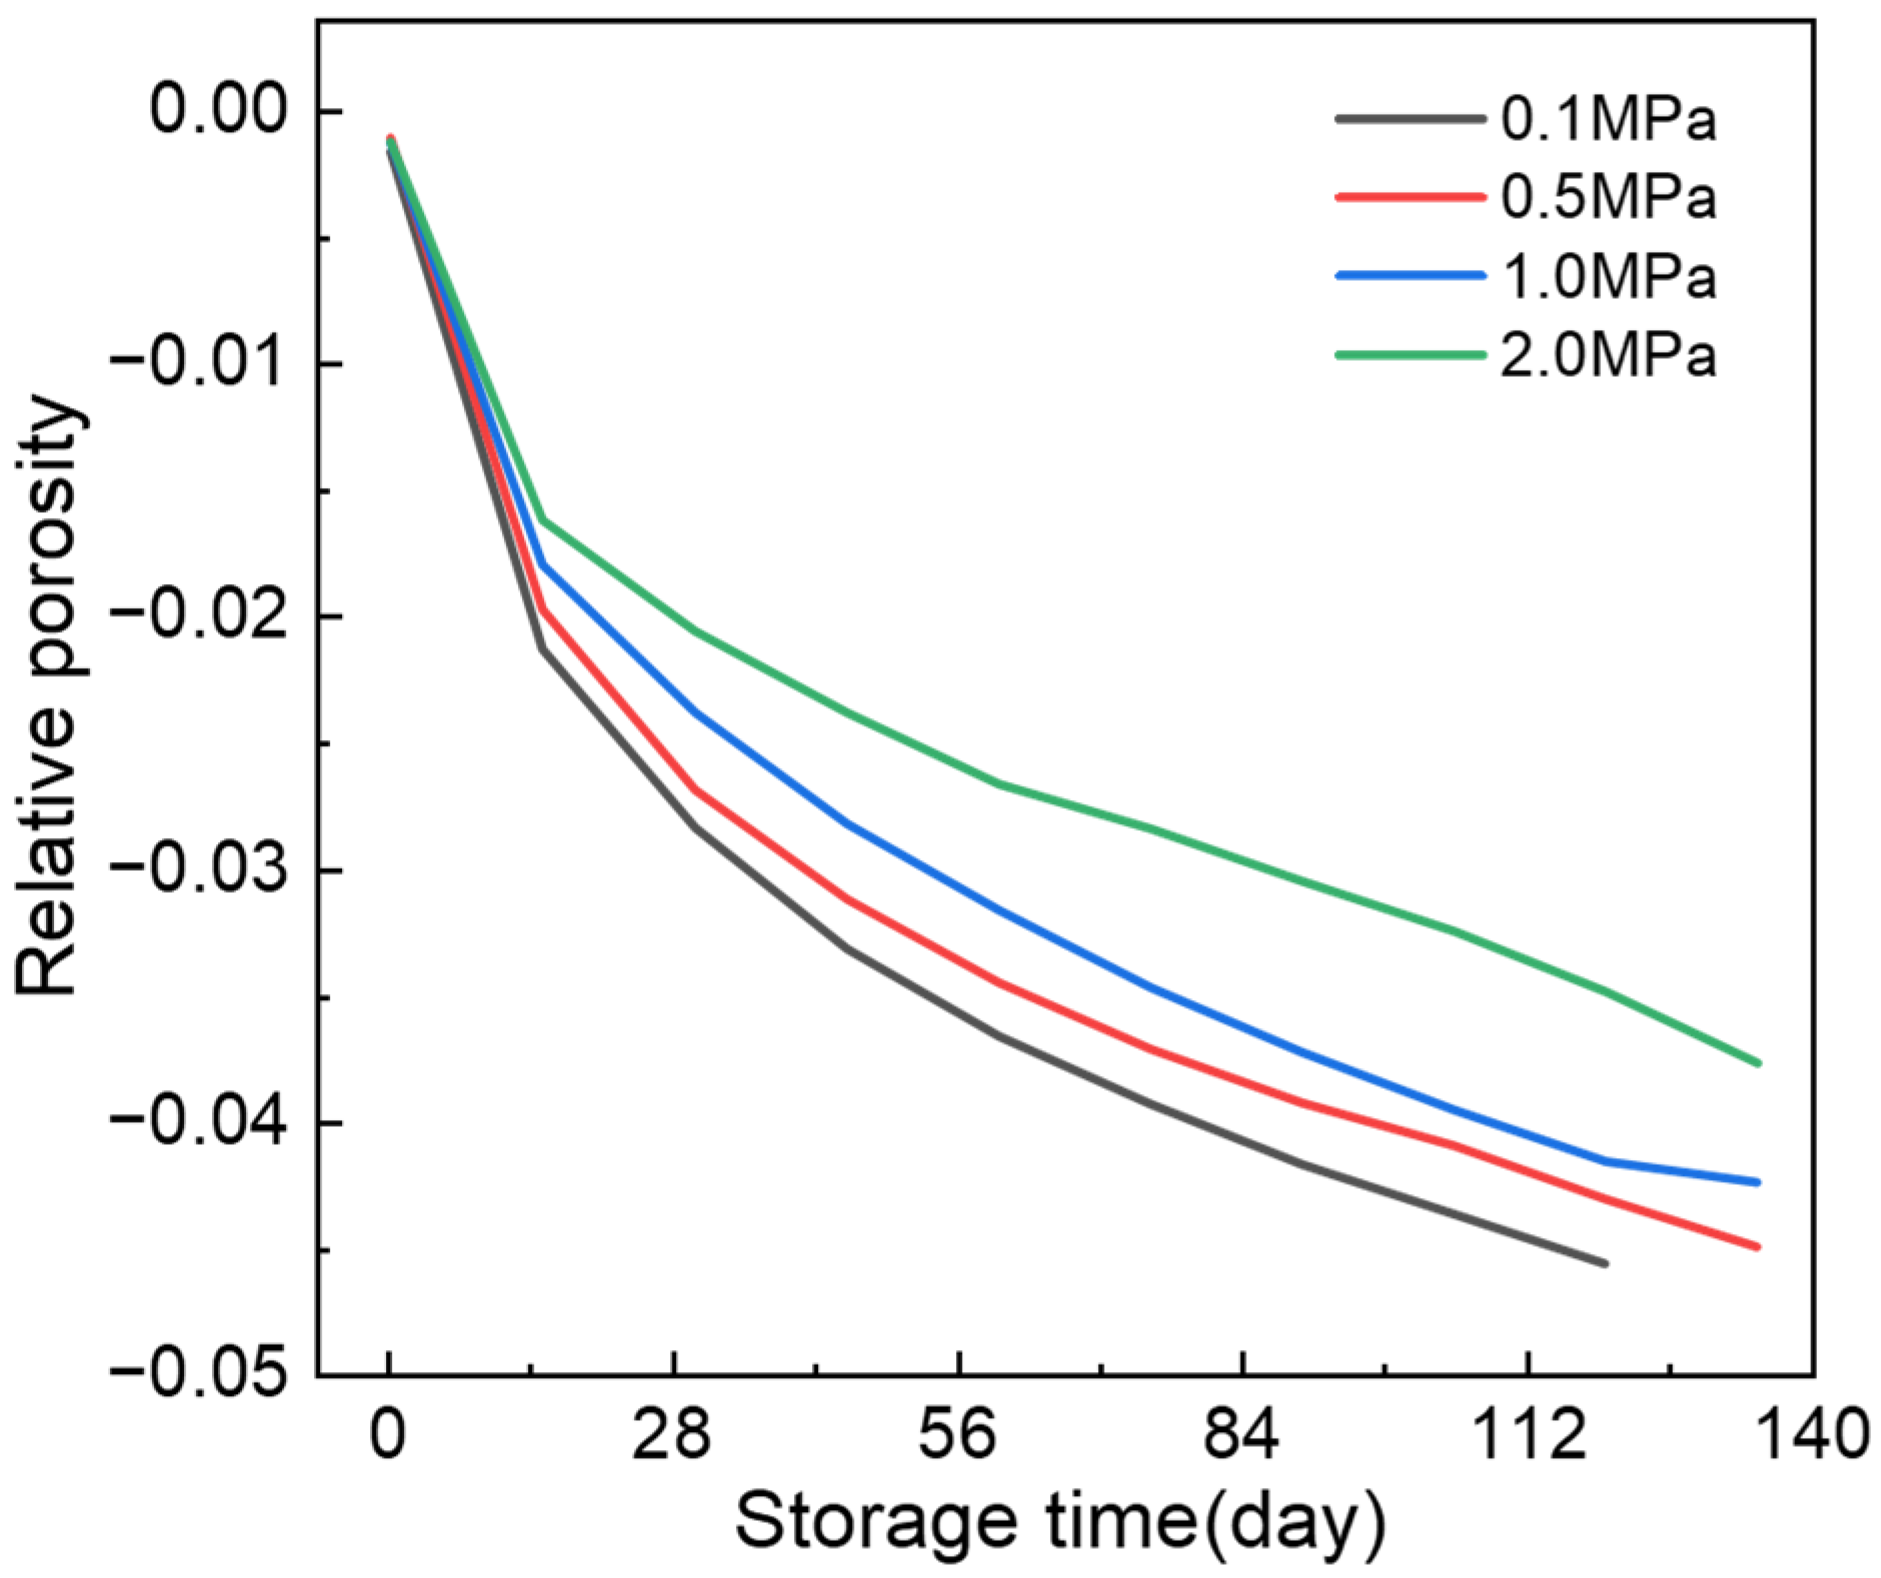
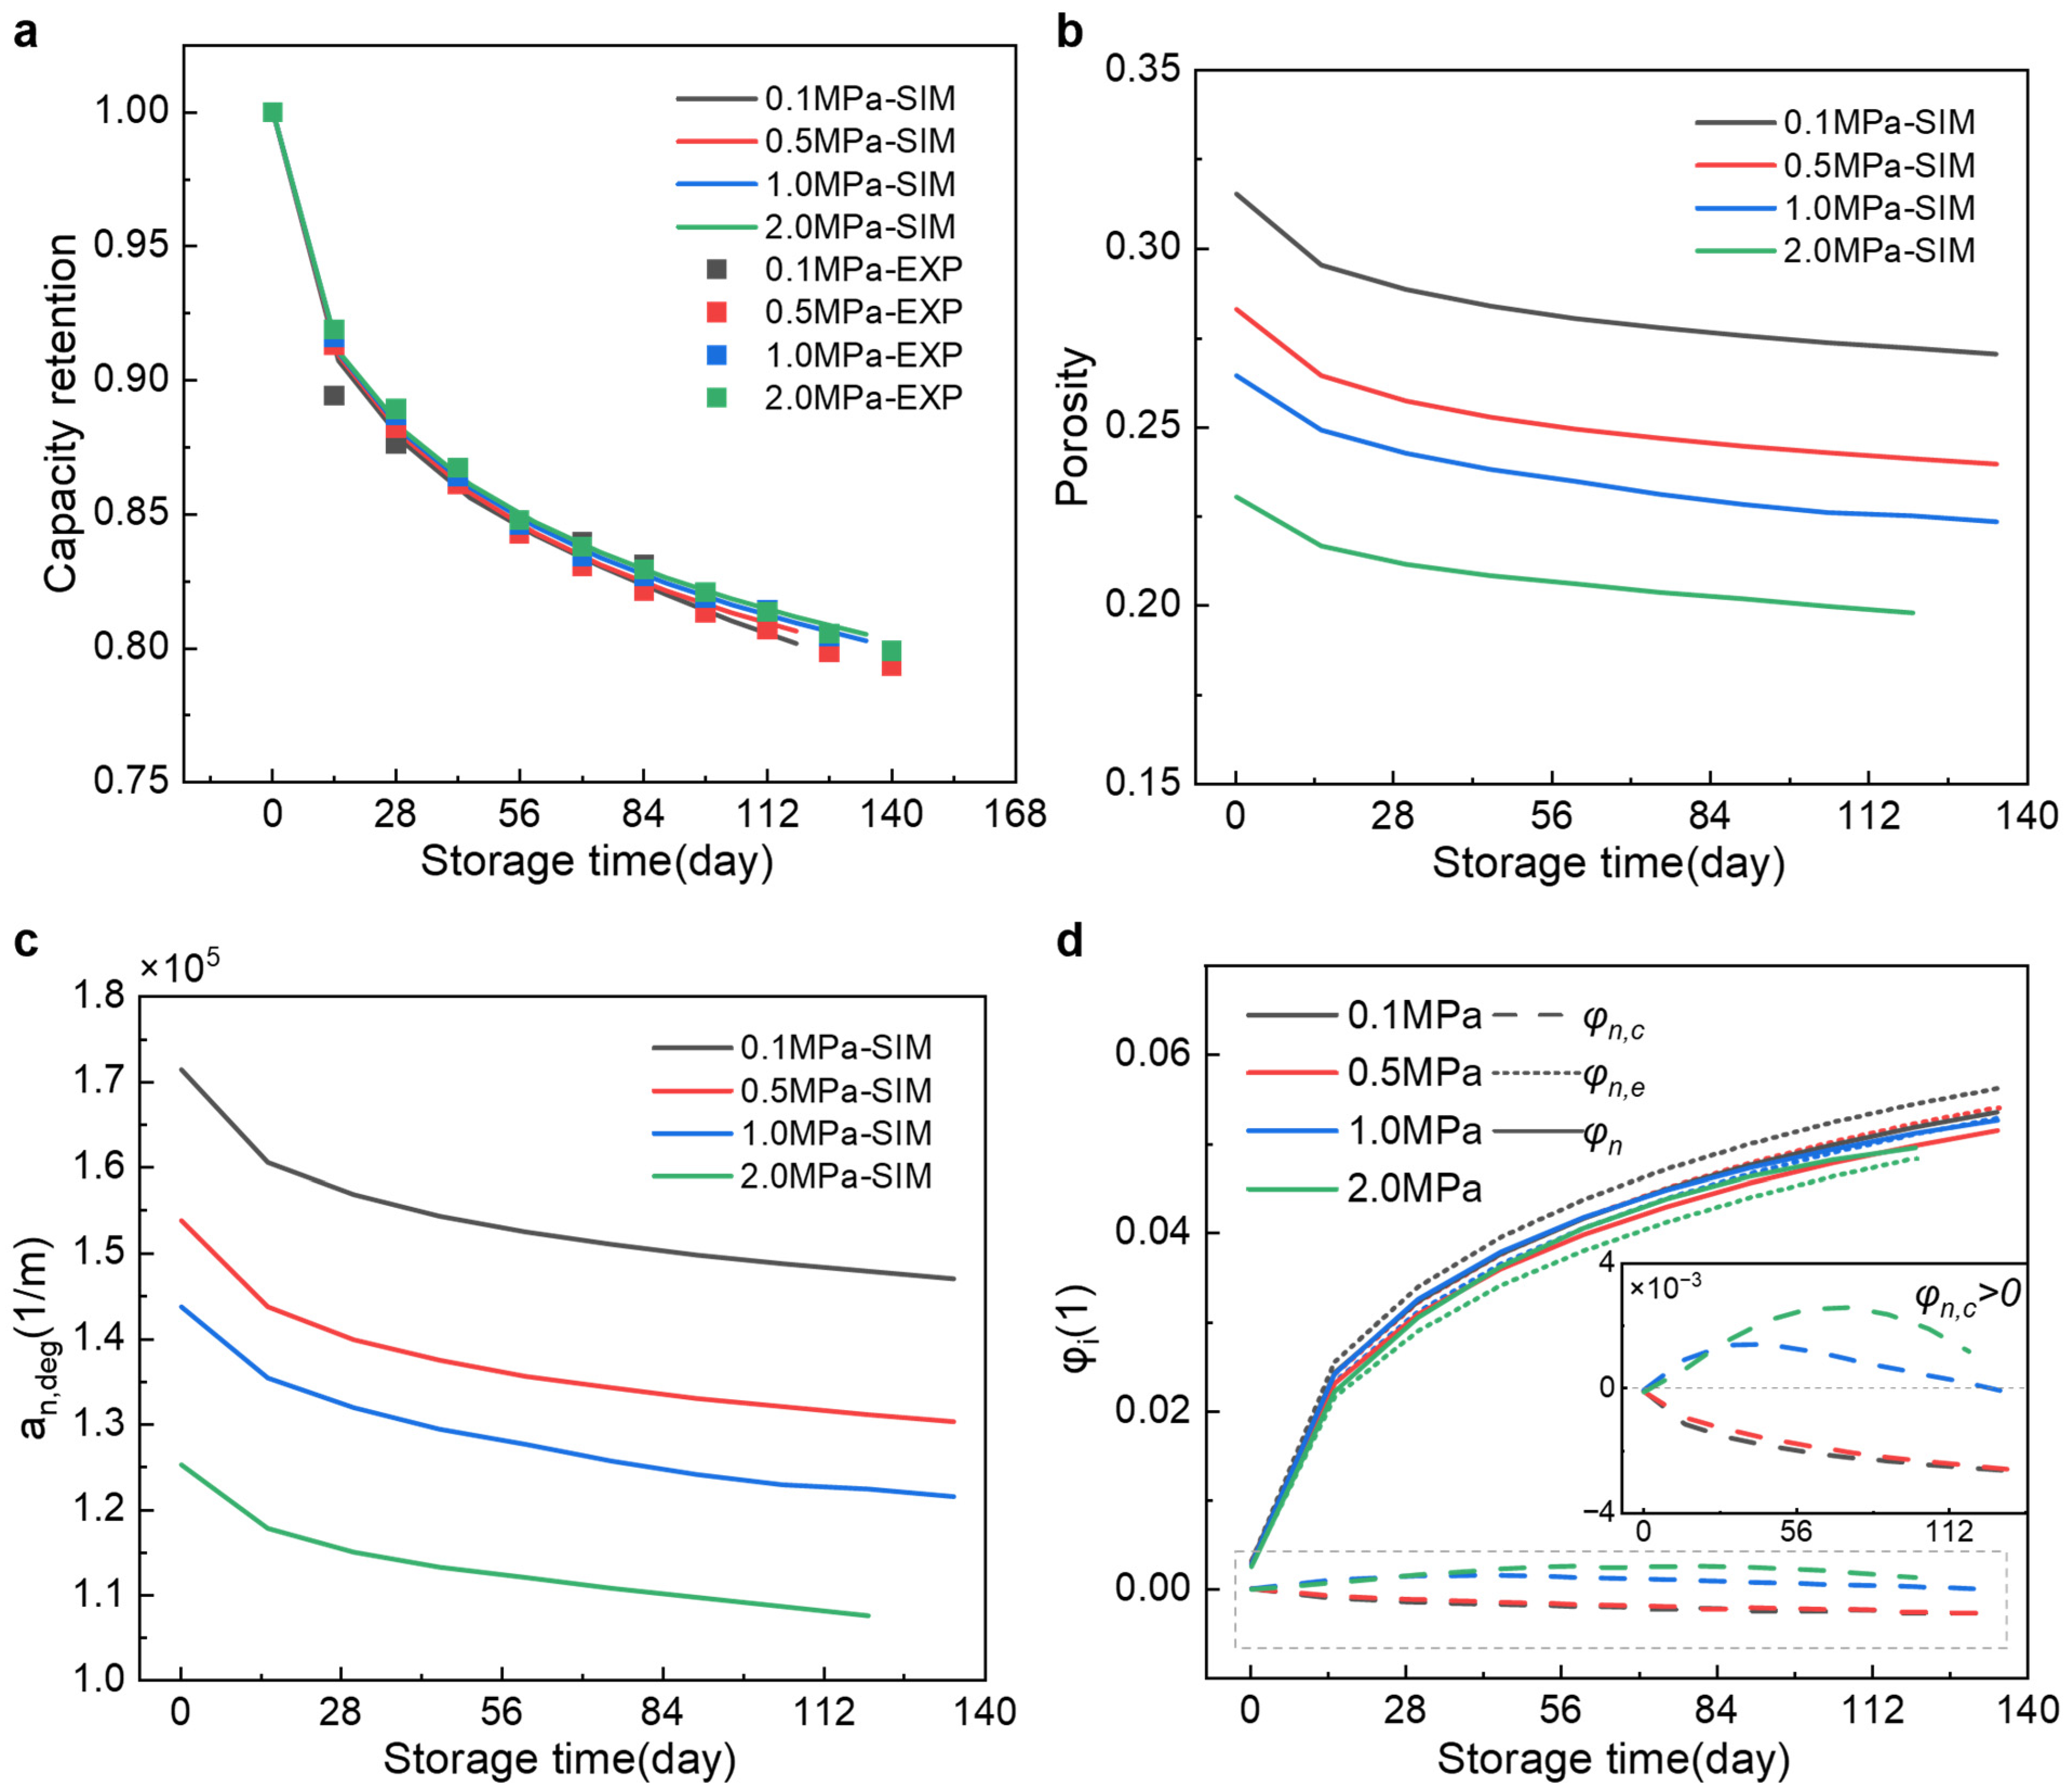
The impact of preload pressure on electrochemical aging was next examined through capacity retention measurements under calendar-storage conditions at 60 °C to accelerate aging. Based on the Arrhenius acceleration factor Equation (25) (activation energy ~30–35 kJ mol−1), storage at 60 °C is approximately 8–12 times faster than storage at 25 °C. Accordingly, the ~140 days of high-temperature aging conducted in this study are equivalent to roughly 3–5 years of calendar aging at room temperature. Similarly, the model achieved accurate predictions of calendar aging capacity retention at 25 °C, 45 °C, and 60 °C, as shown in Figure A2. Capacity loss increased with increasing temperature. For calendar storage of ~98 days, the capacity retention was ~92% at 25 °C, ~87% at 45 °C, and ~80% at 60 °C. As shown in Figure 4a, capacity fade was only weakly affected by preload, and the model successfully reproduced the measured trends with minor deviations. However, a more careful inspection revealed subtle but mechanistically meaningful effects. Elevated preload pressures slightly reduced the rate of capacity fade, an outcome attributed to the reduction in electrode porosity and effective surface area under confinement (Figure 4b). This suppression of porosity lowers the accessible active surface for SEI side reactions, thereby slowing down parasitic electrolyte decomposition (Figure 4c). Such behavior is consistent with Equation (13) of the model, which links SEI kinetics to electrode surface area.
Figure 4d illustrates the decoupling of electrode strain according to Equation (12). It can be observed that the accumulation of irreversible forces during the aging process has a minimal impact on the electrode. Only the initial preload significantly reduces the initial porosity, and the particle expansion caused by side reactions during aging results in substantial strain on the electrode. At the same time, under initial preloads of 1.0 MPa and 2.0 MPa, according to Equation (18), due to significant relaxation, the pressure after aging is lower than the initial preload. Therefore, the electrode strain caused by external compression φn,c is greater than 0. This leads to a plateau in porosity, further inhibiting SEI formation.
ψ = ψ r e f exp E a c t R 1 T r e f 1 T
This finding highlights an underexplored pathway of mechanically assisted aging mitigation: while excessive preload can introduce stress heterogeneity and safety risks, moderate preload may reduce interfacial reactivity by constraining electrode expansion and decreasing effective surface exposure. From a broader perspective, this suggests that mechanical design—long regarded mainly as a structural engineering concern—can also play a subtle yet meaningful role in influencing electrochemical degradation pathways.
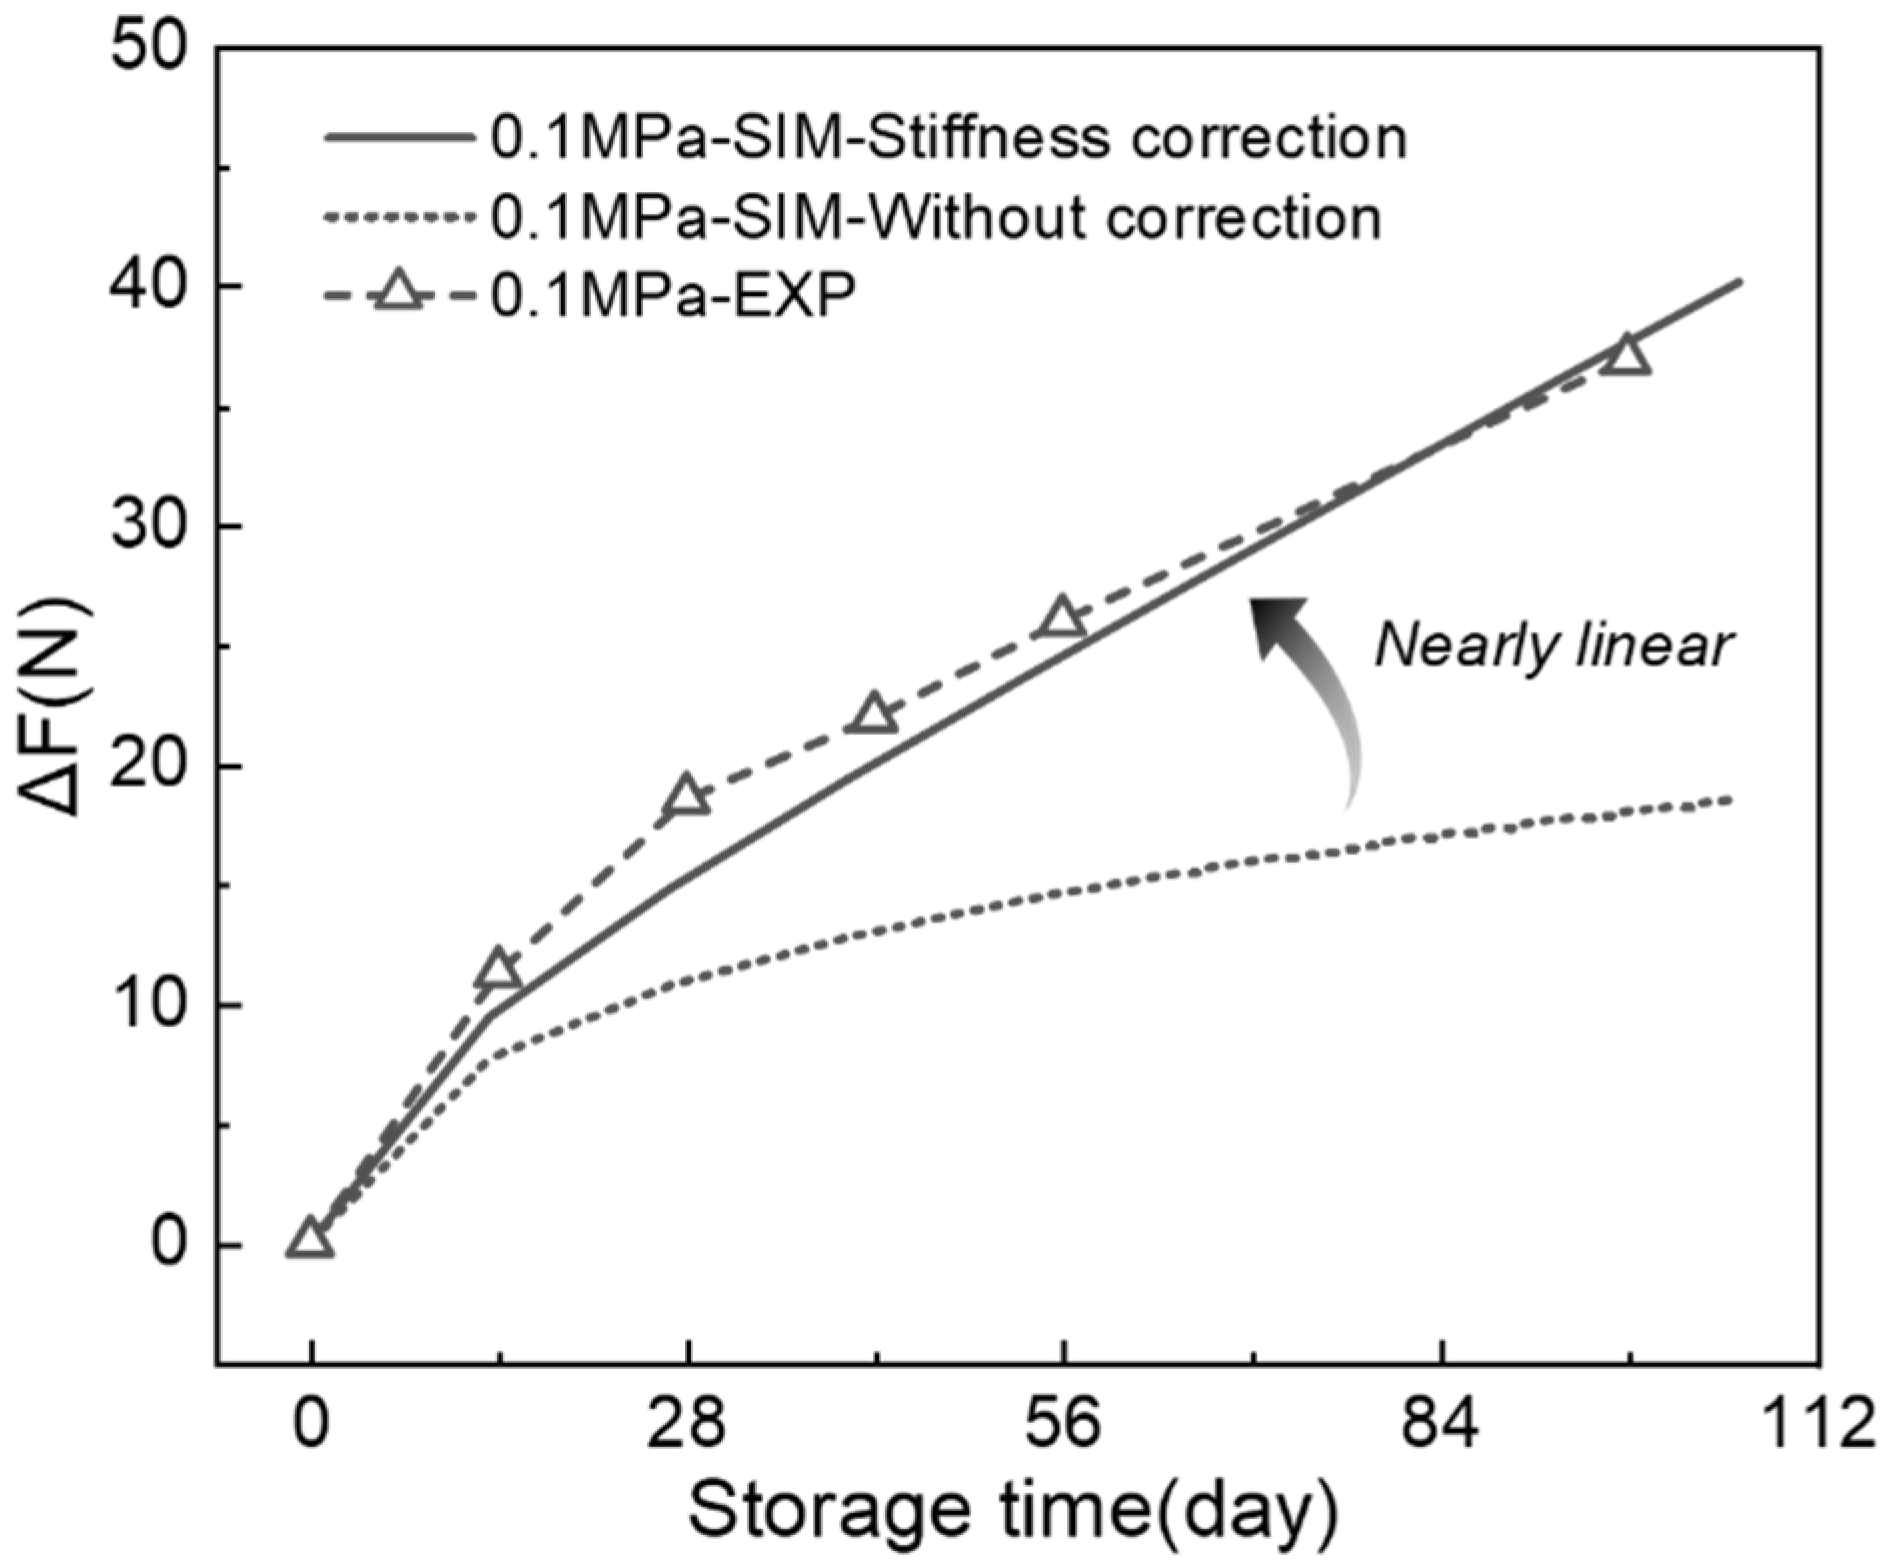
The analysis of irreversible force evolution provided further insight into the interplay between SEI growth and mechanical property changes. Taking the 0.1 MPa baseline case as an example, if the stress–strain relationship measured from fresh electrodes is used to convert volumetric expansion into force, the model predicts a simple square-root-of-time increase in irreversible force, consistent with classical SEI kinetics. However, this prediction significantly underestimates the experimentally observed buildup in later stages of aging. The discrepancy arises because electrode microstructure evolves over time: SEI accumulation densifies the porous anode, reduces void space, and stiffens the electrode matrix. This progressive stiffening amplifies the translation of volumetric expansion into macroscopic force. Without accounting for this evolution, the model misses the accelerated rise in irreversible pressure at long times.
After incorporating a stiffness correction, the model successfully captured this behavior. Specifically, the correction introduced a transition in the predicted force trajectory, from square-root-of-time growth in the early stage (dominated by chemical SEI kinetics) to nearly linear growth at longer times (dominated by mechanically amplified stress accumulation) (Figure 5). This transition illustrates how electrochemical and mechanical degradation processes are not independent but dynamically coupled: chemical aging drives mechanical densification, which in turn enhances the mechanical signature of subsequent chemical aging.

3.3. Influence of Preload on Relaxation Dynamics

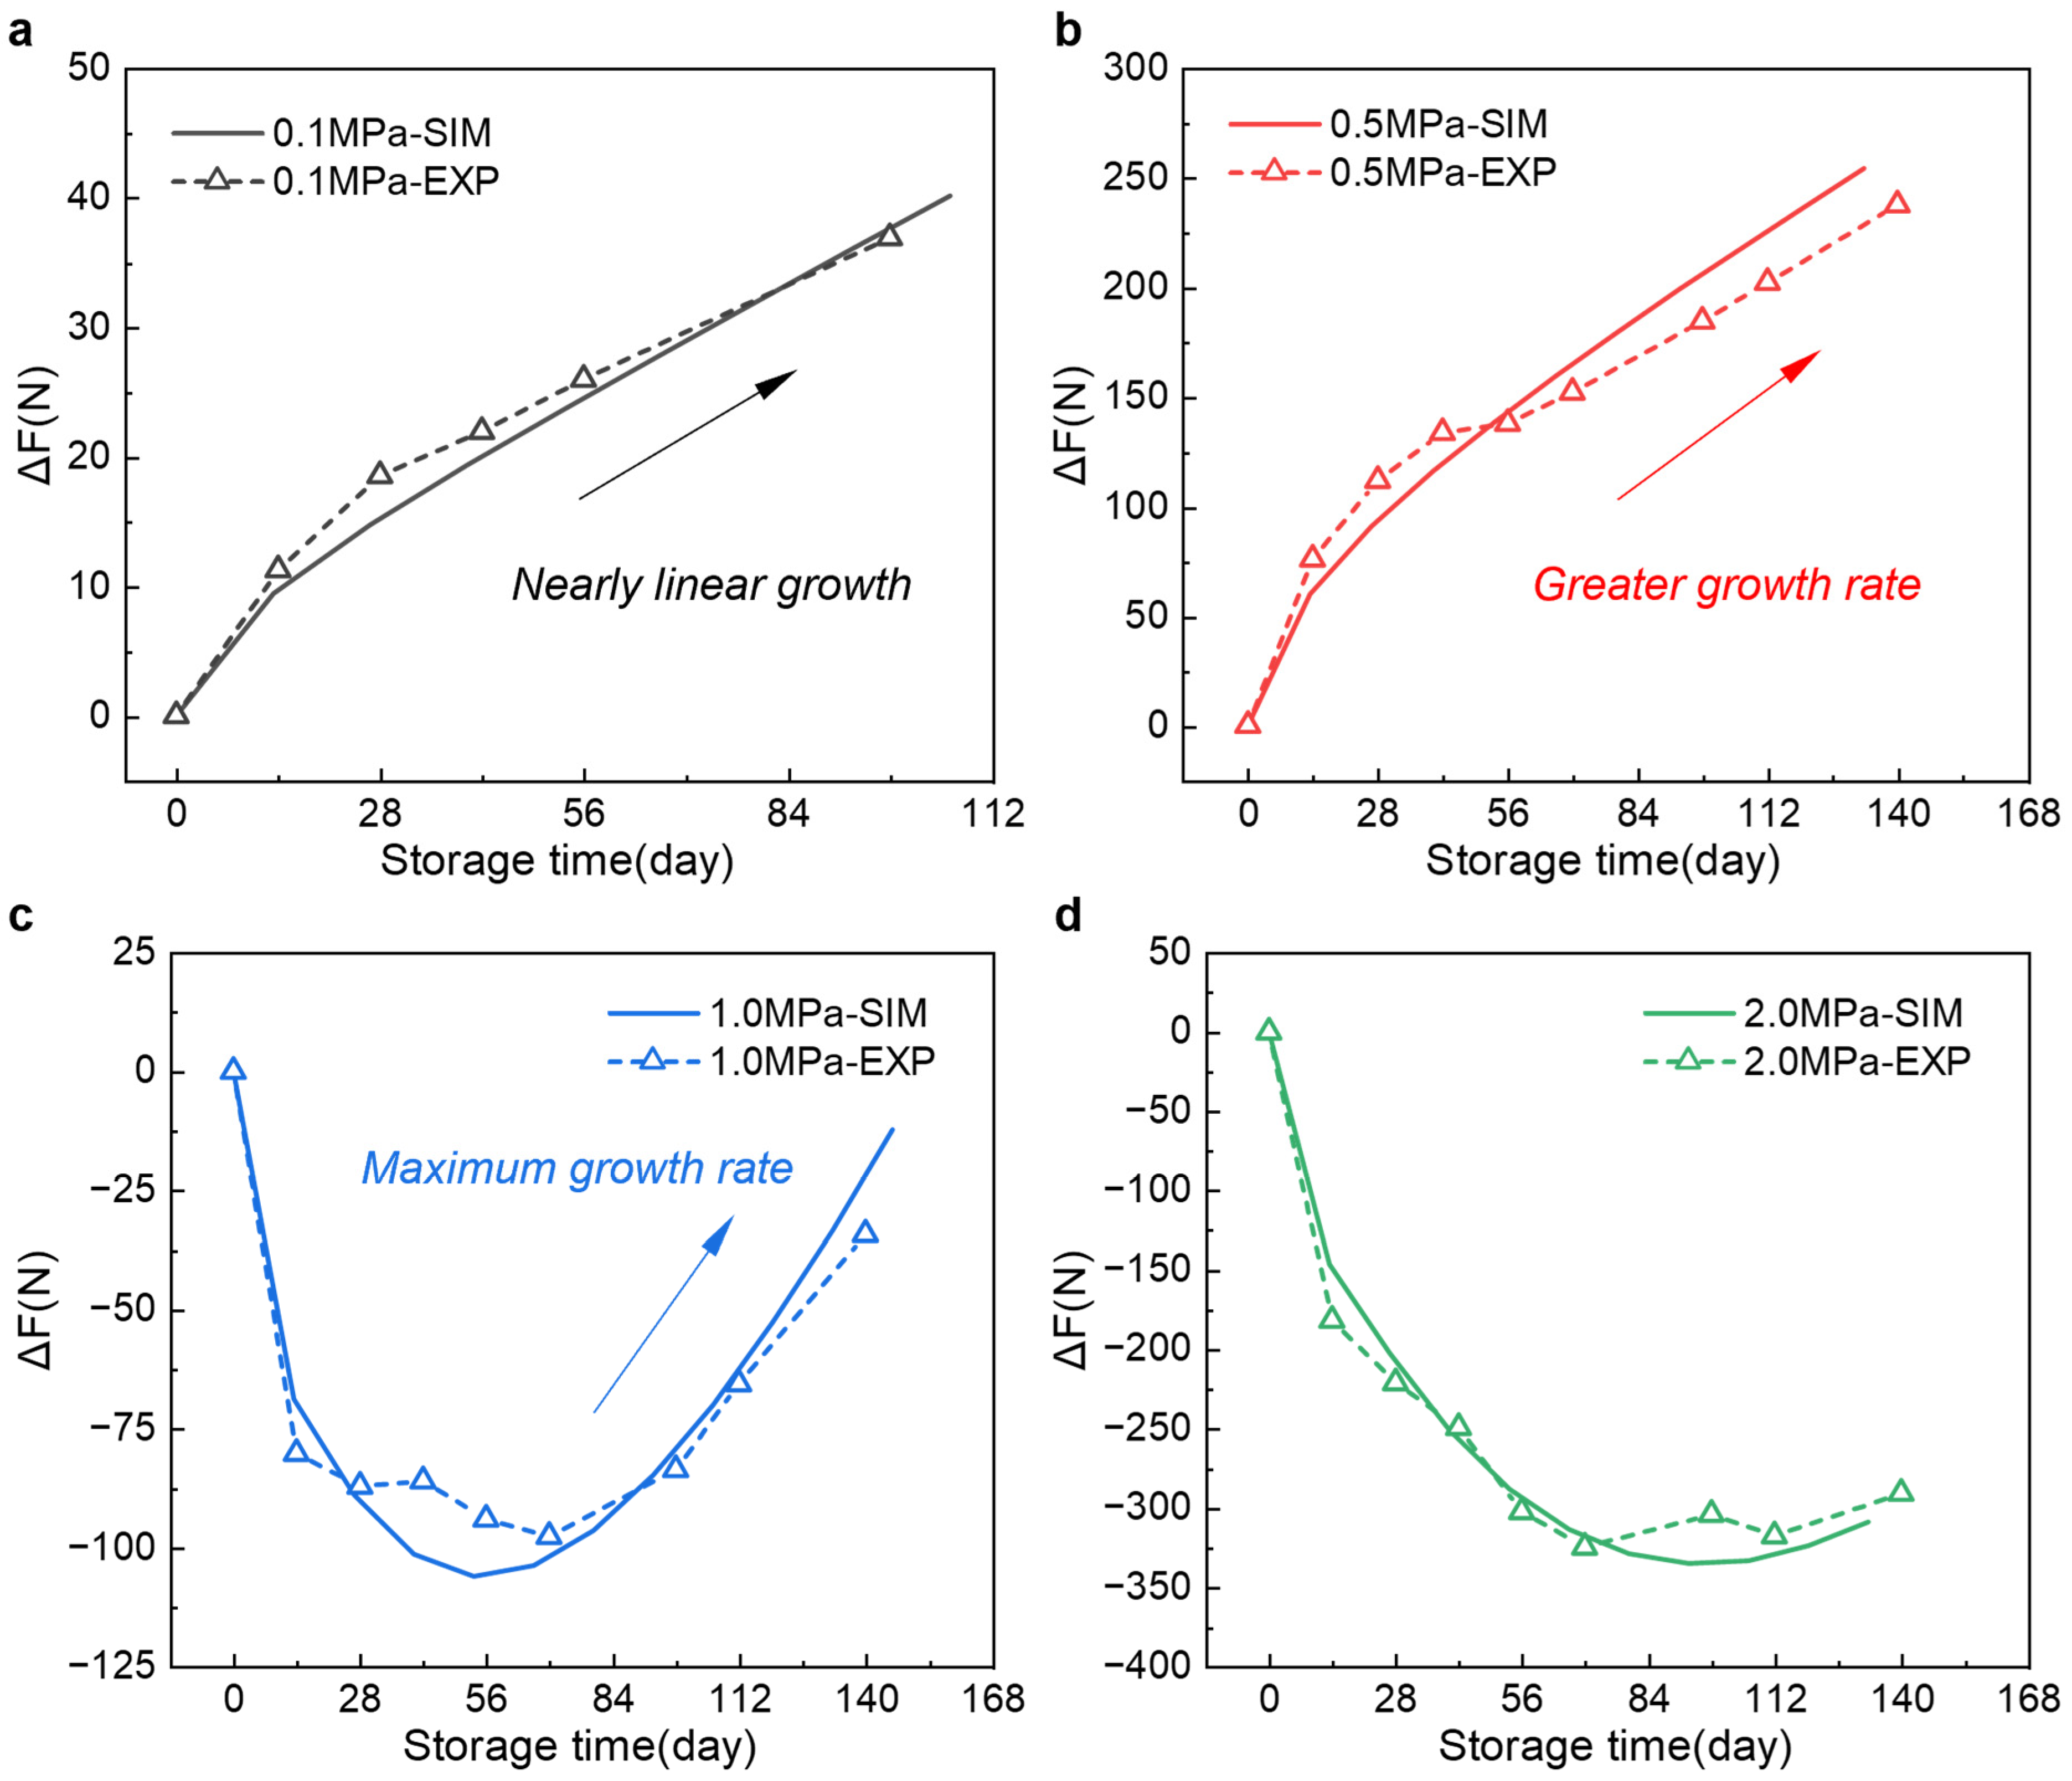
The combined influence of preload and SEI-induced densification was further evaluated under different preload pressures. The model reproduced the observed irreversible force evolution across all test conditions with high accuracy, capturing both the magnitude and the temporal progression.
A clear preload dependence emerged, as shown in Figure 6. At 1.0 MPa, the dominant relaxation process concluded after ~70 days, after which irreversible force resumed its upward trajectory as SEI-induced expansion accumulated. At 2.0 MPa, relaxation persisted much longer, delaying the onset of irreversible force recovery until ~98 days. These results emphasize the critical role of preload in dictating the balance between relaxation and irreversible stress accumulation. While higher preload amplifies the magnitude of force fluctuations, it also extends the relaxation period, temporarily offsetting the buildup of irreversible stress. This interplay complicates the interpretation of force signals but also highlights the nuanced, time-dependent role of mechanical confinement.
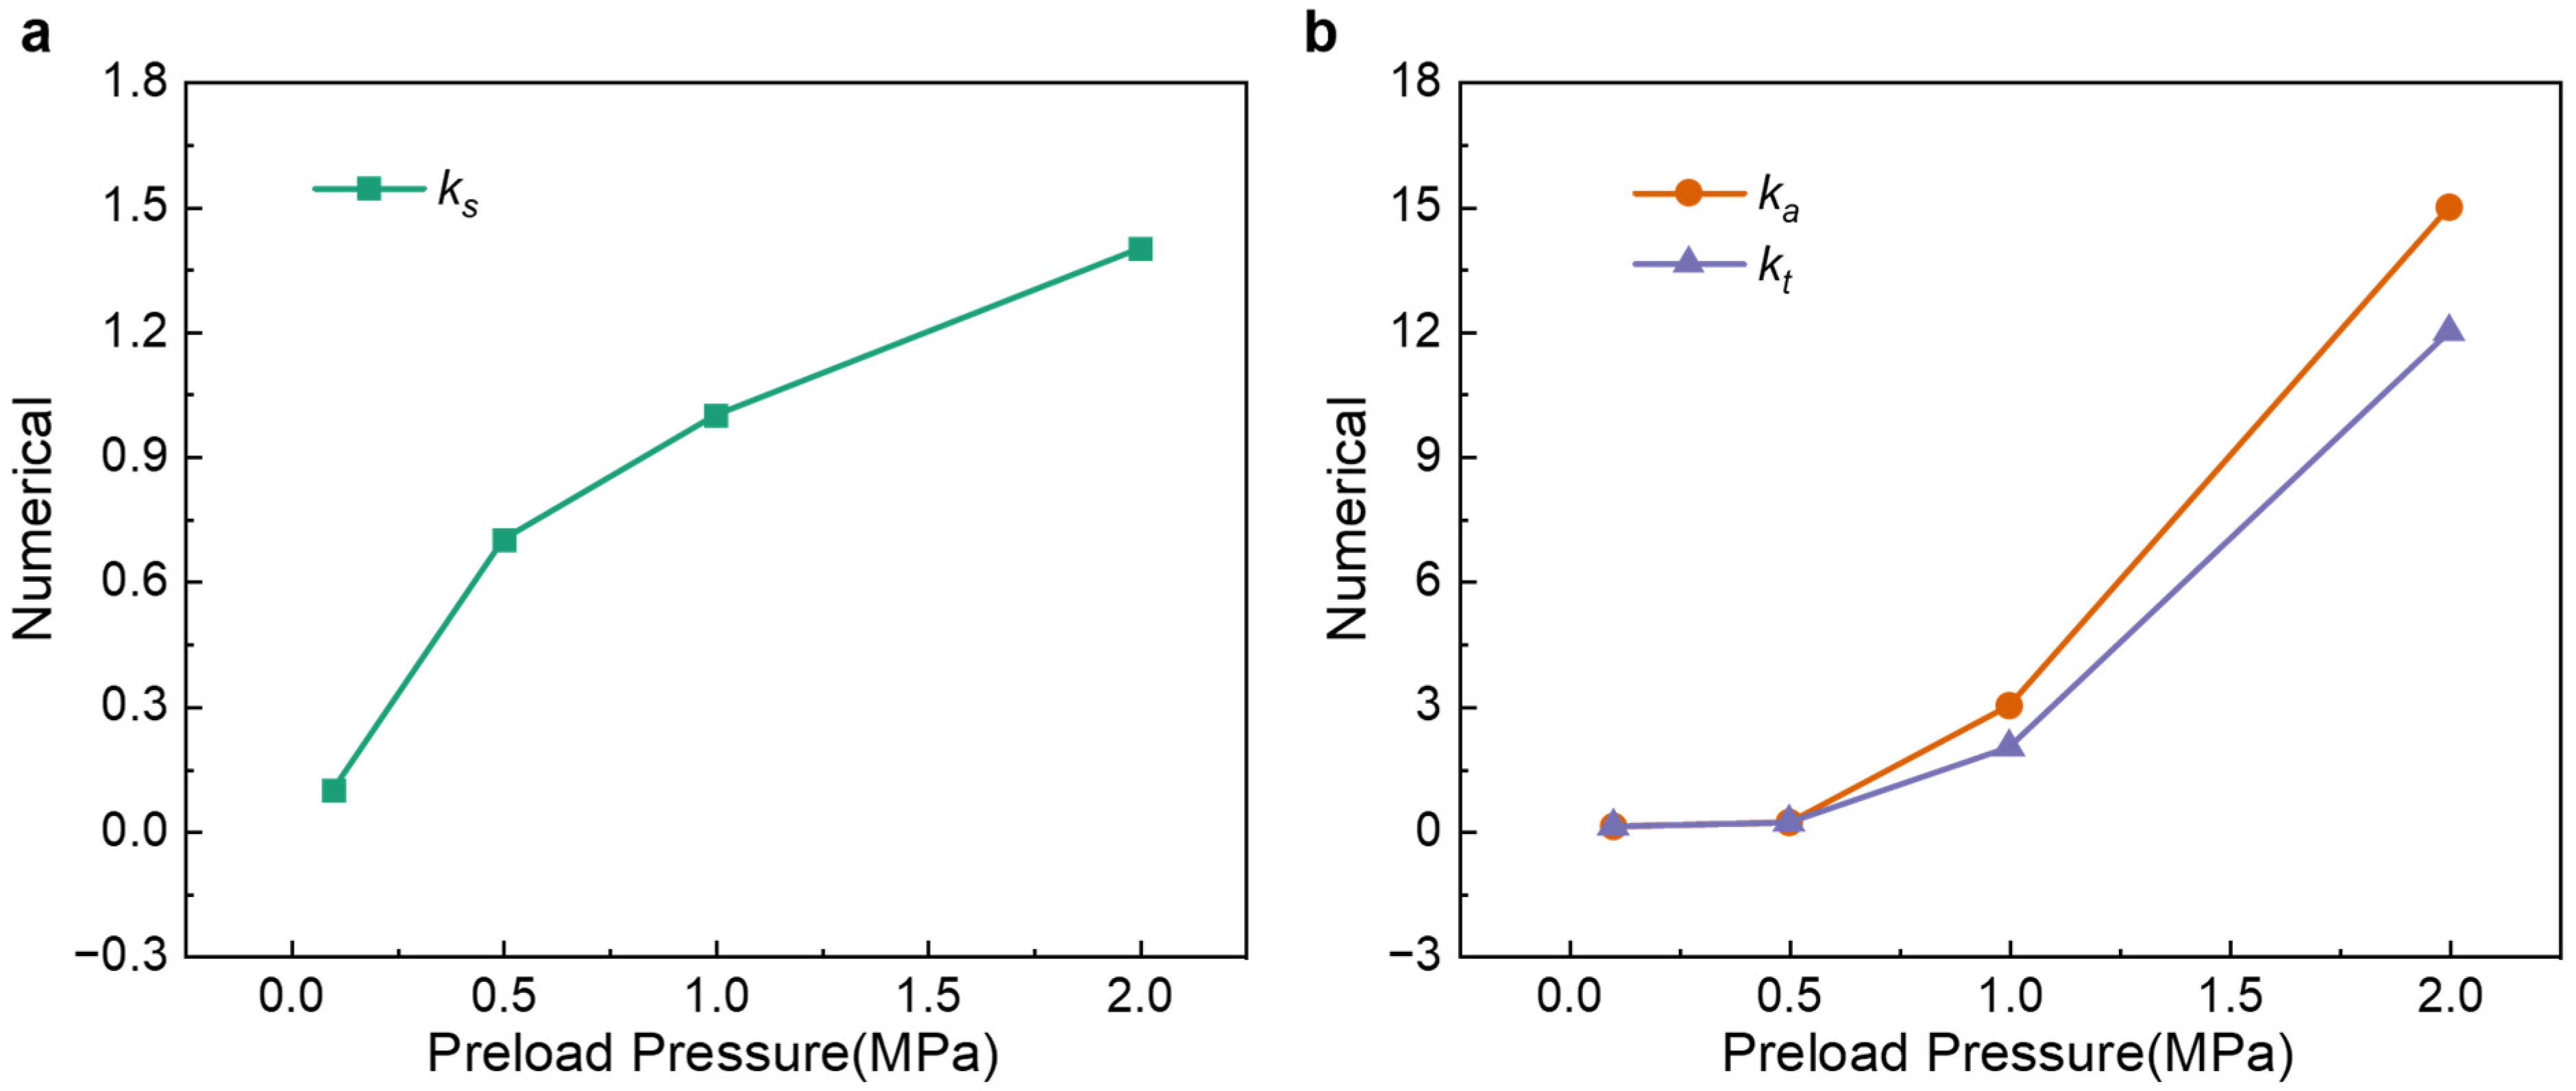
Quantitative fitting using the viscoelastic model yielded three key parameters: ks (stiffness correction), ka (relaxation amplitude), and kt (relaxation time), as shown in Figure 7. Each parameter displayed systematic trends with preload. The stiffness correction factor ks increased with preload, reflecting the enhanced effective stiffness of the constrained electrode stack. Notably, the rate of increase diminished at higher preloads, consistent with the nonlinear character of stress–strain behavior under large compressive loads. Both relaxation parameters, ka and kt, increased approximately exponentially with preload, indicating that stronger confinement not only produces larger relaxation magnitudes but also prolongs relaxation durations. Their correlated trends suggest that relaxation events under high preload involve broader structural rearrangements, which inherently decay more slowly.

3.4. Decoupling Irreversible and Relaxation Forces

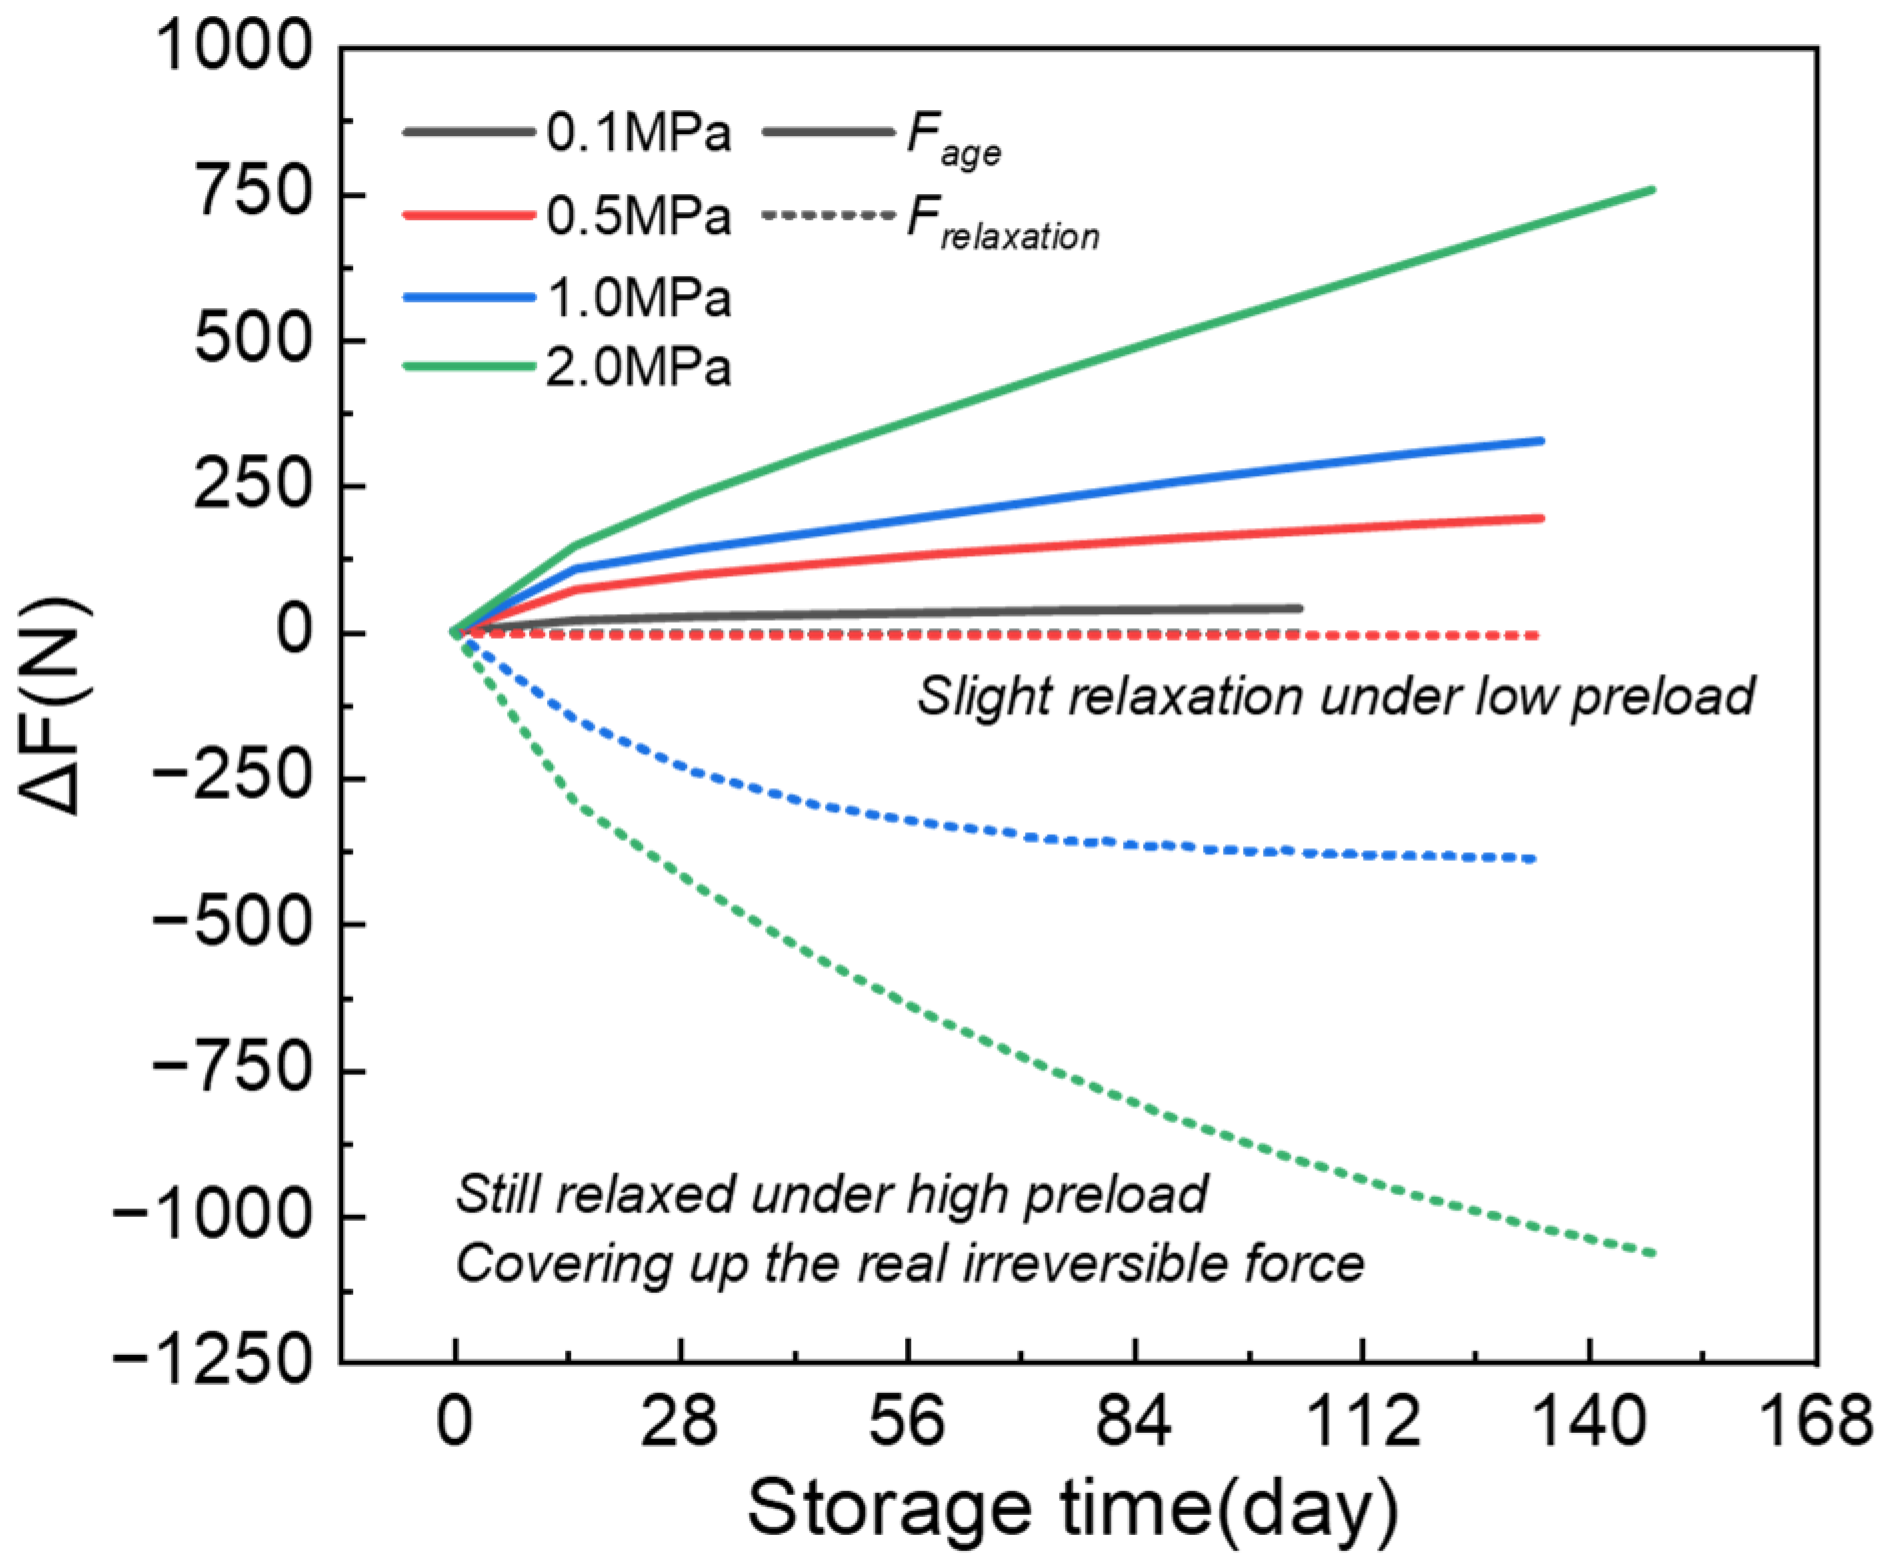
To disentangle the different contributions to the measured force response, the total force was decomposed into irreversible and relaxation components (Figure 8). The irreversible force represents the net buildup of stress caused by SEI-driven electrode expansion, while the relaxation force reflects time-dependent reductions in stress due to viscoelastic redistribution of internal strain. This decomposition revealed several important insights.
First, it demonstrated that preload alters both the magnitude and temporal evolution of each contribution. At low preload, the relaxation contribution was minimal, and the irreversible component directly reflected the intrinsic chemo–mechanical expansion. At higher preload, however, relaxation dominated the early response, temporarily masking the irreversible contribution and delaying its manifestation. Second, it showed that even when preload appeared to have little impact on capacity fade, it significantly shaped the mechanical pathway by which stress accumulated or dissipated.
This framework offers both mechanistic and practical value. Mechanistically, it highlights that long-term battery degradation cannot be fully understood without considering the coupled evolution of chemical and mechanical processes. The interplay between SEI growth, porosity reduction, stiffness increase, and viscoelastic relaxation defines the overall stress trajectory. Practically, the ability to decouple these contributions provides a tool for rational preload design in battery modules. Excessive preload may lead to long-lasting relaxation artifacts that complicate diagnostics and accelerate localized degradation, whereas optimized preload can stabilize electrode contact, suppress interfacial side reactions, and reduce safety risks.
From a broader perspective, this study demonstrates the importance of integrated chemo–mechanical modeling for predicting long-term battery behavior. While electrochemical models alone can capture capacity fade, only by coupling them with mechanical models can we reproduce the evolution of internal stress signals, which are increasingly recognized as valuable observables for battery health monitoring. The present work thus provides both a validated modeling framework and design guidelines for harnessing preload as a controllable parameter in improving the reliability of lithium-ion batteries.

4. Conclusions

This study demonstrates that preload pressure critically shapes the mechanical evolution of lithium-ion pouch cells during calendar aging: low preload (e.g., 0.1 MPa) minimizes viscoelastic relaxation and provides a reliable calibration baseline, while higher preloads amplify pressure fluctuations, stiffen the electrode stack, and prolong relaxation. Although capacity fade remains largely unaffected, elevated preload slightly suppresses SEI formation by reducing porosity and surface area, thereby mitigating parasitic reactions. The proposed coupled electrochemical–mechanical model, incorporating stiffness correction and viscoelastic parameters, accurately reproduces both irreversible force buildup and relaxation dynamics, and its decomposition of total force into irreversible (aging-driven) and relaxation (time-dependent) contributions provides mechanistic insight into how confinement and chemical degradation interact. Together, the integrated experimental–modeling framework establishes preload as a key design parameter in battery modules and offers a predictive basis for optimizing long-term performance, with implications for different chemistries, operating regimes, and real-time health monitoring.
In addition to the calendar aging results presented in this paper, the effect of preload on capacity decay caused by cycling needs further investigation. This is because the electrochemical–mechanical coupling during cycling is highly complex, and the decrease in porosity can lead to more side reactions such as lithium plating and deactivation of active materials, which are not yet fully understood. Moreover, the feasibility of implementing preload control in commercial battery modules—including cost, energy density, scalability, and compatibility with existing assembly processes—also warrants more systematic evaluation. These aspects will be explored in future work to extend the present framework toward real-world module design, preload management, and lifetime prediction.

Author Contributions

Conceptualization, J.L. and X.-G.Y.; methodology, J.L. and X.L.; hardware setup, J.L. and Z.Y.; validation, J.L. and H.L.; formal analysis, S.L. and X.F. (Xingcun Fan); investigation, J.S. and X.F. (Xiaolong Feng); resources, Z.C. and X.L.; data curation, J.L. and H.L.; writing—original draft preparation, J.L.; writing—review and editing, X.-G.Y.; visualization, J.L. and Z.Y.; supervision, X.-G.Y.; project administration, X.L.; funding acquisition, X.-G.Y. All authors have read and agreed to the published version of the manuscript.

Funding

This research was funded by National Natural Science Foundation of China (52277212), Shenzhen Science and Technology Program (KJZD20230923114611023), and the Guangdong Basic and Applied Basic Research Foundation (No. 2024A1515010264).

Data Availability Statement

The data that support the plots within this paper and other findings of this study are available from the corresponding author on reasonable request.

Conflicts of Interest

Author Xue Li, Jintao Shi, Xingcun Fan, Zifeng Cong and Xiaolong Feng are employed by the company China Automotive New Energy Technology Co. Ltd. The remaining authors declare that the research was conducted in the absence of any potential or financial relationship that could be constructed as a potential conflict of interest.

Nomenclature

List of Symbols:
FFaraday constant (96,487 C·mol−1)
cconcentration (mol·m−3)
Ddiffusion coefficient (m2·s−1)
t+transference number
i0exchange current density (A·m−2)
jvolumetric current density (A·m−3)
rparticle radius (m)
kkinetic rate constant (m·s−1)
Uopen-circuit potential (V)
Mmolecular weight (kg·mol−1)
Ttemperature (K)
Rfilm resistance (Ω)
Llength (m)
Nnumber of layers
Kstress–strain curve
Velectrode volume (m3)
Greek:
ϕpotential (V)
ηoverpotential (V)
αcharge transfer coefficient
εvolume fraction
δthickness (m)
σelectronic conductivity (S·m−1)
ρdensity (kg·m−3)
θlithium content stoichiometric coefficient
Subscripts:
nnegative
ppositive
sptseparator
eelectrolyte phase
ssolid phase
intintercalation
tottotal
ECethylene carbonate
SEIsolid-electrolyte interphase
revreversible
irrevirreversible
avgaverage

Appendix A

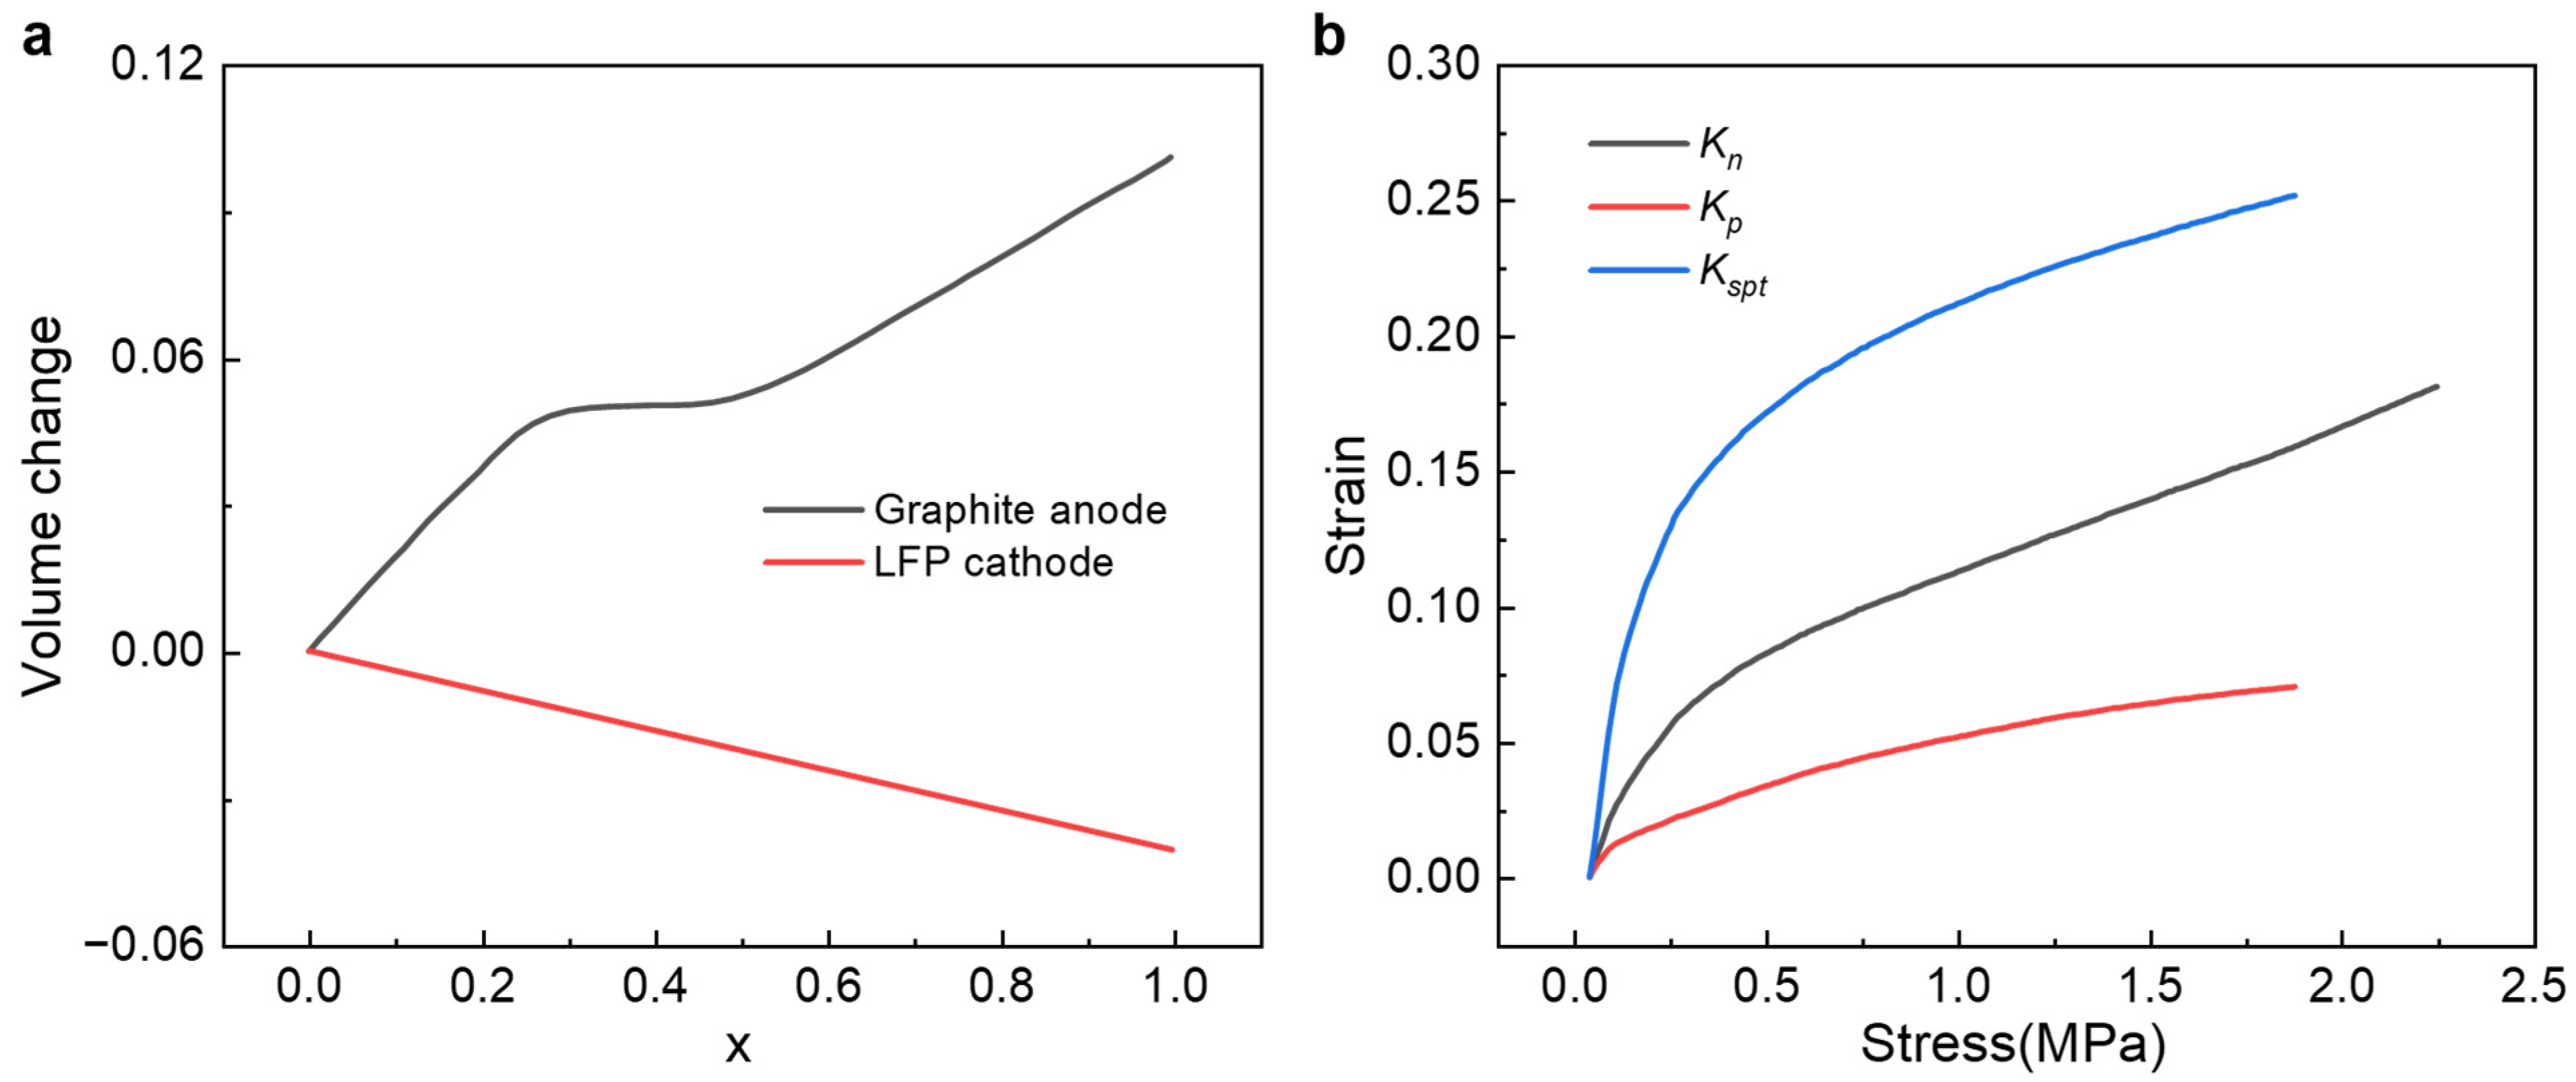
Figure A1a shows the expansion curves of the positive electrode and graphite negative electrode of the lithium iron phosphate battery. During charging, lithium ions are extracted from the positive electrode and inserted into the negative electrode, causing the graphite negative electrode to expand by about 10% and the positive electrode to shrink by about 4%. Figure A1b shows the stress–strain curves of the positive electrode, graphite negative electrode and separator of the lithium iron phosphate battery measured using a compression universal testing machine, which are used to calculate the stress conditions during the battery expansion process.
Figure A1. (a) Expansion curves of lithium iron phosphate cathode and graphite anode; (b) Stress–strain curves of lithium iron phosphate cathode, graphite anode and separator.
Applsci 15 12528 g0a1

Appendix B

Using the same method as the experimental section in Section 2.1, the cell capacity retention under initial preload pressure of 0.5 MPa at 25 °C and 45 °C and storage at 100% SOC was tested and processed, and the model provided accurate predictions. As the temperature increases, the amount of SEI by-reaction products also increases, leading to faster capacity decay.
Figure A2. Comparison of calendar storage cell capacity retention and model simulation results at different temperatures.
Applsci 15 12528 g0a2

Appendix C

Under initial preloads of 1.0 MPa and 2.0 MPa, significant pressure relaxation occurs, and the strain caused by external force is greater than 0, leading to an increase in the total strain of the electrode and consequently a plateau in porosity.
Figure A3. Evolution of relative porosity with varying initial preloads.
Applsci 15 12528 g0a3

References

  1. Choi, J.W.; Aurbach, D. Promise and reality of post-lithium-ion batteries with high energy densities. Nat. Rev. Mater. 2016, 1, 16013. [Google Scholar] [CrossRef]
  2. Han, X.; Lu, L.; Zheng, Y.; Feng, X.; Li, Z.; Li, J.; Ouyang, M. A review on the key issues of the lithium ion battery degradation among the whole life cycle. ETransportation 2019, 1, 100005. [Google Scholar] [CrossRef]
  3. Duan, J.; Tang, X.; Dai, H.; Yang, Y.; Wu, W.; Wei, X.; Huang, Y. Building safe lithium-ion batteries for electric vehicles: A review. Electrochem. Energy Rev. 2020, 3, 1–42. [Google Scholar] [CrossRef]
  4. Thackeray, M.M.; Wolverton, C.; Isaacs, E.D. Electrical energy storage for transportation—Approaching the limits of, and going beyond, lithium-ion batteries. Energy Environ. Sci. 2012, 5, 7854–7863. [Google Scholar] [CrossRef]
  5. Keil, P.; Schuster, S.F.; Wilhelm, J.; Travi, J.; Hauser, A.; Karl, R.C.; Jossen, A. Calendar aging of lithium-ion batteries. J. Electrochem. Soc. 2016, 163, A1872. [Google Scholar] [CrossRef]
  6. Wu, H.; Jia, H.; Wang, C.; Zhang, J.G.; Xu, W. Recent progress in understanding solid electrolyte interphase on lithium metal anodes. Adv. Energy Mater. 2021, 11, 2003092. [Google Scholar] [CrossRef]
  7. Pinson, M.B.; Bazant, M.Z. Theory of SEI formation in rechargeable batteries: Capacity fade, accelerated aging and lifetime prediction. J. Electrochem. Soc. 2012, 160, A243. [Google Scholar] [CrossRef]
  8. Wang, A.; Kadam, S.; Li, H.; Shi, S.; Qi, Y. Review on modeling of the anode solid electrolyte interphase (SEI) for lithium-ion batteries. NPJ Comput. Mater. 2018, 4, 15. [Google Scholar] [CrossRef]
  9. Safari, M.; Delacourt, C. Modeling of a commercial graphite/LiFePO4 cell. J. Electrochem. Soc. 2011, 158, A562. [Google Scholar] [CrossRef]
  10. Yang, X.-G.; Leng, Y.; Zhang, G.; Ge, S.; Wang, C.-Y. Modeling of lithium plating induced aging of lithium-ion batteries: Transition from linear to nonlinear aging. J. Power Sources 2017, 360, 28–40. [Google Scholar] [CrossRef]
  11. Reddy, S.K.M.; Shang, W.; White, R.E. Mathematical model for SEI growth under open-circuit conditions. J. Electrochem. Soc. 2022, 169, 090505. [Google Scholar] [CrossRef]
  12. Deshpande, R.; Verbrugge, M.; Cheng, Y.-T.; Wang, J.; Liu, P. Battery cycle life prediction with coupled chemical degradation and fatigue mechanics. J. Electrochem. Soc. 2012, 159, A1730. [Google Scholar] [CrossRef]
  13. Weng, A.; Olide, E.; Kovalchuk, I.; Siegel, J.B.; Stefanopoulou, A. Modeling battery formation: Boosted sei growth, multi-species reactions, and irreversible expansion. J. Electrochem. Soc. 2023, 170, 090523. [Google Scholar] [CrossRef]
  14. Chung, H.; Kim, J.; Bae, Y.S.; Moon, J. Predictive modeling of lithium-ion battery degradation: Incorporating SEI layer growth and mechanical stress factors. J. Mech. Sci. Technol. 2024, 38, 6157–6167. [Google Scholar] [CrossRef]
  15. Li, J.L.; Wang, Y.N.; Sun, S.Y.; Zheng, Z.; Gao, Y.; Shi, P.; Zhao, Y.J.; Li, X.; Li, Q.; Zhang, X.Q. Understanding and regulating the mechanical stability of solid electrolyte interphase in batteries. Adv. Energy Mater. 2025, 15, 2403845. [Google Scholar] [CrossRef]
  16. Schommer, A.; Corzo, M.O.; Henshall, P.; Morrey, D.; Collier, G. Stack pressure on lithium-ion pouch cells: A comparative study of constant pressure and fixed displacement devices. J. Power Sources 2025, 629, 236019. [Google Scholar] [CrossRef]
  17. Müller, V.; Scurtu, R.-G.; Memm, M.; Danzer, M.A.; Wohlfahrt-Mehrens, M. Study of the influence of mechanical pressure on the performance and aging of Lithium-ion battery cells. J. Power Sources 2019, 440, 227148. [Google Scholar] [CrossRef]
  18. Deich, T.; Storch, M.; Steiner, K.; Bund, A. Effects of module stiffness and initial compression on lithium-ion cell aging. J. Power Sources 2021, 506, 230163. [Google Scholar] [CrossRef]
  19. Li, Q.; Liu, H.; Ye, Y.; Li, K.J.; Wu, F.; Li, L.; Chen, R. The critical importance of stack pressure in batteries. Nat. Energy 2025, 10, 1064–1073. [Google Scholar] [CrossRef]
  20. Gor, G.Y.; Cannarella, J.; Prévost, J.H.; Arnold, C.B. A model for the behavior of battery separators in compression at different strain/charge rates. J. Electrochem. Soc. 2014, 161, F3065. [Google Scholar] [CrossRef]
  21. Laresgoiti, I.; Käbitz, S.; Ecker, M.; Sauer, D.U. Modeling mechanical degradation in lithium ion batteries during cycling: Solid electrolyte interphase fracture. J. Power Sources 2015, 300, 112–122. [Google Scholar] [CrossRef]
  22. Rashid, M.; Gupta, A. Mathematical model for combined effect of SEI formation and gas evolution in Li-ion batteries. ECS Electrochem. Lett. 2014, 3, A95. [Google Scholar] [CrossRef]
  23. Bernhard, R.; Metzger, M.; Gasteiger, H.A. Gas evolution at graphite anodes depending on electrolyte water content and SEI quality studied by on-line electrochemical mass spectrometry. J. Electrochem. Soc. 2015, 162, A1984. [Google Scholar] [CrossRef]
  24. Deshpande, R.D.; Bernardi, D.M. Modeling solid-electrolyte interphase (SEI) fracture: Coupled mechanical/chemical degradation of the lithium ion battery. J. Electrochem. Soc. 2017, 164, A461. [Google Scholar] [CrossRef]
  25. Lundkvist, A.; Larsson, P.-L.; Iyer, A.H.; Olsson, E. Discrete element modelling of the elastic-plastic and viscoelastic properties of a lithium-ion battery electrode layer. Powder Technol. 2024, 443, 119873. [Google Scholar] [CrossRef]
  26. Cannarella, J.; Arnold, C.B. Stress evolution and capacity fade in constrained lithium-ion pouch cells. J. Power Sources 2014, 245, 745–751. [Google Scholar] [CrossRef]
  27. De Sutter, L.; Berckmans, G.; Marinaro, M.; Wohlfahrt-Mehrens, M.; Berecibar, M.; Van Mierlo, J. Mechanical behavior of Silicon-Graphite pouch cells under external compressive load: Implications and opportunities for battery pack design. J. Power Sources 2020, 451, 227774. [Google Scholar] [CrossRef]
  28. von Kessel, O.; Deich, T.; Hahn, S.; Brauchle, F.; Vrankovic, D.; Soczka-Guth, T.; Birke, K.P. Mechanical impedance as a tool for electromechanical investigation and equivalent modeling of lithium-ion batteries. J. Power Sources 2021, 508, 230337. [Google Scholar] [CrossRef]
  29. Chen, S.; Wei, X.; Zhang, G.; Wang, X.; Feng, X.; Dai, H.; Ouyang, M. Mechanical strain signal based early warning for failure of different prismatic lithium-ion batteries. J. Power Sources 2023, 580, 233397. [Google Scholar] [CrossRef]
  30. Ding, S.; Wang, L.; Dai, H.; He, X. Prognosticating nonlinear degradation in lithium-ion batteries: Operando pressure as an early indicator preceding other signals of capacity fade and safety risks. Energy Storage Mater. 2025, 75, 103998. [Google Scholar] [CrossRef]
  31. Yang, K.; Zhang, W.-K.; Yin, Y.; Nan, J.; Wang, W.; Jiang, J.; Yang, X.-G. A hierarchical electrochemical-thermal-mechanical coupled model capable of predicting non-uniform behaviors in large-format Li-ion cells. J. Power Sources 2025, 629, 236049. [Google Scholar] [CrossRef]
  32. Yang, X.-G.; Wang, C.-Y. Understanding the trilemma of fast charging, energy density and cycle life of lithium-ion batteries. J. Power Sources 2018, 402, 489–498. [Google Scholar] [CrossRef]
  33. Garrick, T.R.; Huang, X.; Srinivasan, V.; Weidner, J.W. Modeling volume change in dual insertion electrodes. J. Electrochem. Soc. 2017, 164, E3552. [Google Scholar] [CrossRef]
  34. Kim, J.-S.; Lee, D.-C.; Lee, J.-J.; Kim, C.-W. Optimization of lithium-ion battery pouch cell for maximization of energy density while preventing internal short circuit caused by separator failure under crush load. J. Electrochem. Soc. 2021, 168, 030536. [Google Scholar] [CrossRef]
  35. Jiang, H.; He, Y.; Li, X.; Jin, Z.; Yu, H.; Li, D. Effect of the charge rate on the mechanical response of composite graphite electrodes: In situ experiment and mathematical analysis. Phys. Chem. Chem. Phys. 2024, 26, 1245–1254. [Google Scholar] [CrossRef]
  36. Sethuraman, V.A.; Van Winkle, N.; Abraham, D.P.; Bower, A.F.; Guduru, P.R. Real-time stress measurements in lithium-ion battery negative-electrodes. J. Power Sources 2012, 206, 334–342. [Google Scholar] [CrossRef]
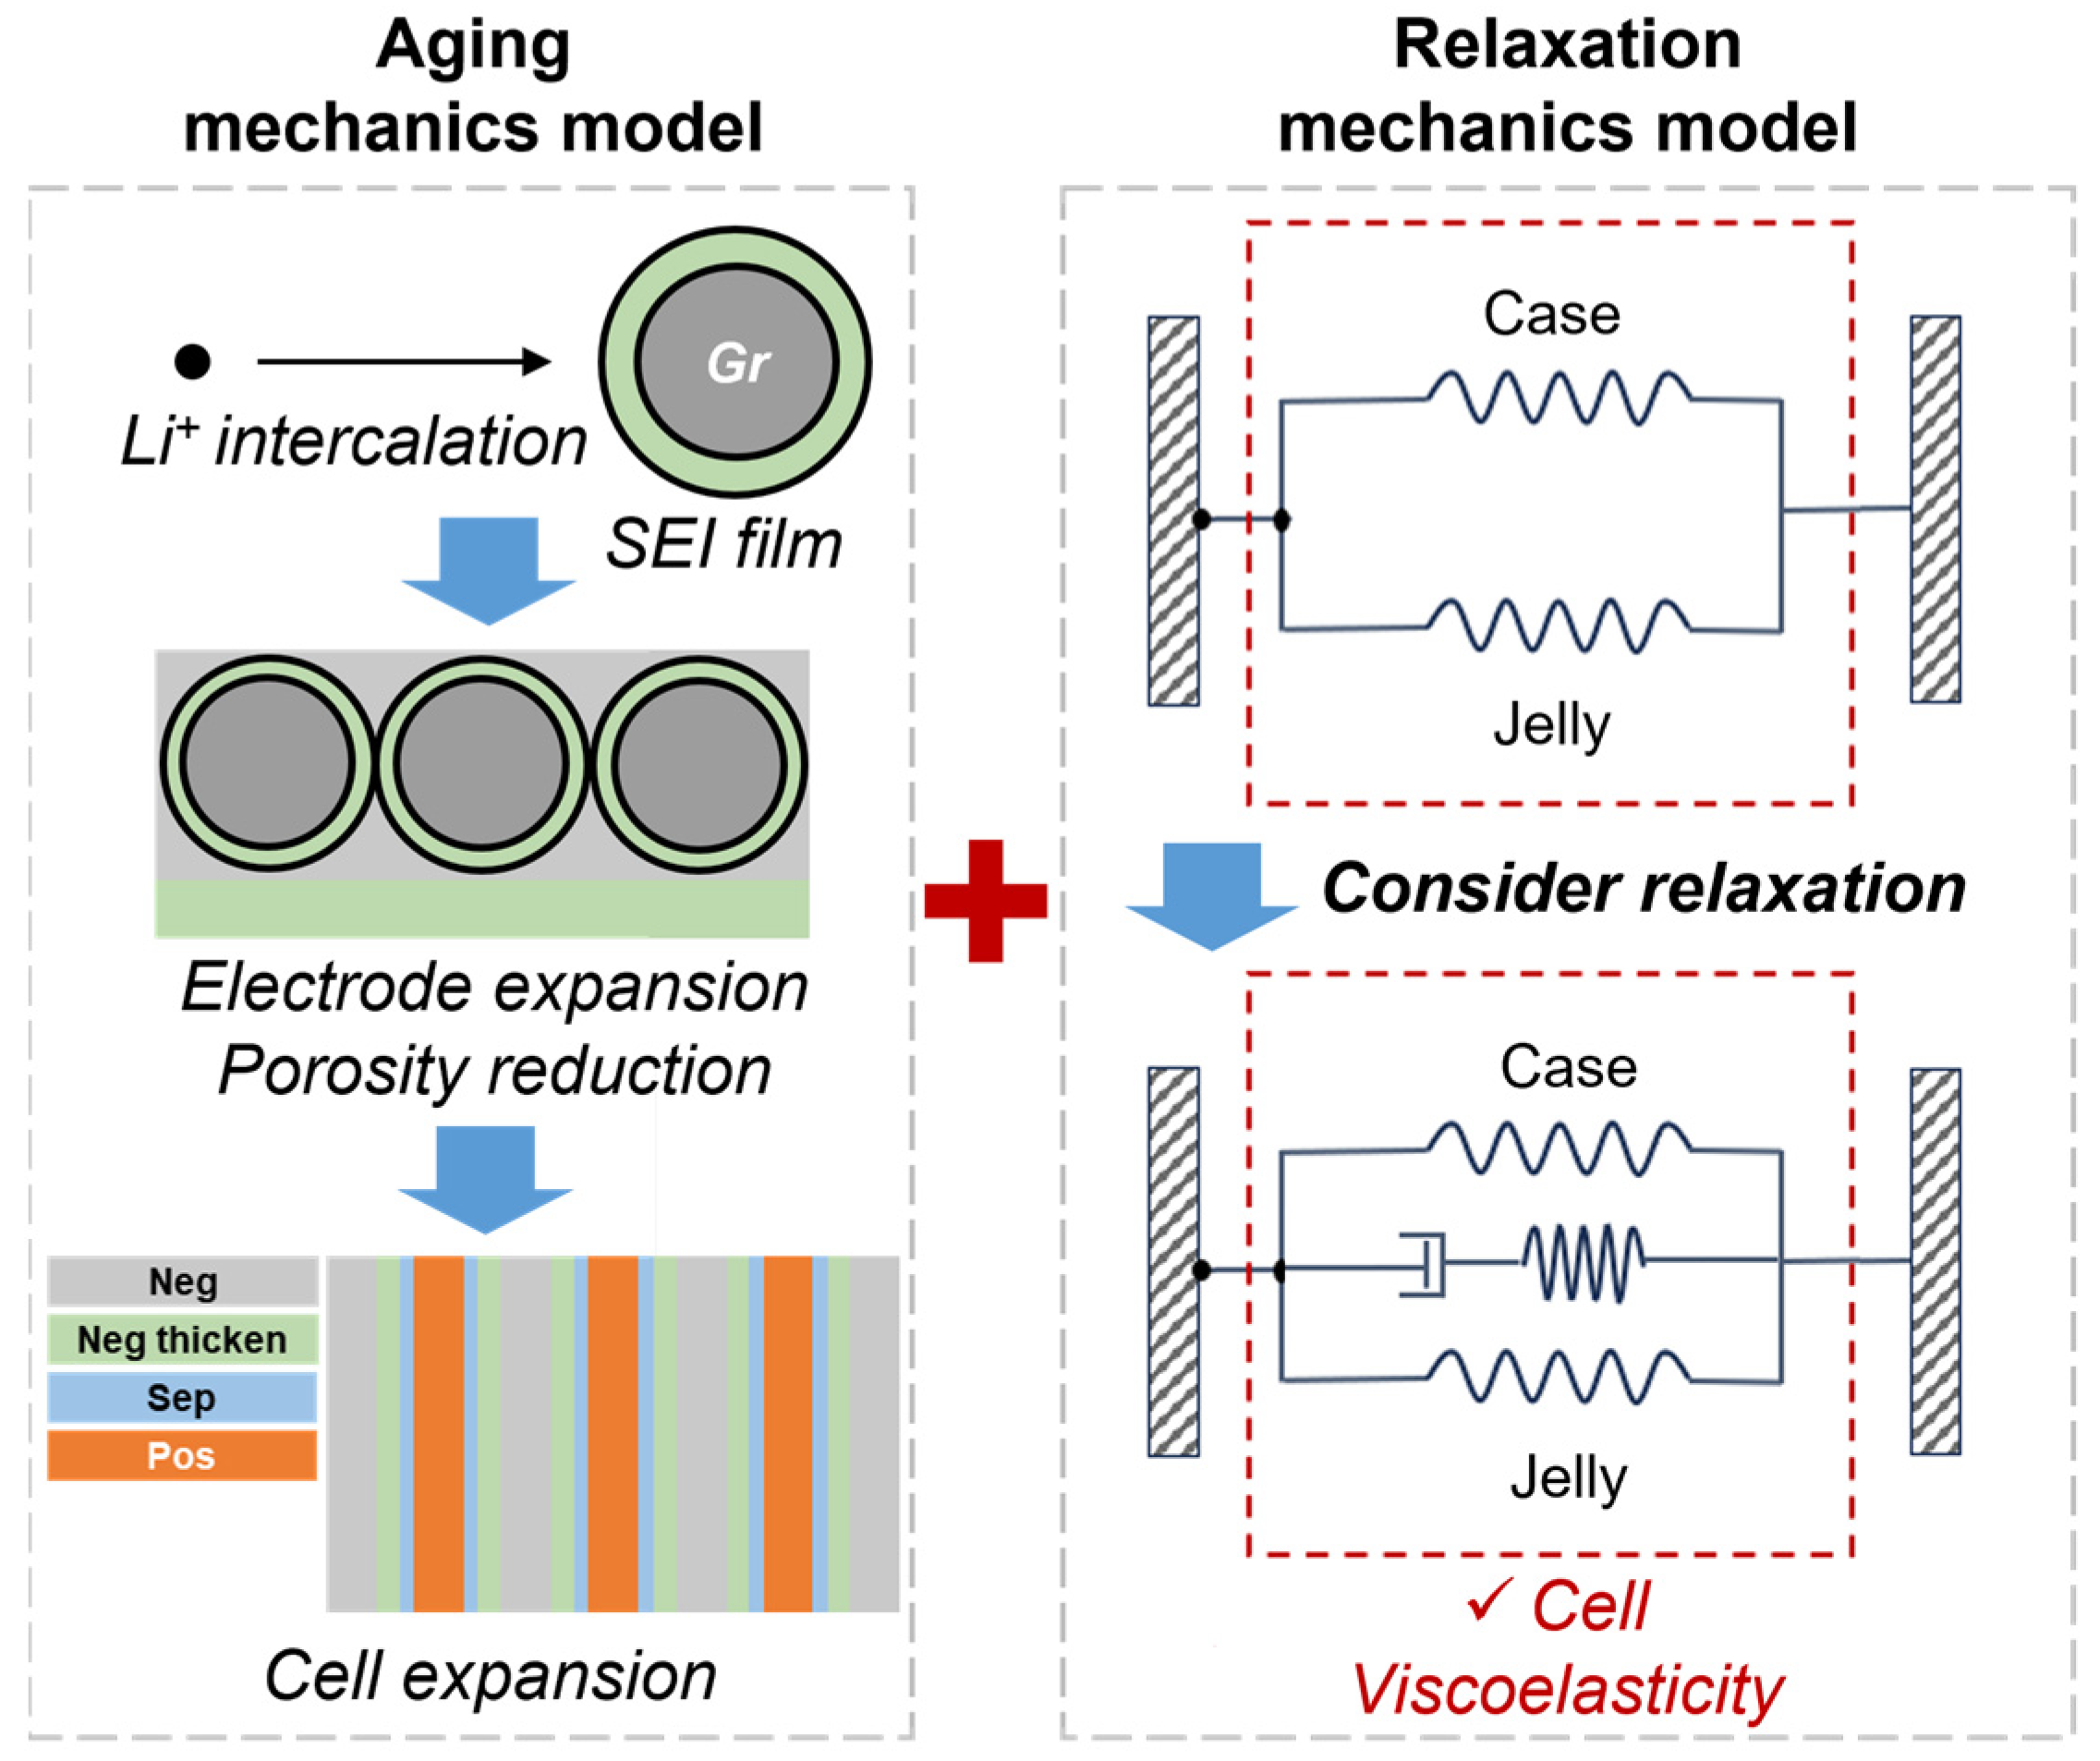
Figure 1. Framework of the ECM model for coupled aging and relaxation.
Applsci 15 12528 g001
Figure 2. Experimental results and model validation at different discharge rates. (a) Comparison between experimental and simulated discharge voltages at 0.1 C, 0.3 C, 1 C, and 3 C. (b) Comparison between experimental and simulated expansion forces during discharge at 0.1 C, 0.3 C, 1 C, and 3 C.
Applsci 15 12528 g002
Figure 3. Expansion force measured during the first reference performance test (RPT) in calendar aging under different preload pressures. (a) Evolution of expansion force for all tested preloads. (b) Expansion force evolution during the first RPT under 0.1 MPa preload, showing a gradual increase.
Applsci 15 12528 g003
Figure 4. Model simulation results extracted at the end of each RPT. (a) Comparison of experimental and simulated capacity retention under different preload pressures; (b) Evolution of porosity with varying initial preloads; (c) Evolution of active specific surface area with varying initial preloads; (d) Evolution of negative electrode strain with varying initial preloads.
Applsci 15 12528 g004
Figure 5. Comparison between experimental and simulated irreversible force under 0.1 MPa preload, with model results obtained by accounting for aging-induced stiffness changes.
Applsci 15 12528 g005
Figure 6. Comparison between experimental and simulated irreversible force under different preload pressures: (a) 0.1 MPa, (b) 0.5 MPa, (c) 1.0 MPa, and (d) 2.0 MPa.
Applsci 15 12528 g006
Figure 7. Identification of model correction parameters. (a) Variation in the stiffness correction parameter with preload pressure; (b) Variation in the relaxation parameter with preload pressure.
Applsci 15 12528 g007
Figure 8. Decoupling of irreversible aging forces and viscoelastic relaxation forces.
Applsci 15 12528 g008
Table 1. Cell design information and model parameters.
Cell Design Information
ParameterUnitCathodeSeparatorAnode
Thicknessum82.51364.5
Sizemm74 × 57/77 × 60
Mass loadingmg/cm219.9/9.65
Electrolyte concentrationmol/L/1.0/
Model parameters
Particle radiusum0.65/10.737
Active material fraction/0.66911/0.64044
Porosity/0.2976 0.32915
Bruggeman’s coefficient/2.1112 2.3171
Maximum concentrationmol/m322,186/31,249
Stoichiometric coefficients (0% SOC)/0.85873/0.1288
Stoichiometric coefficients (100% SOC)/0.011369/0.7752
Solid conductivityS/m6.75/100
Mechanical parameters
Modulus1/GPa70 (Al)/110 (Cu)
Disclaimer/Publisher’s Note: The statements, opinions and data contained in all publications are solely those of the individual author(s) and contributor(s) and not of MDPI and/or the editor(s). MDPI and/or the editor(s) disclaim responsibility for any injury to people or property resulting from any ideas, methods, instructions or products referred to in the content.