Remanufacturing and LCA: A Synergistic Approach Combining Structural Reliability, Sustainability, and Life Multi-Cycle Improvement
Abstract
1. Introduction
1.1. State of the Art: Remanufacturing Evaluation Through LCA and LCC
1.2. Objective and Research Questions
2. Materials and Methods
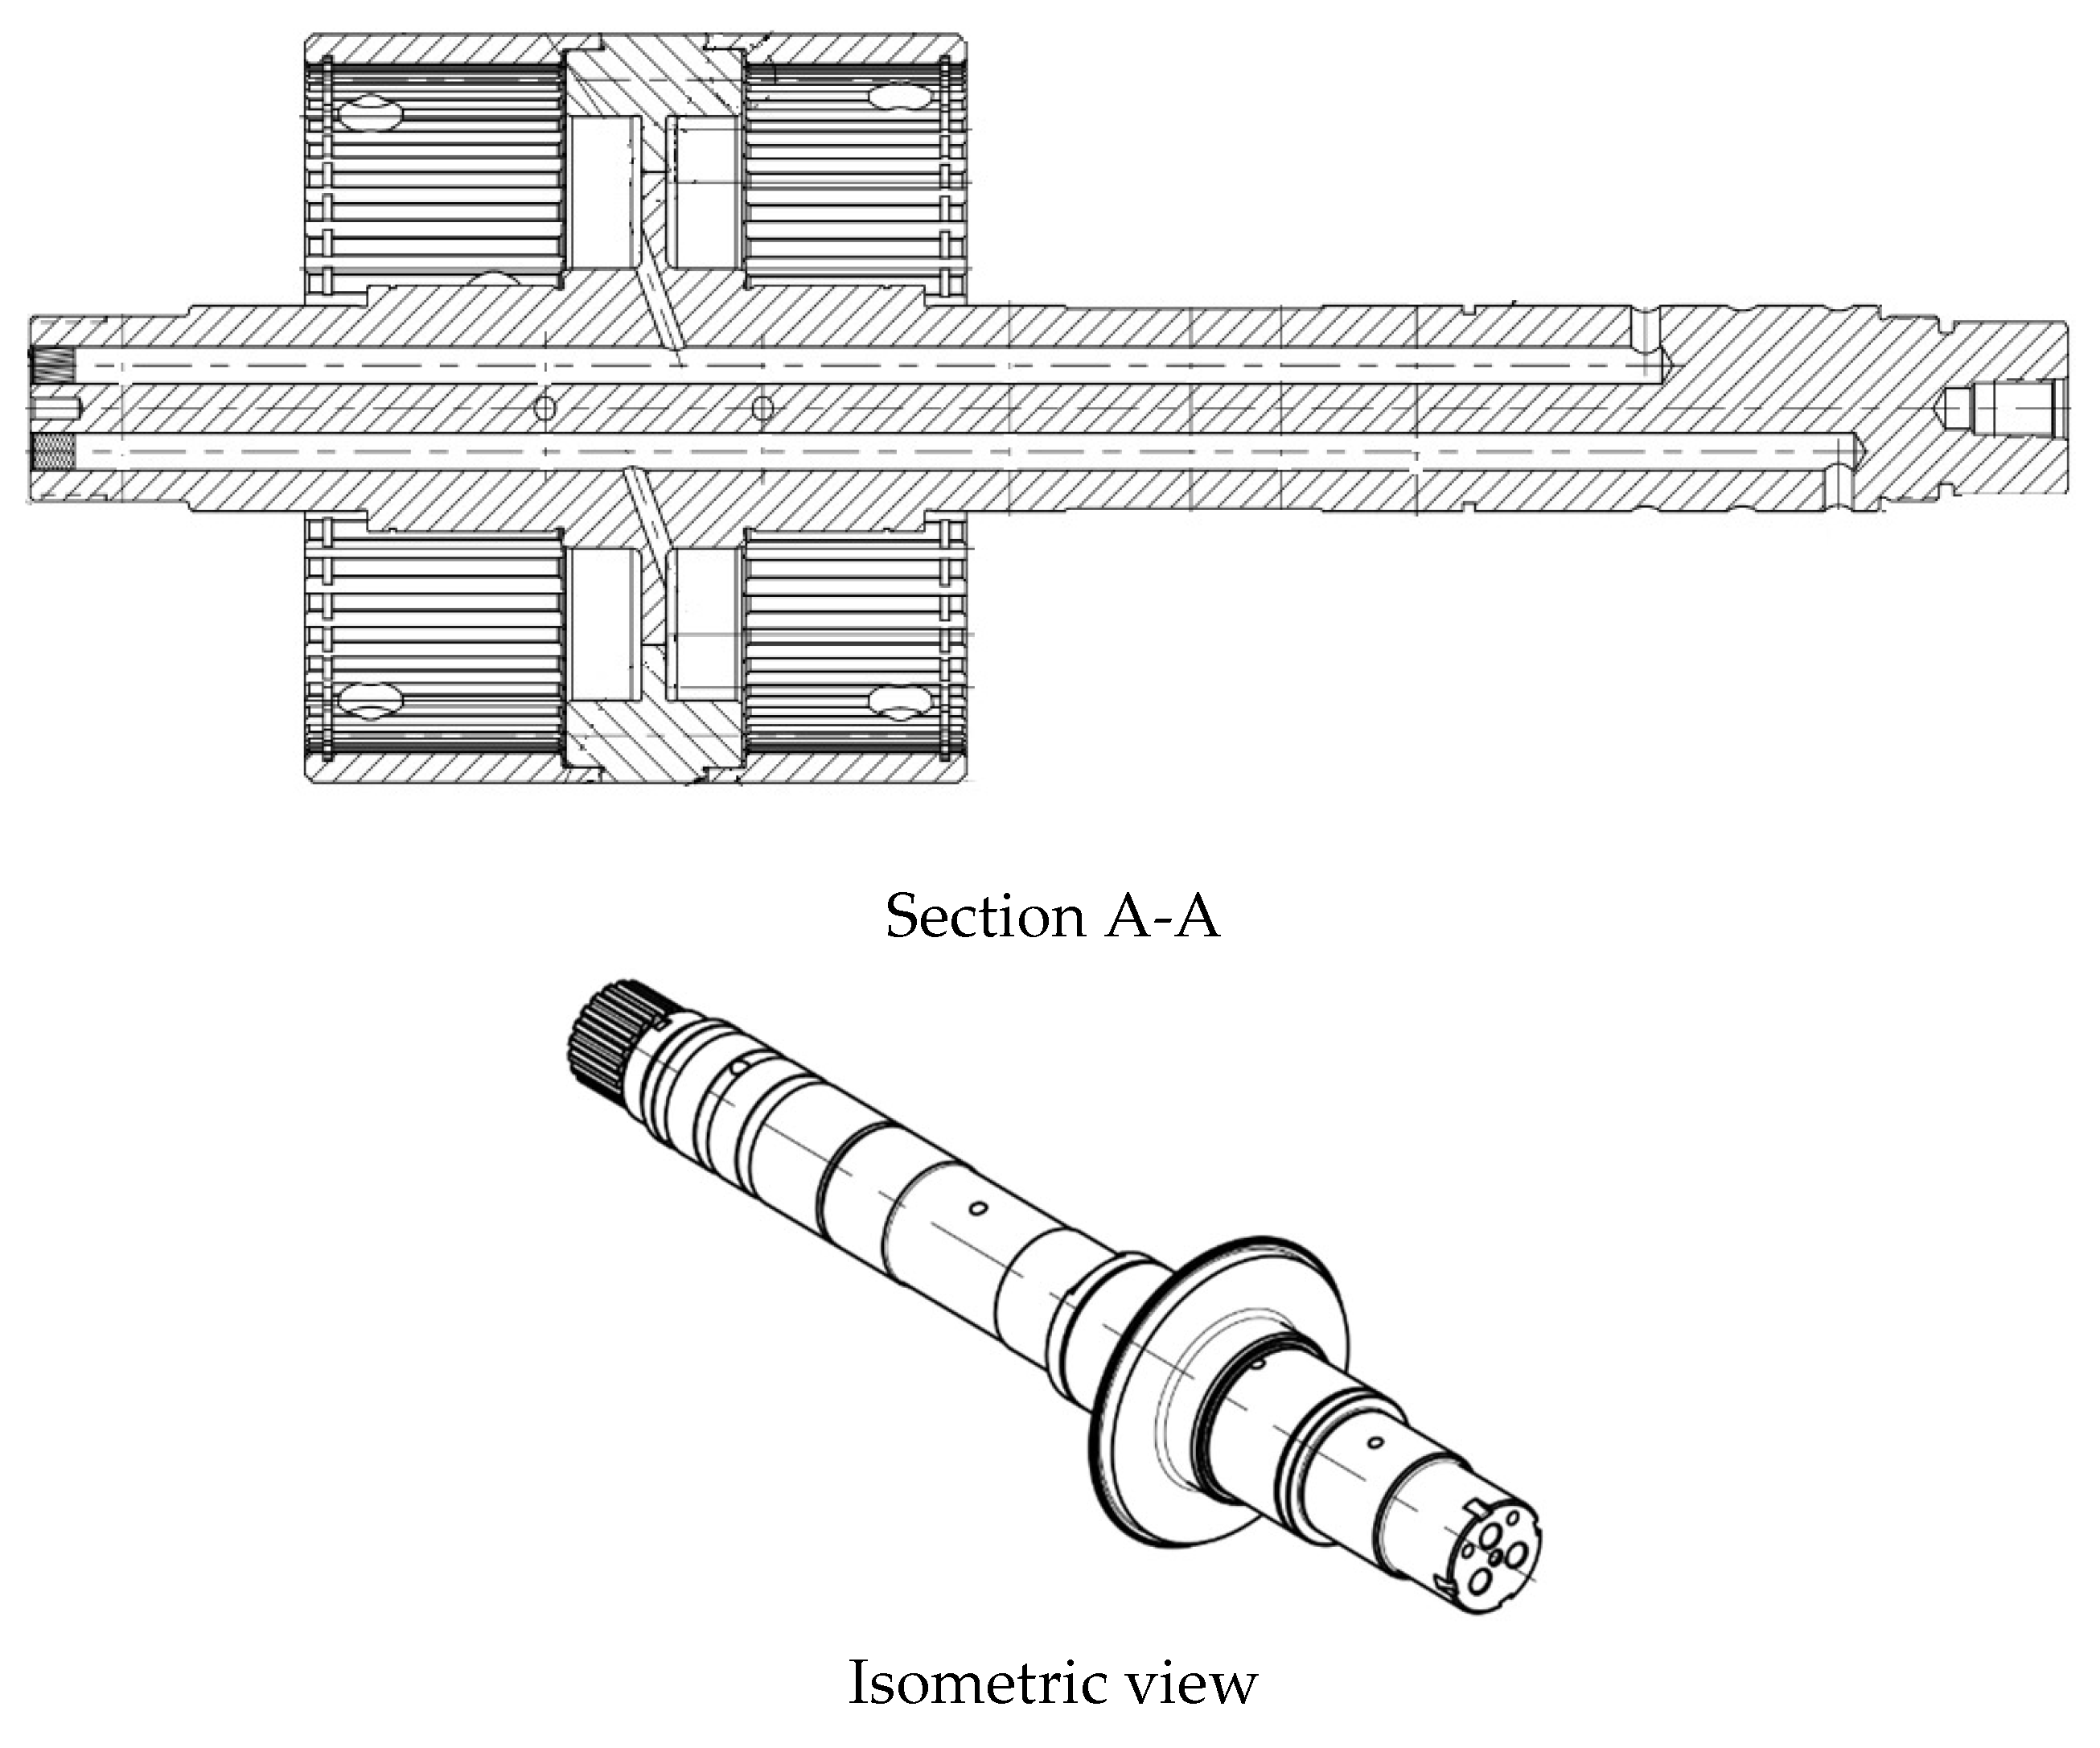
2.1. Case Study
2.2. Structure of the Work and Analysed Scenarios
- -
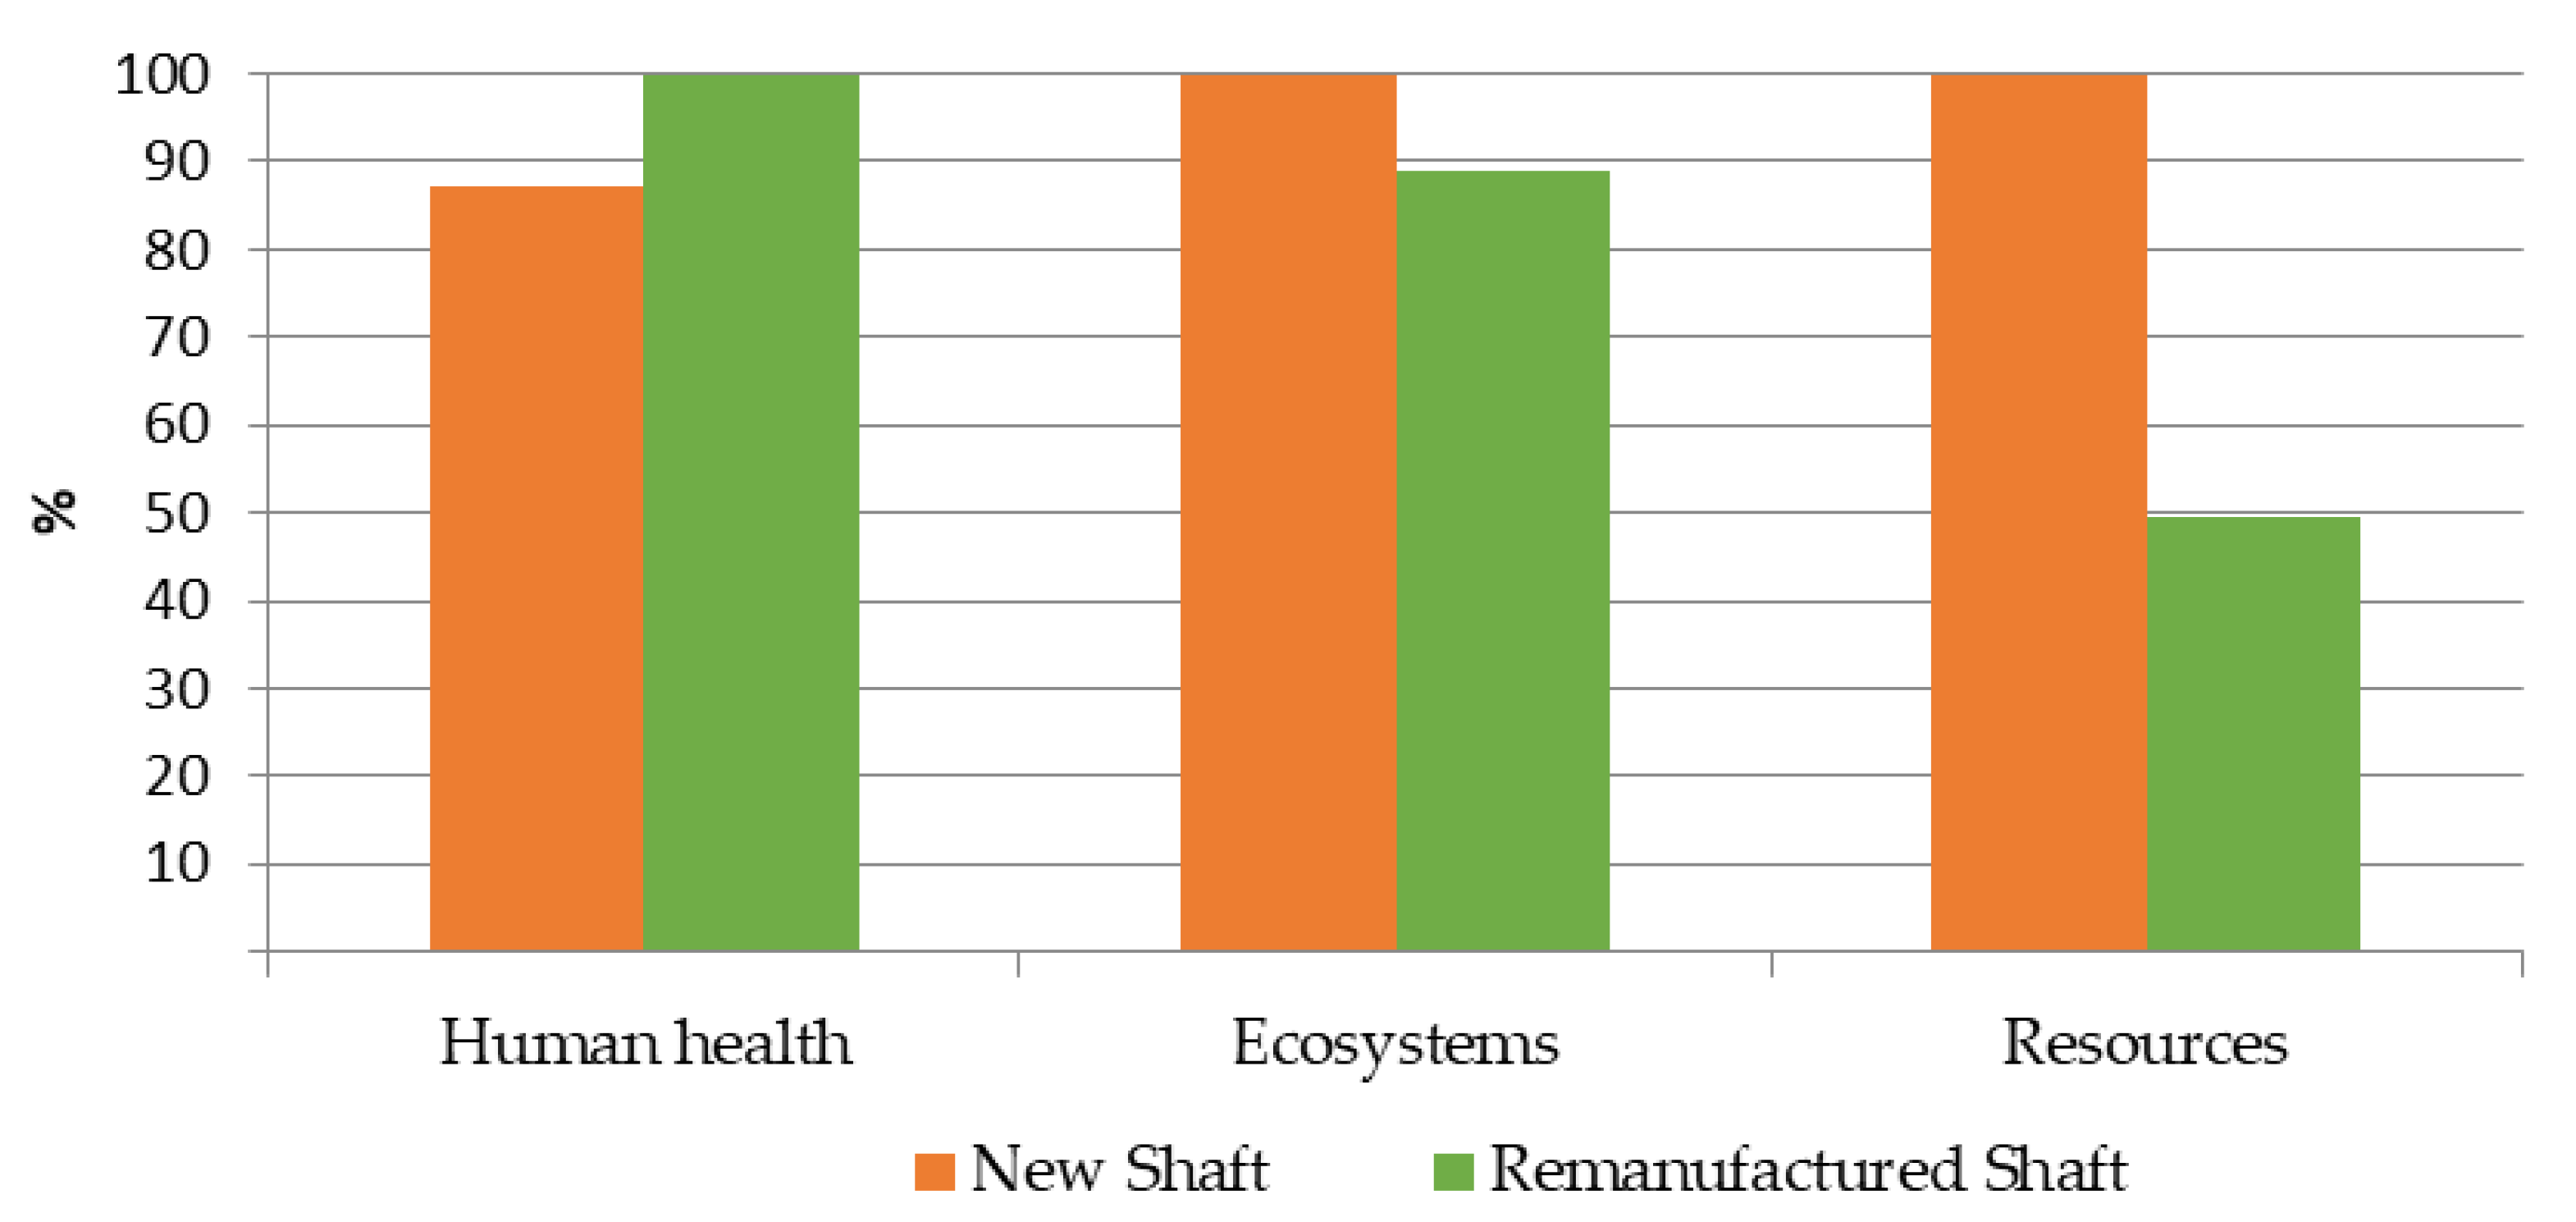
- Phase 1: Comparison between new and remanufactured shafts. A complete LCA (cradle-to-grave) was carried out for both components, including the materials, production processes, surface treatments, assembly, and end-of-life management.
- -
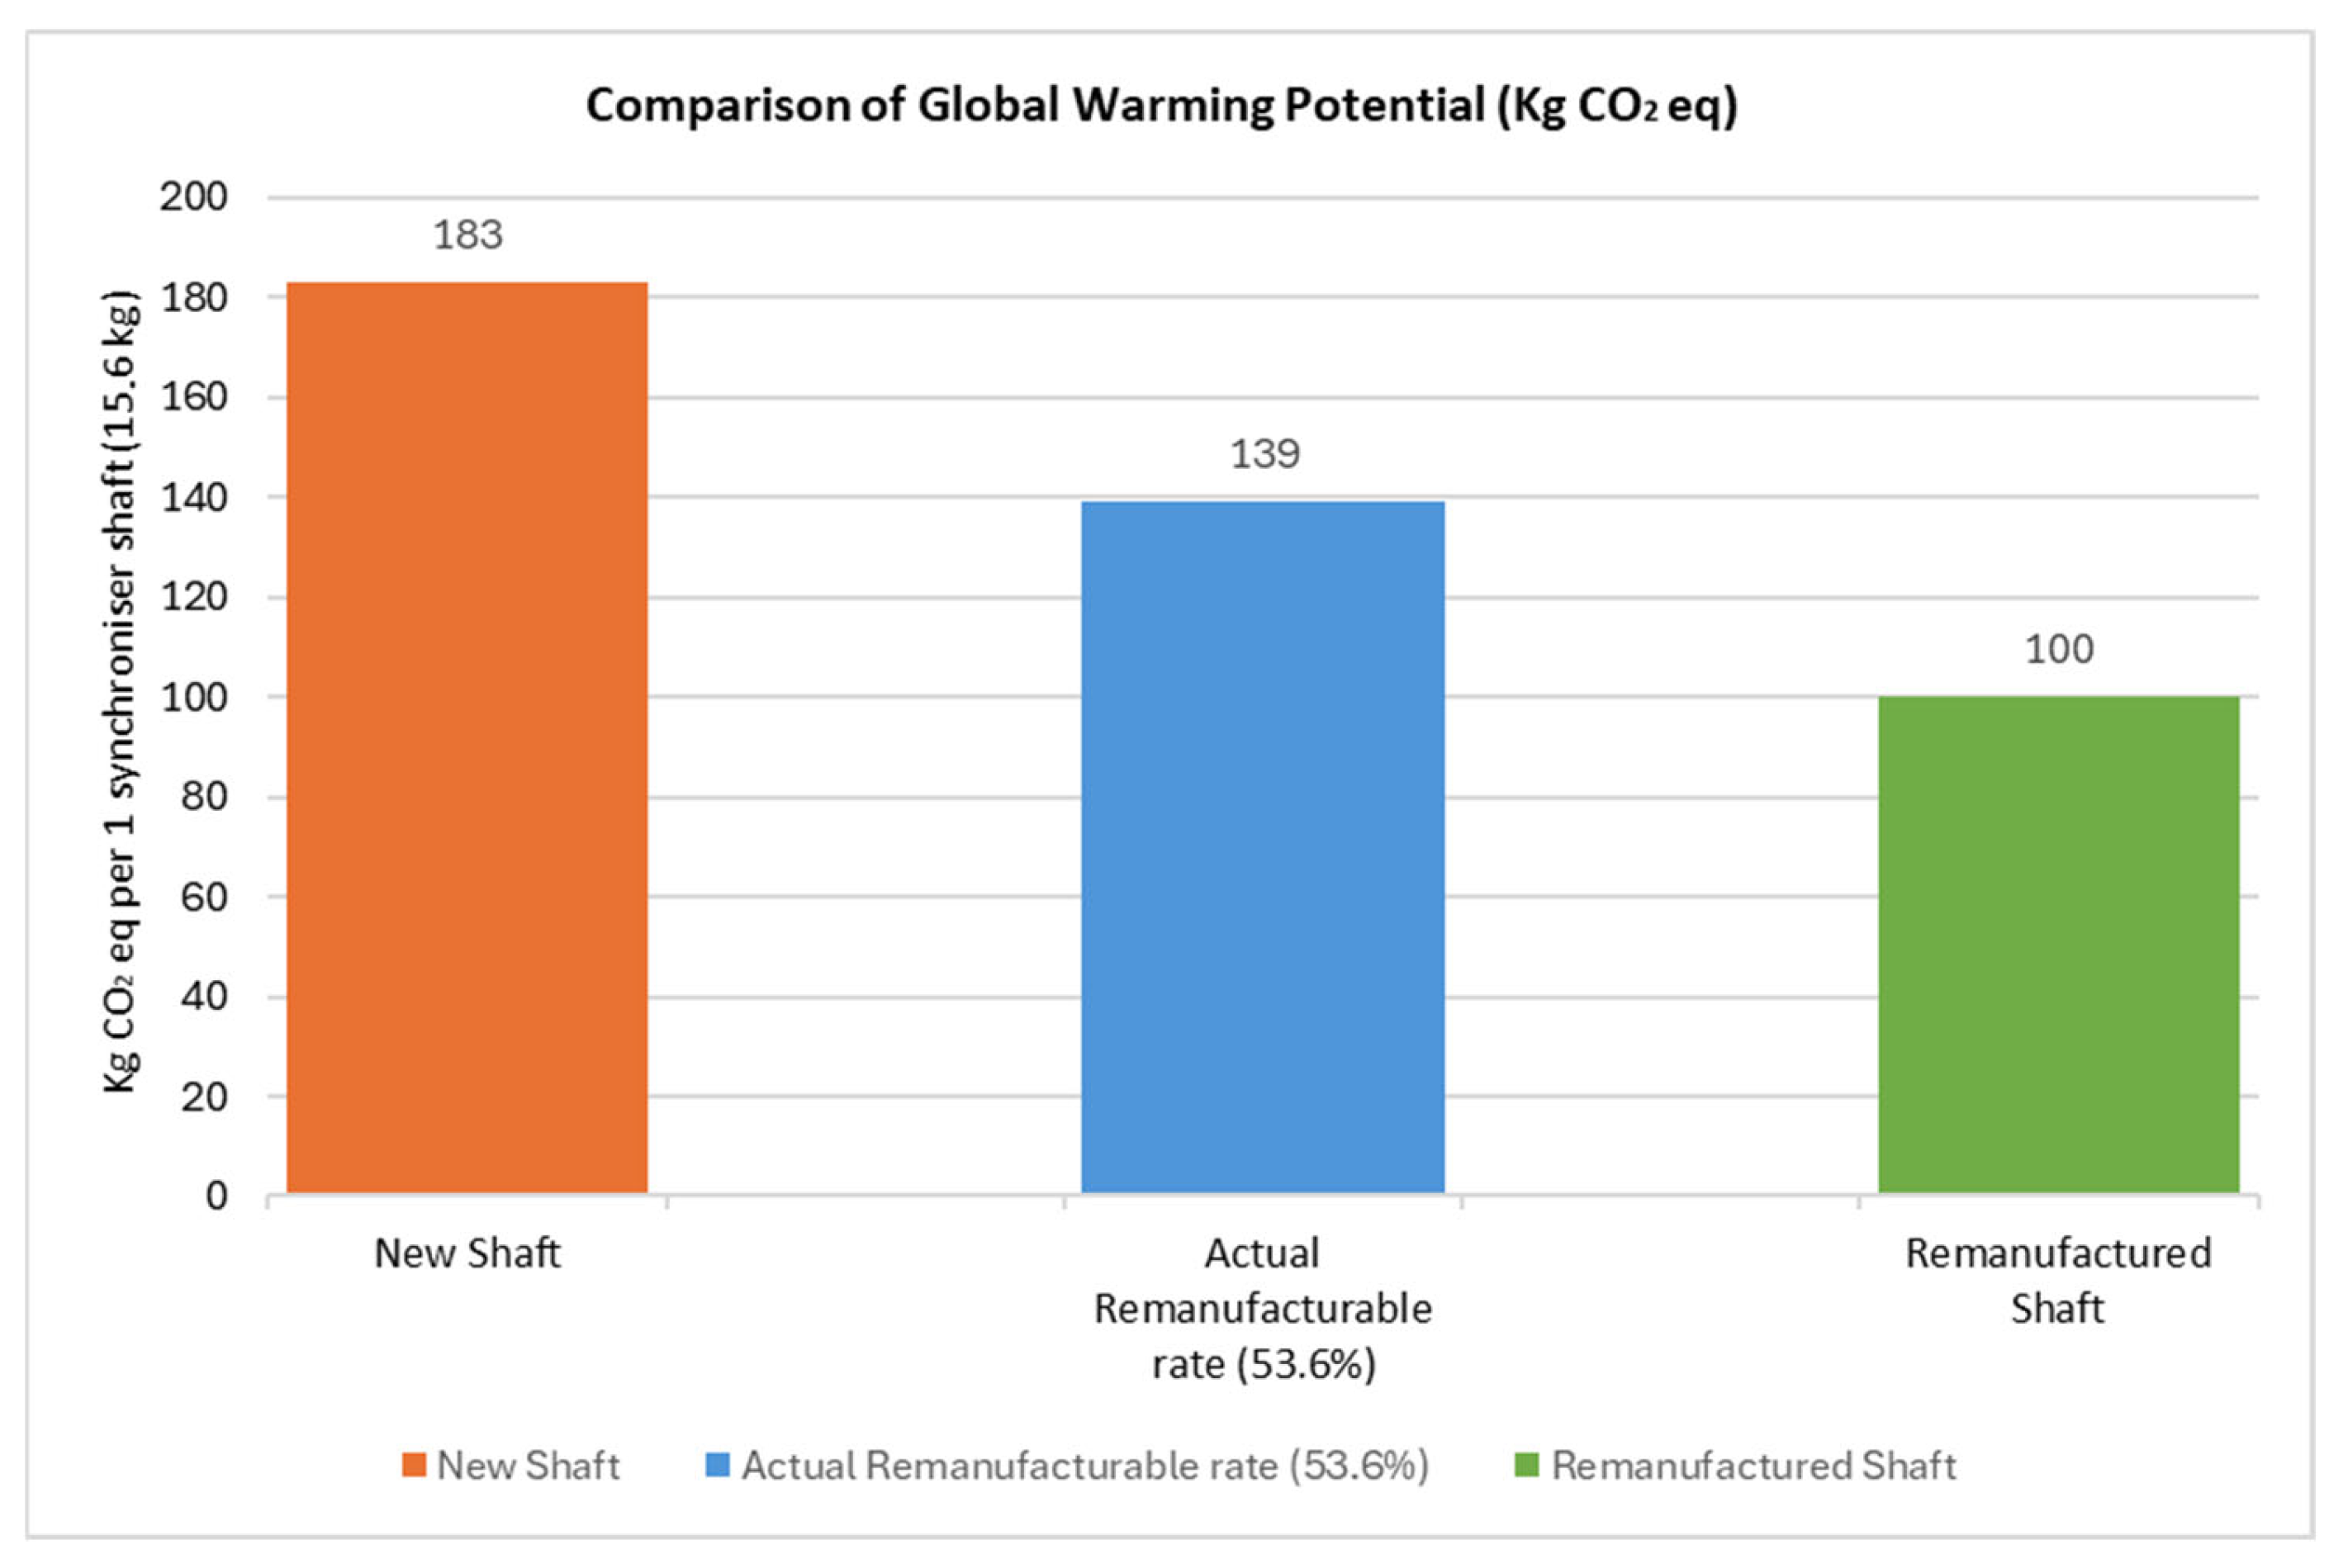
- Phase 2: Average shaft with actual remanufacturable rate (53.6%). This scenario is based on factory data from 153 remanufactured transmissions, 82 of which contained remanufactured shafts. The process is modelled as a weighted combination of new and reprocessed components.
- -
- Phase 3: Sensitivity analysis with increasing remanufacturability rates. Hypothetical scenarios (70%, 85%, and 100%) were simulated to assess the effect of improving the remanufacturable rate on the environmental impact.
- -
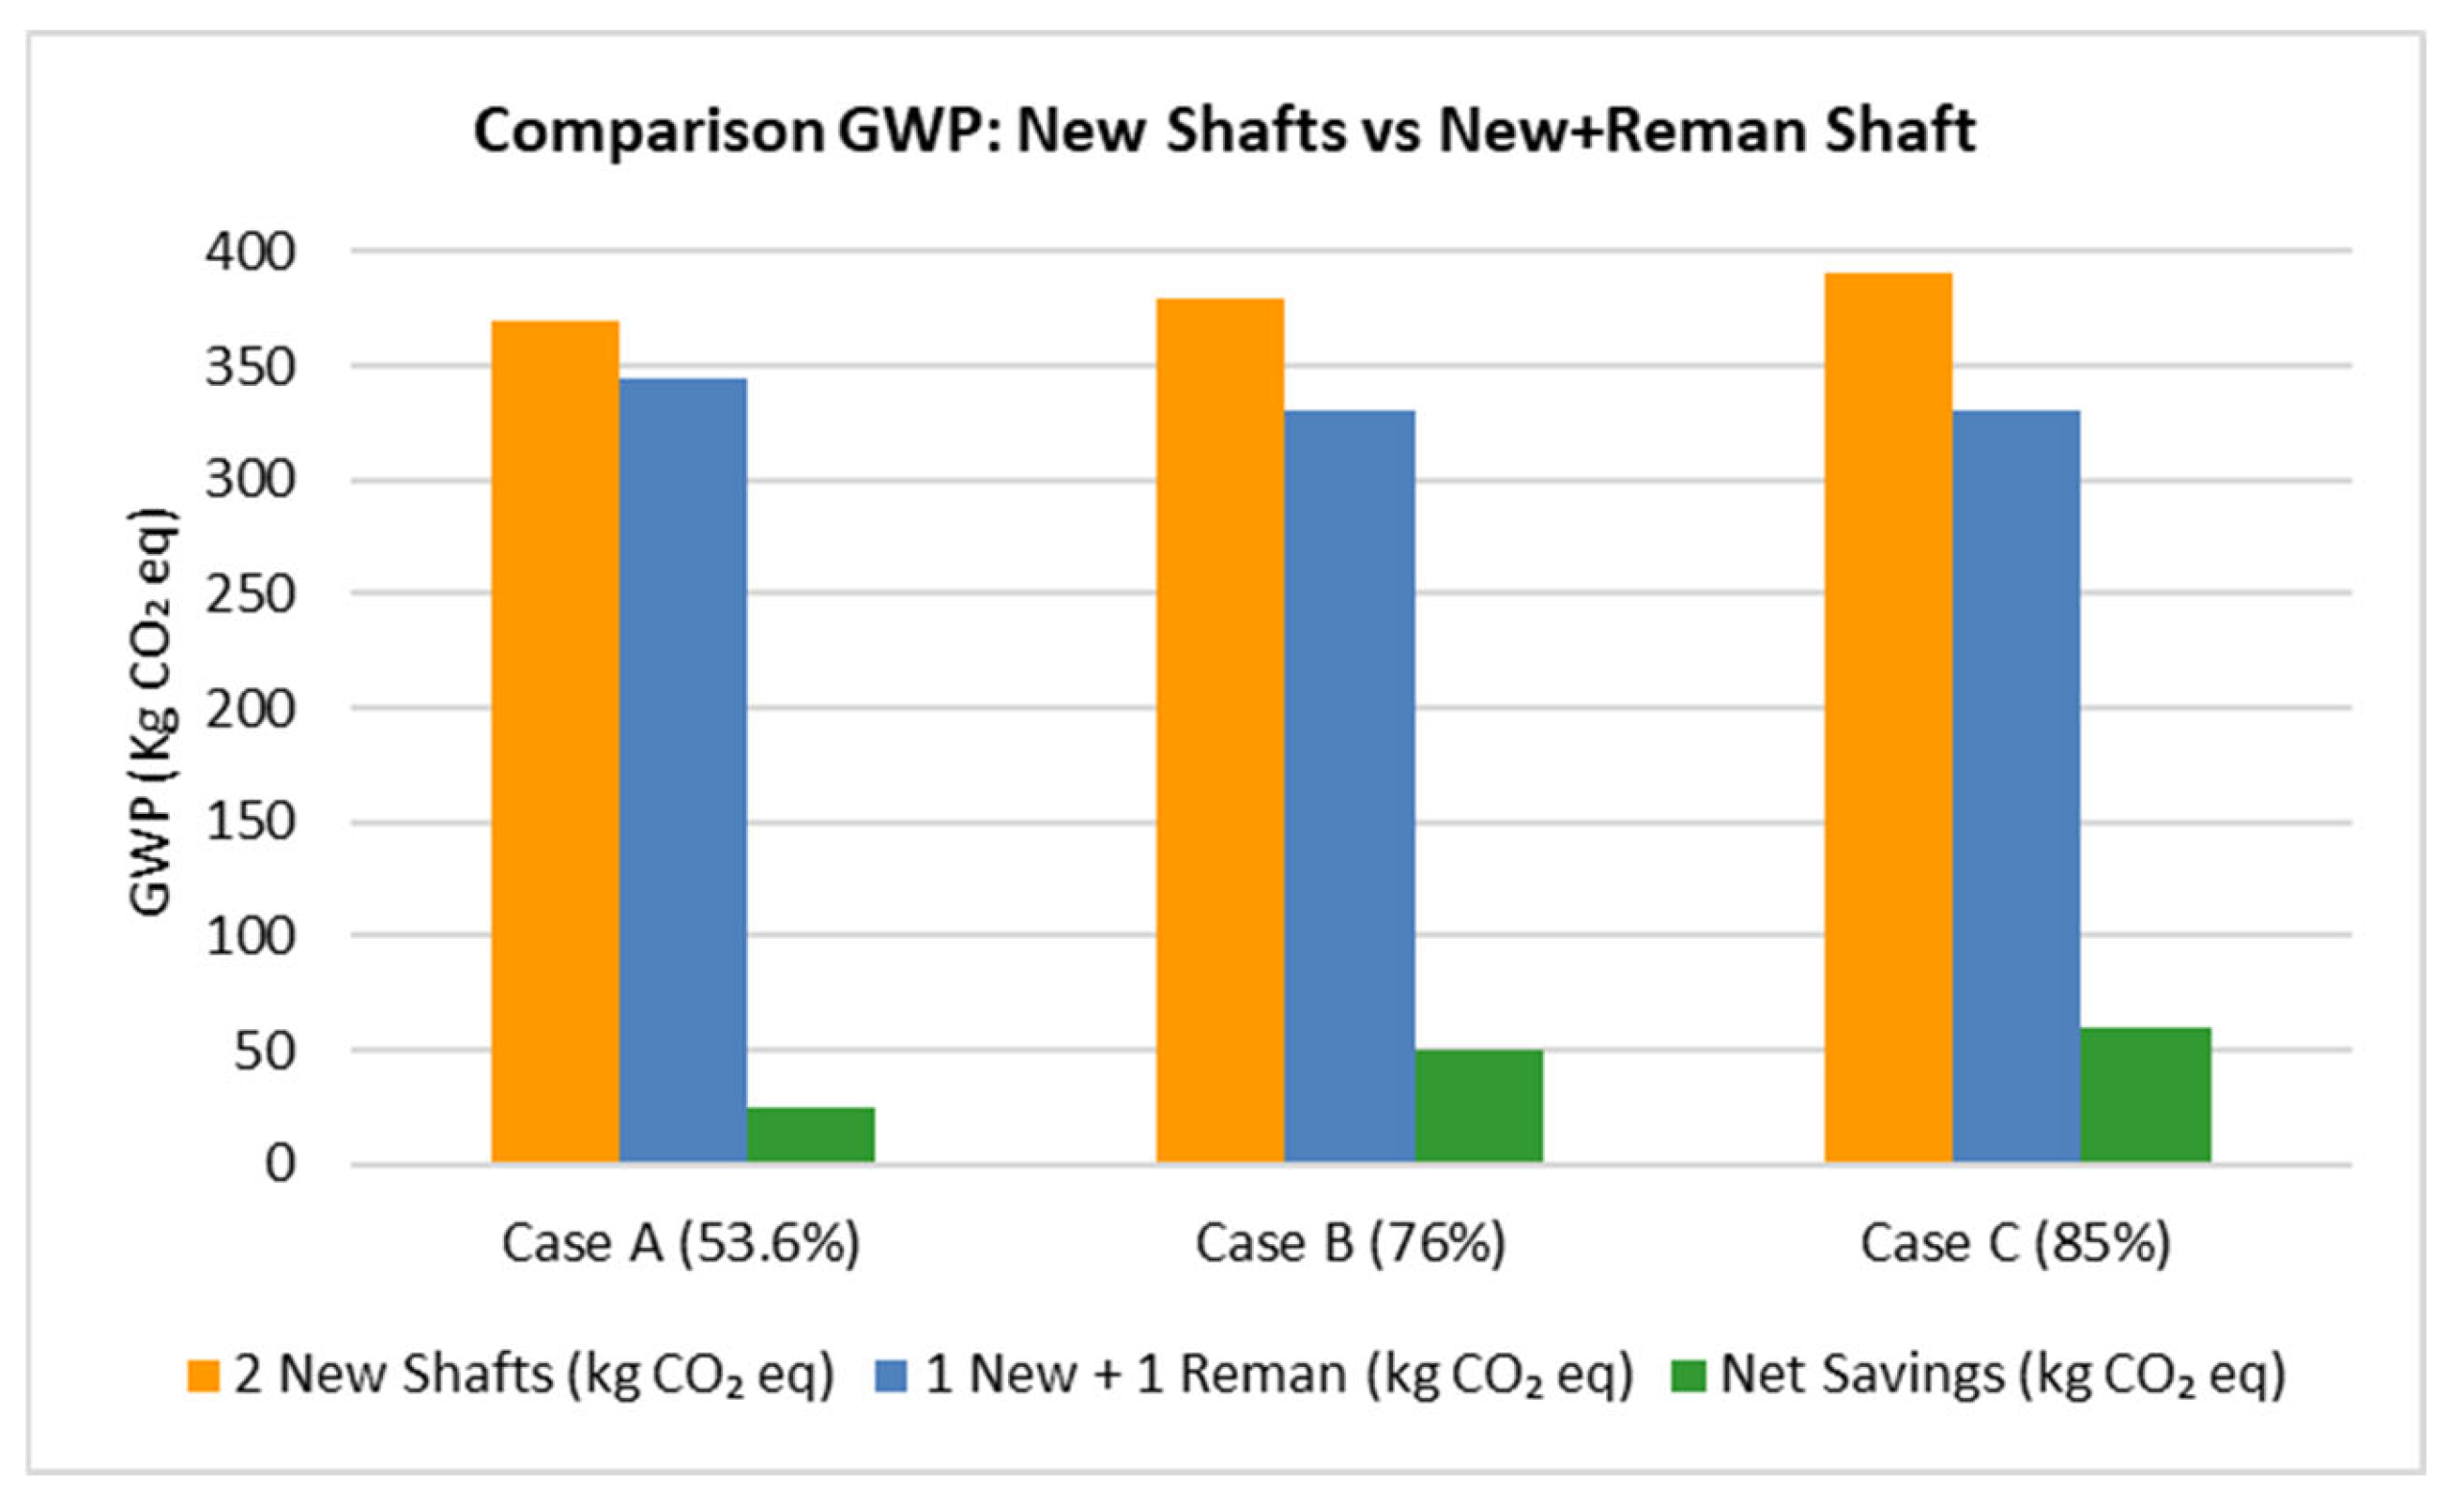
- Phase 1: Comparison between one cycle of remanufacturing + one new cycle versus two consecutive new production cycles.
- -
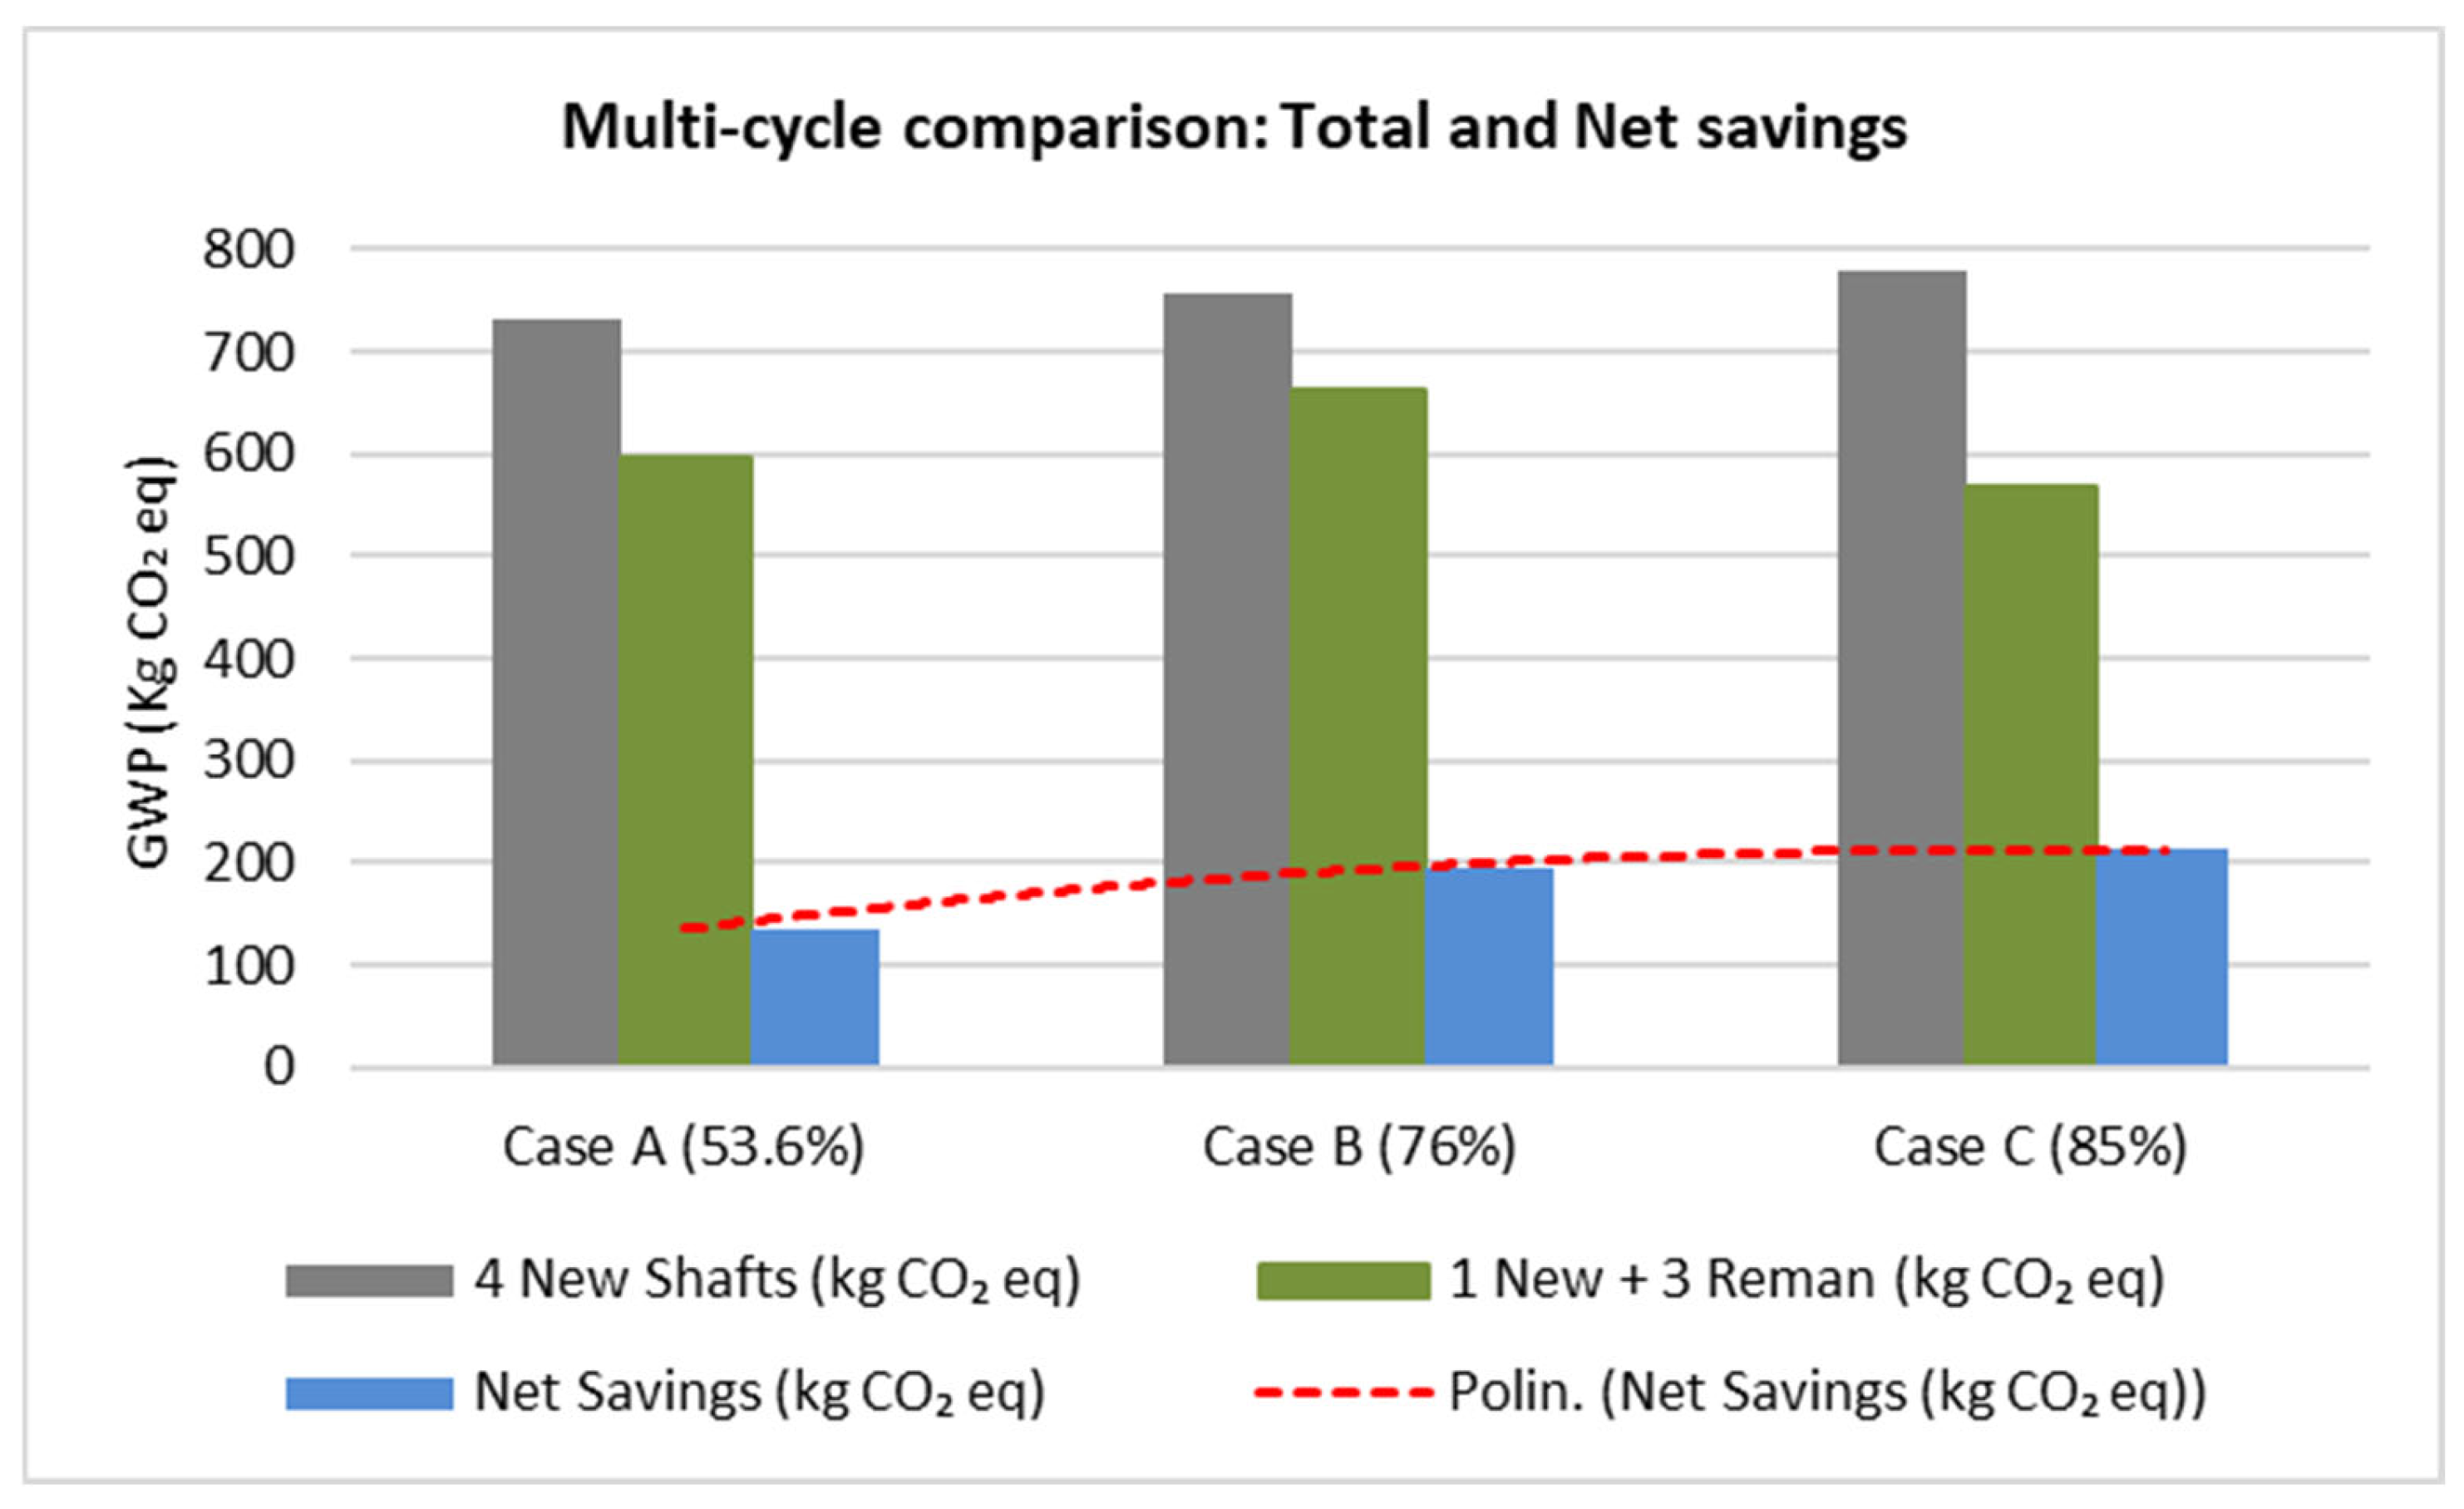
- Phase 2: An evaluation of a multi-cycle scenario, in which the shaft underwent three consecutive remanufacturing cycles after its initial production, for a total of four life cycles. This was compared against the baseline of four entirely new production cycles.
2.3. LCA Modelling
2.3.1. Functional Unit
2.3.2. System Boundaries
2.4. Life Cycle Inventory (LCI)
2.5. Design Strategy: DfRem
2.5.1. Empirical Data and Study Scenarios
2.5.2. Parametric LCA Evaluation Scenarios
- -
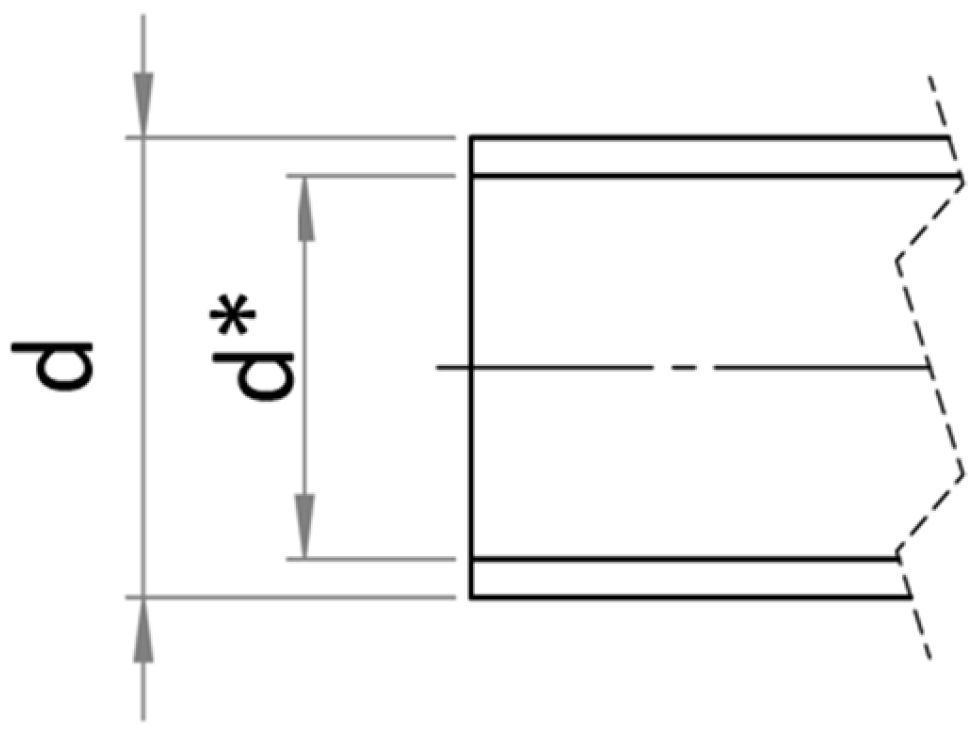
- S1: baseline shaft (Ø42 mm, +0% mass), 1 remanufacturing cycle, remanufacturable rate = 53.6%;
- -
- S2: reinforced shaft (Ø43 mm, +1.66% mass), 1 cycle, remanufacturable rate = 76%;
- -
- S3: further reinforced shaft (Ø44 mm, +3.33% mass), 1 cycle, remanufacturable rate = 85%.
3. Results Analysis
3.1. First Part
3.1.1. Phase 1: Comparison Between New and Remanufactured Shaft
3.1.2. Phase 2: Average Shaft with the Actual Remanufacturable Rate of 53.6%
- Production of a new shaft using virgin raw materials.
- Complete remanufacturing of the shaft.
- An intermediate, real-world scenario in which only 53.6% of shafts are remanufactured, while the remaining 46.4% are replaced with newly produced components.
3.1.3. Phase 3: Sensitivity Analysis with Increasing Remanufacturable Rates (70%, 85%, 100%)
3.2. Second Part
- -
- Material removal, which reduces both the diameter and the residual mass;
- -
- An increasing risk of failing non-destructive testing (NDT);
- -
- A potential loss of compliance with the dimensional tolerances required for proper machine function.
- -
- = success rate at the remanufacturing cycle;
- -
- = initial success rate at the first cycle (baseline industrial value);
- -
- = decay factor (<1) expressing the fractional reduction in success rate per cycle;
- -
- = cycle index .
- -
- Documented reductions in recovery rates for rotating mechanical components across reuse cycles in industrial practice, driven by dimensional loss, surface degradation, and fatigue life exhaustion.
- -
- Process constraints associated with the minimum allowable shaft diameter after re-machining and critical fatigue strength thresholds required to ensure compliance with mechanical safety margins.
- -
- Alignment with degradation trends reported for remanufactured automotive and off-highway machine components, where rejection rates typically increase between 10 and 25% per cycle due to cumulative damage and inspection screening.
- -
- is the environmental impact of manufacturing a new shaft;
- -
- is the impact of remanufacturing one shaft;
- -
- is the remanufacturing success rate at cycle ;
- -
- represents the fraction of components that cannot be remanufactured at cycle and must therefore be replaced with new units.
4. LCC Analysis
4.1. Input Data and Economic Assumptions
- -
- Energy consumption (kWh) or mass of material removed (kg).
- -
- Processing time (hours or minutes).
- -
- Process description.
- -
- Energy: Energy consumption is directly derived from measurement data where available. In the absence of direct measurements, it is estimated using the removed material mass multiplied by a specific cutting energy of 2.5 MJ/kg (equivalent to 0.694 kWh/kg) and divided by machine efficiency, assumed at 75%.
- -
- Tooling: Tooling costs are estimated at EUR 2.00/kg of material removed; in general, tooling accounts for approximately 3% of the total manufacturing cost.
- -
- Waste disposal: Represents the cost of managing chips or residues, set at EUR 0.10/kg, consistent with average fees charged by recycling operators, including transportation costs.
- -
- Scrap revenue: A revenue of EUR 0.20/kg is assigned to steel chips. Although 2024 European scrap metal prices ranged between EUR 0.295/kg and EUR 0.345/kg, a conservative value was chosen to account for potential contamination or additional processing costs.
- -
- New material: For the “Replacement parts” phase, the cost of steel is set at EUR 0.80/kg. This value is higher than the average price of hot-rolled coil steel in Italy (approximately EUR 0.55–EUR 0.59/kg in 2024) to reflect the use of alloyed and heat-treated steels.
- -
- Labour: For the final assembly, a specialised operator in the automotive sector is assumed, with an average company labour cost of EUR 42/h. Eurostat data show that in 2024, the European average industrial labour cost was EUR 33.5/h, with comparable figures reported for the Italian manufacturing sector.
- -
- Electricity: The electricity rate is set at EUR 0.25/kWh, aligned with the industrial consumer prices in the Eurozone. According to Eurostat, in the second half of 2024, non-domestic electricity prices ranged from EUR 0.0767/kWh (Finland) to EUR 0.2578/kWh (Cyprus).
- -
- Overhead costs: A 15% overhead rate is applied to direct costs to cover general expenses such as administration, logistics, and non-attributable maintenance. The managerial literature typically suggests overhead percentages between 10 and 20% of total production value.
- -
- CAPEX: Capital expenditure (machine depreciation) was not included in the current calculations, as the analysed operations represent only a small fraction of total equipment usage. However, the model allows for the introduction of an hourly capital cost if desired, by allocating a machine value across the number of processed parts.
4.2. Life Cycle Costing Inventory (LCCI)
Results
5. Conclusions and Future Developments
Author Contributions
Funding
Institutional Review Board Statement
Informed Consent Statement
Data Availability Statement
Conflicts of Interest
Abbreviations
| EU | European Union |
| JRC | Joint Research Centre |
| CVT | Continuously Variable Transmission |
| LCA | Life Cycle Assessment |
| LCC | Life Cycle Costing |
| LCSA | Life Cycle Sustainability Assessment |
| DfRem | Design for Remanufacturing |
| MR | Machinery Regulation |
| MD | Machinery Directive |
| EHSR | Essential Health and Safety Requirements |
| ERN | European Remanufacturing Network |
| EOL | End of Life |
| BS | British Standard |
| DIN | Deutsche Industrie Norm |
| ISO | International Standard Organization |
| p/n | Part number |
| RER | Europe |
| RoW | Rest of World |
| GLO | Global |
| mPt | millipoints |
References
- Regulation (Eu) 2024/1781 of the European Parliament and of the Council; Office of the European Union: Luxembourg, 2024.
- ISO 14040:2006; Environmental Management—Life Cycle Assessment—Principles and Framework. The International Organization for Standardization: Geneva, Switzerland, 2006.
- ISO 14044:2006; Environmental Management—Life Cycle Assessment—Requirements and Guidelines. The International Organization for Standardization: Geneva, Switzerland, 2006.
- Beneduce, S.; Felaco, A.; Munno, M.; Caputo, F. Tools and Methods for Designing Mechanical Components for Multiple Remanufacturing Cycles in Agricultural Machinery, Advances in Remanufacturing; IWAR 2023. Lecture Notes in Mechanical Engineering; Springer: Cham, Switzerland, 2024; pp. 435–447. [Google Scholar]
- Mann, A.; Saxena, P.; Almanei, M.; Okorie, O.; Salonitis, K. Environmental Impact Assessment of Different Strategies for the Remanufacturing of User Electronics. Energies 2022, 15, 2376. [Google Scholar] [CrossRef]
- Anand, K.; Ryan-Fogarty, Y.; Fitzpatrick, C. Life cycle assessment (LCA) of remanufactured electrical and electronic products. In Proceedings of the 6th Product Lifetimes and the Environment Conference (PLATE2025), Aalborg, Denmark, 2–4 July 2025. [Google Scholar]
- Beneduce, S.; Vita, L.; Cantone, L.; Caputo, F. Machinery Regulation and Remanufacturing: A Link Between Machinery Safety and Sustainability. Machines 2024, 12, 941. [Google Scholar] [CrossRef]
- Gluch, P.; Baumann, H. The life cycle costing (LCC) approach: A conceptual discussion of its usefulness for environmental decision-making. Build Environ. 2004, 39, 571–580. [Google Scholar] [CrossRef]
- Woodward, D.G. Life cycle costing—Theory, information acquisition and application. Int. J. Proj. Manag. 1997, 15, 335–344. [Google Scholar] [CrossRef]
- Hunkeler, D.; Lichtenvort, K.; Rebitzer, G. Environmental Life Cycle Costing; CRC Press: Boca Raton, FL, USA, 2008; p. 232. [Google Scholar]
- Swarr, T.E.; Hunkeler, D.; Klöpffer, W.; Pesonen, H.-L.; Ciroth, A.; Brent, A.C.; Pagan, R. Environmental life-cycle costing: A code of practice. Int. J. Life Cycle Assess 2011, 16, 389–391. [Google Scholar] [CrossRef]
- Shi, J.; Pan, Y.; Yu, Z.; Song, X. Multidimensional remanufacturability assessment method for used products based on LCSA. Int. J. Life Cycle Assess 2024, 29, 1779–1798. [Google Scholar] [CrossRef]
- Gabhane, P.; Kaddoura, M. Remanufacturing in Circular Economy: A Gearbox Example A Comparative Life Cycle and Cost Assessment. Environ. Sci. 2017, 2017. Available online: https://publications.lib.chalmers.se/records/fulltext/252053/252053.pdf (accessed on 17 November 2025).
- Wang, X.; Zhu, Y.; Sun, H.; Jia, F. Crashworthiness analysis and multi-objective optimization of a commercial vehicle frame: A mixed meta-modeling-based method. J. Clean Prod. 2018, 171, 1225–1243. [Google Scholar] [CrossRef]
- Sutherland, J.W.; Adler, D.P.; Haapala, K.R.; Kumar, V. A comparison of manufacturing and remanufacturing energy intensities with application to diesel engine production. CIRP Ann. 2008, 57, 5–8. [Google Scholar] [CrossRef]
- Li, M.; Nemani, V.P.; Liu, J.; Lee, M.A.; Ahmed, N.; Kremer, G.E.; Hu, C. Reliability-Informed Life Cycle Warranty Cost and Life Cycle Analysis of Newly Manufactured and Remanufactured Units. J. Mech. Des. 2021, 143, 112001. [Google Scholar] [CrossRef]
- Peters, K.J. Methodological issues in life cycle assessment for remanufactured products: A critical review of existing studies and an illustrative case study. Clean Prod. 2016, 126, 21–37. [Google Scholar] [CrossRef]
- Lee, J.-H.; Kang, H.-Y.; Kim, Y.-W.; Hwang, Y.W.; Kwon, S.-G.; Park, H.-W.; Choi, J.-W.; Choi, H.-H. Life Cycle Greenhouse Gas Reduction Effects Induced by Turbocharger Multiple Remanufacturing in South Korea. J. Remanuf. 2023, 13, 187–206. [Google Scholar] [CrossRef]
- Yang, S.S.; Ong, S.K.; Nee, A.Y.C. A Decision Support Tool for Product Design for Remanufacturing. Procedia CIRP 2016, 40, 144–149. [Google Scholar] [CrossRef]
- Behtash, M.; Liu, X.; Davied, M.; Thompson, T.; Burjes, R.; Lee, M.; Wang, P.; Hu, C. Reman Co-Design: A Combined Design and Remanufacturing Optimization Framework for the Sustainable Design of High-Value Components. J. Mech. Des. 2024, 146, 020901. [Google Scholar] [CrossRef]
- ISO 15686-5; Buildings and Constructed Assets—Service Life Planning Part 5: Life-Cycle Costing. The International Organization for Standardization: Geneva, Switzerland, 2017.

| Transmission Data CVT | |
|---|---|
| Evaluation period | 2019–2023 |
| Production of new parts | 12,750 |
| Remanufacturing data monitored from 2019 to 2023 | 153 |
| Weight [kg] | 697.0 |
| Intensity compared to total production [%] | 1.2 |
| Intensity compared to spare parts sales [%] | 88 |
| Remanufactured cost/New cost [%] | 86 |
| Material | Hardening Steel |
|---|---|
| Synchroniser shaft mass | 15.7 kg |
| Remanufacturing data monitored from 2019 to 2023 | 82 |
| Process Phase | Included in “New” LCI | Included in “Remanufacturing” LCI |
|---|---|---|
| Raw material | Steel production, low-alloyed | Not included |
| Forming | Included | Not required |
|
Machining/
re-machining | Rough + finish turning | Grinding/re-machining |
| Heat and Surface treatment | Carburising, quenching and tempering | Heat treatment for functional restoration |
| Cleaning and inspection | NDT | Cleaning + NDT |
| Assembly | Included | Included |
| Transport | Transport, lorry, EURO 6 | Transport, lorry, EURO 6 |
| End-of-life treatment | Recycling (95%)/landfill disposal (5%) | Recycling (95%)/landfill disposal (5%) |
| Process parameters | - | -Material removal: 0.20 mm per side; -Magnetic Particle Inspection + Ultrasonic Testing ≥ 0.2 mm; -stress-relief 180–220 °C, 2 h; -run-out(maximum permissible misalignment) ≤0.03 mm |
| Data source | Ecoinvent 3.10 (EU/Global) | Company—specific data + Ecoinvent 3.10 (EU/Global) |
| Scenario | % Remanufacturable Rate | Total Mass (kg) | Mass Allocated to New Production (kg) |
Mass Allocated to Remanufacturing
(kg) |
|---|---|---|---|---|
| S1 | 53.6% | 1570 | 7285 | 8415 |
| S2 | 76% | 1623 | 3895 | 12,335 |
| S3 | 85% | 1676 | 2514 | 14,246 |
| Scenario | % Remanufacturable Rate | % New | Global Warming (kg CO2 eq) | % Reduction |
|---|---|---|---|---|
| Actual case (53%) | 53.6% | 46.4% | 139 | 24% |
| Improved case 70% | 70% | 30% | 125 | 31% |
| Improved case 85% | 85% | 15% | 113 | 38% |
| Optimal case 100% (theoretical) | 100% | 0% | 100 | 45% |
| Case | GWP New |
GWP
of the Reman Component | % Remanufacturable Rate |
Weighted GWP Tot
(New + Reman) | GWP (2 New) (kg) |
Reduction (kg) |
|---|---|---|---|---|---|---|
| A (d = 42 mm) | 183 | 139 | 53.6% | 342.4 | 366 | 23.6 |
| B (d = 43 mm) | 189 | 124 | 76% | 328.6 | 378 | 49.4 |
| C (d = 44 mm) | 195 | 124 | 85% | 329.7 | 390 | 60.3 |
| Case | GWP New | GWP Reman |
Initial Remanufacturable
Rate (%) | GWP Tot (1 New + 3 Reman) | GWP 4 New | Reduction |
|---|---|---|---|---|---|---|
| A | 183 | 139 | 53.6% | 596.28 | 732 | 135.72 |
| B | 189 | 124 | 76.0% | 562.33 | 756 | 193.67 |
| C | 195 | 124 | 85.0% | 567.08 | 780 | 212.92 |
| Phase | Brief Description | Main Data Type | Value |
|---|---|---|---|
| Cleaning and sandblasting | Removal of surface contaminants by wheel blasting | Electricity consumed | 2.0 kWh |
| NDT checks | Magnetic and ultrasonic inspections to detect defects | Electricity consumed | 0.5 kWh |
| Final grinding | Removal of worn layer by grinding | Mass removed | 0.7 kg |
| Heat treatments | Controlled heating and cooling to restore microstructure | Electricity consumed | 20.0 kWh |
| Replaced parts | Replacement of irreparable material sections | Mass replaced | 0.3 kg |
| Final assembly | Reassembly and functional testing of reconditioned component | Labour time | 3 h |
| Phase | Quantity | Energy (kWh) | Direct Cost (EUR) | Overhead (EUR) | Total Cost (EUR) |
|---|---|---|---|---|---|
| Cleaning and sandblasting | 2.0 kWh | 2.000 | 0.500 | 0.075 | 0.575 |
| NDT checks | 0.5 kWh | 0.500 | 0.125 | 0.019 | 0.144 |
| Final grinding | 0.7 kg | 0.648 | 1.492 | 0.224 | 1.716 |
| Heat treatments | 20.0 kWh | 20,000 | 5.000 | 0.750 | 5.750 |
| Replaced parts | 0.3 kg | – | 0.240 | 0.036 | 0.276 |
| Final assembly | 3 h | – | 114,000 | 17,100 | 131,100 |
| Total | 23,148 | 121,357 | 18,204 | 139,561 |
Disclaimer/Publisher’s Note: The statements, opinions and data contained in all publications are solely those of the individual author(s) and contributor(s) and not of MDPI and/or the editor(s). MDPI and/or the editor(s) disclaim responsibility for any injury to people or property resulting from any ideas, methods, instructions or products referred to in the content. |
© 2025 by the authors. Licensee MDPI, Basel, Switzerland. This article is an open access article distributed under the terms and conditions of the Creative Commons Attribution (CC BY) license (https://creativecommons.org/licenses/by/4.0/).
Share and Cite
Felaco, A.; Vita, L.; Cantone, L.; Caputo, F.; Beneduce, S. Remanufacturing and LCA: A Synergistic Approach Combining Structural Reliability, Sustainability, and Life Multi-Cycle Improvement. Appl. Sci. 2025, 15, 12517. https://doi.org/10.3390/app152312517
Felaco A, Vita L, Cantone L, Caputo F, Beneduce S. Remanufacturing and LCA: A Synergistic Approach Combining Structural Reliability, Sustainability, and Life Multi-Cycle Improvement. Applied Sciences. 2025; 15(23):12517. https://doi.org/10.3390/app152312517
Chicago/Turabian StyleFelaco, Amelia, Leonardo Vita, Luciano Cantone, Francesco Caputo, and Stefano Beneduce. 2025. "Remanufacturing and LCA: A Synergistic Approach Combining Structural Reliability, Sustainability, and Life Multi-Cycle Improvement" Applied Sciences 15, no. 23: 12517. https://doi.org/10.3390/app152312517
APA StyleFelaco, A., Vita, L., Cantone, L., Caputo, F., & Beneduce, S. (2025). Remanufacturing and LCA: A Synergistic Approach Combining Structural Reliability, Sustainability, and Life Multi-Cycle Improvement. Applied Sciences, 15(23), 12517. https://doi.org/10.3390/app152312517


