Article

Research on Power Battery Recycling Decision Considering Deposit System Under Online Platform Recycling Mode

School of Business, Jiangnan University, Wuxi 214122, China
*
Author to whom correspondence should be addressed.
Appl. Sci. 2025, 15(23), 12514; https://doi.org/10.3390/app152312514
Submission received: 17 October 2025 / Revised: 19 November 2025 / Accepted: 23 November 2025 / Published: 25 November 2025
(This article belongs to the Section Green Sustainable Science and Technology)

Featured Application

This study provides a comprehensive solution for the power battery recycling industry, incorporating a deposit system, blockchain technology, and supply chain structure.

Abstract

To promote the effective recycling of power batteries and solve the industry dilemma of “missing used batteries”, the deposit system and blockchain technology are regarded as important policy and technical tools. This paper constructs a power battery closed-loop supply chain composed of a battery manufacturer and an online platform, considering two power structures of platforms with and without pricing power, respectively. This study employs Stackelberg game theory, and through modeling and optimization analysis, the optimal pricing, blockchain investment level, and profit of the supply chain under different deposit collectors are explored. The results discuss the following: (1) whether the online platform maintaining the right to recover pricing fundamentally changes the incentive mechanism and efficiency level of the supply chain. When the platform holds the pricing power, its blockchain technology investment level and profit potential are significantly higher than that of its agent model. (2) Deposit as a different attribute of cost or income determines the different pricing logic of enterprises. (3) To maximize the application of innovative technologies such as blockchain in recycling systems, governments, manufacturers, and platforms should strive to promote the application of government–manufacturers deposits modes.

1. Introduction

Driven by the “double carbon” strategic goal, the new energy automobile industry has risen to a strategic pillar industry that China has been focusing on cultivating; it also represents the mainstream direction of the global automobile industry transformation. Therefore, the global electric vehicle market has experienced explosive growth in recent years [1]. While the usage of power batteries has surged rapidly, the increased consumption of batteries leads to irreversible pollution in the natural environment [2] and results in unnecessary waste [3]. Consequently, battery management has become critically important. Effective management not only holds significant implications for public safety [4], but also extends battery lifespan [5]. This, in turn, reduces environmental waste. Furthermore, since retired power batteries are rich in strategic metals such as nickel, cobalt, and lithium, recycling them alleviates shortages of critical metals and generates substantial circular economy benefits [6]. Given their resource value and ecological sensitivity, power battery recycling has transcended mere corporate economic concerns. It has evolved into a critical issue that requires government oversight, industry collaboration, and societal governance. Consequently, power battery recycling is not merely a corporate concern but has also drawn widespread attention from governments and the public [7].
However, although the development potential of the battery recycling industry is huge, it still faces severe challenges in the actual promotion process at present. First, the power battery recycling system is imperfect, the national recycling network has not been established, the coverage rate of formal recycling channels is low, and most recycling parties are still offline recycling, lacking convenience [8], and consumers lack enthusiasm for recycling, resulting in many retired batteries flowing into the informal market. However, the existing literature has demonstrated sufficient diversity of recycling models; for example, many power battery manufacturers have chosen online recycling platforms (such as Kuai Dian power, Tai Li Cloud, Tian Neng Recycling Cloud, etc.) and cooperate with each other to recycle and remanufacture waste power batteries [9], but there is still a lack of mainstream online platforms with strong recycling capabilities. Secondly, the recycling cost is higher than the recycling income, the enterprise profitability is difficult to predict, and the market operation ability is weak. Manufacturers, as the main force of cost recycling, need to invest in technologies that rely on a large amount of capital support, such as battery disassembly and resource utilization after decommissioning power batteries. At present, governments of various countries are widely implementing deposit policies to guide enterprises to effectively carry out recycling actions. Various manufacturers are also making full use of deposit systems to encourage consumers to recycle. For example, battery manufacturers such as Ning DE Times use deposit returns to encourage sales organizations to recycle retired power batteries [10], but data gaps frequently occur, and the battery life cycle traceability system is imperfect [11]. This will not only make the retired battery information chain incomplete, affecting the implementation of the deposit system; but at the same time, the lack of data will lead to insufficient trust from consumers, further affecting the quantity, difficulty, and profits of recycling stakeholders.
Given the above research context, numerous scholars have examined the issue of power battery recycling from multiple perspectives. For instance, closed-loop supply chains based on online platforms for recycling have been discussed by scholars [12], yet this recycling model still requires full integration with the unique attributes of power battery recycling. Whether involving straightforward recycling activities or subsequent battery repurposing and dismantling, the transparency and traceability inherent in blockchain technology remain essential. In discussions regarding online platform recycling methods for power battery recycling, there is a lack of articles addressing the attribution of pricing authority to online platforms. Furthermore, explorations of deposit system implementation models remain incomplete [13], with the vast majority focusing solely on policy incentives [14] while neglecting discussions on market-driven incentives. These discussions also overlook the practical challenges of implementing deposit systems and what role the potential assistance blockchain technology could offer in their application. Thus, integrating deposit systems with blockchain technology holds significant potential in the power battery recycling sector. In discussions about the primary investors in blockchain technology, most articles focus on manufacturers as the investors [15]. However, manufacturers face excessive technical investment burdens and pressures throughout the entire battery recycling process, requiring significant effort not only in battery development but also during the end-of-life phase. Therefore, this paper innovatively proposes a battery recycling solution driven by an integrated online platform that unifies sales and recycling functions. This solution combines diversified deposit systems with blockchain technology investments to stimulate recycling activities.
Against this backdrop, this paper aims to address the following issues:
(1)
How does the ownership of recycling pricing right reshape the effect of deposit systems, and then affect the overall efficiency of the supply chain?
(2)
Which deposit collection mode can achieve the optimal recycling and technology investment effect with minimum social cost?
(3)
Given the policy and market environment, how should manufacturers and online platforms choose the combination model of “deposit + pricing power” to maximize their profits?
To address these challenges, this study first constructs a closed-loop supply chain comprising battery manufacturers, online platforms, and consumer markets. Using the Stackelberg game model, six scenarios are developed based on different deposit collection methods and recycling pricing authority. The strategic interactions among battery manufacturers, online platforms, and government regulators are analyzed. From the perspective of blockchain technology investment by online platforms, the aim is to promote the diversified integration of online platform recycling models and deposit systems across the entire industry.

2. Literature Review

The research closely related to this paper mainly involves the main body of power battery recycling channel, deposit system, and blockchain technology. In terms of the main body of power battery recycling channel, Gong et al. [16] conducted a systematic study on the optimization of power battery closed-loop supply chain recycling channels under the guidance of fund systems. By constructing a theoretical model, this study discussed the optimal selection mechanism of recycling channels under different system scenarios. Based on four mixed recycling models (retailers, third-party recyclers, and tiered enterprises under carbon quota system), Zhang et al. [17] studied the optimal recycling mode selection and carbon emission reduction decision-making process of the electric vehicle battery closed-loop supply chain. Wang et al. [18] constructed a three-party reverse supply chain model including remanufacturers, traditional recyclers, and intelligent recyclers. By analyzing three cooperation modes (cooperation with traditional recyclers, intelligent recyclers, and dual recyclers), Li et al. [19] studied the optimal recycling mode selection and supply chain coordination problems by comparing three dual-channel recycling modes (manufacturer–retailer, manufacturer–third party, retailer–third party) and their optimal pricing and recycling decisions. The results show that when the recycling market competition intensity and third-party economies of scale reach a certain threshold, the retailer–third party joint recycling model performs best.
Many scholars have studied the application of deposit systems in the closed-loop supply chain field. Wang et al. [20] showed that under the situation where the government implements a differentiated deposit system for manufacturers and recyclers, the synergy between manufacturer market competition and the deposit return system can significantly improve the recycling efficiency of the closed-loop supply chain. Liu et al. [21] studied the closed-loop supply chain equilibrium strategy under the dual supervision system of deposit return and minimum recycling rate implemented by the government based on the Stackelberg game model, and provided decision-making suggestions for the formulation of the government deposit system. Huang et al. [22] further analyzed the impact of government deposit collection on enterprise decision-making and profits. Huang et al. [23] studied and analyzed the impact of four deposit models on the closed-loop supply chain, and found that the government can increase the recycling rate by collecting deposits from manufacturers or recyclers, and the remanufacturers can increase their profits by collecting deposits. The deposit system has different effects on the original manufacturer’s selling price, but all of them reduce the remanufacturer’s selling price, which verifies its regulatory effect on supply chain.
Bravo et al. [24] revealed the key role of blockchain technology in improving product traceability and promoting sustainable practices, especially in the field of electric vehicle battery manufacturing and energy. Li et al. [25] developed an information anti-counterfeiting tracking system based on blockchain technology, which ensures data integrity by using its tamper-proof characteristics. Wei et al. [26] found through empirical research that blockchain technology can significantly improve supply chain information transparency, product full cycle traceability and collaborative efficiency, and the improvement of these key factors jointly enhances the overall resilience of the supply chain system. Research by Wang et al. [27] shows that the strategic application of blockchain technology in closed-loop supply chains (CLSCs) can achieve full product life cycle traceability. This mechanism not only helps improve recycling efficiency, but also accurately evaluates the residual value of products. Zhang et al. [28] analyzed the impact mechanism of blockchain technology 3 on risk-averse dual-channel supply chains by constructing three blockchain application scenario models. The study found that the blockchain adoption decision of supply chain members is mainly affected by the unit operating cost, direct selling cost, and market demand fluctuation. Li Jian et al. [29] demonstrated the value of blockchain technology in eliminating the quality doubts of remanufactured products. Wu et al. [30] quantitatively analyzed the impact of consumer traceability awareness on blockchain technology adoption threshold by constructing a game model.
To sum up, the relevant research on recycling modes in a closed-loop supply chain mainly focuses on single channel and mixed channel processes, and the recycling main body also focuses on manufacturer recycling, dealer or third-party entrusted recycling, and there is little research on online platform recycling. Moreover, the existing research mainly focuses on entrusted recycling, and the discussion on platform agent recycling mode is insufficient. Especially in terms of power battery recycling, the research on the segmentation mode of online recycling platforms is very insufficient. In addition, the application of deposit return mechanisms in the field of electric vehicle battery recycling has been proven to be a feasible system choice, which can significantly improve the recycling efficiency of batteries, but there have been studies considering the mode of action of the system focusing on collecting deposits from manufacturers by the government and collecting deposits from recyclers by the government. A few articles discuss the mode of collecting deposits from consumers by remanufacturers. At present, the discussion of the available mode of this system is still insufficient. Finally, there is existing literature about blockchain technology investment and its impact, but most of the current articles regard the investment subject as the product manufacturer, and the discussion of the investment subject of blockchain technology still needs to be explored. Therefore, this paper aims to bridge the gap with previous studies by analyzing six models, as shown in Table 1.

3. Problem Description and Assumptions

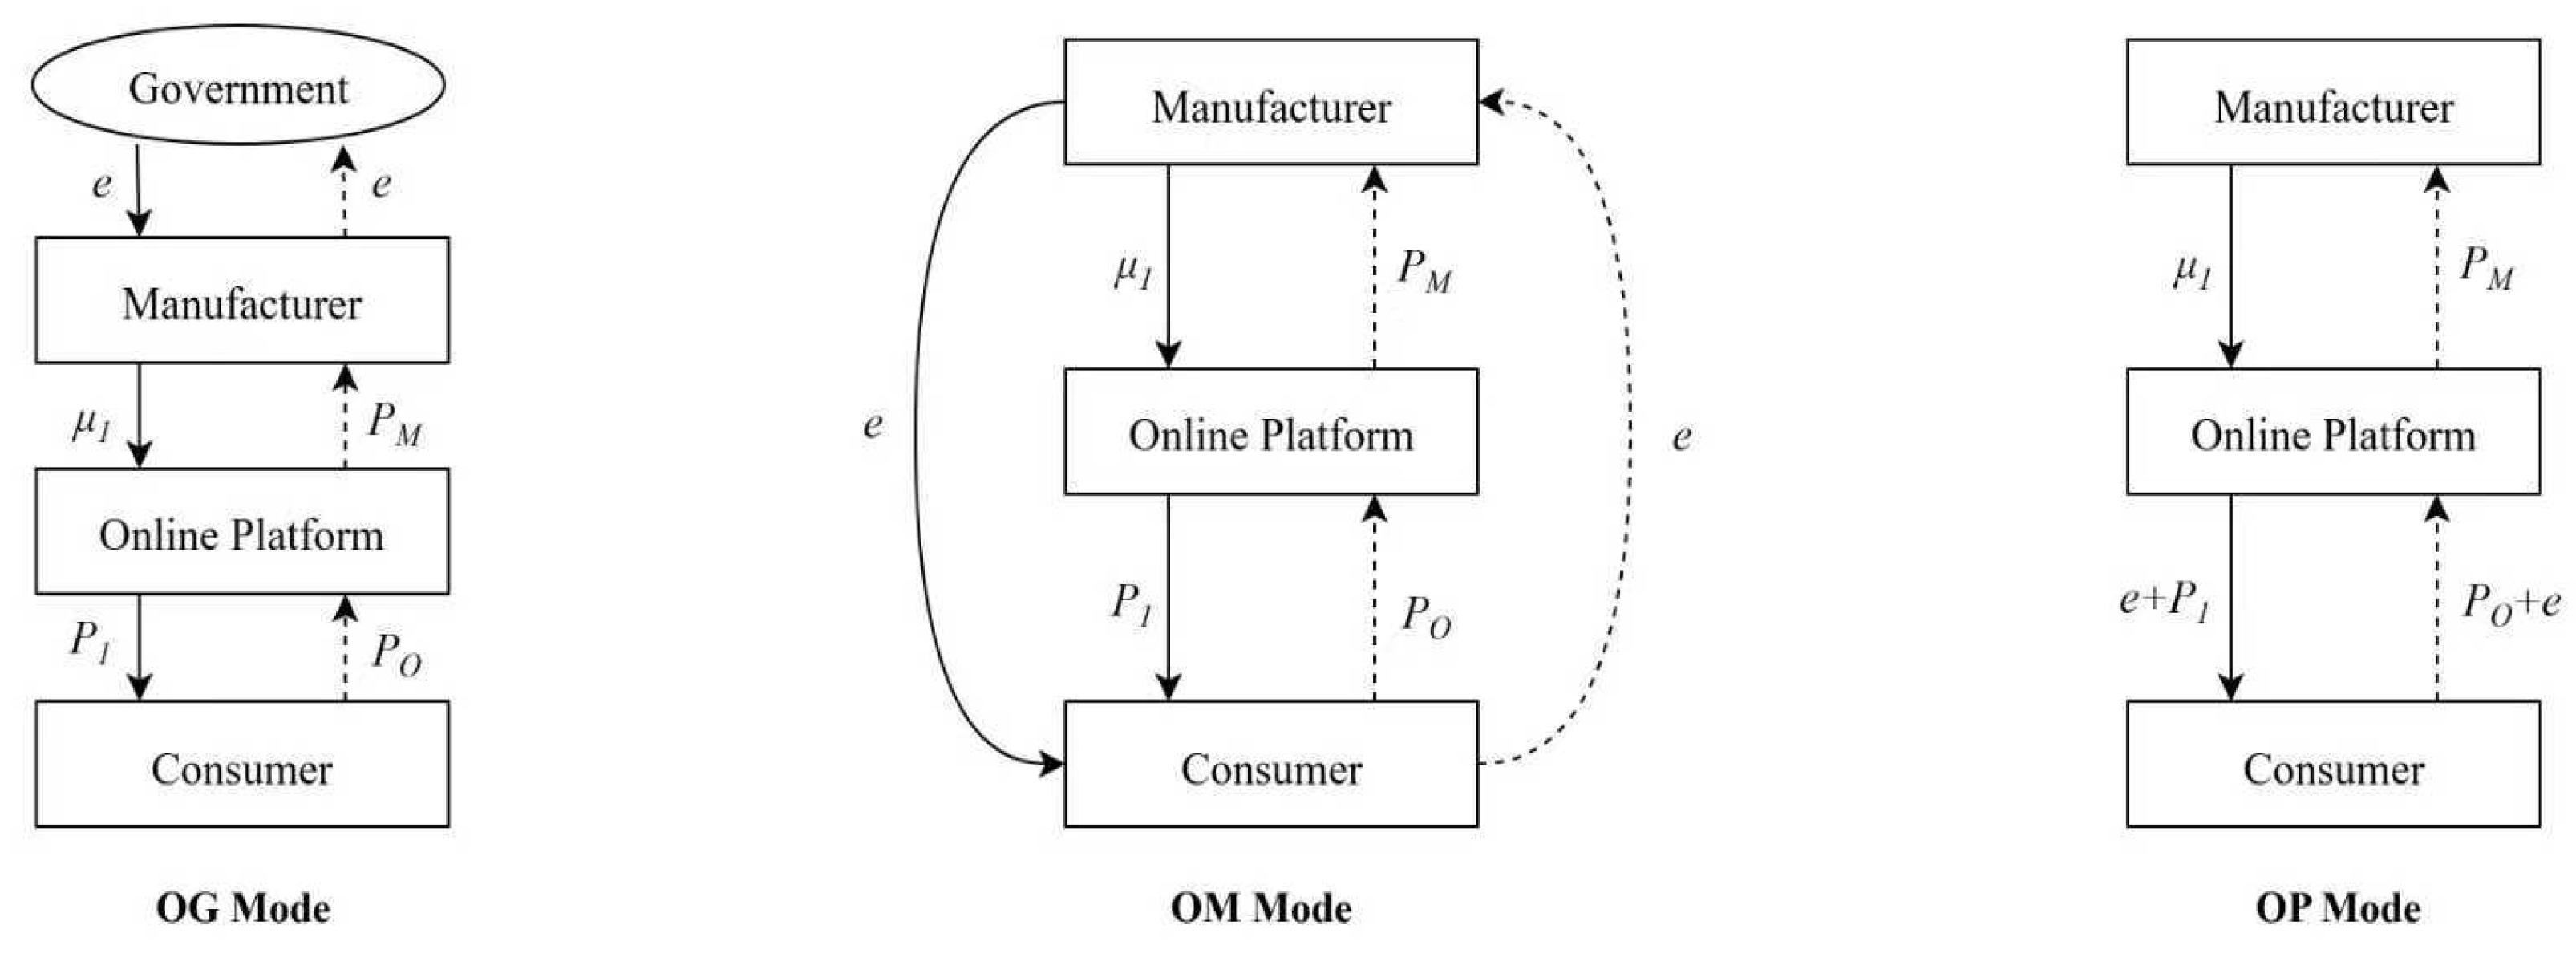
This paper constructs a closed-loop supply chain for power batteries comprising manufacturers and online platforms. In the forward supply chain, manufacturers produce batteries at cost w , while online platforms act as agents selling these batteries online at price p 1 . Manufacturers pay commission μ 1 to the platforms. In the reverse supply chain, two recycling models exist as follows: platform agency recycling and commissioned recycling. Under the agency recycling model, the platform recycles batteries online at price p M , with manufacturers paying commission μ 2 to the platform, which lacks pricing authority for recycling. Three deposit systems exist under this model, as shown in Figure 1: the AG system, where the government collects deposit e from battery manufacturers; the AM system, where manufacturers collect deposit e from consumers; and the AP system, where online platforms collect deposit e from consumers. Under the consignment recycling model, the platform recycles batteries from consumers online at price p O . while manufacturers sell batteries to the platform at price p M . The platform holds pricing authority for recycling. Three deposit systems exist under this model, as shown in Figure 2: OG (government–manufacturer), where the government collects deposits from manufacturers; OM (manufacturer–consumer), where manufacturers collect deposits from consumers; and OP (platform–consumer), where the online platform collects deposits from consumers. The online platform is responsible for blockchain technology investment x . Manufacturers differentiate recovered batteries as follows: those suitable for secondary use ( β ) are sold directly to the secondary market, yielding revenue V 1 ; those unsuitable for secondary use undergo dismantling and recycling, and manufacturers invest in dismantling technology ( u ), yielding revenue V 2 .
This paper ensures the rigor and tractability of the model construction by introducing the following core assumptions:
(1)
This paper assumes that the market demand for power batteries [34] is D A = d 0 p 1 ; D B = d 0 p 1 + e ; where d 0 represents the total potential market demand, p1 denotes the retail price, and e signifies the deposit.
(2)
The quantity of retired power batteries recovered can be expressed as [35] Q j = η p i + σ x . Without loss of generality, we normalize the price sensitivity coefficient in the collection function to 1. This not only facilitates selecting appropriate measurement units for recycling prices and quantities but also simplifies calculations. Therefore, without compromising the nature of our model, we assume η = 1 [15]. Thus, Q A G = p M + σ x ;   Q A M = p M + σ x ;   Q A P = p M + σ x ;   Q O G = p O + σ x ;   Q O M = p O + σ x ;   Q O P = p O + σ x . Among these, σ represents the sensitivity coefficient of consumer investment in blockchain technology, indicating that blockchain technology exerts a positive influence on recycling volumes. By adopting blockchain traceability technology, enterprises enhance the credibility of product data through its tamper-proof nature, thereby gaining consumer trust and effectively stimulating market demand growth [36].
(3)
To ensure that all entities achieve positive returns, the following conditions must be met: p 1 > w , V 2 > u , p M > e , p M > p O , d 0 > p 1 , d 0 > e , d 0 > p 1 + e , μ 1 > μ 2 .
(4)
In reference to the research hypothesis on return on investment [37], we assume that the blockchain investment cost E = 1 2 θ x 2 is a quadratic function of the investment level. Here, θ represents the difficulty coefficient of blockchain technology investment.
(5)
To ensure that all equilibrium solutions are greater than zero, it is necessary to satisfy 2 θ > σ 2 .
(6)
For simplicity, assume that battery manufacturers recycle all waste batteries collected from the market.
The symbols and definitions used in this paper are shown in Table 2:

4. Decision-Making Research on Closed-Loop Supply Chains for Power Batteries in Online Platform Agency Recycling Models

4.1. Model Development and Analysis

4.1.1. Decision-Making Research Under the Government Deposit Scheme for Manufacturers (AG)

Under mode AG, the power battery manufacturer first determines the retail price p 1 and recycling price p M of the power battery, followed by the online platform determining the blockchain investment level x. The profit functions for the power battery manufacturer and the online platform are as follows:
Π A G M = p 1 w e D A μ 1 D A μ 2 Q A G p M e Q A G + β Q A G V 1 + 1 β Q A G V 2 u
Π A G P = μ 1 D A + μ 2 Q A G 1 2 θ x 2
Proposition 1. 
The equilibrium solution under the government deposit scheme model for manufacturers is as follows:
x A G = σ μ 2 θ
p 1 A G = 1 2 e + w + d 0 + μ 1
p M A G = θ K 1 θ + σ 2 μ 2 2 θ
Π A G M = 1 4 θ 2 θ 2 M + 2 K 1 L + 2 e + w μ 1 + μ 1 2 2 K 1 θ θ σ 2 μ 2 + θ σ 2 2 μ 2 2
Π A G P = 1 2 μ 1 e + w d 0 + μ 1 + K 1 μ 2 μ 2 2
Note:  L = β V 1 1 + β V 2 , K 1 = e + u 1 + β + L ,   M = 2 e 2 + w 2 + 2 e w + u 1 + β + u 2 1 + β 2 + d 0 2 2 d 0 e + w + μ 1
Proof of Proposition 1. 
This can be viewed in Appendix A. □
Theorem 1. 
(1)  x A G  increases with  σ  and  μ 2 , decreases with  θ . (2)  p 1 A G  increases with  e ,  w ,  d 0  and  μ 1 . (3)  p M A G  increases with  θ , decreases with  σ ,  u  and  μ 2 . (4) When  V 1 > V 2 u ,  p M A G  increases with  β ; otherwise,  p M A G  decreases with  β .
Proof of Theorem 1. 
This can be viewed in Appendix B. □
First, Theorem 1 (1) indicates that a higher σ signifies greater consumer sensitivity to blockchain investment. To leverage this, online platforms can boost consumer participation in sales and recycling by increasing their blockchain investment, which enhances information transparency and trust. Consequently, platforms are incentivized to raise their investment level to earn more sales and recycling commissions, especially as the per-unit recycling commission ( μ 2 ) increases. Increasing the blockchain investment level x A G can boost the volume of retired power battery recycling ( Q A G = p M + σ x ). The online platform will actively increase the blockchain investment level, to obtain more recycling commissions. Therefore, x A G increases with μ 2 ; when θ increases, it means that the cost will increase significantly for each unit of blockchain investment level. When considering the investment–output ratio, the online platform will reduce the blockchain investment level due to high investment costs, and to avoid excessive costs and loss of profits.
Secondly, Theorem 1 (2) shows that under the AG mode, the government charges the battery manufacturer a deposit, which increases the manufacturer’s cost. To ensure their own profit, the manufacturer will transfer this part of cost to the retail price of the product. Therefore, when e increases, the manufacturer needs to increase the retail price of the power battery to compensate for the higher deposit cost. Therefore, p 1 A G increases with e ; when w increases, the total production cost of the manufacturer increases. To maintain a certain profit level, the manufacturer will increase the retail price of the power battery, so p 1 A G increases with w . When the total potential market demand increases, it indicates that the market demand for power batteries is relatively strong. Manufacturers have stronger pricing power in this market environment. To obtain more profits, manufacturers will increase the retail price of power batteries, so p 1 A G increases with d 0 . When manufacturers pay sales commissions to online platforms, their sales costs increase. To ensure their own profits, manufacturers will pass on this increased cost to consumers by increasing retail prices, so p 1 A G increases with μ 1 .
In addition, Theorem 1 (3) shows that when θ increases, the cost of adding blockchain investment to online platforms increases, which may lead to a decrease in the enthusiasm of online platforms for recycling. To encourage online platforms to actively recycle batteries, manufacturers need to increase the recycling price to ensure that enough used batteries are recycled, so p M A G increases with θ , and as σ increases, consumers become more sensitive to the benefits of blockchain investment. Even when the recycling price p M A G is relatively low, consumers are more willing to participate in recycling due to the blockchain technology investment. Manufacturers can thus ensure sufficient battery recycling without setting excessively high prices, leading to a monotonically decreasing p M A G with increasing σ . As u increases, manufacturers face higher costs for dismantling and reprocessing non-recyclable batteries, reducing their net profit ( V 2 u ) from recycling this category. To safeguard their profits, manufacturers will lower the recycling price p M A G , causing p M A G to decrease monotonically with u . When μ 2 increases, the revenue earned by online platforms from each successful battery recycling transaction rises, thereby boosting their motivation to recycle batteries. In this scenario, manufacturers need not set excessively high recycling prices to incentivize active battery recycling by online platforms, hence p M A G decreases with u .
Finally, Theorem 1 (4) demonstrates that when the profitability of secondary use batteries is relatively high, an increase in β implies that a higher proportion of recovered batteries can be directly sold to the secondary use market. This boosts manufacturers’ revenue from the secondary use market. To acquire more secondary use batteries, manufacturers will raise recycling prices to attract greater volumes of waste batteries. Therefore, p M A G increases with β . Conversely, when the returns from batteries suitable for secondary use are relatively low, an increase in β means a higher proportion of such batteries. However, the returns from this portion are less than the remanufacturing profits from unsuitable batteries, minus any dismantling costs. To control costs, manufacturers will lower the recycling price, so p M A G decreases with β .

4.1.2. Decision-Making Research in Manufacturer-to-Consumer Deposit Models (AM)

In mode AM, the power battery manufacturer first determines the retail price p 1 and recycling price p M of the power battery, followed by the online platform determining the blockchain investment level x . The profit functions for the power battery manufacturer and the online platform are as follows:
Π A M M = p 1 w + e D B μ 1 D B μ 2 Q A M p M + e Q A M + β Q A M V 1 + 1 β Q A M V 2 u
Π A M P = μ 1 D B + μ 2 Q A M 1 2 θ x 2
Proposition 2. 
The equilibrium solution under the manufacturer–consumer deposit model is as follows:
x A M = σ μ 2 θ
p 1 A M = 1 2 ( 2 e + w + d 0 + μ 1 )
p M A M = θ K 2 + ( θ + σ 2 ) μ 2 2 θ
Π A M M = 1 4 θ 2 ( L 1 2 e + u u β + ( w 2 + ( e + u u β ) 2 ) θ 2 + ( d 0 μ 1 ) ( 2 w + d 0 μ 1 ) ) + μ 2 ( θ σ 2 ) ( 2 θ K 2 + ( θ σ 2 ) μ 2 ) )
Π A M P = 1 2 ( μ 1 ( w d 0 + μ 1 ) μ 2 ( K 2 + μ 2 ) )
Note:  L = β V 1 1 + β V 2 , K 2 = e + u u β L .
Since AG and AM modes differ only in terms of their deposit collection mechanisms, their decision sequences and processes are identical. Therefore, the solution process for Proposition 2 is consistent with that of Proposition 1 and is thus omitted.
Theorem 2. 
(1)  x A M  is increasing with respect to  σ  and  μ 2 , and decreasing with respect to  θ . (2)  p 1 A M  is increasing with respect to  w ,  d 0 , and  μ 1 , and decreasing with respect to  e . (3-1) When  V 1 > V 2 u ,  p M A M  increases with  β ; (3-2)  p M A M  increases with  θ , and decreases with  σ ,  u , and  μ 2 .
Proof of Theorem 2. 
The derivation process is identical to that of Theorem 1. □
By Theorem 2, under the AM model, manufacturers directly charge consumers a deposit e . Deposit e represents an additional fee paid by consumers at the point of purchase, increasing their actual expenditure. Manufacturers recognize that charging deposit e may dampen consumer willingness to make a purchase. To stimulate demand, manufacturers have an incentive to lower wholesale prices, thereby encouraging online platforms to set lower retail prices. This offsets the psychological impact of the deposit on consumers. Other regularities are identical to those in Theorem 1 and are not repeated here.

4.1.3. Decision-Making Research on Online Platform Deposit Collection Models for Consumers (AP)

Under mode AP, the power battery manufacturer first determines the retail price p 1 and recycling price p M of the power battery, followed by the online platform determining the blockchain investment level x . The profit functions for the power battery manufacturer and the online platform are as follows:
Π A P M = = p 1 w D B μ 1 D B μ 2 Q A P p M Q A P + β Q A P V 1 + 1 β Q A P V 2 u
Π A P P = e D B Q A P + μ 1 D B + μ 2 Q A P 1 2 θ x 2
Proposition 3. 
The equilibrium solution under the online platform deposit model is as follows:
x A P = σ e + μ 2 θ
p 1 A P = 1 2 ( e + w + d 0 + μ 1 )
p M A P = u ( 1 + β ) θ + e σ 2 + θ L ( θ + σ 2 ) μ 2 2 θ
Π A P M = 1 4 θ 2 ( θ 2 N   e σ 2 ( 2 u 1 + β θ + e σ 2 ) + θ ( L ( 2 u ( 1 + β ) θ 2 e σ 2 +   θ L ) + ( 2 e + w + μ 1 ) θ μ 1 ) 2 ( θ σ 2 ) ( u ( 1 + β ) θ e σ 2 +   θ L ) μ 2 + ( θ σ 2 ) 2 μ 2 2 )
Π A P P = 1 2 ( e ( e   + w + u ( 1 + β ) ) e V 2 + e β V 2 2 e μ 1 w μ 1 μ 1 2 + d 0 ( e +   μ 1 ) + ( e + u ( 1 + β ) ( 1 + β ) V 2 ) μ 2 μ 2 2 + β V 1 ( e +   μ 2 ) )
Note:  L = β V 1 1 + β V 2 ,  N = e + w 2 + u 2 1 + β 2 + d 0 2 2 d 0 ( e + w + μ 1 ) .
Proof of Proposition 3. 
The derivation process for Proposition 3 is identical to that for Proposition 1. □
Theorem 3. 
(1)  x A P  is increasing with respect to  σ  and  μ 2 , and decreasing with respect to  θ  and  e . (2)  p 1 A P  is decreasing with  e  and increasing with respect to  w ,  d 0 , and  μ 1 . (3-1) When V1 > V2 − u,  p M A P  increases with β; (3-2)  p M A P  increases with  e  and  θ , and decreases with u, σ, and μ2.
Proof of Theorem 3. 
The derivation process is identical to that of Theorem 1. □
By Theorem 3, (1) the level of blockchain investment under the AP model decreases with the deposit e . This is because, under the AP model, the online platform directly charges consumers a deposit e , which directly suppresses consumers’ willingness to purchase and recycle. As e increases, consumer participation declines, and the marginal benefit of blockchain investment by the online platform diminishes (even increased investment may fail to offset the negative effects of the deposit). Therefore, to control costs, the platform will reduce blockchain investment. (2) When increased deposits charged by online platforms to consumers lead to a decline in recycling rates, manufacturers must raise recycling prices to incentivize consumer participation to maintain recycling volumes. Other patterns are identical to those in Theorem 2 and will not be repeated here.

4.2. Comparative Analysis

Corollary 1. 
x A G = x A M > x A P , where  x 1 = x A G x A M x A P = e σ θ , ∆x1 increases with σ and e, and decreases monotonically with  θ .
Proof of Corollary 1. 
This can be viewed in Appendix C. □
First, Corollary 1 demonstrates that x A G = x A M , meaning the blockchain investment x of the online platform remains identical under both AG and AM models. This occurs because, while the entities subject to government deposits differ—manufacturers under AG and consumers under AM—the online platform’s role and incentive structure within the reverse supply chain remain fundamentally consistent across both models. The online platform increases the quantity of retired power batteries recycled through blockchain investment, and the expression for the recycling quantity in both models is Q = p M + σ x . When determining the blockchain investment level, the online platform primarily considers the investment cost 1 2 θ x 2 and the commission revenue generated by the increased recycling quantity. Given identical relationships between recycling volume and investment levels, along with comparable cost structures across both models, the online platform selects the same blockchain investment level: x A G = x A M . Furthermore, Corollary 1 indicates that blockchain investment levels for the AG (AM) model exceed those of the AP model. This occurs because, under the AP model, the online platform directly charges consumers a deposit ( e ). This increases consumers’ actual expenditure, potentially reducing their incentive to participate in recycling. To counteract this dampening effect, the platform would need to invest more in blockchain to improve recycling appeal. However, due to the deposit system, the additional revenue gained from recycling remains relatively limited. In contrast, under AG and AM models, consumer participation is less affected by the deposit system. Based on identical cost–benefit considerations, the online platform will opt for higher blockchain investment levels, resulting in x A G = x A M > x A P . Furthermore, Corollary 1 indicates that as σ increases, the gap in blockchain investment levels between AG (AM) models and the AP model widens. This occurs because consumers become more sensitive to the recycling advantages provided by blockchain investments as σ rises. Under the AG and AM models, increased blockchain investment by online platforms more effectively boosts recycling volumes, whereas for the AP model, the impact of such investment is relatively weaker due to the deposit system’s influence. Moreover, under the AP model, the deposit e is collected by the online platform, which somewhat discourages consumer participation in recycling. As e increases, consumer enthusiasm for recycling under the AP model further diminishes, and the effectiveness of blockchain investment by online platforms in this model worsens. In contrast, the deposit system has a smaller impact on consumer recycling participation under the AG and AM models. Therefore, as e increases, the gap in blockchain investment levels between the AG/AM models and the AP model widens. Finally, as θ increases, blockchain investment costs rise more rapidly. Across all models, online platforms reduce blockchain investments. However, since the AP model inherently exhibits relatively poor investment effectiveness, its reduction in investment is comparatively smaller. In contrast, the AG and AM models demonstrate better investment effectiveness, leading to a relatively larger reduction in investment. Consequently, as θ increases, the gap in blockchain investment levels between the AG and AM models and the AP model narrows.
Corollary 2. 
p 1 A G > p 1 A P > p 1 A M .
Proof of Corollary 2. 
This can be viewed in Appendix C. □
Corollary 2 demonstrates that retail prices are highest under the AG model. This occurs because, under the AG model, the government collects a deposit from battery manufacturers. This increases manufacturers’ costs, and to maintain their profit margins, manufacturers pass this cost onto the retail price of the product, thereby raising the retail price p 1 A G . Under the AP model, although the online platform collects a deposit from consumers, this cost is not directly borne by manufacturers. Manufacturers’ costs remain relatively low, so the retail price p 1 A P is lower than p 1 A G . Under the AM model, manufacturers collect a deposit from consumers. This deposit partially offsets manufacturers’ costs, but since it is collected at sale and refunded upon return, its impact on actual manufacturing costs is relatively minor. Under the AP model, deposits charged by online platforms to consumers may dampen purchasing intent. To maintain sales volume, manufacturers may moderately lower retail prices. However, due to operational costs and other factors inherent to the AP model, retail prices remain higher than those under the AM model, resulting in p 1 A P > p 1 A M .
Corollary 3. 
(1) When  θ σ 2 ,  p M A G p M A P > p M A M ; (2) when  θ < σ 2 ,  p M A P > p M A G > p M A M .
Proof of Corollary 3. 
This can be viewed in Appendix C. □
Corollary 3 indicates that when blockchain investment costs are relatively high and online platforms exhibit low investment incentives, the recycling price p M A G under the AG model is the highest. This occurs because, under the AG model, the government collects a deposit from manufacturers, increasing their costs. To ensure sufficient recycling of waste batteries, manufacturers may need to raise the recycling price. Under the AP model, online platforms collect deposits from consumers. While this affects recycling rates, manufacturers’ costs remain relatively low, resulting in a lower recycling price p M A P compared to p M A M . When θ σ 2 , blockchain investment costs are high, somewhat dampening online platforms’ investment enthusiasm. To ensure recycling volumes, manufacturers under the AG model face greater necessity to raise recycling prices. Under the AM model, manufacturers collect deposits from consumers, leading to relatively higher consumer recycling motivation. Manufacturers can secure adequate recycling volumes without paying excessively high prices. Under the AP model, however, deposit collection by online platforms may reduce consumer recycling motivation. Manufacturers must raise the recycling price p M A P to attract more used battery recycling, resulting in p M A P > p M A M . When θ σ 2 , blockchain investment costs are relatively high, somewhat suppressing the investment enthusiasm of online platforms. To ensure recycling volume, manufacturers need to raise recycling prices more significantly under the AG model. Under the AM model, manufacturers collect deposits from consumers, resulting in relatively high consumer recycling motivation. Manufacturers can guarantee a certain recycling volume without paying excessively high prices. In contrast, under the AP model, online platforms collecting deposits may reduce consumer recycling motivation. Manufacturers must increase the recycling price p M A P to attract more used battery recycling, hence p M A P > p M A M . When blockchain investment costs are low ( θ < σ 2 ) and platform investment enthusiasm is high, the recycling price p M A P under the AP model is the highest. This occurs because, under this model, online platforms collect deposits from consumers. While blockchain investment enhances transparency, the deposit burden reduces consumer willingness to recycle, compelling manufacturers to raise recycling prices to attract returns. Under the AG model, government-imposed manufacturer deposits increase costs, but higher blockchain investment partially alleviates recycling pressure, resulting in an intermediate p M A G . Under the AM model, manufacturers directly collect deposits. Combined with the synergistic effects of platform blockchain investment, this significantly boosts consumer recycling motivation. Consequently, setting the minimum recycling price p M A M suffices to guarantee recycling volume.
Corollary 4. 
When  d 0 min d 0 2 , d 0 3 ,  Π M A G Π M A M Π M A P ; where  d 0 2 = 2 w θ 2 + e σ 4 + 2 u ( 1 + β ) θ ( θ σ 2 ) + 2 θ ( ( θ σ 2 ) ( β V 1 ( 1 + β ) V 2 ) + θ μ 1 ) 2 ( θ σ 2 ) 2 μ 2 2 θ 2 ,  d 0 3 = e 2 + w + 2 u β + 2 β V 1 + μ 1 + 2 σ 2 μ 2 θ 2 ( u + ( 1 + β ) V 2 + μ 2 ) .
Proof of Corollary 4. 
This can be viewed in Appendix C. □
When d 0 is small, market demand for power batteries is limited. Under the AG model, although government deposits increase manufacturers’ costs, manufacturers can maintain profits by raising retail and recycling prices. Under the AM model, manufacturers collect deposits from consumers, which moderates purchasing and recycling behavior, but profits remain relatively low due to low market demand. Under the AP model, online platforms collecting deposits may further dampen consumer purchasing and recycling enthusiasm, resulting in the lowest manufacturer profits. Thus, Π M A G Π M A M Π M A P .
Corollary 5. 
When  μ 1 2 μ 2  and  d 0 d 0 1 ,  Π P A M Π P A G Π P A P , where  d 0 1 = e + w + 1 β V 2 u + β V 1 + μ 1 .
Proof of Corollary 5. 
This can be viewed in Appendix C. □
When sales commission μ 1 exceeds twice that of the recycling commission μ 2 , the platform prioritizes sales over recycling. Under low market demand, avoiding suppression of consumer willingness is crucial. Thus, under the AM model where manufacturers collect deposits, the platform safeguards sales volume and secures its primary revenue source. Under the AG model, though deposits are not directly collected, incentives remain insufficient. Under the AP model, the platform’s deposit collection suppresses demand, undermining its main income stream.

5. Decision-Making Research on Closed-Loop Supply Chains for Power Batteries in Online Platform-Commissioned Recycling Models

5.1. Model Development and Analysis

5.1.1. Decision-Making Research Under the Government Deposit Scheme for Manufacturers (OG)

Under the OG model, the battery manufacturer first determines the retail price p 1 and recycling price p M of the power battery. Subsequently, the online platform sets the recycling price p O and blockchain investment level x . The profit functions for the battery manufacturer and online platform are as follows:
Π O G M = p 1 w e D A μ 1 D A μ 2 Q O G p M e Q O G + β Q O G V 1 + 1 β Q O G V 2 u
Π O G P = μ 1 D A + p M p O Q O G 1 2 θ x 2
Proposition 4. 
The equilibrium solution under the government deposit scheme for manufacturers is as follows:
p O O G = ( θ σ 2 ) ( K 3 + β V 1 ) 4 θ 2 σ 2
x O G = σ ( K 3 + β V 1 ) 4 θ 2 σ 2
p 1 O G = 1 2 ( e + w + d 0 + μ 1 )
p M O G = 1 2 ( K 3 + β V 1 )
Π O G M = 1 8 θ 4 σ 2 ( θ V e + w 2 σ 2 + ( 2 θ σ 2 ) d 0 2 + β 2 θ V 1 2 ( 1 + β ) θ V 2 ( 2 C   ( 1 + β ) V 2 ) + ( 2 θ σ 2 ) μ 1 ( 2 ( e + w ) + μ 1 ) 2 ( 2 θ   σ 2 ) d 0 ( e + w + μ 1 )
Π O G P = 1 16 θ 8 σ 2 ( θ C 2 + β 2 θ V 1 2 + 1 + β 2 θ V 2 2 4 ( 2 θ σ 2 ) μ 1 ( e + w d 0 +   μ 1 ) 2 ( 1 + β ) θ V 2 ( C μ 2 ) + 2 β θ V 1 K 3 2 θ C μ 2 + θ μ 2 2 )
Note:  C = e + ( 1 + β ) u ,  L = β V 1 1 + β V 2 ,  K 3 = C ( 1 + β ) V 2 μ 2 ,  V = e 3 e + 4 w + 2 1 + β μ + 2 w 2 + 1 + β 2 μ 2 + 2 β V 1 K 3 2 K 3 μ 2 μ 2 2
Proof of Proposition 4. 
This can be viewed in Appendix A. □
Theorem 4. 
(1)  x O G  is increasing with respect to  σ  and  e , and decreasing with respect to  θ , u and  μ 2 ;when  V 2 < V 1 + u ,  x O G  increases with β, otherwise, it decreases with β. (2)  p 1 O G   i n c r e a s e s   w i t h   e ,   w , d 0  and  μ 1 . (3)  p M O G   i n c r e a s e s   w i t h   e , decreases with  u  and  μ 2 ; when  V 2 < V 1 + u ,  p M O G  decreases with β, and conversely, decreases with  β . (4)  p O O G  increases with  θ  and e, and decreases with σ, u, and  μ 2 . When  V 2 < V 1 + u ,  p O O G  increases with β; otherwise, it decreases with β.
Proof of Theorem 4. 
The derivation process is identical to that of Theorem 1. □
(1)
As the deposit amount e increases, the government collects higher deposits from manufacturers, directly raising their costs. Manufacturers have strong incentives to boost battery recycling rates to minimize deposit losses or secure refunds, prompting them to incentivize online platforms by increasing recycling commissions μ 2 . Faced with higher commission incentives, online platforms will increase blockchain investment to boost recycling volumes. An increase in σ indicates greater consumer sensitivity to the impact of blockchain technology investment. Higher blockchain investment levels by online platforms can more effectively attract consumer participation in battery recycling activities, as blockchain investment enhances information transparency and trust. Online platforms have greater motivation to increase blockchain investment levels to earn more recycling commission income, so this investment monotonically increases with σ . When θ increases, it means the cost per unit of additional blockchain investment rises significantly. When considering the investment–output ratio, online platforms reduce blockchain investment levels due to excessively high costs, so this investment decreases with θ . As u increases, manufacturers transform higher costs for dismantling and recycling non-gradable batteries, resulting in reduced net profits from recycling. Manufacturers may consequently lower the recycling commission μ 2 , thereby reducing incentives for online platforms to invest in blockchain technology. Thus, μ 2 decreases with increasing u . When μ 2 increases, online platforms gain higher profits from each successful battery recycling procedure. However, under the OG model, higher μ 2 may cause platforms to rely more on commission income rather than blockchain investment to boost recycling volume. Therefore, μ 2 decreases with increasing x . For parameter β , when V 2 < V 1 + u , the profit V1 from secondary utilization (battery reuse) plus dismantling cost exceeds the profit V 2 from non-reusable batteries. This indicates that secondary utilization is relatively more profitable. As β increases, the proportion of recycled batteries suitable for direct secondary utilization rises, giving manufacturers greater incentive to boost recycling rates. This, in turn, motivates online platforms to increase blockchain investments to acquire more high-quality batteries, resulting in an increasing β . Conversely, when V 2 V 1 + u , non-recycling becomes more cost-effective. An increase in β may reduce manufacturers’ incentives for recycling, prompting online platforms to decrease investments. Thus, β decreases.
(2)
When the deposit increases, the government collects higher deposits from manufacturers, raising their costs. To maintain profits, manufacturers pass this cost onto online platforms by raising wholesale prices. As sales agents, online platforms reflect these higher procurement costs when setting retail prices, causing them to increase with e . When the unit production cost w rises, manufacturers’ total production costs increase. To maintain profit levels, manufacturers raise the wholesale prices of power batteries, which forces online platforms to increase retail prices to sustain their profit margins. Thus, the retail price increases with w . An increase in potential total market demand d 0 indicates robust market demand for power batteries. Online platforms possess greater pricing power in this market environment. To capture higher profits, they raise retail prices for power batteries, which thus increase with d 0 . When manufacturers increase sales commissions μ 1 paid to online platforms, their sales costs rise and may be passed on through higher wholesale prices. Online platforms factor in this elevated cost base when setting retail prices, consequently raising them, and hence retail prices increase with μ 1 .
(3)
As the deposit e increases, the government collects higher deposits from manufacturers. To ensure sufficient recycling rates and avoid deposit losses or secure refunds, manufacturers raise recycling prices to directly incentivize consumer participation, resulting in an enhanced relationship with e . When dismantling costs u rise, manufacturers face higher disposal expenses for non-recyclable batteries, reducing their net profits from recycling. To maintain profitability in recycling activities, manufacturers lower recycling prices to control costs, causing recycling prices to decrease with u . When recycling commission μ 2 increases, online platforms gain higher returns from recycling, boosting their recycling incentives. Manufacturers need not set excessively high recycling prices to guarantee sufficient collection volumes under these conditions, so recycling prices decrease with μ 2 . For parameter β , when V 2 < V 1 + u , secondary utilization yields relatively higher returns. As β increases, manufacturers raise recycling prices to attract consumers and acquire more high-value batteries suitable for secondary utilization, so recycling prices increase with β . Conversely, when V 2 V 1 +  u , non-recycling becomes more cost-effective. Increasing β may prompt manufacturers to avoid excessive investment in low-return channels, thereby lowering recycling prices. Thus, recycling prices decrease with β .
(4)
As θ increases, the cost of blockchain investment for online platforms rises, reducing their willingness to invest. To compensate for the potential decline in recycling volumes, platforms must raise recycling prices to directly incentivize consumer participation, causing e to increase with θ . When the deposit e increases, manufacturers’ costs rise, potentially prompting them to incentivize platforms by raising commission μ 2 . To meet higher recycling targets, online platforms raise recycling prices to attract more consumers, causing them to increase with e . As σ increases, consumers become more sensitive to the recycling advantages offered by blockchain investments. Even with lower recycling prices set by online platforms, consumers are more willing to participate in recycling due to blockchain technology investments. In this scenario, online platforms can reduce recycling prices to save costs, so it decreases with σ . As dismantling costs u increase, manufacturers’ net profits decrease, potentially lowering commission μ 2 . Online platforms then reduce recycling prices to maintain profits, so it decreases with u . For parameter β , when V 2 < V 1 + u , secondary utilization becomes more profitable. As β increases, online platforms, incentivized by manufacturers, raise recycling prices to acquire more batteries suitable for secondary use, so recycling prices increase with β . Conversely, when V 2 V 1 + u , online platforms lower recycling prices to control costs, so recycling prices decrease with β .

5.1.2. Decision Research (OM) in the Manufacturer-to-Consumer Deposit Model

Under mode OM, the power battery manufacturer first determines the retail price p 1 and recycling price p M of the power battery. Subsequently, the online platform sets the recycling price p O and blockchain investment level x . The profit functions for the power battery manufacturer and the online platform are as follows:
Π O M M = ( p 1 w +   e ) D B μ 1 D B μ 2 Q O M ( p M + e ) Q O M + β Q O M V 1 + ( 1   β ) Q O M ( V 2 u )
Π O M P = μ 1 D B + p M p O Q O M 1 2 θ x 2
Proposition 5. 
The equilibrium solution under the manufacturer-to-consumer deposit model is as follows:
p O O M = ( θ σ 2 ) ( K 4 β V 1 ) 4 θ 2 σ 2
x O M = σ ( K 4 β V 1 ) 4 θ 2 σ 2
p 1 O M = 1 2 ( 2 e + w + d 0 + μ 1 )
p M O M = 1 2 ( K 4 β V 1 )
Π O M M = 1 8 θ 4 σ 2 ( θ ( 2 w 2 + T 2 ) w 2 σ 2 + ( 2 θ σ 2 ) d 0 2 + β 2 θ V 1 2 + ( 1 +   β ) θ V 2 ( 2 T + ( 1 + β ) V 2 ) + ( 2 θ σ 2 ) μ 1 ( 2 w + μ 1 ) 2 ( 2 θ   σ 2 ) d 0 ( w + μ 1 ) + 2 θ ( K 4 μ 2 ) μ 2 + θ μ 2 2 2 β θ V 1 K 4 )
Π O M P = 1 16 θ 8 σ 2 ( θ ( T 2 + β 2 V 1 2 + 1 + β 2 V 2 2 ) 4 ( 2 θ σ 2 ) μ 1 ( w d 0 + μ 1 ) + 2 θ T μ 2 + θ μ 2 2 + 2 ( 1 + β ) θ V 2 ( T + μ 2 ) 2 β θ V 1 K 4 )
Note:  T = e + u β u ,  L = β V 1 1 + β V 2 ,  K 4 = e + u β u + ( 1 + β ) V 2 + μ 2
Proof of Proposition 5. 
The derivation process for Proposition 5 is identical to that for Proposition 4. □
Theorem 5. 
(1)  x O M  is increasing with respect to  σ , and decreasing with respect to  θ , u,  e  and  μ 2 ; when  V 2 < V 1 + u ,  x O M  increases with β, otherwise, it decreases with β. (2)  p 1 O M   i n c r e a s e s   w i t h   w ,  d 0  and  μ 1 , and decreases with  e . (3)  p M O M  decreases with  u ,  e  and  μ 2 ; when  V 2 < V 1 + u ,  p M O M  increases with β, and conversely, decreases with  β . (4)  p M O M  increases with  θ , decreases with σ, u, e and  μ 2 . When  V 2 < V 1 + u ,  p O O G  increases with β; otherwise, it decreases with β.
Proof of Theorem 5. 
The derivation process is identical to that of Theorem 1. □
Theorem 5 shows that as e increases, (1) consumers become more willing to recycle, while the marginal benefit of blockchain investment by online platforms decreases, leading to reduced blockchain investment levels. (2) Manufacturers charge consumers a deposit e , increasing consumers’ actual expenditure and potentially suppressing their willingness to purchase. To stimulate demand, manufacturers and online platforms lower retail prices to offset the psychological impact of the deposit on consumers. (3) With stronger consumer recycling willingness, manufacturers can further reduce recycling prices to control costs while maintaining recycling volumes. (4) The incentive effect of the deposit intensifies. To maximize profits, online platforms lower recycling prices to save costs while leveraging the deposit system to sustain recycling volumes. Therefore, x O M , p 1 O M , p M O M  and  p O O M all decrease with e . The remaining patterns align with Lemma 4 and are not repeated here.

5.1.3. Decision Research (OP) on the Manufacturer-to-Consumer Deposit Model

Under mode OP, the power battery manufacturer first determines the retail price p 1 and recycling price p M of the power battery. Subsequently, the online platform sets the recycling price p O and blockchain investment level x . The profit functions for the power battery manufacturer and the online platform are as follows:
Π M O P = ( p 1 w ) D B μ 1 D B μ 2 Q O P p M Q O P + β Q O P V 1 + ( 1 β ) Q O P ( V 2 u )
Π P O P = e D B Q O P + μ 1 D B + p M p O Q O P 1 2 θ x 2
Proposition 6. 
The equilibrium solution under the manufacturer-to-consumer deposit model is as follows:
p O O P = ( θ σ 2 ) ( e K 4 β V 1 ) 4 θ 2 σ 2
x O P = σ ( K 4 β V 1 ) 4 θ 2 σ 2
p 1 O P = 1 2 ( e + w + d 0 + μ 1 )
p M O P = 1 2 ( e + ( 1 + β ) u + β V 1 ( 1 + β ) V 2 μ 2 )
Π M O P = 1 8 θ 4 σ 2 ( θ J e + w 2 σ 2 + ( 2 θ σ 2 ) d 0 2 + β 2 θ V 1 2 + ( 1 + β ) θ V 2 ( 2 T + ( 1 + β ) V 2 ) + ( 2 θ σ 2 ) μ 1 ( 2 ( e + w ) + μ 1 ) 2 ( 2 θ σ 2 ) d 0 ( e + w + μ 1 ) + 2 θ ( K 4 μ 2 ) μ 2 + θ μ 2 2 2 β θ V 1 K 4 )
Π P O P = 1 16 θ 8 σ 2 ( θ X + 4 e e + w σ 2 + β 2 θ V 1 2 + 1 + β θ V 2 2 T + 1 + β V 2 + 4 ( 2 θ σ 2 ) μ 1 ( 2 e + w + μ 1 ) + 4 ( 2 θ σ 2 ) d 0 ( e + μ 1 ) + 2 θ ( K 4 μ 2 ) μ 2 + θ μ 2 2 2 β θ V 1 K 4 )
Note:  T = e + u β u ,  L = β V 1 1 + β V 2 ,  K 4 = e + u β u + ( 1 + β ) V 2 + μ 2 ,  J = 3 e 2 + 4 e w + 2 w 2 ( 1 + β ) ( 2 e u ( 1 + β ) , X = e ( 7 e + 8 w + 2 ( 1 + β ) μ ) + 1 + β 2 u 2
Proof of Proposition 6. 
The derivation process for Proposition 6 is identical to that for Proposition 4. □
Theorem 6. 
(1)  x O P  is increasing with respect to  σ , and decreasing with respect to  θ , u,  e , and  μ 2 ; when  V 2 < V 1 + u ,  p 1 O P  increases with β, otherwise, it decreases with β. (2)  p 1 O P   i n c r e a s e s   w i t h   w ,  d 0 , and  μ 1 . (3)  p M O P  increases with  e , decreases with  u  and  μ 2 ; when  V 2 < V 1 + u ,  p M O P  increases with β, and conversely, decreases with  β . (4)  p O O P  increases with  θ , decreases with σ, u, e, and  μ 2 . When  V 2 < V 1 + u ,  p O O P  increases with β; otherwise, it decreases with β.
Proof of Theorem 6. 
The derivation process is identical to that of Theorem 1. □
Theorem 6 demonstrates that in OP mode, online platforms charge consumers a deposit e , which suppresses their willingness to recycle. Simultaneously, these platforms hold pricing power over recycling, potentially creating misaligned recycling objectives with manufacturers. To compensate for this dual disadvantage and ensure their own battery recycling volumes, manufacturers are compelled to raise recycling prices to directly incentivize consumers. The remaining patterns align with Theorem 5 and are not repeated here.

5.2. Comparative Analysis

Corollary 6. 
x O G > x O M = x O P , where  x 2 = x O G x O M x O P = e σ / ( 2 θ σ 2 ) , x 2  increases with σ and  e , and decreases with  θ .
Proof of Corollary 6 
This can be viewed in Appendix C. □
In both OM and OP modes, online platforms hold pricing power within the reverse supply chain, enabling them to autonomously set recycling prices to optimize collection volumes. Despite differences in deposit collection entities, the profit functions and decision-making mechanisms for online platforms remain fundamentally identical across both models. Blockchain investment decisions by online platforms primarily depend on recycling commissions and the cost function of collection volume. Given their pricing authority, online platforms can adjust collection prices to offset the impact of deposits on consumer behavior, thereby maintaining consistent blockchain investment levels. Consequently, x O G > x O M . In the OG model, governments collect deposits from manufacturers. Manufacturers possess stronger incentives to boost collection rates—either to minimize deposit losses or secure refunds—and thus are willing to pay higher collection commissions to online platforms. In the OG model, the higher μ 2 prompts the online platform to increase blockchain investment to boost recycling volume and achieve greater profits. In contrast, the OM and OP models feature lower and identical μ 2 values, resulting in lower investment levels by the online platform. Thus, x O G > x O M = x O P .
As σ increases, the marginal benefit of blockchain investment rises, particularly in the OG model where higher μ 2 amplifies this effect, thereby widening the investment gap between OG and OM/OP models. When e increases, manufacturers pay higher additional commissions in the OG model, strengthening investment incentives for online platforms, whereas OM/OP models remain unaffected, further widening the gap. As θ increases, investment costs rise more rapidly, causing investment levels to decrease across all models. However, due to higher returns in the OG model, the reduction in investment is relatively smaller, whereas the decrease is more significant in the OM/OP model, thereby narrowing the gap.
Corollary 7. 
p 1 O G > p 1 O P > p 1 O M .
Proof of Corollary 7. 
This can be viewed in Appendix C. □
First, under the OG model, the government collects a deposit from battery manufacturers, which directly increases their production costs. To maintain their profit margins, manufacturers pass this cost onto wholesale prices. As sales agents, online platforms reflect these higher wholesale costs when setting retail prices, resulting in the highest retail price p 1 O G . Under the OP model, online platforms collect the deposit from consumers. Since manufacturers do not bear this deposit, their costs are relatively lower, leading to lower wholesale prices. However, after collecting the deposit, online platforms may moderately raise retail prices to maintain profits, compensating for the potential dampening effect of the deposit on consumer demand (e.g., reduced purchase willingness). Thus, the retail price p 1 O P is lower than p 1 O G but higher than p 1 O M . In the OM model, the manufacturer collects a deposit from consumers. This deposit provides the manufacturer with additional revenue, partially offsetting production costs, allowing the manufacturer to set a lower wholesale price. When setting retail prices, the online platform, based on lower wholesale costs and competitive considerations, sets a lower retail price, making p 1 O M the lowest.
Corollary 8. 
p M O G = p M O P > p M O M .
Proof of Corollary 8. 
This can be viewed in Appendix C. □
First, under the OG model, the government collects a deposit from battery manufacturers. This directly increases manufacturers’ costs. To ensure high recycling rates and avoid deposit losses or secure refunds, manufacturers have strong incentives to set higher recycling prices p M O G to encourage consumer participation. Under the OP model, online platforms collect deposits from consumers. Manufacturers do not collect deposits directly, but the deposit system may influence consumer recycling willingness. Since online platforms hold recycling pricing power, manufacturers must set a higher recycling price p M O P to ensure platforms have sufficient incentive to actively recycle batteries and compensate for potential risks of reduced recycling volumes due to the deposit system. Thus, manufacturers set the same recycling price as in the OG model. In the OM model, manufacturers collect deposits from consumers. Manufacturers collect deposits at point of sale and refund them upon recycling, providing a cash flow advantage. The deposit system itself incentivizes consumer participation in recycling to obtain refunds. Consequently, manufacturers can guarantee sufficient recycling volumes without setting high recycling prices, enabling them to set lower recycling prices p M O M .
Corollary 9. 
p O O G > p O O M = p O O P .
Proof of Corollary 9. 
This can be viewed in Appendix C. □
First, under the OG model, the government collects a deposit from battery manufacturers. This directly increases manufacturers’ costs, creating a strong incentive for them to pay higher recycling commissions μ 2 to online platforms to ensure high recycling rates and avoid deposit losses or secure refunds. In response to this incentive, online platforms set higher recycling prices p O O G to attract consumer participation and boost recycling volumes, thereby increasing commission revenues. Therefore, p O O G is highest. In the OM model, manufacturers collect deposits from consumers. The deposit system directly incentivizes consumers to recycle batteries to retrieve their deposits, resulting in higher consumer participation in recycling. Online platforms can achieve sufficient recycling volumes without setting very high recycling prices, thereby saving costs. Consequently, they set a lower recycling price p O O M . In the OP model, online platforms collect deposits e from consumers. The online platform directly owns the deposit revenue, and the deposit system itself incentivizes consumer recycling (e.g., through deposit refunds). Consequently, the online platform similarly does not need to set high recycling prices. The online platform’s decision-making resembles the OM model because the deposit has the same effect on consumer behavior. The online platform will set the same recycling price p O O P to maximize profits, thus p O O G > p O O M = p O O P .
Corollary 10. 
When  d 0 4 d 0 d 0 5 ,    Π M O G Π M O M Π M O P ; when  d 0 < m i n { d 0 4 , d 0 5 } ,  Π M O G > Π M O P > Π M O M . Where  d 0 4 = e + 2 w + 2 μ 1 2 , d 0 5 = 2 θ ( e + 2 w + 2 ( 1 + β ) μ ) ( e + 2 w ) σ 2 + 4 β θ V 1 4 ( 1 + β ) θ V 2 + 4 θ μ 1 2 σ 2 μ 1 4 θ μ 2 4 θ 2 σ 2 .
Proof of Corollary 10. 
This can be viewed in Appendix C. □
In the OG model, the government collects deposits from manufacturers, which directly increases manufacturers’ costs. However, under moderate market demand, manufacturers can pass on part of these costs by appropriately raising wholesale and retail prices. Simultaneously, manufacturers ensure sufficient recycling volumes by setting higher redemption prices, thereby avoiding deposit losses. This combined strategy allows manufacturers to maintain high profits under moderate demand, resulting in the maximum Π M O G . In the OM model, manufacturers collect a deposit from consumers. The deposit system provides manufacturers with a cash flow advantage (advance receipt of deposit revenue) and directly incentivizes consumer participation in recycling (deposit refunds), thereby reducing manufacturers’ reliance on high recycling prices. Under moderate demand, this model effectively balances costs and benefits, yielding intermediate profits: Π M O G Π M O M Π M O P . Under the OP model, online platforms collect a deposit from consumers. Manufacturers do not directly receive deposit income, but the deposit system may suppress consumer purchasing intent (decreased demand). Manufacturers still need to set high recycling prices to compensate for the platform’s insufficient recycling incentives. Under moderate demand, manufacturers face significant cost pressure with limited income, resulting in the lowest profit, i.e., Π M O P is minimal.
Corollary 11. 
When  d 0 6 d 0 d 0 7 ,  Π P O G Π P O P Π P O M ; when  d 0 < m i n { d 0 6 , d 0 7 } ,  Π P O G > Π P O M > Π P O P . Where  d 0 6 = e + w + 2 μ 1 ,  d 0 7 = 2 ( e + w ) θ + ( 1 + β ) θ μ ( e + w ) σ 2 + β θ V 1 + ( θ β θ ) V 2 + ( 2 θ σ 2 ) μ 1 θ μ 2 2 θ σ 2 .
Proof of Corollary 11. 
This can be viewed in Appendix C. □
Under the OG model, the government collects a deposit from manufacturers. This incentivizes manufacturers to pay higher commissions to online platforms—particularly the reverse logistics commission μ 2 —to ensure continuous operations and secure deposit refunds. Online platforms earn commission μ 1 through forward sales while also generating substantial profits in reverse logistics due to manufacturers’ high commission incentives. Simultaneously, the platform holds pricing power over recycling, enabling further profit optimization by controlling recycling prices. Under moderate market demand, this model effectively boosts platform revenue, yielding maximum profits (i.e., Π P O G is maximized). Under the OP model, online platforms collect deposits directly from consumers. This generates direct deposit income for the platform but may somewhat suppress consumer purchasing intent (reduced demand). The platform retains recycling pricing authority but must carefully set prices to maintain collection volumes. Under moderate demand, the combination of deposit income and commission income (affected by somewhat suppressed demand) results in platform profits lower than the OG model but higher than the OM model, i.e., Π P O P Π P O M . Under the OM model, manufacturers collect the deposit from consumers. Online platforms cannot capture deposit revenue, and manufacturers’ capital flow advantages may grant them greater leverage in commission negotiations (e.g., lowering commission rates). Although platforms control recycling pricing, lower recycling prices limit profit margins. Under moderate demand, platforms lack additional revenue sources (deposits), resulting in the lowest profits, i.e., Π P O M is minimal. Under the Original Guarantee (OG) model, even with low market demand, manufacturers remain willing to pay higher commissions to incentivize platforms to increase recycling volumes due to government deposit pressures. Platforms secure profits through higher recycling commissions μ 2 and pricing power over recycling. In low-demand environments, this strong manufacturer support maximizes platform profits under the OG model, i.e., Π P O G is maximized. Under the OM model, low market demand means manufacturers’ deposits incentivize consumers to recycle (to recover deposits), ensuring basic recycling volumes. Although the platform lacks deposit revenue and may receive lower commissions, stable recycling volumes provide a baseline commission income. Comparatively, its profits exceed those of the OP model, which faces more severe demand suppression, meaning Π P O M > Π P O P . In the OP model, online platforms directly collect deposits from consumers. In an already weak market demand environment, charging deposits further suppresses consumer purchasing and recycling willingness, leading to declines in both sales volume and recycling volume. Although the platform receives deposit income, the resulting loss in commission income is greater (both sales commission μ 1 and recycling commission μ 2 decrease). Therefore, under low demand, the OP model yields the lowest profit, i.e., Π P O P is minimal.

6. Numerical Analysis of Closed-Loop Supply Chains for Power Batteries Under Two Recycling Models

Based on the preceding analysis, this section employs numerical analysis methods to elucidate the research findings, conducting comprehensive cross-validation of the proposed model using MATLAB 2025b software. Based on the model assumptions, to ensure the obtained equilibrium solutions possess practical significance and maintain universality, all parameter values and units are summarized in Table 3 after referencing the existing literature [12,32,38,39]. To clearly present the conclusions from the curves, some parameters adopt different values in different figures, which will be explicitly explained in subsequent sections. The fixed numerical parameters are listed first, and are as follows: μ 1 = 0.4 , β = 0.9 , V 1 = 4 , V 2 = 3 , u = 0.2 .

6.1. Numerical Analysis of a Closed-Loop Supply Chain for Power Batteries Under an Online Platform Agency Recycling Model

6.1.1. Impact of Key Parameters on Blockchain Investment Levels

To validate the impact of key parameters σ , e , and θ on blockchain investment level x under the online platform proxy recycling model, this section establishes the following: e = 0.1 ,   μ 2 = 0.2 , θ = 0.5 , σ = 0.7 . The specific simulation results are shown in Figure 3.
As shown in Figure 3, (1) regardless of parameter variations, the blockchain investment levels under AG and AM modes remain consistent for online platforms. This consistency occurs because the deposit transaction, though involving different parties, happens entirely outside the online platform and does not directly affect its profit function. Therefore, the profit function structure of the online platform remains identical under both modes. (2) As shown in the three figures, regardless of parameter variations, the blockchain investment level of the online platform is lowest under the AP mode. This is because the platform collects the deposit from consumers, which effectively increases consumers’ total expenditure on product purchases (retail price + deposit). According to the demand function, this inevitably suppresses positive demand, leading to reduced sales volume and consequently lower sales commissions for the platform. Thus, the optimal investment level chosen by the platform under the AP model is the lowest. (3) As the consumer’s sensitivity coefficient σ to the recycling price increases, the online platform’s blockchain investment rises for both models. This is because a higher σ implies that the platform’s blockchain investment x can more effectively increase the recycling quantity Q, thereby generating more commission revenue. As the deposit increases, blockchain investment remains unchanged under the AG/AM models, since the deposit is an external transaction and does not affect the platform’s decision-making. Under the AP model, however, the platform directly collects the deposit. Higher deposit revenue displaces the platform’s desire to invest in blockchain, leading to reduced blockchain investment at this point; when θ increases, blockchain investment costs rise more rapidly. Across all models, online platforms reduce blockchain investment. These findings validate the conclusion of Corollary 1. Therefore, enterprises seeking to build long-term, sustainable competitive advantages should prioritize AG or AM models. They should collaborate with partners to design incentive contracts centered on high commission recycling μ 2 to drive beneficial technological innovation and value creation throughout the supply chain ecosystem.

6.1.2. The Impact of Key Parameters on Price Decision-Making Among Different Entities

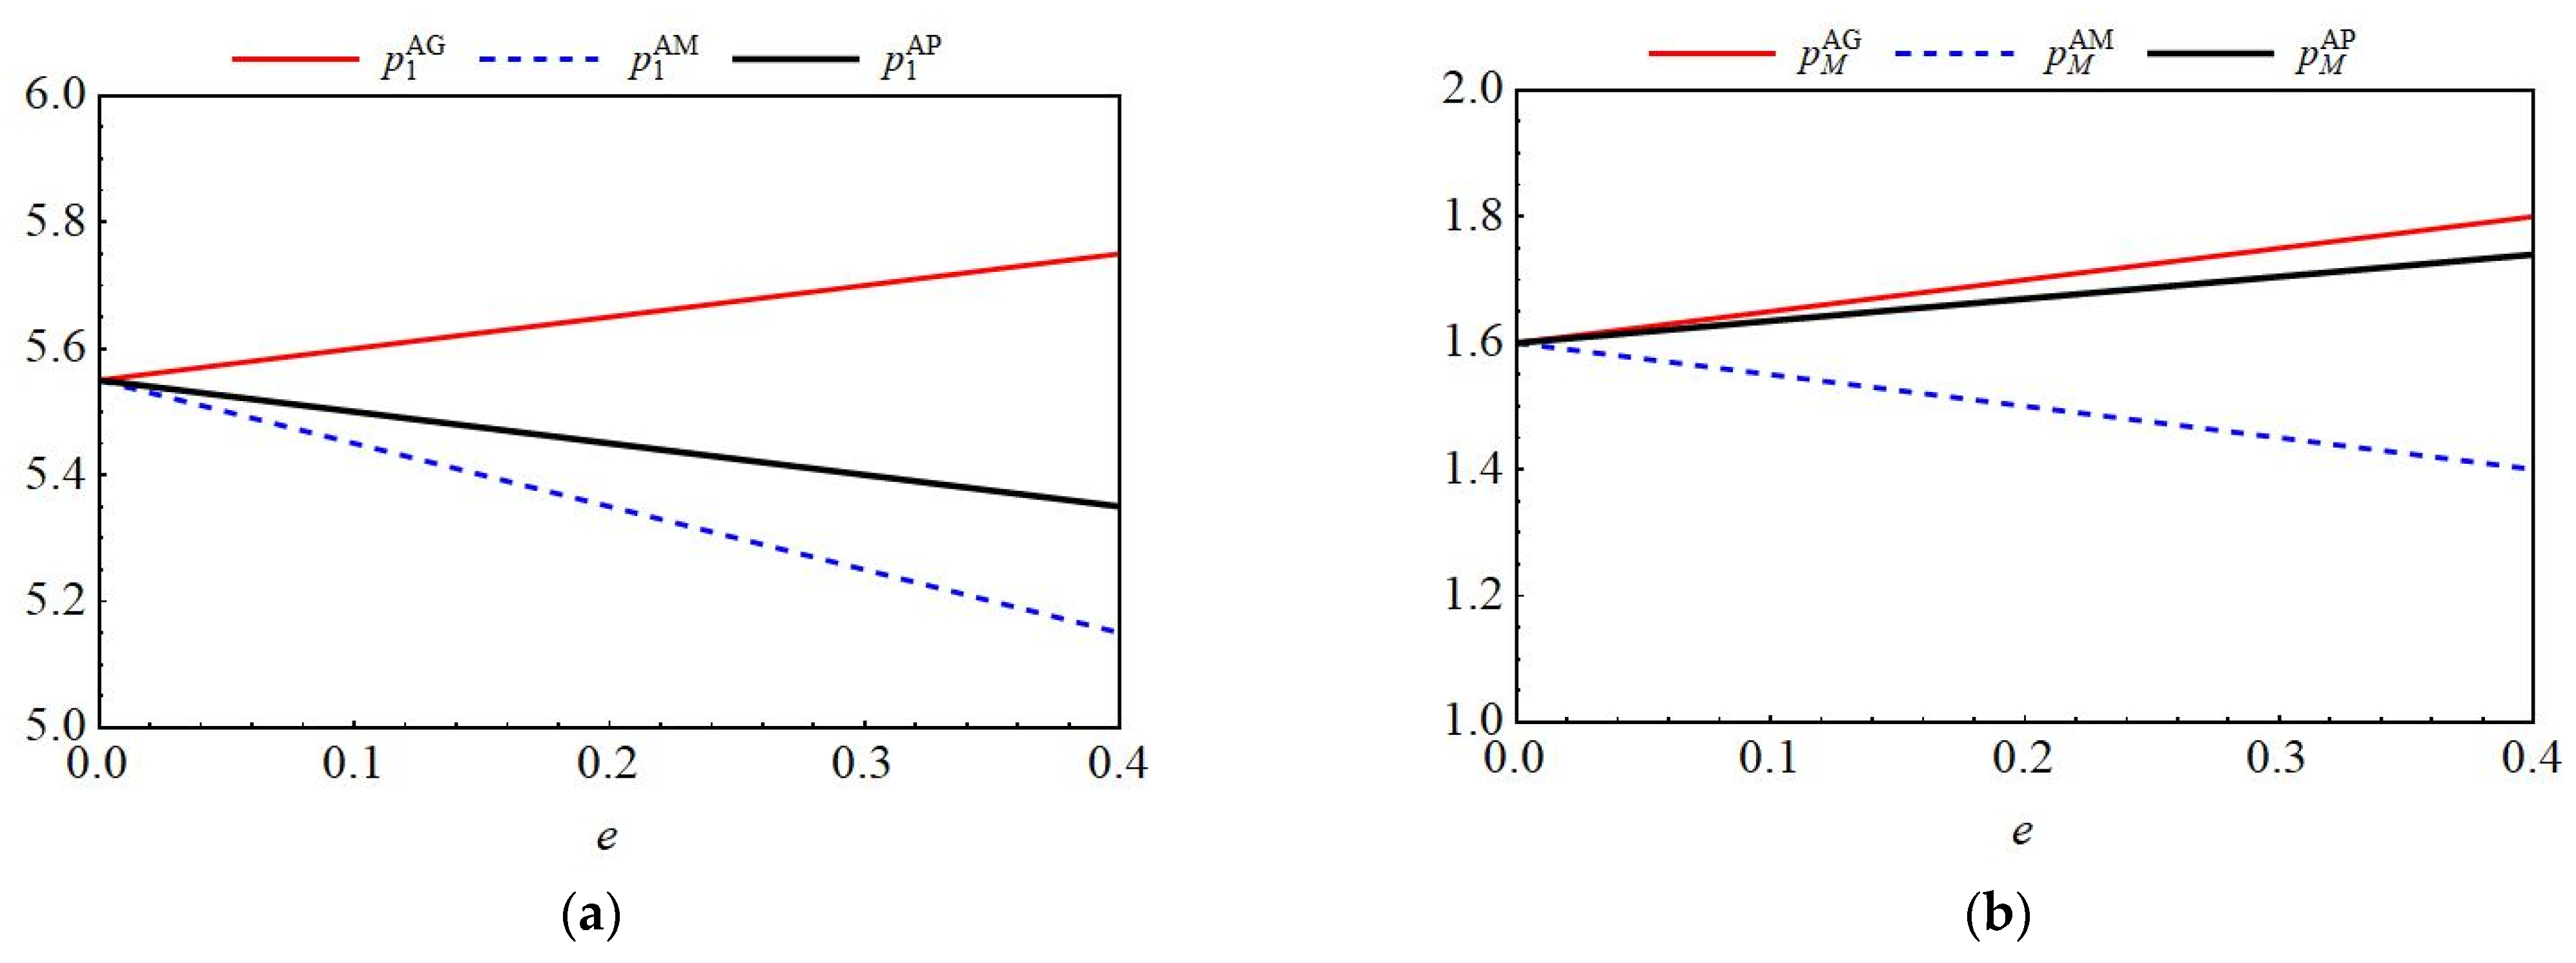
To validate the impact of the key parameter e on the relationship between retail price and recycling price under the online platform agency recycling model, this section establishes w = 0.7 , d 0 = 10 , μ 2 = 0.4 ,   σ = 0.7 , θ = 0.7 . The specific simulation results are shown in Figure 4.
As shown in Figure 4, (1) under the AG model, retail prices increase significantly with higher deposit amounts, as the deposit collected by the government becomes an additional cost for manufacturers. Manufacturers pass on this cost to online platforms by raising wholesale prices. To maintain profits, platforms then increase retail prices, ultimately shifting this cost burden to consumers. (2) In both AP and AM models, the deposit is collected directly from consumers by a specific member of the supply chain. This increases consumers’ total purchase cost, thereby suppressing market demand. To counteract this demand-suppressing effect, manufacturers have a strong incentive to lower retail prices to stimulate sales volume. (3) For manufacturers, the AG line remains consistently high, indicating that they adopt strategies of both high retail prices and high buyback prices. Under the AM model, however, they adopt strategies of low retail prices and low buyback prices. This demonstrates that manufacturers can either offset buyback costs by raising retail prices or ensure collection rates to avoid deposit losses by increasing buyback prices. The above findings validate the conclusions of Corollary 2 and 3. Therefore, governments should avoid a one-size-fits-all deposit amount. Deposits are a double-edged sword: while increasing e may heighten pressure on all parties, it also directly inflates product retail prices (especially under the AG model). Governments should scientifically establish differentiated, dynamic deposit standards based on battery value, consumer affordability, and target recycling rates.

6.1.3. The Impact of Key Parameters on Optimal Profit for Different Entities

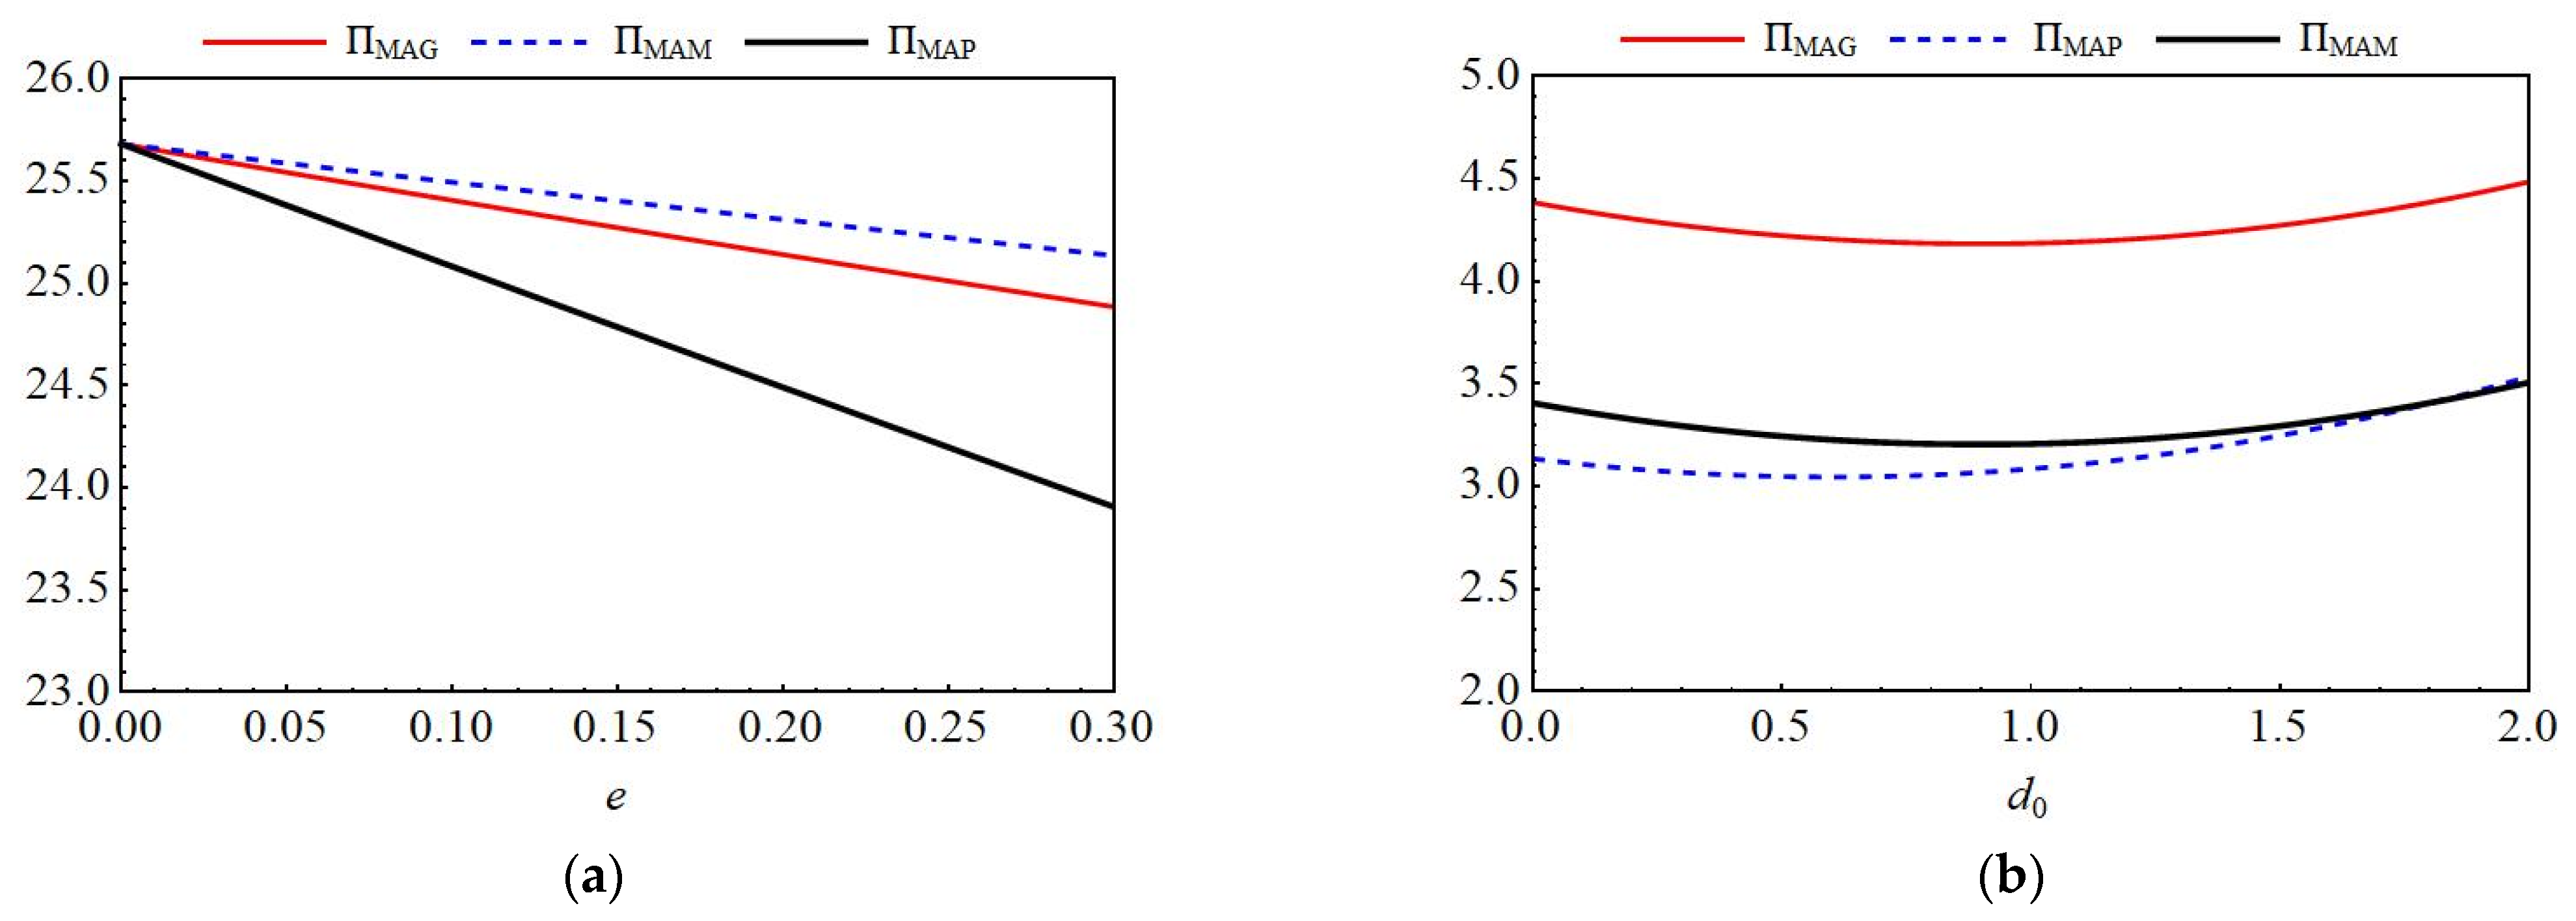
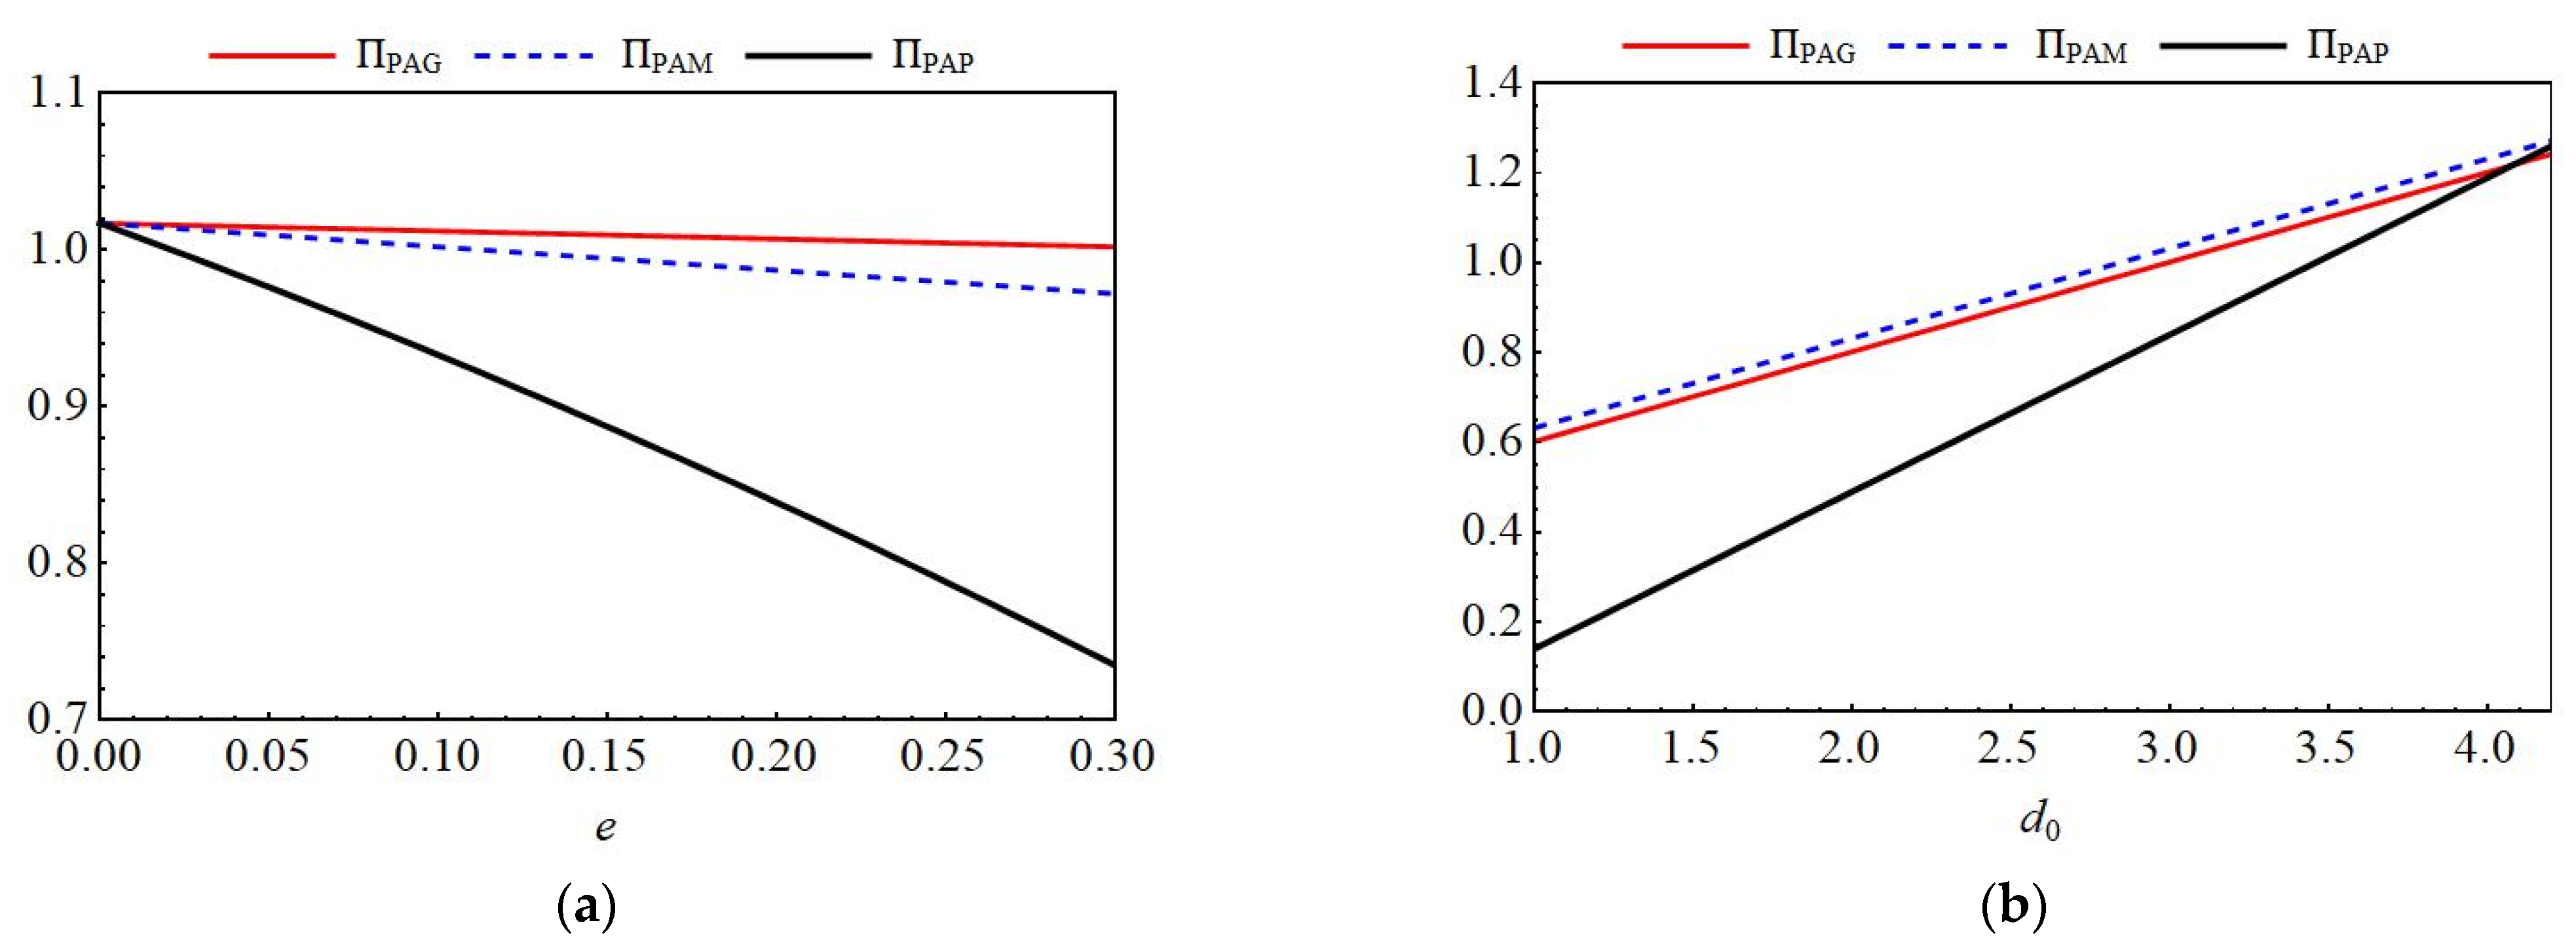
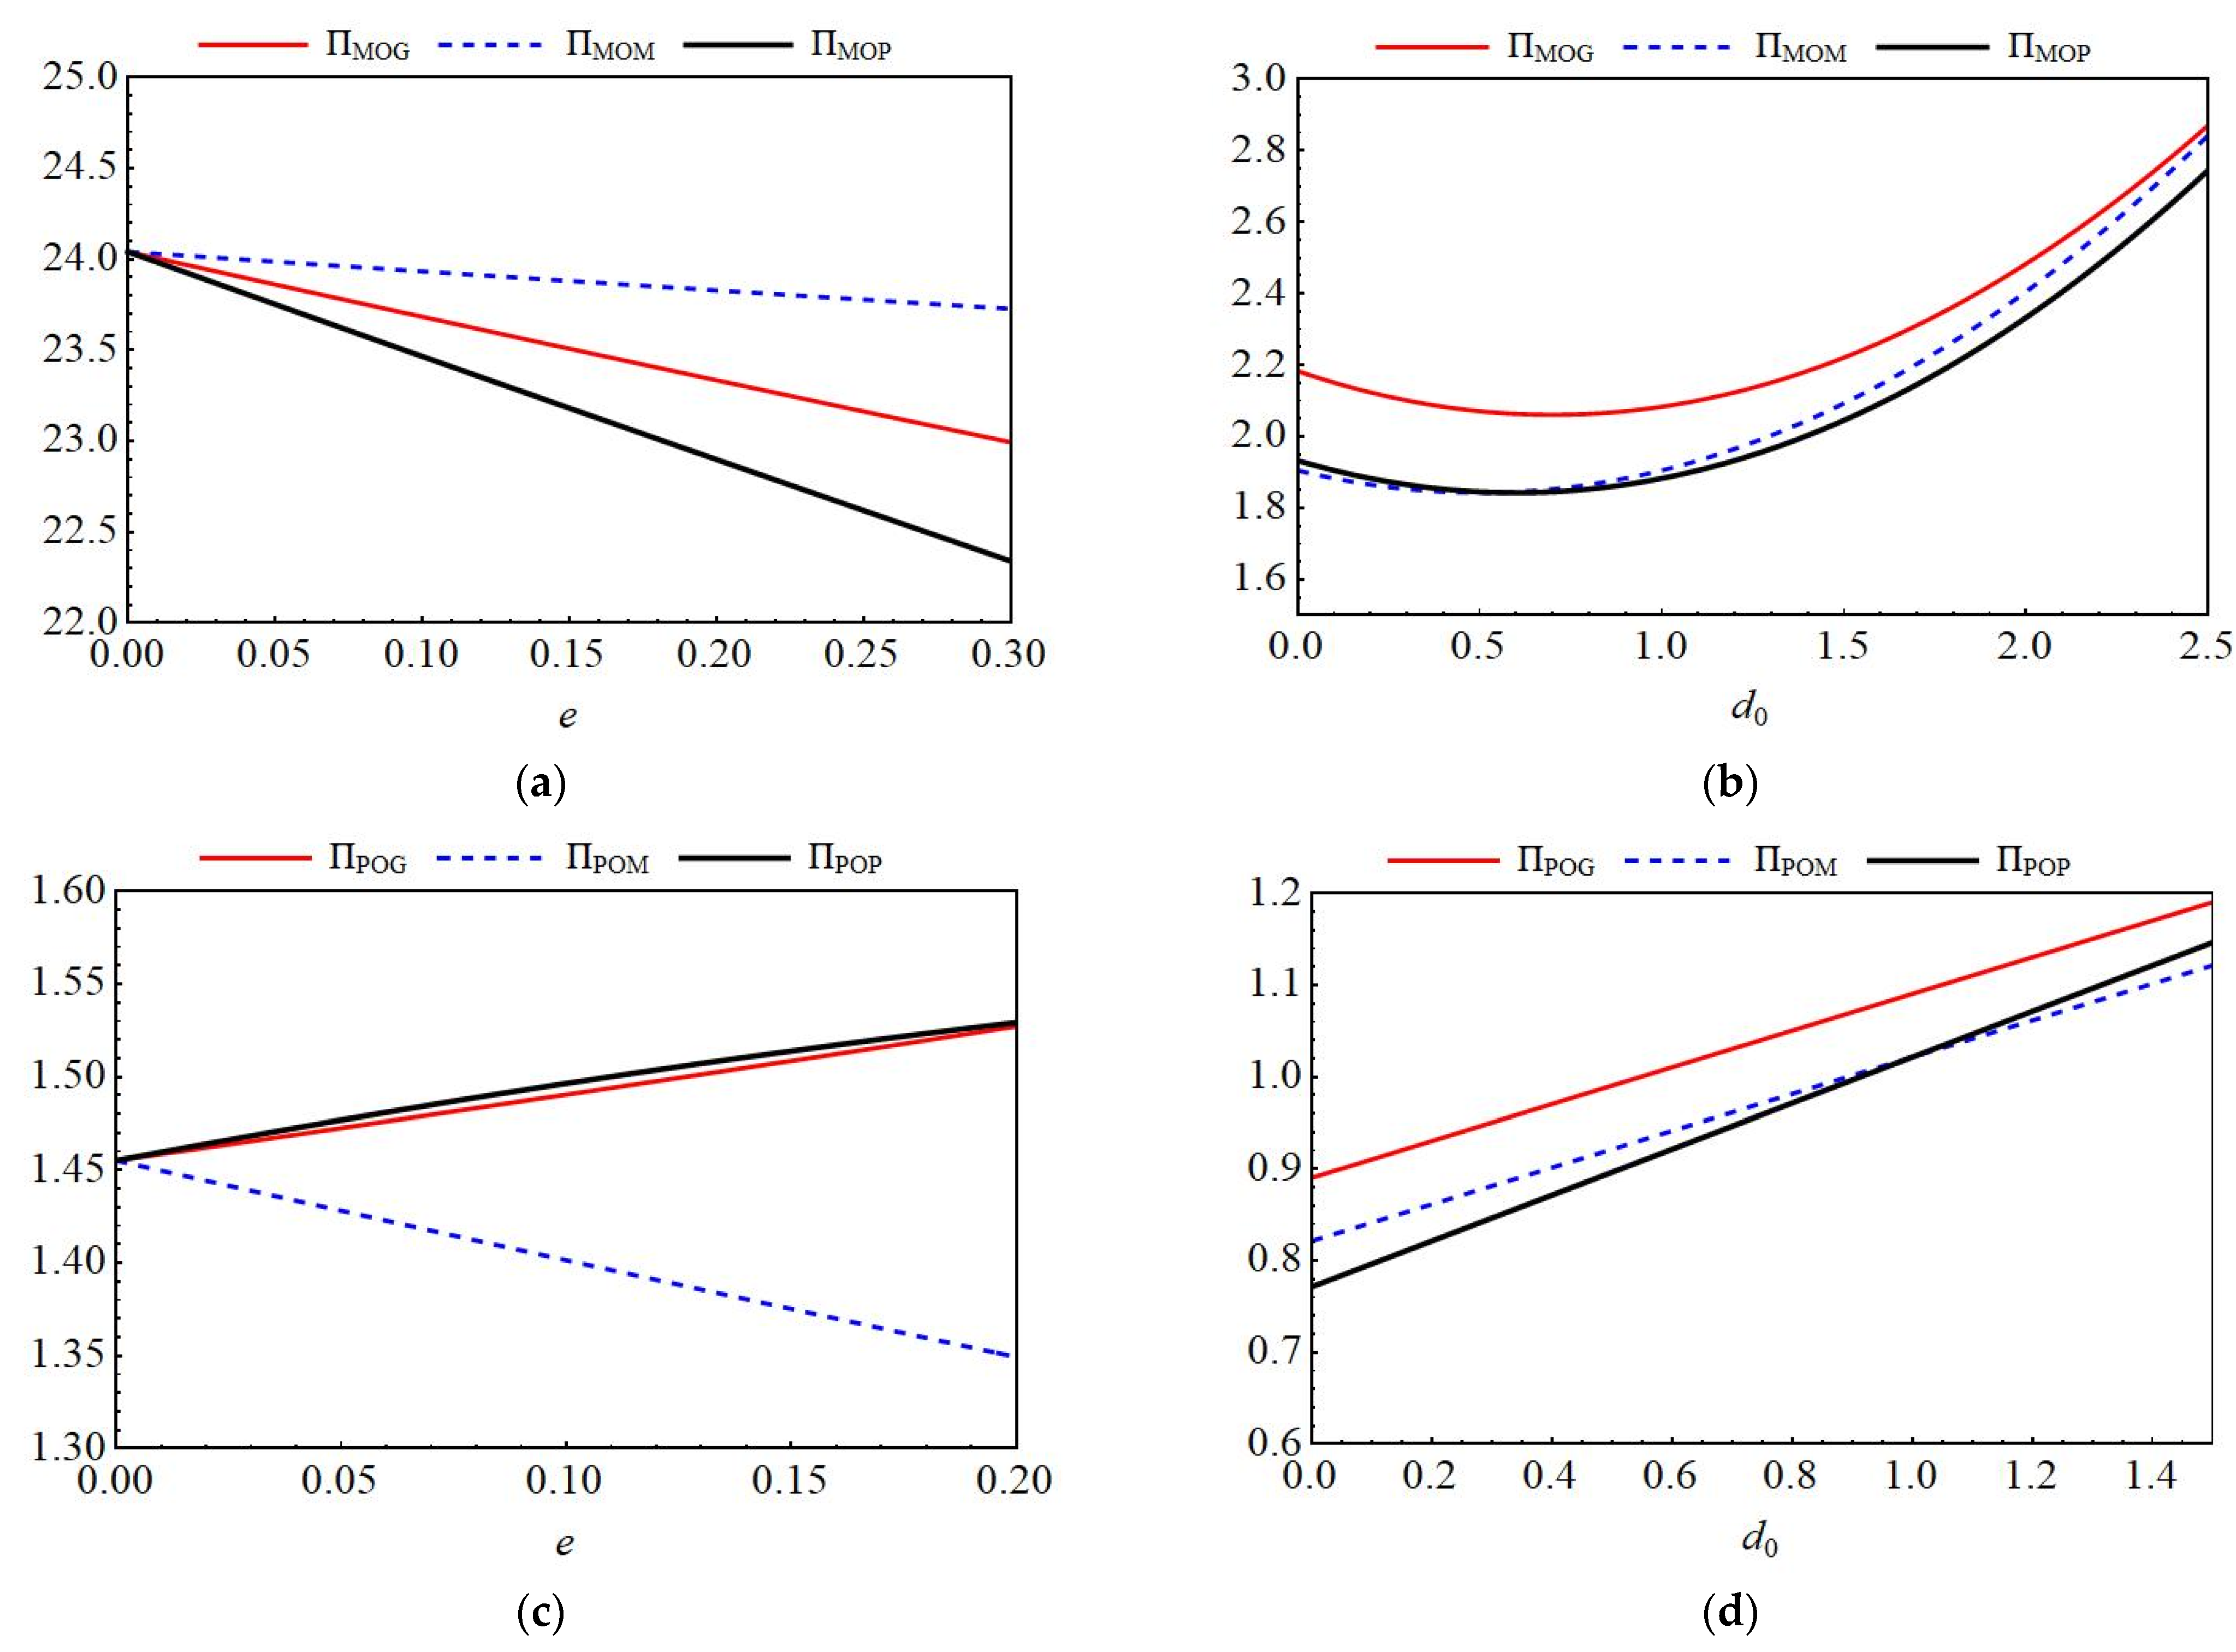
To validate the impact of key parameters e and d 0 on the profits of manufacturers and online platforms under three agency recycling models, this section establishes d 0 = 10  for Figure 5a, d 0 = 3 for Figure 6a, and w = 0.2 , θ = 0.7 , e = 0.3 , μ 2 = 0.3 , σ = 0.7 . The specific simulation results are shown in Figure 5 and Figure 6.
As shown in Figure 5, (1) in the AG model, when e increases, the manufacturer’s operating costs rise directly. To maintain profits, manufacturers must raise retail prices to pass on these costs. However, excessively high prices deter consumers, leading to declining sales. Thus, the increased costs from e cannot be fully passed on. Under the AM model, when e increases, consumers’ total expenditure on batteries (retail price + deposit) rises. This suppresses consumer willingness to purchase batteries, causing market demand to shrink and sales to fall. Under the AP model, an increase in e causes market contraction, leading to a significant decline in the manufacturer’s sales volume. Consequently, their sales revenue and profits plummet. However, they cannot respond by adjusting their deposit policy and remain entirely passive. Therefore, manufacturers under the AP model are most sensitive to increases in e and experience the most severe declines. This is because manufacturers bear all the consequences of market contraction without receiving any deposit revenue. (2) As the market’s total potential demand increases, manufacturers under the AG model consistently achieve the highest profits. This demonstrates that when government deposits raise manufacturers’ costs, this compels manufacturers to adopt a “high retail price, high recycling price” strategy to mitigate this disadvantage. This validates the conclusion of Corollary 4. Consequently, manufacturers should tailor their deposit negotiation and response strategies to specific models and select models based on market prospects.
As shown in Figure 6, (1) under the AG mode, when the increase in e is modest, the growth in recycling fees may not fully offset the loss in sales commissions. Consequently, in many cases, the platform’s profit tends to decline or remain flat. Under the AM mode, manufacturers charging consumers a deposit e similarly suppresses market demand, leading to a drop in sales volume d. Under the AP mode, profit declines most sharply as e increases, as this is the most direct model. The platform itself collects the deposit e from consumers, which directly raises the purchase threshold for consumers and most strongly suppresses purchasing intent. (2) The AM curve consistently leads, indicating AM as the preferred model. When market demand is insufficient, avoiding direct consumer deposits is a key platform strategy. Following market expansion, the platform’s profit logic shifts: the deposit’s deterrent effect on consumers weakens, while the deposit income effect under the AP model is significantly amplified. Combined with increased commission income, total profits rapidly rise, surpassing the AG model. This validates the conclusion of Corollary 5. Therefore, platforms should favor the AM or AG models. While the AP model appears to generate deposit income, it falls into an “incentive trap.” Collecting deposits suppresses demand. More critically, it undermines the platform’s motivation to invest in and enhance service capabilities (with blockchain requiring minimal investment), severely damaging core competitiveness and profit foundations in the long term.

6.2. Numerical Analysis of a Closed-Loop Supply Chain for Power Batteries Under Online Platform-Commissioned Recycling Model

6.2.1. Impact of Key Parameters on Blockchain Investment Levels

To validate the impact of key parameters σ , e , and θ on blockchain investment level x under the online platform-commissioned recycling model, this section establishes the following: μ 2 = 0.3 ,   θ = 0.7 , σ = 0.5 , e =   0.2 for Figure 7a, and e =   0.1 for Figure 7c. The specific simulation results are shown in Figure 7.
As shown in Figure 7, (1) the blockchain investment levels under OM and OP modes are consistent because platforms consider marginal revenue and marginal cost when making decisions. Regardless of who collects the deposit, if the platform can freely optimize the recycling rate, the marginal revenue and marginal cost functions are identical under both modes. (2) An increase in σ signifies improved “output efficiency” of blockchain investment. Platforms in all modes are willing to increase investment. Under the OG mode, bolstered by the existing high commission μ 2 , the revenue amplification effect from high σ is more pronounced, resulting in a significantly larger increase than in other modes. An increase in θ indicates higher blockchain investment costs (cost function: ½θx2). As marginal costs rise, platforms reduce investment to optimize profits, causing blockchain investment levels to decrease with θ . Under the OG model, blockchain investment increases with deposit amounts. Since governments collect deposits from manufacturers, manufacturers have strong incentives to boost recycling rates to avoid deposit losses or secure refunds. Consequently, they are willing to pay platforms higher recycling commissions. Platforms respond to this incentive by increasing blockchain investment to elevate recycling volumes, thereby securing greater commission income. Under the OM/OP model, blockchain investment decreases as deposits decline. Since deposit systems charge consumers directly, they incentivize voluntary recycling. Consequently, manufacturers or online platforms can reduce investment to control costs. (3) Under the OG model, manufacturers pay higher commissions due to the pressure from the deposit, giving platforms stronger incentives to increase investment. While investment also rises under the OM/OP models, the OG model’s incentive amplification effect is more pronounced, widening the gap. Under the OG model, despite manufacturers offering high commission incentives, high costs weaken platforms’ willingness to increase investment. Under the OM/OP model, the reduction in investment is relatively smaller. Increased costs diminish the investment advantage of the OG model, narrowing the gap between the two. Under the OG model, the government collects a deposit e from manufacturers. To minimize losses, manufacturers are willing to pay higher recycling commissions μ 2 to the platform, thereby incentivizing increased blockchain investment. Under the OM/OP model, the deposit is collected either by the manufacturer or the platform but does not directly influence the platform’s investment decisions, thus widening the gap between the two models. This explanation validates Corollary 6. It is evident that the party collecting the deposit determines both the source and intensity of incentives for technological investment. Managers should not view technological investment decisions in isolation but should consider them holistically within the overall business model and supply chain rules, particularly regarding the party collecting the deposit.

6.2.2. The Impact of Key Parameters on Price Decision-Making Among Different Entities

To validate the impact of the key parameter e on the relationship between retail price and recycling price under the online platform-commissioned recycling model, this section establishes w = 0.7 , d 0 = 10 ,   μ 2 = 0.3 , σ = 0.5 , θ = 0.7 . The specific simulation results are shown in Figure 8.
As shown in Figure 8, (1) in the OG model, the deposit e represents a direct cost imposed by the government on manufacturers. As the direct bearers of this cost, manufacturers pass on 100% of the deposit expense to downstream entities by raising wholesale prices to platforms. Under the OP model, charging deposits suppresses market demand. To balance this suppression effect, platforms do not pass on the full deposit cost to consumers when setting retail prices, but rather, only half. In the OM model, manufacturers collect the deposits. To encourage consumer acceptance of this deposit system and stimulate sales, manufacturers have an incentive to set the lowest possible retail price as a marketing or compensation strategy. (2) OG and OP models: Under both models, manufacturers do not directly collect deposits from consumers but instead face pressure to achieve high recycling rates. Consequently, manufacturers have strong incentives to set higher buyback prices to incentivize collection channels and ensure sufficient recycling volumes. OM model: Manufacturers collect deposits themselves. The deposit system itself already strongly incentivizes consumers to recycle to reclaim their deposits. Consequently, manufacturers can obtain sufficient recycling volumes without paying high buyback prices, making p M O M the lowest price. (3) Only under the OG mode does an increase in e directly translate into stronger commission incentives for manufacturers on the platform. In response to these incentives, the platform further raises the recycling price p O O G to recover more batteries, thereby maximizing profits. The above explanation validates Corollary 7–9. Evidently, government pressure (via e ) is most effectively channeled into manufacturer pressure under the OG model, which then translates into high commission incentives for the platform. This ultimately manifests as high buyback prices for the platform and high efficiency across the entire system.

6.2.3. The Impact of Key Parameters on Optimal Profit for Different Entities

To validate the impact of key parameters e and d 0 on the profits of manufacturers and online platforms under three commissioned models, this section establishes d 0 = 10   f o r Figure 9a, d 0 = 3   f o r Figure 9c, w = 0.2 , θ = 0.7 , μ 2 = 0.3 , σ = 0.5 ,   e = 0.1 . The specific simulation results are shown in Figure 9.
As shown in Figure 9, (1) in any O-series model, increasing deposits is unfavorable news as it invariably undermines the market’s fundamental base. From a deposit perspective, the optimal choice for manufacturers is the OM model, as it grants control over deposits, transforming them from a cost or risk into a controllable strategic tool. Manufacturers should strenuously avoid the OP model, as it not only strips them of influence over market demand but also imposes high costs at the recycling stage. (2) When market demand is low, under the OG model, high government deposits compel manufacturers to adopt high-price, high-refund strategies. Despite higher costs, this best safeguards unit profit and recycling volume, yielding the highest profits. The OP model performs second best. The OM model performs the worst, as its low-price strategy cannot compensate for low demand through volume, severely squeezing profit margins. (3) For online platforms, within a structure that holds pricing power for recycling, it is essential to ensure a corresponding revenue stream. This can be achieved either by collecting deposits directly (OP model) or by partnering with entities offering high commission incentives (OG model). It is imperative to avoid the pitfalls of the OM model, where pricing power exists without commensurate economic incentives, leaving the platform passively exposed to market demand contraction stemming from deposit requirements. (4) During market downturns, the high recycling commissions paid by manufacturers under the OG model become a stable and reliable “minimum guaranteed income” for the platform, yielding the highest profits. OM model profits rank second, as recycling volumes still have basic safeguards. The OP model performs the worst; the platform’s own deposit collection severely suppresses demand, causing commission income to plummet, which cannot be compensated for by deposit income. After demand recovers, the demand-suppressing effect of deposits under the OP model weakens, and the platform’s deposit income becomes substantial, surpassing the OM model in profits. However, the OG model remains the most profitable due to its stable high commission incentives. The OM model consistently yields the lowest profits due to the absence of additional revenue (no deposits) and potential commission pressure from manufacturers. The above findings validate Corollary 10–11. Therefore, manufacturers should select models based on market conditions. The OG model represents the most platform-friendly and lowest-risk approach.

6.3. Comparative Analysis of Decision-Making in Closed-Loop Supply Chains for Power Batteries Under Two Recycling Models

To validate the impact of the key parameter e on blockchain investment levels and the profits of manufacturers and online platforms across six research scenarios, the following conditions were established: σ = 0.5 ,   μ 2 = 0.3 ,   θ = 0.7 ,   w = 0.2 ,   d 0 = 10   f o r  Figure 10 ,   d 0 = 3   f o r  Figure 10c. The specific simulation results are shown in Figure 10.
Figure 10 shows that (1) the OG line consistently remains at the highest level. From the perspectives of platforms, manufacturers, and governments alike, if the goal is to maximize the technological sophistication and transparency of the supply chain, the OG model stands as the sole optimal choice in the long term. Meanwhile, the AP line consistently remains at the lowest level. The fundamental difference between the two lies in whether the online platform possesses pricing power, which leads to diametrically opposed trajectories in their technological investment. This demonstrates that a platform’s market power is a prerequisite for incentivizing its technological innovation. (2) The increase in e has simultaneously reduced manufacturers’ sales volume and raised their unit costs. Under this dual pressure, manufacturers’ profits show a declining trend across all models. Furthermore, under the joint determination of the deposit collector and the supply chain power structure, AM achieves the optimal outcome while OP faces the worst. (3) Under the OP mode, the deposit e directly enters the platform’s revenue stream. As e increases, the platform’s direct revenue increases linearly. While collecting deposits may suppress recycling willingness, the platform possesses the powerful tool of recycling pricing authority. It can compensate consumers by raising recycling prices, thereby offsetting the suppression effect of deposits and maintaining or even boosting recycling volumes. Thus, the platform enjoys the revenue from e increases without any concerns.

7. Discussions

This study provides important insights into the effectiveness of the closed-loop supply chain for power batteries by analyzing the deposit system and the attribution of platform pricing power from both theoretical and practical perspectives. After synthesizing all theoretical findings and simulation results, Table 4 clearly presents which models (AG, AM, AP, OG, OM, OP) perform best under different conditions.
Based on our research findings, we provide the following management insights for different stakeholders: (1) For governments, the core policy objective should be to incentivize investment in blockchain technology and enhance supply chain efficiency. Specifically, governments should adopt the OG model, establishing clear producer responsibility by charging manufacturers a deposit while ensuring online platforms retain pricing authority in the recycling phase. (2) For battery manufacturers, the AM model—where manufacturers collect deposits directly from consumers—generates the most substantial profit returns in most market scenarios. When only OG/OM/OP collaborative models are available, manufacturers must thoroughly evaluate each model’s long-term impact on their profitability. If policy constraints necessitate the AG model (government-collected deposits), manufacturers can reasonably pass on these additional costs by appropriately raising product prices. (3) For online platforms, the OG model under the commission model maximizes profits through high commission recycling rates and pricing power. Although the OP model provides both pricing power and deposit income, this business approach holds significant profit growth potential during market booms, albeit with the risk of demand suppression.

8. Conclusions

This paper constructs a supply chain game model involving battery manufacturers and online recycling platforms, focusing on the critical process of power battery recycling. The study aims to examine the impact of two key factors—the deposit refund system and blockchain technology investment—on both parties within the supply chain. First, the supply chain structure is divided into two fundamental scenarios: one where the online platform operates as an agent (AG, AM, AP), and another where the platform holds pricing authority for recycling (OG, OM, OP). By systematically comparing the pricing strategies, technology investment levels, and profit distribution mechanisms of each participant across these models, this paper seeks to answer the following core questions: Under different power distributions, which party should collect the deposit? How should supply chain power be allocated to most effectively incentivize blockchain technology investment, enhance supply chain operational efficiency, and achieve synergistic optimization of all parties’ interests?
Through deduction and simulation verification of a series of propositions, this paper draws the following comprehensive conclusions: (1) If an online platform possesses pricing power over returns, this directly alters the incentive effects of deposit policies. When platforms lack pricing authority (AG/AM/AP), their blockchain investment levels tend to be passive and conservative. Conversely, when platforms hold pricing authority (OG/OM/OP), the OG model provides the strongest investment incentives. On one hand, government deposits collected from manufacturers create policy pressure; on the other, manufacturers increase platform recycling commissions to protect their own interests. Driven by both pricing authority and revenue growth, platforms naturally increase technological investment. (2) The target of deposits influences pricing behavior. When deposits become a cost for one party, pricing becomes a tool to shift pressure. Conversely, when deposits can be converted into revenue (e.g., manufacturers directly collecting deposits from consumers in the AM model), pricing strategies shift toward competitive pricing to capture market share. (3) To maximize blockchain technology investment, online platforms must strive to regain pricing power. Governments should adopt policies requiring manufacturers to collect deposits (G model), thereby promoting the OG collaborative model.
This research can be extended in several directions. First, the results are derived under linear demand and collection functions, as well as the parameter assumptions stated in Section 3. While these assumptions are common in the literature and allow for tractable analysis, they define the boundary of our findings. Future considerations may include alternative functional forms, uncertain demand and recycling. Second, the model focuses on a bilateral monopoly structure involving a single manufacturer and a single platform. However, actual markets feature multi-party competition. Future research could further explore scenarios where multiple online platforms compete for manufacturer representation rights, or where multiple manufacturer brands sell on the same platform. Furthermore, this study primarily examines the deposit system as a single policy tool. In practice, governments often adopt policy combinations, such as integrating deposit systems with recycling subsidies, carbon quotas, and other measures. Future research could develop models incorporating multiple policy tools to provide more refined policy design recommendations for relevant stakeholders.
Additionally, this study exhibits significant limitations in its exploration of blockchain technology solutions. The analysis focuses almost exclusively on technical investment cost parameters within the model. It overlooks more critical structural flaws and implementation barriers in real-world applications, including technical obstacles and inherent architectural rigidity. These include technical and implementation obstacles, as well as inherent architectural rigidity. Future research should incorporate these deficiencies of blockchain technology into its modeling framework.

Author Contributions

Conceptualization, C.J.; methodology, C.J. and Y.C.; software, Y.C.; validation, C.J. and Y.C.; formal analysis, Y.C.; investigation, Y.C.; data curation, Z.W.; writing—original draft preparation, Y.C.; writing—review and editing, C.J.; supervision, C.J.; project administration, C.J.; funding acquisition, C.J. All authors have read and agreed to the published version of the manuscript.

Funding

This research was funded by the General Program of the National Social Science Foundation of China (No. 24BGL218).

Data Availability Statement

Data will be made available on request.

Conflicts of Interest

The authors declare no conflicts of interest.

Appendix A

All results below are derived using reverse induction. The solution process for Proposition 1 is as follows: First, it is straightforward to prove that 2 Π A G P 2 x = θ < 0 . Subsequently, applying the first-order optimality condition ( Π A G P x = 0 ) yields x A G = σ μ 2 θ . Next, substituting x A G = σ μ 2 θ into Equation (1) yields the second-order Hessian matrix of Π A G M with respect to p 1 A G and p M A G as
H = 2 0 0 2
The first-order principal sub determinant H1 of the Hessian matrix is easily computed as H 1 = 2 < 0 , and the second-order principal sub determinant is H 2 = 4 > 0 . Therefore, Π A G M is a strictly concave function with respect to p 1 A G and p M A G , and can thus be solved to obtain p 1 A G * = 1 2 ( e + w + d 0 + μ 1 ) , p M A G = θ ( e + u ( 1 + β ) + β V 1 ( 1 + β ) V 2 ) ( θ + σ 2 ) μ 2 2 θ . Finally, substituting p 1 A G * and p M A G into the profit function in Equation (1) yields the optimal profit. Proposition 1 is hereby proven.
The solution process for Proposition 4 is as follows: the second-order Hessian matrix of Π O G P with respect to x O G    and  Π O G P is expressed as
H = 2 σ σ θ
The first-order principal sub determinant H1 of the Hessian matrix is easily computed as H 1 = 2 < 0 , and the second-order principal sub determinant is H 2 = 2 θ σ 2 . Therefore, when 2 θ > σ 2 , Π O G P is a strictly concave function with respect to x O G and p O O G , and thus can be solved to obtain x O G = σ p M 2 θ σ 2 , p O O G = ( θ σ 2 ) p M 2 θ σ 2 . Then, substituting x O G and p O O G into the profit function, the second-order Hessian matrix of Π O G M with respect to p 1 O G    and  p M O G can be expressed as
H = 2 0 0 2 θ 2 θ + σ 2
The first-order principal sub determinant H1 of the Hessian matrix is easily computed as H 1 = 2 < 0 , and the second-order principal sub determinant is H 2 = 4 θ 2 θ + σ 2 . Therefore, when 2 θ > σ 2 , Π O G M is a strictly concave function with respect to p 1 O G and p M O G , and thus can be solved to obtain p 1 O G * = 1 2 ( e + w + d 0 + μ 1 ) , p M O G * = 1 2 ( e + ( 1 + β ) u + β V 1 ( 1 + β ) V 2 μ 2 ) . Finally, substituting p 1 O G * and p M O G * into the profit function, x O G * and p O O G * yields the optimal profit. Proposition 4 is hereby proven.

Appendix B

Solving for the equilibrium solution x A G in Proposition 1 yields the following first-order derivatives with respect to σ , μ 2 and θ :
x A G σ = μ 2 θ > 0
x A G μ 2 = σ θ > 0
x A G θ = σ μ 2 θ 2 < 0
Therefore, it is demonstrated that x A G increases with σ and μ 2 , and decreases with θ . Following a similar derivation process to that of x A G , the first-order derivatives of the equilibrium solution p 1 A G in Proposition 1 with respect to e , w , d 0 and μ 1 are as follows:
p 1 A G e = p 1 A G w = p 1 A G d 0 = p 1 A G μ 1 = 1 2 > 0
Therefore, it is demonstrated that p 1 A G increases with e , w ,   d 0 and μ 1 , the first-order derivatives of the equilibrium solution p 1 A G in Proposition 1 with respect to θ , σ , u , μ 2    and  β are as follows:
p M A G θ = σ 2 μ 2 2 θ 2 > 0
p M A G σ = σ μ 2 θ < 0
p M A G u = 1 2 ( 1 + β ) < 0
p M A G μ 2 = θ + σ 2 2 θ < 0
p M A G β = 1 2 ( u + V 1 V 2 )
When V 1 > V 2 u , p M A G β > 0 ; otherwise p M A G β < 0 . Therefore, p M A G increases with θ , decreases with σ , u , μ 2 . When V 1 > V 2 u , p M A G increases with β , otherwise, decreases with β . Theorem 1 is hereby proven.

Appendix C

Proof for Corollary 1. 
x A G = x A M = σ μ 2 θ > 0 , x A G x A M x A P = σ μ 2 θ σ e + μ 2 θ = e σ θ > 0 . □
Proof for Corollary 2. 
p 1 A G p 1 A P = e 2 > 0 , p 1 A P p 1 A M = e 2 > 0 . □
Proof for Corollary 3. 
p M A G p 1 A M = e > 0 , p M A P p 1 A M = e θ + σ 2 2 θ > 0 , p M A G p M A P = e θ σ 2 2 θ . When θ σ 2 , p M A G p M A P 0 ; conversely, p M A P p M A G > 0 . □
Proof for Corollary 4. 
Π M A G Π M A M = 1 4 e ( e + 2 w + 4 u ( 1 + β ) 2 d 0 + 4 β V 1 4 ( 1 + β ) V 2 + 2 μ 1 + 4 ( θ + σ 2 ) μ 2 θ ) , thus, when d 0 e 2 + w + 2 u β + 2 β V 1 + μ 1 + 2 σ 2 μ 2 θ 2 ( u + ( 1 + β ) V 2 + μ 2 ) , Π M A G Π M A M 0 , Furthermore, Π M A M Π M A P =   e ( 2 w θ 2 e σ 4 2 u ( 1 + β ) θ ( θ σ 2 ) + 2 θ ( θ d 0 ( θ σ 2 ) ( β V 1 ( 1 + β ) V 2 ) θ μ 1 ) + 2 ( θ σ 2 ) 2 μ 2 ) 4 θ 2 , When d 0 > = 2 w θ 2 + e σ 4 + 2 u ( 1 + β ) θ ( θ σ 2 ) + 2 θ ( ( θ σ 2 ) ( β V 1 ( 1 + β ) V 2 ) + θ μ 1 ) 2 ( θ σ 2 ) 2 μ 2 2 θ 2 , Π M A M Π M A P 0 , Π M A G Π M A M Π M A P . □
Proof for Corollary 5. 
Π P A M Π P A G = e μ 1 2 e μ 2 , When μ 1 2 μ 2 , Π P A M Π P A G 0 . Π P A G Π P A P = 1 2 e ( e + w + u ( 1 + β ) d 0 + β V 1 ( 1 + β ) V 2 + μ 1 ) . When  e + w + 1 β V 2 u + β V 1 + μ 1 d 0   ,   Π P A G Π P A P 0 . □
Proof for Corollary 6. 
x O M = x O P = σ e + u β u β V 1 + 1 + β V 2 + μ 2 4 θ 2 σ 2 , x O G x O M x O P = σ e + 1 + β u + β V 1 1 + β V 2 μ 2 4 θ 2 σ 2 + σ e + u β u β V 1 + 1 + β V 2 + μ 2 4 θ 2 σ 2 = e σ 2 θ σ 2 > 0 . □
Proof for Corollary 7. 
p 1 O G p 1 O P = e > 0 , p 1 O P p 1 O M = e 2 > 0 . □
Proof for Corollary 8. 
p M O G = p M O P = 1 2 ( e + ( 1 + β ) u + β V 1 ( 1 + β ) V 2 μ 2 ) , p M O G p M O P p M O M = e > 0 . □
Proof for Corollary 9. 
p O O M = p O O P = 1 2 ( e + ( 1 + β ) u + β V 1 ( 1 + β ) V 2 μ 2 ) ,  p O O G p O O M p O O P = θ σ 2 e + 1 + β u + β V 1 1 + β V 2 μ 2 4 θ 2 σ 2 + θ σ 2 e + u β u β V 1 + 1 + β V 2 + μ 2 4 θ 2 σ 2 = e ( θ σ 2 ) 2 θ σ 2 > 0 . □
Proof for Corollary 10. 
Π M O G Π M O M = e ( 2 θ ( e + 2 w + 2 ( 1 + β ) μ ) ( e + 2 w ) σ 2 + 2 ( 2 θ + σ 2 ) d 0 + 4 β θ V 1 + 4 θ V 2 4 β θ V 2 + 4 θ μ 1 2 σ 2 μ 1 4 θ μ 2 ) 8 θ 4 σ 2 , thus, when d 0 2 θ ( e + 2 w + 2 ( 1 + β ) μ ) ( e + 2 w ) σ 2 + 4 β θ V 1 4 ( 1 + β ) θ V 2 + 4 θ μ 1 2 σ 2 μ 1 4 θ μ 2 4 θ 2 σ 2 , Π M O G Π M O M 0 . Π M O M Π M O P = 1 4 e ( e + 2 w 2 d 0 + 2 μ 1 ) , When d 0 e + 2 w + 2 μ 1 2 , Π M O M Π M O P 0 , Π M O G Π M O M Π M O P . Conversely, When d 0 < e + 2 w + 2 μ 1 2 , Π M O M Π M O P 0 , thus Π M O M Π M O P 0 . □
Proof for Corollary 11. 
Π P O G Π P O M = e 1 + β θ u + β θ V 1 + θ β θ V 2 4 θ μ 1 + 2 σ 2 μ 1 θ μ 2 4 θ 2 σ 2 > 0 , Π P O G Π P O P = e ( 2 ( e + w ) θ + ( 1 + β ) θ μ ( e + w ) σ 2 + ( 2 θ + σ 2 ) d 0 + β θ V 1 + θ V 2 β θ V 2 + 2 θ μ 1 σ 2 μ 1 θ μ 2 ) 4 θ 2 σ 2 . When d 0 2 w θ θ u + β θ u w σ 2 + β θ V 1 θ ( ( 1 + β ) V 2 + μ 2 ) 2 θ σ 2 ,   Π P O G Π P O P 0 . Π P O P Π P O M = 1 2 e ( w d 0 + 2 μ 1 ) , When d 0 w + 2 μ 1 , Π P O P Π P O M 0 .  Conversely, d 0 < w + 2 μ 1 ,   Π P O P Π P O M < 0 . □

References

  1. Xiao, M.; Xu, C.; Xie, F. Research on the impact of information sharing and government subsidy on competitive power battery recycling. J. Clean. Prod. 2024, 467, 142989. [Google Scholar] [CrossRef]
  2. Du, J.; Li, Q.; Qiao, F. Estimation of vehicle emission on mainline freeway under isolated and integrated ramp metering strategies. Environ. Eng. Manag. J. 2018, 17, 1237–1248. [Google Scholar] [CrossRef]
  3. Richa, K.; Babbitt, C.W.; Gaustad, G. Eco-efficiency analysis of a lithium-ion battery waste hierarchy inspired by circular economy. J. Ind. Ecol. 2017, 21, 715–730. [Google Scholar] [CrossRef]
  4. Lai, X.; Cao, Q. In-depth investigation of battery recycling: Strengthening the safety line of electric vehicles. Qinzhou Daily 2024, 1, 8–15. [Google Scholar]
  5. Gu, X.; Leromonachou, P. Developing pricing strategy to optimise total profits in an electric vehicle battery closed loop supply chain. J. Clean. Prod. 2018, 203, 376–385. [Google Scholar] [CrossRef]
  6. Zhang, Q.; Jin, W. Optimal decisions of power battery production and repurposing rate under different repurposed battery markets and repurposing parties. Int. J. Prod. Res. 2025, 1–16. [Google Scholar] [CrossRef]
  7. Gu, X.; Huang, M.; Zhou, L. Reimagining government subsidy policies: Facilitating echelon utilization and sustainable practices for retired battery systems. Comput. Ind. Eng. 2025, 208, 111437. [Google Scholar] [CrossRef]
  8. Riexinger, G.; Doppler, J.; Haar, C.; Trierweiler, M.; Buss, A.; Schöbel, K.; Ensling, D.; Bauernhansl, T. Integration of traceability systems in battery production. Procedia CIRP 2020, 93, 125–130. [Google Scholar] [CrossRef]
  9. Yao, F.; Zhu, J.; Yan, Y. Subsidy strategies for green design power battery closed-loop supply chain under equity concerns. Syst. Sci. Math. 2024, 44, 2730–2750. [Google Scholar]
  10. Nan, J.; Li, H. Two-type game analysis on the coexistence of price competition and technical cooperation of retired power battery recycling. Syst. Sci. Math. 2025, 1–24. [Google Scholar]
  11. Centobelli, P.; Cerchione, R.; Del Vecchio, P.; Oropallo, E.; Secundo, G. Blockchain technology for bridging trust, traceability and transparency in circular supply chain. Inf. Manag. 2022, 59, 7. [Google Scholar] [CrossRef]
  12. Chen, X.; Zhang, C. A dynamic analysis of a green closed-loop supply chain with different on-line platform smart recycling and selling models. Comput. Ind. Eng. 2025, 200, 110748. [Google Scholar] [CrossRef]
  13. Wu, W.; Zhang, M.; Jin, D. Decision-making analysis of electric vehicle battery recycling under different recycling models and deposit-refund scheme. Comput. Ind. Eng. 2024, 191, 110109. [Google Scholar] [CrossRef]
  14. Li, J.; Liu, F.; Zhang, J.Z.; Li, L.; Ferreira, J. Forward–reverse blockchain traceability: Promoting electric vehicles with battery recycling in the presence of subsidy. Ann. Oper. Res. 2024, 1–28. [Google Scholar] [CrossRef]
  15. Wu, Q.; Wang, Y.; Cheng, T.C.E.; Sun, Y. Optimal decisions and coordination of a supply chain in the hybrid recycling mode with traceability and fairness concern. Int. J. Prod. Res. 2024, 63, 5292–5316. [Google Scholar] [CrossRef]
  16. Gong, B.; Gao, Y.; Liu, Z. Selection of recycling channels for power battery closed-loop supply chain under government fund system. Comput. Integr. Manuf. Syst. 2023, 305, 3123–3137. [Google Scholar]
  17. Zhang, C.; Tian, Y.; Han, M. Recycling mode selection and carbon emission reduction decisions for a multi-channel closed-loop supply chain of electric vehicle power battery under cap-and-trade policy. J. Clean. Prod. 2022, 375, 134060. [Google Scholar] [CrossRef]
  18. Wang, Y.; Jiang, Q.; Guan, X. Recycling channel design and coordination in a reverse supply chain with customer green preference. Transp. Res. Part E Logist. Transp. Rev. 2023, 179, 103329. [Google Scholar] [CrossRef]
  19. Li, X. Collection mode choice of spent electric vehicle batteries: Considering collection competition and third-party economies of scale. Sci. Rep. 2022, 12, 6691. [Google Scholar] [CrossRef]
  20. Wang, W.; Wang, Z.; Yang, S. Study on deposit return system of closed-loop supply chain under manufacturer competition. Chin. J. Manag. Sci. 2021, 29, 179–188. [Google Scholar]
  21. Liu, Z.; Li, K.W.; Tang, J. Optimal operations of a closed-loop supply chain under a dual regulation. Int. J. Prod. Econ. 2021, 233, 107991. [Google Scholar] [CrossRef]
  22. Huang, C.; Li, D. Research on pricing and profit distribution in closed-loop supply chains based on non-cooperative-cooperative dual-type games with deposit-returned recyclers. Chin. J. Manag. Sci. 2022, 32, 166–177. [Google Scholar]
  23. Huang, Y.; Liu, Y.; Zheng, B. Research on deposit refund systems based on government-driven and market-driven approaches: Analysis of recycling decisions considering closed-loop supply chain competition. Oper. Res. Manag. Sci. 2024, 33, 51–56. [Google Scholar]
  24. Bravo, M.; Molina, N.; Cerro, M. Exploring blockchain applications in the transition to a circular economy: A comprehensive sector-focused review. Procedia Comput. Sci. 2024, 241, 564–569. [Google Scholar] [CrossRef]
  25. Li, F. Packaging anti-counterfeiting information traceability method based on blockchain traceability. Comput. Meas. Control. 2024. [Google Scholar]
  26. Wei, P.; Ma, S.; Yan, X.B. Consumer service level-oriented resilience optimization for e-commerce supply chain considering hybrid strategies with blockchain adoption. Int. J. Prod. Res. 2024, 62, 7226–7260. [Google Scholar]
  27. Wang, Y.; Gao, J.; Cheng, T. Does blockchain technology need to be introduced in the closed-loop supply chain based on product lifecycle management? Comput. Ind. Eng. 2024, 188, 109881. [Google Scholar] [CrossRef]
  28. Zhang, T.; Dong, P.; Chen, X. The impacts of blockchain adoption on a dual-channel supply chain with risk-averse members. Omega 2023, 114, 102747. [Google Scholar] [CrossRef]
  29. Li, J.; Wang, L.; Quan, P. Impact of blockchain technology on remanufacturing supply chains with CSR investments. China Circ. Econ. 2024, 38, 34–45. [Google Scholar]
  30. Wu, X.; Fan, Z.; Li, G. Strategic analysis for adopting blockchain technology under supply chain competition. Int. J. Logist. Res. Appl. 2023, 26, 1384–1400. [Google Scholar] [CrossRef]
  31. Suvadarshini, P.; Biswas, I.; Srivastava, S. Impact of reverse channel competition, individual rationality, and information asymmetry on multi-channel closed-loop supply chain design. Int. J. Prod. Econ. 2023, 259, 108818. [Google Scholar] [CrossRef]
  32. Wan, N.; Fan, J.; Wu, X. The cost-sharing mechanism for blockchain technology adoption in the platform-led e-commerce supply chain. J. Syst. Sci. Syst. Eng. 2025, 34, 156–179. [Google Scholar] [CrossRef]
  33. Chang, F.; Chi, M.; Fan, S.; Choi, T. Who should invest in blockchain technology under different pricing models in supply chains? Europ. J. Oper. Res. 2024, 319, 777–792. [Google Scholar]
  34. Wang, W.; Fan, L.; Yang, S. The impact of manufacturers sharing recycling investment costs on closed-loop supply chain decisions. Stat. Decis. Mak. 2018, 34, 57–61. [Google Scholar]
  35. Feng, Z.; Xiao, T.; Chai, C. Recycling and pricing strategies in a third-party recycler-led two-tier closed-loop supply chain. Chin. J. Manag. Sci. 2018, 26, 118–127. [Google Scholar]
  36. Lin, Q.; Liu, M.; Wang, X. Green supply chain decision-making incorporating blockchain information transmission functions. Comput. Integr. Manuf. Syst. 2024, 30, 355–368. [Google Scholar]
  37. Wang, M.; Li, Y.; Shi, W. Dynamic decision-making on corporate end-of-life product recycling under different environmental regulations. Syst. Eng. Theory Pract. 2020, 40, 103–118. [Google Scholar]
  38. Yan, Y.; Cao, J.; Zhou, Y.; Zhou, G.; Chen, J. Decisions for power battery closed-loop supply chain: Cascade utilization and extended producer responsibility. Ann. Oper. Res. 2024, 1–14. [Google Scholar] [CrossRef]
  39. Dan, P.; Wang, Z.; Wang, M.; Andrea, A.; Xiao, T. Online collection channel and government subsidy strategy of retired power batteries considering cascade utilization. Comput. Ind. Eng. 2025, 209, 111417. [Google Scholar] [CrossRef]
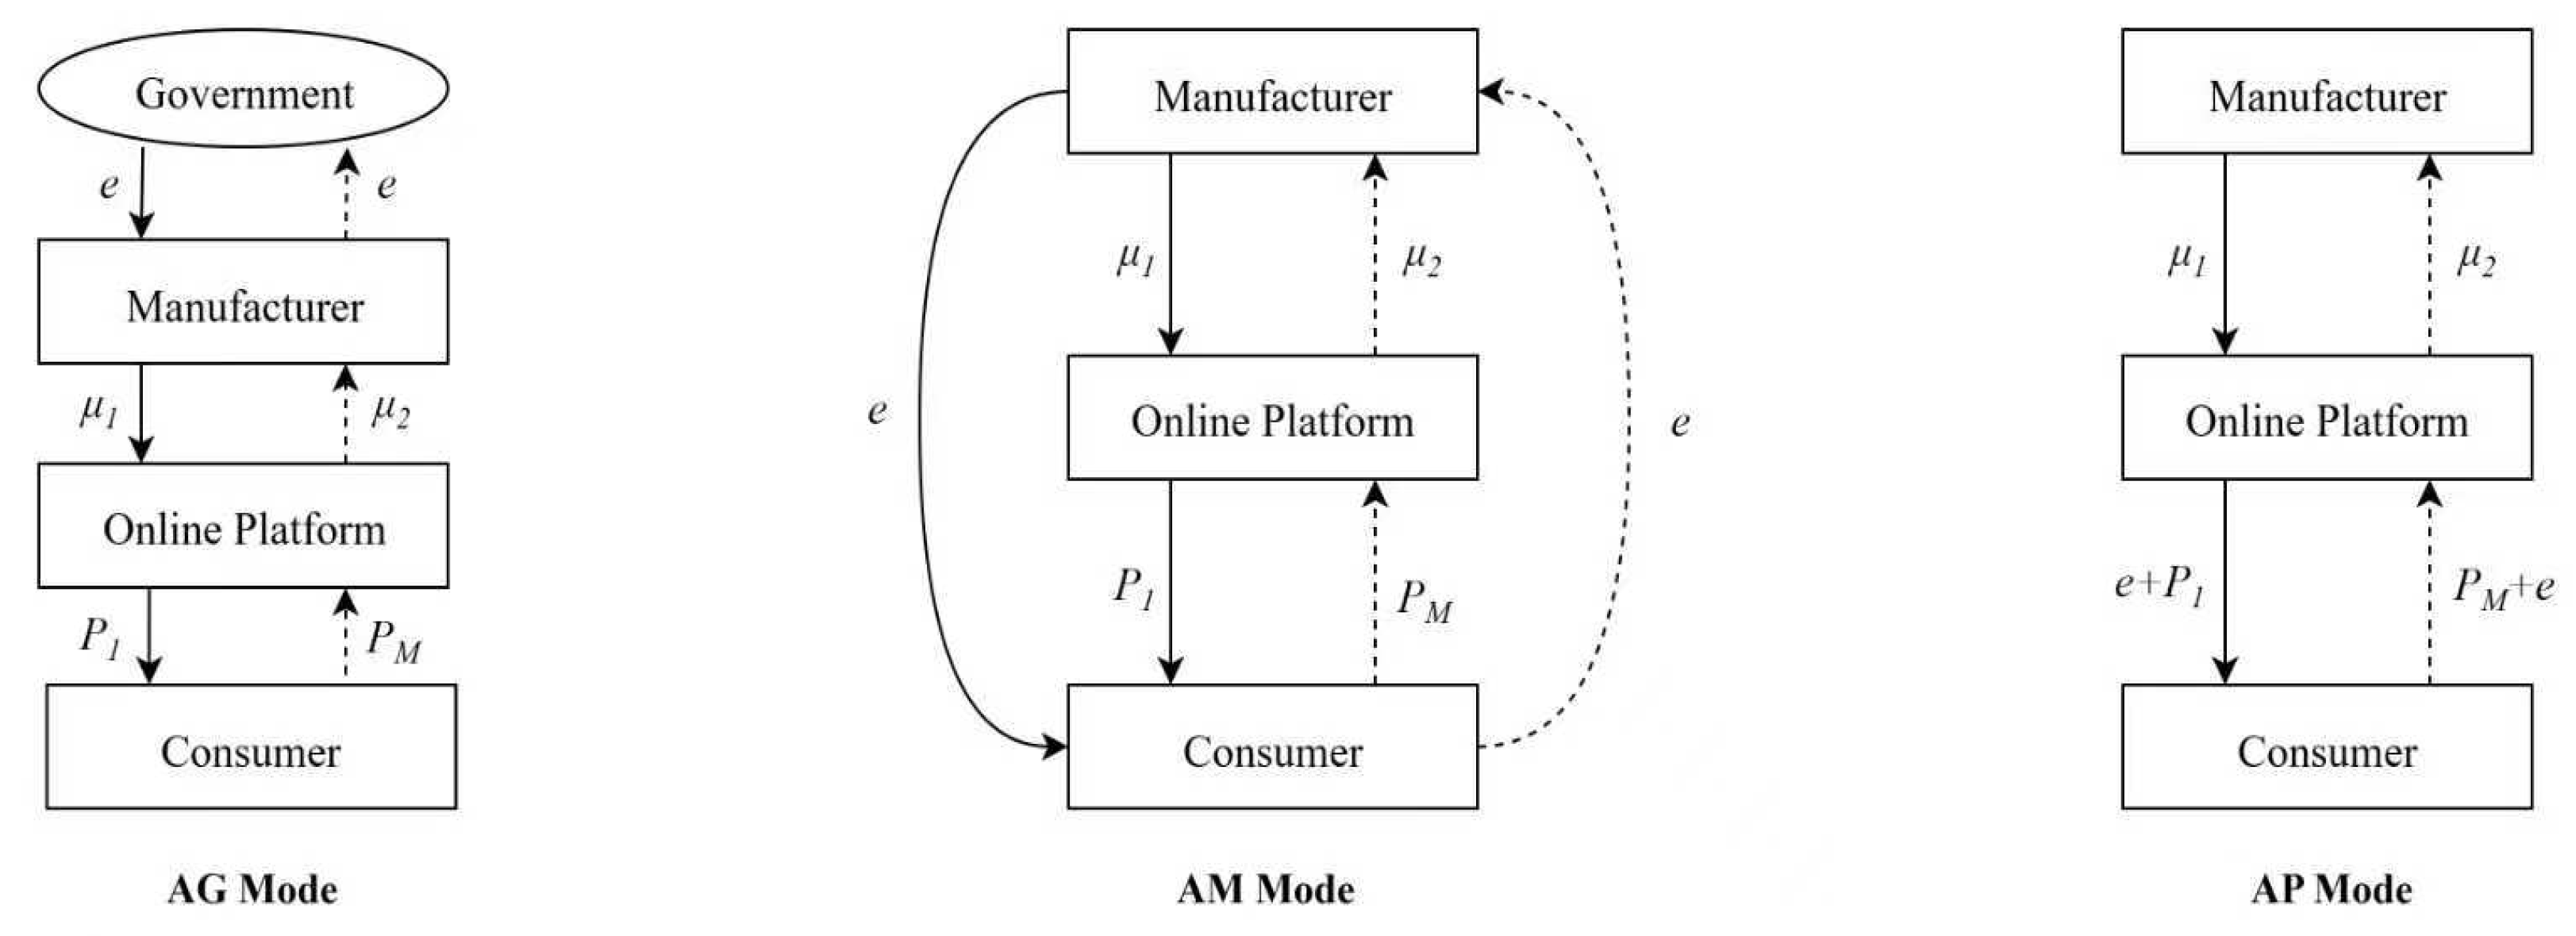
Figure 1. Three systems under the online platform agency recycling model, from left to right: the AG mode, where the government collects deposits from manufacturers; the AM mode, where manufacturers collect deposits from consumers; and the AP mode, where online platforms collect deposits from consumers.
Applsci 15 12514 g001
Figure 2. Three systems under the online platform-commissioned recycling model, from left to right: the OG mode, where the government collects deposits from manufacturers; the OM mode, where manufacturers collect deposits from consumers; and the OP mode, where online platforms collect deposits from consumers.
Applsci 15 12514 g002
Figure 3. (a) The impact of σ -variation on blockchain investment levels under the online platform agency recycling model; (b) the impact of e -variation on blockchain investment levels under the online platform agency recycling model; and (c) the impact of θ -variation on blockchain investment levels under the online platform agency recycling model.
Applsci 15 12514 g003
Figure 4. (a) The impact of e -variation on retail prices under the online platform agency recycling model and (b) the impact of e -variation on recycling prices under the online platform agency recycling model.
Applsci 15 12514 g004
Figure 5. (a) The impact of e -variation on the profits of manufacturers under the online platform agency recycling model and (b) the impact of d 0 -variation on the profits of manufacturers under the online platform agency recycling model.
Applsci 15 12514 g005
Figure 6. (a) The impact of e -variation on the profits of online platforms under the online platform agency recycling model and (b) the impact of d 0 -variation on the profits of online platforms under the online platform agency recycling model.
Applsci 15 12514 g006
Figure 7. (a) The impact of σ -variation on blockchain investment levels under the online platform-commissioned recycling model; (b) the impact of e -variation on blockchain investment levels under the online platform-commissioned recycling model; and (c) the impact of θ -variation on blockchain investment levels under the online platform-commissioned recycling model.
Applsci 15 12514 g007
Figure 8. (a) The impact of e -variation on retail price under the online platform-commissioned recycling model; (b) the impact of e -variation on manufacturer recycling price under the online platform-commissioned recycling model; and (c) the impact of e -variation on online platform recycling prices under the online platform-commissioned recycling model.
Applsci 15 12514 g008
Figure 9. (a) The impact of e -variation on the profits of manufacturers under the online platform-commissioned recycling model; (b) the impact of d 0 -variation on the profits of manufacturers under the online platform-commissioned recycling model; (c) the impact of e -variation on the profits of online platform under the online platform-commissioned recycling model; and (d) the impact of d 0 -variation on the profits of online platform under the online platform-commissioned recycling model.
Applsci 15 12514 g009
Figure 10. (a) The impact of e -variation on online platform profitability across six models; (b) the impact of e -variation on online platform profitability across six models; and (c) the impact of e -variation on online platform profitability across six models.
Applsci 15 12514 g010
Table 1. Summary of closely related literature.
PaperDeposit Collection MethodBlockchain
Investment
Online
Platform Recycling Model
CLSC
Policy-DrivenMarket-DrivenInvested by ManufacturersInvested by RetailersInvested by Online Platforms
Suvadarshini et al. (2023) [31]
Wu et al. (2024) [13]
Huang et al. (2024) [23]
Wu et al. (2024) [15]
Chen and Zhang (2024) [12]
Wan et al. (2025) [32]
Li et al. (2024) [14]
Gong et al. (2021) [16]
Chang et al. (2024) [33]
This paper
Note: CLSC: Closed-loop supply chain.
Table 2. Notations and definitions.
NotationsDefinitions
Parameter
d 0 Total potential market demand.
σ Consumer sensitivity coefficient of blockchain technology investment.
V 1 Manufacturer revenue from tiered utilization market.
V 2 Manufacturer revenue from remanufacturing new batteries.
e Product unit deposit.
β Proportion of recycled batteries suitable for tiered utilization.
u Manufacturer disassembly technology cost.
μ 1 Sales commission rate.
μ 2 Recycling commission rate.
θ Difficulty coefficient of blockchain technology investment.
w Supplier’s new battery wholesale price.
Decision variable
  p 1 Retail price of power batteries.
p M Manufacturer’s recycling price for power batteries.
  p O Online platform recycling price for power batteries.
x Blockchain investment level.
Function
DANumber of requests under no-deposit policy.
DBNumber of requests under deposit policy.
Q j Total number of power batteries recycled.
Π j i Supply chain member profit.
j Recycling mode (AG, AM, AP, OG, OM, OP).
i M: Manufacturer, P: Online platform.
Table 3. Summary of data.
SymbolValueUnitReference
d 0 3/10unitChen and Zhang (2024) [12]
Wan et al. (2025) [32]
σ 0.5/0.7
e 0.1/0.2/0.3RMB/unit
μ 1 0.4
μ 2 0.2/0.3
θ 0.5/0.7
w 0.2/0.7RMB/unitYan et al. (2024) [38]
Dan et al. (2025) [39]
V 1 4RMB/unit
V 2 3RMB/unit
β 0.9
u 0.2RMB/unit
Table 4. Model performance summary table (based on key conditions).
ConditionsBest Model (Manufacturer Perspective)Best Model (Platform Perspective)Optimal Model (Government Perspective)
High market demandOG/AMOG/OPOG
Low market demandAM/OGAM/OGAM/OG
High-Level Blockchain Investment Incentive ObjectivesOGOGOG
Low Retail Price
(Consumer Cost) Target
AMAMAM
High Recycling Rate TargetOGOGOG
Manufacturer Profit MaximizationAM/OG--
Platform Profit Maximization-OG/OP -
Disclaimer/Publisher’s Note: The statements, opinions and data contained in all publications are solely those of the individual author(s) and contributor(s) and not of MDPI and/or the editor(s). MDPI and/or the editor(s) disclaim responsibility for any injury to people or property resulting from any ideas, methods, instructions or products referred to in the content.