NACA Duct Optimization for Specific Purposes
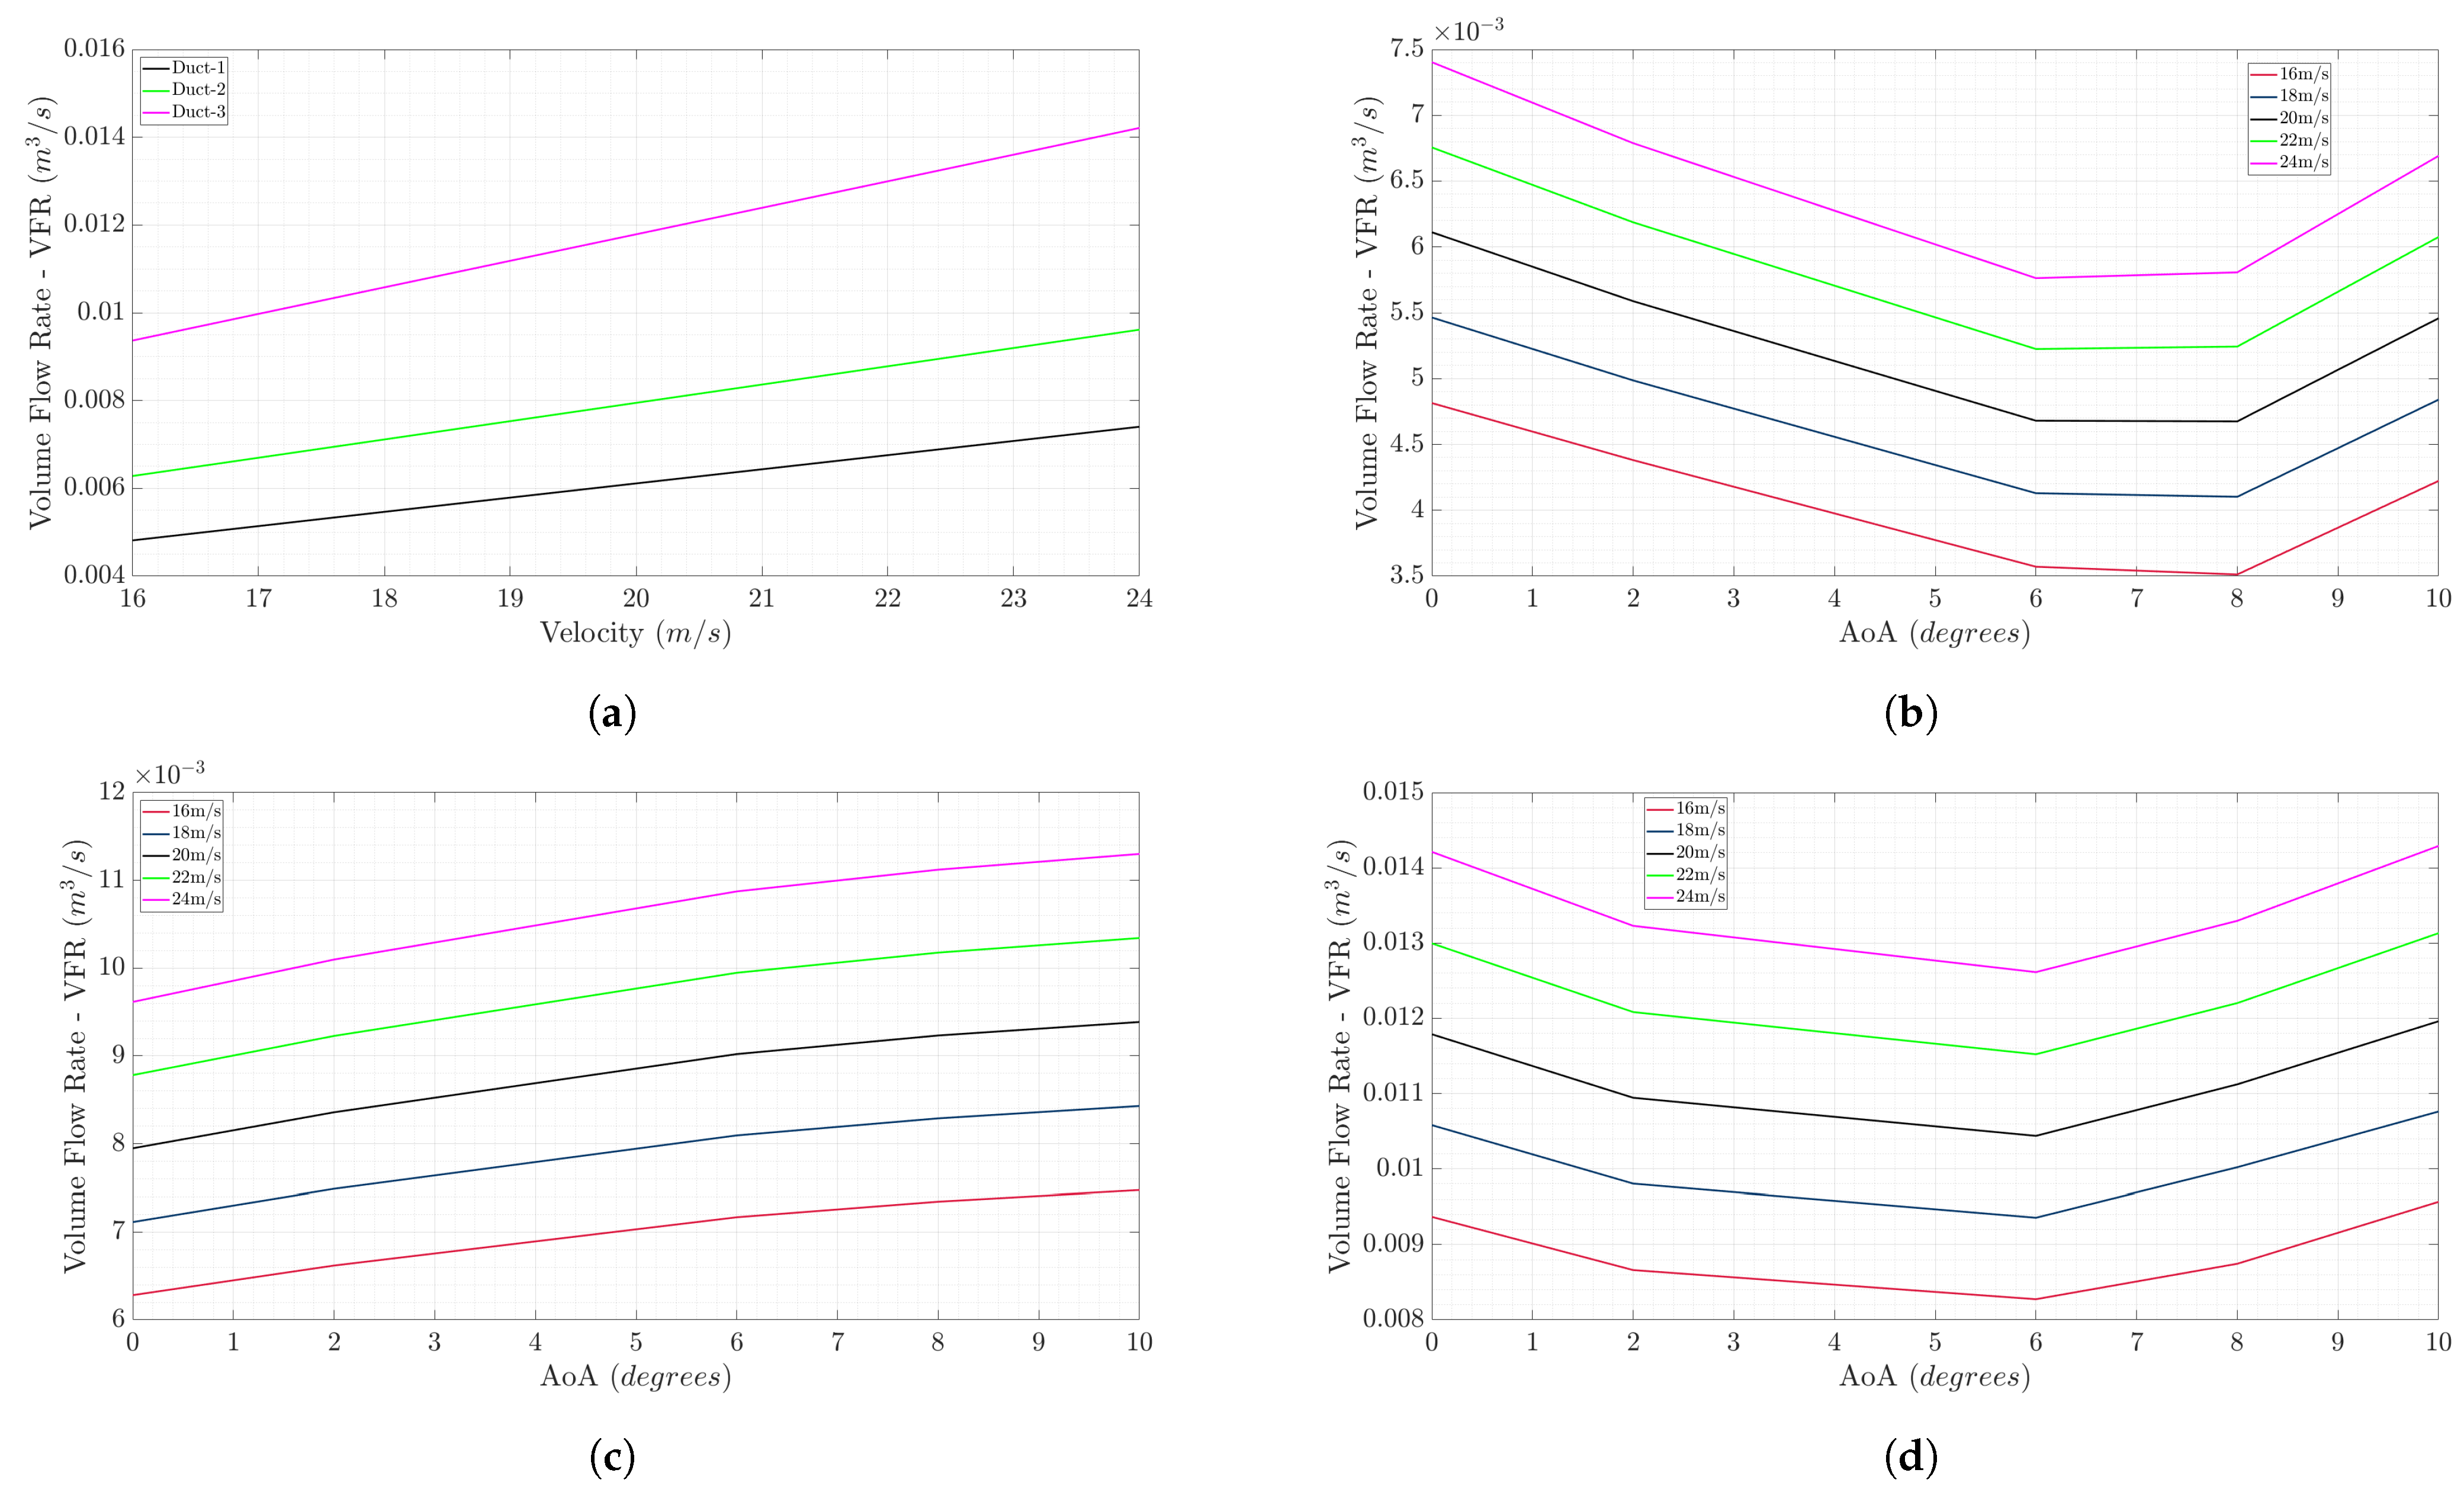
For this specific study, NACA duct optimization was conducted to determine the most efficient configuration for the UAV’s cooling system. Following the first two steps of the design methodology—the conceptual design of the inlets based on the required mass flow rate and inlet area—the process proceeded to the third step, which involved selecting the geometrical characteristics of the NACA duct to be implemented on this UAV.
An SBO (surrogate-based optimization) framework was developed and employed to identify the optimal geometric parameters of the NACA duct, namely the ramp angle, divergence angle, length-to-depth ratio (L/D), and width-to-length ratio (W/L). The surrogate model employed in the SBO procedure was validated using Leave-One-Out (LOO) Cross-Validation. The complete LOO formulation and the corresponding error metrics (RMSE, relative RMSE, and predictive R-squared) are reported in
Appendix A. The optimization framework directly coupled the SBO algorithm with high-fidelity aerodynamic simulations performed through computational fluid dynamics (CFD), ensuring an accurate evaluation of duct performance across the design space.
The objective function of the optimization was defined to maximize the volume flow rate (VFR) through the duct, subject to a constraint on minimizing the drag increase induced by the duct’s presence on the UAV’s external surface. This balance ensures both efficient airflow capture and aerodynamic integrity of the overall design.
The lower and upper bounds for each geometric parameter considered in the optimization process are presented below:
Ramp angle: –.
Divergence wall angle: –.
Length-to-depth ratio: 7–15.
Width-to-length ratio: –.
The SBO sample size was defined as 40, corresponding to 10 times the number of design variables, following established recommendations in the literature (Forrester et al. [
15]). A total of 30 infill points—equivalent to 75% of the initial sample size—were subsequently generated to improve the accuracy of the surrogate model and refine the search for the optimal configuration.
Table 3 presents the geometric parameter values of the 30 infill points evaluated during the SBO process, while
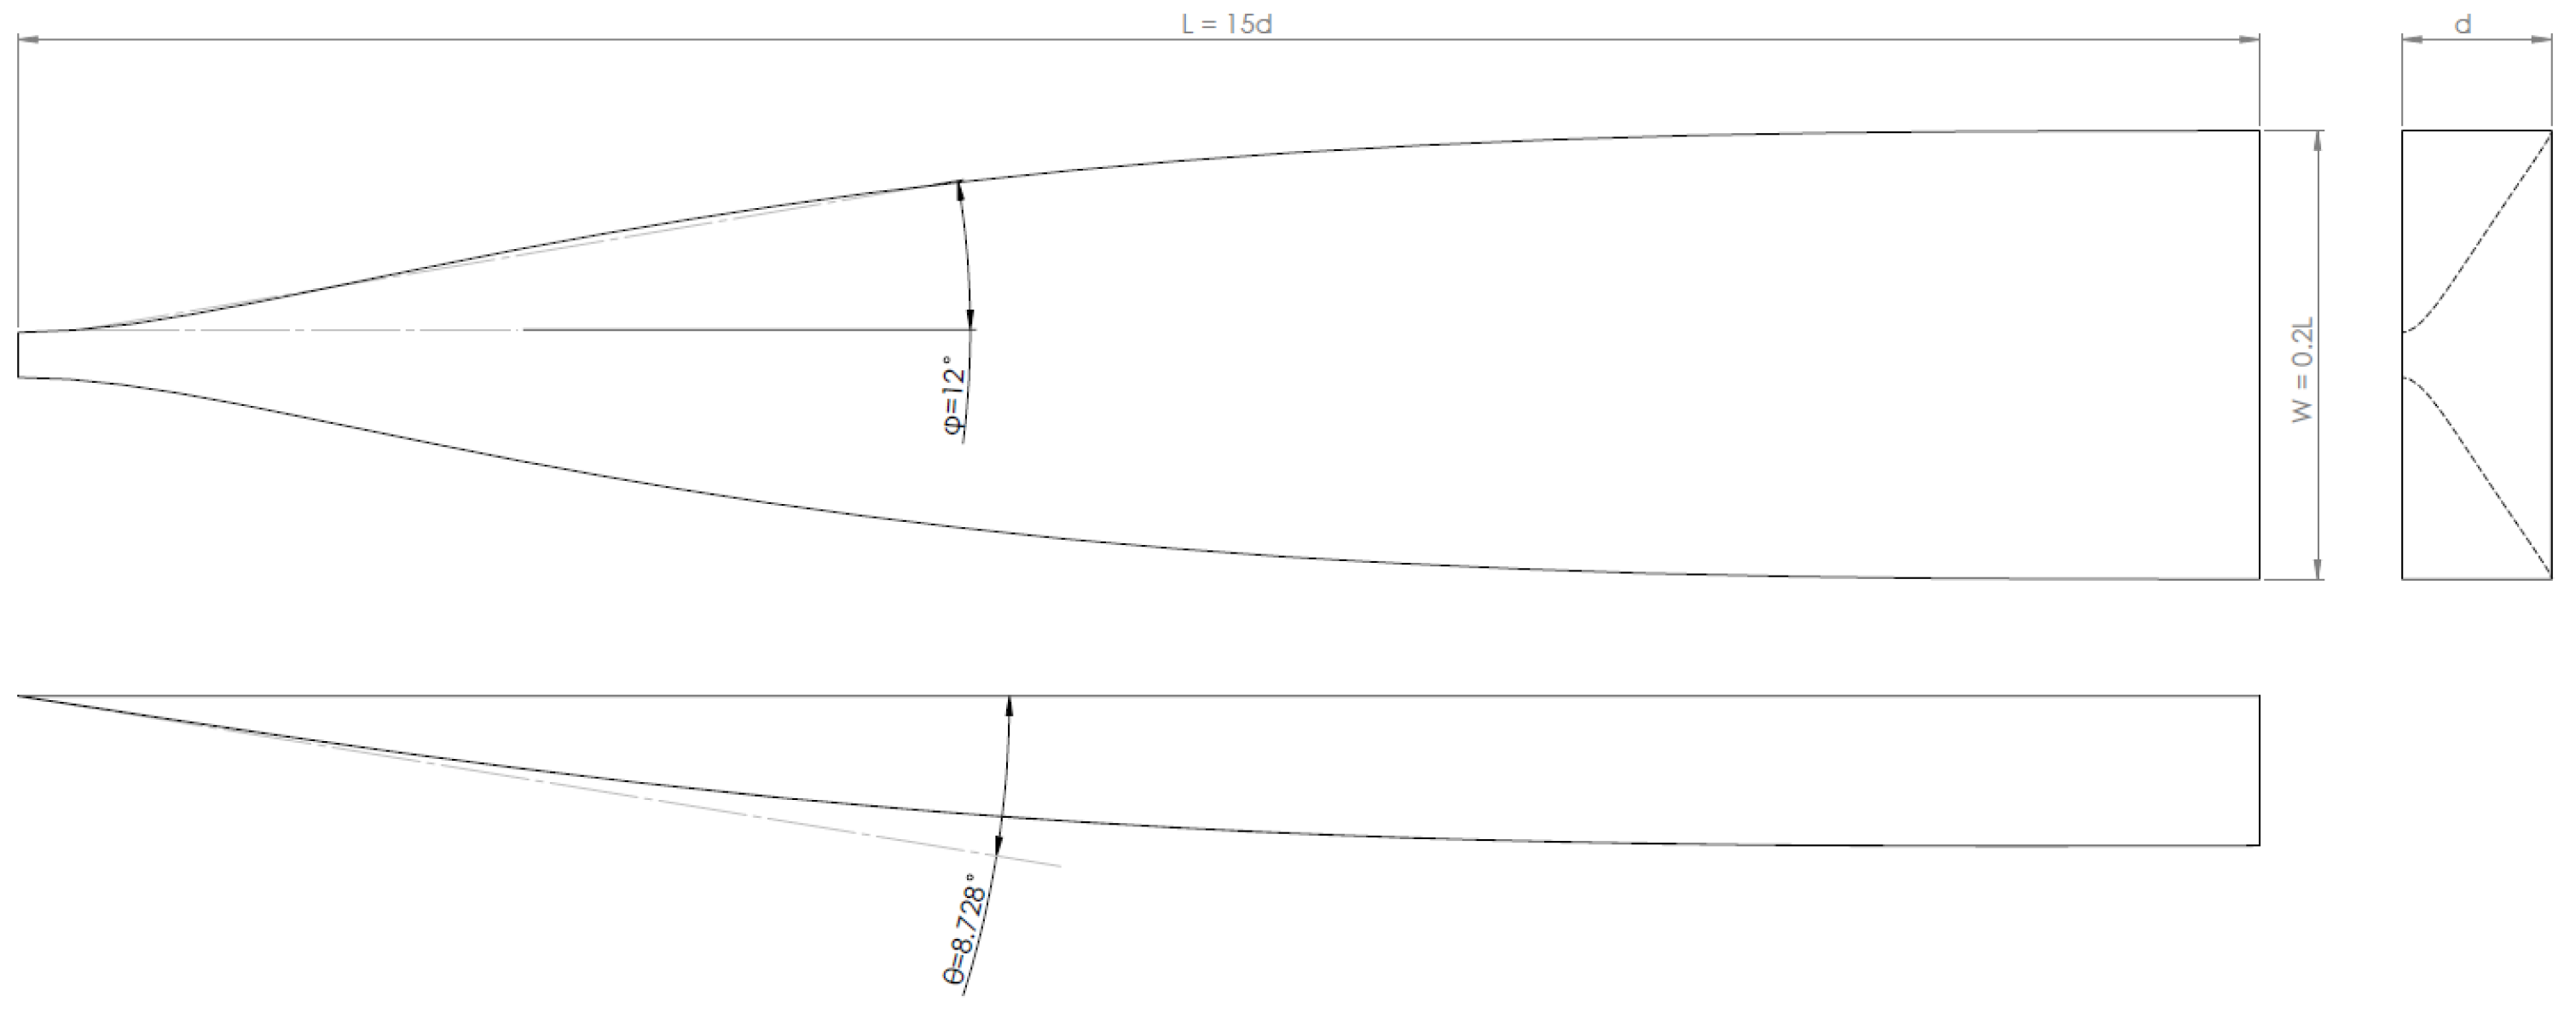
Table 4 summarizes the corresponding VFR and drag difference results obtained from the CFD simulations for each configuration. The optimized NACA duct geometry identified through this framework is illustrated in
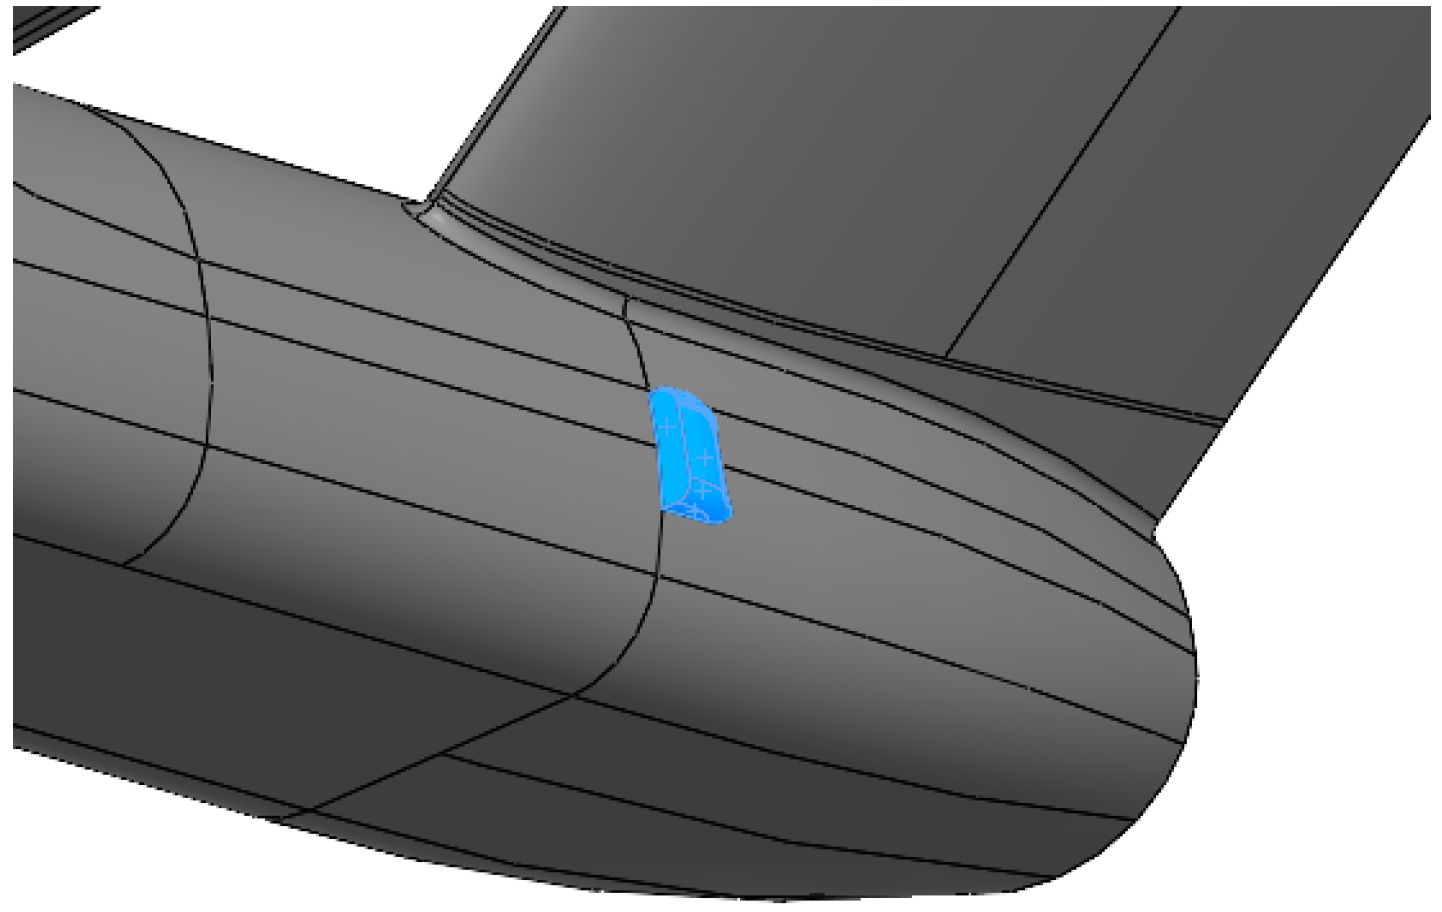
Figure 4, representing the configuration that achieved the maximum VFR while maintaining a minimal drag penalty.
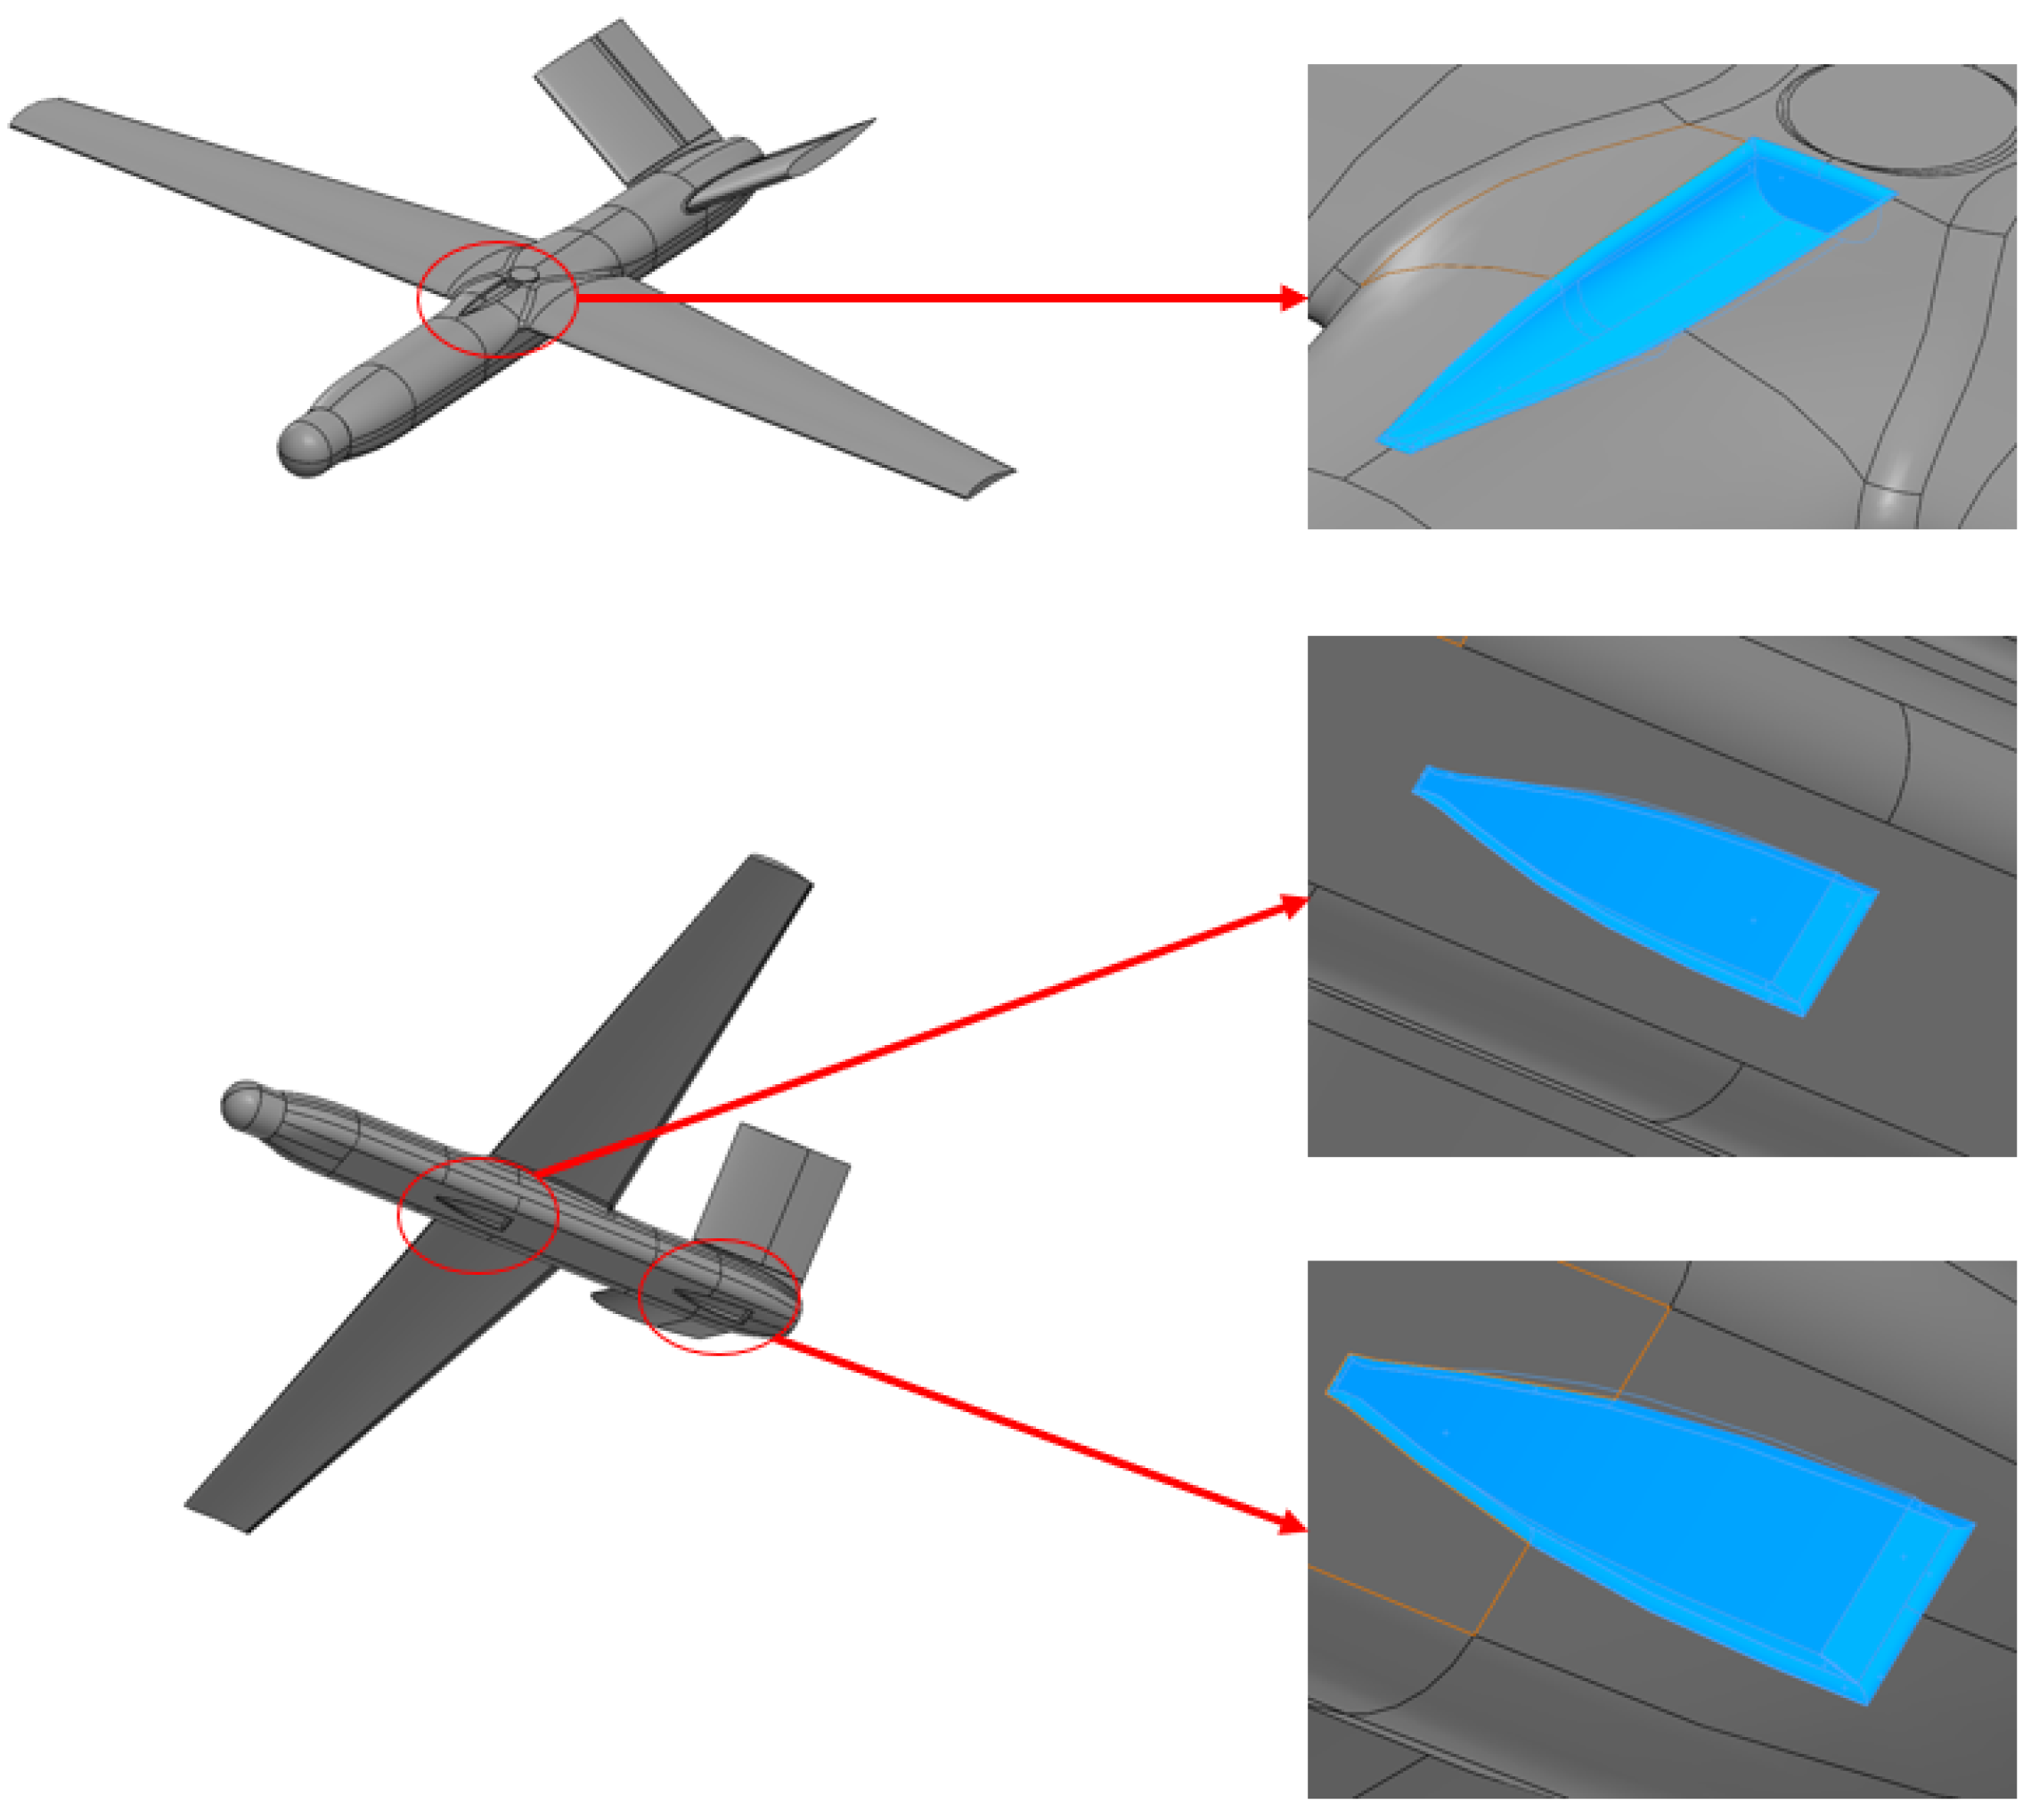
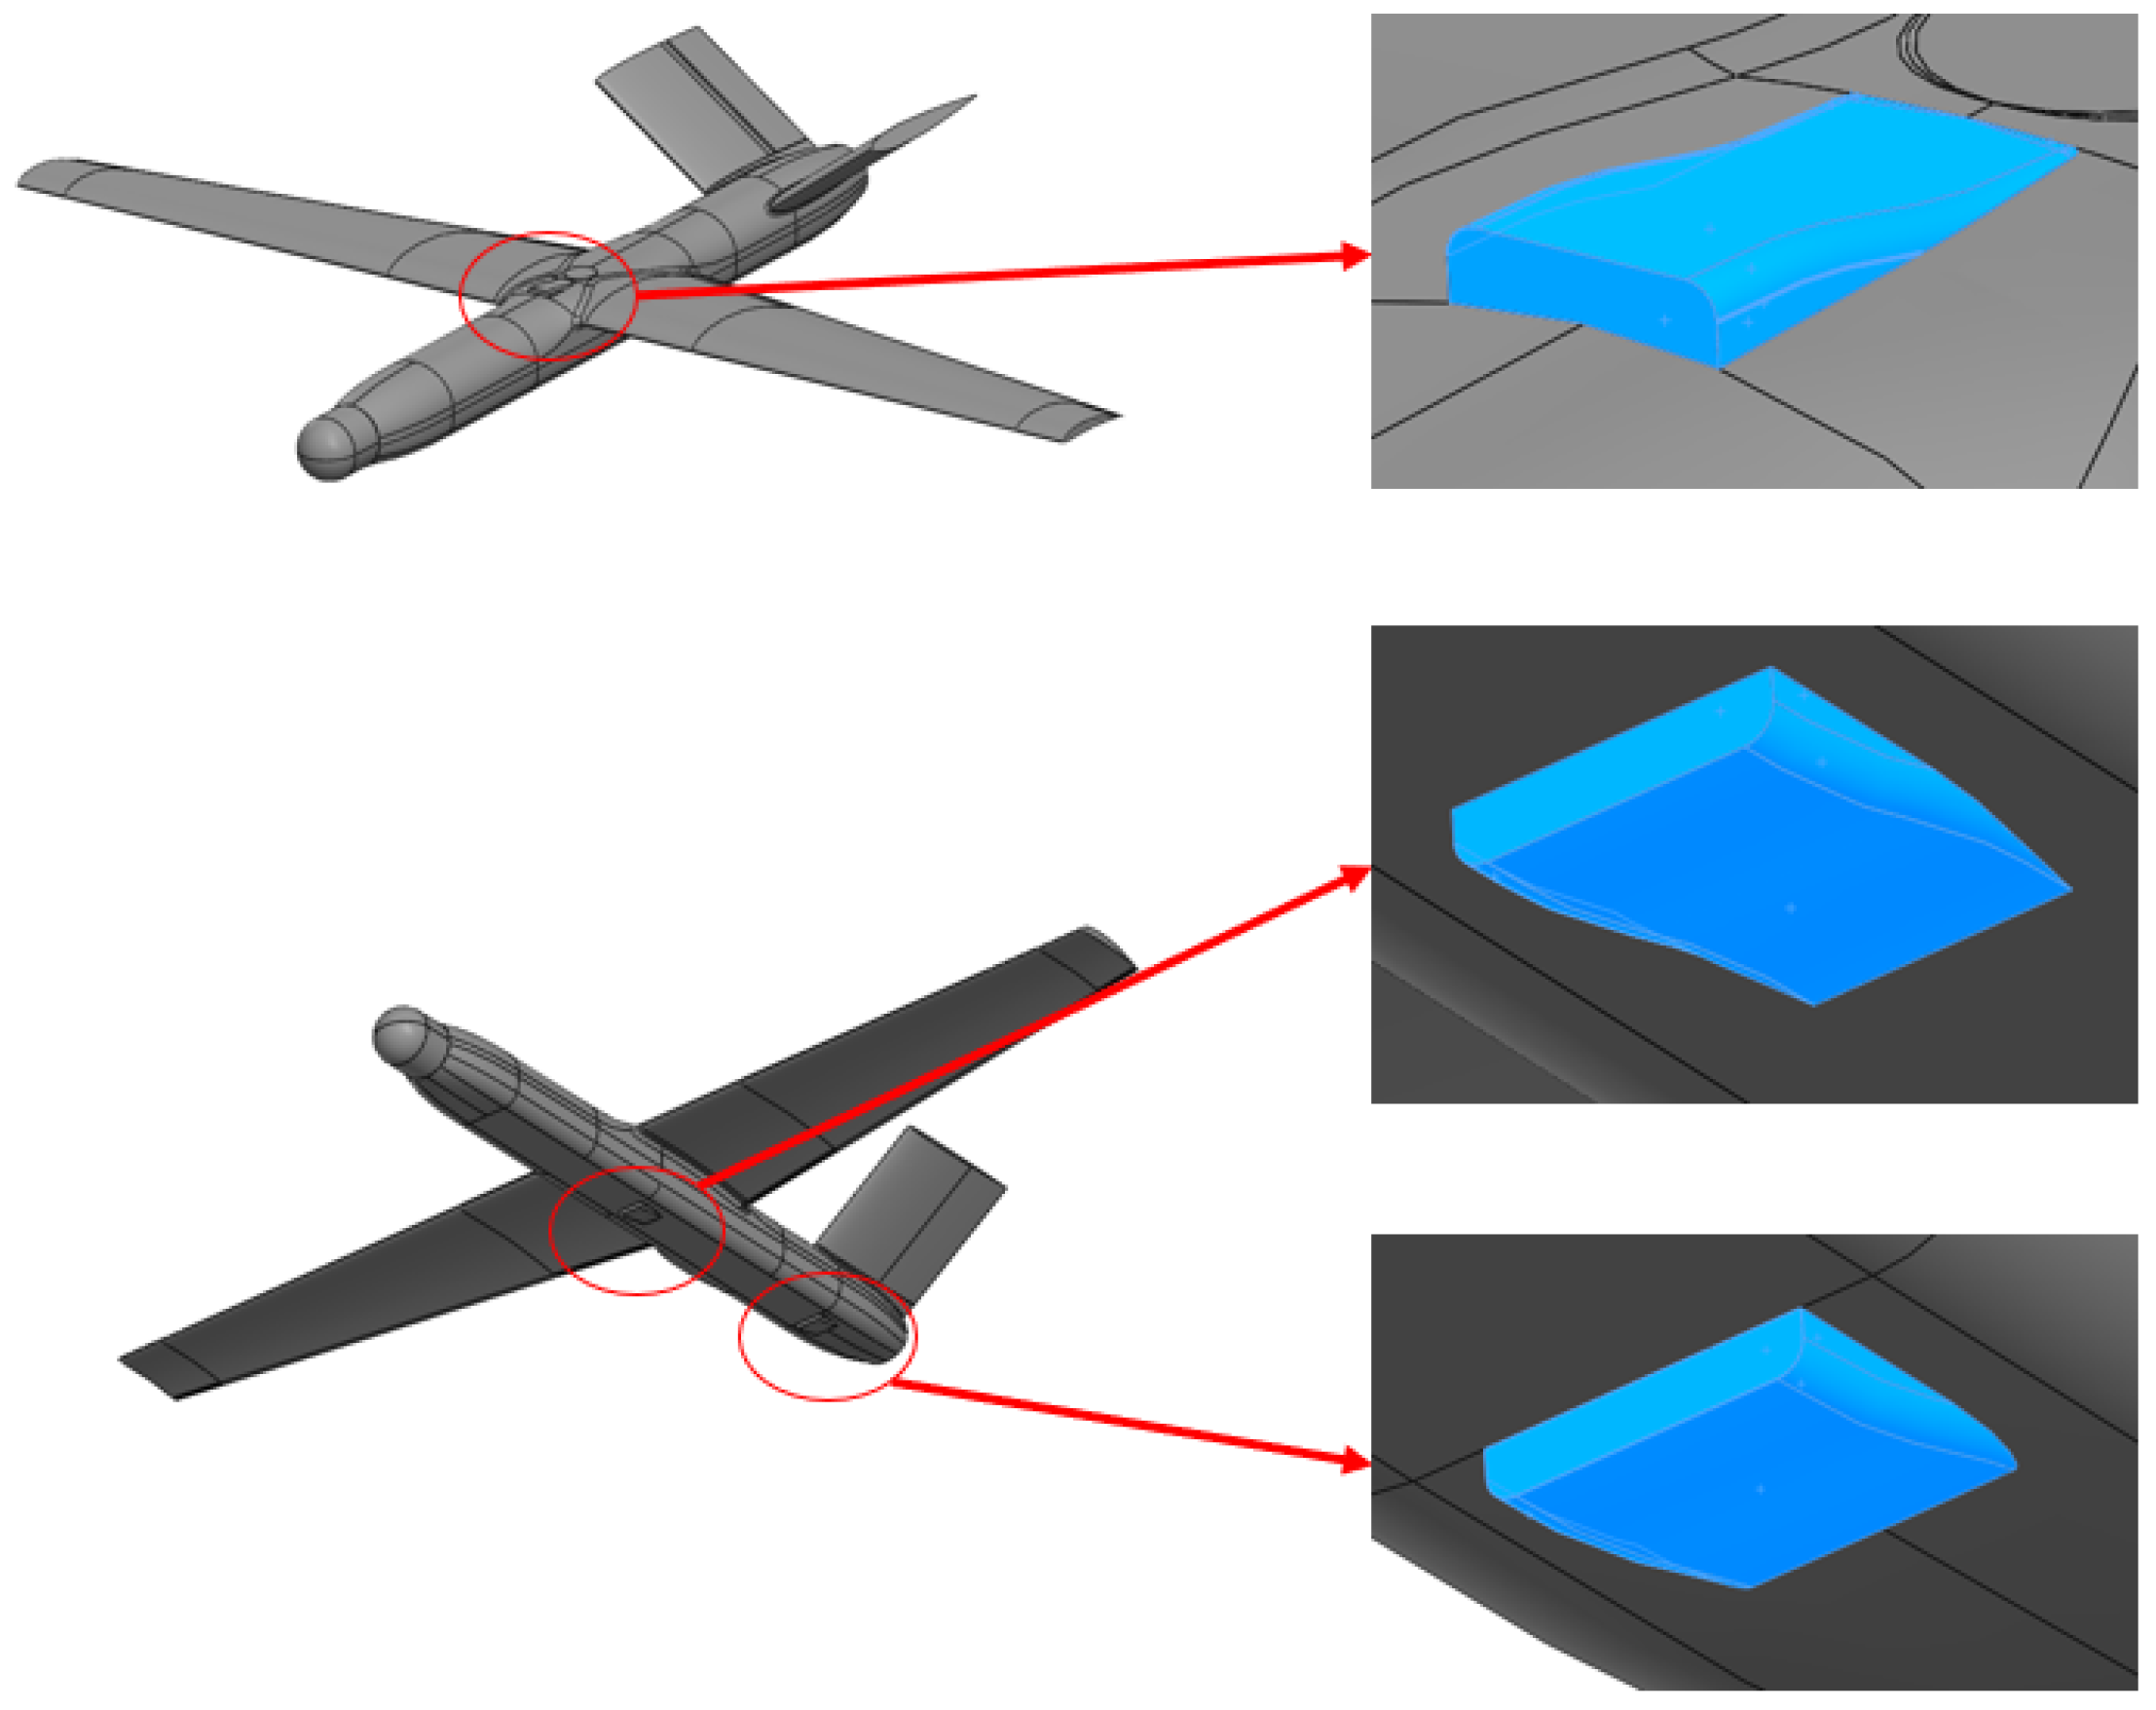
The selected optimized NACA duct geometry obtained from the SBO framework was subsequently implemented for the three inlet areas defined during the conceptual design phase and integrated into the UAV model, as shown in
Figure 5. High-fidelity aerodynamic simulations were then conducted using computational fluid dynamics (CFD) to analyze the external airflow around the UAV. In these simulations, the inlet areas were defined as pressure outlet boundary conditions to extract the volume flow rate (VFR) through each duct.
In addition to the optimized NACA ducts, two alternative configurations were evaluated for comparison: NACA ducts designed according to Frick’s geometric formulation [
21] and simple rectangular ducts of equivalent inlet area. Frick’s NACA duct, originally developed and validated by Frick et al. in a series of NASA experimental studies, is considered a benchmark configuration for low-profile, submerged inlets operating in subsonic flow regimes. Its well-documented aerodynamic characteristics, including pressure recovery and drag behavior, make it a reliable standard for evaluating alternative duct designs in both aircraft and UAV applications. The rectangular duct, on the other hand, was included as a baseline non-optimized configuration representing a simple, manufacturable inlet geometry with no curvature or contouring features. These comparative simulations enabled an assessment of the relative aerodynamic efficiency and flow capture performance of each configuration.
Table 5 presents the dimensions of each duct according to Frick’s geometric characteristics of NACA ducts, while
Table 6 presents the divergence wall coordinates for the NACA ducts.
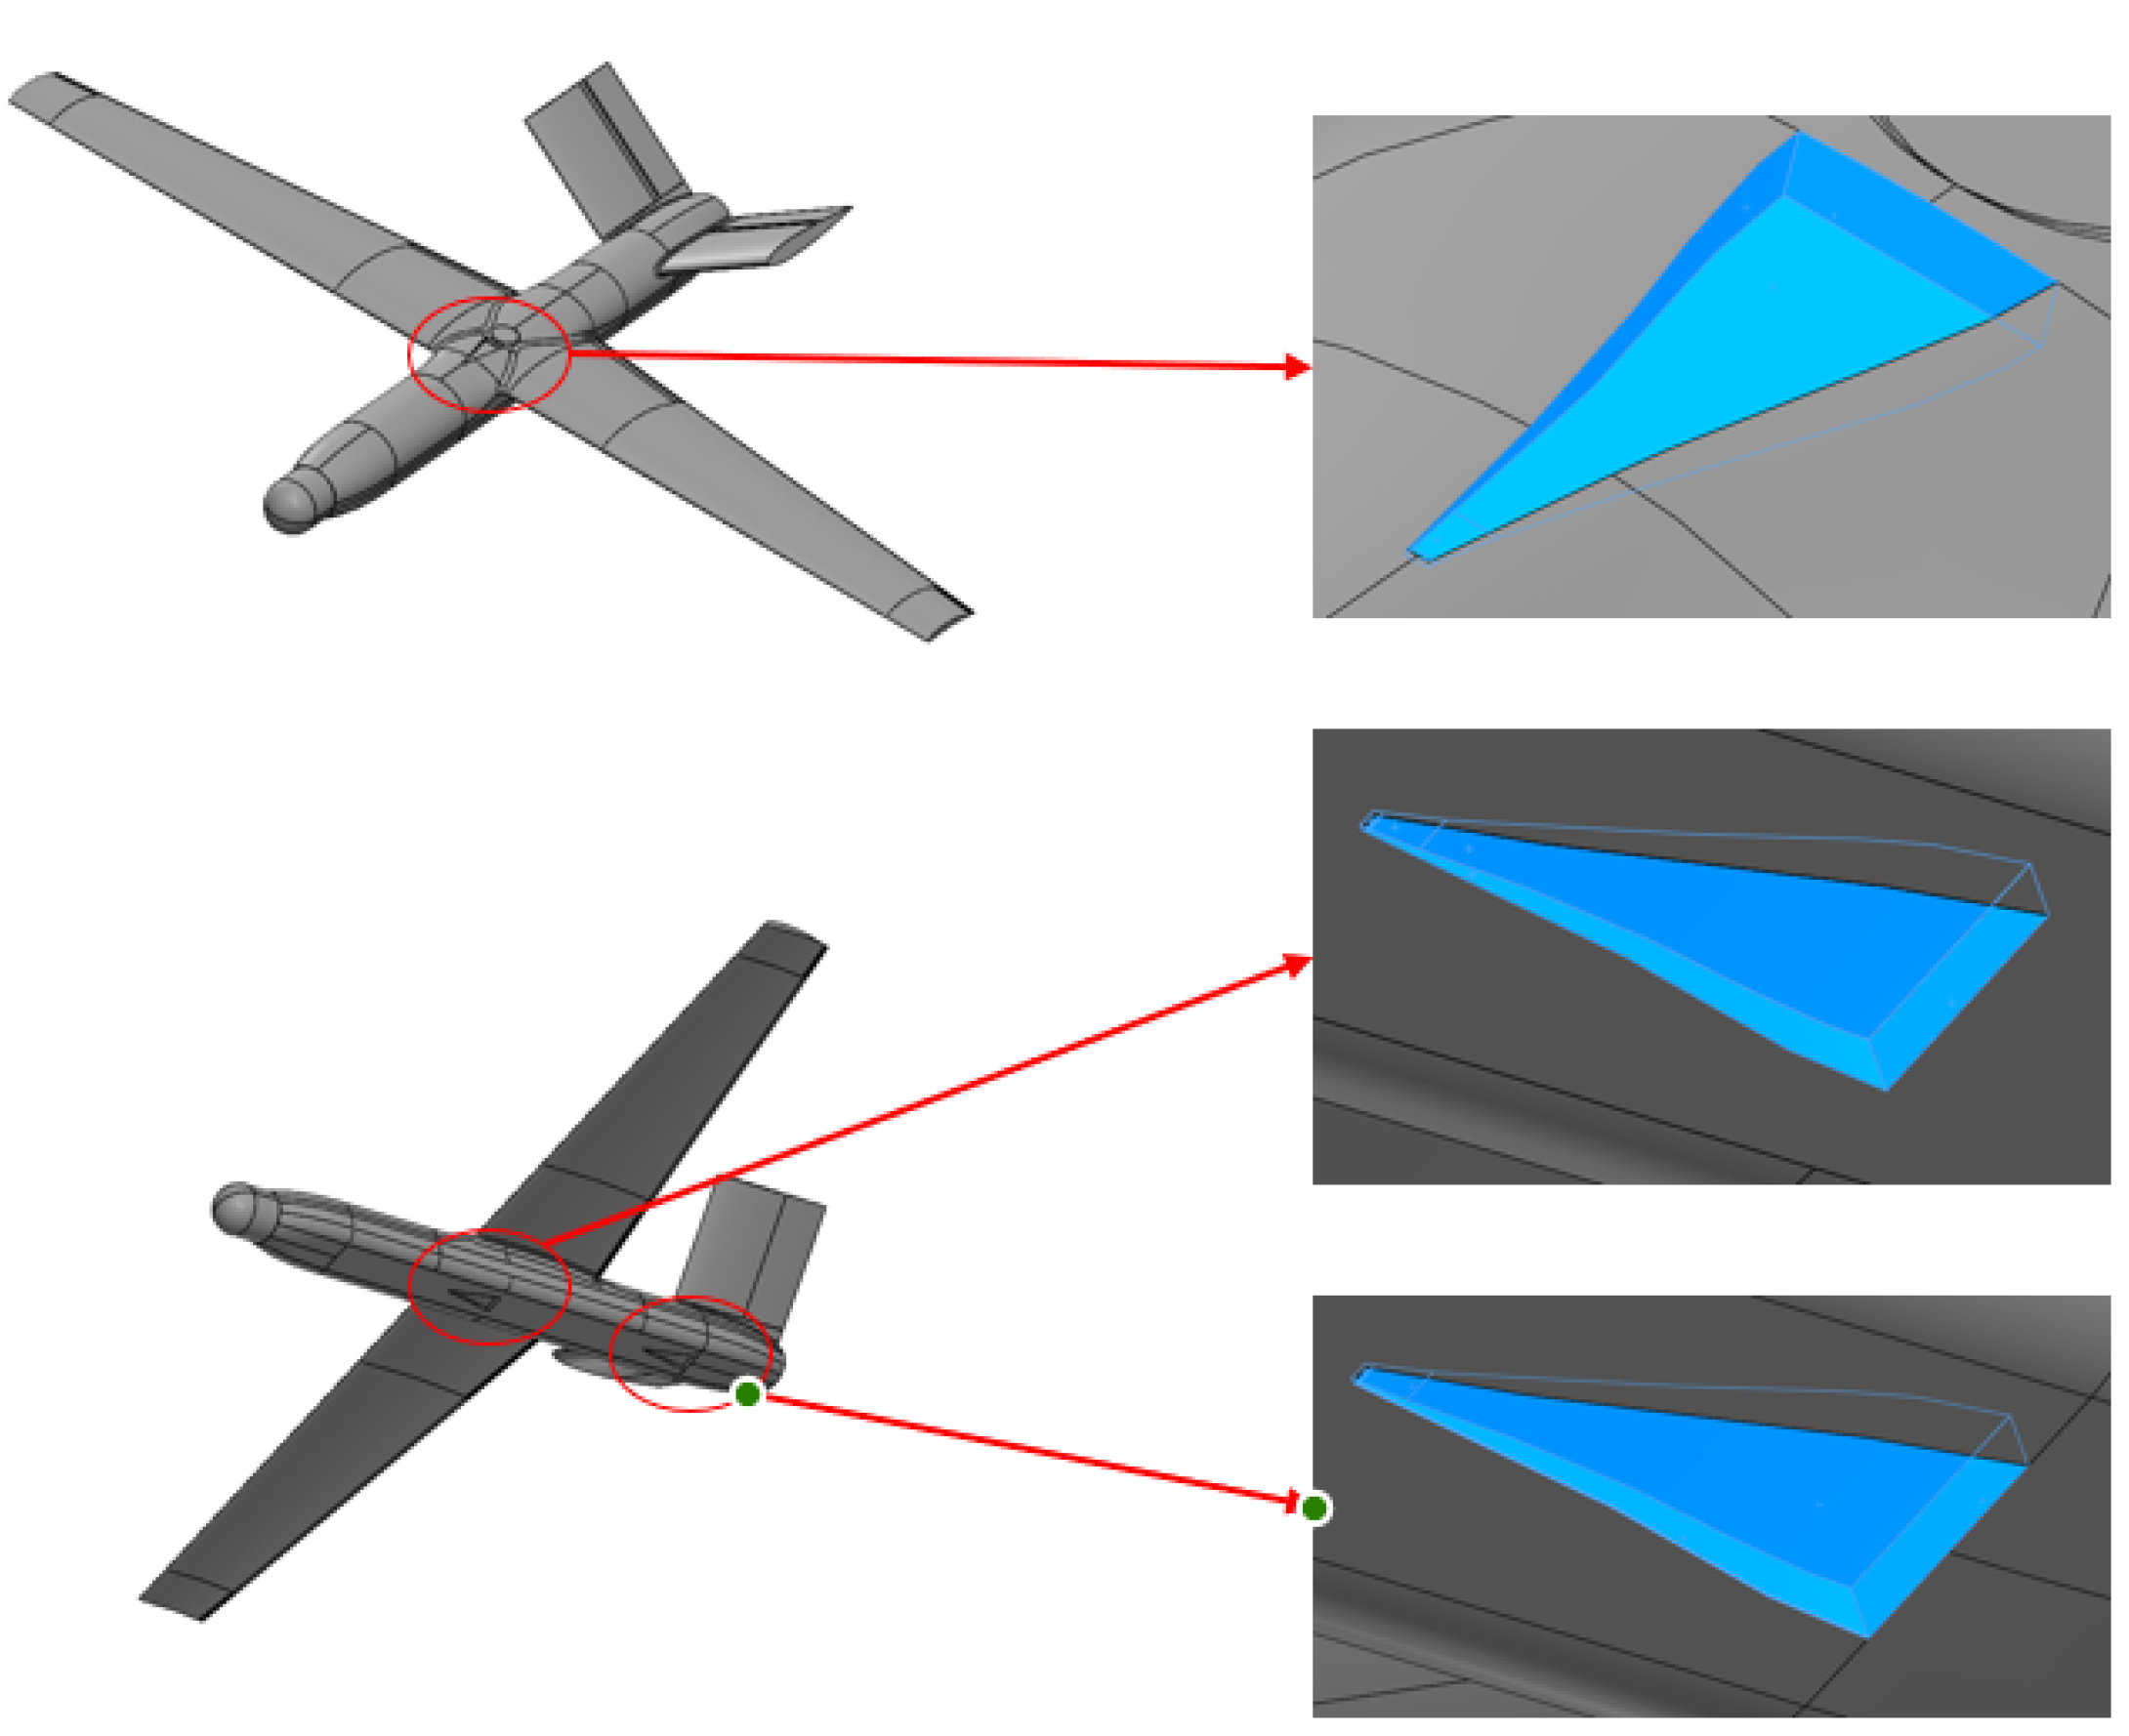
NACA ducts, according to Frick’s geometrical characteristics, can be seen installed on the UAV in
Figure 6, while the installed normal rectangular ducts can be seen in
Figure 7.
The results of the drag coefficient (
) calculation for each duct configuration installed on the UAV, evaluated across a range of flight velocities, are presented in
Figure 8. In addition, the corresponding lift-to-drag ratios (
) for each configuration are also shown, providing a comparative assessment of the overall aerodynamic performance of the UAV for the optimized NACA duct, the standard NACA duct based on Frick’s geometry, and the simple rectangular duct design.
Table 7 and
Table 8 present the differences in the drag coefficient (
) and lift-to-drag ratio (
), respectively, between the clean UAV configuration (without ducts) and the three duct configurations—namely, the optimized NACA duct, the standard NACA duct (Frick’s geometry), and the rectangular duct. These comparisons provide a quantitative assessment of the aerodynamic impact of each duct design on the overall performance and efficiency of the UAV.
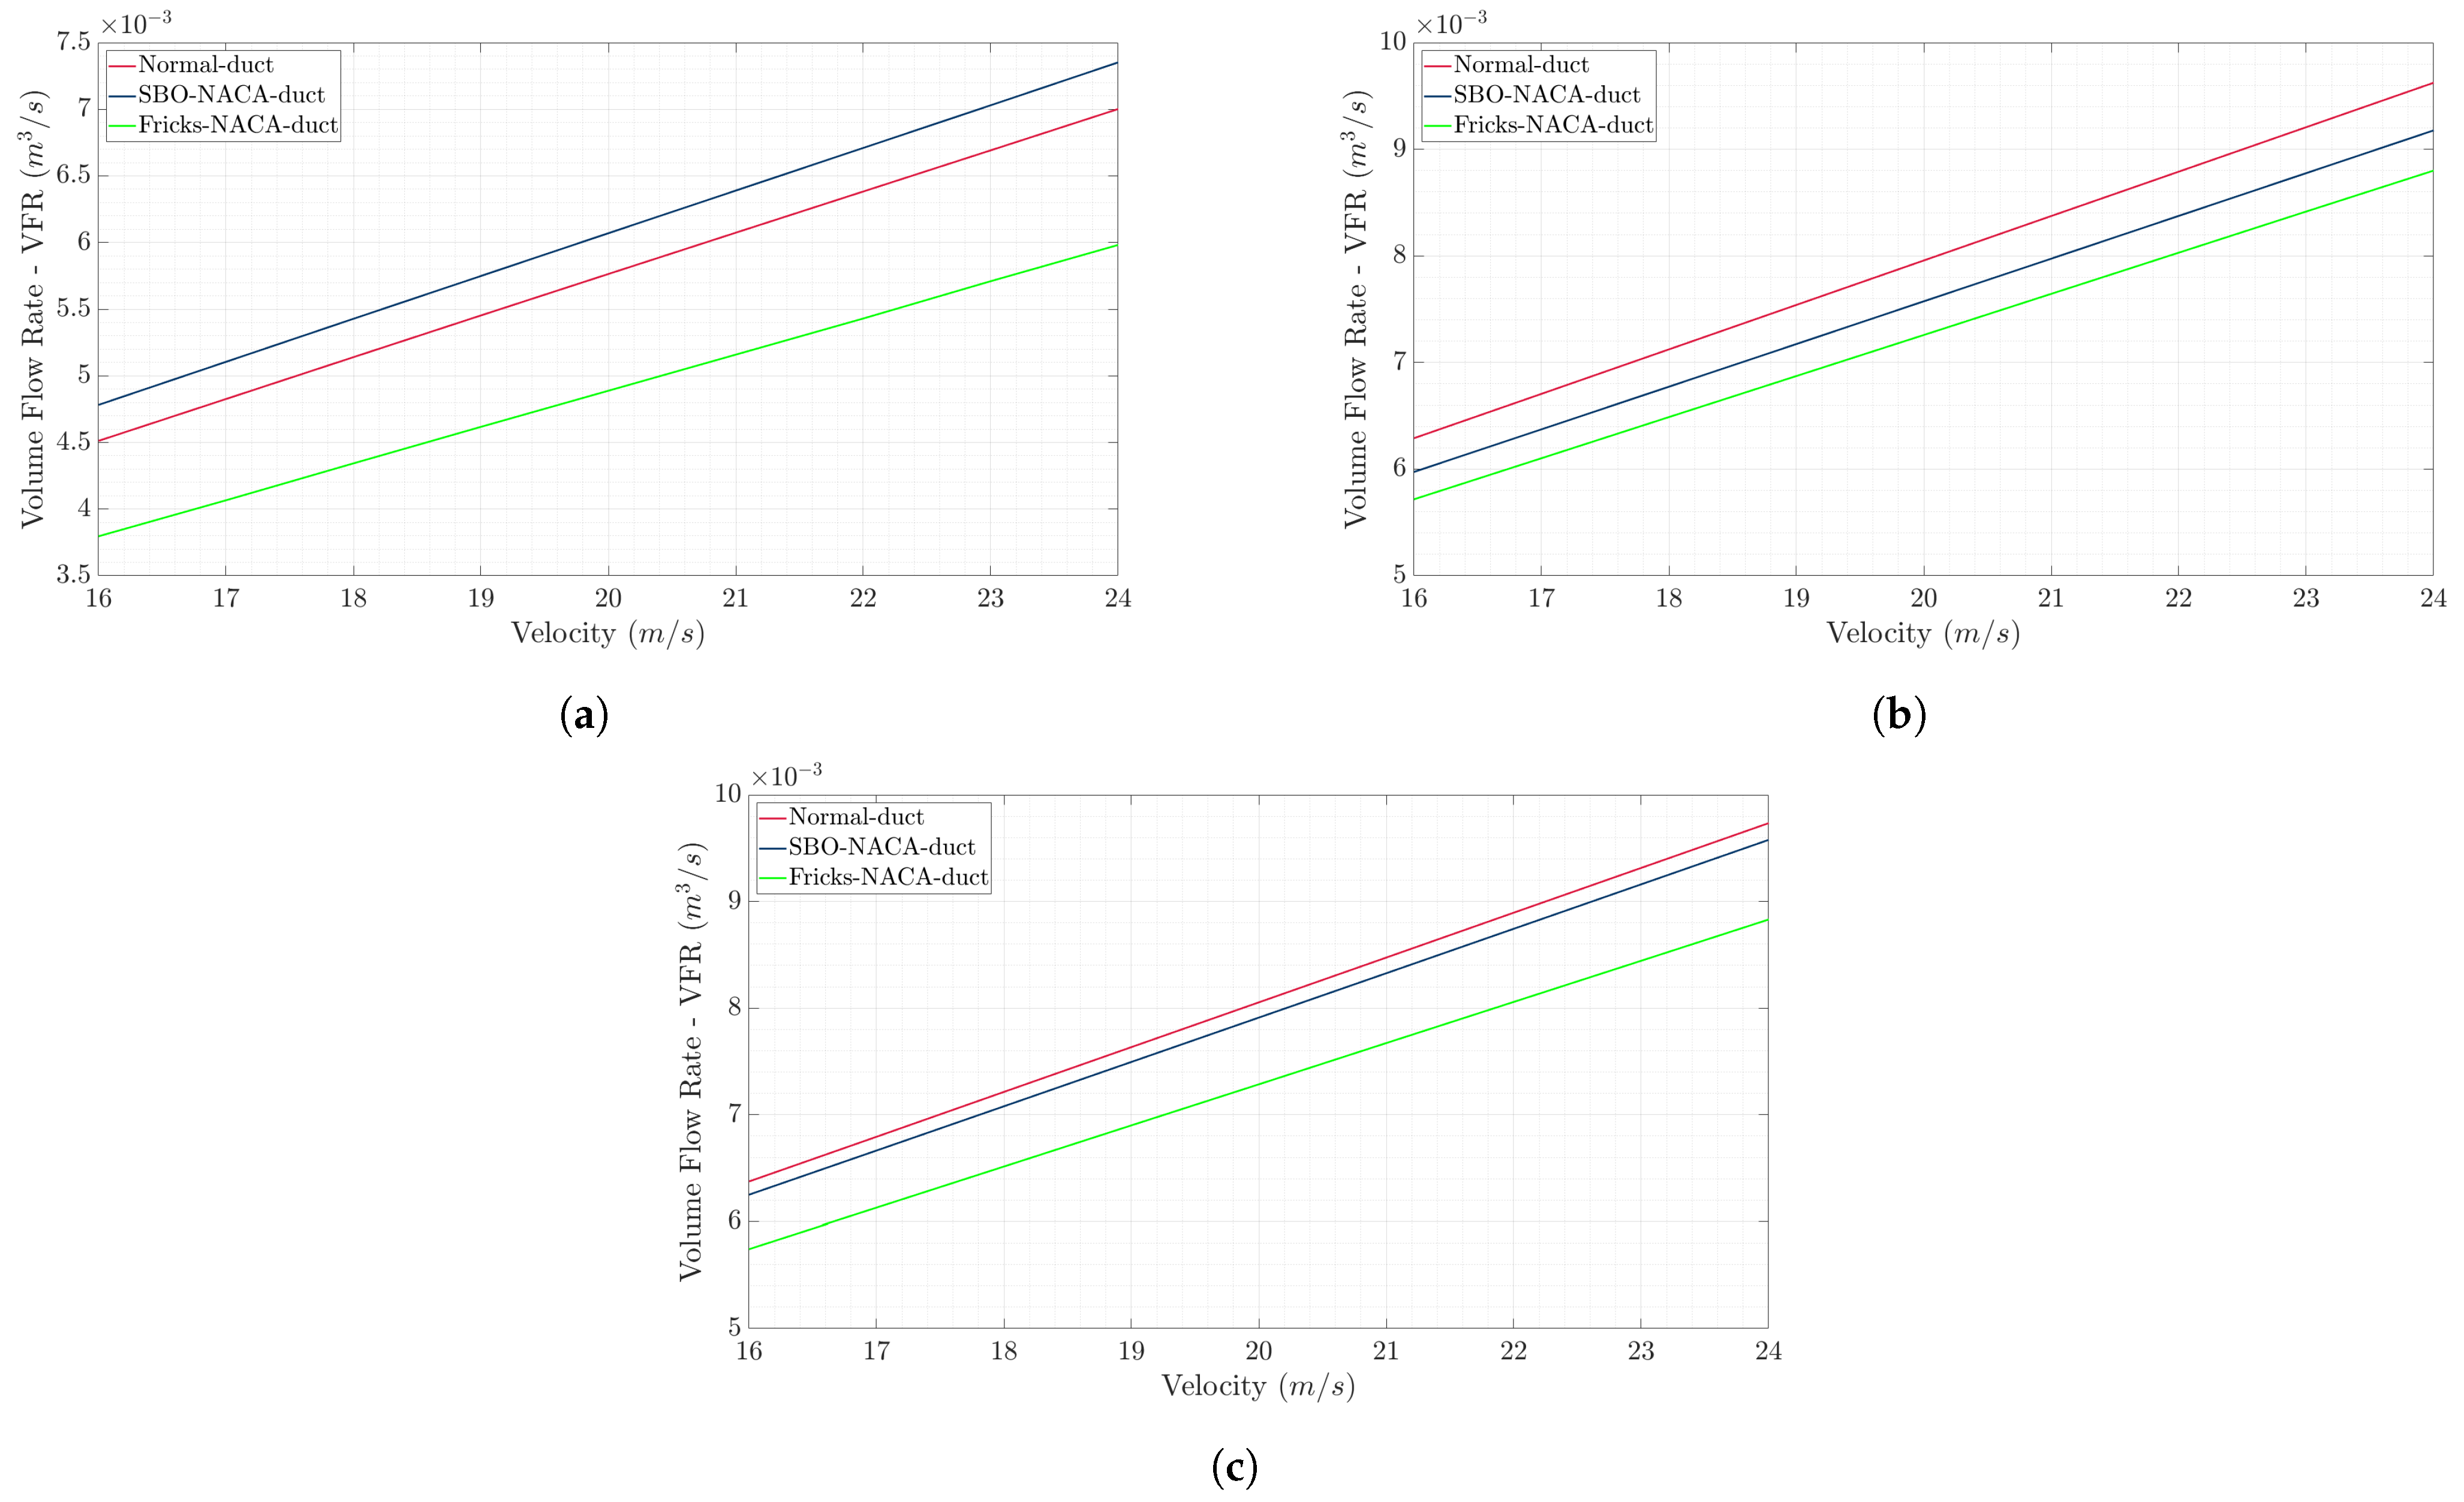
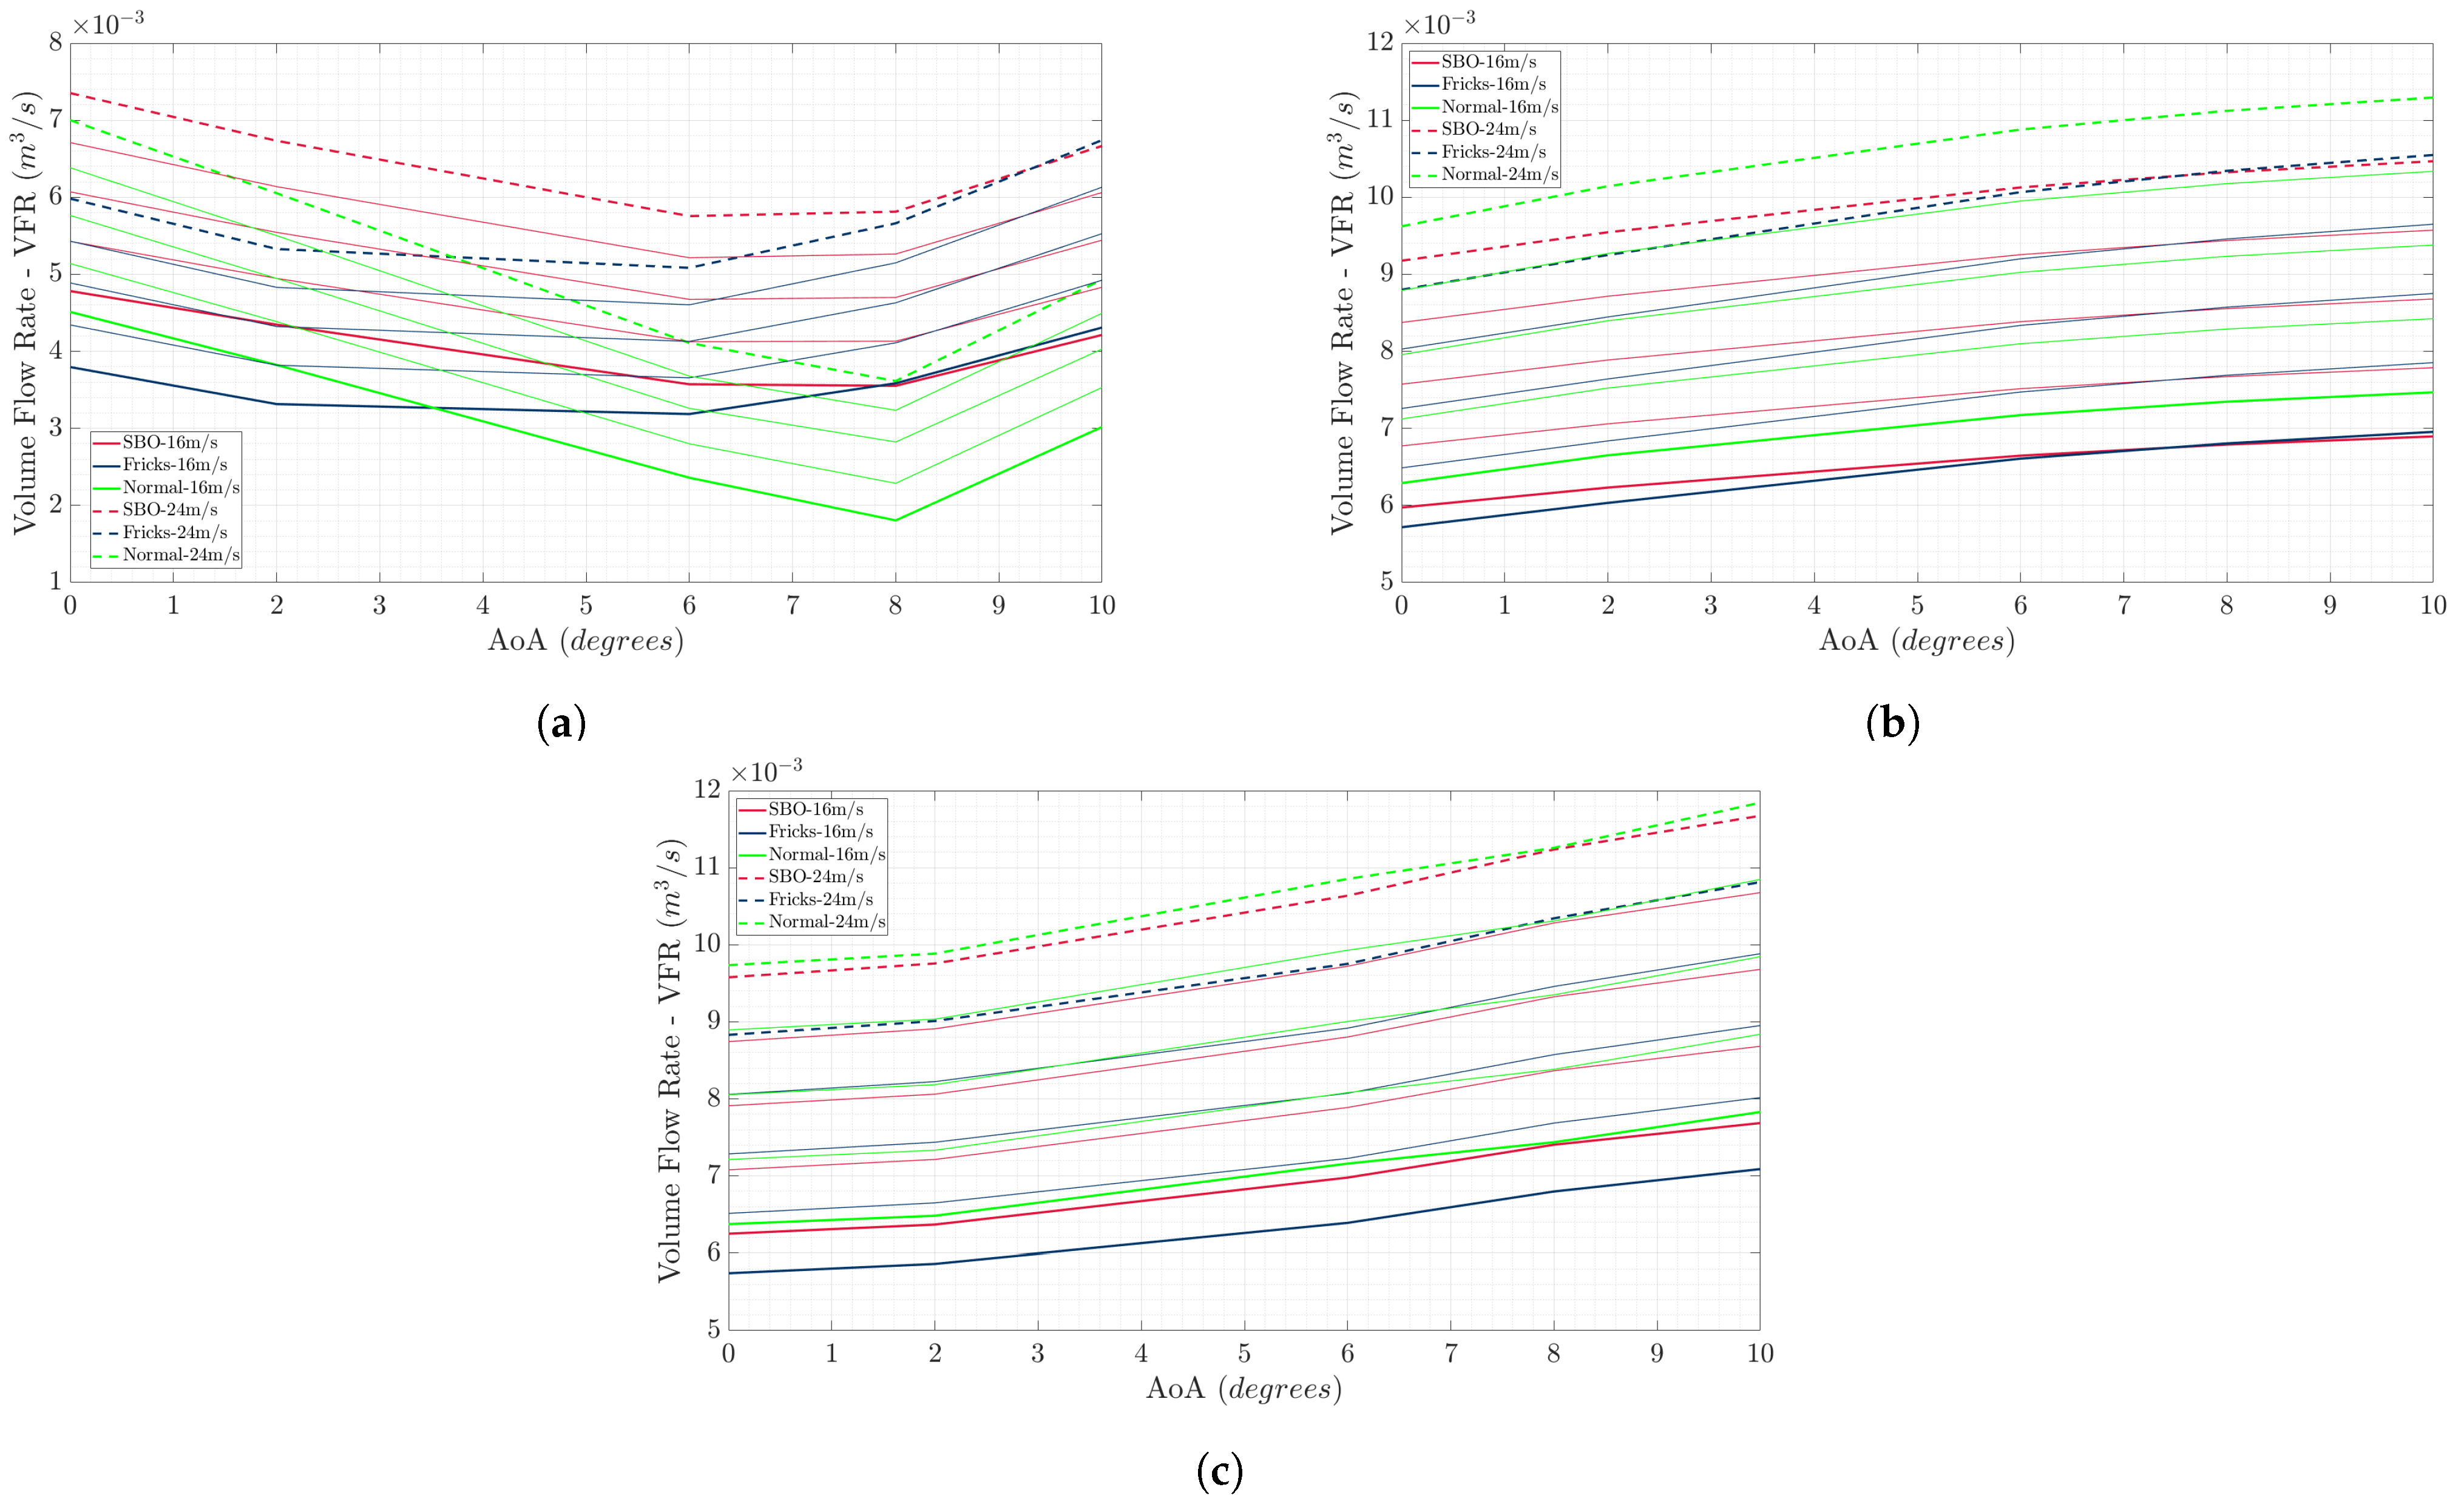
The results of the CFD analyses for the volume flow rate and aerodynamic performance of each duct configuration are presented in
Figure 9,
Figure 10,
Figure 11,
Figure 12,
Figure 13. Specifically,
Figure 9 illustrates the volume flow rate (VFR) obtained for each duct type and configuration across a range of flight velocities, while
Figure 10 and
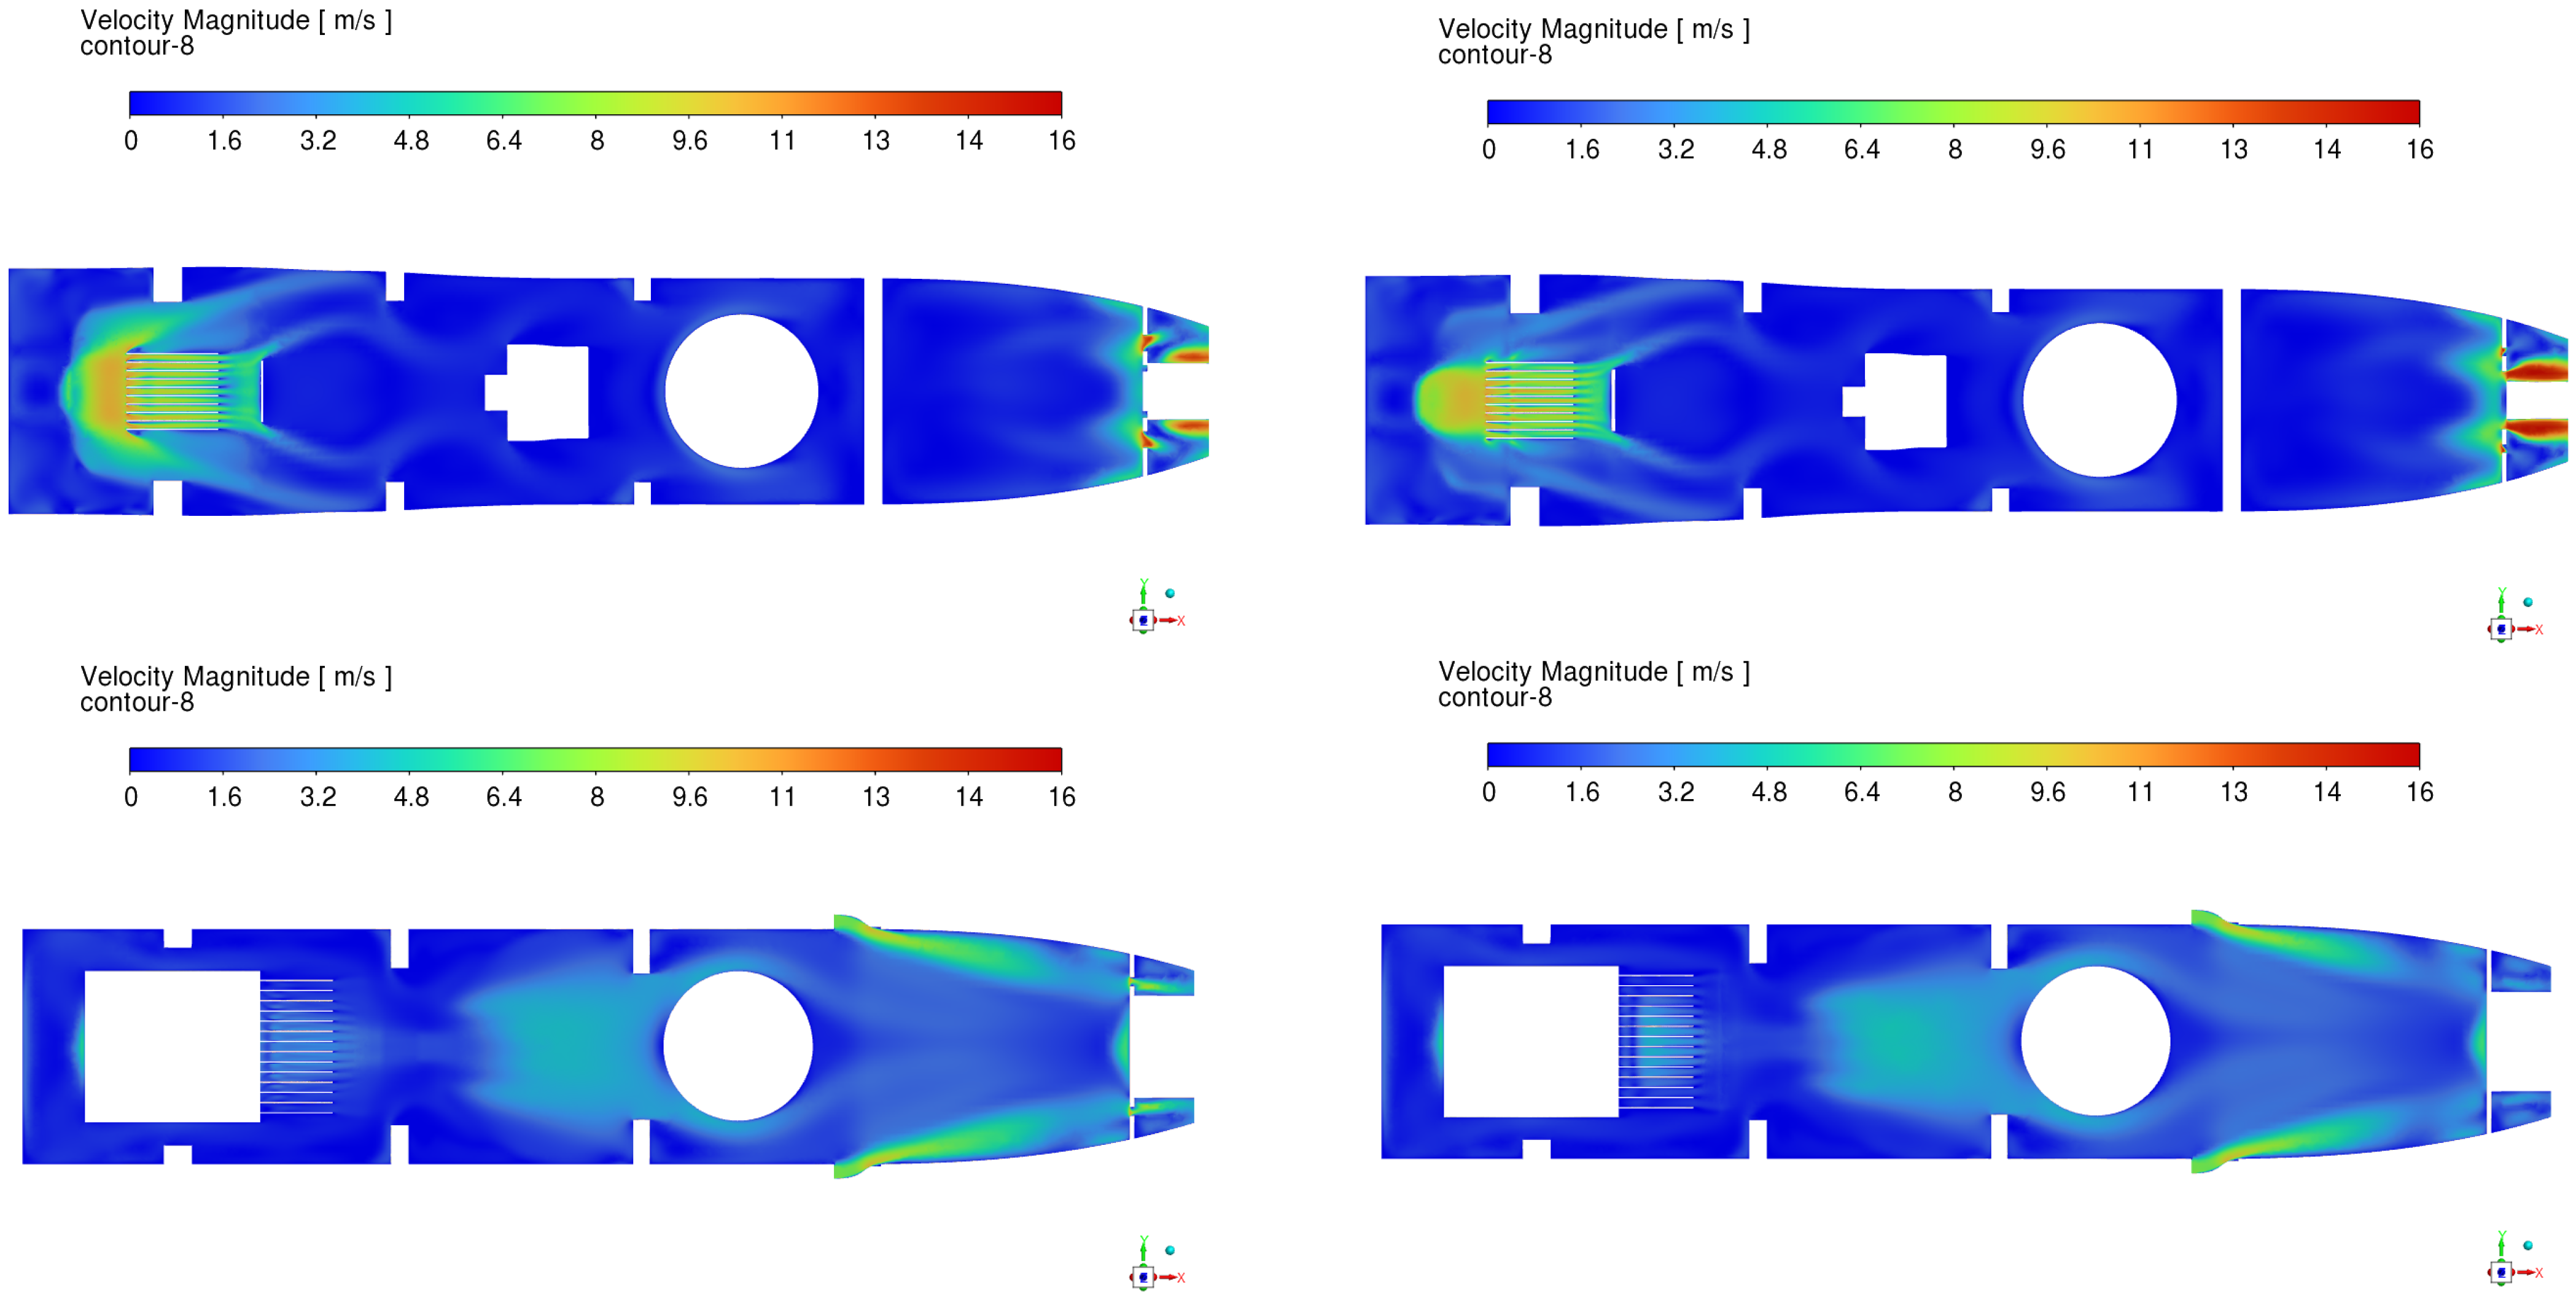
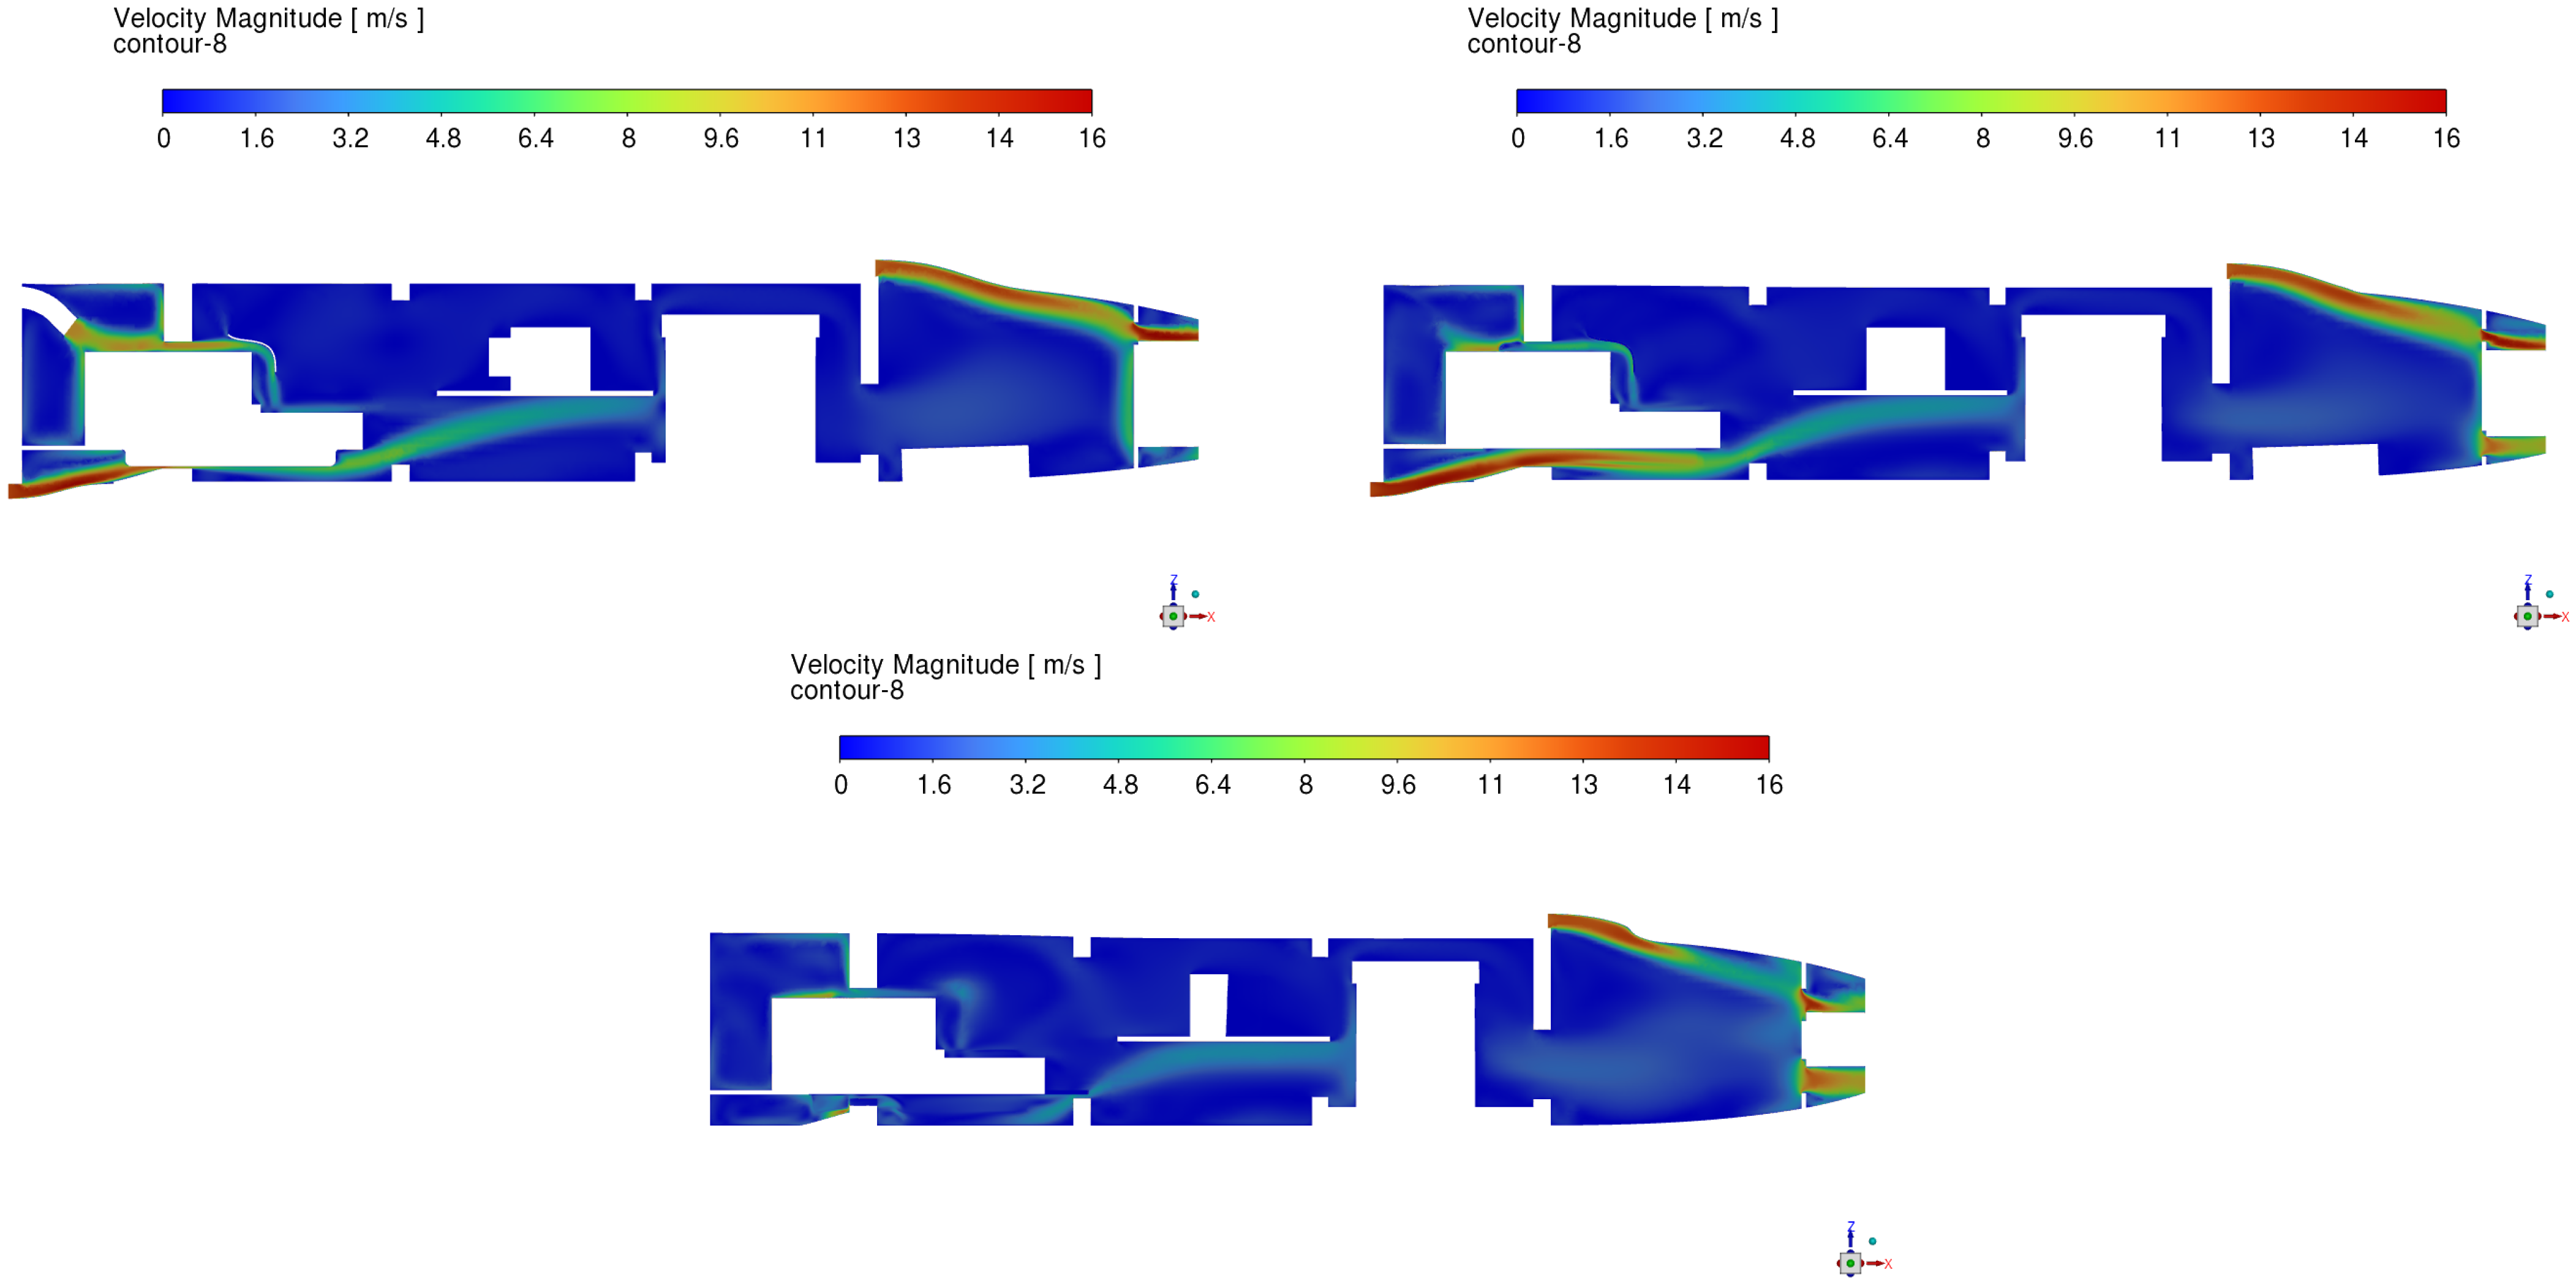
Figure 11 present the differences between the two NACA duct types according to the velocity contours on their inlet, and streamlines of the airflow around them.
Figure 12 presents the variation of the VFR for each duct and configuration as a function of both the angle of attack (AoA) and velocity, providing insight into the ducts’ sensitivity to different flight conditions. Finally,
Figure 13 shows the drag coefficient of the UAV for each duct configuration at various angles of attack and flight velocities, enabling a comparative evaluation of the aerodynamic penalties associated with each design.
Figure 9 indicates that the Frick NACA duct configuration is less effective than the other two configurations in terms of volume flow rate performance. Furthermore, the results show that the SBO-optimized NACA duct provides superior airflow capture on the upper surface of the UAV (duct-1), demonstrating its effectiveness in that location. Conversely, for the ducts positioned on the lower surface of the UAV, the rectangular duct configuration achieves higher volume flow rates compared to both NACA duct designs, suggesting that the rectangular inlet geometry performs more efficiently under the local flow conditions on the lower fuselage.
Figure 10 and
Figure 11 illustrate the velocity contours at the inlet and the corresponding velocity streamlines for the SBO-optimized NACA duct and Frick’s NACA duct, respectively, at an angle of attack of
. Frick’s NACA duct exhibits a larger separation vortex near the downstream edge of the inlet, which results in greater flow distortion and energy loss within the boundary layer. In contrast, the SBO-optimized duct shows a smoother and more confined vortex, indicating a smoother acceleration of the incoming flow toward the throat region. This improvement reduces local velocity deficits and enhances the overall volume flow rate (VFR) at the duct exit. The velocity contours confirm this behavior, showing higher and more uniform inlet velocities for the SBO-optimized configuration compared with Frick’s baseline geometry.
Figure 12 shows trends similar to those observed in
Figure 9, confirming the comparative performance of the different duct configurations. Additionally, due to the vortex created by the change in the angle of attack (AoA), the volume flow rate (VFR) for duct-1 (located on the upper surface of the UAV) decreases as the AoA increases from
to
for each type of duct. However, it then starts to rise again because the vortex then becomes beneficial to the airflow near the inlet for greater angles of attack. Throughout this variation, the SBO-optimized NACA duct consistently demonstrates the highest airflow efficiency, maintaining superior VFR values compared to both the Frick NACA duct and rectangular duct configurations.
Figure 13, which presents the drag coefficient (
) of the UAV for each duct configuration across various angles of attack (AoAs), reveals distinct performance trends. It can be observed that the rectangular duct configuration exhibits the lowest drag among all configurations at low angles of attack (
). However, as the AoA increases from
to
, the NACA duct configurations become aerodynamically more efficient, demonstrating lower drag coefficients compared to the rectangular design. Within this higher AoA range, the Frick NACA duct shows the best drag performance, achieving the lowest overall drag coefficient among the evaluated configurations.


