Article

Recalibrated Relationship of P-Wave Velocity in a Coal Seam with Depth in the South-Western Upper Silesian Coal Basin

1
Mineral and Energy Economy Research Institute of the Polish Academy of Sciences, Wybickiego 7A, 31-261 Kraków, Poland
2
Faculty of Civil Engineering and Resource Management, AGH University of Krakow, Mickiewicza 30, 30-025 Kraków, Poland
3
Faculty of Civil Engineering, Cracow University of Technology, Warszawska 24, 31-155 Kraków, Poland
4
Faculty of Geology, University of Warsaw, Krakowskie Przedmieście 26/28, 00-927 Warszawa, Poland
*
Author to whom correspondence should be addressed.
Appl. Sci. 2025, 15(23), 12505; https://doi.org/10.3390/app152312505
Submission received: 14 October 2025 / Revised: 13 November 2025 / Accepted: 24 November 2025 / Published: 25 November 2025
(This article belongs to the Special Issue Sustainable Research on Rock Mechanics and Geotechnical Engineering)

Abstract

P-wave velocity in coal seams increases with depth and reflects the in situ stress state in the rock mass. Anomalous velocity can indicate changes in the stress state resulting from various mining and geological disturbances. This information could contribute to the more efficient mining of coal at greater depths, particularly in seismically prone areas. The empirical relationship between P-wave velocity in coal seams and depth, developed by Dubiński in 1989, enables the determination of the magnitude of the velocity anomaly. However, this relationship was determined based on measurements taken to a depth of approximately 900 m. Currently, mining in the south-western Upper Silesian Coal Basin extends to greater depths, reaching around 1300 m. This study aims to update the empirical relationship for calculating reference P-wave velocities in coal seams by including new data. The archival 252 measurements were combined with 74 new velocity data from greater depths up to 1281 m. Regression analysis revealed that the updated power model offers a more reliable description of velocity changes in coal seams with increasing depth. This updated model can be used to identify anomalous stress zones and implement special protective measures in endangered mine workings. Our findings may contribute to reducing the risk of dynamic phenomena and enable more efficient exploitation of deep-seated coal seams.

1. Introduction

As a result of exploiting a multi-seam hard coal deposit, edges and remnants of unextracted seams are formed, leading to stress redistribution within the rock mass [1,2,3]. In the vicinity of these edges and remnants, stress concentrations occur in the rock mass (Figure 1). Such stress increases may adversely affect the stress–strain conditions around underground workings. Excessive stress can induce seismic activity, and in some cases, rockbursts, causing significant damage to mine excavations [4,5,6,7,8,9,10,11,12,13]. These dynamic phenomena seriously limit the mining of coal seams at greater depths.
To assess the extent of the influence of edges and remnants on the stress state within a coal seam, seismic profiling—a method of profiling refracted P-wave velocity—is conducted [1,14,15]. These surveys are performed in zones potentially affected by edges and remnants. The measurements enable a realistic assessment of the relative increase in stress under specific geological and mining conditions. Although such analyses may be carried out using mathematical methods, they are subject to substantial limitations. In analytical or numerical modeling, it is difficult to accurately determine the current stress and deformation state in an excavation disturbed by mining operations due to the influence of the time elapsed since the formation of edges and remnants.
Seismic profiling also enables the assessment of stress relief in a mining excavation induced by the extraction of a coal panel located in an overlying or underlying seam (Figure 1) [1,14]. The magnitude of this stress relief depends on both distance and time. Over time, the degree of stress relief decreases as post-mining voids and fractures progressively close. Seismic profiling has also been applied to evaluate stress variations caused by faults reactivated as a result of coal seam extraction [16,17]. Furthermore, it can be employed to assess the effectiveness of rockburst prevention measures such as destress blasting, destress drilling, coal seam hydration, and other preventive techniques [6,18,19].
The fundamental indicator of stress state variation determined in seismic measurements in coal seams is the change of wave velocity [20,21,22,23,24,25,26,27,28,29]. This change in velocity, known as a seismic anomaly, is widely calculated relative to a reference velocity. The reference velocity is most commonly determined from an empirical relationship describing the variation of P-wave velocity with depth in coal seams under specific geological and mining conditions. It may also be measured directly using seismic profiling in a section of the underground excavation where the stress state is undisturbed. Accurate determination of the reference velocity is crucial for estimating the magnitude of the seismic anomaly and the influence of geological and mining disturbances. The scale of relative stress corresponding to magnitude of seismic anomaly in the geological conditions of the Upper Silesian Coal Basin (USCB) was elaborated [1].
The first relationship for calculating reference velocity in coal seams was developed by Dubiński [1] in 1989 for mining operations in the USCB at depths ranging from 500 to 900 m. Velocity measurements were primarily taken within this interval, with limited data available from depths below 900 m, which restricts the formula’s initial applicability. However, coal seams are currently being exploited at increasingly greater depths, reaching approximately 1300 m. As a consequence, the geomechanical conditions have evolved, altering the dependence of P-wave reference velocity on depth. This necessitates recalibrating Dubiński’s formula [1] to ensure its applicability under current conditions.
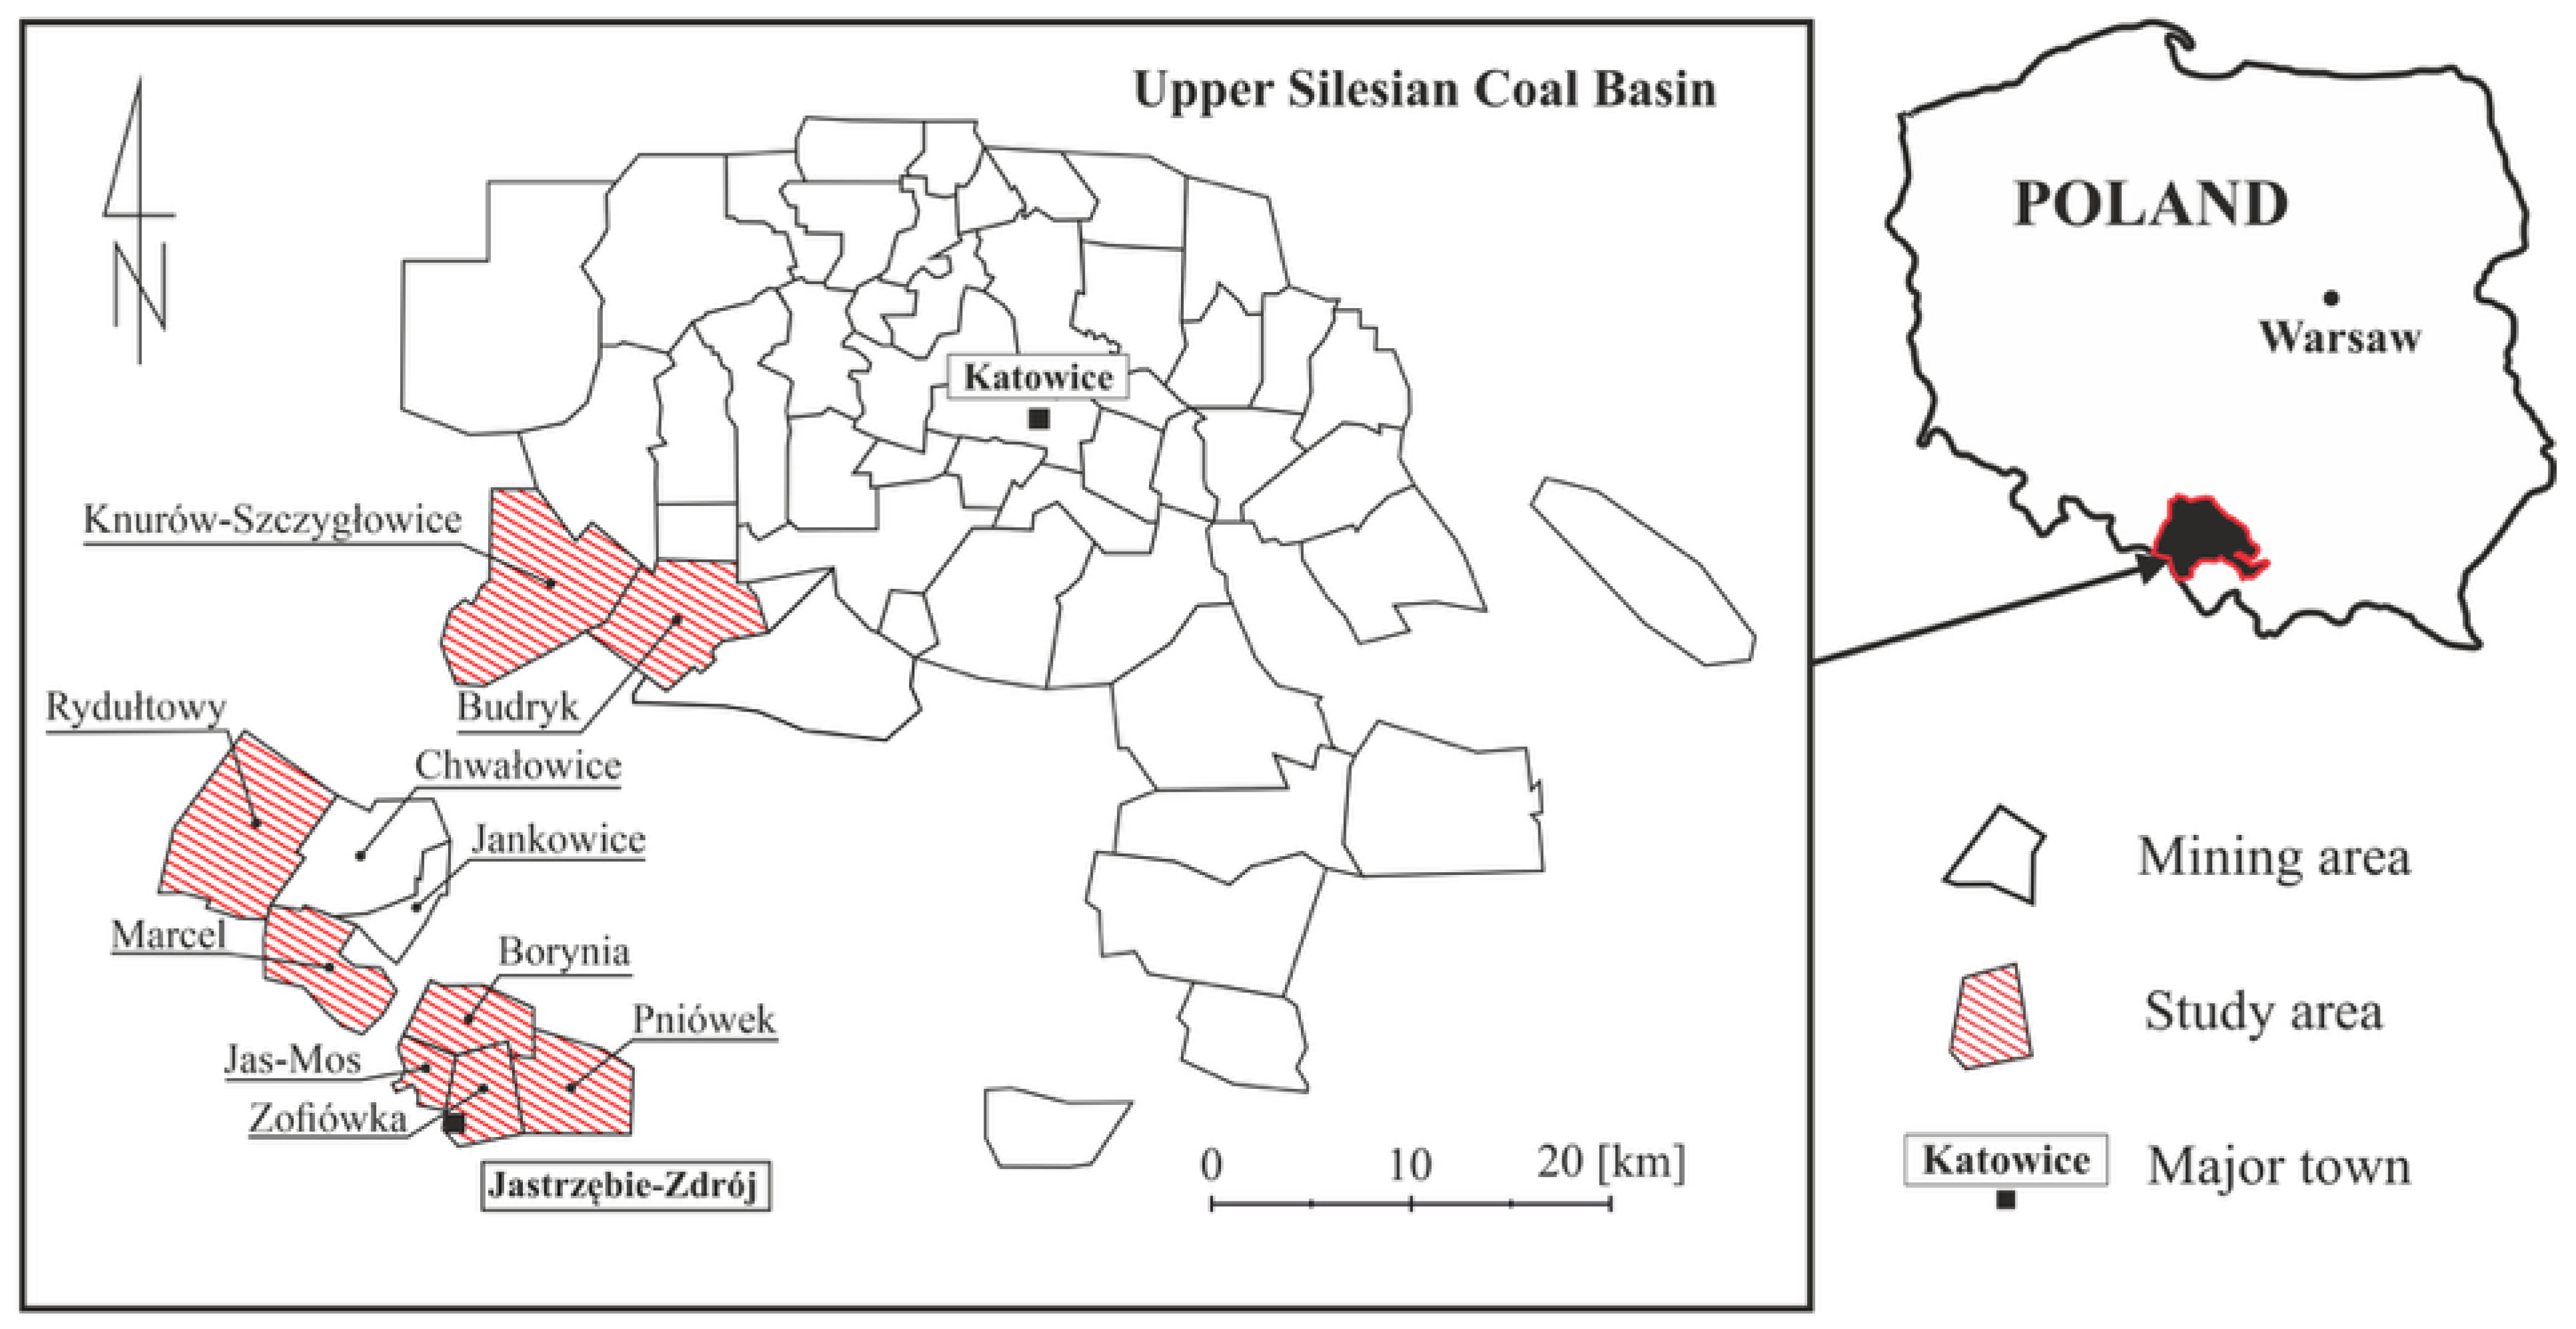
The study aims to present a new empirical relationship for calculating the P-wave reference velocity in the south-western part of USCB (Figure 2). The novelty of this study lies in recalibrating the empirical P-wave velocity–depth relationship using the largest dataset acquired to date (316 measurements), extending the depth range from 900 m to 1300 m, and statistically demonstrating that the updated regional power-law model provides significantly higher accuracy compared with the archival Dubiński formula [1].
The study area comprises eight coal mines (Figure 2). It includes coal seams from the Paralic of Mississippian and Upper Silesian Sandstone, Mudstone, and Kraków Sandstone of Pennsylvanian lithological series. The lithostratigraphic properties of coal seams vary depending on the sedimentary environment. In the Mississippian Paralic Series, the coal seams are thin and discontinuous, with higher ash and sulfur content. In contrast, in the Pennsylvanian coal-bearing series, the seam coals are thicker, more uniform, and purer. The heterogeneity factor for velocity discrepancies in the analyzed coal seams for depth intervals was analyzed.
Several local empirical relationships for the reference P-wave velocity have been previously developed for specific mines within this part of the USCB, namely the Jastrzębie Coal Mine [30] and the Zofiówka Coal Mine [20]. Kokowski et al. [30] presented an empirical power-law model describing the variation of P-wave reference velocity in coal seams with depth, analogous to Dubiński’s [1] model, under the geological conditions of the Jastrzębie Coal Mine. This power-law relationship was derived from 35 additional seismic profiling measurements conducted in various coal seams of the Jastrzębie mine at depths ranging from 640 to 1200 m. The corrected P-wave reference velocity values were higher than those predicted by the archival Dubiński model. Further details are provided in the Results and Discussion section. Łapczyński et al. [20] modified the archival Dubiński [1] model by incorporating 24 additional measurements obtained at greater depths, ranging from 704 to 1073 m, under the geological and mining conditions of the Zofiówka Coal Mine. The coefficients of the modified model did not differ significantly from those of the archival model and were similar to those reported by Kokowski et al. [30] for the neighboring Jastrzębie Coal Mine. This confirms the consistency and reliability of the models derived under comparable geological conditions for both Zofiówka and Jastrzębie.
Compared with the previously established empirical relationships for the adjacent Jastrzębie and Zofiówka mines, the new proposed relationship enables the determination of P-wave reference velocity for a wider set of coal mines. This model is based on the largest dataset compiled to date, resulting in more accurate estimates. It should also be emphasized that the data used in the calculations predominantly originated from coal mines located in the south-western part of the USCB (Figure 2).
In calculating the reference velocity of the P wave, one can also use the relationship characterizing the reference velocity for the central part of the USCB, as given by Dubiński [1]. This relationship does not include data from hard coal mines in the Jastrzębie-Zdrój region. The new relationship fills this gap and is therefore important for seismic investigations performed in coal mines in this part of the USCB.
The seismic investigations presented in this study were employed to assess the magnitude and extent of stress variations, thereby enabling the design of preventive measures that reduce the risk of rockbursts in underground mine workings. In some cases, information indicating the absence or minimal extent of such stress influence is equally important, as it allows for reducing costs associated with rockburst prevention measures—for example, reinforcement of excavation support or the execution of special destress blasting operations.

2. Theoretical Background

In comparison to the previous studies [20,30], the theoretical background is further elaborated upon in this section.
Seismic profiling in coal seams enables the measurement of the refracted P-wave velocity, which propagates through undisturbed elastic zones located near the boundary with disturbed plastic and residual plastic zones adjacent to the excavation. Both the plastic and residual plastic zones are collectively referred to as the Excavation Disturbed Zone (EDZ). The theoretical boundary between the elastic and plastic zones is indicated by the red line in Figure 3, according to the Ladanyi model [31].
The model is based on the following assumptions [31]:
  • The rock mass is homogeneous and isotropic, and a circular excavation with a radius r has been made within it. The surrounding rock mass is initially under hydrostatic stress p0, and the radial support pressure exerted by the lining is constant and equal to pi.
  • The problem is axially symmetric along the axis of the excavation; therefore, σθ and σr denote the tangential and radial stresses, respectively. The principal stresses σ1 and σ3 correspond to the maximum and minimum principal stresses, assuming that the stresses along the excavation axis take intermediate values. Plane strain conditions are considered, independent of the stress state along the axis of the excavation.
  • It is assumed that the equilibrium equation of the Lamé problem is satisfied, which, in cylindrical coordinates, takes the following form:
σ r r + σ r σ θ r = 0
  • The rock mass initially behaves as a linearly elastic material, and its strength is described by the Mohr–Coulomb failure criterion expressed as:
σ 1 = k σ 3 + σ c m
where:
k   = 1   + sin φ 1   sin φ
σcm—uniaxial compressive strength of the rock mass, φ—internal friction angle.
  • In the plastic zone, at the boundary with the residual plastic zone, the behavior of the rock mass is described by the Mohr–Coulomb failure criterion in the form:
σ 1 = k x   σ 3 + σ c m x
where:
  k x   = 1   + sin φ x 1   sin φ x
where the quantities with the superscript (x) refer to the fractured rock mass.
  • Outside the plastic zone, the rock mass behaves elastically, and Hooke’s law applies in this zone:
  σ r σ θ = E ( 1 v ) ( 1 + v ) ( 1 2 v )   1 v 1 v v 1 v 1   ε r ε θ
where:
  • υ—Poisson ratio,
  • ε r ,   ε θ —radial and tangential strains, respectively.
At the boundary between the elastic zone and the EDZ, the tangential stress reaches its maximum value (Figure 4). The refracted P-wave propagates along this boundary on the elastic side. However, under field conditions, the boundary between the elastic and EDZ has a transitional character. It depends on the properties of the coal seam and the local stress state. The measured P-wave velocity is therefore close to the velocity within the elastic zone (Figure 4).
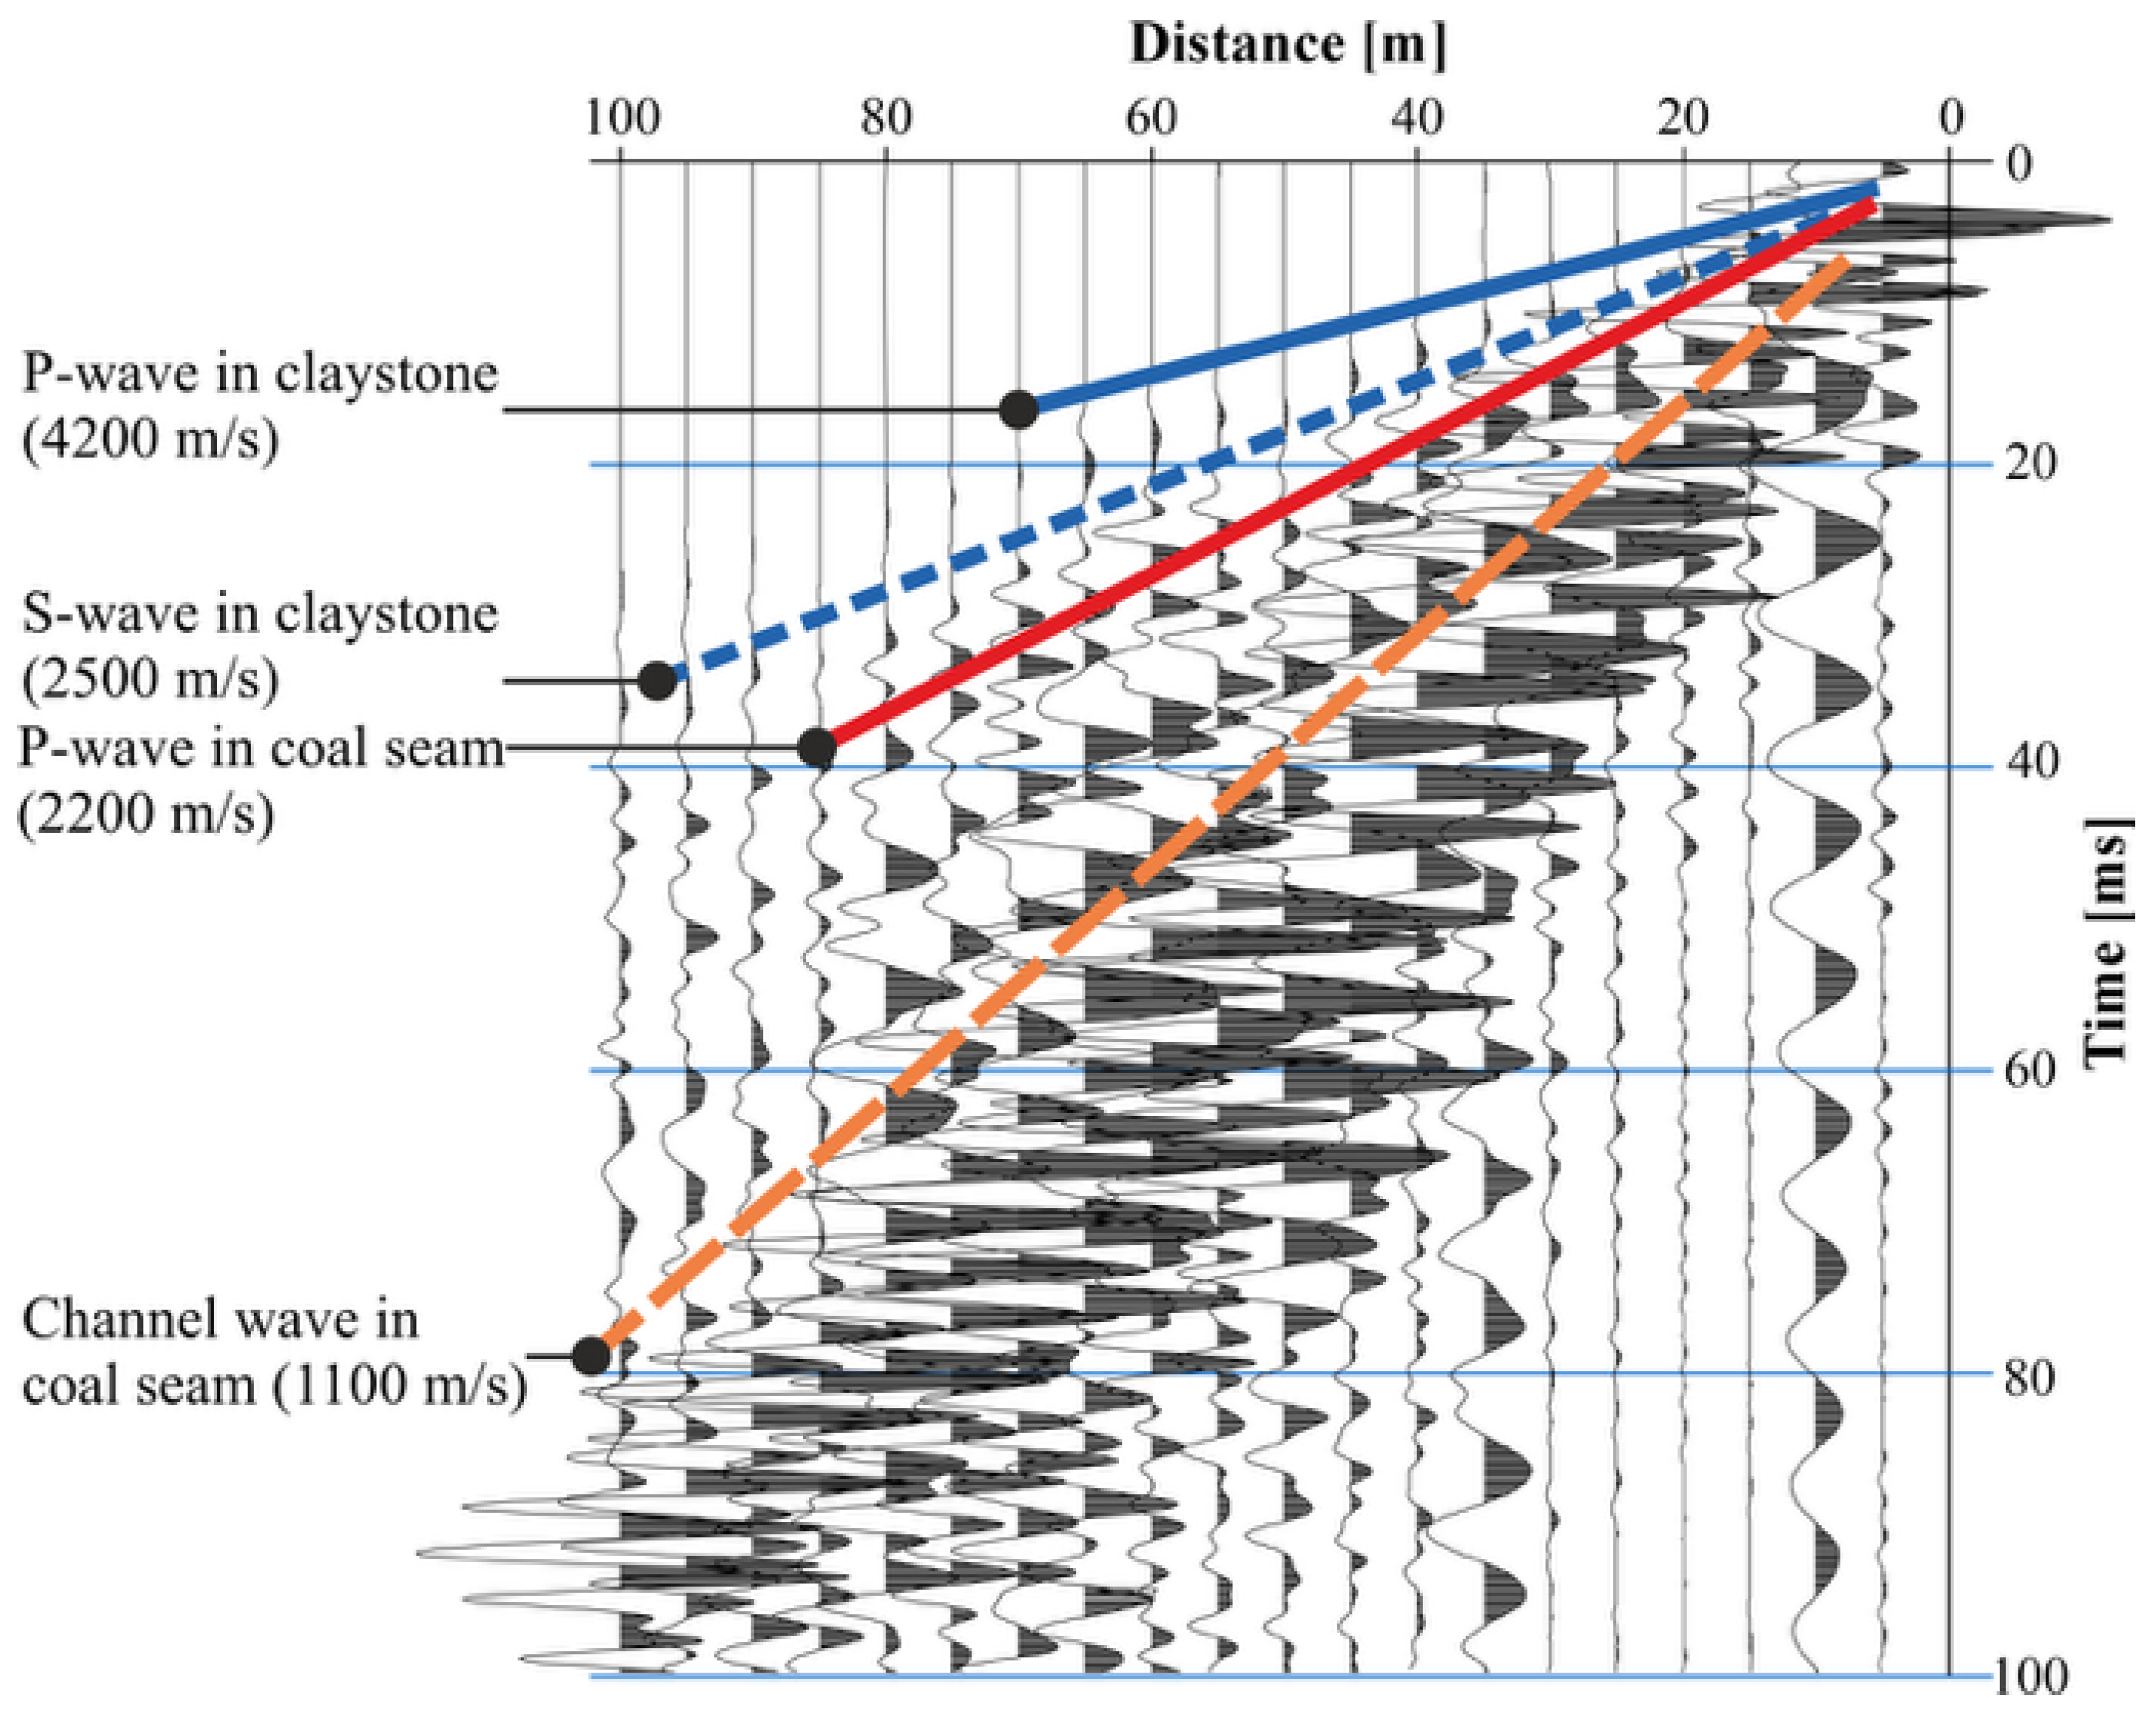
Using seismic profiling, we can determine the P-wave velocity in the coal seam along a specific section in the heading (Figure 4a). A wave field within the structure of the coal seam and its neighboring rock layers is complex (Figure 5). Identifying the first breaks of a P-wave in a heterogeneous medium is challenging due to the complicated wave interactions in the EDZ. Under these conditions, several types of waves, including direct, reflected, diffracted, refracted waves and channel waves, can be generated.
The measured P-wave velocity V0 enables the determination of seismic anomalies in coal seams at a specific stress state. The VP velocity is compared to a V0 reference velocity calculated from an empirical Dubiński relationship [1]:
V 0   =   1200   +   4.83 · h 0.76
where h is the depth of the measured P-wave velocity.
Finally, the seismic anomaly A is calculated using the formula:
A   =   V P V 0 V 0 · 100   %
This seismic anomaly enables the determination of the relative increase or decrease in stress within the coal seam [1]. The scale that correlates seismic anomaly values to corresponding stress changes within the USCB geological conditions for depths ranging from 500 to 900 m is detailed in Table 1.

3. Geological Setting

The Upper Silesian Coal Basin, situated in southern Poland (Figure 2), is one of the most important hard coal deposits in Europe. It developed as part of the Variscan foreland basin and comprises Mississippian-Pennsylvanian clastic successions that contain numerous coal seams (Table 2) [32].
The productive Carboniferous succession attains several kilometers in thickness, diminishing from more than 4000 m in the western part of the basin to approximately 1000 m in the east. It is subdivided into the Paralic of Mississippian and Upper Silesian Sandstone, Mudstone, and Kraków Sandstone of Pennsylvanian lithological series. They together contain several hundred documented coal seams (Table 2). The lithostratigraphic variability of coal-bearing series is closely reflected in the diversity of coal seam properties. In the Mississippian Paralic Series, seam coals formed within deltaic and marginal-marine environments are typically thin, laterally discontinuous, and characterized by higher ash and sulfur contents due to frequent marine incursions and clastic input. In contrast, seam coals of the Pennsylvanian coal-bearing series, deposited in fluvial–lacustrine settings of an alluvial plain, are generally thicker, laterally persistent, and purer. The stable, predominantly continental sedimentation favored extensive peat accumulation with lower mineral admixture. Petrographic composition also differs, with Paralic coals enriched in inertinite and mineral matter, whereas Pennsylvanian coals are dominated by vitrinite derived from well-preserved woody material. These contrasts highlight the significant impact that depositional settings and lithostratigraphic frameworks have on the quality and distribution of coal seams.
The Carboniferous strata are overlain by Neogene and Quaternary sediments, primarily consisting of clays, sands, and gravels, with thicknesses ranging from a few tens to several hundred meters. The structural framework of the basin is complex, comprising numerous normal and reverse faults that generally trend north–south (N–S) and east–west (E–W). Tectonics is particularly intense in the south-western part of the basin, where it exerts a significant control on coal seam distribution and continuity.
This study focused on mining districts located in the south-western part of the USCB (Figure 2). In the Knurów-Szczygłowice and Budryk mines, the Carboniferous succession is dominated by the Upper Silesian Sandstone Series and the overlying Mudstone Series. These strata consist of sandstones, mudstones, and claystones, with numerous productive coal seams of considerable thickness. The structural pattern is relatively simple, characterized by monoclinal bedding gently dipping eastwards, locally offset by faults with throws reaching several tens of meters.
Further to the southwest, the Rydułtowy and Marcel mines are underlain by a greater thickness of Carboniferous strata assigned to the Paralic Series, specifically the Jaklovec Beds. In the Rydułtowy area, coal exploitation is concentrated within the Paralic and Upper Silesian Sandstone, which represent the dominant lithostratigraphic units of this part of the basin [32]. In the Marcel area, the deposit is divided into two structural troughs separated by the Michałkowice thrust fault, which exerts a strong control on local coal seam distribution. The geological setting in both mining areas is complicated by a dense fault network that causes significant variability in seam continuity and localized variations in dip.
In the southern part of the study area, the Jastrzębie, Zofiówka, Borynia, and Pniówek mines are grouped within the Jastrzębie-Zdrój region. In this structural domain, the productive Carboniferous succession comprises the Orzesze, Ruda, and Saddle seams, which contain multiple coal seams extending to depths exceeding 1200 m. Lithologically, these units comprise alternating claystones, mudstones, and sandstones, with coal seams typically associated with clay shales, and less frequently, with sandstones in the roof part [32]. The tectonic framework of this region is strongly influenced by the Jastrzębski fault, which separates the western and eastern parts of the deposit. To the west, the strata dip monoclinally eastwards at 10–15°, whereas in the east of and southeastern zones, the dips are gentler, generally ranging from 2° to 7°. The Carboniferous succession is further disrupted by a dense system of predominantly normal faults, with throws ranging from a few decimeters to more than 60 m [32].

4. Methods and Data

The calculation procedure follows a three-stage structure, similar to that of earlier studies by Kokowski et al. [30] and Łapczyński et al. [20]. It comprises the preparation of the dataset, modeling of the P-wave velocity–depth relationship, and verification of the statistical models.

4.1. Preparation of the Dataset

A combined dataset of 326 velocity-depth values was compiled, consisting of both archival and new P-wave velocity values measured in coal mines in the south-western part of USBC. The archival dataset of Dubiński [1] counted 252 measurements. The new dataset contained seventy-four measurements, including twenty-six from the Zofiówka Coal Mine [20], twenty-one from the Jastrzębie Coal Mine [30], two from Pniówek Coal Mine, seven from Borynia Coal Mine, two from Rydułtowy Coal Mine, eight from Marcel Coal Mine, three from Knurów-Szczygłowice Coal Mine, and five from Budryk Coal Mine (Table 3).
The dataset statistics used in the calculations are presented in Table 4. To measure the P-wave reference velocity, sections of seismic profiles were selected that were not affected by local mining and geological disturbances, such as faults, seam edges, and remnants. This often required either extending the existing seismic profile or conducting an additional profile. This methodological approach ensured that the reference velocity values reliably reflect the in situ conditions of the coal seams and are consistent with earlier studies [20,30]. The new data extended deeper than in previous studies, reaching a depth of 1281 m. The inclusion of these additional depths provided a solid basis for updating the archival velocity–depth model to reflect better geological and mining conditions across the coal mines in the study area.

4.2. Modeling of the Velocity–Depth Relationship

Analogs to the previous articles [20,30], reference velocity V0 was assumed to be a function of depth h, according to the power model initially proposed by Dubiński [1]:
V 0 = 1200 + a · h b
where a and b are estimated constants. The constant 1200 (m/s) is the average value of the P-wave velocity measured on coal samples in the laboratory.
For comparison, a linear model was also analyzed:
V 0 = c 0 + c 1 · h
Linear and nonlinear regression curves were generated for the combined dataset using Statistica software ver. 7.1. Parameter estimation for the nonlinear model was carried out using the Levenberg–Marquardt algorithm, which iteratively updates the parameter vector ∆p according to:
p = J T J + λ I 1 · J T r
where J is the Jacobian matrix of residual derivatives with respect to the parameters, r is the residual vector, λ is the damping parameter, and I is the identity matrix.
Residuals were computed for each observation, and points for which the residual exceeded twice the standard deviation σ were excluded:
σ = i = 1 n y i y i ^ 2 n
where yi is the individual observed values of the dependent variable; ŷl is the value predicted by the regression model for the i-th observation, and n is the number of observations.
After excluding outlying points, the final calibration was based on the most consistent dataset.

4.3. Verification of Statistical Models

The most suitable regression model for estimating P-wave velocity as a function of depth was verified and statistically evaluated through several steps.
First, the quality of the regression fit was evaluated using the Root Mean Square Error (RMSE), the Variance Accounted For (VAF), and the Coefficient of Determination (R2):
R M S E = 1 n i = 1 n y i y i ^ 2    
where yi is the observed value, ŷl is the predicted value from the regression model for the i-th observation, and n is the number of observations.
V A F = 1 V a r y y i ^ V a r y × 100 %
where Var(yŷl) is the variance of the residuals and Var(y) is the variance of the observed values.
R 2 = i = 1 n y i ^ y _ 2 i = 1 n y i y _ 2        
where y is the arithmetic mean of all y values.
Second, the analysis included the calculation of the total systematic error, which accounted for uncertainties in determining the P-wave onset on the seismogram and in geophone positioning in the excavation sidewall. This error was calculated using the total differential equation:
Δ y r = i = 1 n f x i x 1 , x 2 , , x n Δ x i
where:
i = 1 n f x i x 1 , x 2 , , x n Δ x i = x 1 Δ x 1 + x 2 Δ x 2 + + x n Δ x n f x 1 , x 2 , , x n
where yr is the value of the function after changing its arguments, xi are the independent variables, and Δxi are their uncertainties.
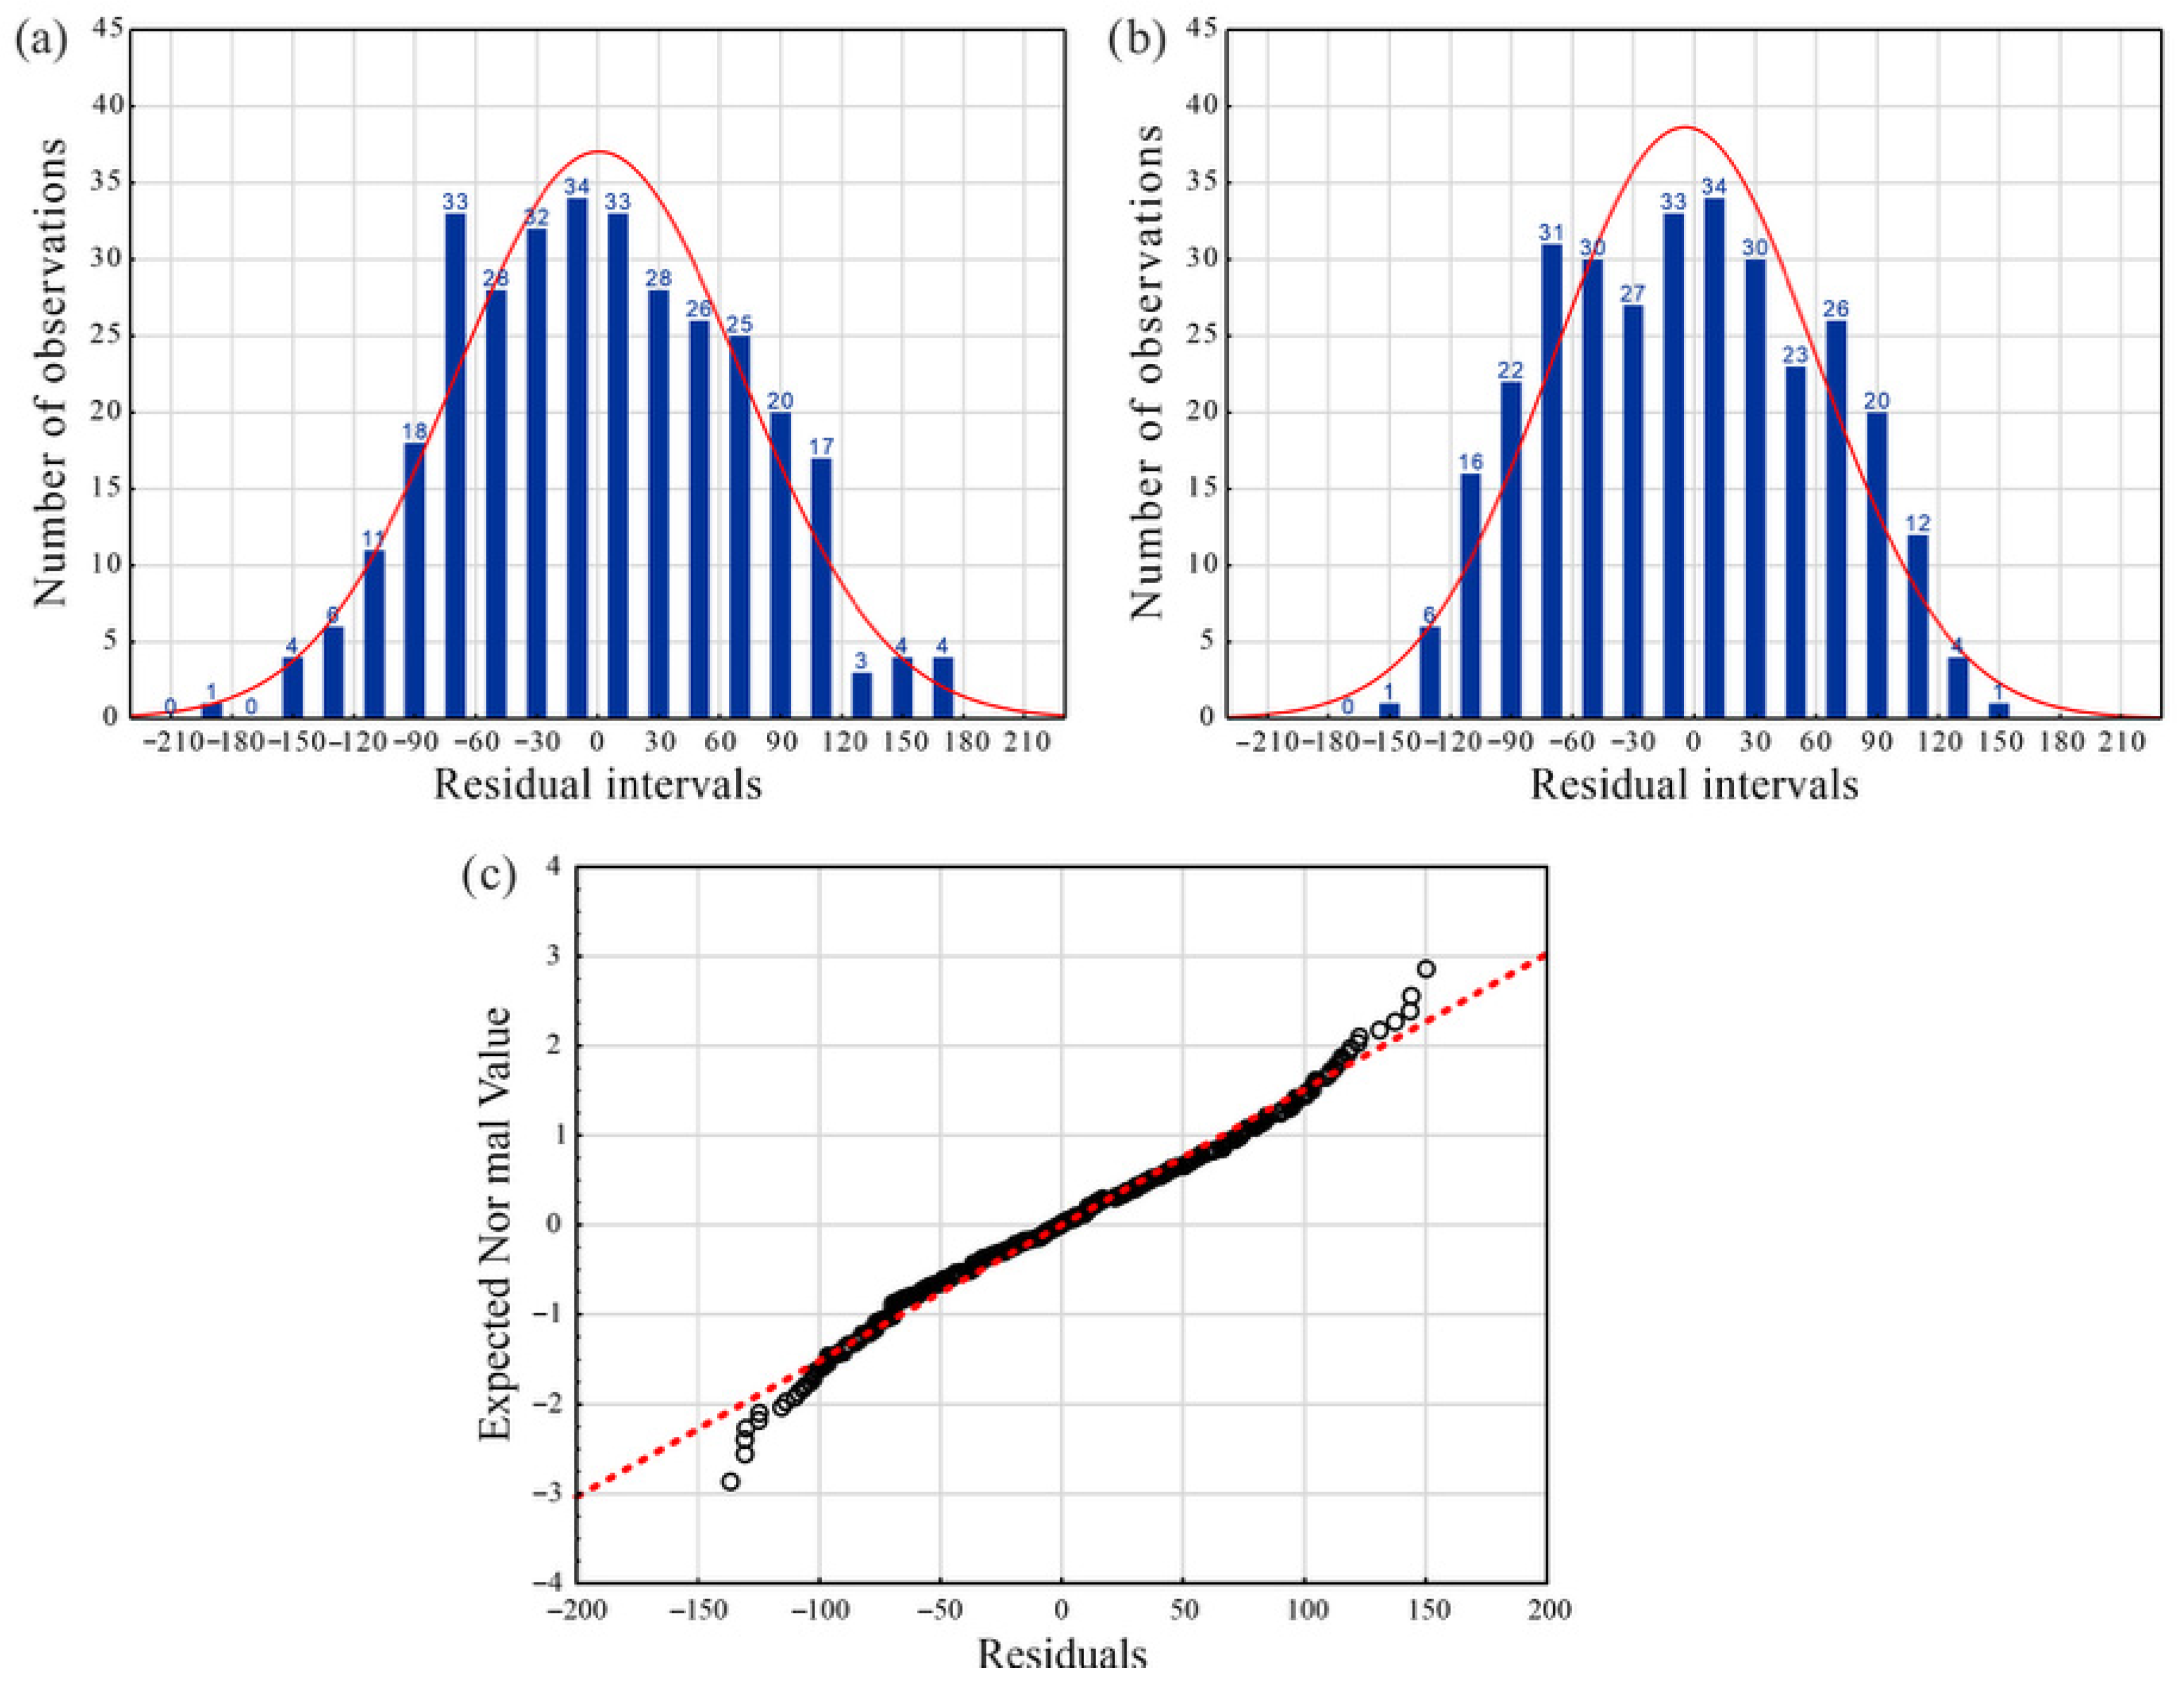
Finally, after selecting the best-fitting model, the regression assumptions were verified. The Breusch–Pagan test was applied to examine potential heteroscedasticity in the residuals of the fitted model. The distribution of residuals was examined using histograms of standardized residuals before and after outlier removal, as well as a normal probability plot. In addition, confidence intervals and standard errors of the estimated parameters were calculated to assess the precision of the regression coefficients.
The heterogeneity factor (hf) was calculated to quantify the variability between the measured and modeled P-wave velocities in different coal seams. The entire dataset was divided into the following depth intervals: 200–400 m, 400–600 m, 600–800 m, 800–1000 m, 1000–1200 m, and 1200–1400 m. The calculation was performed using the following formula [34]:
h f = σ V m
where σ is the standard deviation of the residual (difference between measured and modeled P-wave velocity) and Vm is the mean measured P-wave velocity in the respective depth interval.
This formula represents a relative variability measure commonly used in the statistical characterization of spatial heterogeneity in geophysical and geotechnical datasets.

5. Results and Discussion

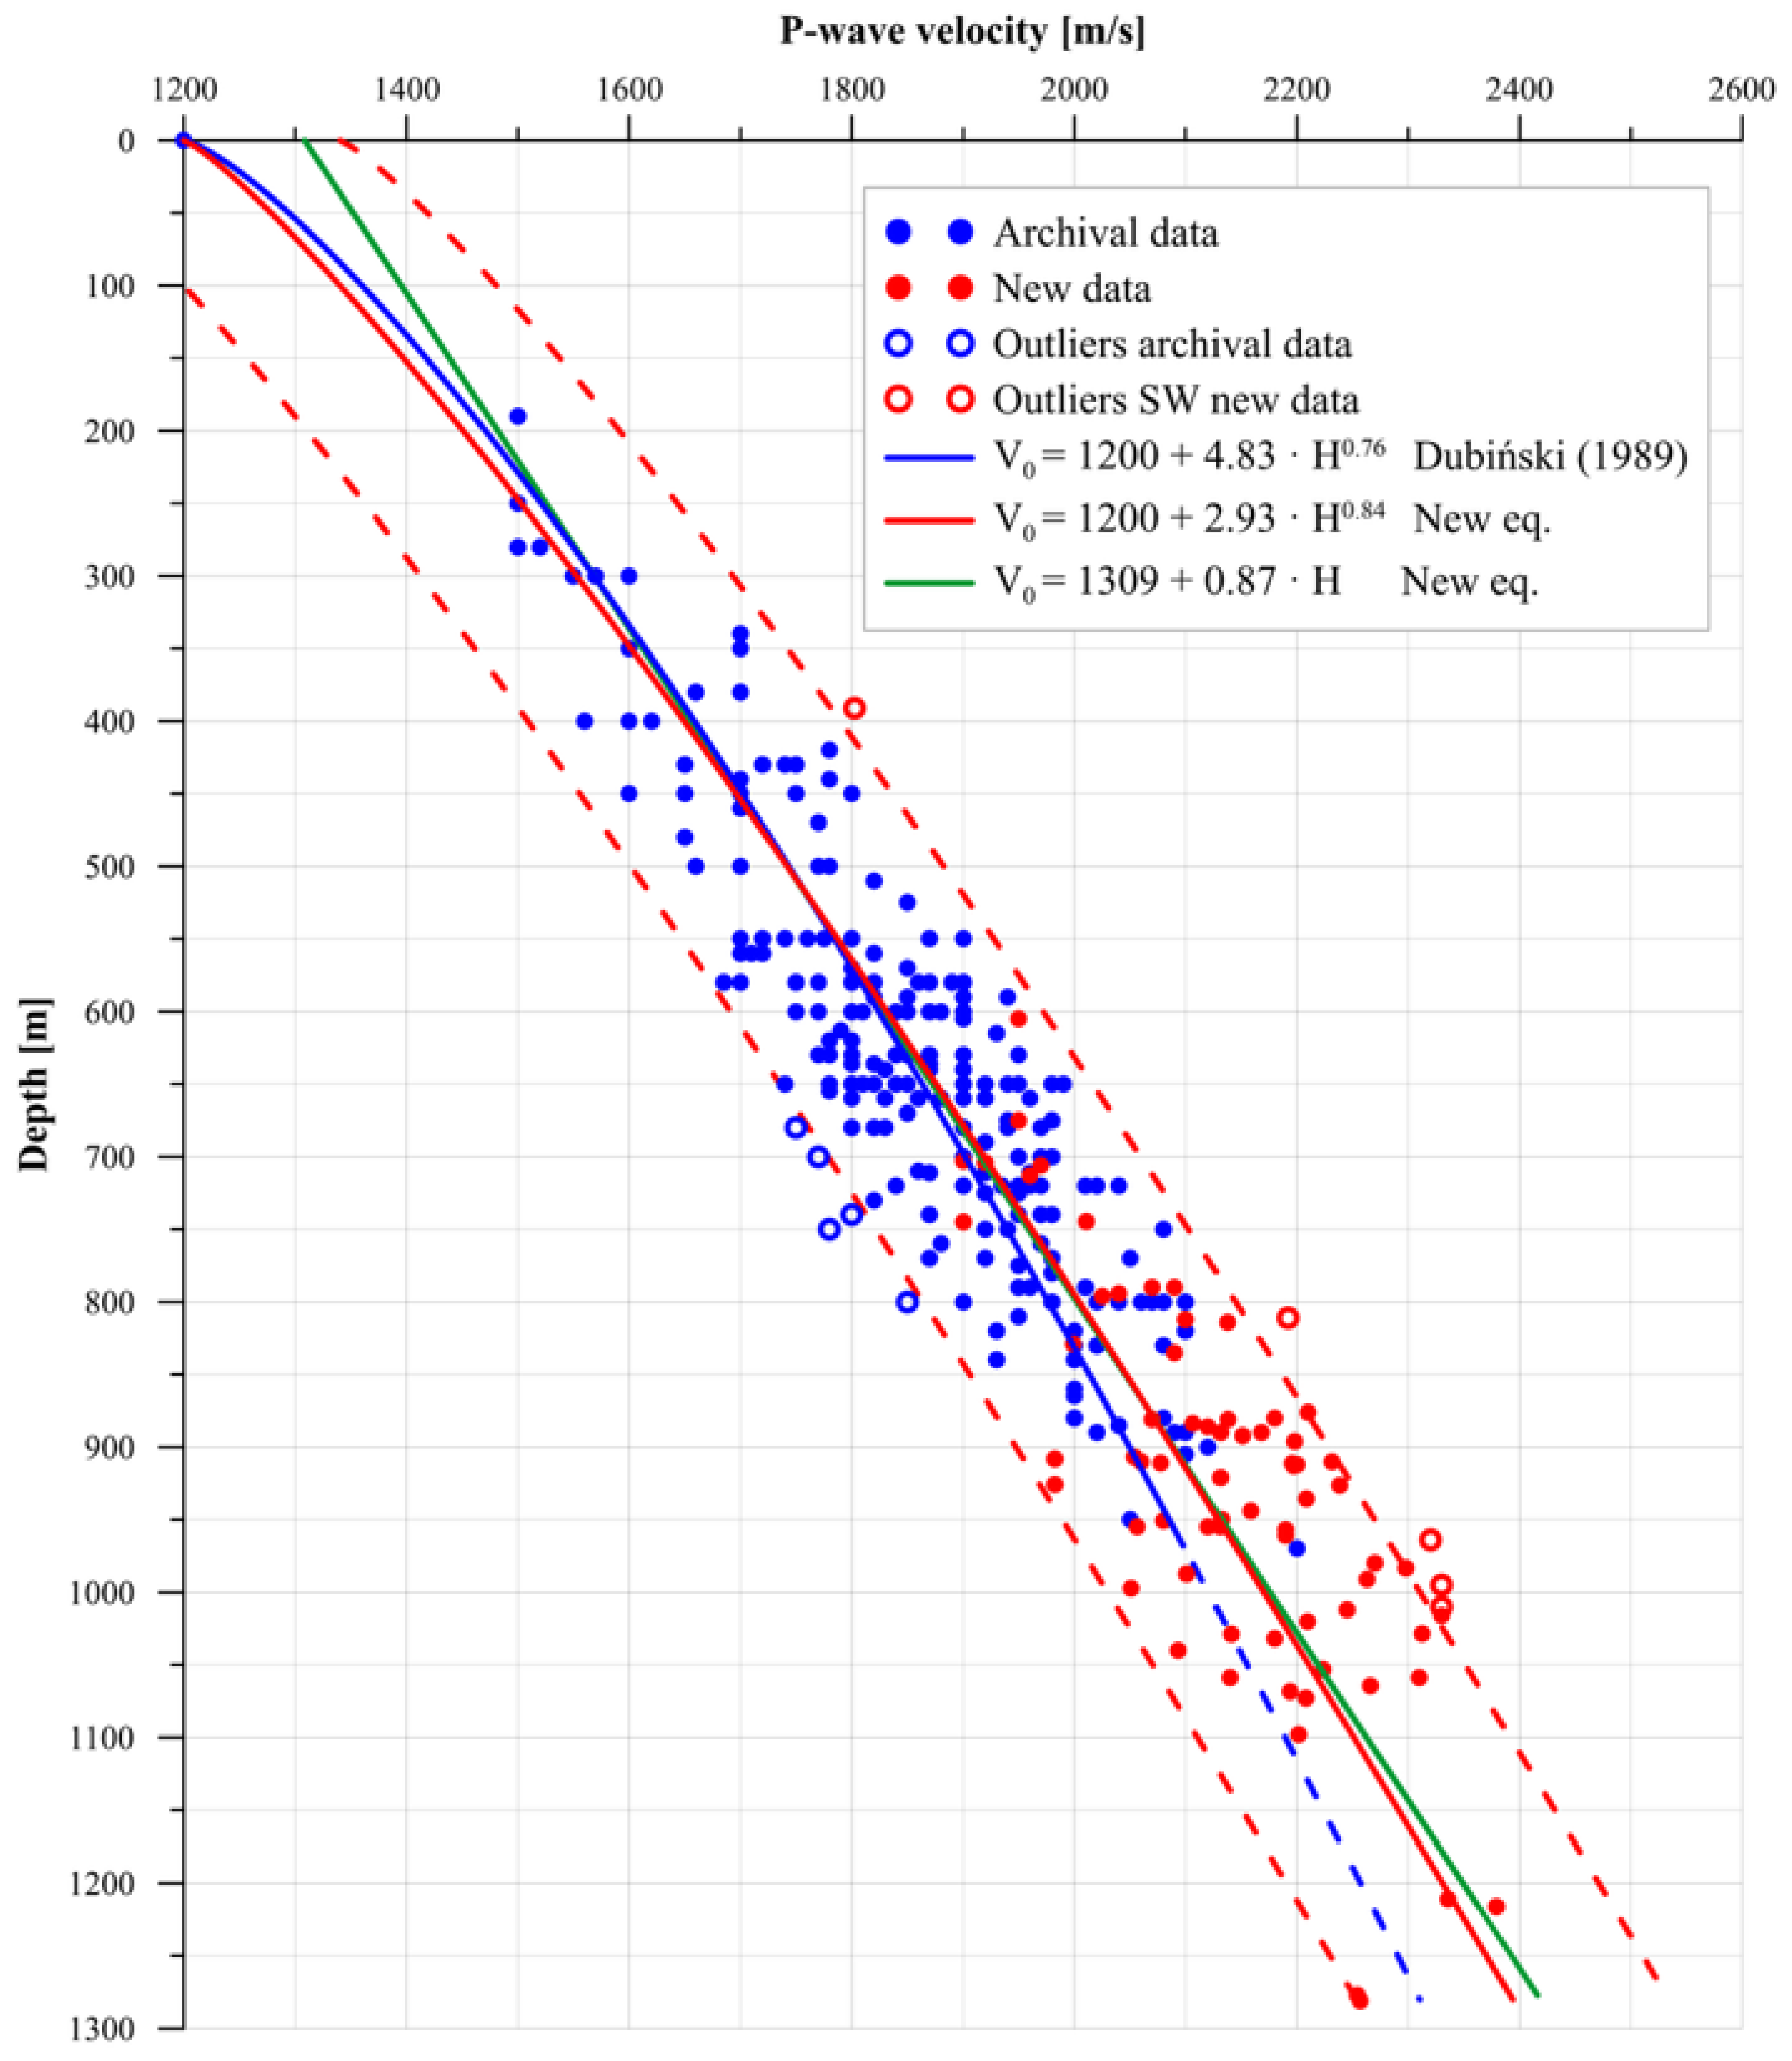
In the combined dataset, which contained 252 archival and 74 new points from south-western USCB coal mines, outlier detection was performed. The dataset was reduced by ten outliers: five archival and five new. After refining, 316 points remained for model regression evaluation. The power-law model best represented the analyzed dataset, whereas the linear model failed to capture the velocity–depth relationship. Figure 6 shows the combined dataset, the tested regression curves (linear and power-law), and the excluded outliers.
The initial power-law regression model, prior to outlier removal, is expressed as follows:
V 0   =   1200   +   2.93 · h 0.84
Using the refined dataset, the nonlinear regression produced the following updated velocity–depth model for the south-western USCB coal mines:
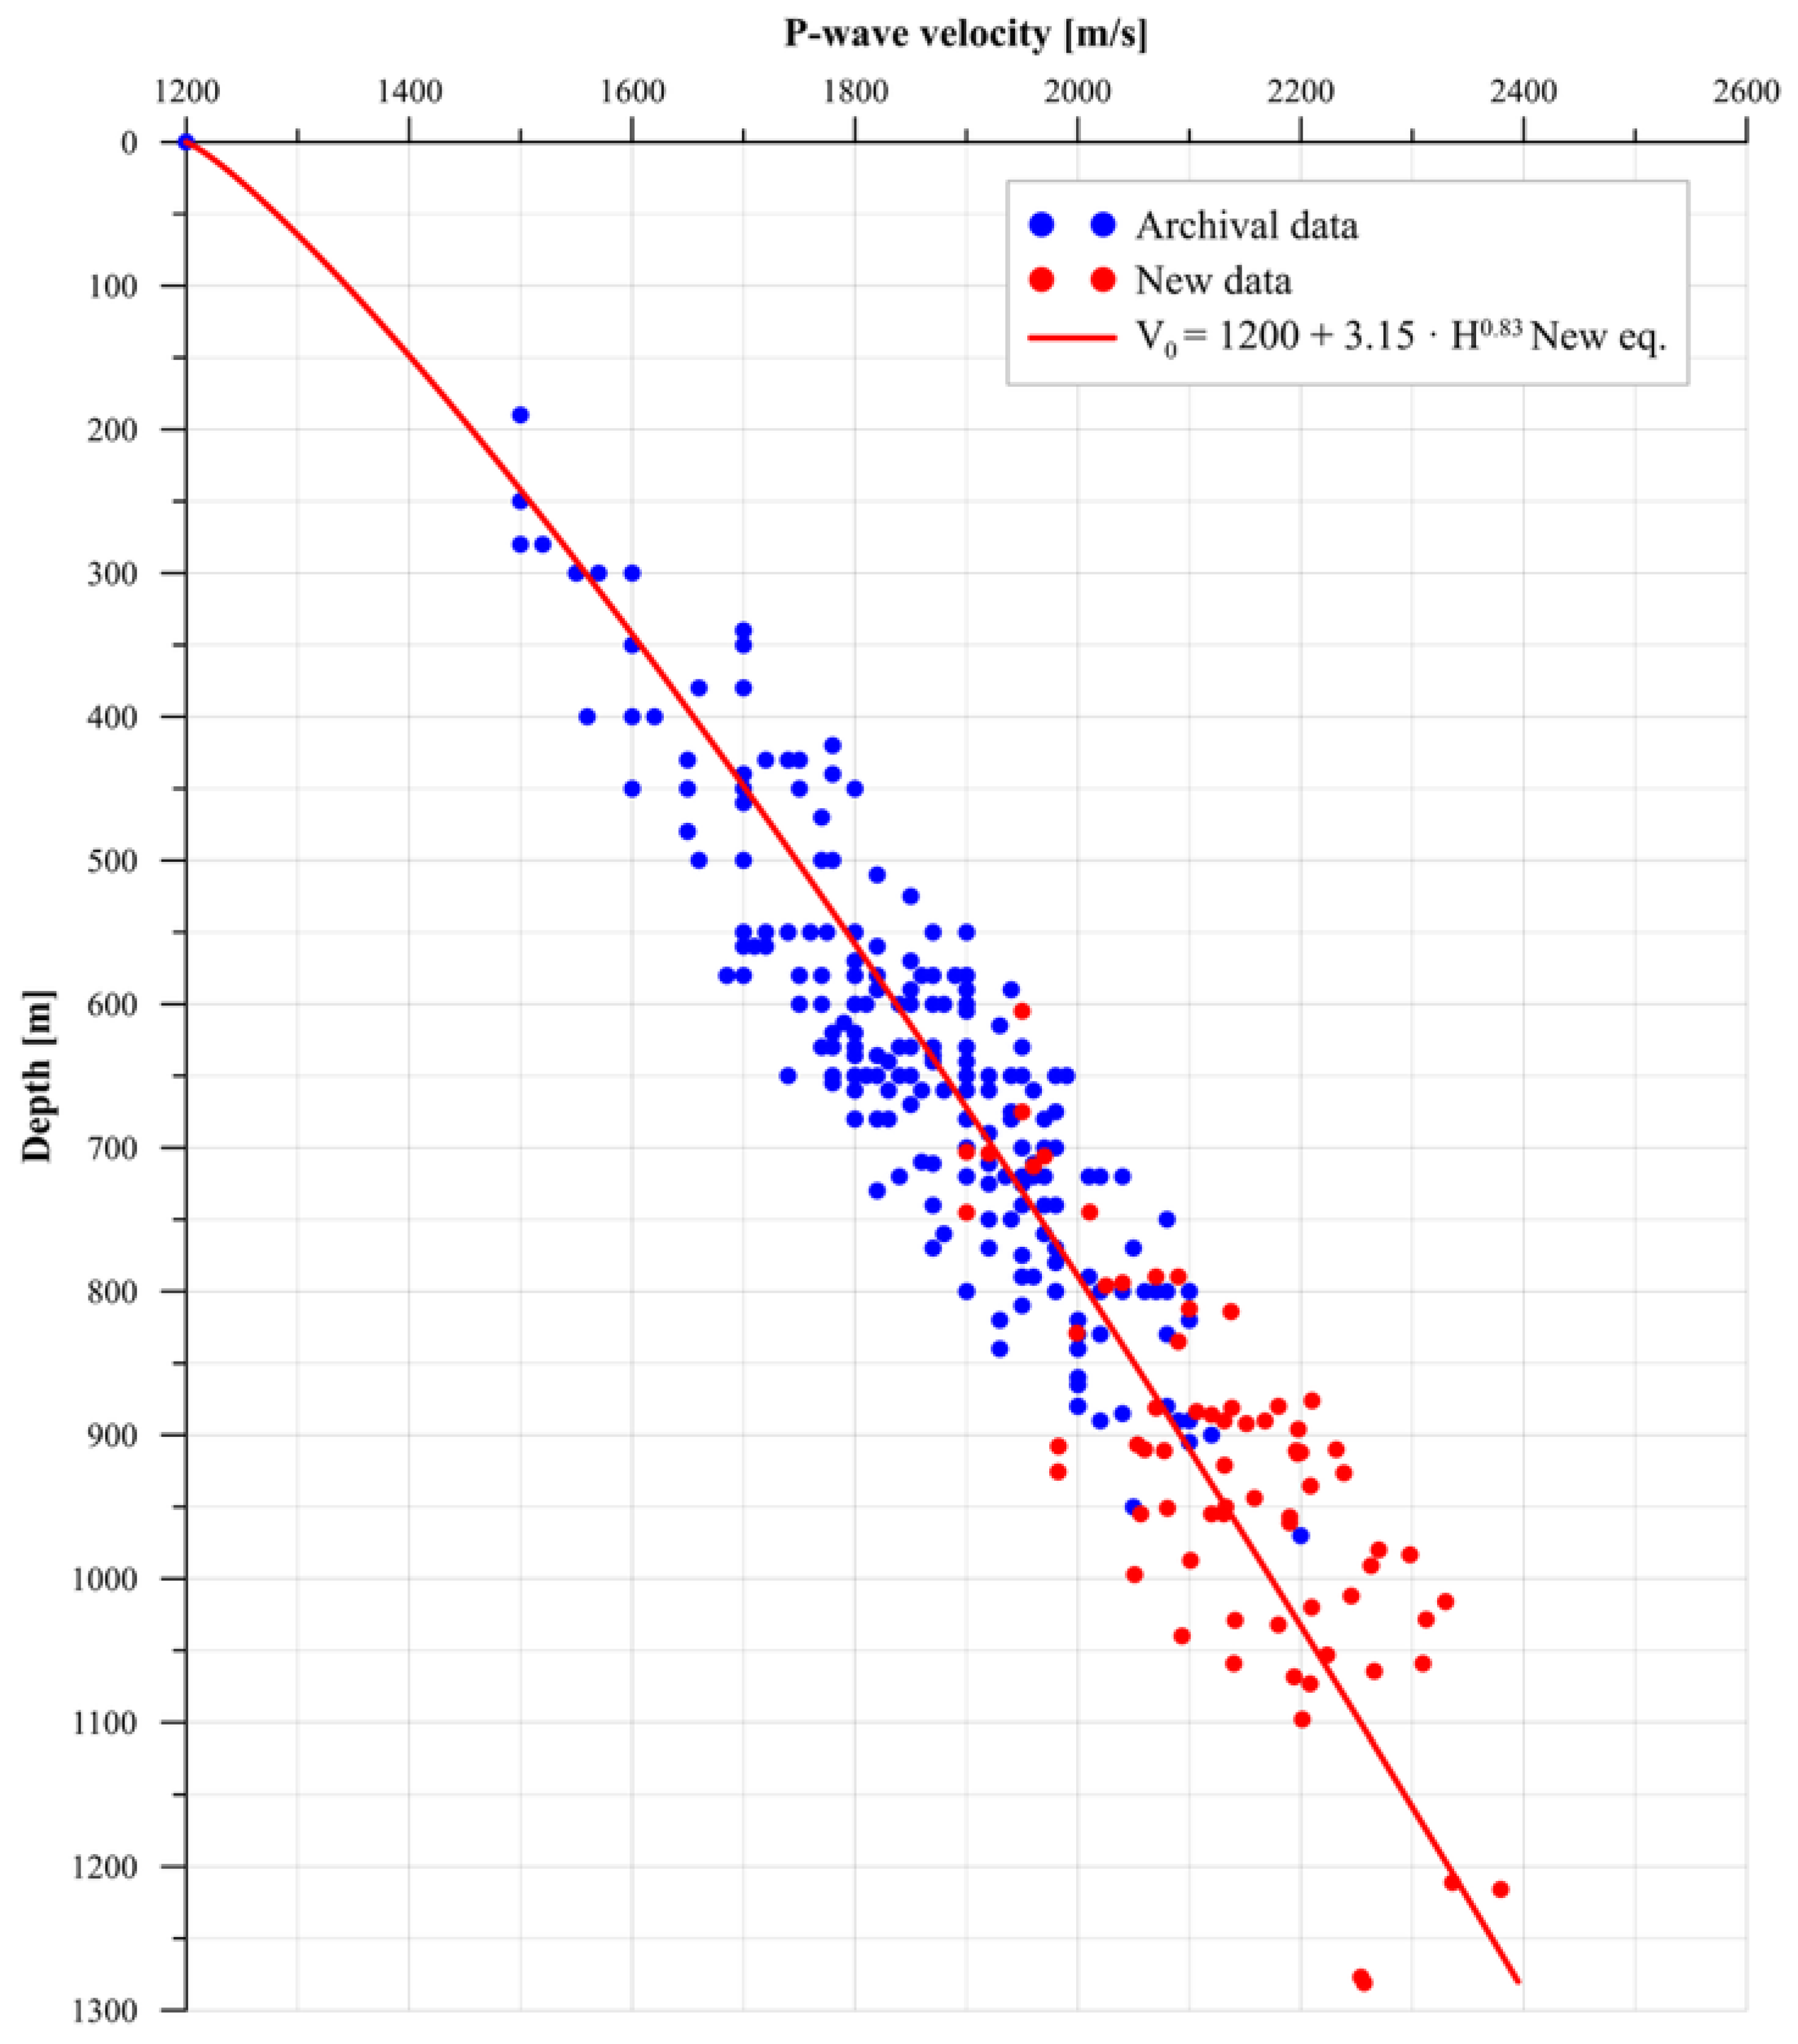
V 0   =   1200   +   3.15 · h 0.83
The regression model is clearly illustrated in Figure 7. In Figure 8, the new velocity–depth model for the south-western USBC coal mines is compared with the archival Dubiński model and local models for the Zofiówka and Jastrzębie coal mines. The graph demonstrates that the new model aligned more closely with the Zofiówka and Jastrzębie models while showing significant deviations from the Dubiński model. This divergence became particularly pronounced at depths greater than 700 m, where the Dubiński model consistently predicted lower velocities. The comparison underlines the extension of the dataset to a depth of 1281 m. The new empirical relationship provides a more accurate representation of the current deep mining conditions at these greater depths.
In Table 5, a comparison of the coefficients and statistical descriptors for all analyzed models is presented. For the Zofiówka Coal Mine, the recalibrated relationship is shown based on extended data. The updated model was characterized by a coefficient of determination (R2) of 0.86, an RMSE of 65.3 m/s, and a VAF of 85.9%. These values indicate a strong fit of the power-law model to the dataset and are comparable to those in earlier studies conducted at the Jastrzębie and Zofiówka mines.
The coefficients listed in Table 5 reveal that the updated model for the south-western USCB coal mines exhibited the highest coefficient of determination (R2) of 0.86, confirming its better fit to the data than the models by [1,20,30]. Furthermore, the residual standard deviation, σ = 70 m/s, remained consistent with previous models, indicating stable performance even when including data from greater depths. These statistical indicators confirm that the new model offers a more accurate representation of the P-wave velocity–depth relationship, particularly for deeper coal seams, where the archival model showed limited reliability.
Table 6 presents the new relationship statistics for the south-western USBC coal mines. The results indicate that parameter a had a relatively large standard error and confidence interval, but within the range of changes in local relationships for the Jastrzębie and Zofiówka mines. The estimated parameter b had a small standard error and a relatively narrow confidence interval, which also accounts for changes in local relationships for both dependencies for the Jastrzębie and Zofiówka mines.
The analysis also included systematic errors inherent to the measurement procedure, like in previous studies [20,30]. Two main sources of uncertainty were identified: (1) the uncertainty in determining the onset of the P-wave on the seismogram, estimated at 125 ms, and (2) the uncertainty in geophone positioning at the excavation sidewall, estimated at 0.20 m. The total maximum systematic error was calculated using a differential approach:
Δ V P = V P d Δ d + V P t Δ t = 20 m s + 25 m s = 45 m s
where VP is the P-wave velocity, d is the length of the seismic profile, and t is the arrival time of the P-wave.
The maximum systematic error of 45 m/s is comparable to the difference between the new and archival velocity estimates at a depth of 1000 m (53 m/s). This indicates that the improvement introduced by the new relationship is meaningful relative to the measurement uncertainties.
The heterogeneity factor calculated for the analyzed depth intervals ranged from 2.72% to 3.64%, with an average value of 3.27% (Figure 9). This indicates low variability between the measured and modeled P-wave velocities throughout the studied coal seam dataset. Such values confirm consistent agreement between the empirical model and the measured data across the investigated depth range.
Residual analysis further confirmed the model’s adequacy. Histograms of standardized residuals before and after outlier removal (Figure 10a,b) demonstrate that filtering improved the distribution, bringing it closer to a Gaussian distribution. The normal probability plot (Figure 10c) shows that most points closely followed the trend line, with only minor deviations at the extremes. The Breusch–Pagan test of residuals indicated no heteroscedasticity (p-value > 0.05), supporting the validity of the regression assumptions.
In summary, the statistical results indicate that the new model establishes a strong and representative relationship between velocity and depth. The addition of new velocity measurements from deeper levels enhanced its reliability. Compared with the archival model by Dubiński [1], the recalibrated model extends the validity range by over 300 m, incorporates data from eight mines, and more accurately characterizes current geological and mining conditions.
This study also introduced significant practical contributions. The corrected P-wave reference velocity values were higher than those predicted by the archival Dubiński model. This is primarily illustrated in Figure 8. At depths greater than 700 m, the Dubiński model consistently predicted lower velocities. This means that the magnitude of the anomaly calculated using the new relationship will be smaller than that calculated using the Dubiński model. This becomes important for assessing relative changes in stress and geomechanical conditions in mining workings. This enables the design of more reliable preventive measures to reduce the risk of rockbursts in underground mine workings. In some cases, it allows for reducing costs associated with rockburst prevention measures—for example, reinforcing excavation support or executing special destress blasting operations.
In terms of assumptions, the new model accurately reflects the character of the velocity–depth relationship. It confirms the consistency and reliability of the models derived under comparable geological conditions for both Zofiówka [20] and Jastrzębie [30]
This new empirical model therefore provides a robust reference framework for interpreting seismic profiling results, enhancing the assessment of stress conditions in deep coal seams.

6. Conclusions

The increasing depth of mining in multi-seam hard coal deposits in the Upper Silesian Coal Basin is altering the criteria for assessing the relative stress state within the rock mass. The archival relationship between wave velocity in coal seams and depth, previously used for this purpose, required adjustments due to its limited applicability, which extended up to approximately 900 m. Using a new dataset of measurements from greater depths, the existing relationship was recalibrated for the south-western USCB coal mines. A larger dataset comprising 316 P-wave velocity measurements, which combined archival data with new values, enabled the recalibration of the archival relationship. This extended the depth range to approximately 1300 m. Based on the statistical analysis results, the following conclusions were drawn.
  • Compared to the archival Dubiński relationship, the updated model predicts velocities at depths reaching 1281 m, thereby improving the accuracy of seismic anomaly calculations used for assessing relative stress changes. In terms of assumptions, the new model more accurately reflects the character of the velocity–depth relationship.
  • Regression analysis confirmed that the power-law model best described the velocity–depth relationship, yielding R2 = 0.86 and RMSE = 65.3 m/s. The heterogeneity factor calculated for the analyzed depth intervals ranged from 2.72% to 3.64%, with an average value of 3.27%. This indicates low variability between the measured and modeled P-wave velocities throughout the studied coal seam dataset. Outlier detection and residual analysis were systematically applied to enhance the model’s robustness.
  • The new regional relationship is consistent with earlier local models for Zofiówka and Jastrzębie mines but provides greater robustness due to its broader empirical basis.
  • The calculation procedure can be utilized to develop velocity models for various geological and mining conditions in underground mines at continuously increasing depths. The results highlight the need for further data acquisition from depths exceeding 1300 m and from additional geological settings of the Upper Silesian Coal Basin to refine and validate the empirical model.
  • The practical contribution results from the updated relationship, which enables more reliable identification of anomalous stress zones and supports the optimization of rockburst prevention strategies during deep mining.
Seismic profiling in a coal seam enables the determination of anomalous changes in P-wave velocity compared to the reference velocity at a specific mining depth. This indicates the impact of various geological and mining disturbances. Our findings may contribute to reducing the risk of dynamic phenomena and enable the more efficient exploitation of coal at greater depths.

Author Contributions

Conceptualization, M.Ł. and Z.P.; methodology, M.Ł., Z.P., Z.B., E.P. and T.Ł.; software, M.Ł.; validation, Z.P., E.P., Z.B. and P.K.; formal analysis, M.Ł., Z.B., E.P., P.K. and T.Ł.; investigation, M.Ł., Z.P., Z.B. and T.Ł.; resources, M.Ł., Z.P. and Z.B.; data curation, M.Ł.; writing—original draft preparation, M.Ł. and Z.P.; writing—review and editing, M.Ł., Z.P., Z.B., E.P., P.K. and T.Ł.; visualization, M.Ł.; supervision, Z.P., E.P., P.K. and Z.B.; project administration, Z.P. All authors have read and agreed to the published version of the manuscript.

Funding

This research received no external funding.

Institutional Review Board Statement

Not applicable.

Informed Consent Statement

Not applicable.

Data Availability Statement

The raw data supporting the conclusions of this article will be made available by the authors on request.

Acknowledgments

The authors would like to thank Editor and the anonymous Reviewers for their efforts towards improving the manuscript.

Conflicts of Interest

The authors declare no conflict of interest.

References

  1. Dubiński, J. Seismic Method of Anticipating Assessment of Rockburst Hazard in Hard Coal Mines; Research Works of Central Mining Institute: Katowice, Poland, 1989. (In Polish) [Google Scholar]
  2. Jiráňková, E.; Petroš, V.; Šancer, J. The Assessment of Stress in an Exploited Rock Mass Based on the Disturbance of the Rigid Overlying Strata. Int. J. Rock Mech. Min. Sci. 2012, 50, 77–82. [Google Scholar] [CrossRef]
  3. Burtan, Z.; Chlebowski, D. The Effect of Mining Remnants on Elastic Strain Energy Arising in the Tremor-Inducing Layer. Energies 2022, 15, 6031. [Google Scholar] [CrossRef]
  4. Brown, E.T.; Hoek, E. Underground Excavations in Rock; CRC Press: Boca Raton, FL, USA, 1980. [Google Scholar]
  5. Brady, B.H.G.; Brown, E.T. Rock Mechanics for Underground Mining; Cambridge University Press: Cambridge, UK, 1993. [Google Scholar]
  6. Qi, Q.; Pan, Y.; Shu, L.; Li, H.; Jiang, D.; Zhao, S.; Zou, Y.; Pan, J.; Wang, K.; Li, H. Theory and Technical Framework of Prevention and Control with Different Sources in Multi-Scales for Coal and Rock Dynamic Disasters in Deep Mining of Coal Mines. J. China Coal Soc. 2018, 43, 1801–1810. [Google Scholar] [CrossRef]
  7. Konicek, P.; Waclawik, P. Stress Changes and Seismicity Monitoring of Hard Coal Longwall Mining in High Rockburst Risk Areas. Tunn. Undergr. Space Technol. 2018, 81, 237–251. [Google Scholar] [CrossRef]
  8. Pilecki, Z. Dynamic Analysis of Mining Tremor Impact on Excavation in Coal Mine. In FLAC and Numerical Modeling in Geomechanics; CRC Press: Boca Raton, FL, USA, 1999; pp. 397–400. [Google Scholar]
  9. Zhang, C.; Ye, J.; Liu, N.; Xie, Q.; Hu, M.; Li, L. True triaxial modeling test of high-sidewall underground caverns subjected to dynamic disturbances. J. Rock Mech. Geotech. Eng. 2025, 17, 2109–2132. [Google Scholar] [CrossRef]
  10. Assefa, E.; Tilahun, K.; Assefa, S.M.; Jilo, N.Z.; Pantelidis, L.; Sachpazis, C. Stability evaluation of tunnels in steeply dipping layered rock mass using numerical models: A case study. Sci. Rep. 2025, 15, 2046. [Google Scholar] [CrossRef]
  11. Zou, Q.; Chen, Z.; Zhan, J.; Chen, C.; Gao, S.; Kong, F.; Xia, X. Morphological evolution and flow conduction characteristics of fracture channels in fractured sandstone under cyclic loading and unloading. Int. J. Min. Sci. Technol. 2023, 33, 1527–1540. [Google Scholar] [CrossRef]
  12. Chlebowski, D.; Burtan, Z. Mining-Induced Seismicity during Development Works in Coalbeds in the Context of Forecasts of Geomechanical Conditions. Energies 2021, 14, 6675. [Google Scholar] [CrossRef]
  13. Chlebowski, D.; Burtan, Z. Geomechanical Analysis of the Main Roof Deformation in Room-and-Pillar Ore Mining Systems in Relation to Real Induced Seismicity. Appl. Sci. 2024, 14, 5710. [Google Scholar] [CrossRef]
  14. Szreder, Z.; Pilecki, Z.; Klosinski, J. Effectiveness of recognition of exploitation edge influence with the help of profiling of attenuation and velocity of seismic wave. Gospod. Surowcami Miner.–Miner. Resour. Manag. 2008, 24, 215–226. [Google Scholar]
  15. Szreder, Z.; Barnaś, M. Assessment of the Impact of an Overlying Coal Seam Edge Using Seismic Profiling of Refracted P-Wave Velocity. E3S Web Conf. 2017, 24, 01007. [Google Scholar] [CrossRef]
  16. Tajduś, A.; Cała, M.; Tajduś, K. The Influence of a Normal Fault on the Initial State of Stress in a Rock Mass. Stud. Geotech. Mech. 2016, 38, 109–121. [Google Scholar] [CrossRef]
  17. Pilecka, E.; Stec, K.; Chodacki, J.; Pilecki, Z.; Szermer-Zaucha, R.; Krawiec, K. The Impact of a High-Energy Mining-Induced Tremor in a Fault Zone on Damage to Buildings. Energies 2021, 14, 4112. [Google Scholar] [CrossRef]
  18. Dubiński, J.; Konopko, W. Rock Bursts—Assessment, Prognosis, Defeating; Central Mining Institute (GIG): Katowice, Poland, 2000. (In Polish) [Google Scholar]
  19. Chlebowski, D.; Burtan, Z. Geophysical and Analytical Determination of Overstressed Zones in an Exploited Coal Seam: A Case Study. Acta Geophys. 2021, 69, 701–710. [Google Scholar] [CrossRef]
  20. Łapczyński, M.; Pilecki, Z.; Krawiec, K.; Słomian, A.; Pilecka, E.; Łątka, T. Modelling of P-Wave Velocity Changes in Coal Seams with Increased Depth: A Case Study. Sci. Rep. 2025, 15, 3413. [Google Scholar] [CrossRef] [PubMed]
  21. Evison, F.F. A Coal Seam as a Guide for Seismic Energy. Nature 1955, 176, 1224–1225. [Google Scholar] [CrossRef]
  22. Krey, T. Channel Waves as a Tool of Applied Geophysics in Coal Mining. Geophysics 1963, 28, 701–714. [Google Scholar] [CrossRef]
  23. Krey, T. In-seam Seismic Exploration Techniques. Coal Explor. 1976, 1, 227–255. [Google Scholar]
  24. Körmendi, A.T.; Bodoky, T.; Hermann, L.; Dianiska, L.; Kálmán, T. Seismic Measurements for Safety in Mines. Geophys. Prospect. 1986, 34, 1022–1037. [Google Scholar] [CrossRef]
  25. Hatherly, P. Coal Seam Mapping by Underground In-Seam Seismic Surveys. Geoexploration 1987, 24, 285–294. [Google Scholar] [CrossRef]
  26. Dresen, L.; Rüter, H. Seismic Coal Exploration. Part B: In-Seam Seismics; Graham & Trotman: London, UK, 1994. [Google Scholar]
  27. Hosseini, N.; Oraee, K.; Shahriar, K.; Goshtasbi, K. Passive Seismic Velocity Tomography on a Longwall Mining Panel Based on the Simultaneous Iterative Reconstructive Technique (SIRT). J. Cent. South Univ. 2012, 19, 2297–2306. [Google Scholar] [CrossRef]
  28. Schott, W.; Waclawik, P. On the Quantitative Determination of Coal Seam Thickness by Means of In-Seam Seismic Surveys. Can. Geotech. J. 2015, 52, 1496–1504. [Google Scholar] [CrossRef]
  29. Teng, J.; Li, S.; Jia, M.; Lian, J.; Liu, H.; Li, G.; Wang, W.; Volker, S.; Feng, L.; Yao, X.; et al. Research and Application of In-Seam Seismic Survey Technology for Disaster-Causing Potential Geology Anomalous Body in Coal Seam. Acta Geol. Sin. (Engl. Ed.) 2020, 94, 10–26. [Google Scholar] [CrossRef]
  30. Kokowski, J.; Szreder, Z.; Pilecka, E. Reference P-wave Velocity in Coal Seams at Great Depths in the Jastrzębie Coal Mine. E3S Web Conf. 2019, 133, 01011. [Google Scholar] [CrossRef]
  31. Ladanyi, B. Use of the Long-Term Strength Concept in the Determination of Ground Pressure on Tunnel Linings. In Proceedings of the 3rd Congress of the International Society for Rock Mechanics, Denver, CO, USA, 1–7 September 1974; Volume II, Part B. pp. 1150–1156. [Google Scholar]
  32. Nieć, M.; Sermet, E.; Salamon, E. Variation of Coal Quantity Accumulated in the Mississippian to Pennsylvanian Coal Seams (Upper Silesia and Lublin Coal Basins, Poland): A Reflection of Changes in Climate and CO2 Availability. Geol. Q. 2023, 67, 8. [Google Scholar] [CrossRef]
  33. Sermet, E.; Nieć, M.; Chećko, J.; Górecki, J. Hard Coal Resource Base in Poland for Underground Gasification; Central Mining Institute: Katowice, Poland, 2018. (In Polish) [Google Scholar]
  34. Mehdipour, V.; Rabbani, A.R.; Kadkhodaie, A. A practical approach to derive heterogeneity index using an integrated petrophysical data analysis. Sci. Rep. 2025, 15, 7526. [Google Scholar] [CrossRef] [PubMed]
Figure 1. Model of the influence of the coal seam’s edge (a) and remnant (b) on velocity measured in the underlying coal seam.
Applsci 15 12505 g001
Figure 2. Localization of the study area in the Upper Silesian Coal Basin.
Applsci 15 12505 g002
Figure 3. Model of the behavior of a rock mass around circular excavation (Szreder et al. [14] based on [31]); σ1—major principal stress, σ3—minor principal stress, σθ—tangential stress, σr—radial stress, ε1—major principal strain, p0—virgin stress, pi—lining load, r—radius.
Applsci 15 12505 g003
Figure 4. Model of P-wave propagation in a coal seam in the sidewall of a roadway (a). A cross section depicting the structure of a coal seam with neighboring rock layers, highlighting the velocity of P-wave changes in red in the coal seam in the sidewall of roadway (b) (based on [14]).
Applsci 15 12505 g004
Figure 5. An example of a wave field measured in the structure of a coal seam with neighboring rock layers with identified waves [20].
Applsci 15 12505 g005
Figure 6. Archival dataset (blue dots) and new data from the south-western USBC coal mines (red dots), along with the regression curves: linear (green line), nonlinear (red line), and the archival data (blue line [1]). Outliers are highlighted with empty dots. The dashed red lines indicate the range of twice the standard deviation.
Applsci 15 12505 g006
Figure 7. Archival dataset (blue dots) and recent data from the Zofiówka coal mine (red dots) without outliers, along with the regression curve for all data (red line).
Applsci 15 12505 g007
Figure 8. Comparison of empirical P-wave velocity–depth models with divergence between models at greater depth from the right-hand side.
Applsci 15 12505 g008
Figure 9. Heterogeneity factor values (%) comparing the measured and modeled P-wave velocities for selected depth intervals. The number above each bar indicates the number of measurements within that depth interval.
Applsci 15 12505 g009
Figure 10. (a) Histogram of standard residuals (dark blue bars) and density of normal distribution plot (red line) with outliers, (b) without outliers, and (c) normal probability plot of residuals (black) along with regression curve (red dashed line).
Applsci 15 12505 g010
Table 1. Scale of relative stress corresponding to seismic anomaly variations in the geological conditions of the Upper Silesian Coal Basin for depths from 500 to 900 m [1].
Degree of
Relative Stress
Change
Scale of Relative Stress IncreasePositive
Seismic
Anomaly
[%]
Increase in
Relative Stress
[%]
Negative
Seismic
Anomaly
[%]
Decrease in
Relative Stress [%]
0very lowbelow 5below 20above −7.5below 25
1low5 to1520 to 60−7.5 to −1525 to 55
2medium15 to 2560 to 140−15 to −2555 to 80
3highabove 25above 140below −25above 80
Table 2. Coal seams in the Upper Silesian Coal Basin (based on [33]).
StratigraphyLithological SeriesLocal StratigraphyMaximum Thickness of Coal-Bearing Formations [m]Total Number of Coal Seams and PartingsMaximum Total Coal Thickness [m]Coal Seam Numbers
PennsylvanianKrakow SandstoneLibiąż5603848111–119
Łaziska1080201–216
MudstoneOrzesze *Orzesze2000158112301–327
Załęże328–364
Ruda *401–406
Upper
Silesian Sandstone
Ruda8106180407–420
Zabrze
(Saddle, Anticlinal)
140501–510
MississippianParalicPoruba110026399601–630
Jaklovec350701–723
Hrušov1300801–848
Petřkovice760901–920
* former mining subdivision.
Table 3. The new dataset from the south-western Upper Silesian Coal Basin coal mines.
No.Coal MineDepth [m]Measured Velocity of the P-wave [m/s]No.Coal
Mine
Depth [m]Measured Velocity of the P-wave [m/s]
1Zofiówka704192038Jastrzębie7451900
2Zofiówka745201139Jastrzębie8862120
3Zofiówka884210640Jastrzębie8122100
4Zofiówka890216841Jastrzębie9572190
5Zofiówka907205442Jastrzębie7131960
6Zofiówka911219643Jastrzębie7061970
7Zofiówka926198244Jastrzębie6751950
8Zofiówka927223945Jastrzębie9552131
9Zofiówka936220946Jastrzębie9552120
10Zofiówka944215947Jastrzębie8812070
11Zofiówka950213348Jastrzębie7942040
12Zofiówka951208049Jastrzębie8352090
13Zofiówka983229850Jastrzębie8802180
14Zofiówka987210151Jastrzębie8762210
15Zofiówka1016233052Jastrzębie9122200
16Zofiówka1029231353Jastrzębie9802270
17Zofiówka1029214154Jastrzębie8291999
18Zofiówka1032218055Jastrzębie9952330
19Zofiówka1053222356Jastrzębie10102330
20Zofiówka1059214057Rydułtowy12162379
21Zofiówka1059231058Rydułtowy12112336
22Zofiówka1065226659Marcel6051950
23Zofiówka1068219460Marcel10122245
24Zofiówka1073220861Marcel10202210
25Zofiówka790209062Marcel9112078
26Zofiówka790207063Marcel9912263
27Pniówek814213764Marcel9212131
28Pniówek811219165Marcel8962198
29Borynia913219766Marcel3911752
30Borynia955205667Knurów-Szczygłowice9972051
31Borynia910223268Knurów-Szczygłowice9081983
32Borynia796202569Knurów-Szczygłowice9102060
33Borynia890213170Budryk12812257
34Borynia881213871Budryk12772254
35Borynia892215172Budryk10982201
36Jastrzębie964232073Budryk10402093
37Jastrzębie703190074Budryk9612190
Table 4. Statistics of the dataset.
ParameterNew DataArchival Data
Number of measured velocity values74252
Min. measurement depth [m]391190
Max. measurement depth [m]1281970
Min. P-wave velocity [m/s]18021500
Max. P-wave velocity [m/s]23792200
Average P-wave velocity [m/s]21411859
Table 5. Reference velocity V0 models.
Name of ModelReference Velocity V0
Relationship
Coefficient of
Determination R2
Standard
Deviation
σ
Dubiński (1989) [1] V 0 = 1200 + 4.83 · h 0.76 0.7764
Jastrzębie Coal Mine V 0 = 1200 + 2.73 · h 0.85 0.8263
Zofiówka Coal Mine V 0 = 1200 + 3.20 · h 0.83 0.8561
South-western USBC V 0 = 1200 + 3.15 · h 0.83 0.8670
Table 6. Statistics of the new relationship for the south-western USBC coal mines.
Estimated
Parameter
Value of
Estimated
Parameter
Standard
Error
Lower
Confidence
Limit
Upper
Confidence
Limit
a
b
3.15
0.83
0.44
0.02
2.29
0.79
4.01
0.87
Disclaimer/Publisher’s Note: The statements, opinions and data contained in all publications are solely those of the individual author(s) and contributor(s) and not of MDPI and/or the editor(s). MDPI and/or the editor(s) disclaim responsibility for any injury to people or property resulting from any ideas, methods, instructions or products referred to in the content.