Article

Multi-Objective Robust Design of Segmented Thermoelectric–Thermal Protection Structures for Hypersonic Vehicles Using a High-Fidelity Thermal Network

by
Yidi Zhao
1,
Hao Dong
1,2,*,
Keming Cheng
1,
Kongjun Zhu
1,2 and
Tianyu Xia
1
1
College of Aerospace Engineering, Nanjing University of Aeronautics and Astronautics, Nanjing 210016, China
2
State Key Laboratory of Mechanics and Control for Aerospace Structures, Nanjing University of Aeronautics and Astronautics, Nanjing 210016, China
*
Author to whom correspondence should be addressed.
Appl. Sci. 2025, 15(23), 12482; https://doi.org/10.3390/app152312482
Submission received: 27 October 2025 / Revised: 21 November 2025 / Accepted: 22 November 2025 / Published: 25 November 2025

Abstract

Long-endurance hypersonic vehicles face the dual challenge of withstanding extreme aerodynamic heating while meeting onboard power requirements. Integrating thermoelectric generators within thermal protection systems offers a solution by converting thermal loads into electrical power. However, accurate prediction requires resolving coupled multiphysics, where three-dimensional simulations are computationally prohibitive and existing one-dimensional models lack accuracy. This study develops a quasi-two-dimensional distributed thermal network incorporating shape-factor corrections for rapid, high-fidelity prediction. Multi-objective optimization is performed to balance specific power, thermal expansion mismatch, and thermal margin. Analysis reveals fundamental trade-offs: a maximum-power design achieves 28.1 W/kg but only a 0.8% thermal margin, whereas a balanced design delivers 24.5 W/kg with a 5.1% thermal margin and significantly reduced thermal stress. Despite geometric variations, peak conversion efficiency converges to approximately 13%. This indicates that efficiency is primarily governed by material properties, while geometric optimization effectively tunes temperature and thermal strain distributions, providing guidelines for reliable system development.

1. Introduction

Long-duration hypersonic vehicles constitute strategic aerospace assets, enabling sustained high-speed atmospheric flight and assured space access [1,2]. Yet, their development confronts dual challenges. Severe aerodynamic heating generates surface temperatures that can reach extreme levels, potentially exceeding 1800 K at leading edges [3,4], imposing significant thermal loads that jeopardize structural integrity throughout extended missions [5]. Simultaneously, operational complexity demands enhanced onboard energy autonomy for systems such as fuel supply, radar, and flight control [6,7] while stringent mass constraints preclude traditional power solutions such as auxiliary power units (APUs) or ram air turbines (RATs), which are often unsuitable for the hypersonic regime [8,9]. Thermoelectric conversion technology offers a promising approach to address these challenges [10]. Based on the Seebeck effect—whereby temperature gradients induce electrical potentials—thermoelectric generators (TEGs) enable direct thermal-to-electrical energy conversion with exceptional reliability stemming from their solid-state, maintenance-free architecture without moving parts [8,11,12]. Integrating TEGs within thermal protection systems (TPS) yields multifunctional TEG-TPS structures that transform potentially damaging thermal loads into valuable electrical power [5,13]. Given hypersonic vehicles’ enormous temperature gradients [14], segmented or multistage TEG architectures employing multiple materials optimized for specific temperature ranges are essential for achieving higher efficiency [14,15]. Studies by Cheng et al. [14,15,16,17] consistently demonstrate that multistage TEGs achieve significantly higher conversion efficiency than single-stage designs across wide temperature domains, confirming segmented structures as a key technological pathway for cascade utilization of large temperature differences. Gong et al. [5] also proposed a novel thermoelectric-material-based TPS structure and evaluated its performance for hypersonic vehicles. These works highlight the potential of TEGs for onboard power generation and thermal management.
Optimizing segmented TEG-TPS designs necessitates navigating extraordinary computational complexity arising from tightly coupled multiphysics phenomena involving thermal, electrical, and mechanical fields [13]. Accurate performance prediction demands simultaneous resolution of aerodynamic heating, three-dimensional heat conduction, thermoelectric conversion governed by Seebeck–Peltier–Thomson effects, and thermomechanical stress fields. Three-dimensional finite element methods (FEM) represent the analytical benchmark [18], capturing geometric intricacies, temperature-dependent properties, and interfacial phenomena including thermal contact resistance (TCR) and electrical contact resistance (ECR) [19,20]. The importance of interface effects is underscored by findings such as those of Gou et al. [20] and Gao et al. [19], who showed that ECR alone can significantly diminish power output. Shittu et al. [21] and Zhang et al. [22] also emphasized the necessity of considering ECR during TEG design and optimization. Previous steady-state analyses, such as Gou et al.’s investigation of physical dimensions, temperature ranges, and interfacial thermal contacts in multistage TEGs [20], revealed critical design sensitivities. However, this fidelity exacts severe computational penalties; single transient multiphysics simulations mirroring a flight envelope routinely require extensive processing time, potentially days [13,14,15,16,17,18,23], creating significant barriers to comprehensive structural optimization.
Fortunately, the periodic symmetry often inherent in TEG-TPS structures enables significant computational simplification through unit-cell modeling [5,24]. For TEG-TPS arrays, unit-cell analysis employing periodic boundary conditions dramatically reduces three-dimensional problem complexity while preserving macroscopic behavior, a technique successfully demonstrated by Gong et al. [5] and Gao et al. [13]. This dimensional reduction makes simplified calculation methods feasible for optimization workflows. Zero-dimensional thermoelectric models, such as those used in initial system-level assessments [8], offer rapid performance estimation but face severe limitations in transient analysis, as they assume uniform temperature distributions and cannot capture temporal dynamics critical for hypersonic flight conditions [20]. To address these shortcomings, thermal network modeling has evolved substantially from early lumped-parameter approaches toward distributed-parameter formulations capable of resolving spatial gradients [25]. Lumped-parameter thermal networks (LPTNs) assume isothermal conditions within discrete elements and remain valid only under low internal temperature gradients [26], a condition often violated in thermally thick TEG-TPS components. Distributed-parameter models overcome this limitation by discretizing components into multiple nodes. Notably, Piggott [23] developed a refined one-dimensional transient SPICE model that accounts for distributed Seebeck, Peltier, and Thomson effects along the thickness direction, achieving high accuracy for thermoelectric conversion predictions compared to experimental data. However, TEG-TPS structures inherently exhibit three-dimensional thermal behavior characterized by substantial lateral heat spreading through substrates, insulation, and potential structural elements such as honeycomb cores [13]. This lateral diffusion creates thermal short circuits that significantly diminish temperature differences across TEG legs, fundamentally altering power-generation efficiency.
Current modeling frameworks face fundamental trade-offs: three-dimensional finite element models accurately capture geometric complexity and coupled physics but demand prohibitive computational resources, whereas efficient distributed one-dimensional thermoelectric models comprehensively describe conversion processes but cannot predict crucial lateral heat-transfer effects [20,23]. This computational intractability forces designers into untenable compromises: either sacrificing design-space exploration by evaluating fewer candidates or accepting reduced simulation fidelity to improve efficiency—both approaches risk missing superior design solutions. Therefore, there is an urgent need for a distributed, simplified computational method that incorporates lateral heat-flow corrections and can accurately predict spatiotemporal temperature and electrical potential distributions in TEGs under large transient temperature gradients typical of hypersonic flight. Such an approach would combine the computational efficiency of thermal network methods with the physical fidelity necessary for capturing three-dimensional heat-transfer effects, enabling rapid yet accurate optimization of TEG-TPS designs.
In this work, inspired by previous research, a two-dimensional distributed thermal network incorporating shape-factor-based lateral heat-transfer corrections [27] is developed for segmented TEG-TPS performance prediction. The model’s accuracy is validated against three-dimensional finite element simulations under transient aerodynamic heating representative of hypersonic flight envelopes. Moreover, multi-objective optimization using the NSGA-II algorithm is performed to explore three-stage leg-length configurations, simultaneously optimizing power density, thermal expansion mismatch, and thermal margin. Analysis of the spatiotemporal temperature and electric potential distributions in the Pareto-optimal designs shows that the balanced configuration delivers a substantial reduction in thermal strain and a marked improvement in thermal margin, with only a modest 6.8% penalty relative to the maximum-power configuration, thereby providing a validated pathway for developing a reliable, multifunctional TEG-TPS for hypersonic vehicles.

2. Thermal Network Construction Methods

2.1. Segmented Thermoelectric-TPS Design

2.1.1. Geometry-Based Configuration

The core analysis object of this study is a Unit Cell of a three-segment TEG-TPS integrated structure. As shown in Figure 1, the Unit Cell comprises stacked functional layers in the through-thickness direction, including a silicon carbide (SiC) hot face sheet at the top, a titanium alloy (Ti-alloy) load-bearing substrate at the bottom, and a core thermoelectric module (TEM). The TEM comprises a pair of side-by-side p-type and n-type segmented thermoelectric legs, with insulating fillers such as Saffil alumina fiber (Saffil Al-fiber) placed between the legs and around their periphery to suppress lateral parasitic heat leakage. Each leg is partitioned into three segments along its height, corresponding to high- (HTE), intermediate- (MTE), and low-temperature (LTE) operating regimes. Metallic interconnects (e.g., copper) provide electrical series interconnection and thermal continuity between adjacent segments and between the thermoelectric legs and the electrodes.

2.1.2. Three-Segment Thermoelectric Material System

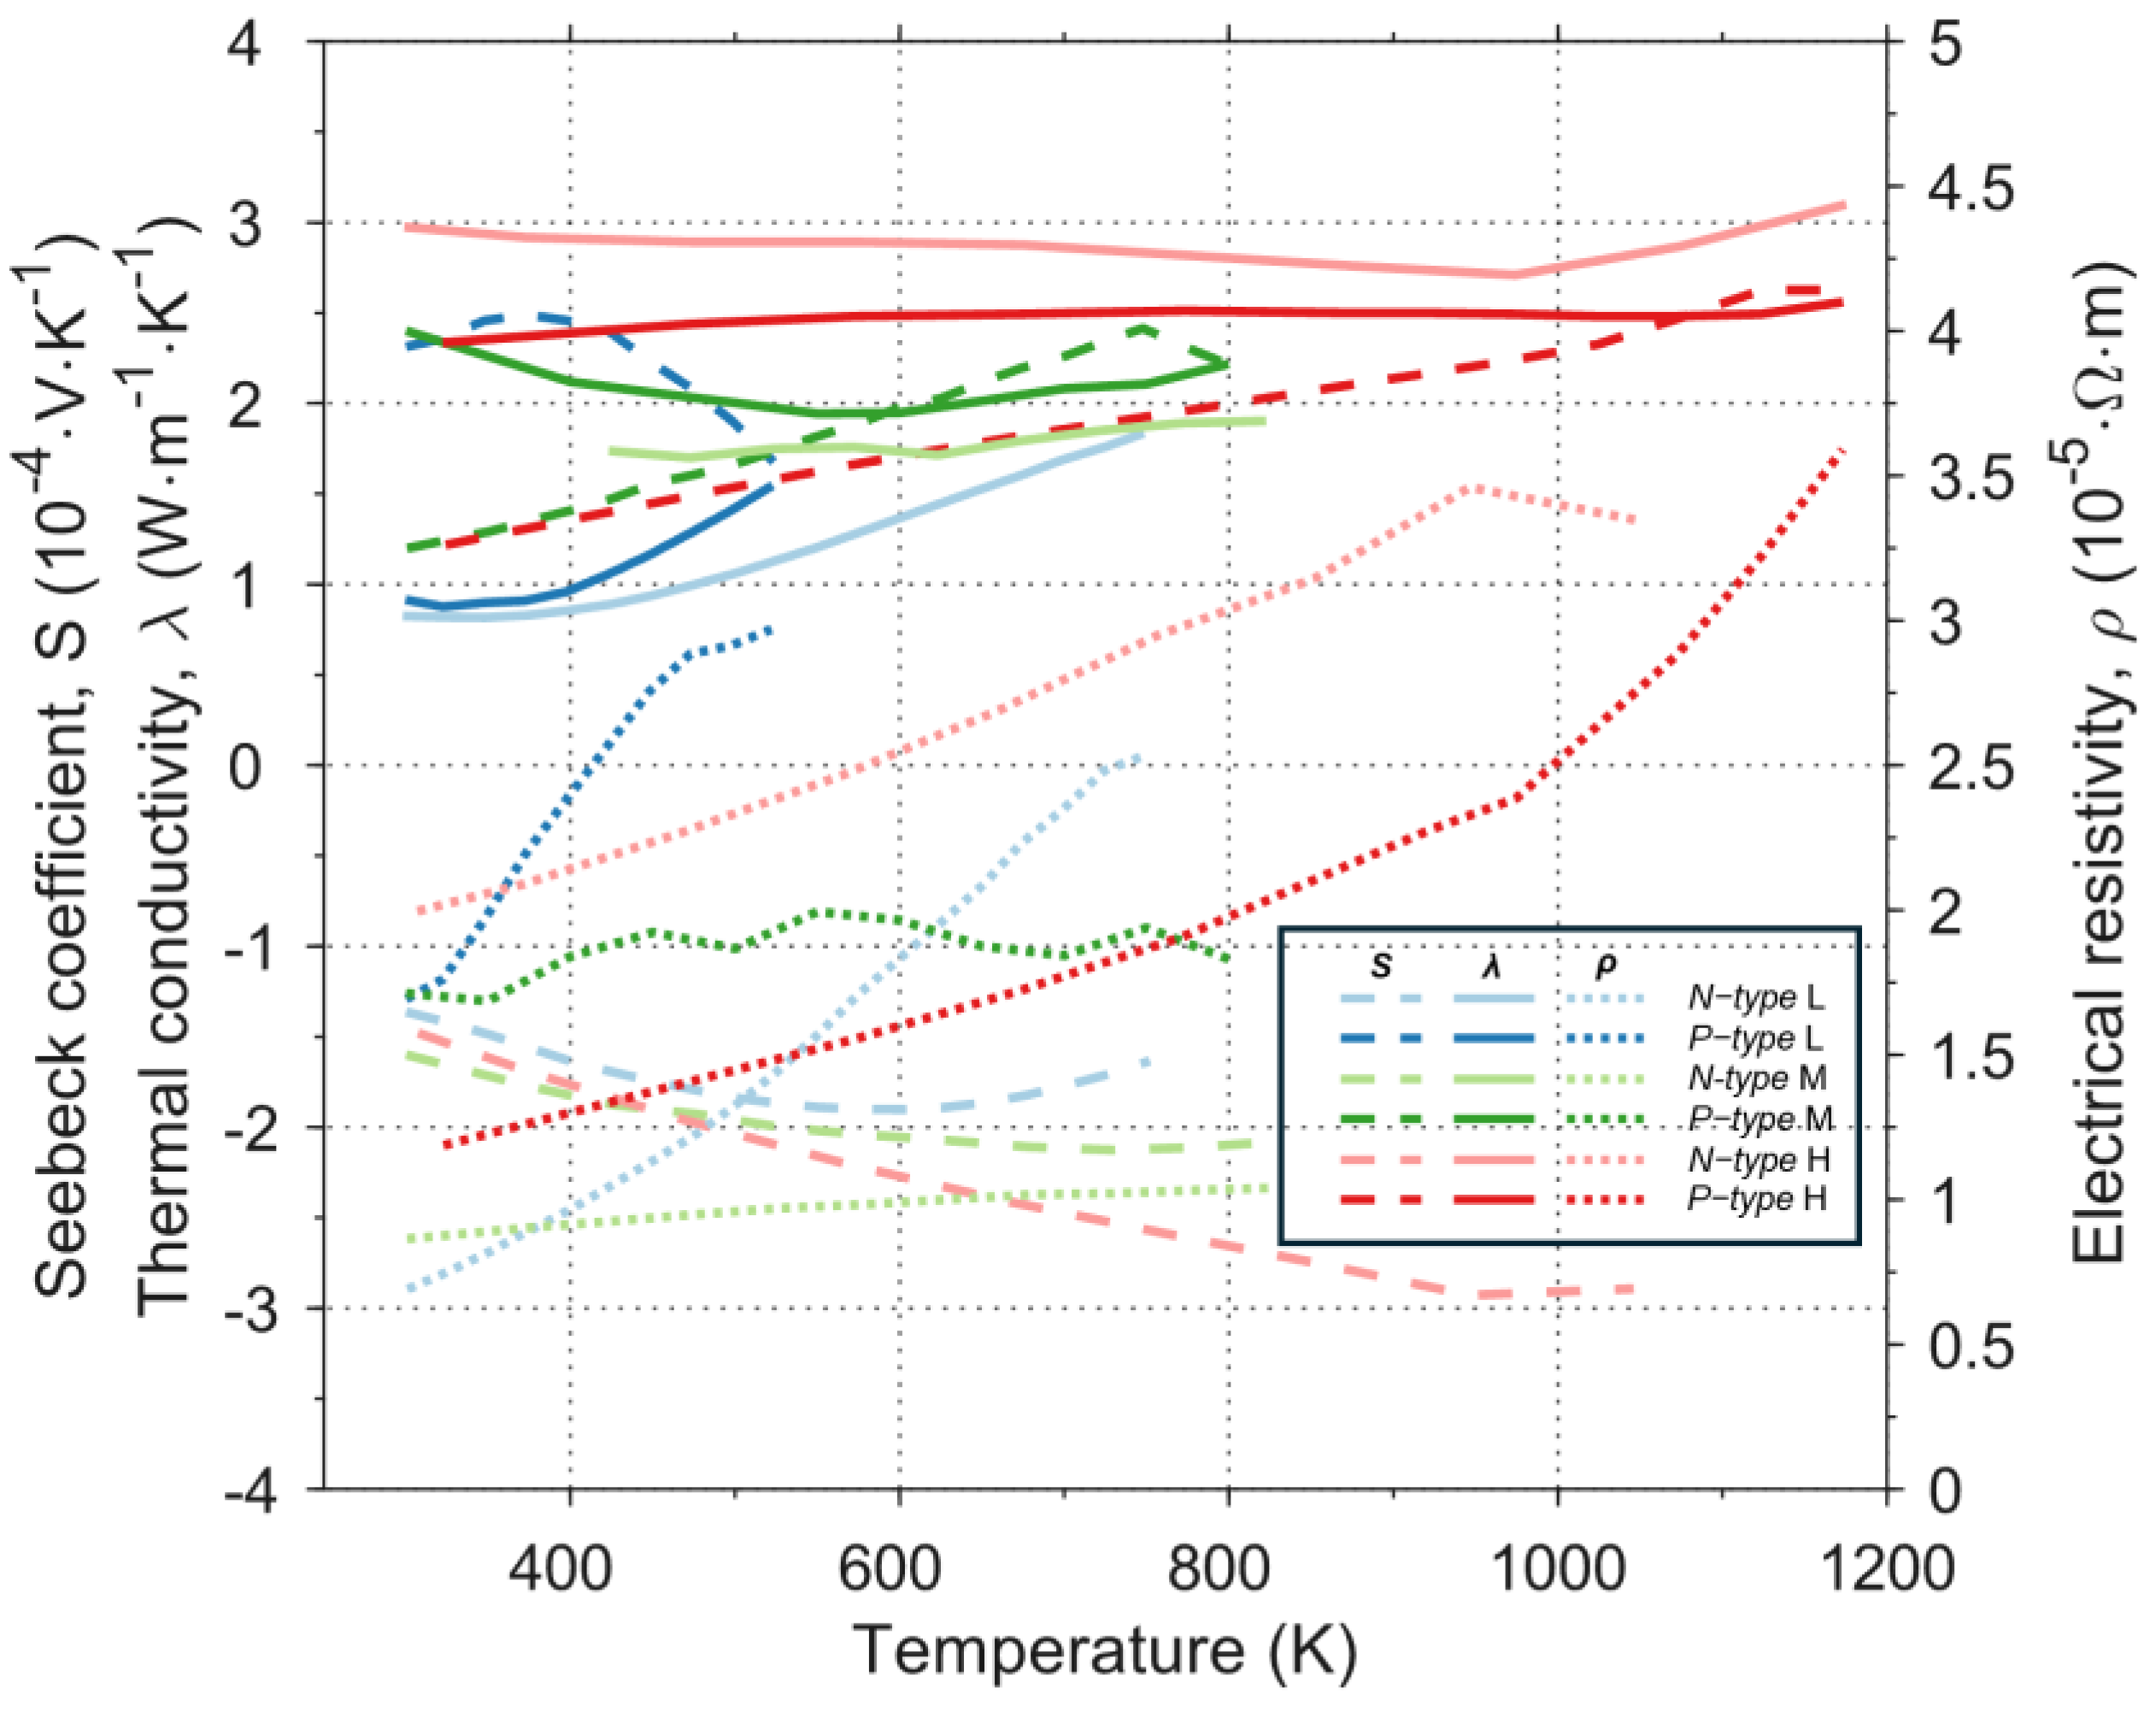
To maximize thermoelectric conversion performance across a wide temperature range (300–1200 K), this study moves beyond the conventional single-material approach and, based on a systematic review of performance data, selects and assigns the best-performing p-type and n-type thermoelectric materials to the three operating temperature regimes. This state-of-the-art segmented material set ensures a high thermoelectric figure of merit (ZT) within each regime. The constituent materials and relevant physical properties—namely the maximum service temperature (Tlimit) and the coefficient of thermal expansion (CTE), are listed in Table 1. Selected TE materials and their thermoelectric properties are shown in Figure 2.

2.2. High-Fidelity Thermal Network Modeling Method

2.2.1. Quasi-Two-Dimensional Thermoelectric Coupled Model

To accurately predict the performance of the thermoelectric generator under complex thermal environments while balancing computational efficiency, this study proposes a high-fidelity, quasi-two-dimensional thermoelectric coupling modeling approach. The model couples the conventional one-dimensional (1D) through-thickness heat conduction equation with an Equivalent Thermal Network (ETN) model that characterizes lateral heat transfer (heat leakage). This reduction in the three-dimensional heat-transfer problem enables fast, system-level performance prediction while preserving the fidelity of key physical processes.
The macroscopic structure of the TEG comprises a periodic array of numerous p–n thermocouples, exhibiting translational symmetry. Leveraging this property, the analysis is reduced to a representative Unit Cell model. To ensure fidelity, Periodic Boundary Conditions are applied to the opposing lateral faces, enforcing identical temperature distributions on translationally symmetric surfaces. This constraint guarantees continuity of the heat flux and temperature field, yielding the symmetric and spatially periodic temperature field shown in Figure 3. This periodic thermal field is the central physical premise of the present simplification strategy. It provides a rigorous justification for treating lateral heat transfer within the Unit Cell as a quasi-two-dimensional problem, thereby underpinning the subsequent simplification to an equivalent thermal resistance based on the shape factor.

2.2.2. Lateral Heat Transfer: Hybrid Equivalent Thermal-Resistance Network Model

Lateral thermal crosstalk (heat leakage) between the thermoelectric leg (TE leg) and the insulating material (Saffil) degrades TEG conversion efficiency. To quantify this effect while avoiding the high computational cost of 3D FEM simulations, we construct a lateral equivalent thermal-resistance (ETR) network using a lumped-parameter approach. The model’s theoretical basis is shape-factor (S) theory for steady-state heat conduction [25]. For complex geometries, such as the concentric square annuli representing the TE leg and its surrounding insulation, the steady-state conductive thermal resistance Rth is accurately predicted using a shape factor S obtained via conformal mapping and calibrated against FEM results.
S ( x ) = 8 ln ( x ) 1 + 1 4 1 1 x
R t h = 1 λ S ( x ) L
where x denotes the ratio of the outer to inner side lengths of the concentric square annulus, λ denotes the thermal conductivity of the conducting medium and L is the longitudinal (axial) length of the structure.
Although the boundary conditions in this study (aerodynamic heat flux) are transient, applying the steady-state shape factor is justified under a quasi-steady assumption for three reasons: (1) the low thermal conductivity of Saffil introduces thermal inertia relative to through-thickness heat transport; (2) material properties vary slowly within a single time step; and (3) the network model targets cross-sectional average temperatures rather than instantaneous local gradients, for which the steady-state shape factor provides a robust descriptor of the overall thermal impedance.
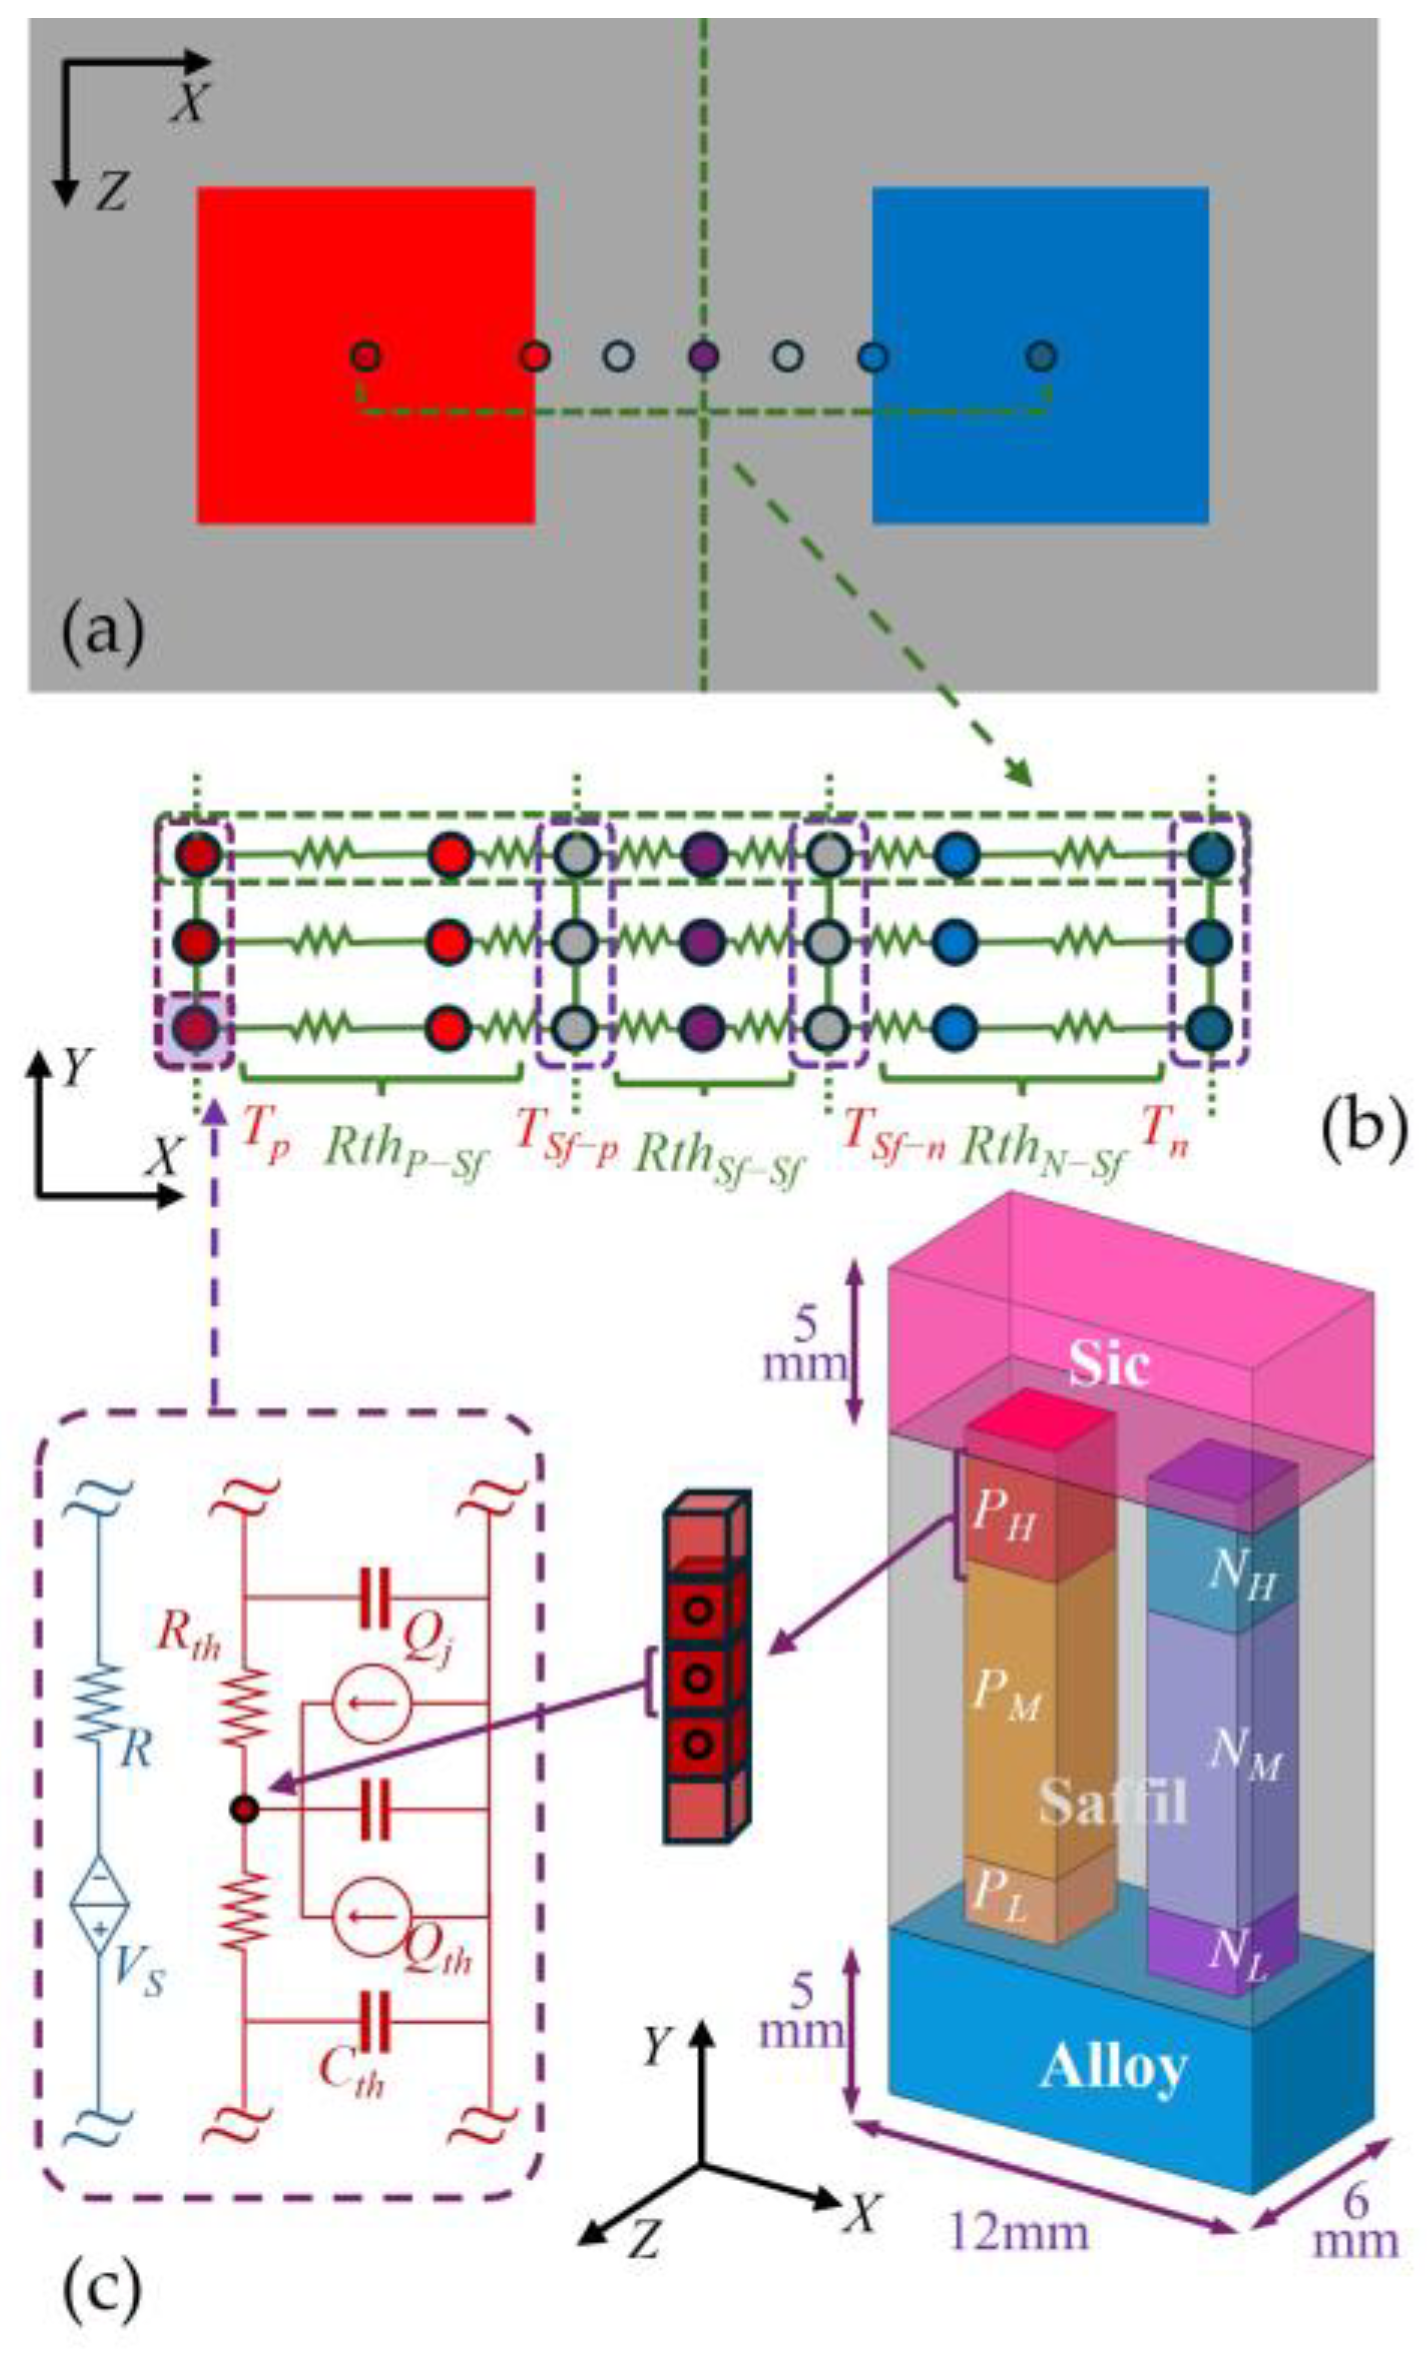
The model’s innovation is a Hybrid Equivalent Resistance (HER) approach grounded in component-level physical properties. Based on the thermal network topology in Figure 4, we define four key lateral lumped-parameter nodes: Tp (p-leg average), TSf-p (Saffil avg. encasing the p-leg), Tn (n-leg average), and TSf-n (Saffil avg. encasing the n-leg). The lateral heat-leak pathway is decomposed into two parts: Heterogeneous thermal resistance (from each TE leg to its wrapping insulation) and Homogeneous thermal resistance (within and between the insulation layers).
Heterogeneous thermal resistance (RthTE-Sf): This resistance quantifies the lateral heat-flow impedance from the TE-leg average node (Tp/Tn) to the surrounding Saffil average node (TSf-p/TSf-n). Within the HER framework, this path is modeled as two thermal resistances in series:
R t h T E - S f = R t h T E + 1 2 R t h S f
RthTE represents the equivalent resistance of the annulus between the TE average-temperature interface and the Saffil contact interface, whereas RthSaffil represents the resistance of one half of the Saffil annulus (via virtual partitioning), as shown in Figure 4.
Geometric Equivalence Method: Based on the simulation results in Figure 3, the TE-leg cross-sections exhibit a nearly uniform temperature distribution, validating the use of a single average-temperature node. Although the profile is approximately quadratic, we adopt a geometric equivalence approach, modeling the region from this average node to the outer boundary as an equivalent concentric square annulus. By straightforward integration of the heat-conduction field over this virtual annulus, the equivalent geometric ratio is found to be x = 2 , from which the corresponding lateral thermal-resistance expression (4) follows:
R t h T E = 1 λ T E S ( 2 ) d y
where dy is the longitudinal length of the element.
Thermal-Resistance Midpoint Method: For the passive Saffil Al-fiber sheath, this method is adopted. Its total lateral thermal resistance is apportioned equally to the inner and outer sides, yielding the resistance from its inner boundary to the average-temperature node Ts-p/Ts-n:
R t h S f = 1 λ Saffil S ( 2 ) d y
Homogeneous thermal resistance (RthSf-Sf):
This resistance characterizes lateral heat-leakage crosstalk between the p- and n-leg insulation (Saffil) through the intermediate medium. We simplify this pathway as the sum of resistances from the Saffil average nodes (TSf-p, TSf-n) to a virtual boundary, equivalently obtained by superposing the remaining half-resistance of each Saffil annulus. A common temperature node at this virtual boundary couples the lateral heat flow, completing the cross-sectional thermal model.
R t h S f - S f = 1 2 R t h S f ( p ) + 1 2 R t h S f ( n )

2.2.3. Longitudinal Thermoelectric Coupling Model

The model is discretized longitudinally into multiple control volumes, each represented by the distributed thermal network proposed in [19], as shown in Figure 4. The properties of each element used in the computations are temperature dependent and are evaluated at a reference temperature defined as the average of the equivalent temperature nodes at its two ends. The transient energy conservation equation for each control volume is categorized as either a TE or a Non-TE element based on its physical properties:
  • TE element: For control volumes within the thermoelectric materials (p- and n-type legs), the governing equation includes heat capacity, conduction, Joule heating, the Thomson effect, and lateral heat leakage:
    ρ C p T t   =   y λ T y + ρ e J 2 τ J T y q l a t e r a l ( y )
    where ρ is the density, Cp is the specific heat capacity, λ is the thermal conductivity, ρe is the electrical resistivity, τ is the Thomson coefficient, J is the current density, and qlateral(y) denotes the lateral heat-loss source term supplied by the lateral thermal network model in Section 2.2.2.
  • Non-thermoelectric element: For non-thermoelectric materials (e.g., SiC layer, titanium alloy, Saffil Insulator), the equation reduces to the standard heat diffusion form, containing only heat capacity, conduction, and lateral heat leakage. Although the SiC and titanium alloy layers are homogeneous, retaining the parallel four-column nodal topology (Figure 4) reduces temperature error at the thermoelectric (TE) interfaces.
ρ C p T t = y λ T y q l a t e r a l ( y )
The overall electrical performance of the TEG is determined by the Seebeck effect and the total internal electrical resistance.
  • Open-circuit voltage (Voc): obtained by summing the Seebeck electromotive forces generated by the P/N legs across all segments, as shown in Equation (9):
V o c = i = 1 N s e g T c , i T h , i ( α p , i ( T ) α n , i ( T ) ) d T
  • Total internal resistance (Rin): the series sum of the bulk resistances of all material segments together with the Electrical Contact Resistances (ECRs) of all interfaces, as shown in Equation (10):
R i n = i = 1 N s e g L i ρ e , p , i ( T ( z ) ) A p + ρ e , n , i ( T ( z ) ) A n d z + j = 1 N i n t f E C R p , j A p + E C R n , j A n
  • Output power (Pload): when an external load resistance Rload is connected, the circuit current I and the output power Pload are given, respectively, by Equations (11) and (12):
I = V o c R i n + R l o a d
P l o a d = I 2 R l o a d

2.2.4. Baseline Model Validation

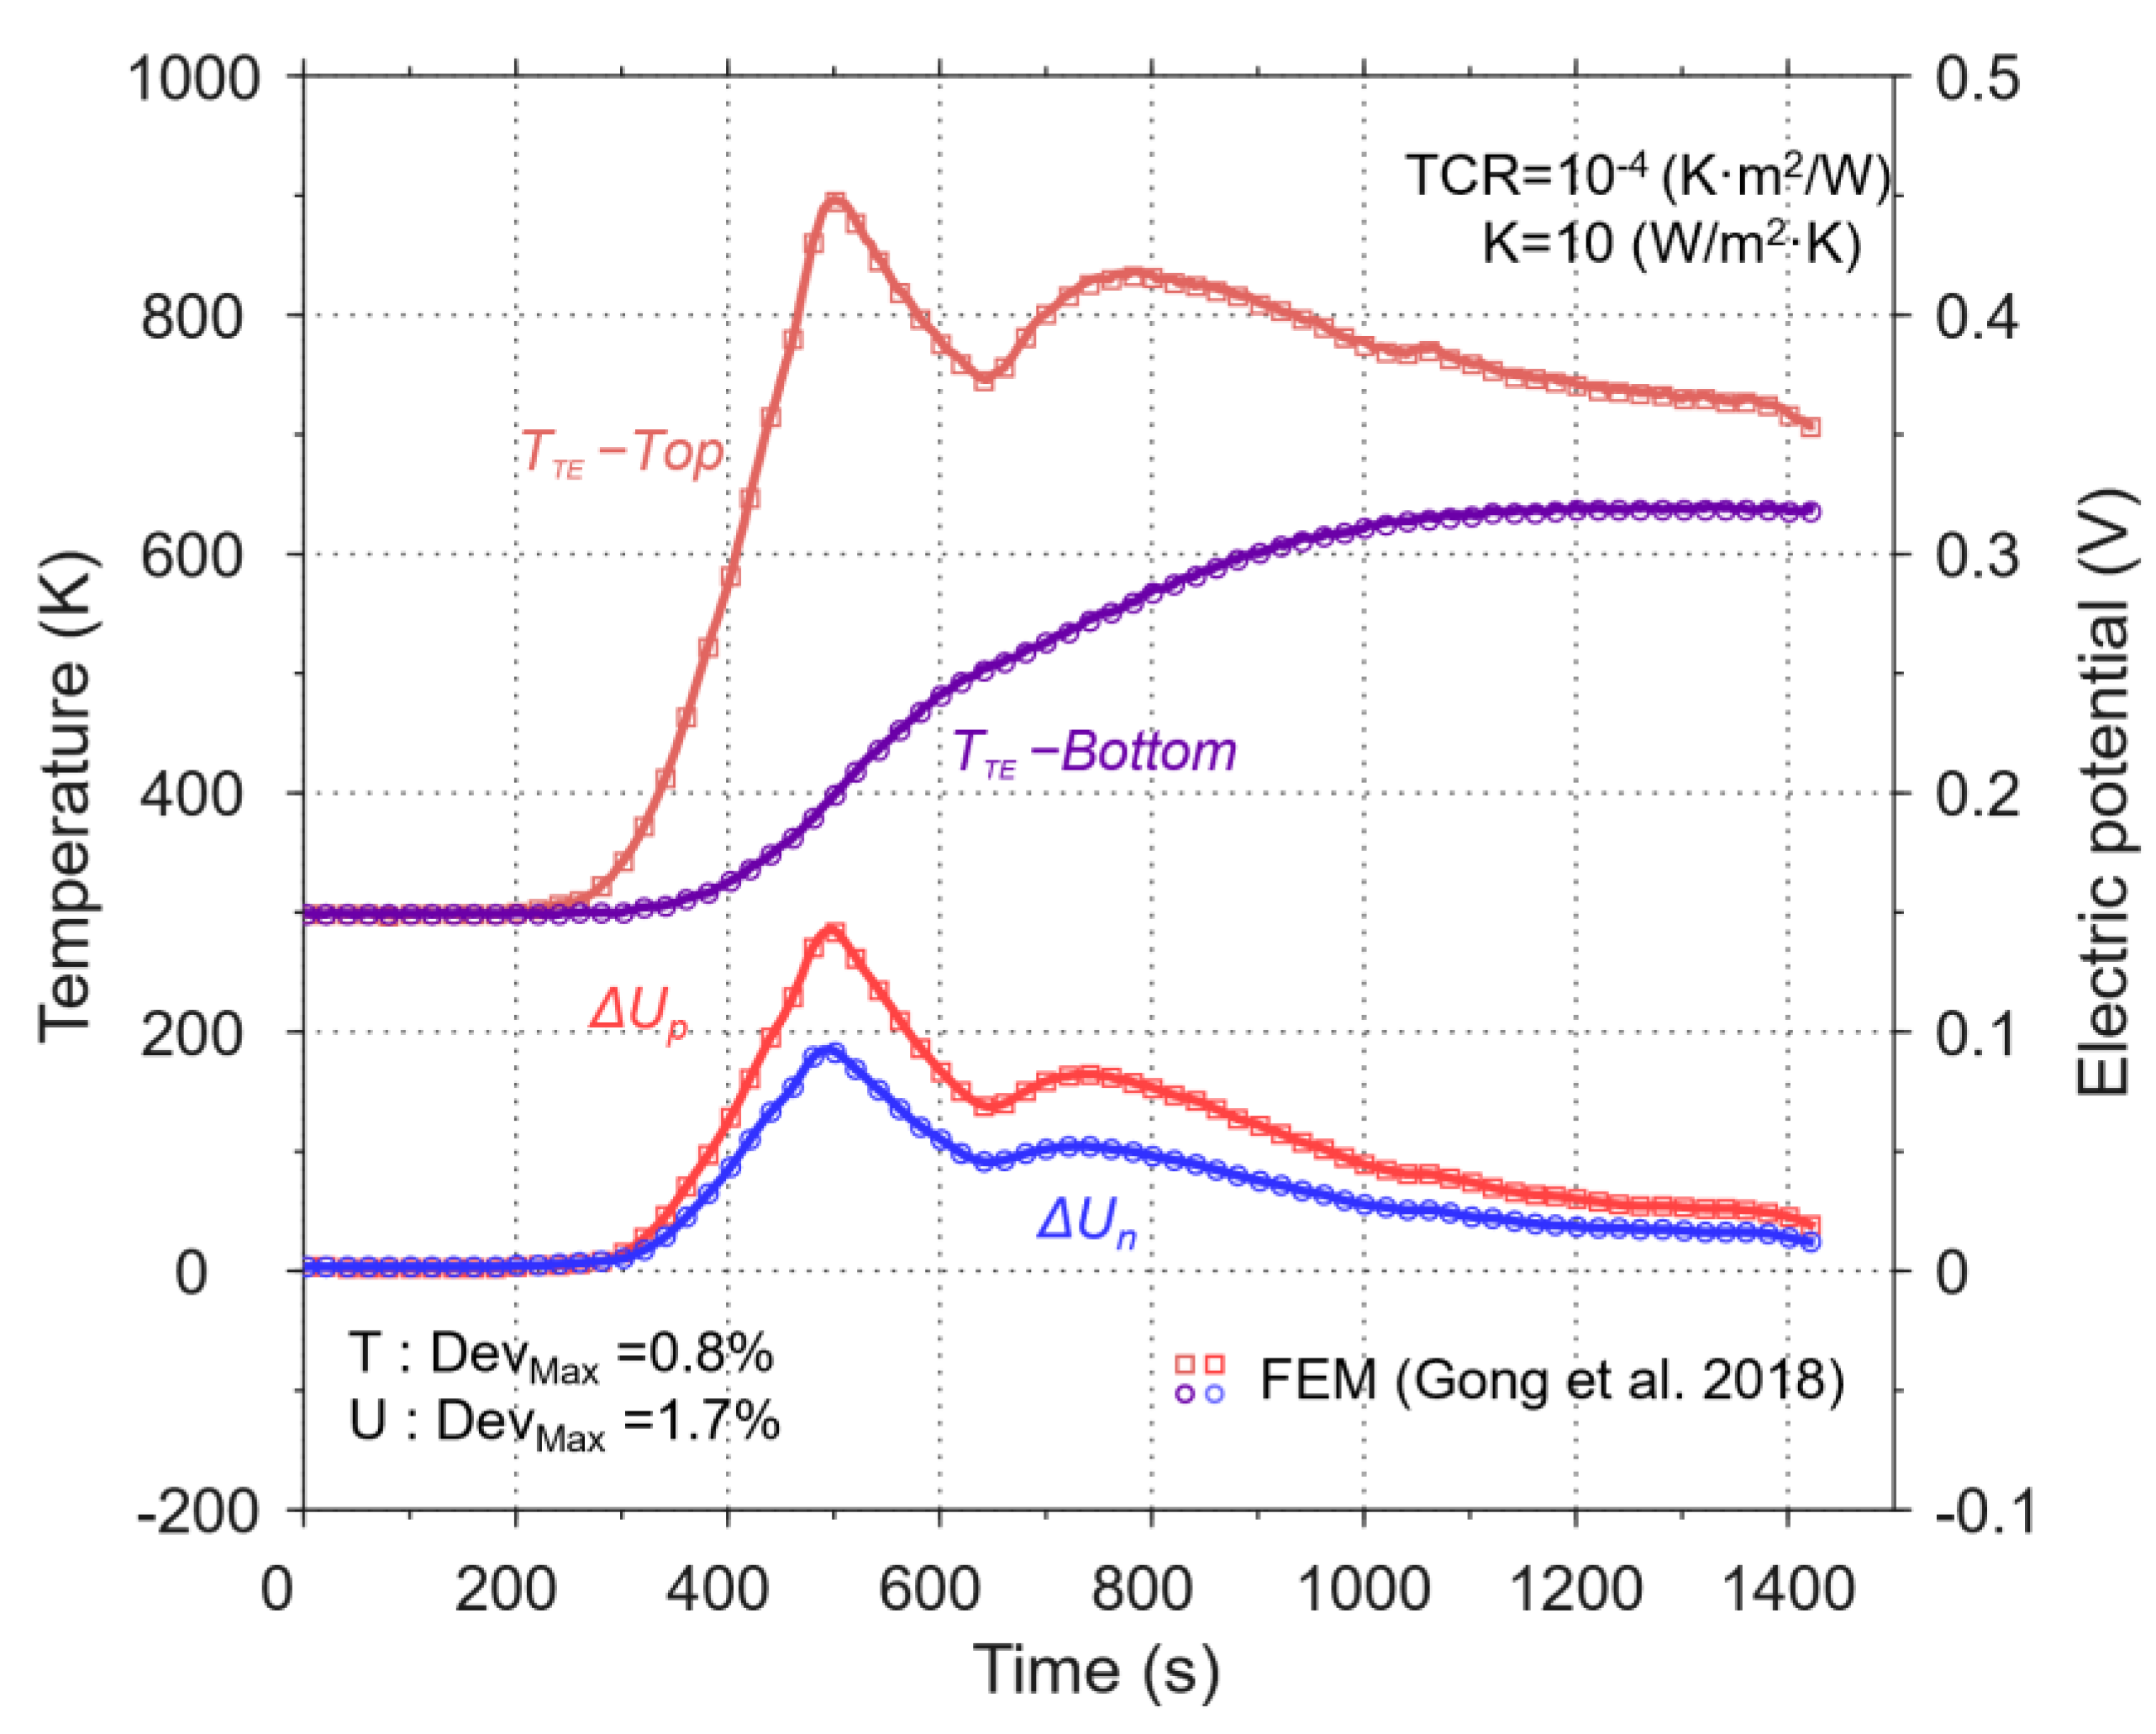
To assess the accuracy and efficiency of the quasi-2D thermal network framework, we reproduced the numerical benchmark of Gong et al. [5]. That study examined a single-stage thermoelectric generator–thermal protection system (TEG-TPS) assembly and provided the full geometry, material properties, and transient aerodynamic heat-flux boundary conditions. To ensure rigorous comparability and reproducibility, the simulation setup was matched to the reference: the entire domain was initialized at a uniform temperature Tinit = 300 K, and the bottom surface of the n-type leg was set as the electrical ground (U = 0 V). The transient aerodynamic heat flux profile shown in Figure 5 serves as the top thermal load, while the cold side employs a convective boundary condition (hconv). Figure 6 compares our predictions with the reported results in Reference [5]. Over the entire transient, the key metrics—open-circuit voltage and hot-/cold-side temperatures—agree within 2% relative error, while the runtime is on the order of seconds. These results demonstrate that the proposed framework delivers both high accuracy and high computational efficiency.

2.2.5. Integration of Interfacial Contact Effects

Having validated the core framework, we extended the model to capture the interfacial contact phenomena that become important in the multi-stage, segmented architecture considered here. Between dissimilar materials, thermal contact resistance (TCR) and electrical contact resistance (ECR) are introduced as lumped series resistances at each interface in the thermal and electrical subnetworks, respectively. For an interface with effective contact area Aeff, the inserted resistances are Rthcontact = TCR/Acontact and Relcontact = ECR/Acontact. When temperature-dependent contact data are available, the contact resistances are evaluated at the interface-average temperature consistent with the property evaluation strategy used for bulk elements. Joule heat generated at electrical contacts is apportioned locally to the adjacent control volumes to ensure energy conservation.
The prescribed TCR and ECR values are taken from experimental measurements and theoretical analyses in the References [34,35,36,37], as summarized in Table 2.

3. Structural Design Optimization

To achieve the optimal design of the hypersonic thermoelectric structure, this study establishes an NSGA-II based optimization–simulation framework that implements a complete workflow comprising thermal network construction, transient simulation, and iterative optimization. The simulation boundary conditions used during optimization are identical to those in Reference [5]. In particular, the cold side employs a convective heat transfer coefficient hconv = 100 W/(m2·K), which was identified therein as the minimum value that still prevents the airframe wall from overheating.

3.1. Problem Formulation

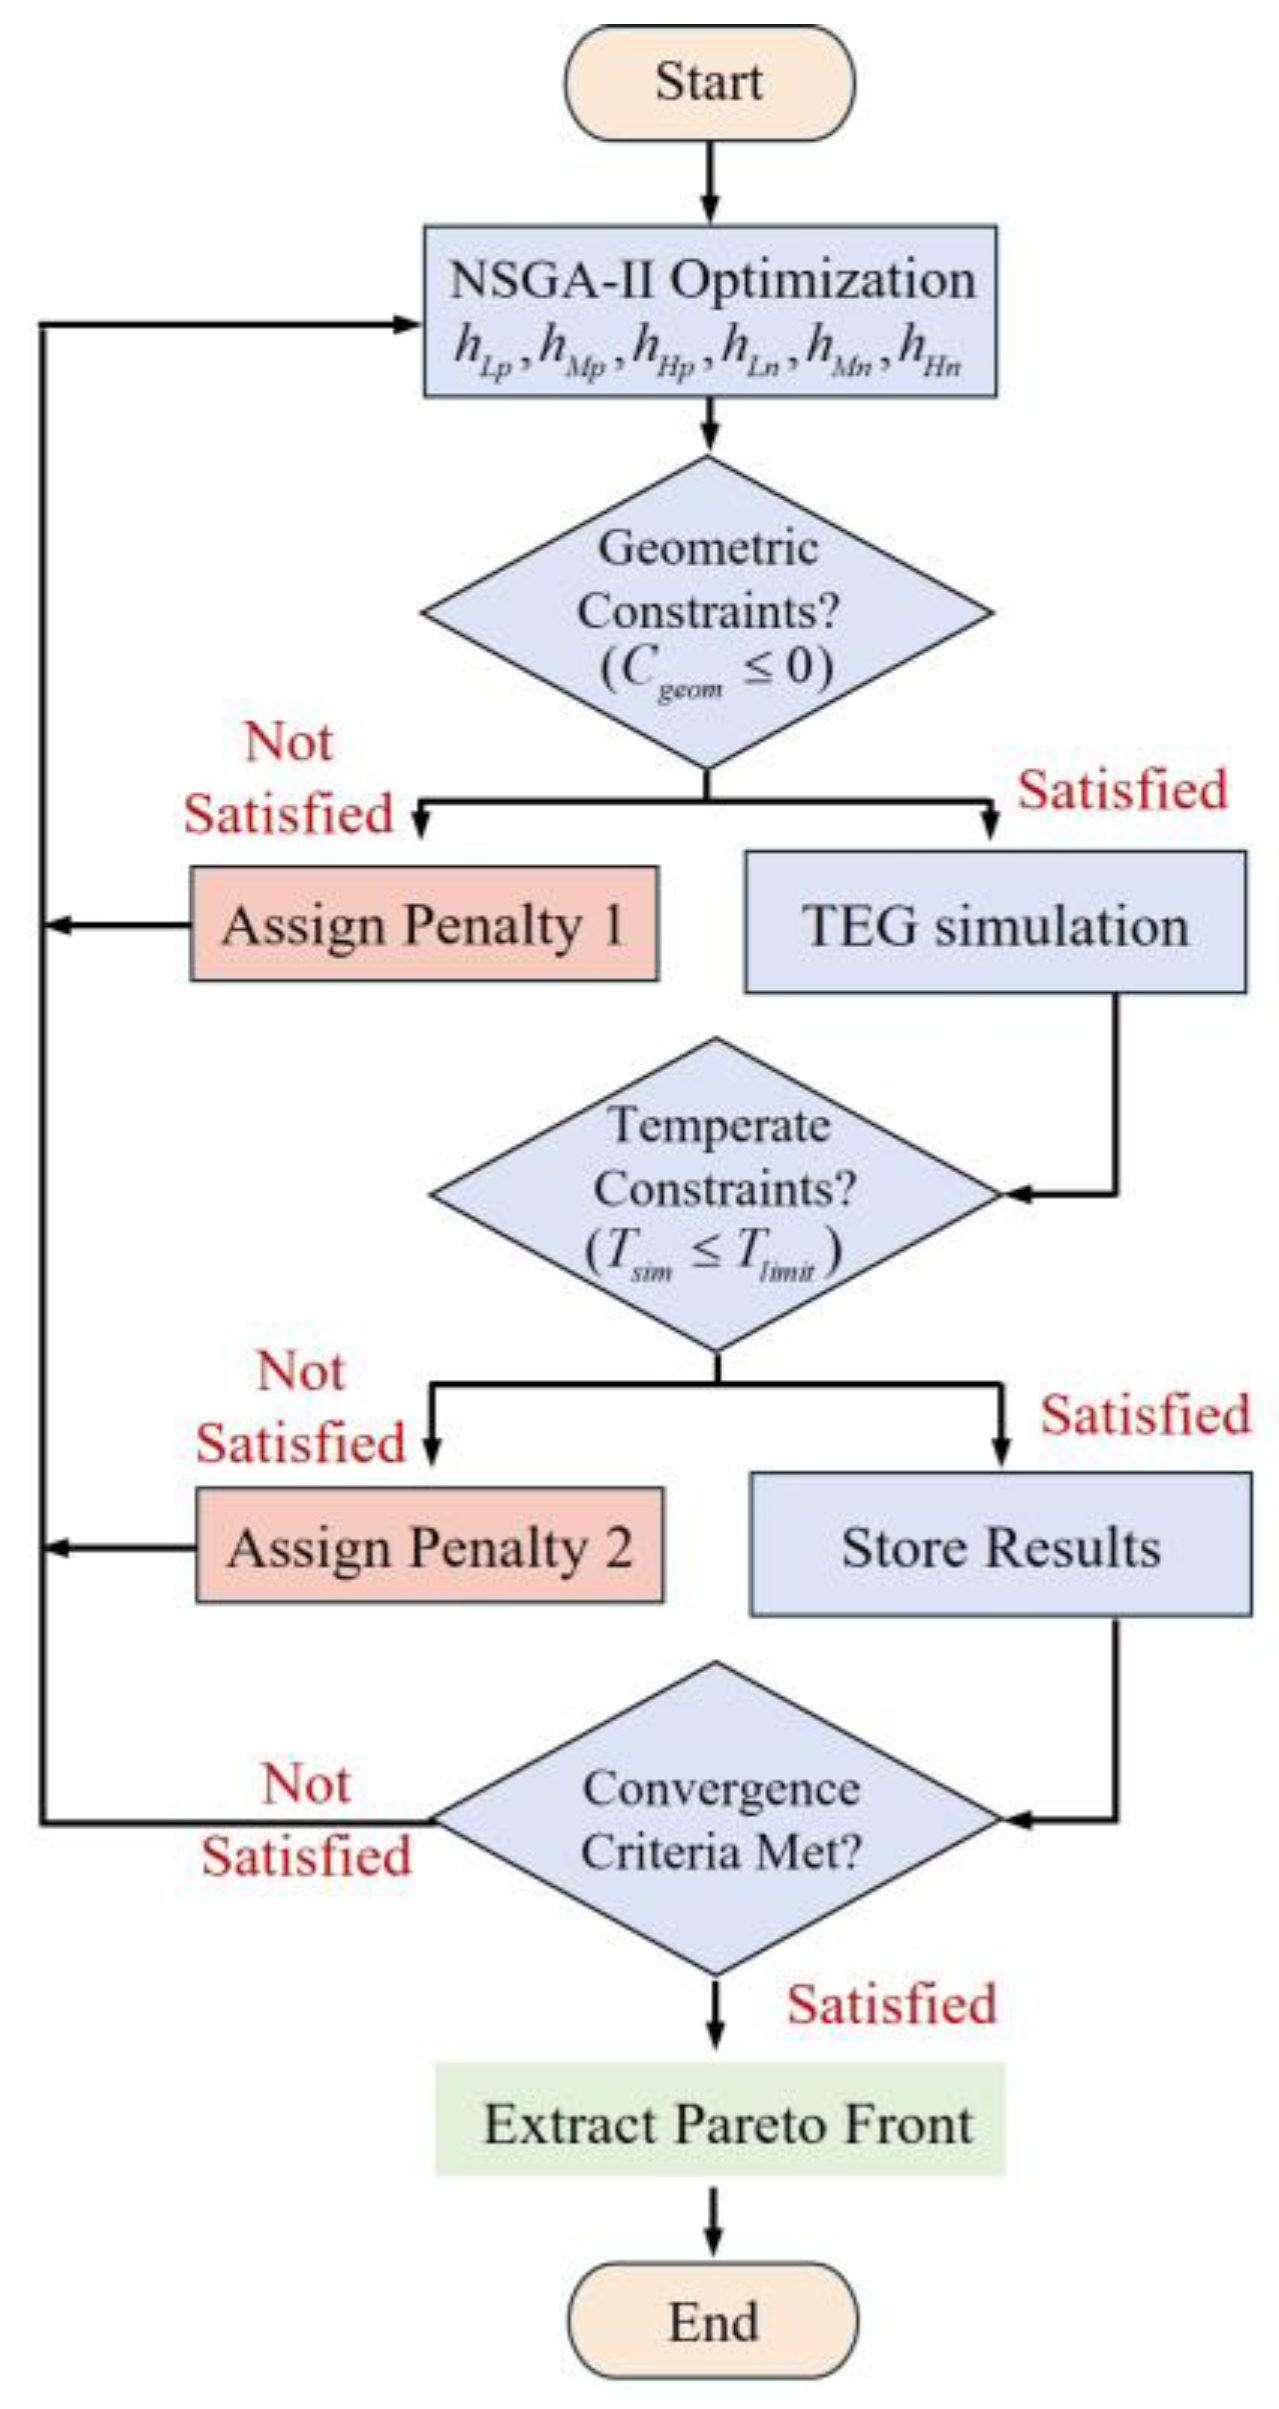
The optimization seeks Pareto-optimal designs within a geometry-defined search space that satisfy multiple objectives under physical constraints. The workflow (Figure 7) uses a pre-screening–post-validation dual-constraint strategy to ensure both computational efficiency and physical fidelity: pre-screening enforces hard geometric constraints (Cgeom) before running simulations, and post-validation checks any physics-based constraints (Csim) after transient solutions are obtained.

3.2. Design Variables and Constraints

3.2.1. Design Variables

The design variable vector X comprises the segment heights of the p- and n-type thermoelectric legs:
X = [ h L p , h M p , h H p , h L n , h M n , h H n ]
where hLp, hMp, hHp are the heights of the low-, mid-, and high-temperature segments of the p-type leg, and hLn, hMn, hHn are the corresponding segment heights of the n-type leg.

3.2.2. Constraints

The optimization is subject to the following strict geometric constraints (Cgeom), enforced during pre-screening to ensure manufacturability and a physically realizable stack:
  • Total stack height: the thermoelectric structural height HTEtotal must lie between 15 mm and 25 mm.
  • P/N leg height consistency: to maintain a level structure, the total heights of the p- and n-type legs must be equal, i.e., HP = HN.
C g e o m , 1 = H T E t o t a l 25 0 C g e o m , 2 = 15 H T E t o t a l 0 C g e o m , 3 = H P H N = ( h L p + h M p + h H p ) ( h L n + h M n + h H n ) = 0
Thermophysical constraints (Csim) are evaluated after each transient simulation to ensure safe, reliable operation:
  • Material temperature upper bound: for every material node k and any time t, the instantaneous temperature must satisfy Tk(t)Tlimit,k.
C s i m , 1 ( t ) = max k TE ( T k ( t ) T l i m i t , k ) 0
  • Cabin-side temperature upper bound: To protect onboard electronic equipment, the temperature at the inner (cabin-side) surface of the structure must not exceed 440 K.
C s i m , 2 ( t ) = max ( T i n s ( t ) 440   K ) 0

3.3. Objective Functions

This study focuses on three mutually competing core performance metrics:
f1: Specific power
  • Objective: maximize the average ideal power per unit mass, a key indicator of the system’s power-to-mass ratio.
    f 1 = P ¯ i d e a l M u n i t P ¯ i d e a l = 1 N s t e p s t = 1 N s t e p s V o c ( t ) 2 4 R i n ( t )
    where P ¯ i d e a l denotes full-cycle average ideal output power.
    f2: Maximum thermal expansion mismatch
  • Objective: minimize the peak absolute difference, over the entire operating period, between the total thermal expansion lengths of the p-type and n-type legs.
f 2 = max Δ L P ( t ) Δ L N ( t )
Specifically, ΔLP(t) and ΔLN(t) are the total axial thermal elongations of the p-leg and n-leg at time t, computed as:
Δ L ( t ) = k P / N - elems α k ( T k ( t ) T r e f ) Δ y k
where αk denotes the coefficient of thermal expansion (CTE) of material segment k; Tk(t) denotes the instantaneous temperature of discretized element k at time t; Tref = 300 K is the reference temperature; and Δyk is the axial length increment associated with thermal network element k.
f3: Normalized thermal margin
  • Objective: f3 is a composite thermal reliability metric. It first applies a large positive penalty term—the overtemperature integral—to strictly preclude any overtemperature anywhere in the system. Only when no overtemperature occurs over the entire spatiotemporal domain does the objective switch to a negative reward whose magnitude equals the minimum relative thermal safety margin sustained across space and time. Minimizing f3 thereby eliminates overtemperature risk and, conditional on safe operation, maximizes the robustness of the thermal design.
    f 3 = t = 1 N s t e p s k elems max ( 0 , T k ( t ) T l i m i t , k ) Δ y k Δ t if   ( k , t )   s . t .   T k ( t ) > T l i m i t , k min t , k T l i m i t , k T k ( t ) T l i m i t , k if   ( k , t ) , T k ( t ) T l i m i t , k
    where Tlimit,k is the specified maximum allowable temperature for the material used in element k; Δt is the time-step size.

4. Results and Discussion

4.1. Comparison of Optimization Results

The resulting set of non-dominated solutions, shown in Figure 8a, constitutes the Pareto front in the three-objective space. As illustrated, the specific power (f1) for these optimized designs predominantly spans from 20 to 28 W/kg. While these values are lower than those of typical aerospace batteries (200–300 W/kg), the TEG-TPS offers the distinct advantage of functioning as a multifunctional load-bearing component rather than parasitic mass. Consequently, it is positioned as a critical auxiliary power source for distributed on-board electronics—such as wireless health-monitoring sensors—eliminating the need for heavy cabling and redundant energy storage.
Within this design space, Figure 8a clearly reveals strong conflicts and trade-offs among the three core objectives. The most notable conflict is between specific power f1 and thermal margin f3: designs targeting high power density generally exhibit lower thermal margin. This occurs because high-power-density designs tend to favor lightweight configurations with smaller total height (and mass), which concomitantly reduce the system’s total thermal resistance, making the system more prone to approach the material temperature limit. To deepen understanding of this trade-off and extract design guidelines, we strategically selected three representative designs on the Pareto front for detailed analysis, as shown in Table 3: P (Max specific power), which maximizes specific power; R (Reliability-prioritized), which maximizes thermal margin while maintaining low thermal expansion mismatch (low f2); and B (Balanced), the balanced design located at the knee point of the Pareto front, offering the best compromise among the three objectives. Figure 8b presents the geometric configurations of the p- and n-type (P/N) legs for these three representative designs.

4.2. Thermoelectric Characteristic Analysis

To elucidate the physical origins of performance differences arising from different optimization strategies, the field distributions of Designs P (Max specific power), R (Reliability-prioritized), and B (Balanced) were subjected to comparative analysis.

4.2.1. Temperature Characteristics

Figure 9a presents the time histories of the top- and bottom-surface temperatures of the three optimized designs under transient external heat flux. The top-surface temperature curves of the three structures are nearly identical, with minimal differences, indicating that optimization primarily affects internal heat partitioning rather than the surface temperature response. In contrast, the bottom-surface temperature shows a pronounced disparity: Design R, which has the largest thermal margin and overall thickness, exhibits the lowest cold-side temperature, approximately 10 K lower on average than the other two designs over the entire simulation period. This confirms that increasing total thermal resistance enhances the structure’s thermal insulation and thermal reliability.
Figure 9b compares the temporal evolution of the thermal expansion mismatch between the p-/n-type legs for the three designs. This metric is directly linked to the mechanical reliability of the structure. Design B demonstrates markedly superior behavior: its thermal expansion mismatch is nearly one order of magnitude lower than that of the other two designs (P and R) and remains nearly constant in the latter half of the simulation (after approximately 600 s), indicating high mechanical stability.
Figure 10 further probes the interior by analyzing the time histories of the average temperatures of each segment for the p- and n-type legs, shown for the p-leg in Figure 10a and for the n-leg in (Figure 10b). In the high-temperature segment (HTE), the average temperature curves of the three designs for both legs are very close, indicating that the optimization affects the hot side primarily through the overall thermal resistance. The key differences emerge in the mid-/low-temperature segments (M/LTE): for the p-leg, Design B resembles the power-prioritized Design P in profile and maintains a higher overall temperature level; whereas for the n-leg (Figure 10b), Design B aligns more with the reliability-prioritized Design R, with the average temperatures of its M/LTE markedly lower than those of Design P.
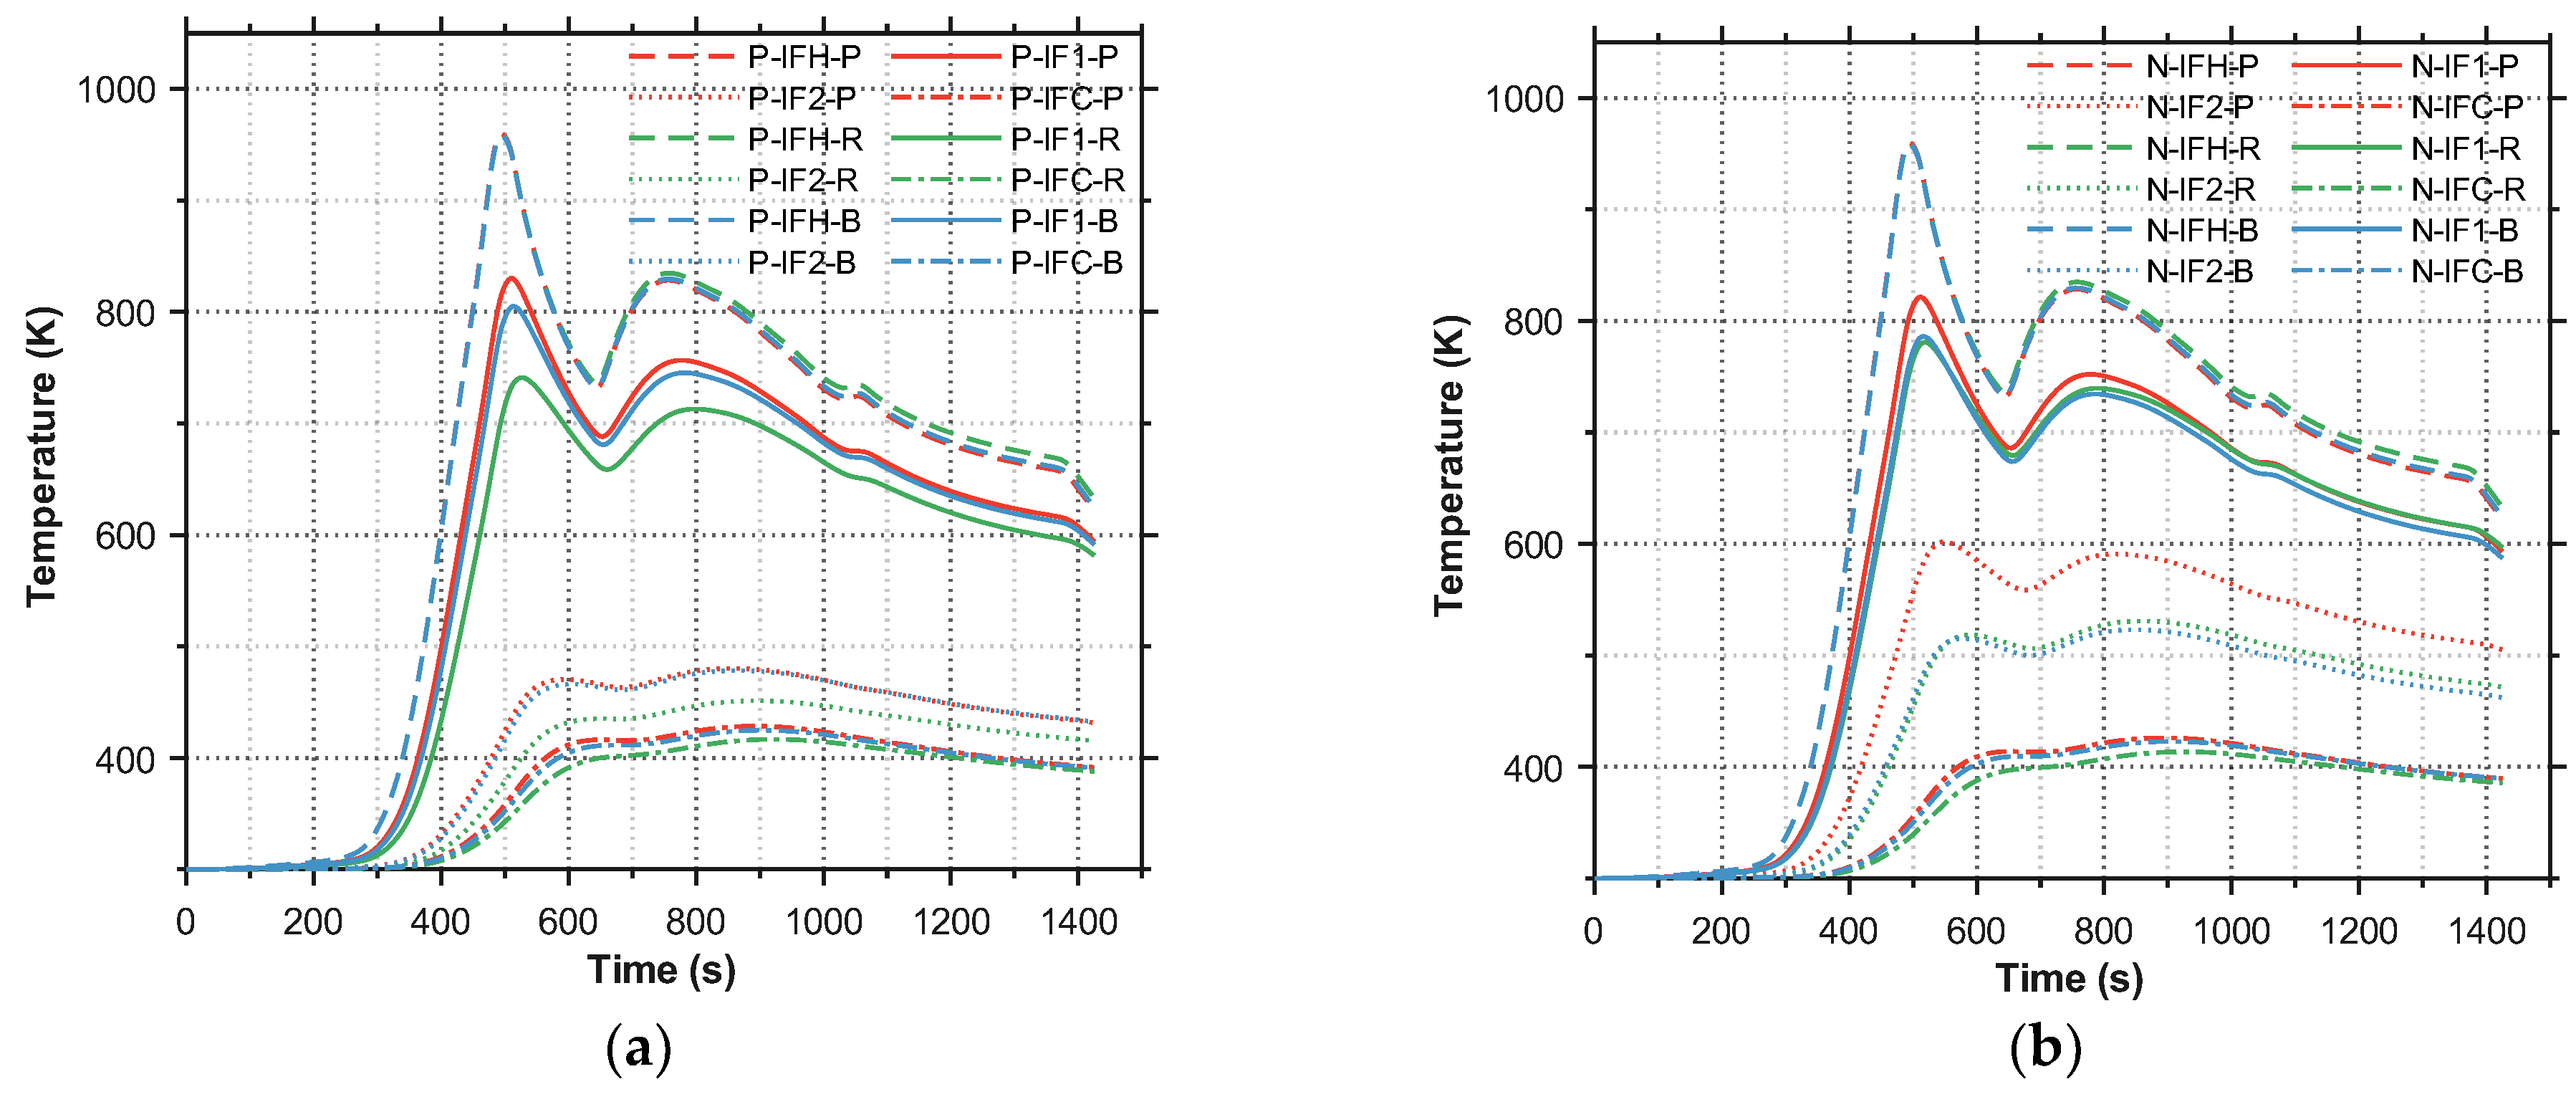
Figure 11 reveals a critical thermal inertia phenomenon. The upper interfaces—namely, the hot-side electrode interface (IFH) and the HTE–MTE interface (IF1)—exhibit peak temperatures near the first heat flux peak (approximately 500 s). In contrast, the lower interfaces—the MTE–LTE interface (IF2) and the cold-side electrode interface (IFC)—exhibit peak temperatures delayed near the second heat flux peak (approximately 800–1000 s). This clearly indicates significant heat accumulation in the lower portion of the structure; even as the heat flux decreases in the later period, temperatures in the middle and lower regions change little and even rise slightly. Regarding differences between the P- and n-legs, temperatures at the IFH, IF1, and IFC interfaces exhibit minimal variation between the MTE–LTE interface (IF2) temperature in the n-leg (Figure 11b) is markedly higher than that at the IF2 interface in the p-leg (Figure 11a).

4.2.2. Electrical Characteristic

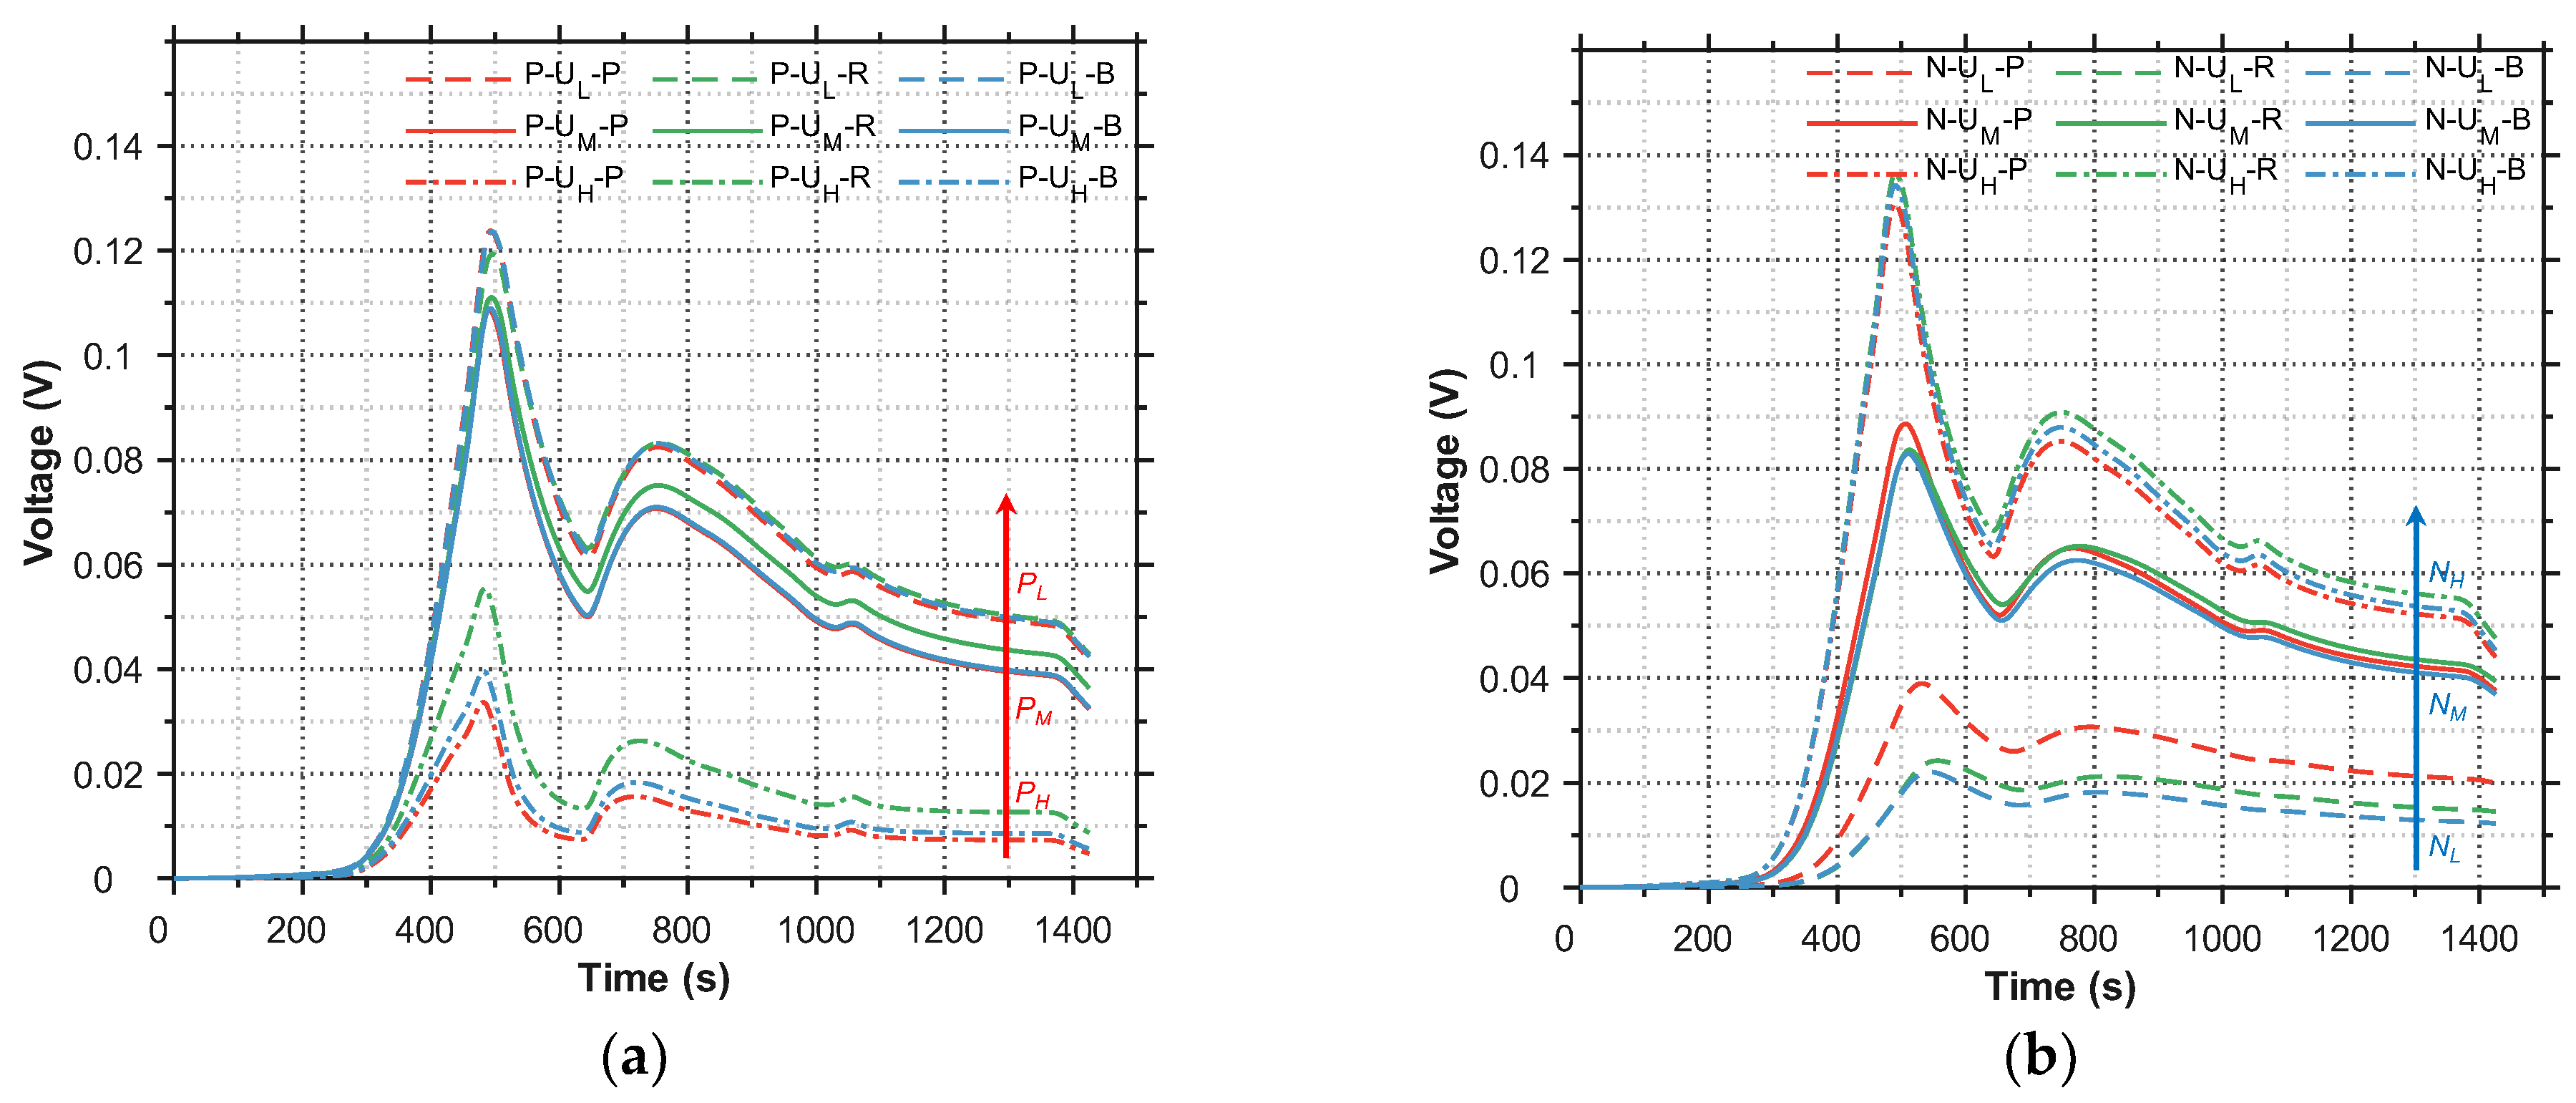
Figure 12 corroborates a consistent conclusion: across all designs, the MTE contributes the largest share of the voltage output (~60%), primarily because it spans the widest temperature range (500–850 K), enabling full exploitation of the material’s high-ZT window. For the n-leg (Figure 12a), where the electric potential increases in the same direction as the temperature gradient, Design P performs best in the LTE; its advantage diminishes in the MTE; and it is ultimately overtaken by Designs R and B in the HTE. For the p-leg (Figure 12b), where the electric potential increases opposite to the temperature gradient, the trend differs: Design R performs best at high temperatures, but as heat is conducted toward the cold side, its potential growth rate gradually slows, and its total potential is eventually surpassed by the balanced Design B. Among the three schemes, Design B achieves the highest combined voltage of the two legs.
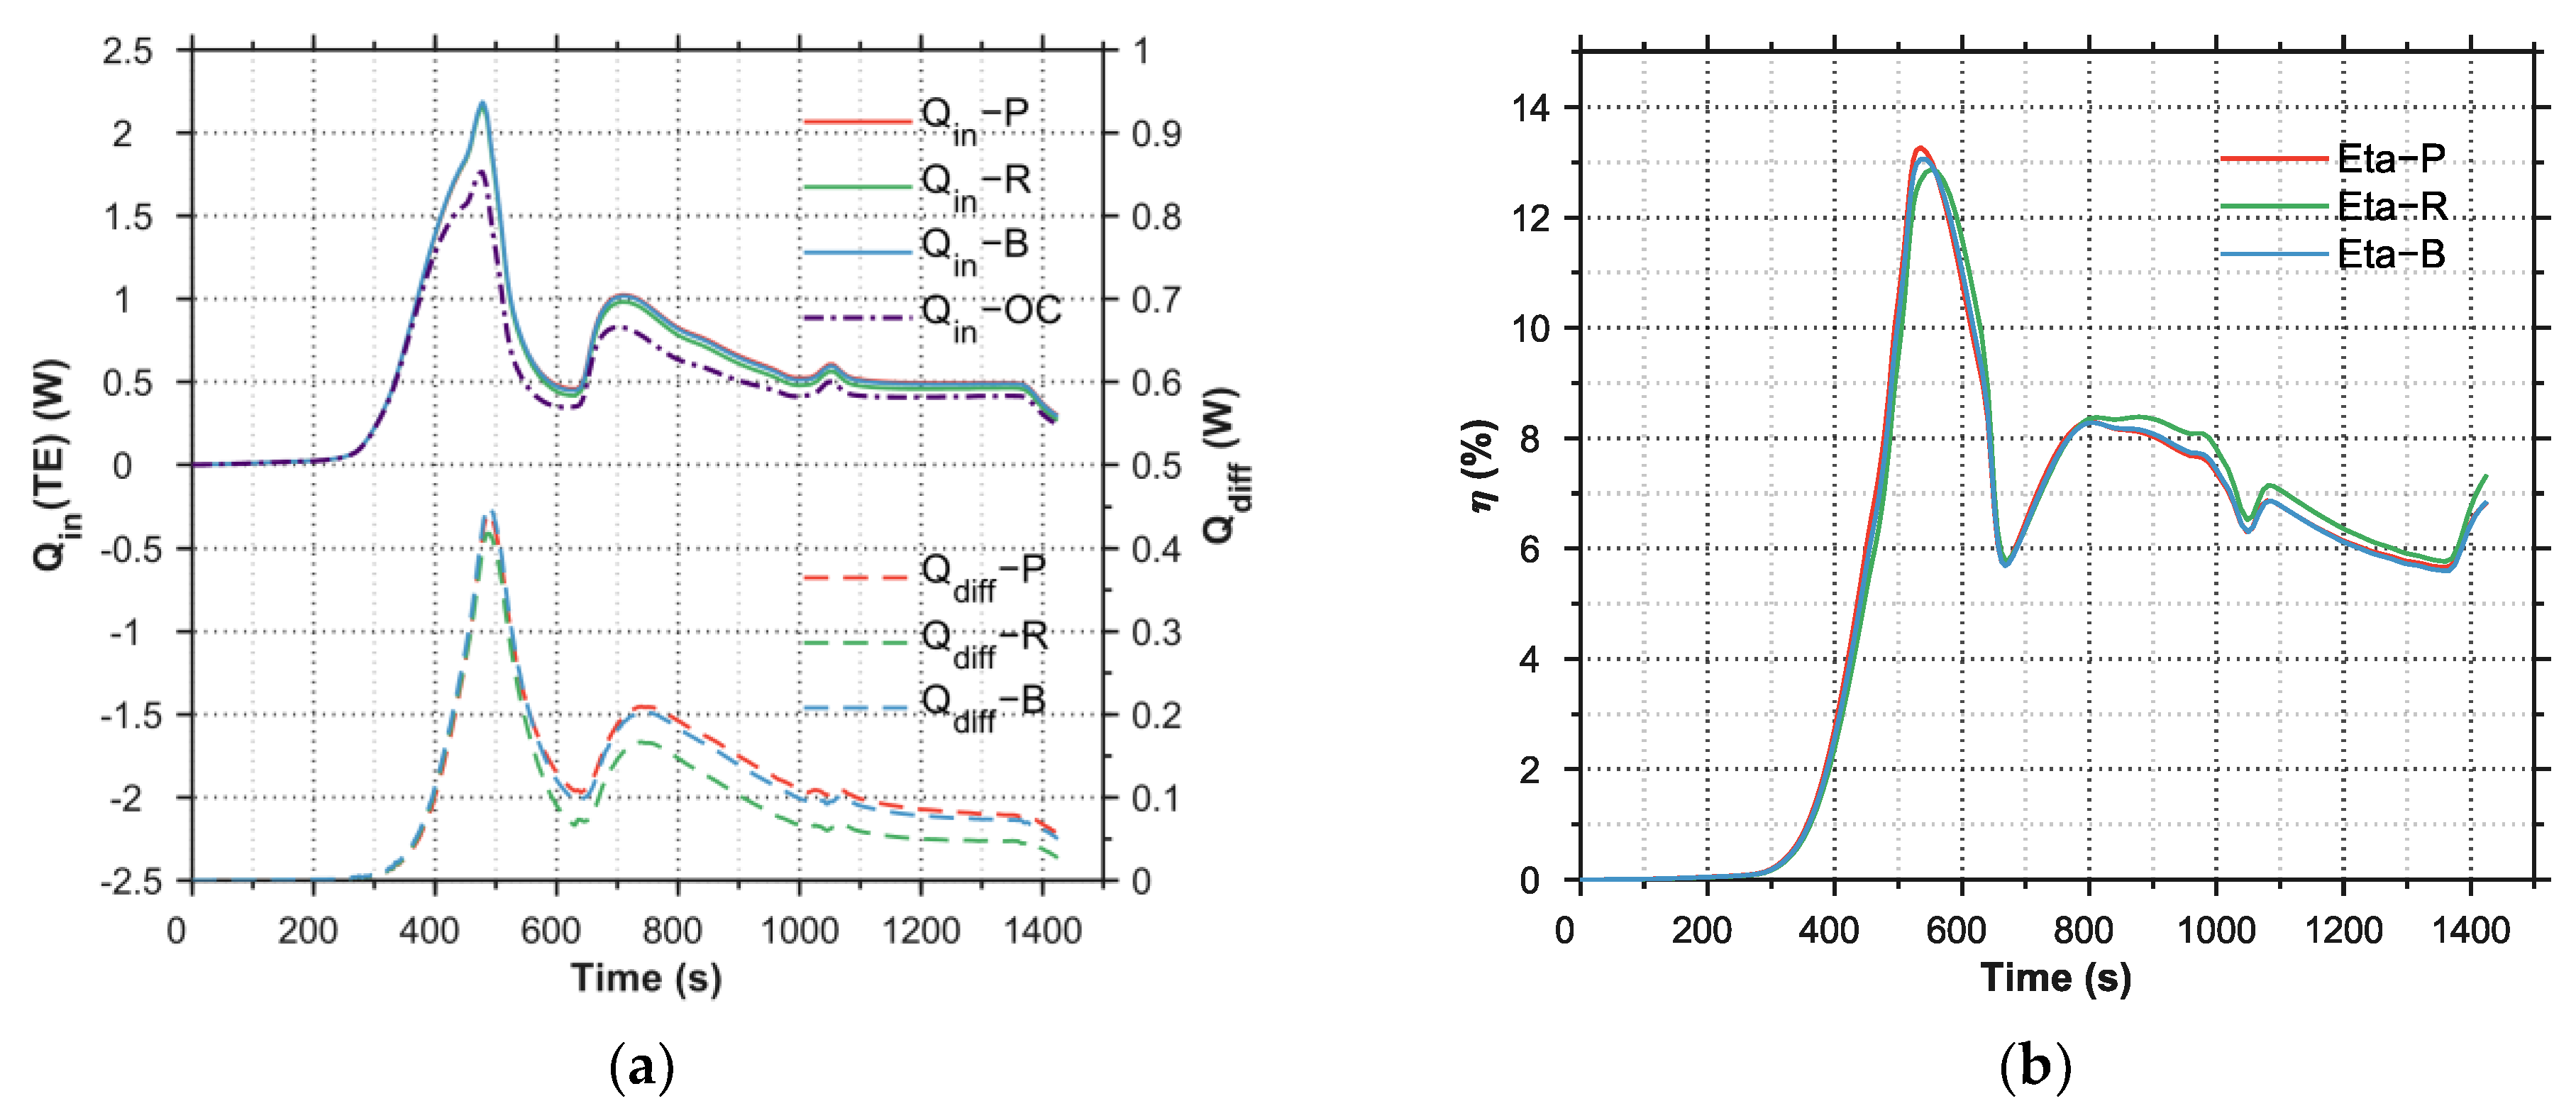
When evaluating thermoelectric efficiency, a common practice is to reference the ratio of ideal power to input heat under open-circuit conditions (Qin-OC). However, once a load is connected and current flows (I > 0), the Peltier effect induces pronounced heat absorption at the hot-side junction; concurrently, Joule heating arises within the material, and under large temperature differences the Thomson effect becomes non-negligible. These coupled thermoelectric effects feed back to reshape the internal temperature gradient, thereby dynamically altering the conductive heat flux entering the hot side according to Fourier’s law. Consequently, the actual total heat input under load, Qin-load, differs significantly from Qin-OC. To quantify this impact, we choose a load resistance Rload comparable to the average internal resistance of the three configurations (~0.08 Ω) to emulate near-maximum-power operation. Figure 13a shows, for both the loaded and open-circuit cases, the time evolution of the total hot-side heat input to the p-and n-legs (Qin) and their difference (Qdiff).
Finally, using the real load power Pload(t) = I(t)2Rload and the actual input heat flow (Load), Qin(t), shown in Figure 13a, we computed the instantaneous, real conversion efficiency η(t) = Pload(t)/Qin(t). The results show that, despite pronounced differences among the three designs in geometry, specific power (f1), and reliability metrics (f2, f3), their actual max conversion efficiencies are very similar, all around 13% (Figure 13b). This convergence indicates that the efficiency upper bound is largely dictated by the material system, whereas geometric optimization primarily tunes macroscopic attributes such as output power and temperature margins.

5. Conclusions

In this study, a multi-objective robust design methodology for a segmented thermoelectric–thermal protection structure (TEG-TPS) harvesting aerodynamic heat from hypersonic vehicles has been presented. A high-fidelity, computationally efficient quasi-2D thermal network model was developed, integrating a novel hybrid equivalent resistance network to capture complex lateral heat transfer. The accuracy of this core model was rigorously validated against published results from a benchmark case. An automated multi-objective optimization platform (based on NSGA-II) was then established to investigate the effects of geometric design variables on system performance. The optimization systematically navigated the trade-offs between conflicting objectives, namely specific power (f1), maximum thermal expansion mismatch (f2), and normalized thermal margin (f3). The performance of optimized designs under actual transient flight conditions was evaluated and compared against a baseline design. The results lead to the following conclusions:
  • The proposed quasi-2D thermal network model, which incorporates the hybrid equivalent resistance method and accounts for full transient thermoelectric effects (Seebeck, Peltier, Thomson, Joule), was verified to achieve high accuracy (relative error < 2%) against published 3D FEM results. This model reduced calculation time to on the order of seconds, making complex transient multi-objective optimization feasible. However, it is important to note that this efficiency relies on assumptions of periodic symmetry and uniform cross-sections. While valid for the unit-cell analysis performed here, these assumptions may limit direct applicability for asymmetric configurations or edge effects in finite arrays without recalibration.
  • The multi-objective optimization revealed a severe conflict between specific power (f1) and normalized thermal margin (f3). Designs pursuing maximum power inherently favor a smaller total thickness, which reduces thermal resistance, raises cold-side temperatures, and drastically diminishes the thermal margin, leading to high risks of material failure by overheating.
  • The effectiveness of the multi-objective optimization framework is demonstrated by the identified Balanced design (Design B). As shown by the quantitative results, compared to the Power-Priority design (Design P), Design B achieves a 61% reduction in thermal expansion mismatch (f2) and raises the minimum thermal margin (f3) from 0.8%to 5% throughout the entire flight envelope, while sacrificing only 6.8% of the maximum achievable specific power (f1).
  • Despite distinct geometric configurations among the optimized designs (P, R, B), the peak conversion efficiency consistently converges to approximately 13%. This indicates that, under the constraint of uniform cross-sectional legs, the efficiency ceiling is primarily governed by the ZT values of the material system. However, this value does not represent the absolute physical limit. Future research exploring variable cross-section architectures (e.g., hourglass or tapered legs) could potentially surpass this 13% threshold by more effectively matching the local thermal impedance to the material’s optimal temperature range.
  • Translating optimized designs into flight-ready hardware entails substantial manufacturing and operational challenges. In particular, assembling multi-segment thermoelectric generator (TEG) structures demands precise control of interfacial quality, as thermal and electrical contact resistances can significantly degrade conversion efficiency. Moreover, the hypersonic flight environment—characterized by repeated thermal cycling, high-amplitude vibration, and shock loading—subjects the structure to risks of material fatigue and interfacial delamination over extended missions. Scaling to large-scale production introduces additional difficulties in maintaining consistent material properties and geometric tolerances. Therefore, future work must bridge the gap between theory and application through rigorous experimental validation under relevant flight conditions and the development of robust, high-yield manufacturing processes to ensure system reliability.

Author Contributions

Conceptualization, H.D. and Y.Z.; Methodology, Y.Z. and H.D.; Validation, K.C. and T.X.; Formal Analysis, Y.Z. and K.C.; Investigation, Y.Z., K.C. and T.X.; Data Curation, T.X. and K.Z.; Writing—Original Draft Preparation, Y.Z. and H.D.; Writing—Review and Editing, Y.Z., H.D. and K.C.; Visualization, K.C.; Supervision, H.D. and K.Z.; Project Administration, H.D. and K.Z. All authors have read and agreed to the published version of the manuscript.

Funding

This research was funded by the Independent Research Project of the State Key Laboratory of Mechanics and Control for Aerospace Structures, grant number MCAS-I-0323K02.

Data Availability Statement

The original contributions presented in this study are included in the article. Further inquiries can be directed to the corresponding author.

Conflicts of Interest

The authors declare no conflicts of interest.

References

  1. An, K.; Guo, Z.; Xu, X.; Huang, W. A framework of trajectory design and optimization for the hypersonic gliding vehicle. Aerosp. Sci. Technol. 2020, 106, 106110. [Google Scholar] [CrossRef]
  2. Gou, J.-J.; Yan, Z.-W.; Hu, J.-X.; Gao, G.; Gong, C.-L. The heat dissipation, transport and reuse management for hypersonic vehicles based on regenerative cooling and thermoelectric conversion. Aerosp. Sci. Technol. 2021, 108, 106373. [Google Scholar] [CrossRef]
  3. Behrens, B.; Müller, M. Technologies for thermal protection systems applied on re-usable launcher. Acta Astronaut. 2004, 55, 529–536. [Google Scholar] [CrossRef]
  4. Gori, F.; Corasaniti, S.; Worek, W.M.; Minkowycz, W.J. Theoretical prediction of thermal conductivity for thermal protection systems. Appl. Therm. Eng. 2012, 49, 124–130. [Google Scholar] [CrossRef]
  5. Gong, C.-L.; Gou, J.-J.; Hu, J.-X.; Gao, F. A novel TE-material based thermal protection structure and its performance evaluation for hypersonic flight vehicles. Aerosp. Sci. Technol. 2018, 77, 458–470. [Google Scholar] [CrossRef]
  6. Zhang, D.; Qin, J.; Feng, Y.; Ren, F.; Bao, W. Performance evaluation of power generation system with fuel vapor turbine onboard hydrocarbon fueled scramjets. Energy 2014, 77, 732–741. [Google Scholar] [CrossRef]
  7. Song, S.; Liu, W.; Peitsch, D.; Schaefer, U. Detailed design of a high speed switched reluctance starter/generator for more/all electric aircraft. Chin. J. Aeronaut. 2010, 23, 216–226. [Google Scholar] [CrossRef]
  8. Cheng, K.; Qin, J.; Zhang, D.; Bao, W.; Jing, W. Performance evaluation for a combined power generation system of closed-Brayton-cycle and thermoelectric generator with finite cold source at room temperature on hypersonic vehicles. Energy 2022, 254, 124444. [Google Scholar] [CrossRef]
  9. Surhone, L.M.; Tennoe, M.T.; Henssonow, S.F. Ram Air Turbine; Collins Aerospace: Wilson, NC, USA, 2010. [Google Scholar]
  10. Wang, Y.; Cheng, K.; Dang, C.; Wang, C.; Qin, J.; Huang, H. Performance and experimental investigation for a novel heat storage based thermoelectric harvester for hypersonic vehicles. Energy 2023, 263, 125885. [Google Scholar] [CrossRef]
  11. Bell, L.E. Cooling, heating, generating power, and recovering waste heat with thermoelectric systems. Science 2008, 321, 1457–1461. [Google Scholar] [CrossRef]
  12. Chen, W.-H.; Chiou, Y.-B. Geometry design for maximizing output power of segmented skutterudite thermoelectric generator by evolutionary computation. Appl. Energy 2020, 274, 115296. [Google Scholar] [CrossRef]
  13. Gao, G.; Gou, J.-J.; Gong, C.-L.; Hu, J.-X.; Gao, R.-C. A novel mechanical-thermal-electrical thermal protection system concept and its multi-scale performance evaluation for hypersonic launch vehicles. Compos. Struct. 2021, 268, 113962. [Google Scholar] [CrossRef]
  14. Cheng, K.; Zhang, D.; Qin, J.; Zhang, S.; Bao, W. Performance evaluation and comparison of electricity generation systems based on single- and two-stage thermoelectric generator for hypersonic vehicles. Acta Astronaut. 2018, 151, 15–21. [Google Scholar] [CrossRef]
  15. Cheng, K.; Qin, J.; Jiang, Y.; Lv, C.; Zhang, S.; Bao, W. Performance assessment of multi-stage thermoelectric generators on hypersonic vehicles at a large temperature difference. Appl. Therm. Eng. 2018, 130, 1598–1609. [Google Scholar] [CrossRef]
  16. Cheng, K.; Qin, J.; Sun, H.; Dang, C.; Zhang, S.; Liu, X.; Bao, W. Performance assessment of an integrated power generation and refrigeration system on hypersonic vehicles. Aerosp. Sci. Technol. 2019, 89, 192–203. [Google Scholar] [CrossRef]
  17. Cheng, K.; Qin, J.; Jiang, Y.; Zhang, S.; Bao, W. Performance comparison of single- and multi-stage onboard thermoelectric generators and stage number optimization at a large temperature difference. Appl. Therm. Eng. 2018, 141, 456–466. [Google Scholar] [CrossRef]
  18. Chen, L.; Li, J.; Sun, F.; Wu, C. Performance optimization of a two-stage semiconductor thermoelectric-generator. Appl. Energy 2005, 82, 300–312. [Google Scholar] [CrossRef]
  19. Gao, G.; Li, D.; Gou, J.-J.; Gong, C.-L.; Li, S.-M. A study of interfacial electrical contact resistances of thermoelectric generators for hypersonic vehicles by experimental measurements and two-scale numerical simulations. Aerosp. Sci. Technol. 2022, 131, 107966. [Google Scholar] [CrossRef]
  20. Gou, J.-J.; Hu, J.-X.; Yan, Z.-W.; Gao, G.; Gong, C.-L. Effects of physical dimensions, temperature ranges and interfacial thermal contacts on the multi-stage thermoelectric generators for a hypersonic vehicle. Int. J. Energy Res. 2022, 46, 20021–20038. [Google Scholar] [CrossRef]
  21. Shittu, S.; Li, G.; Zhao, X.; Ma, X.; Akhlaghi, Y.G.; Fan, Y. Comprehensive study and optimization of concentrated photovoltaic-thermoelectric considering all contact resistances. Energy Convers. Manag. 2020, 205, 112422. [Google Scholar] [CrossRef]
  22. Zhang, A.B.; Wang, B.L.; Pang, D.D.; Chen, J.B.; Wang, J.; Du, J.K. Influence of leg geometry configuration and contact resistance on the performance of annular thermoelectric generators. Energy Convers. Manag. 2018, 166, 337–342. [Google Scholar] [CrossRef]
  23. Piggott, A. Detailed Transient Multiphysics Model for Fast and Accurate Design, Simulation and Optimization of a Thermoelectric Generator (TEG) or Thermal Energy Harvesting Device. J. Electron. Mater. 2019, 48, 5442–5452. [Google Scholar] [CrossRef]
  24. Gou, J.J.; Gong, C.L.; Tao, W.Q. Appropriate utilization of the unit cell method in thermal calculation of composites. Appl. Therm. Eng. 2018, 139, 295–306. [Google Scholar] [CrossRef]
  25. Chen, M.; Rosendahl, L.A.; Condra, T.J.; Pedersen, J.K. Numerical modeling of thermoelectric generators with varying material properties in a circuit simulator. IEEE Trans. Energy Convers. 2009, 24, 112–124. [Google Scholar] [CrossRef]
  26. Chavez, J.A.; Ortega, J.A.; Salazar, J.; Turo, A.; Garcia, M.J. SPICE model of thermoelectric elements including thermal effects. In Proceedings of the 17th IEEE Instrumentation and Measurement Technology Conference, Baltimore, MD, USA, 1–4 May 2000; IEEE: Piscataway, NJ, USA, 2000; Volume 2, pp. 1019–1023. [Google Scholar] [CrossRef]
  27. Nickolay, M.; Fischer, L.; Martin, H. Shape factors for conductive heat flow in circular and quadratic cross-sections. Int. J. Heat Mass Transf. 1998, 41, 1437–1444. [Google Scholar] [CrossRef]
  28. Bai, F.X.; Yu, H.; Peng, Y.K.; Li, S.; Yin, L.; Huang, G.; Chen, X.J. Electronic topological transition as a route to improve thermoelectric performance in Bi0.5Sb1.5Te3. Adv. Sci. 2022, 9, 2105709. [Google Scholar] [CrossRef] [PubMed]
  29. Yang, K.; Li, X.; Sun, C.; Song, W.; Zhao, W.; Zhang, Q. Robust Room Temperature Thermoelectric Performance of Mg3(Sb, Bi)2-Based Alloys via Multivalent Mn Doping. Adv. Funct. Mater. 2024, 34, 2315886. [Google Scholar] [CrossRef]
  30. Tang, X.; Zhang, Q.; Chen, L.; Goto, T.; Hirai, T. Synthesis and thermoelectric properties of p-type- and n-type-filled skutterudite RyMxCo4−xSb12 (R: Ce, Ba, Y, M: Fe, Ni). J. Appl. Phys. 2005, 97, 093712. [Google Scholar] [CrossRef]
  31. Rogl, G.; Grytsiv, A.; Yubuta, K.; Puchegger, S.; Bauer, E.; Raju, C. In-doped multifilled n-type skutterudites with ZT = 1.8. Acta Mater. 2015, 95, 201–211. [Google Scholar] [CrossRef]
  32. Joshi, G.; Lee, H.; Lan, Y.; Wang, X.; Zhu, G.; Wang, D.; Ren, Z. Enhanced thermoelectric figure-of-merit in nanostructured p-type silicon germanium bulk alloys. Nano Lett. 2008, 8, 4670–4674. [Google Scholar] [CrossRef]
  33. Kallel, A.C.; Roux, G.; Martin, C.L. Thermoelectric and mechanical properties of a hot pressed nanostructured n-type Si80Ge20 alloy. Mater. Sci. Eng. A 2013, 564, 65–70. [Google Scholar] [CrossRef]
  34. Wen, L.; Yin, L.; Li, X.; Chen, S.; Zhang, T.; Cheng, J.; Ma, B.; Ren, Y.; Xiao, L.; Cao, F.; et al. Unified contact layers design for highly efficient segmented PbTe/Bi2Te3 thermoelectric devices. Energy Environ. Sci. 2025, 18, 9939–9948. [Google Scholar] [CrossRef]
  35. Wojciechowski, K.T.; Zybala, R.; Mania, R. High temperature CoSb3–Cu junctions. Microelectron. Reliab. 2011, 51, 1198–1202. [Google Scholar] [CrossRef]
  36. Yoo, C.Y.; Yeon, C.; Jin, Y.; Kim, Y.; Song, J.; Yoon, H.; Min, G. Determination of the thermoelectric properties of a skutterudite-based device at practical operating temperatures by impedance spectroscopy. Appl. Energy 2019, 251, 113341. [Google Scholar] [CrossRef]
  37. Zhang, Q.; Liao, J.; Tang, Y.; Gu, M.; Ming, C.; Qiu, P.; Chen, L. Realizing a thermoelectric conversion efficiency of 12% in bismuth telluride/skutterudite segmented modules through full-parameter optimization and energy-loss minimized integration. Energy Environ. Sci. 2017, 10, 956–963. [Google Scholar] [CrossRef]
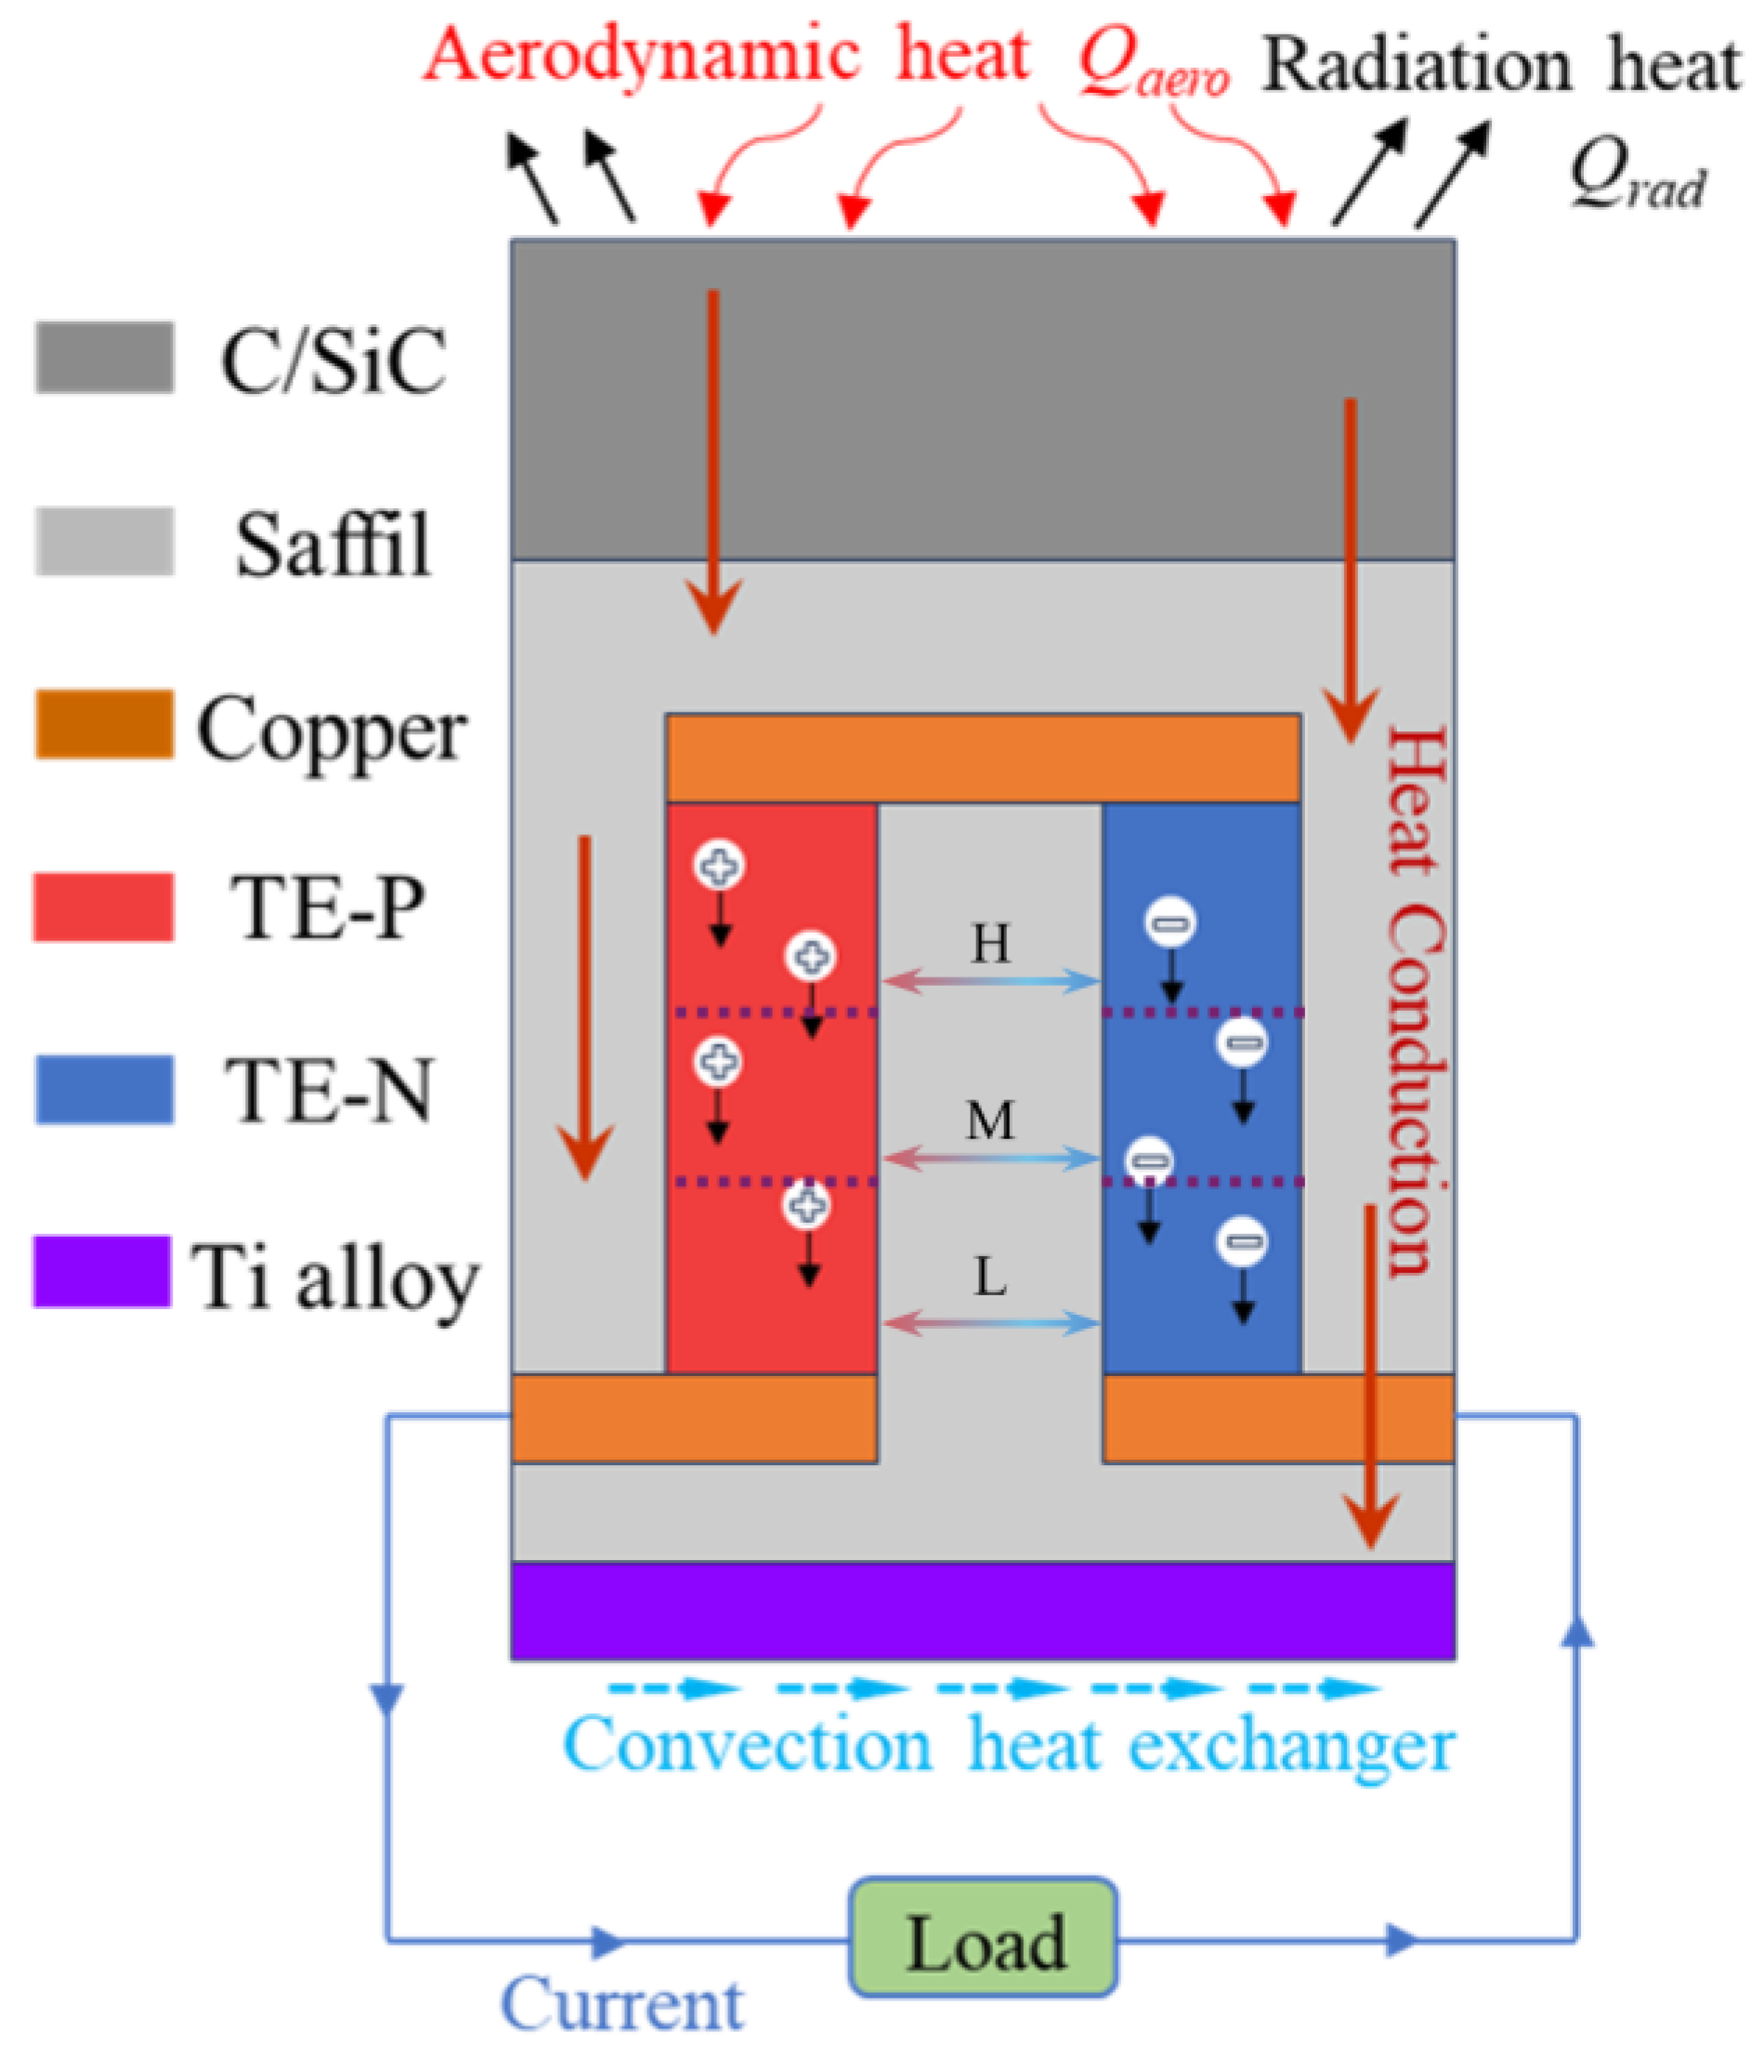
Figure 1. Cross-sectional schematic of the the TEG-TPS structure showing heat transfer pathways and thermoelectric conversion principle.
Applsci 15 12482 g001
Figure 2. Temperature-dependent thermoelectric properties of segmented p-type and n-type materials.
Applsci 15 12482 g002
Figure 3. Cross-sectional temperature distribution of the TEG-TPS structure at t = 400 s.
Applsci 15 12482 g003
Figure 4. Dimensionality reduction from three-dimensional physical structure to quasi-2D thermal network model: (a) Cross-section of TEG-TPS structure showing the discretized node distribution on TE and Saffil surfaces; (b) Quasi-2D thermal network representation with distributed nodes connected by thermal resistances; (c) Three-dimensional physical structure and the equivalent electrical circuit element.
Applsci 15 12482 g004
Figure 5. The transient aerodynamic heat flux profile.
Applsci 15 12482 g005
Figure 6. Comparison of thermal network predictions with finite-element simulations from Gong et al. [5].
Applsci 15 12482 g006
Figure 7. Flowchart of the automated multi-objective optimization platform.
Applsci 15 12482 g007
Figure 8. Multi-objective optimization results for segmented thermoelectric generator designs: (a) Pareto frontier visualization showing the trade-off between specific power (W/kg), maximum thermal expansion mismatch (μm) and normalized thermal margin (%); (b) Optimal segment length distributions for representative designs from each optimization strategy.
Applsci 15 12482 g008
Figure 9. Transient thermal and mechanical responses comparison for typical designs: (a) Top and bottom surface temperature history; (b) Thermal expansion mismatch history between p-/n-legs.
Applsci 15 12482 g009
Figure 10. Average temperature history of each segment for (a) p-leg and (b) n-leg in typical Designs (P, R, B).
Applsci 15 12482 g010
Figure 11. Interface temperature history for (a) p-leg and (b) n-leg in typical Designs (P, R, B).
Applsci 15 12482 g011
Figure 12. Electric potential history at each interface for (a) p-leg and (b) n-leg in typical Designs (P, R, B).
Applsci 15 12482 g012
Figure 13. TE conversion calculation: (a) Hot-end input heat flow comparison; (b) TE conversion efficiencyfor typical Designs (P, R, B).
Applsci 15 12482 g013
Table 1. Selected TE materials and relevant physical properties.
CategoriesP-TypeTlimitCTEN-TypeTlimitCTE
LTEBi0.5Sb1.5Te3 [28]<520 K1.65 × 10−5Mg3.17Mn0.03Bi1.49
Sb0.5Te0.01 [29]
<740 K2.23 × 10−5
MTEBa0.30Ni0.05Co3.95Sb12 [30]<850 K9.5 × 10−6(Sr0.080Ba0.043Yb0.054
In0.008)Co4Sb12 [31]
<850 K9.5 × 10−6
HTESi80Ge20 [32]<1200 K4.2 × 10−6Si80Ge20 [33]<1200 K4.2 × 10−6
Table 2. Thermal contact resistance (TCR) and electrical contact resistance (ECR) at interfaces.
InterfaceTCR (K·m2/W)ECR (Ω·m2)
HTE-Electrode2 × 10−55 × 10−9
HTE-MTE3 × 10−52 × 10−9
MTE-LTE4 × 10−51 × 10−9
LTE-Electrode1 × 10−55 × 10−10
Table 3. Comparison of the objective performance for the three representative designs.
Designf1 (W/kg)f2 (μm)f3 (%)
P (Max specific power)28.112.50.8
R (Reliability-prioritized)22.711.38.9
B (Balanced)24.53.65.1
Disclaimer/Publisher’s Note: The statements, opinions and data contained in all publications are solely those of the individual author(s) and contributor(s) and not of MDPI and/or the editor(s). MDPI and/or the editor(s) disclaim responsibility for any injury to people or property resulting from any ideas, methods, instructions or products referred to in the content.