Article

Study on the Stress Response and Deformation Mechanism of Pipe Jacking Segments Under the Coupling Effect of Defects and Deflection

1
School of Civil and Environmental Engineering, Changsha University of Science & Technology, Changsha 410114, China
2
National Engineering Laboratory of Highway Maintenance Technology, Changsha University of Science & Technology, Changsha 410114, China
*
Author to whom correspondence should be addressed.
Appl. Sci. 2025, 15(23), 12465; https://doi.org/10.3390/app152312465
Submission received: 23 October 2025 / Revised: 16 November 2025 / Accepted: 18 November 2025 / Published: 24 November 2025

Abstract

Defects in pipes adversely affect both the jacking construction process and long-term operational safety, yet their specific impacts on mechanical properties remain unclear. This study investigates pipe jacking segments under deflection, using the Changsha Meixi Lake project as a case study. Similar model tests combined with digital image correlation were employed to examine the evolution of stress and deformation under various deflection angles and defect conditions. The reliability of the laboratory tests was verified through theoretical stress calculations under the non-deflection condition. The credibility of the laboratory test results was further enhanced by employing a numerical model and normalized parameters. Key findings reveal that stress distribution characteristics are jointly determined by the deflection mode and load. Co-directional deflection exhibits a more significant stress concentration effect; under identical load and angle conditions, it results in higher stress levels due to a superposition effect, whereas diagonal deflection shows a weakening effect. Joint deformation progresses through three distinct stages. The linear growth stage exhibits an initial linear strain–load relationship under stable deflection (load < 2 kN). The accelerated deformation stage is characterized by nonlinear strain growth with a slowing deformation rate (2–4 kN). The deformation deceleration stage finally shows a slow linear strain increment (load > 4 kN). Increasing load and deflection angle significantly amplify axial deformation, particularly revealing a “thick-in-the-middle, thin-at-the-sides” compression characteristic in the 45° vault zones. Furthermore, segment defects markedly exacerbate stress non-uniformity. Defect angles ≥ 60° substantially increase the frequency and amplitude of compressive stress in the vault, accelerate the decay of tensile stress at the bottom, and critically reduce structural stability. These new findings provide significant insights for deflection control and structural safety assessment in pipe jacking engineering. The experimental framework provides fundamental insights into construction operations in upper-soft and lower-hard strata tunneling.

1. Introduction

Pipe jacking technology is widely used in urban underground spaces [1,2,3] due to its environmental friendliness and minimal ground disturbance [4,5,6]. These projects frequently traverse complex geotechnical conditions, such as upper-soft and lower-hard strata. Due to the inconsistent stiffness of the strata, phenomena such as pipe-line deflection and axis deviation frequently occur during construction in such compo-site strata [7,8]. However, deflection from the design axis will lead to stress redistribution in the pipe segments and form stress concentration at eccentric compression locations [9,10,11]. This may ultimately lead to problems such as segment cracking, spalling, and leakage [12,13,14,15]. As an important component of jacking pipes, the structural characteristics of pipe joints affect the safety and long-term stability during the construction and operation of pipe jacking projects. Therefore, it is of great significance to deeply investigate the influence of deflection and defects on segment deformation and displacement and to grasp the axial mechanical behavior of pipe segments during the pipe jacking construction process.
Existing methods for controlling deflection and defects in pipe jacking construction include high-quality segment manufacturing [16,17], developing standardized transportation schemes [18,19], on-site non-destructive testing [20,21], and precise guidance systems [22,23]. These methods further improve construction quality and protect the segment structure. However, challenges arising from complex geological conditions, working environments, and operational factors still prevent the complete avoidance of segment damage. Understanding and exploring the mechanism of segment damage and defect problems under such complex conditions can provide a theoretical basis and reference for risk assessment and control.
In recent years, extensive research has been conducted to understand the mechanical behavior of pipe jacking segments and joints. The structural performance of segments, particularly under complex loading conditions, has been a focal point [24,25,26,27,28,29]. Studies have combined field experiments with numerical simulations to analyze the axial bearing capacity of large-section pipes [30] and the mechanical performance of stress loss in prestressed pipe jacking [31]. Other studies have focused on the performance of repaired defective pipes [32,33] and the mechanical response of HDPE double-wall corrugated pipes under coupled loads [34,35].
Regarding joint behavior, which is critical to segmental lining integrity, research has progressed through centrifuge model tests [36], full-scale experiments [37], and advanced numerical modeling [38,39]. These studies reveal the response mechanisms of joints under ground movements, faulting, mining, and differential settlement conditions [40,41,42,43,44]. Concurrently, significant efforts have been dedicated to predicting jacking forces, leading to the development of analytical models that consider soil arching and pipe-slurry-soil interaction [45], new methods for estimating jacking load and frictional resistance in the vertical direction have been proposed [46], and probabilistic approaches [47,48]. Model testing remains an indispensable tool for validating these theories and exploring complex soil–structure interaction mechanisms, as demonstrated in studies on excavation face stability [49], ground deformation [50,51], and the longitudinal mechanical properties of tunnels [52]. Complementing these methods, advanced non-contact monitoring techniques like Digital Image Correlation (DIC) have been successfully applied in geotechnical testing to accurately capture full-field displacement and progressive failure [53,54,55], showcasing their potential for detailed experimental mechanics analysis. Regarding pipeline deflection and defect issues, recent research has focused on the influence of the three-edge bearing method on the structural failure of cylinder segments [56], the effect of intersegment deflection on axial mechanical response [57], and pipeline cracking in field pipe jacking projects [58]. Although research on axial stress in pipe jacking has gained strong momentum, current methodologies still predominantly rely on numerical simulation, with limited experimental validation through physical modeling, and the typical deflection process and deformation mechanisms of segments remain unclear. On the other hand, existing research on defects primarily focuses on the repair of small drainage and water supply pipelines [59,60,61], analyzing their post-repair structural circumferential bearing capacity. However, the longitudinal characteristic stress and synergistic effects of pipe joints under defects and their combinations during the construction period have rarely been explored [62,63,64,65]. This gap highlights the necessity for comprehensive research on stress response and deformation mechanisms under combined conditions of defects and deflection.
This paper investigates the deformation stress mechanisms under complex bending modes and defect states in pipe jacking models. This paper establishes similar segment models with 4 different deflection angles and 5 defect states. Using digital image correlation technology, it systematically analyzes the stress and evolution characteristics of segments under deflection and compares the distribution patterns of segment stress nephograms under different deflection angles. One of the key observations in this paper is that the co-directional deflection angle has a more significant effect on increasing pipe segment stress. Another finding is that the pipe segment deflection process includes three stages: linear growth, rapid growth, and slow growth. Additionally, the influence of defects on the internal stress of the pipe segment structure is remarkable, particularly when the defect range develops to 20.8% to 25% area.
The paper is organized as follows. In Section 2, We presents the project overview. In Section 3, We describes the test setup and procedure. In Section 4, We elaborates on the test results and discussion. In Section 5, We provides the summary and conclusions. The research results help to understand the occurrence and response mechanism of pipe jacking deflection, thereby providing a reference for pipe jacking construction and attitude control.

2. Project Overview

The construction area of the Changsha Meixi Lake pipe jacking project is located on YingRi Road, Changsha City, in northern Hunan Province, China, as shown in Figure 1. The monitored section of the pipe jacking has a drive length of 78 m. The burial depth of the pipe jacking ranges from 6.49 to 6.79 m. A single segment is 3.0 m long.
The inner diameter of the segment is 1800 mm. The outer diameter of the segment is 2200 mm. The wall thickness of the segment is 200 mm. The geological strata in the project area are complex and interwoven.
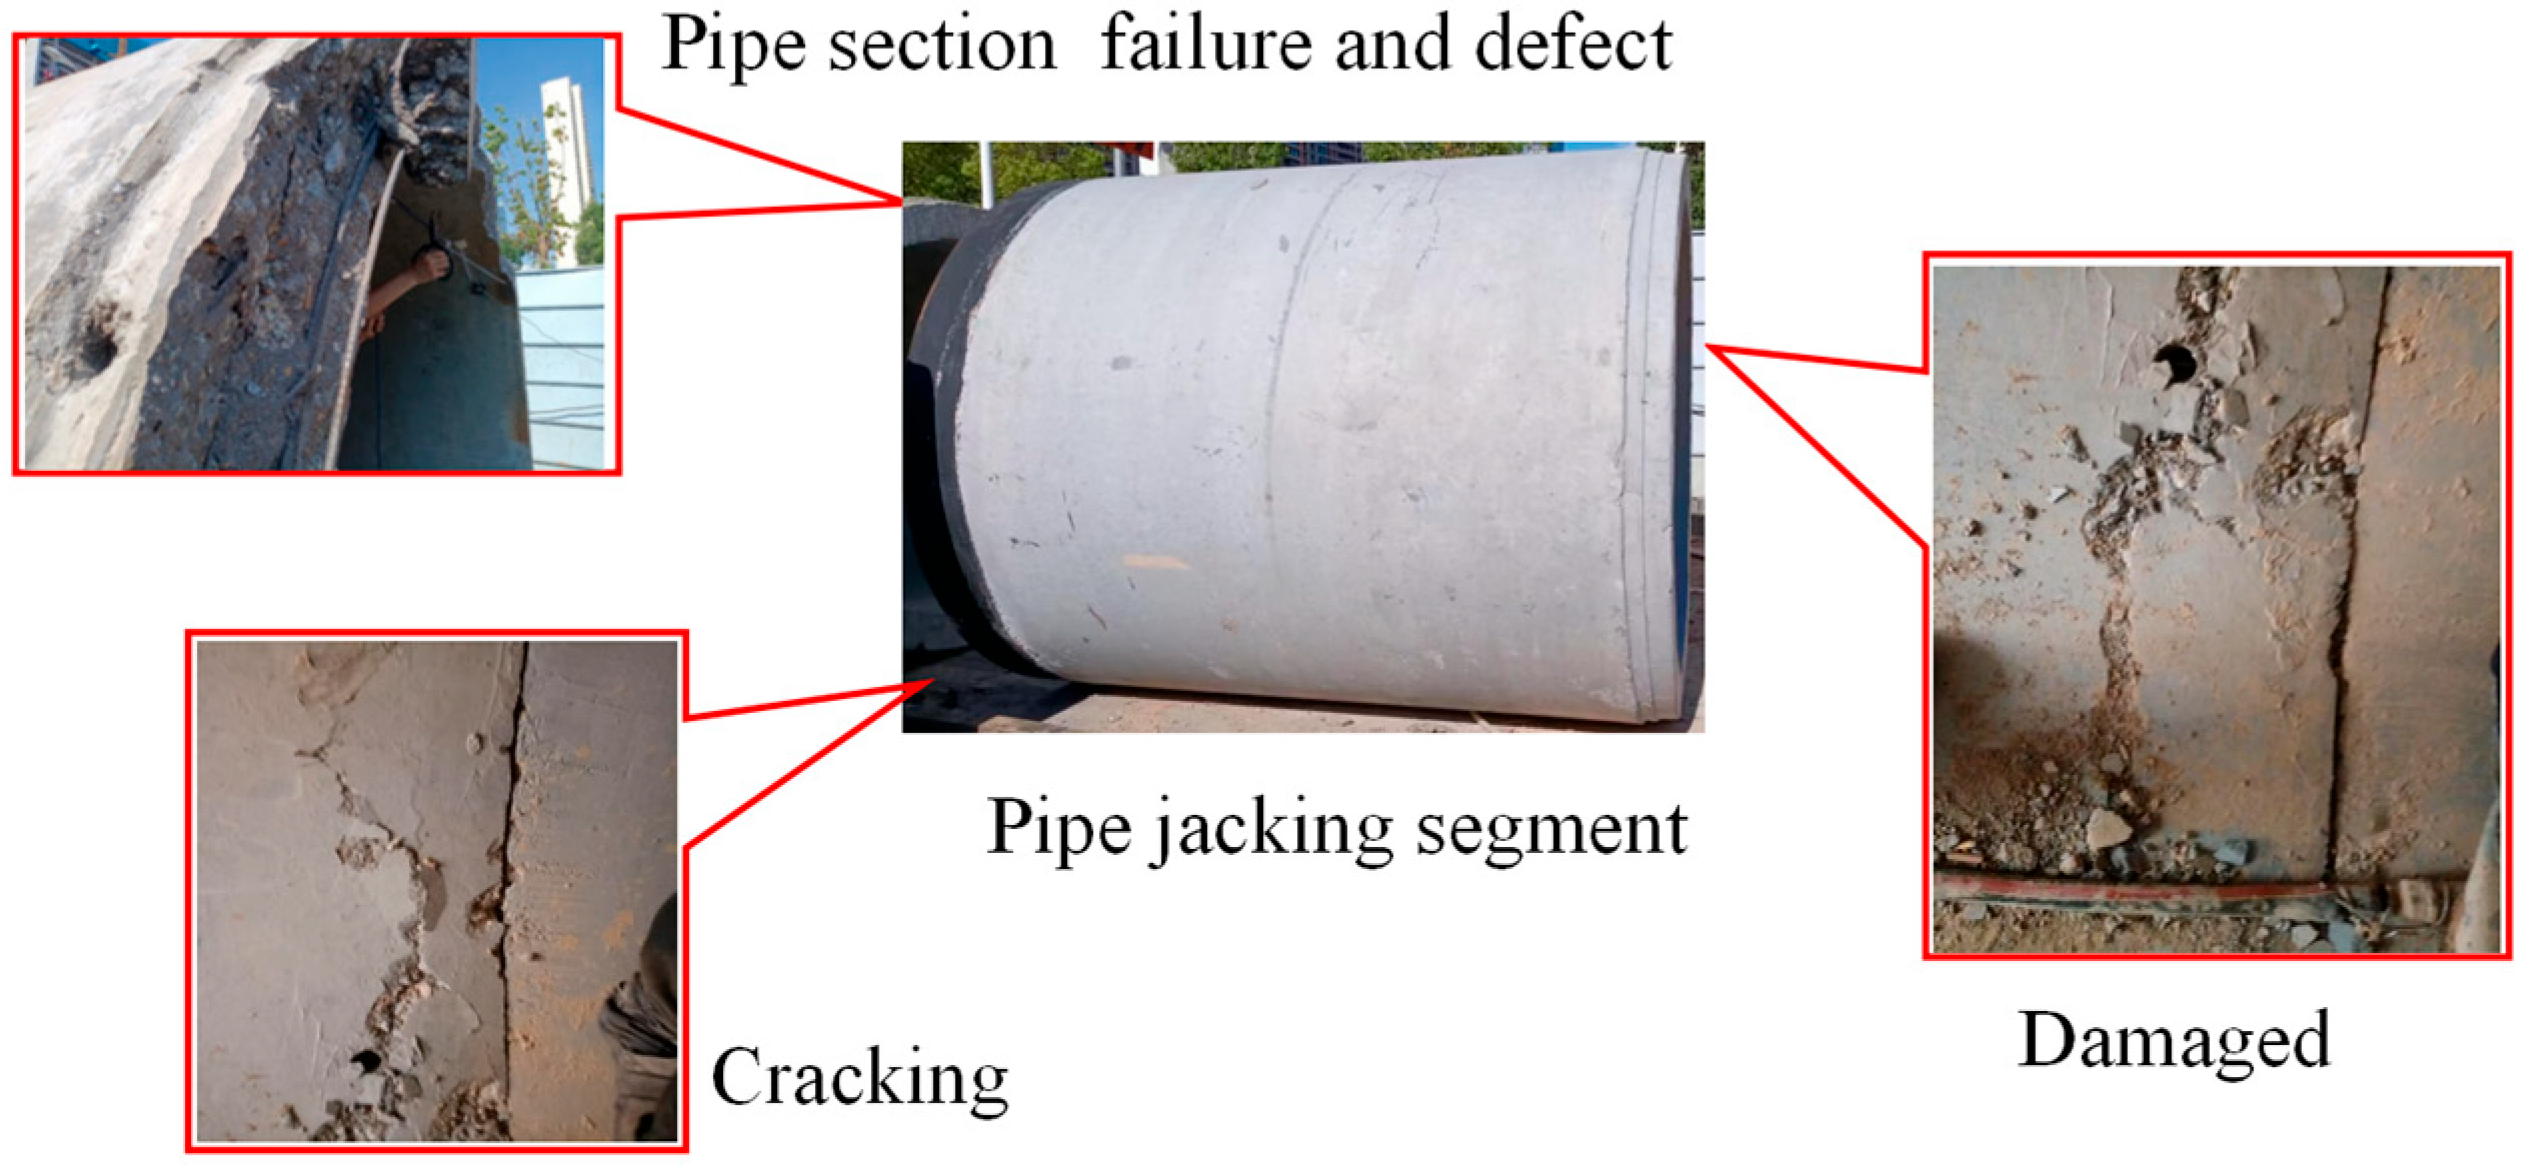
The segments were manufactured using C25 ordinary Portland cement, conforming to the Chinese standard GB/T 11836-2009 [66], which specifies the ultimate strength and testing criteria for such pipes. Although the axial compressive strength of the segments is high, cracking, defects and damage occurred on the outer wall of the segments during the initial jacking stage. Shortly after the pipe jacking entered the composite stratum, damage problems appeared on the inner wall of the segments, as shown in Figure 2. Preliminary field investigation concluded that the morphological deflection of the pipeline during loading led to an increase in local stress within the segments. Tensile or compressive stresses on the inner and outer walls of the pipeline exceeded the design stress values. This ultimately led to spalling of the side walls. Therefore, research on the stress response characteristics of segments under conditions of pipe jacking deflection and defects was carried out.

3. Test System and Scheme

During on-site construction, it was observed that deflection occurred between pipe segments, resulting in relative displacement. Therefore, a pipe segment deflection test was designed. To understand the deformation patterns during the pipe jacking process, visualization and DIC methods were introduced to investigate the deformation characteristics. Given that defects in on-site pipe segments impact both the pipe jacking construction and the long-term safety and stability of subsequent segments during operation, a structural test for pipe segments with defect damage was designed. Due to the complexity of actual engineering, the laboratory tests were partially simplified. For example, (1) the deflection angle between pipe segments in engineering is difficult to quantify, so displacement was used in the laboratory tests to simulate the deflection angle. (2) Since pipe segment defects vary depending on their location during construction, different central angle ranges were used in the laboratory tests to simulate the occurrence of defects for quantifying such conditions. (3) On-site, due to the large size of pipe segments, jacking force is applied by hydraulic jacks. In the laboratory tests, because the model is small and the designed load levels are low (1–6 kN), and the loading range of hydraulic jacks is too large to accurately control load level changes, a dynamometer was used to apply loads in graded uniform increments. (4) Furthermore, to enhance visualization and obtain comprehensive patterns of relative displacement in pipe segments, acrylic pipes were used for the model segments. The focus was on analyzing the deformation behavior of pipe segments under deflection and defect factors within the elastic stage.

3.1. Comprehensive Experimental Design for the Indoor Pipe Jacking Model Test

This test aims to systematically study the influence of deflection and defects on the structural response of pipe jacking. Based on practical on-site issues, three key influencing factors were selected as independent variables for the experimental design: pipe joint deflection angle A, deflection combination pattern B, and pipe joint defect C (measured by the central angle). By constructing a full factorial experiment of A(6) × B(2) × C(5), it ensures a comprehensive capture of the influence patterns of each factor and their interactions on the characteristic stress of the pipe jacking.
(1) Factor A: Pipe joint deflection angle. This factor is a key geometric parameter simulating installation misalignment and axis deviation of pipe joints. Eight levels were set: 0.5°, 1.0°, 1.5°, 2.0°, 2.5°, 3.0°. The level range covers typical on-site deflection scenarios from small to large. The level interval of 0.5° allows for indicating the degree of deflection and precisely establishing the stress-deflection angle response relationship, avoiding the omission of key variation trends due to excessively large intervals.
(2) Factor B: Deflection combination pattern. This factor simulates the spatial distribution form of deflection, which has a decisive influence on the overall load-bearing mode of the structure. Two levels were set: “unidirectional deflection” and “diagonal deflection”. These two patterns represent two extreme load-bearing scenarios—“unidirectional deflection” leads to overall bending, while “diagonal deflection” leads to torsional deformation. Considering these two deflection patterns can reveal the mechanical mechanisms under different deflection forms.
(3) Factor C: Pipe joint defect (measured by the central angle). This factor simulates the cross-sectional weakening of pipe joints caused by manufacturing or construction damage. Five levels were set: 30°, 45°, 60°, 75°, and 90°. The levels for defect size, arranged from small to large, enable a systematic study of the entire process from local influence to significant weakening of sectional stiffness. This sequence is sufficient to depict the variation curve of characteristic stress with increasing defect size.

3.2. Test Setup

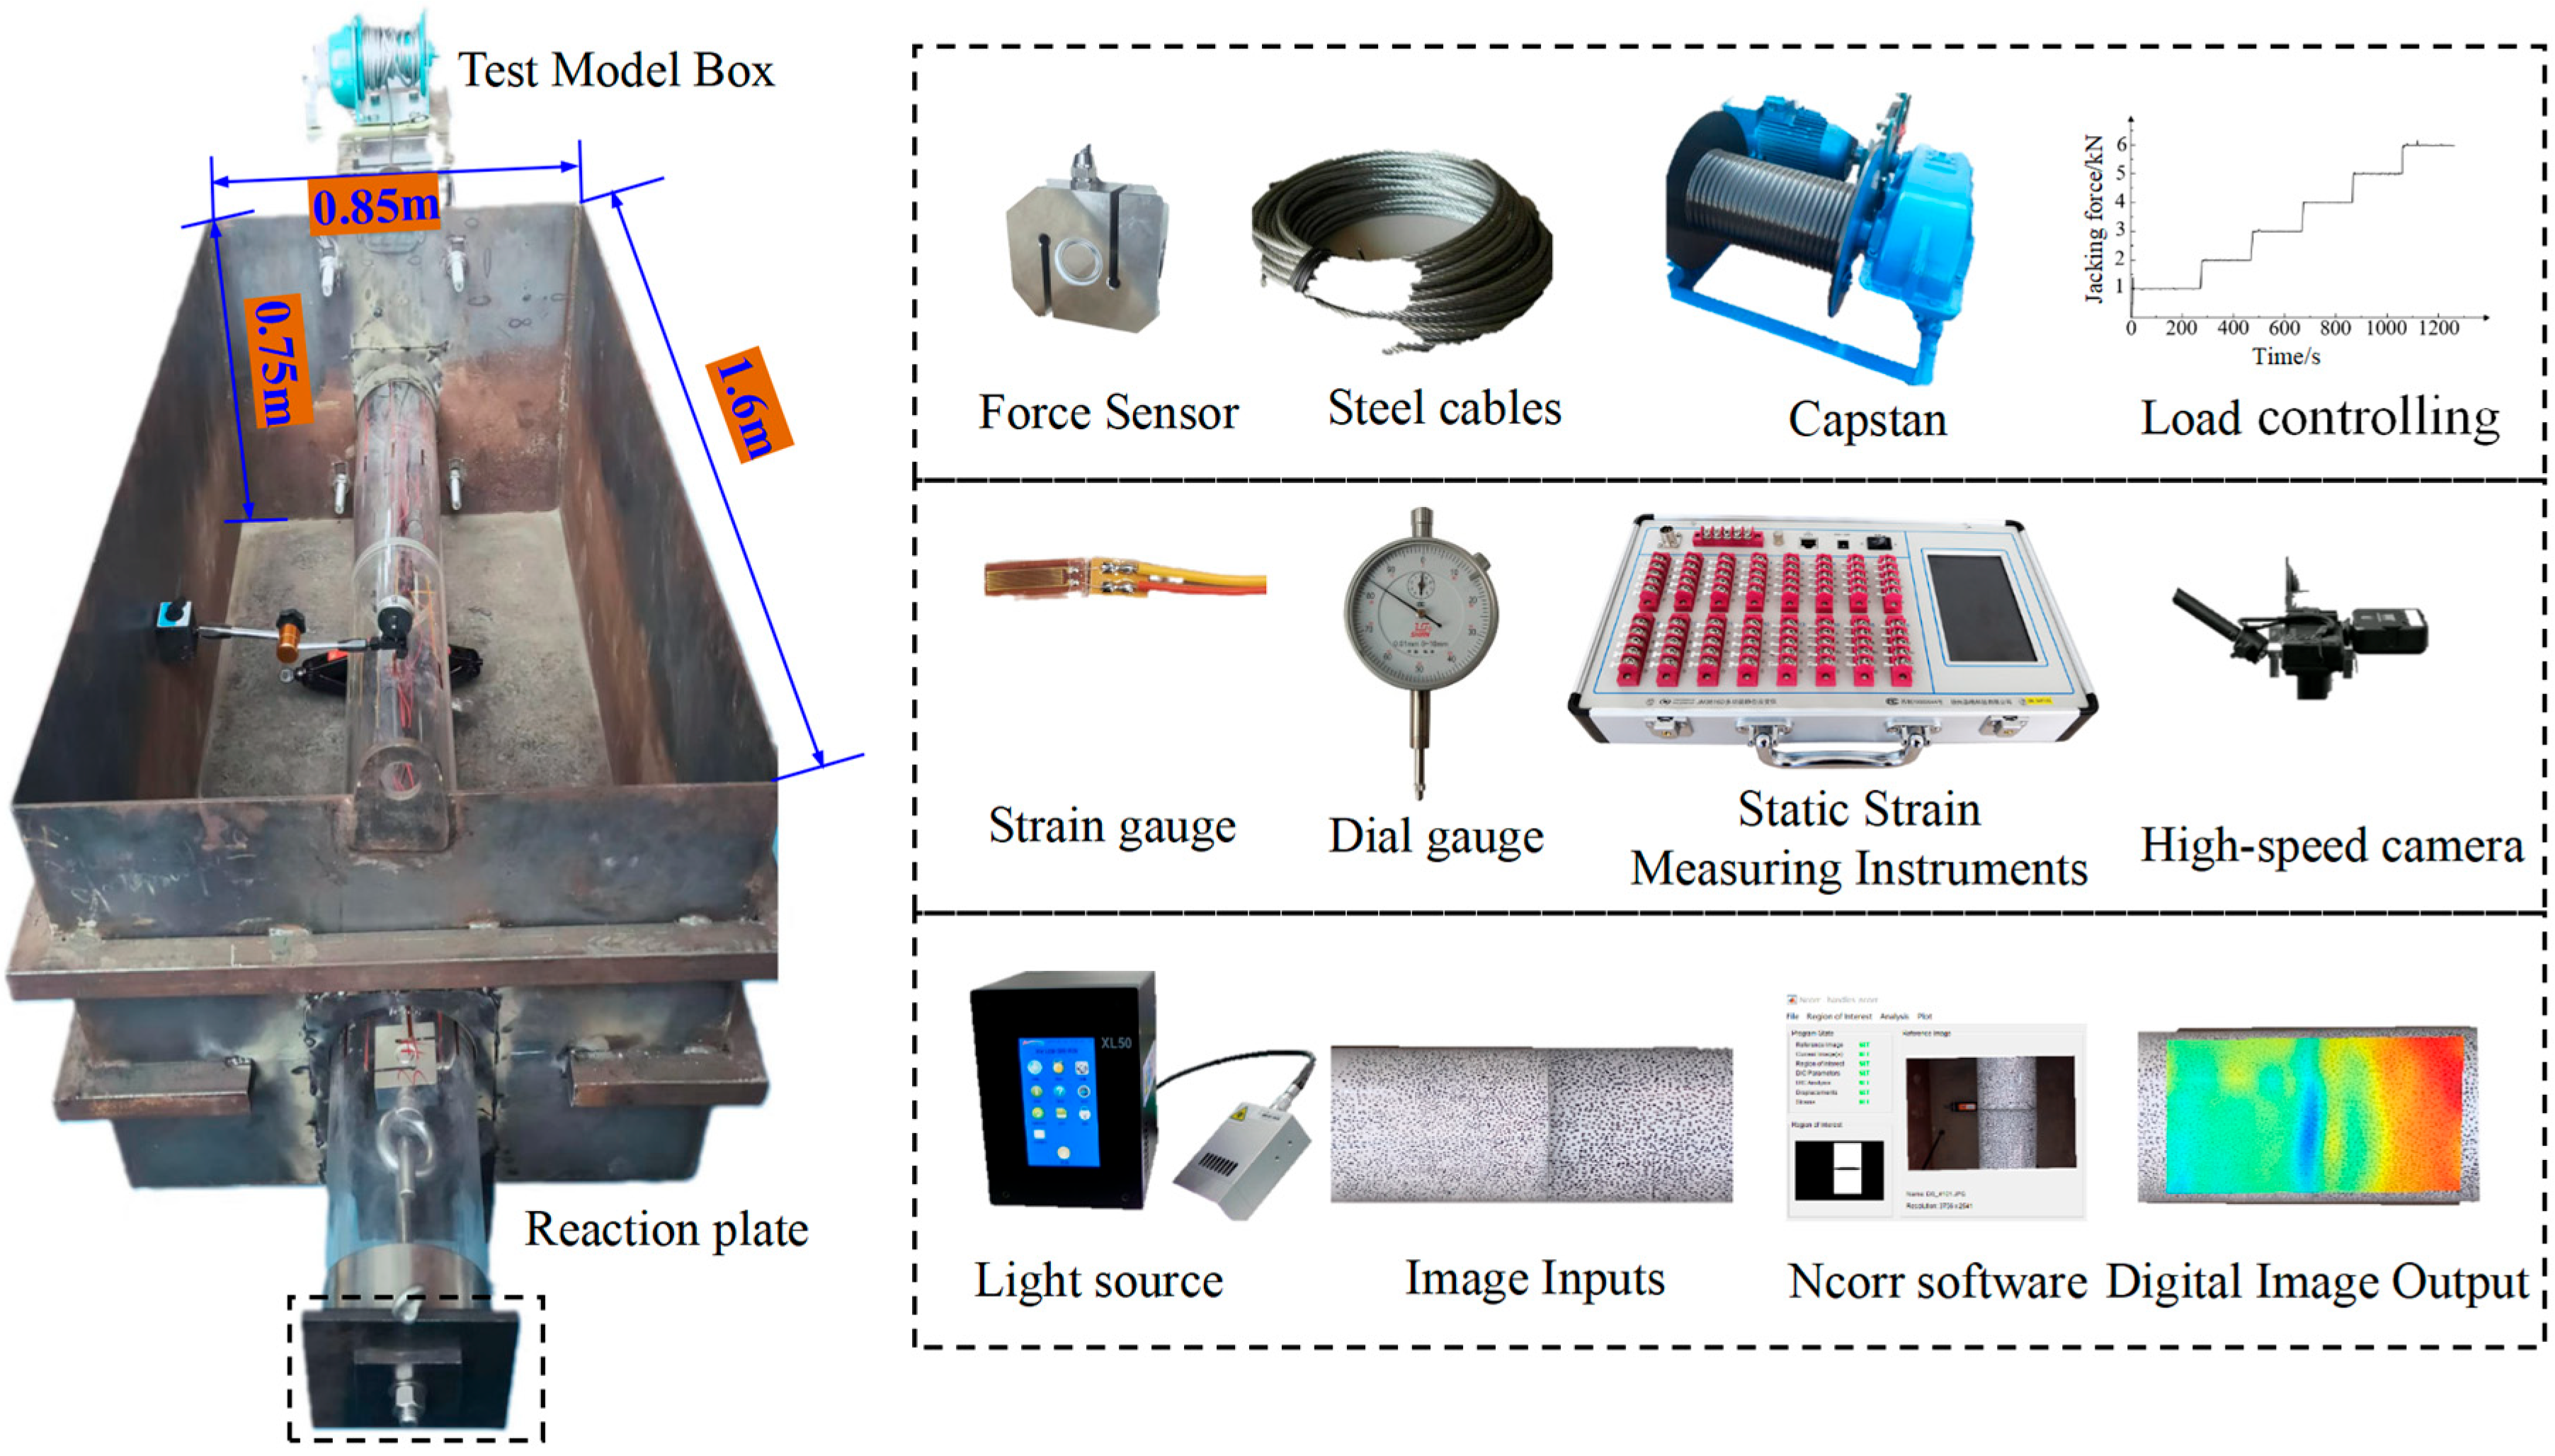
Based on the actual field project, an indoor test system was designed. We considered the theory of similar models and designed indoor model experiments. Efforts were made to ensure that the parameters maintain similar characteristics to the actual engineering conditions. The indoor model test system for pipe jacking is shown in Figure 3, which includes a model box, a loading system, a measurement system, and a data processing system. The model box dimensions are: length × width × height (1.6 m × 0.85 m × 0.75 m). The top is open, and the sides have reserved holes for applying load to the segments. The loading system includes loading plates, expansion cables, and a self-developed load control machine. The measurement system includes strain gauges, dial indicators, a static strain instrument (DH3818Y, Jiangsu Donghua Testing Technology Co., Ltd., Jingjiang City, China), speckle standard points, high-speed cameras, etc. The data processing system includes a DHDAS control and analysis software, an Ncorr system V1.2.2, etc. The load was set to 6 levels, with each level increasing by 1 kN. Each load level was maintained steadily for 3 min. The load was applied to the segments evenly and in steps. The strain gauge system has an accuracy of ±0.5% ± 3 µε. The DIC system’s strain measurement uncertainty, determined from the noise floor in unloaded reference images, is approximately 50 µε.
To clarify the influence of the relative contact relationship between segments and the loading conditions on the axial mechanical behavior of the pipe jacking, this paper designed indoor model tests related to the pipe jacking deflection angle. The main physical quantities in the model tests include geometric dimensions l, unit weight γ, elastic modulus E, Poisson’s ratio μ, deflection angle φ, stress σ, and strain ε. The gravitational acceleration is the same for the model tests and the prototype tests. Using dimensional analysis and the second theorem of similarity theory, the relationships between the similarity ratios of each physical parameter were finally obtained as follows: geometric similarity ratio Cl = 10; unit weight similarity ratio Cγ = 1; similarity ratios for Poisson’s ratio, strain, and deflection angle Cμ = Cε = Cφ = 1; similarity ratios for elastic modulus and stress CE = Cσ = 10. Acrylic tubes were selected as the model material for the tests. The elastic modulus of the acrylic tube segments, measured through indoor compression tests, is E = 2.76 GPa.

3.3. Deflection Test Scheme

3.3.1. Segment Deflection Simulation Test

The segment deflection angle is simulated through the relative displacement between segments. The distance between the jack and the socket end of the segment is l. The relative deflection angle of the segments is φ, the misalignment height of the jack is ΔH. The relationship between these three parameters is shown in Formula (1) and Figure 4.
ΔH = l sin(φ/2)
In Formula (1): l is the distance from the segment socket end to the jack; ΔH is the jack thrust distance; φ is the relative deflection angle of the segments.
Figure 4. Setting the deflection angle.
Applsci 15 12465 g004

3.3.2. Monitoring Point Layout

Five strain monitoring sections were arranged along the model axis, at the middle and ends of the segments, as shown in Figure 5. The deformation monitoring point for Joint 1–2 is named DS1. The deformation monitoring point for Joint 2–3 is named DS2. Inside the segment joint socket, two monitoring sections were arranged along the circumference at 45° intervals. Each monitoring section has a total of 8 measurement points. They are named clockwise from the vault as C1 to C8 and C9 to C16. Three monitoring sections were arranged along the circumference at the middle of the segment at 45° intervals. Each section has 8 measurement points. They are named clockwise from the vault as G1 to G8, G9 to G16, and G17 to G24.
Strain gauges inside the test segments were arranged along the direction of the applied load. They were connected to a static strain instrument. Axial strain during the jacking process was collected in real-time. Segment stress was obtained through conversion. To better reflect the segment deflection mode, three test segments were used in the model test to simulate pipe jacking deflection. Two types of deflection modes were set in the test: diagonal deflection and co-directional deflection. The load was applied to the socket end face of Segment #3. The test segments were installed sequentially by spigot-and-socket joint. Deflection jacks were installed at the bottom or right side of Segment #2 and Segment #3. This simulated the pipe jacking deflection phenomenon under complex contact conditions. The applied deflection angles and load levels are shown in Table 1.

3.4. Deformation Test Scheme

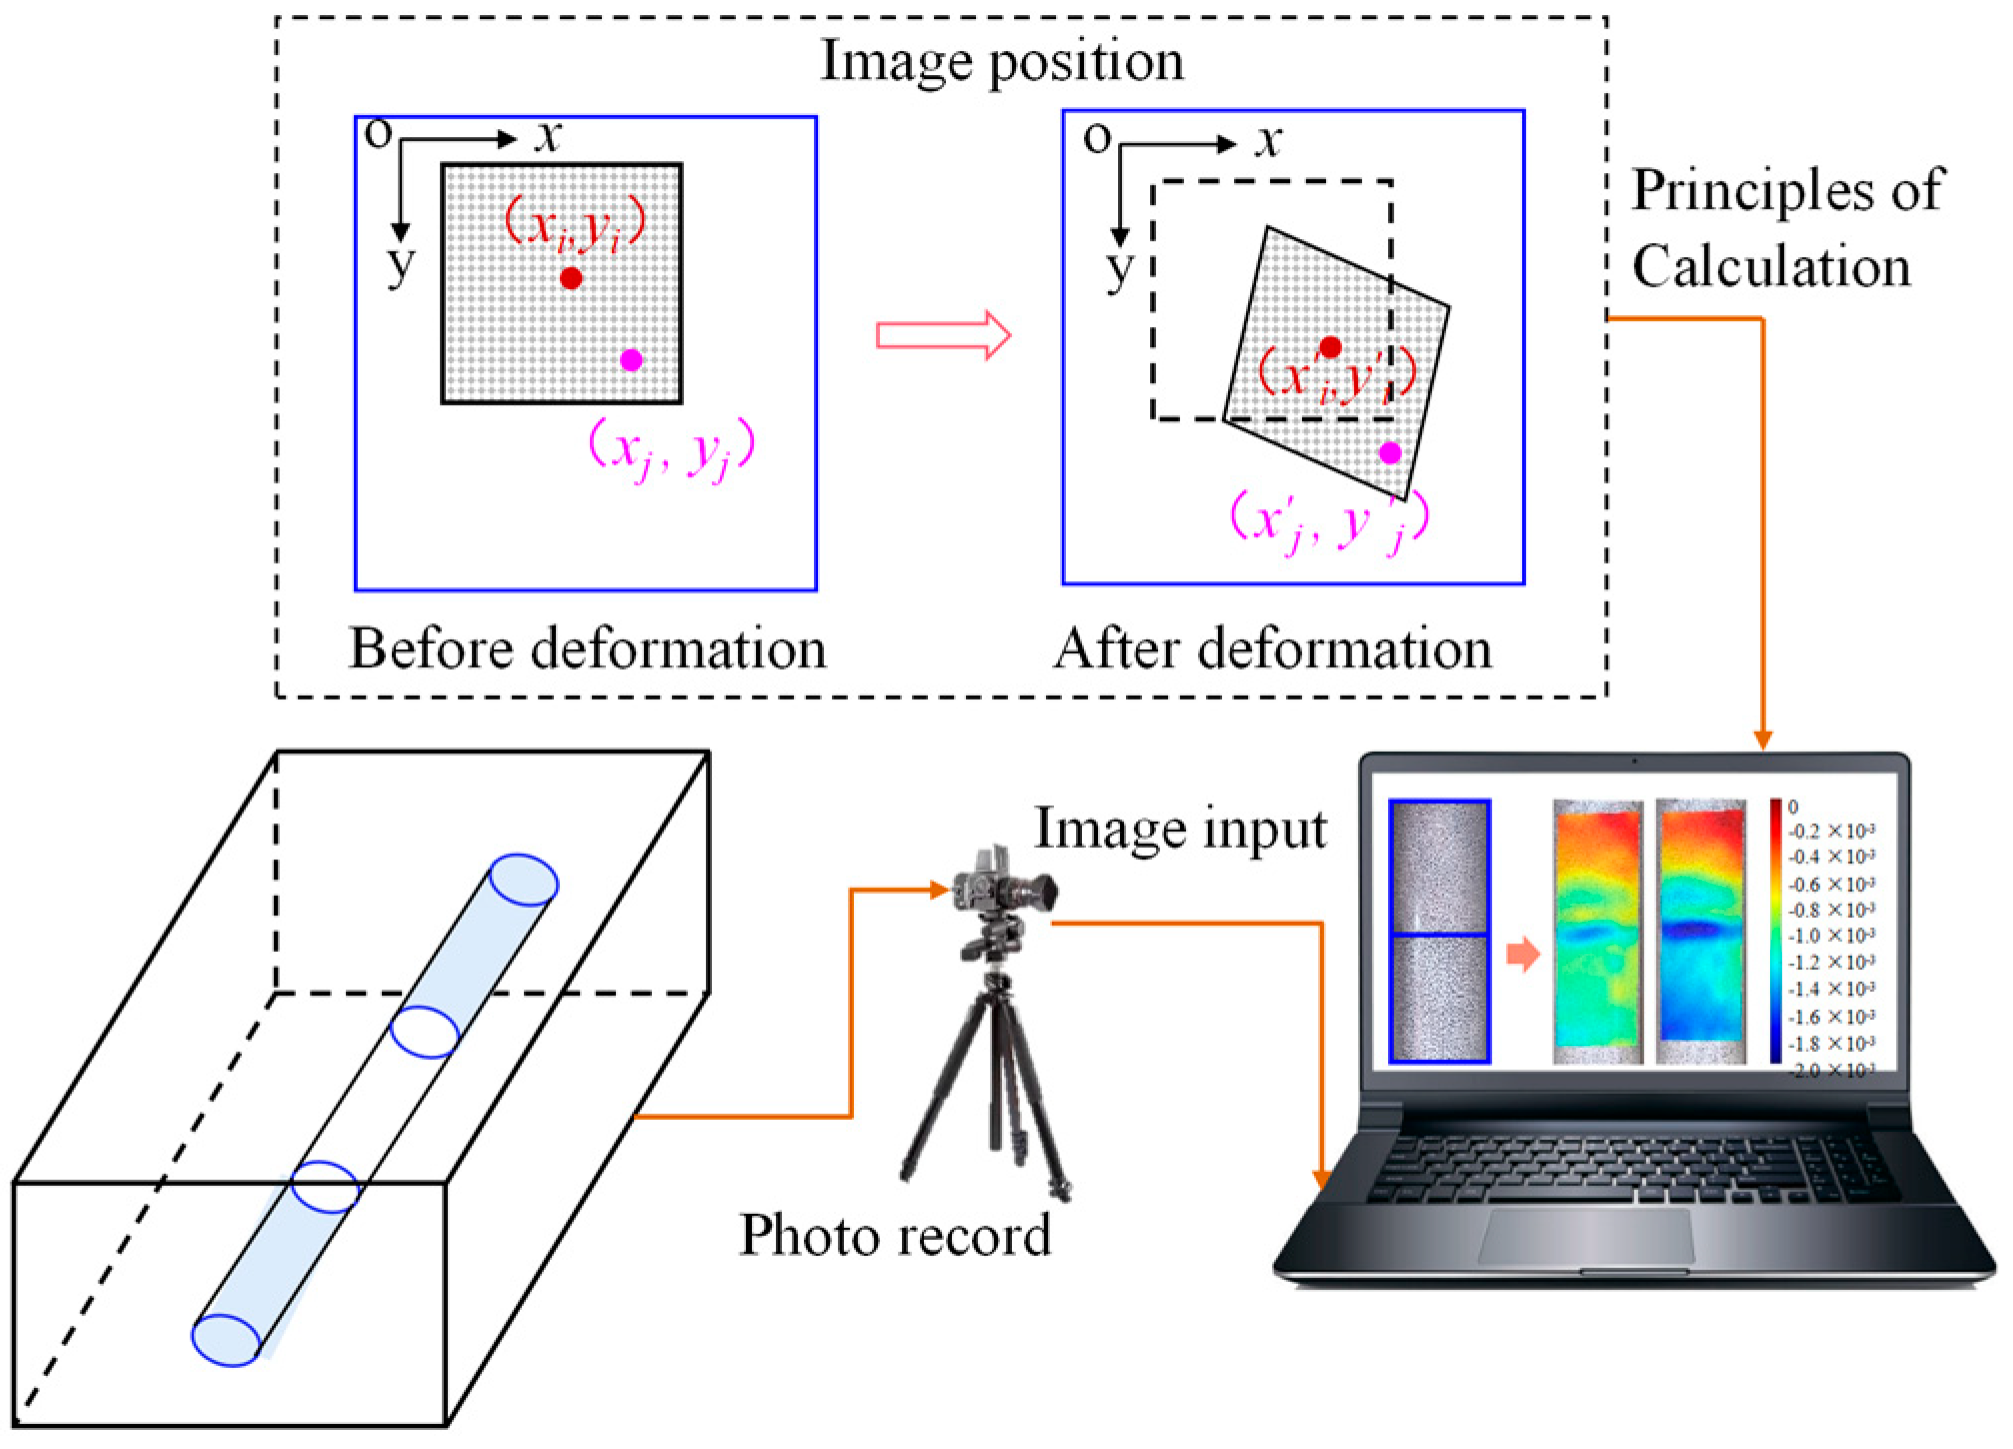
To study the deformation characteristics of pipe jacking joints, DIC and virtual extensometer technology were used to analyze the surface strain field during the deformation process of pipe jacking joints. This allows for a quantitative calculation and analysis of the non-uniform strain response characteristics of the segment joints. DIC technology was used to analyze the real-time strain field of the pipe jacking segments. The basic principle is as follows: a rectangular reference subset of size (3756 × 2541) is selected as the center point. The calculation formula is as shown in Equations (2) and (3). The center point of the target subset is obtained by searching for the maximum value of the correlation function. By comparing the positional changes in the image subsets before and after deformation, the displacement and strain information of each point is obtained. The calculation program used in this paper is Ncorr [67,68]. A virtual extensometer [69] is an optical measurement analysis method based on DIC technology. It calculates the deformation amount by arranging symmetrical measurement points on both sides of a crack, as shown in Figure 6.
x j = x j + Δ x + u y j = y j + Δ y + v
x j = x j + Δ x + u + u x Δ x + u y Δ y y j = y j + Δ y + v + v x Δ x + v y Δ y
In the formula, x j , y j are the coordinates before deformation, and x j , y j are the coordinates of any point in the subset after deformation. Δ x , Δ y represent the coordinate differences of any point in the x and y directions before and after deformation. u , v are the displacement components in the shape parameter vector. u / x , u / y , v / x and v / y are the displacement gradients of u and v in the x and y directions, respectively.
Figure 6. Schematic diagram of DIC deformation.
Applsci 15 12465 g006
After the segment is subjected to force, the deformation characteristics of the segment joints can directly reflect the force-deformation behavior during the pipe jacking construction process. Therefore, a quarter of the segment length was selected to conduct the segment joint deformation test. First, a white primer was evenly sprayed on the outer wall of the segment. Then, a marker pen was used to arrange speckles on the segment. Next, the segments were installed sequentially, and the image capture device was set up for photography. Finally, DIC digital image technology was used to process the test images.

3.5. Segment Defect Test Scheme

To investigate the influence of pipeline damage on the longitudinal mechanical behavior of the structure, a segment defect test was designed and conducted, as shown in Figure 7. First, segments were cut to create defects. The defect length was 5 cm. The defect width increased in increments of 15°, as shown in Table 2. For single defects, the defect angles were 30°, 45°, 60°, 75°, and 90°. For double defect combinations, the defect angle was set to 90°, combined with 30°, 45°, 60°, 75°, and 90°. Then, monitoring points were arranged and the segments were connected. Finally, graded loading was applied to the defective segments, and stress testing was conducted to obtain the stress variations under different working conditions.

4. Analysis of Test Results

4.1. Characteristics of Segment Stress and Deformation Fields

4.1.1. Co-Directional Deflection and Axial Stress Response

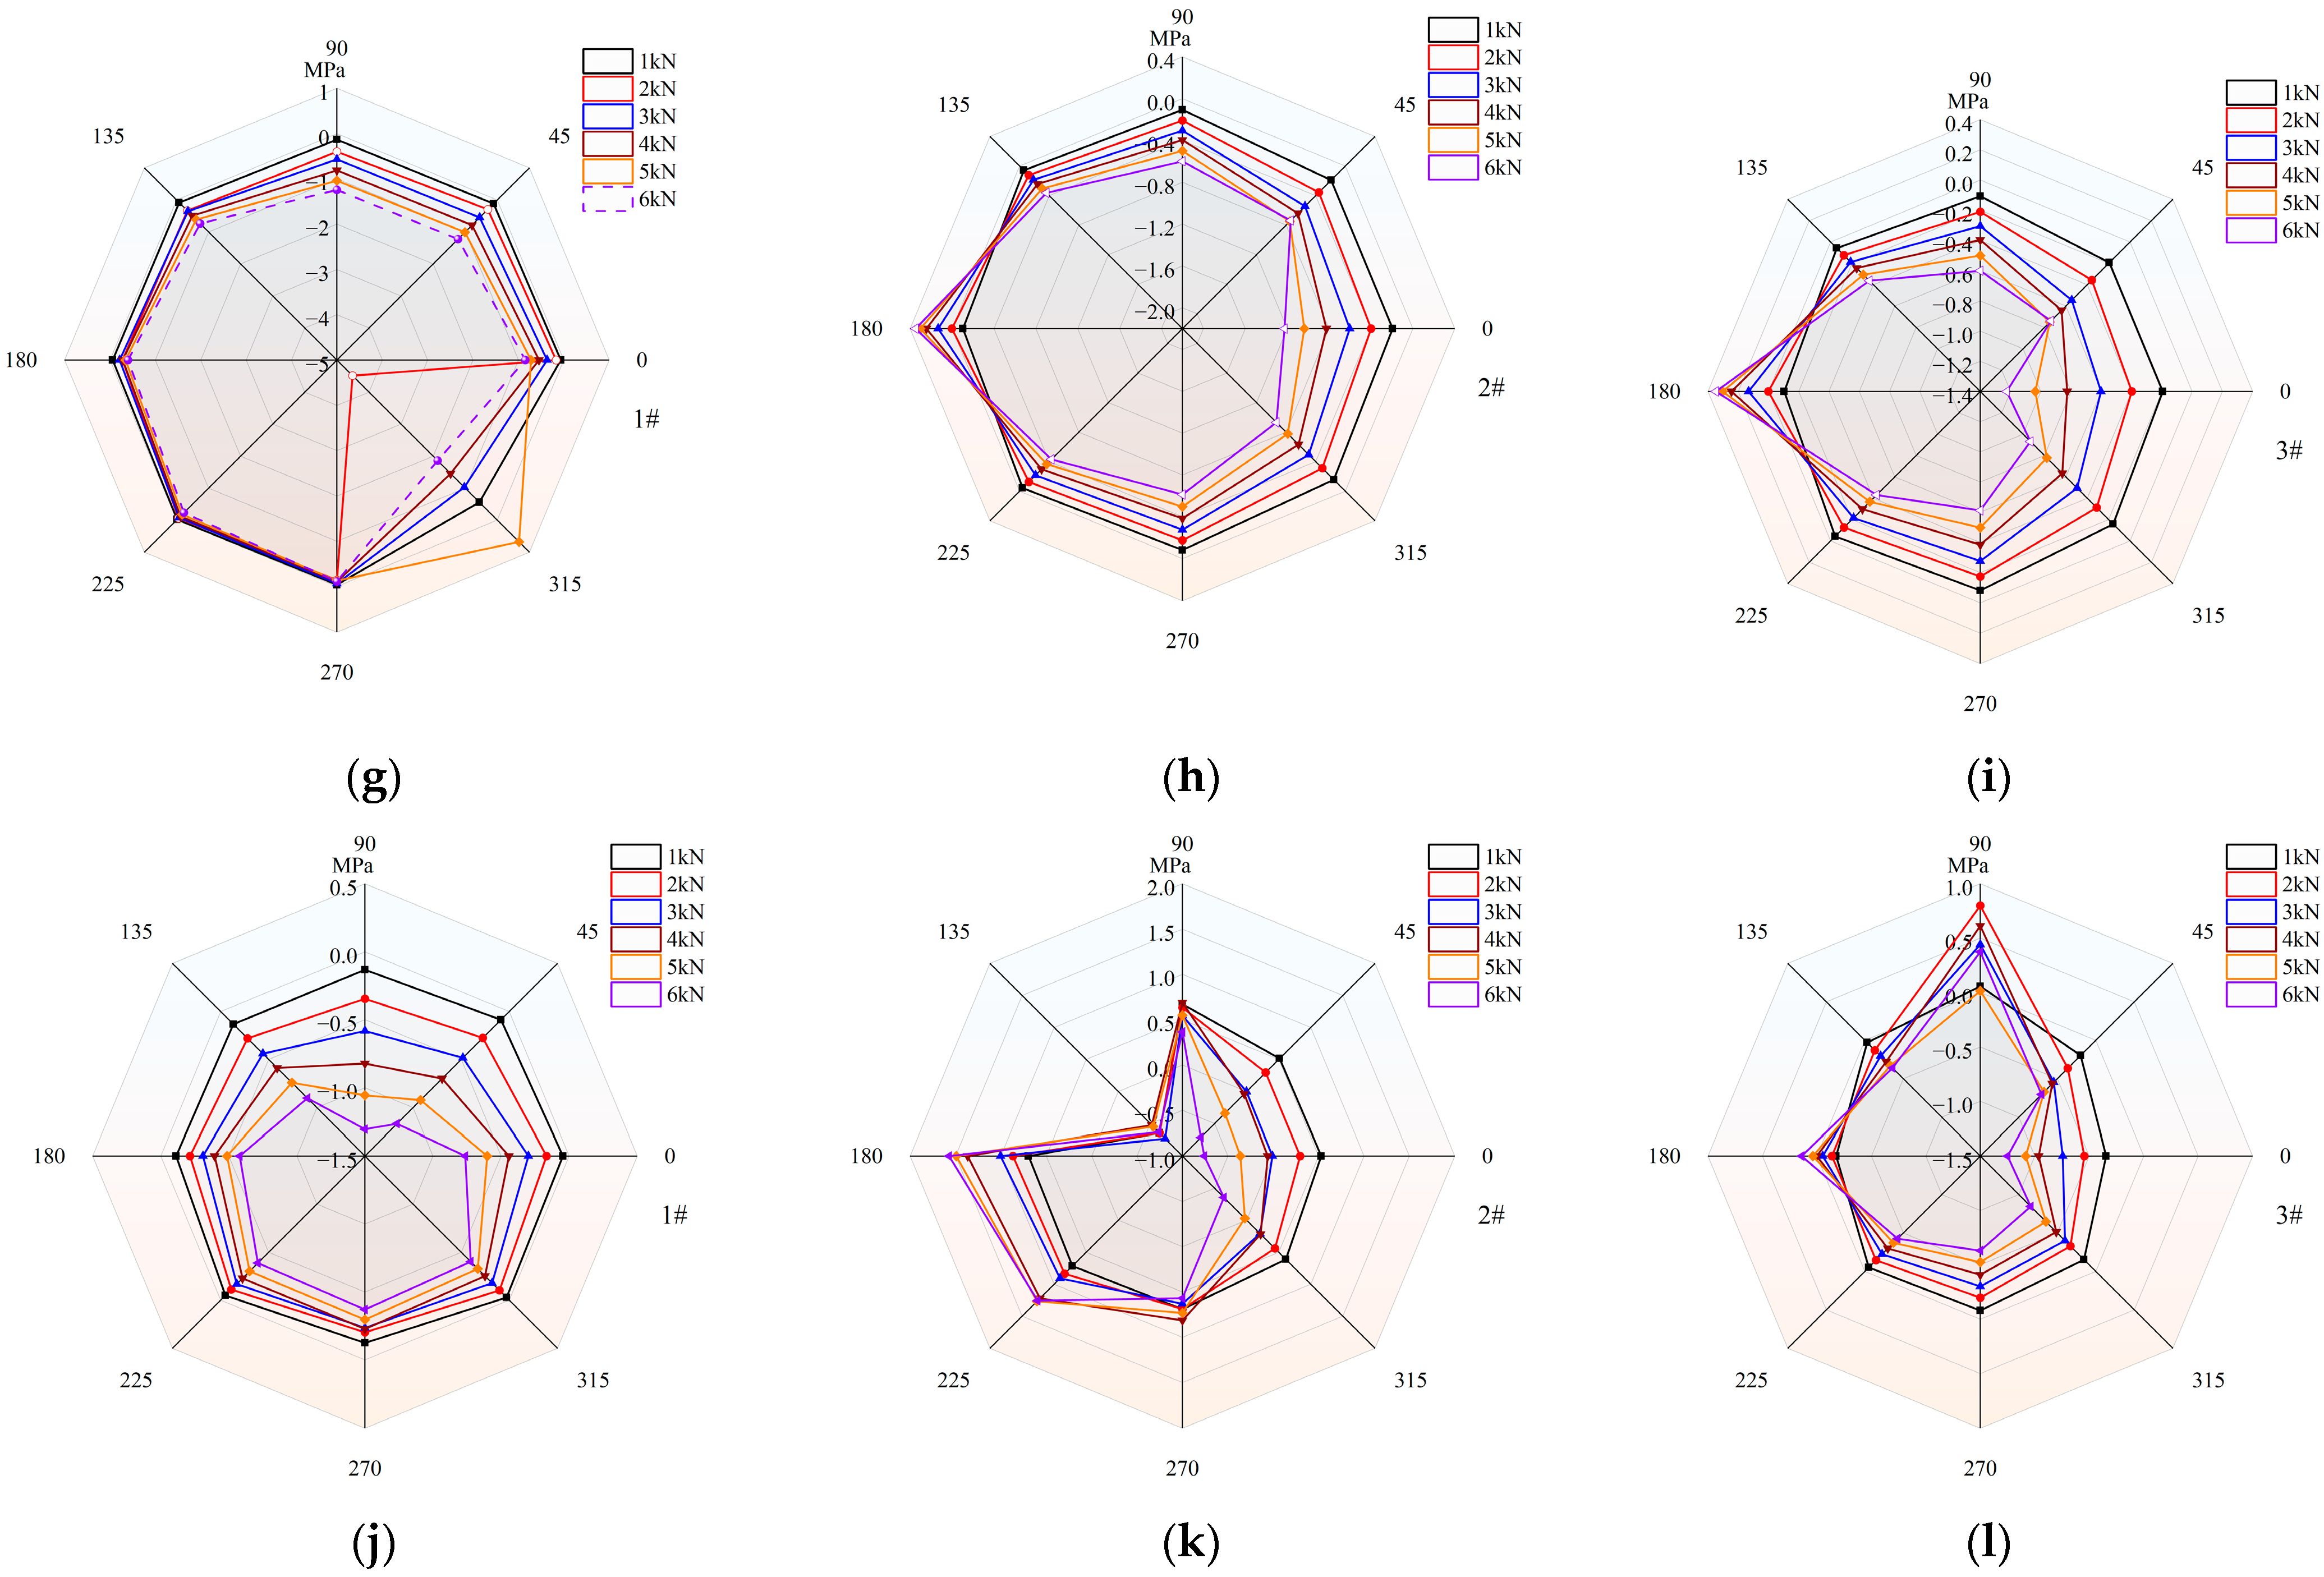
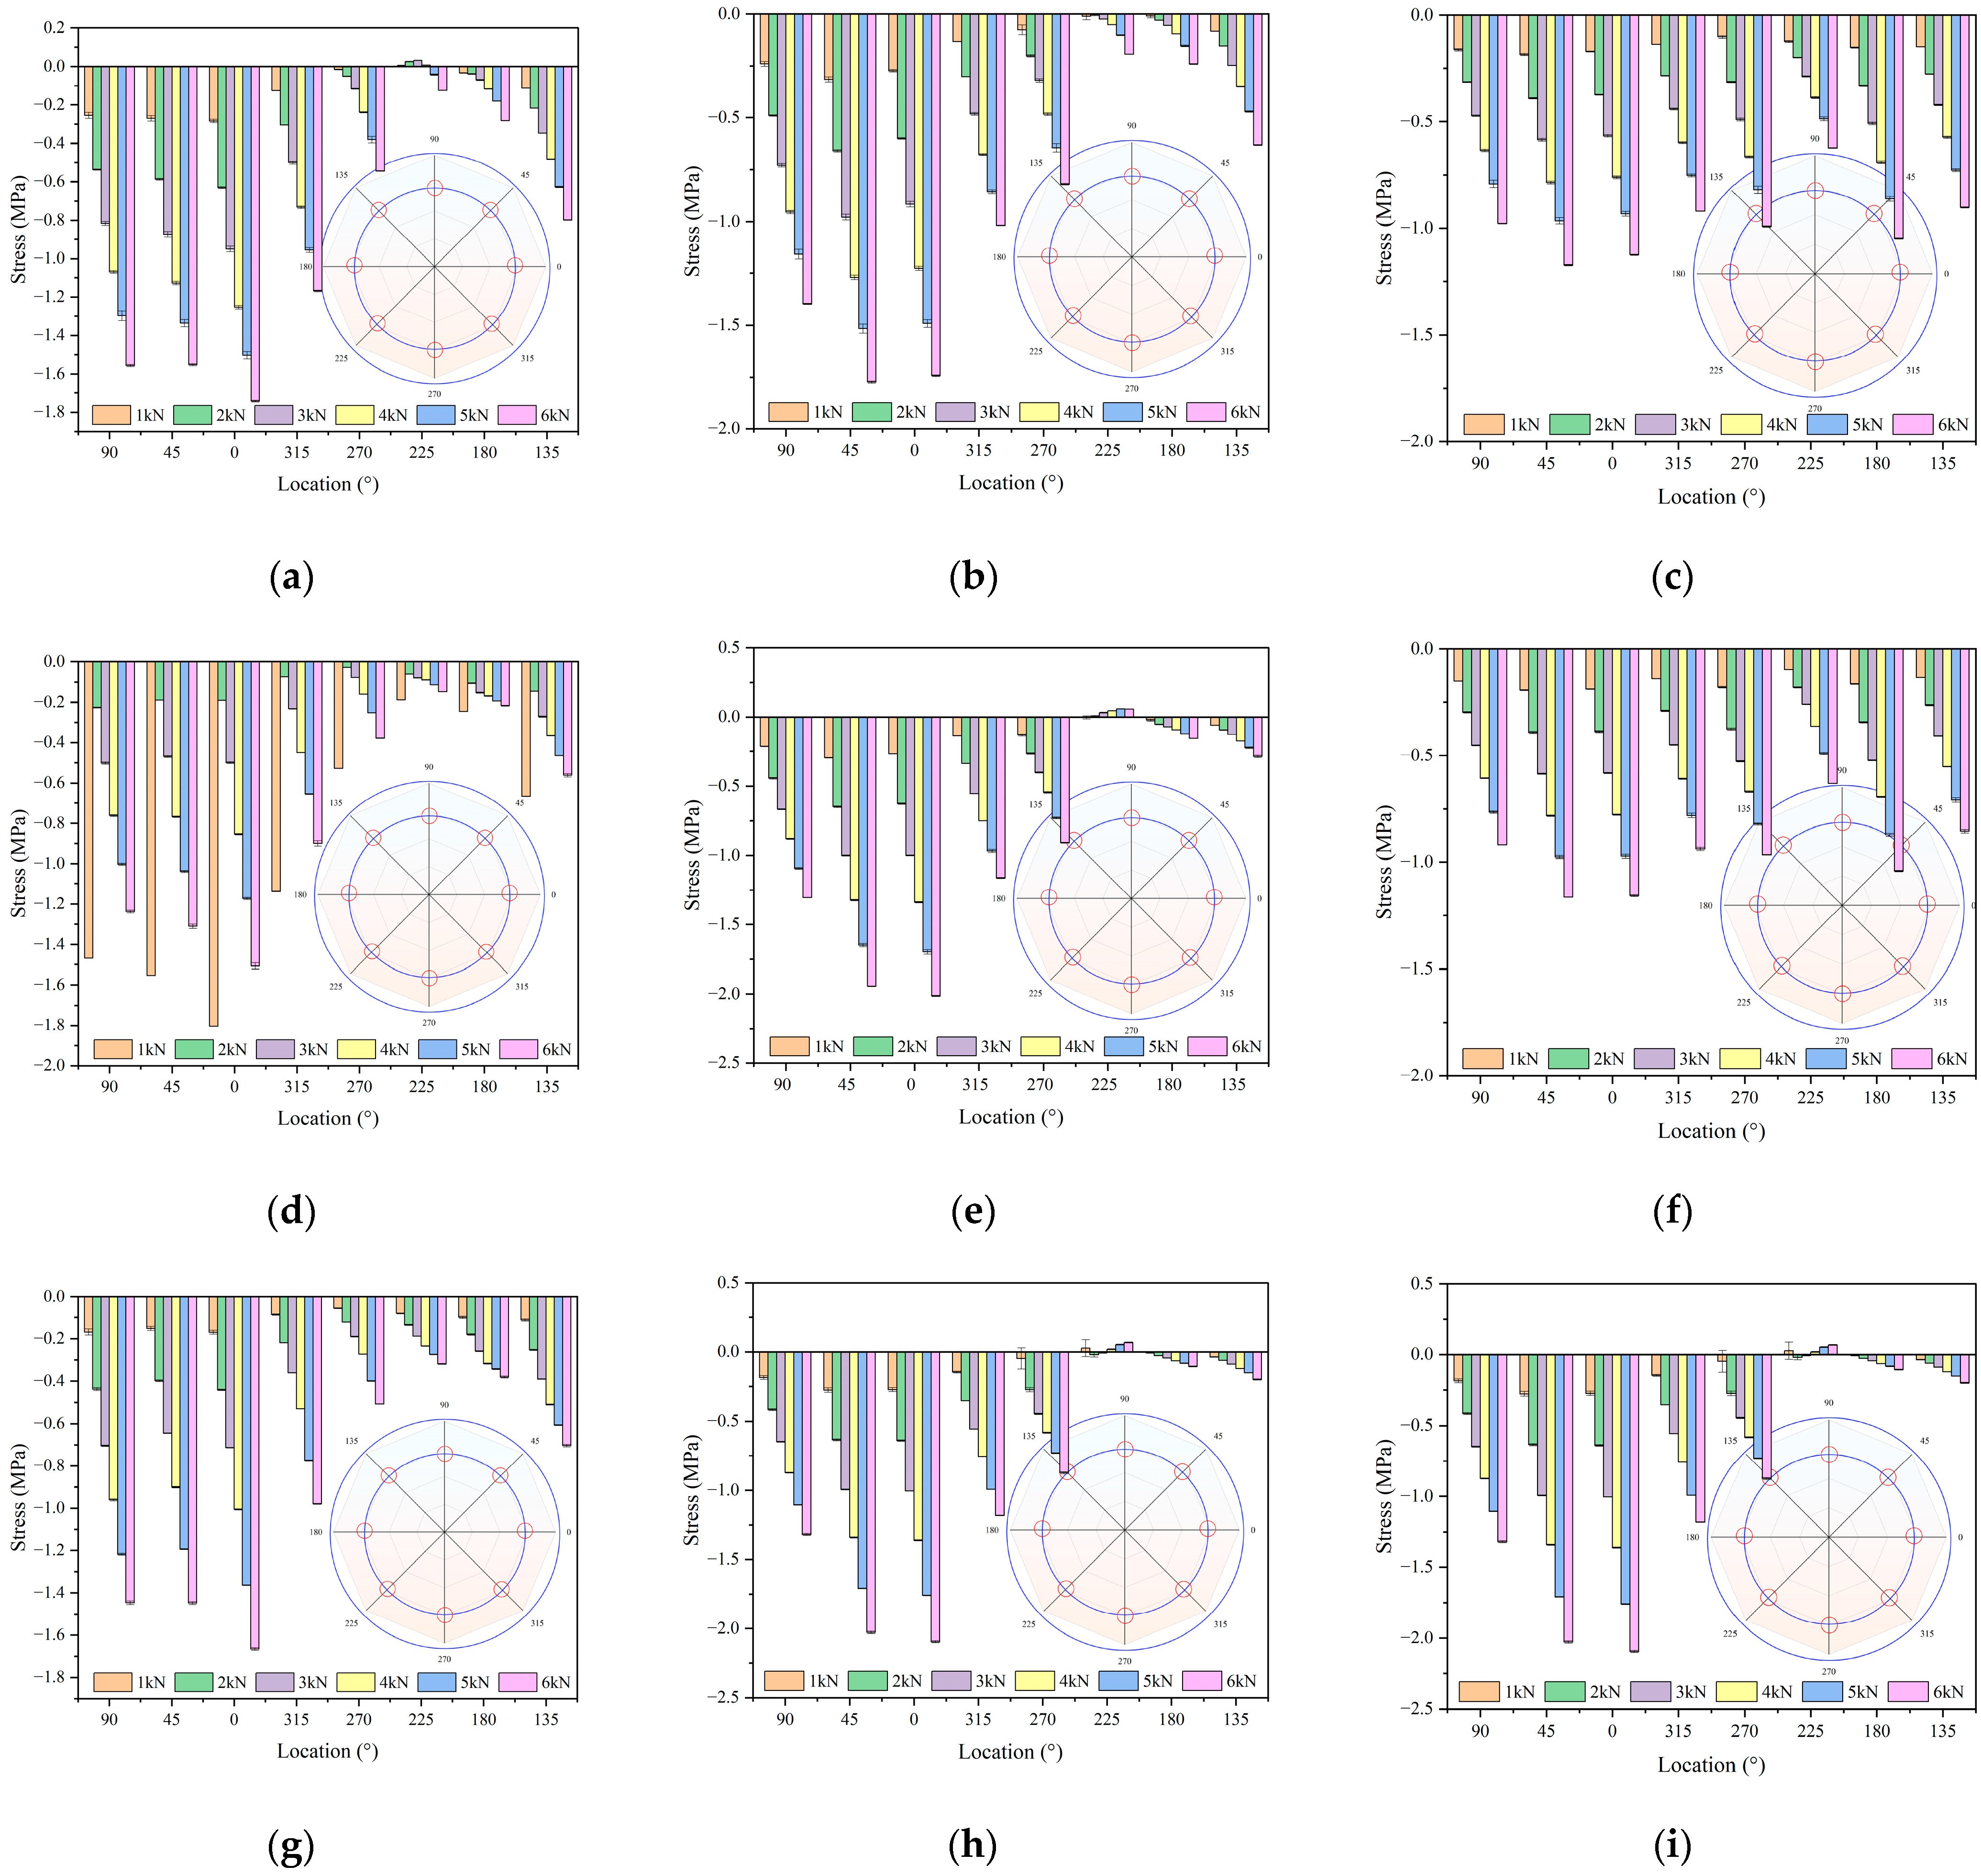
The polar coordinate diagram of the segment joint under co-directional deflection is shown in Figure 8. Partial test results are available in the Supplementary Materials file, “1-Co-directional deflection”. In the figure, a negative axial stress indicates the segment is under compression, while a positive axial strain indicates the segment is under tension. Under co-directional deflection, the pipeline exhibits significant horizontal eccentric compression and a relatively low vertical stress level. As the deflection angle and load level increase, the axial stress also increases correspondingly. The stress diagram shows a “horizontal cone” shape. When the deflection angle increases from 1.5° to 2°, the stress on the far-left side increases abruptly. The reason for this phenomenon is the mutual extrusion at the right joint of the segment after deflection and the direct action of the load on the joint measurement points, which causes local compressive deformation.
As the deflection angle increases, the most significant change is in the characteristic stress diagram of pipe segment 3#. When the deflection angle is 0, the stress distribution in the pipe segment is relatively uniform as shown in Figure 8a–c. When the deflection angle increases to 2°, as shown in Figure 8g–i, the tensile stress on the left side increases significantly. At this time, on the right side, under a smaller load (<1 kN), the pipe segment stress is at a zero stress level. When the deflection angle increases to 3°, stress peak points appear at both the top and left parts of the pipe segment. Furthermore, attention should be paid to the co-directional deflection threshold. When the deflection angle increases to 3°, the stress will exhibit unfavorable structural distribution characteristics, as shown in Figure 8j–l.

4.1.2. Diagonal Deflection and Axial Stress Response

The variation law of axial stress at the mid-span of the segment under diagonal deflection is shown in Figure 9. Partial test results are available in the Supplementary Materials file, “2-Diagonal deflection”. During the test, the diagonal deflection direction was set vertically. Under diagonal deflection, sections 1-1 and 2-2 exhibited opposite stress concentration effects. Both were symmetrically distributed along the 90°~270° axis. When the deflection angle was constant, the axial stress increased with the load level. When the load level was constant, the axial stress increased with the deflection angle. Specifically, the 45°~135° range of Segment #1 was the eccentric compression zone.
The 225°~315° range of Segment #2 was the eccentric compression zone. The strain level in Segment #2 was higher than that in Segment #1. The reason for this phenomenon is that after loading, the restraint from the joint caused the deflection angle φ12 between Segment #1 and Segment #2 to be smaller than the deflection angle φ23 between Segment #2 and Segment #3. Comparing the stress conditions under the same load level, the stress level for diagonal deflection is less than that for co-directional deflection. For example, when the deflection angle is 2° and the load is 6 kN, the compressive stress under co-directional deflection at the 270° position of section 2-2 is 131.8% of that under diagonal deflection. The compressive stress under co-directional deflection at the 315° position of section 2-2 is 134% of that under diagonal deflection. It is speculated that the reason for this phenomenon is that the deflection angles in co-directional deflection are on the same side, while in diagonal deflection they are on opposite sides. At the 1-2 and 2-3 sections, the co-directional deflection has two superimposed effects, whereas the diagonal deflection has mutually weakening effects.

4.2. Joint Deformation Characteristics

To obtain the deformation law of the pipeline joint, DIC was used to investigate the deformation law of the segment joint after deflection. The deformation stages of the segment deflection angle during the loading process are shown in Figure 10. Observation revealed that the preset deflection angle gradually decreased as the load level increased during loading. To clarify the influence of the decreasing deflection angle on segment stress during loading, the axial deformation at the midpoint of the compression zone of the Segment #2 joint was selected for analysis. As the load level increased, the segment deformation rate initially increased and then tended to stabilize. As shown in Figure 9, as the load level increases, the contact pressure at the vault of the joint continuously increases, leading to an increase in deformation strain. During the testing process, and based on the patterns of joint deformation, it was found that the deformation of the pipe joint exhibits three typical stages: linear growth, accelerated deformation, deformation deceleration. In the linear growth stage (load < 2 kN), the segment deflection angle does not change, and the strain increment is linearly related to the load. In the accelerated deformation stage (load < 4 kN), the rate of strain increase slows down, and the strain increment exhibits more nonlinear deformation. When entering the deformation deceleration stage (load > 4 kN), the strain increment slowly increases linearly with the load.
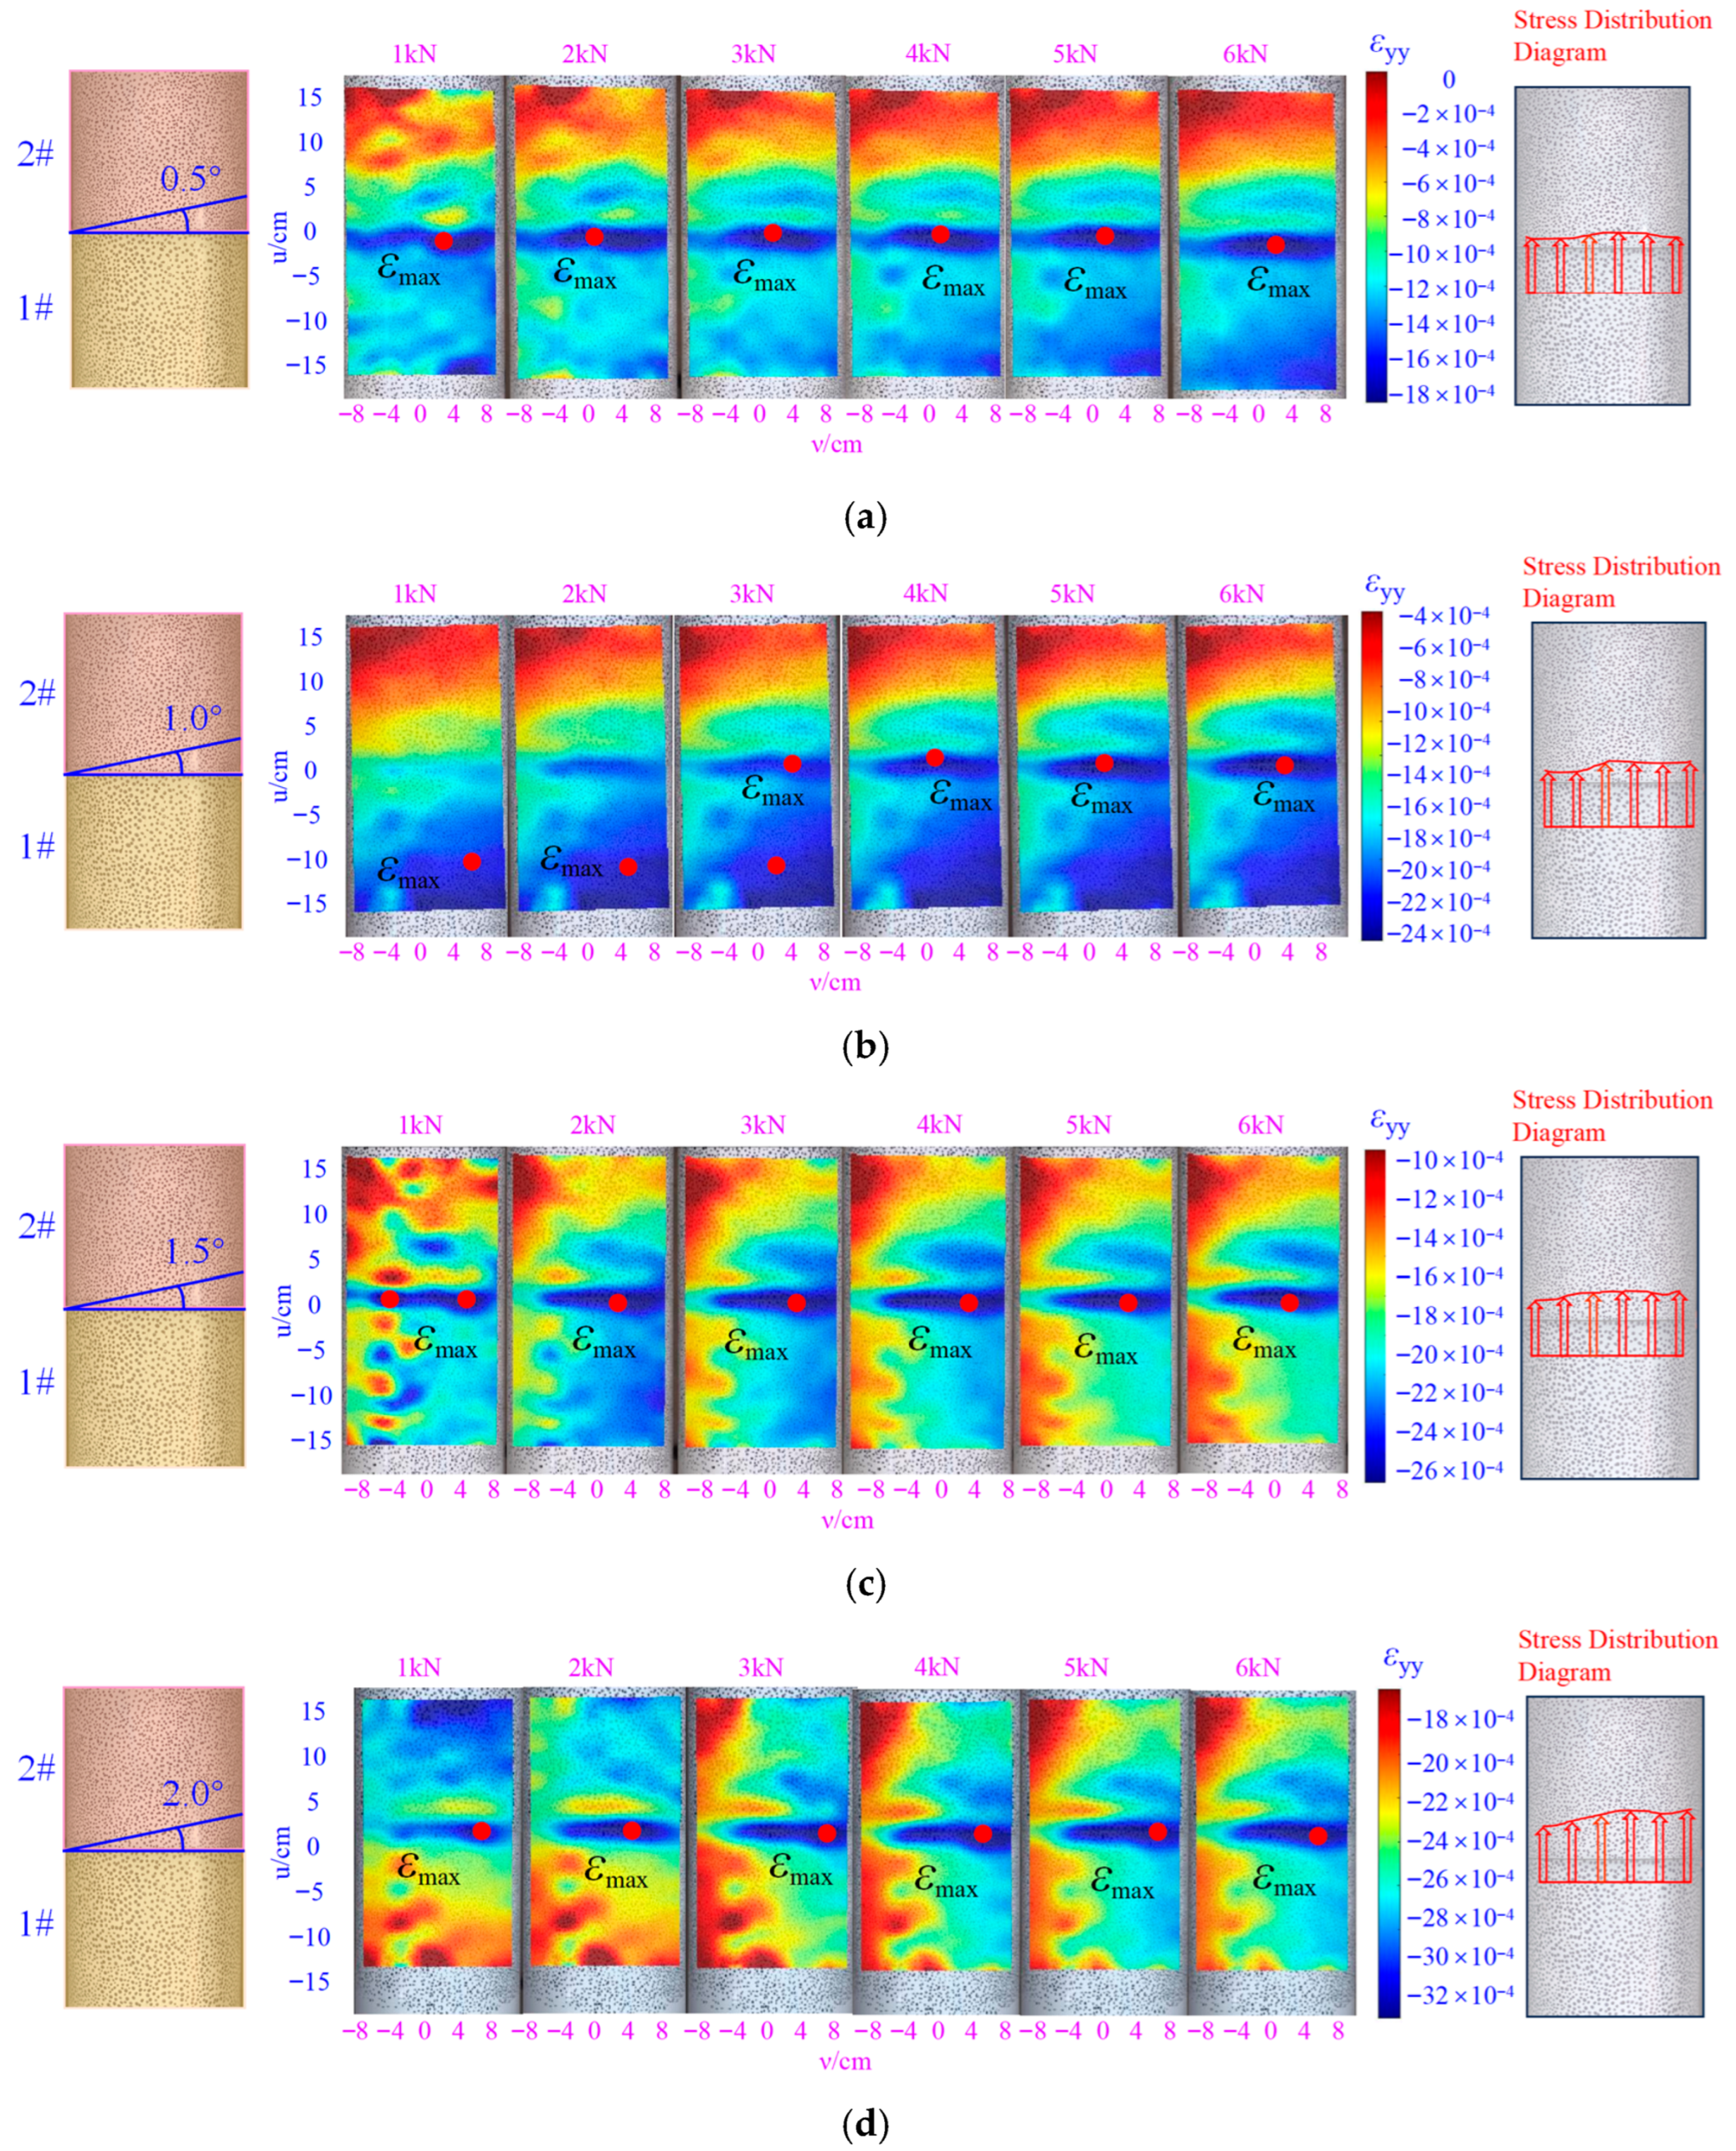
The cloud diagram of the deformation displacement field distribution of the segment joint is shown in Figure 11. Partial test photos are available in the Supplementary Materials file, “photos”. Taking the midpoint of the segment joint gap as the coordinate origin and the loading direction as the positive direction, compression deformation of the segment is negative and elongation is positive. The stress nephograms at the loading stages of 1 kN~6 kN for deflection angles of 0.5°~2° were selected for analysis. The overall axial deformation of the joint increases with the load level and deflection angle. In the diagram, significant compression deformation occurs in the vault left and right 45° areas of the segment joint. The deformation nephogram of this area in the horizontal direction shows a characteristic of being “thick in the middle and thin on both sides”. When the deflection angles are 0.5° and 1°, an increase in load level does not change the stress distribution of the joint. When the deflection angles are 1.5° and 2°, an increase in load level reduces the stress difference between the segment joints. Taking a deflection angle of 0.5° as an example, as the load increases, the compressive stress distribution at the joint does not change significantly, but the displacement degree intensifies. The maximum deformation value and the strain change gradient both increase, and the radiation area of strain concentration expands. When the deflection angle is 0.5° and the jacking force is 6 kN, the force transmission from the end of Segment #2 to the end of Segment #1 causes its average axial strain to decay by 72.6%. When the deflection angle is 2° and the jacking force is 6 kN, the axial strain decay from the end of Segment #2 to the end of Segment #1 is only 36%. This shows that the increase in the deflection angle changes the contact mode of the joint, and the force transmission path at the vault of the joint becomes more significant.

4.3. Axial Stress Response Induced by Defects

4.3.1. Mechanical Characteristics Under Single Defect Conditions

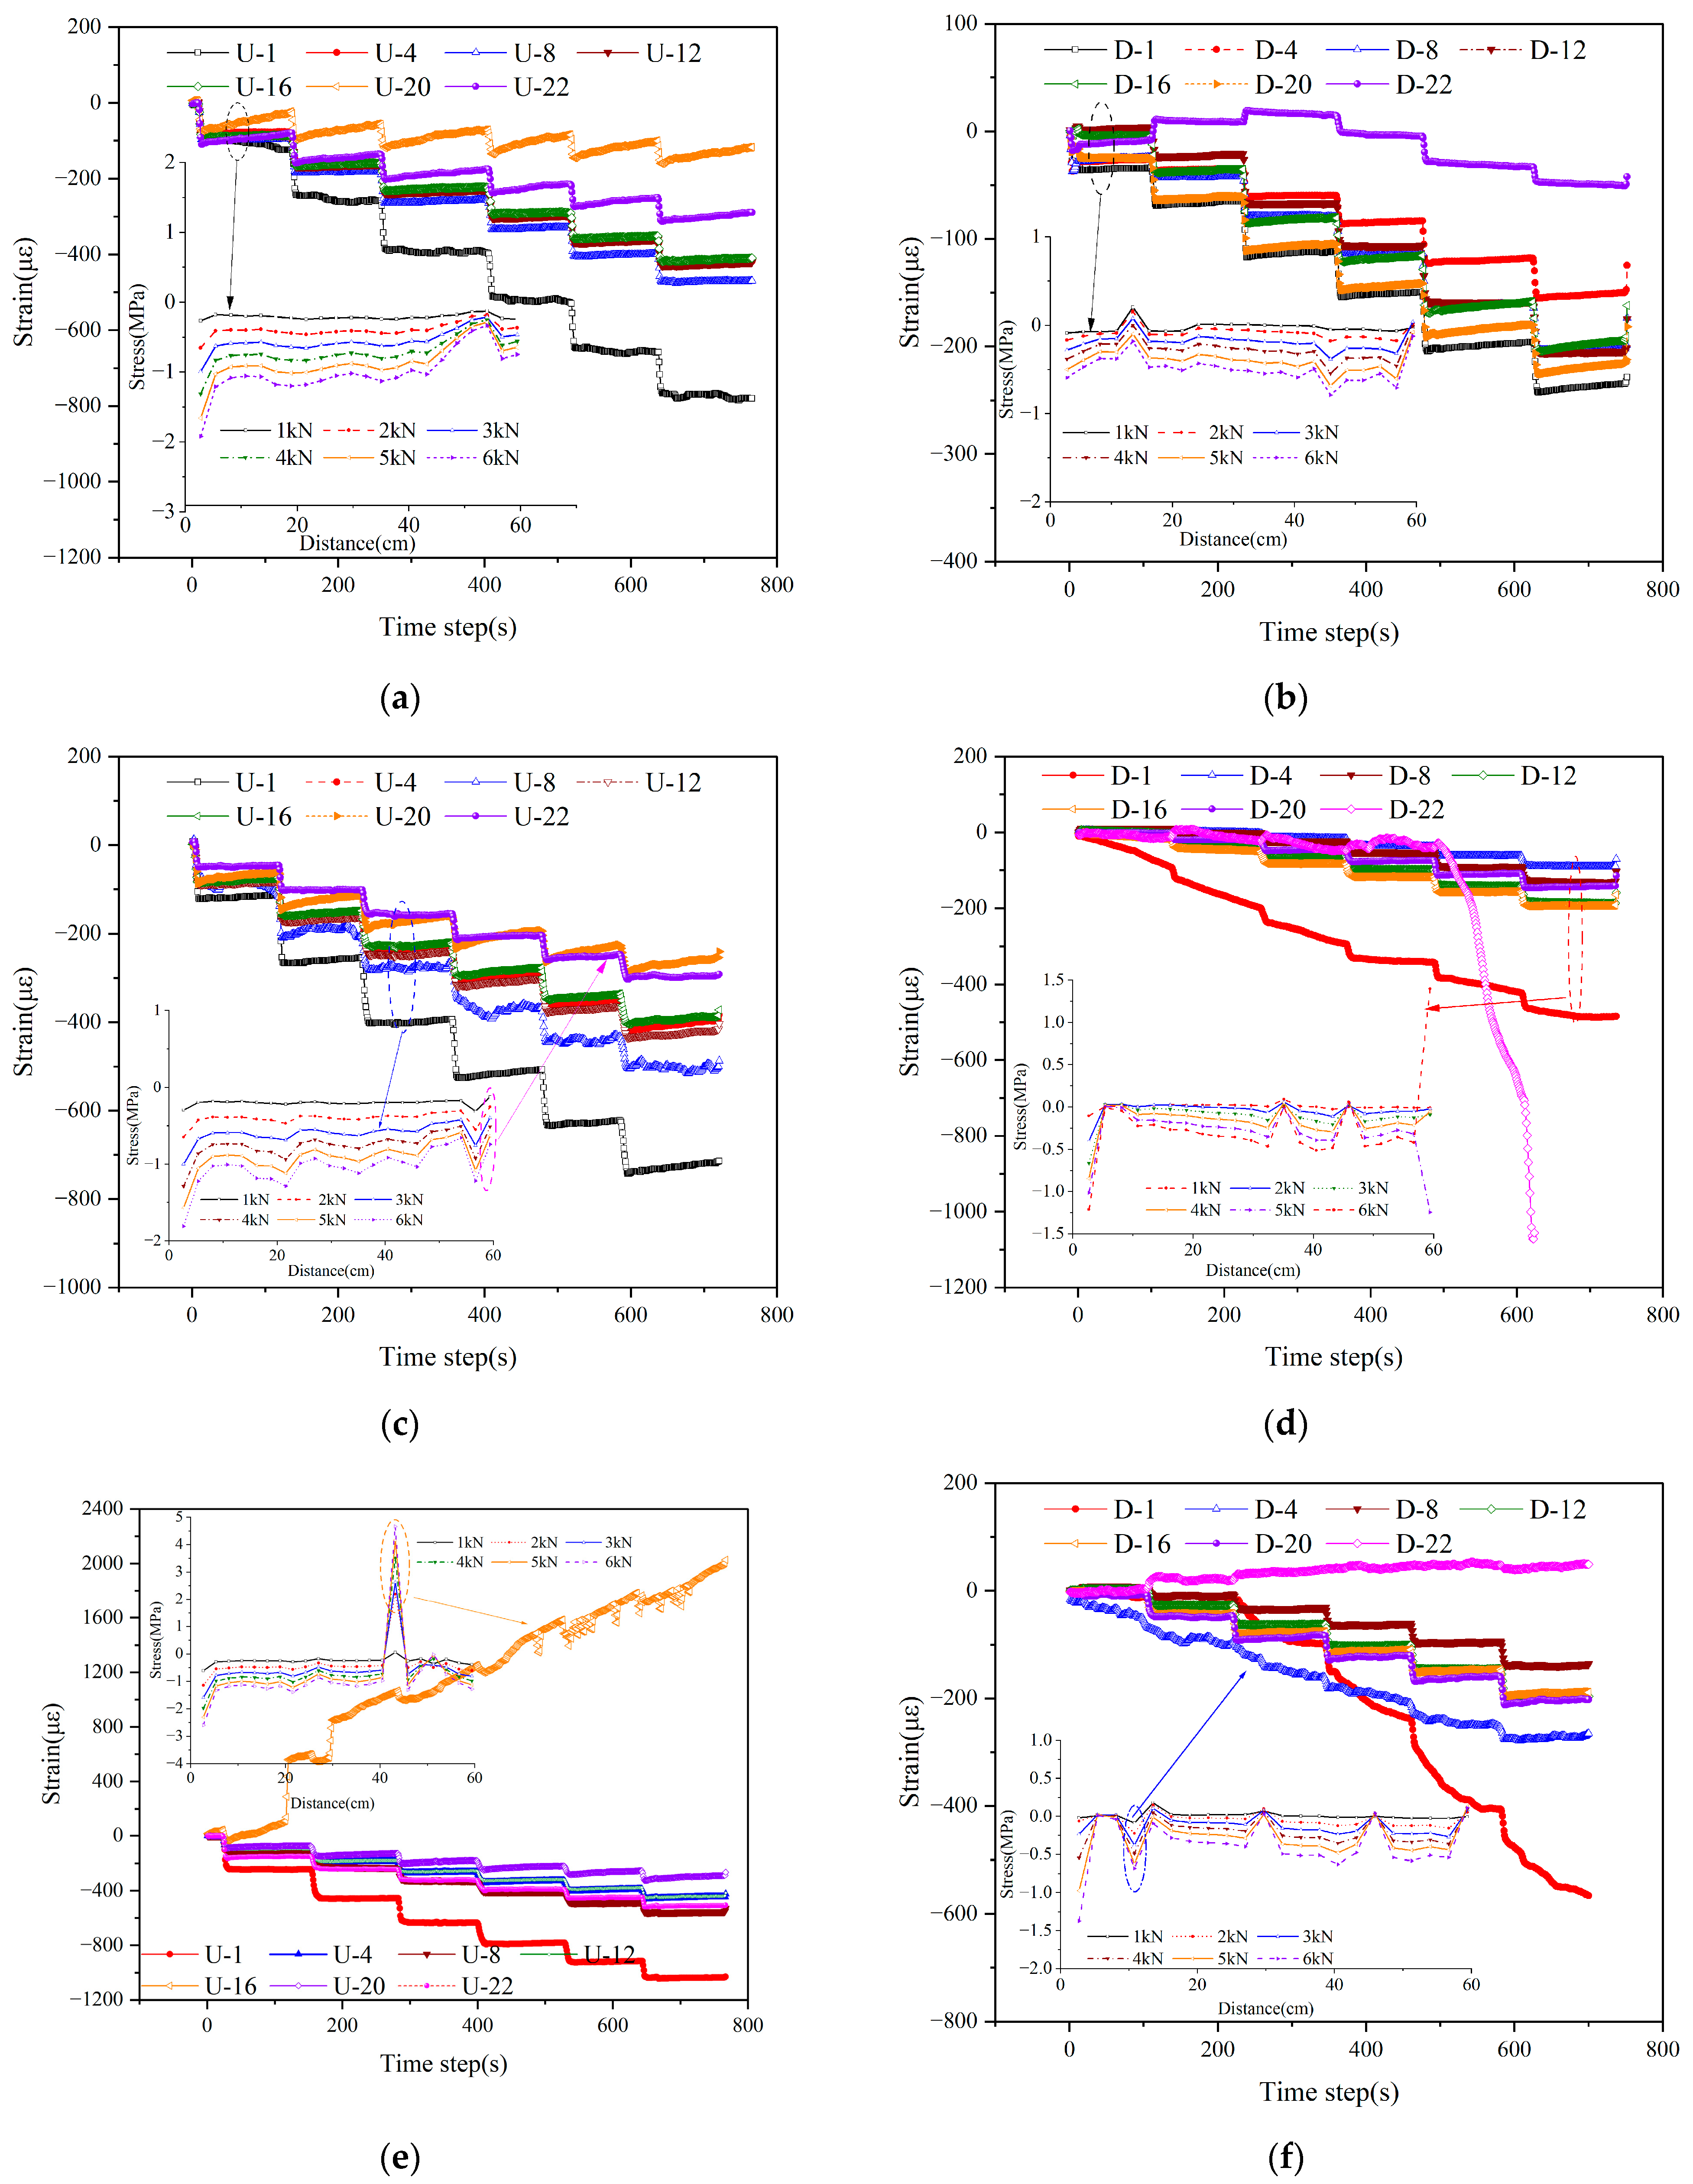
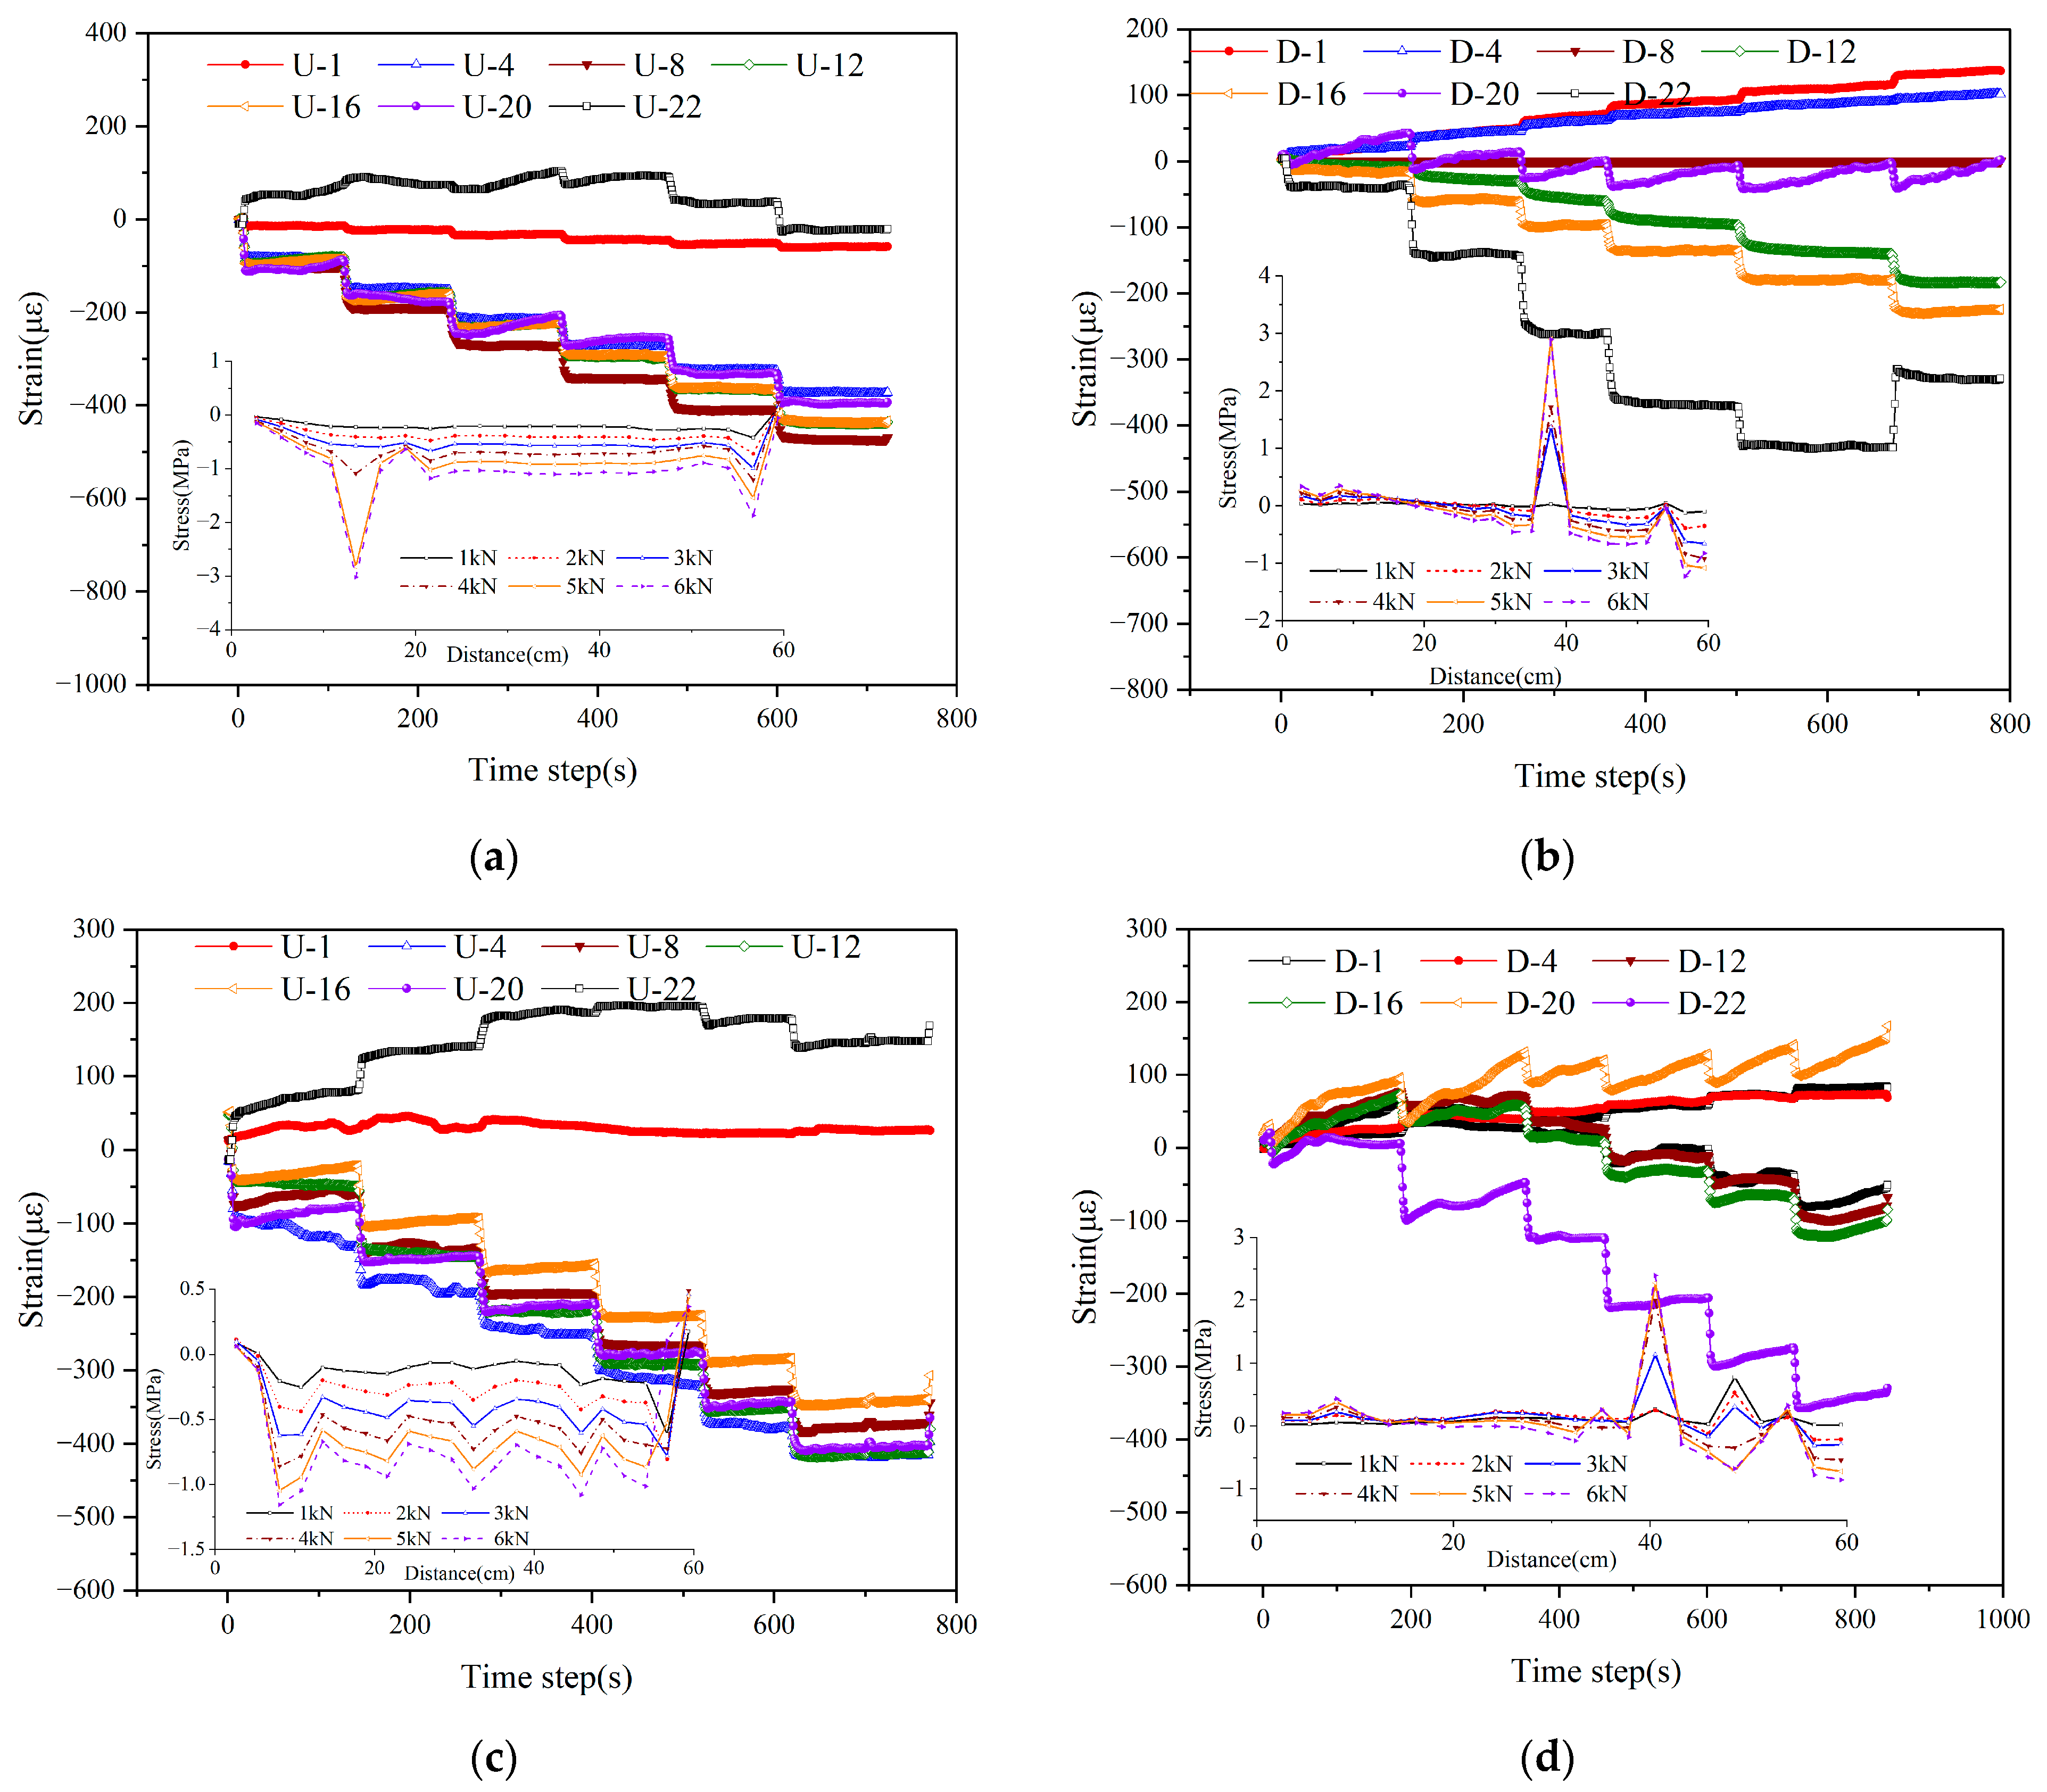
Under the condition of no defect in the segment, as shown in Figure 12a,b, an axial uniformly distributed load is applied. The entire segment is under compression. As the load gradually increases, the segment strain increases in a step-like pattern. From the perspective of vault stress (curves U-1, U-4, U-8, U-12, U-16, U-20, U-22), the overall stress is predominantly compressive, with mostly negative strain values. As the load increases from 1 kN to 6 kN, the absolute value of the compressive stress shows a significant upward trend. In the initial loading stage (small distance/time step range), the stress exhibits some fluctuations but gradually stabilizes as the distance increases. The stress stratification corresponding to different loads is clear: the greater the load, the higher the compressive stress level at the vault. The vault stress distribution appears relatively gentle overall, showing a compressive state with a strain peak at point 20. The bottom stress (curves D-1, D-4, D-8, D-12, D-16, D-20, D-22) also increases with the load, but the increase is not as significant as the load level rises. D-22 shows a trend of first increasing, then decreasing, and then increasing again, exhibiting an alternation between tensile and compressive stress.
With a 30° defect at the bottom, as shown in Figure 12c,d, the vault stress remains predominantly compressive with mostly negative strain values. Compared to the 0° defect condition, the stress at point U-20 increases, and the local fluctuation of stress at point U-8 is more significant. As the load increases from 1 kN to 6 kN, the absolute value of the compressive stress shows an increasing trend, but under larger loads (e.g., 5 kN, 6 kN), the fluctuation range expands. This indicates that the 30° defect disturbs the transmission and distribution of the vault compressive stress. Tensile stress appears at the bottom. Compared to the 0° defect, the 30° defect alters the growth rate and distribution pattern of the bottom tensile stress, exhibiting more significant non-uniformity under load. Particularly when the load reaches a certain level (e.g., 6 kN), the D-22 curve shows an abrupt stress change, indicating that the 30° defect reduces the stability of the bottom stress and increases the risk of stress concentration.
With a 45° defect at the bottom, as shown in Figure 12e,f, the distribution of vault compressive stress exhibits more complex variations compared to the 0° and 30° defect conditions. As the load increases from 1 kN to 6 kN, the absolute value of the compressive stress increases significantly. Within specific distance intervals, obvious stress peaks appear (e.g., near a distance of about 40 cm, the stress curves under various loads show prominent peaks). This indicates that the 45° defect alters the transmission path of the vault compressive stress, making the local stress concentration more significant. Compared to the 0° and 30° defects, the 45° defect has two effects. On one hand, it causes the tensile stress at the top measuring point 16 and the bottom measuring point 22 to continuously increase with the load, while the increasing rate at the bottom measuring point D-22 continuously decreases. On the other hand, the compressive stress amplitudes at the bottom and vault of the pipe segment show an increasing trend. When the 45° defect occurs, the stress state of the pipe segment gradually changes.
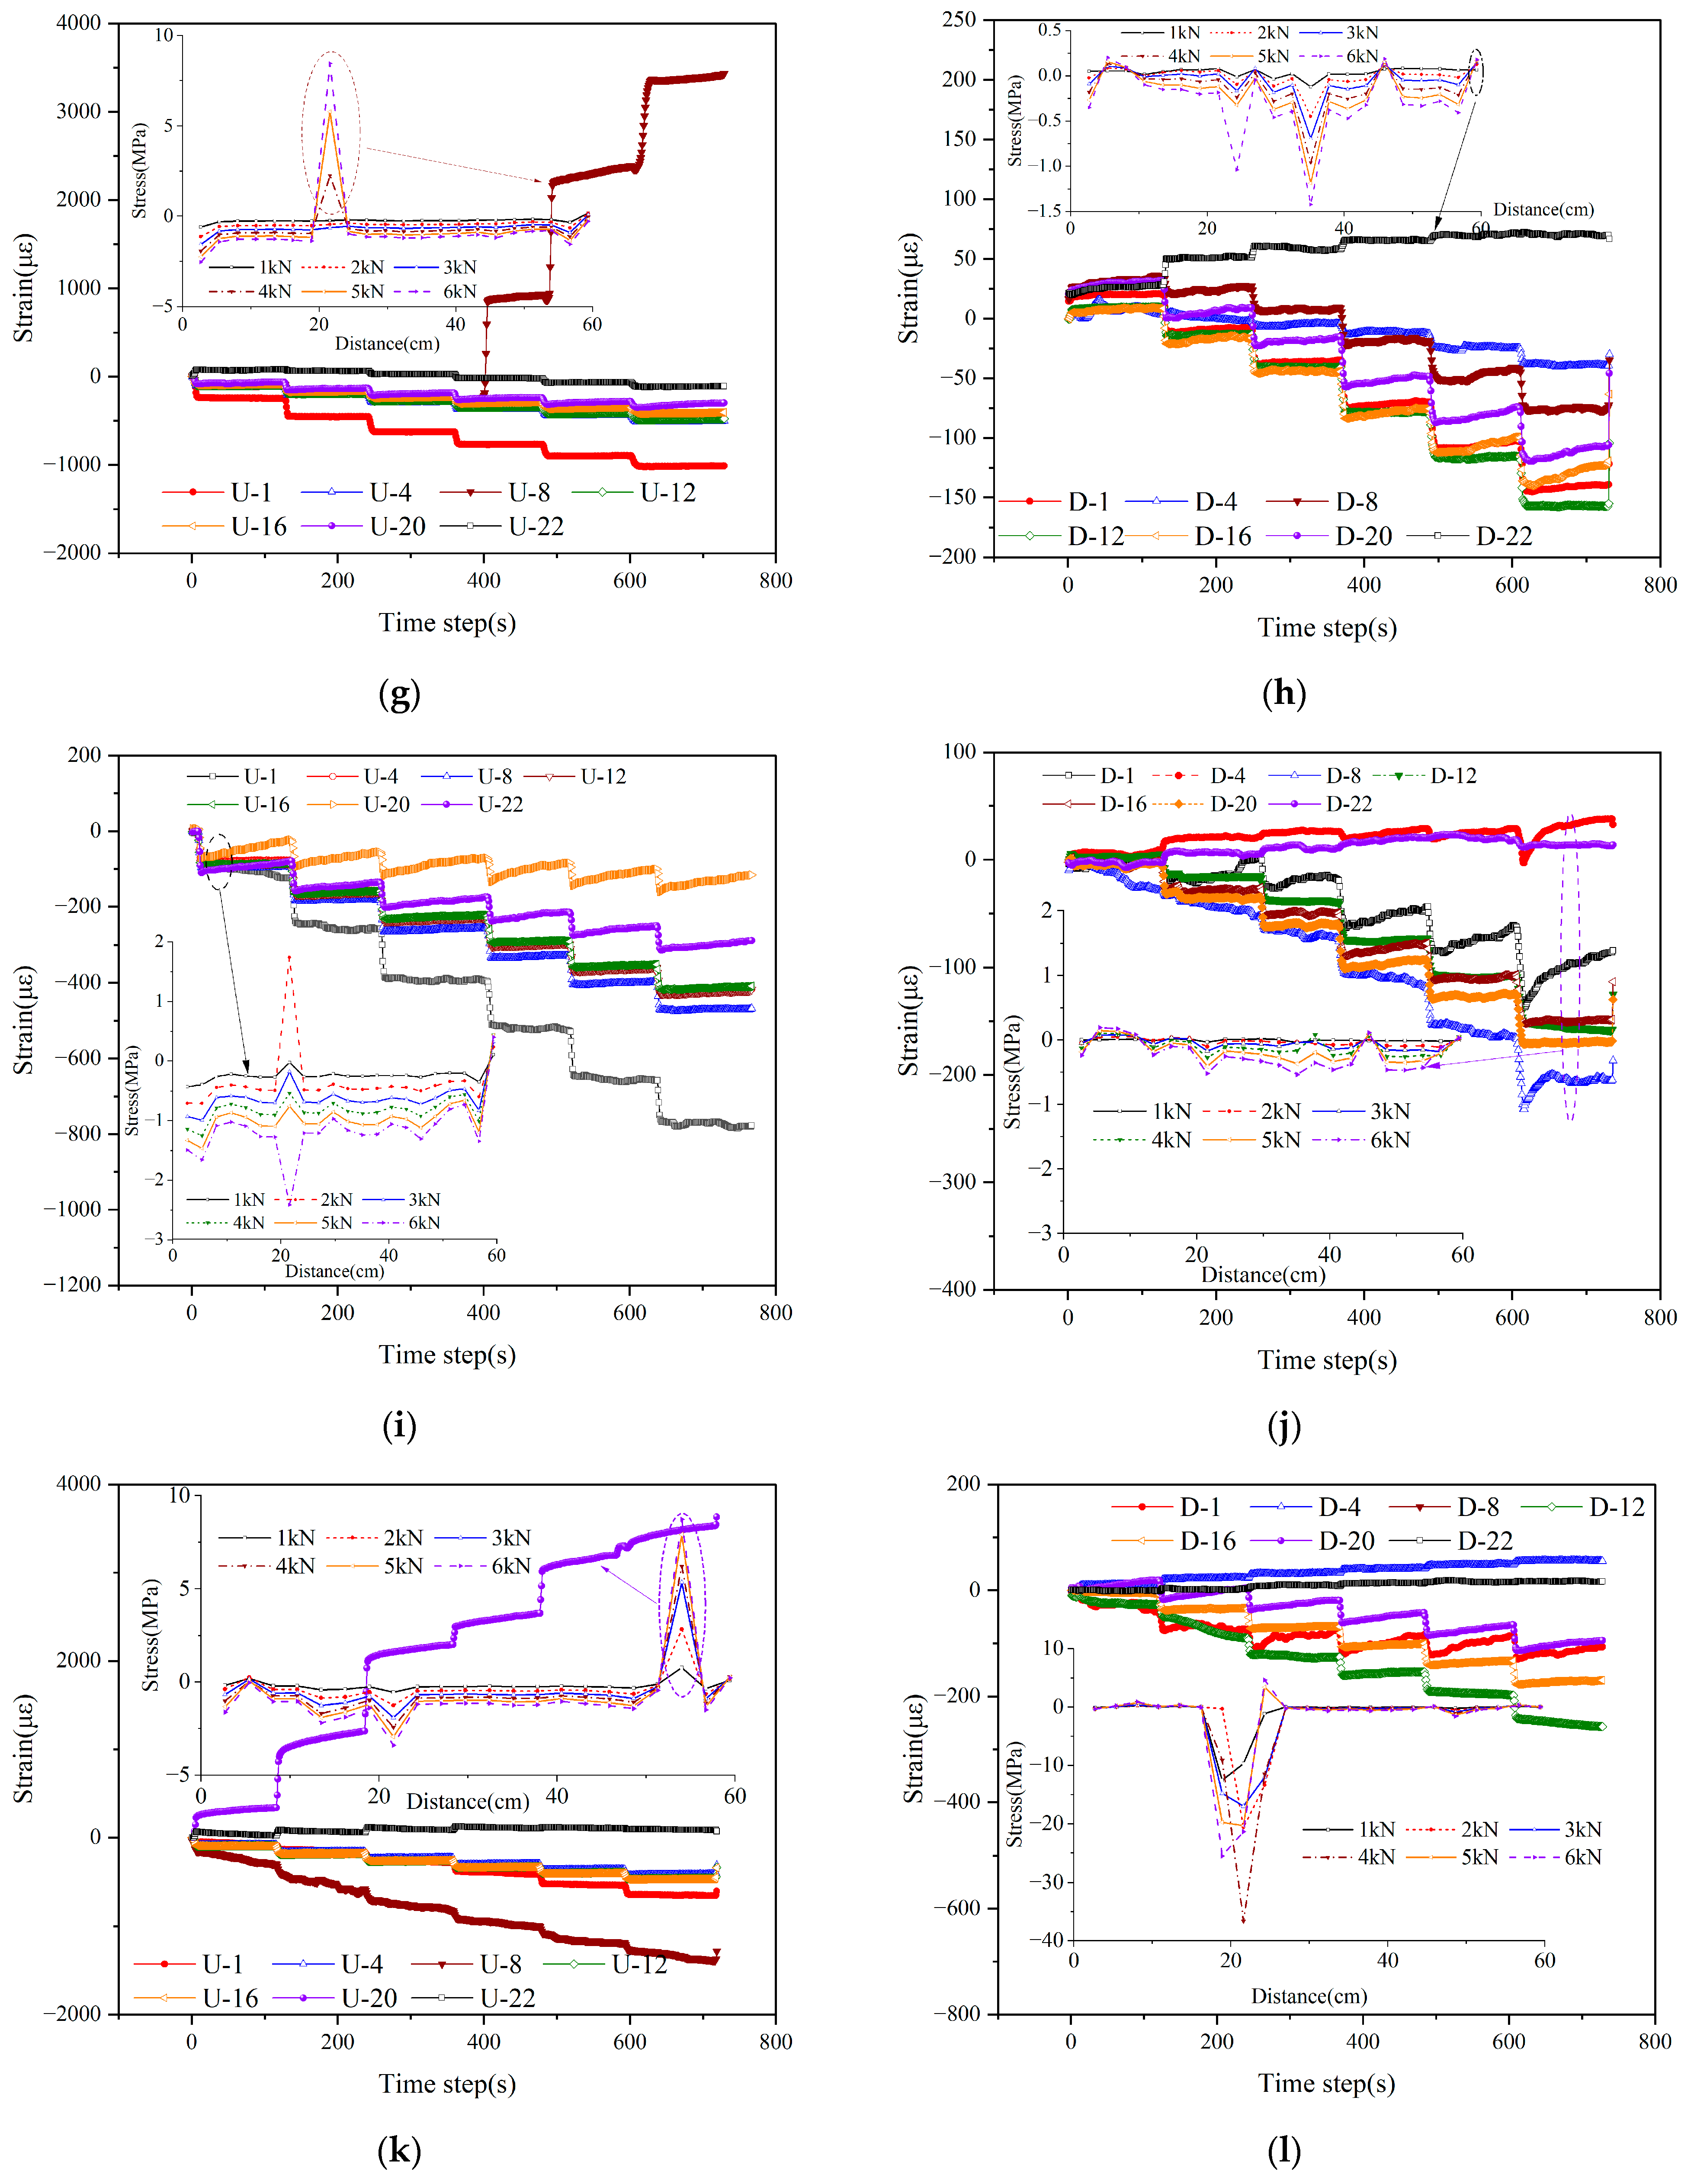
With a 60° defect at the bottom, as shown in Figure 12g,h, the distribution and variation trend of the vault compressive stress differ significantly from the 45° defect condition. For example, in the vault stress, the location of tensile stress increase shifts from U-16 to U-8, and the stress state at measuring point U-8 changes from compression to tension when the load exceeds 3 kN. As the load increases from 1 kN to 6 kN, the absolute value of the compressive stress continues to increase. Regarding the bottom stress, at this time, two compressive stress maxima appear at positions 20–40 cm from the joint, with the maximum stress reaching 1.5 MPa, and the peak stress being three times that under the zero-defect condition.
With a 75° defect at the bottom, as shown in Figure 12i,j, the uniformity of the vault compressive stress distribution is further reduced, and the range of stress fluctuations is larger compared to the 60° defect condition. For example, at a distance of 20 cm from the joint, the stress value overall shifts from tension to compression. As the load increases from 1 kN to 6 kN, the absolute value of the overall stress continues to increase. In the initial loading stage, more significant abrupt stress changes occur (e.g., in the initial distance segment, the stress curves show obvious drops and recoveries). This indicates that the 75° defect causes stronger disturbance to the transmission of the vault compressive stress, with local stress concentration and fluctuation effects superimposed, significantly reducing the stability of the vault stress. Compared to the 60° defect, the 75° defect exacerbates the expansion of the bottom tensile stress range. For example, under the 60° defect, tensile stress mainly appears at point D-22, while under the 75° defect, tensile stress occurs simultaneously at D-4 and D-22, and as the load increases, the tensile stress maintains a relatively stable level. Under larger loads (e.g., 6 kN), the tensile stress almost approaches zero, with compressive stress appearing in some areas. This reflects that the 75° defect has a significant weakening effect on the tensile stress bearing capacity, manifested as the bottom stress no longer changing with the increase in load level. The bottom can hardly effectively bear tensile stress, and the stress state is extremely unstable.
With a 90° defect at the bottom, as shown in Figure 12k,l, the distribution of the vault compressive stress shows extreme non-uniformity, with stress fluctuations and concentration phenomena reaching a considerable degree compared to the 75° defect condition. As the load increases from 1 kN to 6 kN, the absolute value of the compressive stress continues to increase. The 90° defect leads to a noticeable phenomenon of a sudden increase in tensile stress at the vault of the pipe segment and a sudden increase in compressive stress at the bottom of the pipe segment. For example, changes occur at the U-20 measuring point near the 60 cm mark of the vault and at the measuring point near the 20 cm mark of the bottom. Among them, the tensile stress at the top can reach 10 MPa, while the compressive stress at the bottom can reach 40 MPa. The local stress concentration is extremely significant, and the degree of compressive stress concentration at the vault has posed a serious threat to the structural safety. This reflects that the 90° defect fundamentally alters the nature of the stress at the bottom. For example, at the D-4 location, the stress state changes from being predominantly compressive to predominantly tensile compared to the condition with a defect range of <60°. The stress state at the bottom is completely unbalanced, and the stability and rationality of the structural stress are severely compromised.

4.3.2. Mechanical Characteristics of Segments Under Combined Vault and Bottom Defects

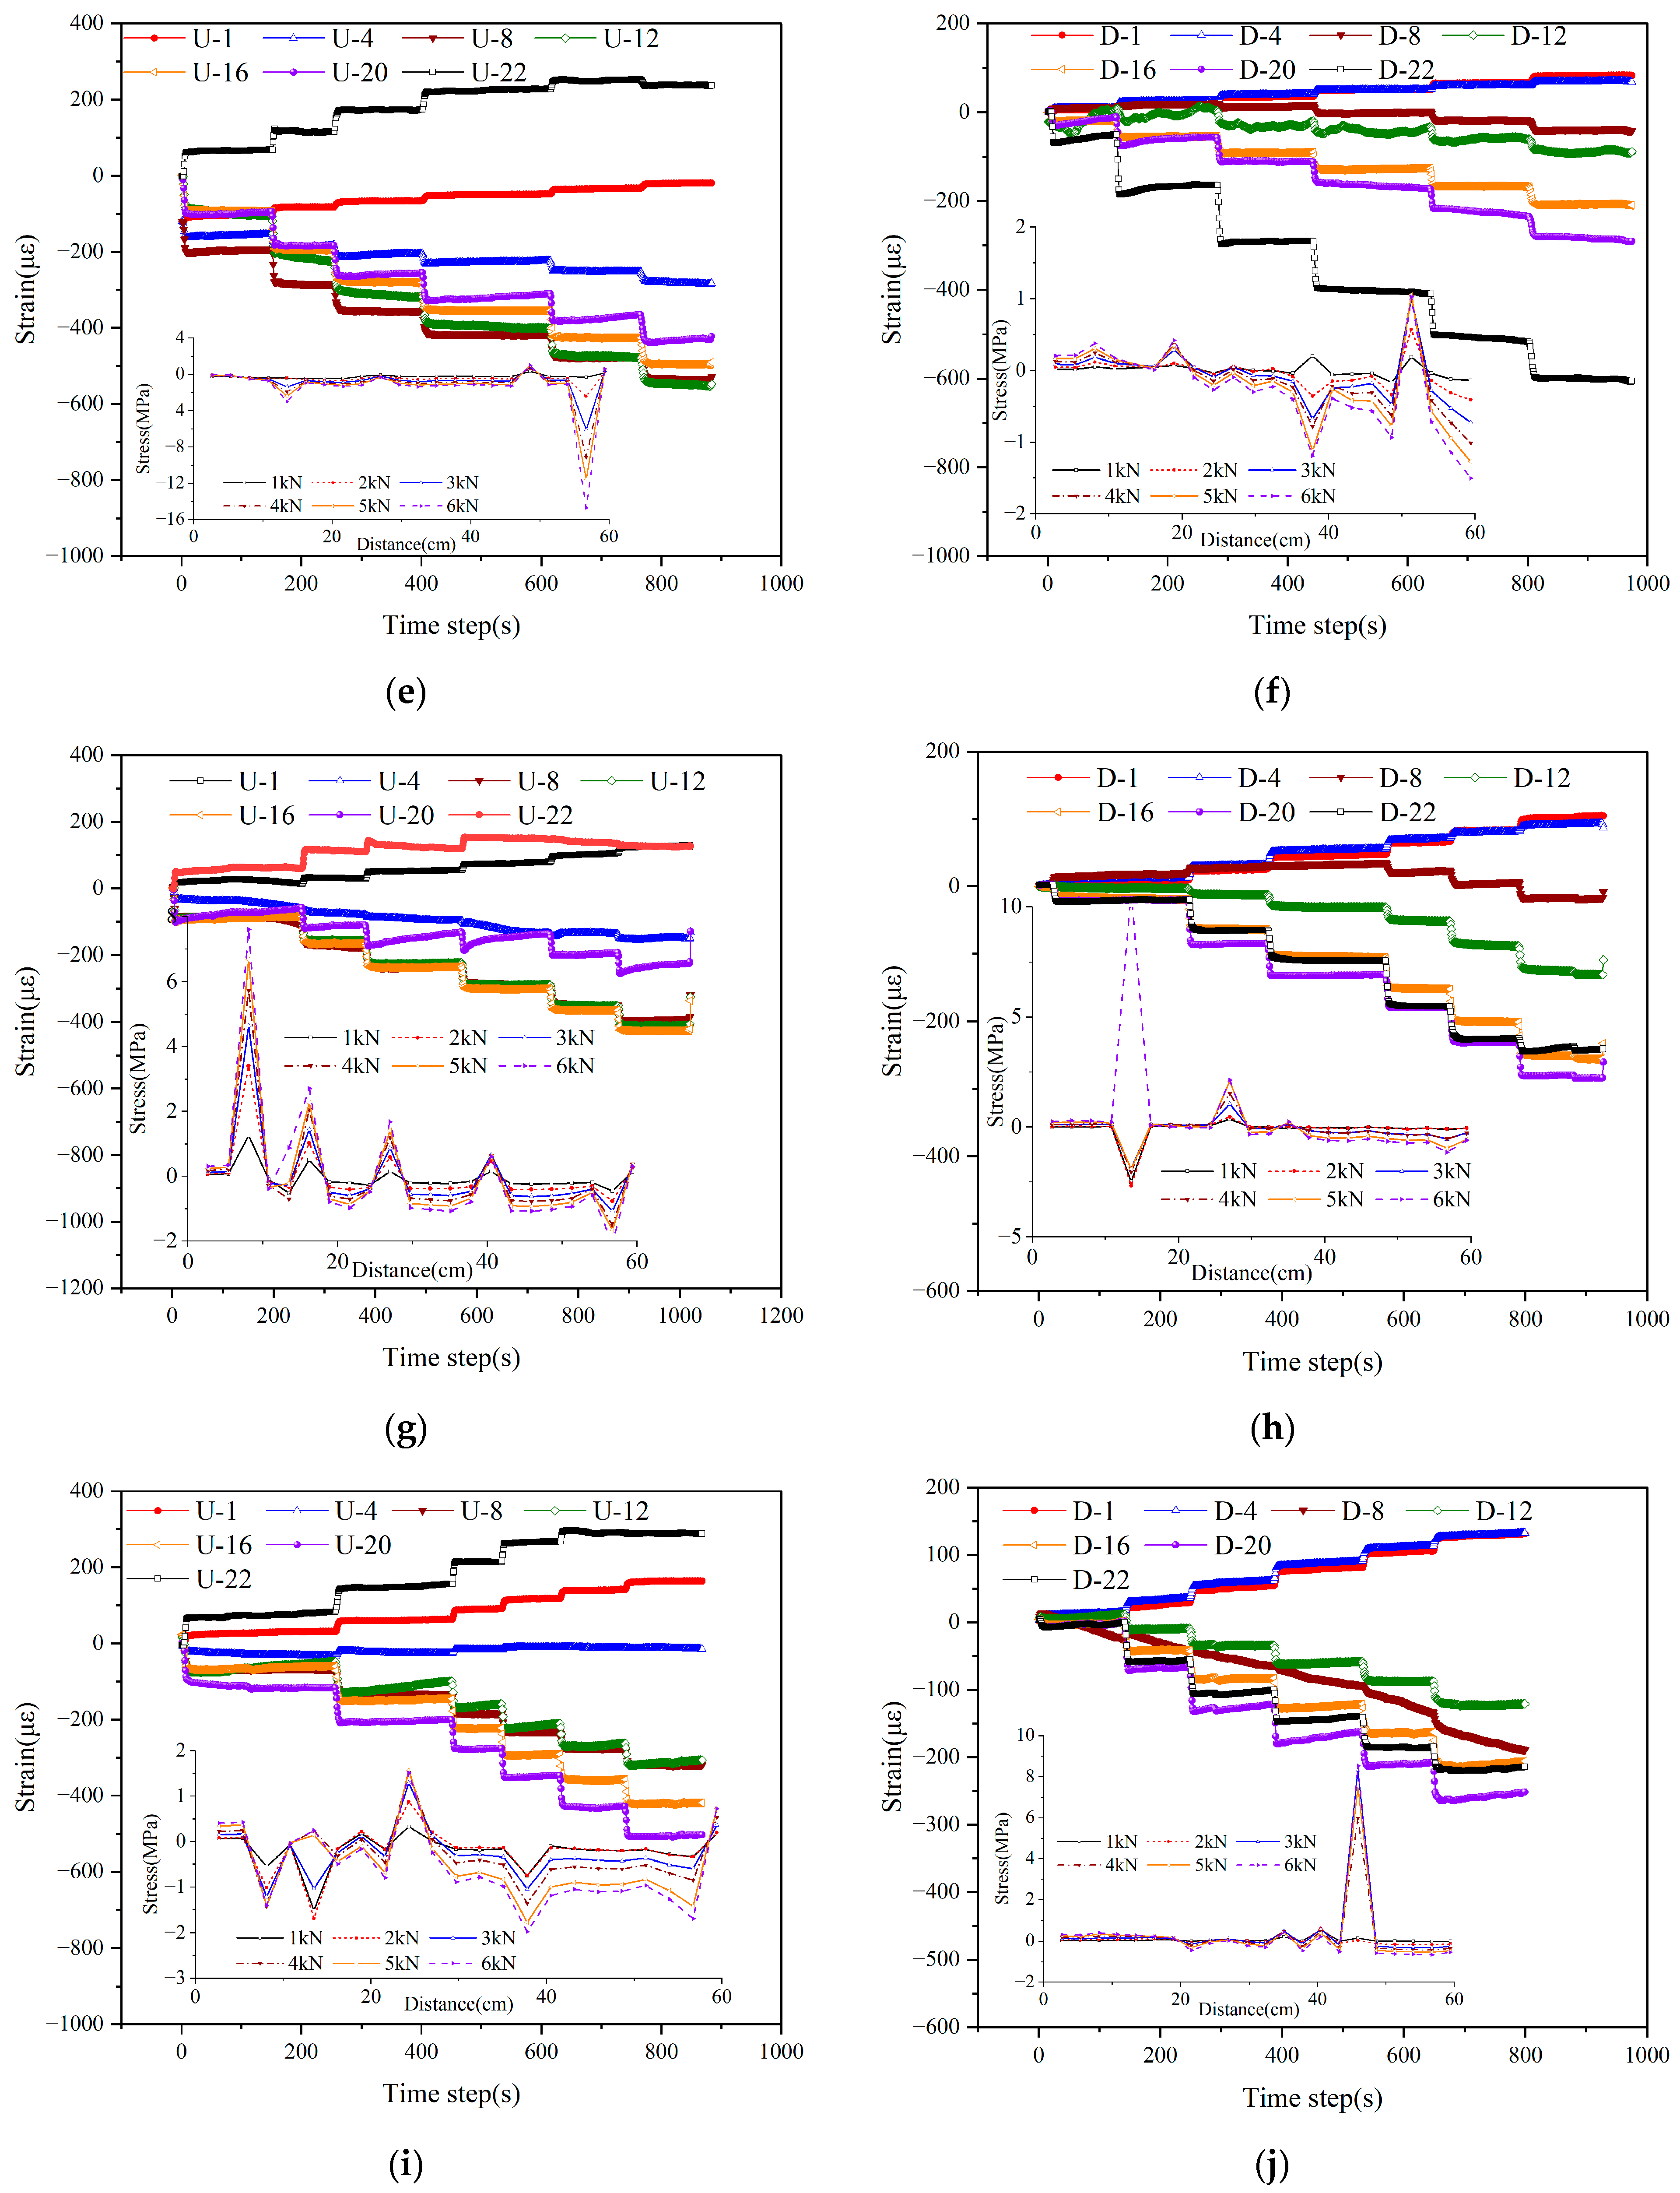
The structural variation characteristics under the combined 90° bottom and 30° vault defects are shown in Figure 13a,b. Partial test results are available in the Supplementary Materials file, “3-Defect Testing”. For the vault stress of segment #2, the strain at different positions exhibits phase variations with the time step, fluctuating within a certain range. The variation trends and amplitudes differ among the curves. The stress distribution along the segment length is relatively uniform, with peak stresses occurring at 15 cm and 55 cm from the interface. The bottom strain-time step curve of segment #2 shows that the strain at positions D-1 and D-4 also displays phase characteristics. Compared to the vault, the bottom stress exhibits a more regular symmetrical distribution. At this time, position D-8 remains unaffected by the load, in a zero-stress state during loading. The maximum tensile stress occurs 40 cm from the segment interface, reaching 3.5 MPa.
The structural responses under the combined 90° bottom and 45° vault defects are shown in Figure 13c,d. Under this defect combination, the strain and stress responses at the vault and bottom of segment #2 exhibit specific patterns. The vault strain shows distinct phase variations with the time step, and the strain curves at different monitoring positions (e.g., U-1, U-4) differ significantly, reflecting the complexity of the structural mechanical behavior. The embedded stress-distance subplot indicates that the stress distribution along the segment length varies under different loads (1 kN, 2 kN, etc.). As the load increases, the stress variation amplitude becomes more significant, demonstrating the sensitivity of the vault’s stress response to the load. The combination of defects also results in a non-uniform stress distribution. The bottom strain of the segment also changes in phases with the time step; however, its value range and variation trend differ from those at the vault, indicating a different deformation mechanism due to its position and interaction with the defects. The stress-distance subplot shows a unique bottom stress distribution under different loads. The bottom stress changes little in the 0–40 cm range, while in the 40–60 cm range, the stress fluctuates over a wider range.
The structural responses under the combined 90° bottom and 60° vault defects are shown in Figure 13e,f. The vault strain of segment #2 exhibits phase variations with the time step, with significant differences at various positions. The diverse shapes of the strain curves (e.g., U-1, U-4) reflect the complexity of the mechanical state at the vault. The stress-distance subplot shows that the stress distribution along the segment length varies with the load (1 kN, 2 kN, etc.). Increasing load exacerbates the peak-valley variations in stress, indicating that the compressive stress at the vault increases significantly when approaching the joint location. For instance, at the 58 cm position, the maximum stress reaches 16 MPa. The combination of a 60° vault and a 90° bottom defect leads to prominent stress non-uniformity. The bottom strain also changes in phases, but its value range and variation trend are distinctly different from the vault’s, reflecting a different deformation mechanism influenced by its position and interaction with the defects. The stress-distance subplots reveal the fluctuating variation characteristics of the pipeline bottom stress along the length. Under the combined action of defects and load, significant stress peaks appear in specific intervals, where the maximum tensile stress and the maximum compressive stress are similar in magnitude.
The structural responses under the combined 90° bottom and 75° vault defects are shown in Figure 13g,h. Under this condition, the vault strain of segment #2 shows distinct phase variations and significant differences across monitoring positions (e.g., U-1, U-4) as the time step increases, reflecting a complex mechanical state. The stress-distance subplots show that the vault stress exhibits a continuously weakening tensile stress peak, and the maximum tensile stress peak is four times that of the compressive stress peak. Stress peaks and valleys change more intensely with increasing load, highlighting the high sensitivity of the vault’s structural stress response. The combination of defects causes more intense stress non-uniformity. The bottom strain also exhibits phase changes but with smaller fluctuations, and the overall stress distribution is relatively uniform. When the load is excessive (>5 kN), the stress will transition from compression to tension.
The structural responses under the combined 90° bottom and 90° vault defects are shown in Figure 13i,j. When both the bottom and vault have 90° defects, the mechanical response of segment #2 exhibits unique patterns. The tensile and compressive strains at the vault appear to show a symmetrical pattern, but the compressive strain remains greater than the tensile strain. The strain curves exhibit diverse shapes, with large amplitude fluctuations occurring at specific locations, reflecting the complex mechanical behavior under this symmetrical defect combination. The stress-distance subplots show that stress fluctuations and variations intensify with increasing load, indicating that the vault stress response is extremely sensitive to the load magnitude. The dual 90° defects result in a unique non-uniform stress distribution. The load magnitude will cause a transition between tensile and compressive stress, with two distinct stress states existing at positions 20 cm and 40 cm from the joint. The bottom strain also changes in phases, but its value range and variation trend are distinctly different from the vault’s, reflecting a significantly different deformation mechanism due to its position, interaction with defects, and differences in load transfer paths. The stress-distance subplot shows a unique bottom stress distribution under different loads, with significant stress peaks in specific intervals. As the load increases, significant tensile stress (>8 MPa) appears at the bottom, indicating that the stress bearing and transfer characteristics of the bottom structure under this defect combination are relatively complex.

5. Discussion

5.1. Theoretical Validation

When the pipe segment has no deflection angle and the load is applied uniformly, Equation (4) can be used to calculate the pipe segment stress.
σ ¯ = F / A
In the equation, σ ¯ represents the average stress value on the pipe segment cross-section, F represents the applied load level on the pipe segment, and A represents the cross-sectional area of the pipe segment.
The comparison results between the theoretical values and the average stress under the non-deflection condition are shown in Figure 14. The stress growth trend of the pipe segment shows good consistency with the theoretical values. The values for 1#90° and 1#135° fluctuate on both sides of the theoretical value. As can be seen from Table 3, the difference between the measured stress and the theoretical value for the No. 1 pipe segment is small. At the 90° and 135° positions of the pipe segment, the average stress deviations are 6.74% and 3.73%, respectively. This indicates that the error between the indoor test results and the theoretical values is small (<10%). It demonstrates that the indoor test results are reliable, and using the indoor model test of the pipe segment to investigate the structural mechanical characteristics is reasonable.

5.2. Numerical Model Validation

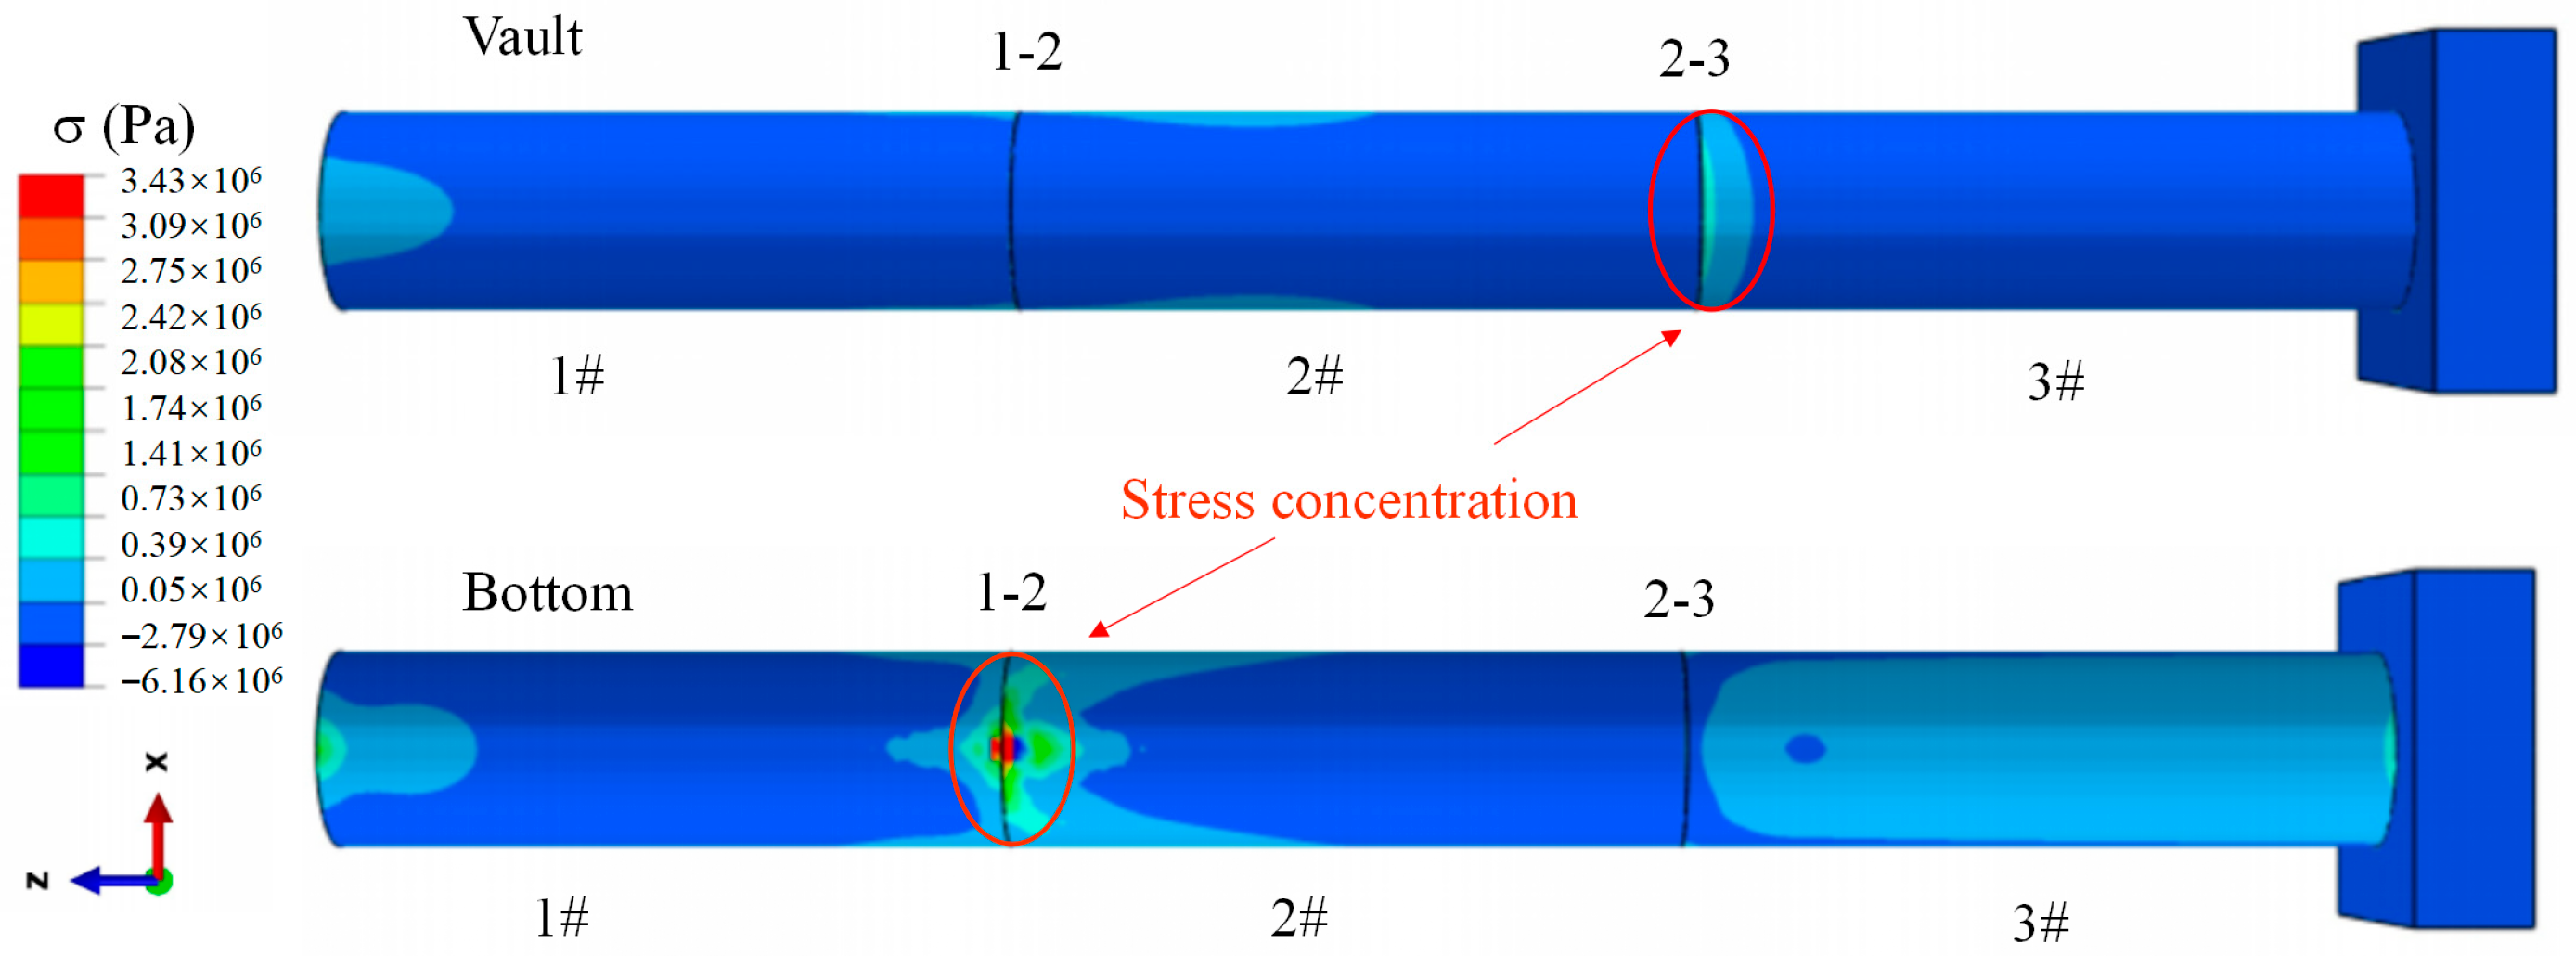
To further verify the reliability of the indoor deflection test results, a numerical model under the condition of 2° diagonal deflection was established, as shown in Figure 15. The nephogram indicates that stress concentration phenomena occur at the bottom of the 1–2 joint and the bottom of the 2–3 joint along the deflection position. This phenomenon is consistent with the findings of [57]. This stress distribution characteristic matches the pattern observed in the DIC nephogram. DIC technology provides non-contact, full-field deformation measurements with high accuracy. This further demonstrates that the method proposed in this paper for investigating and evaluating stress characteristics under deflection angles is reasonable.

5.3. Normalization Analysis

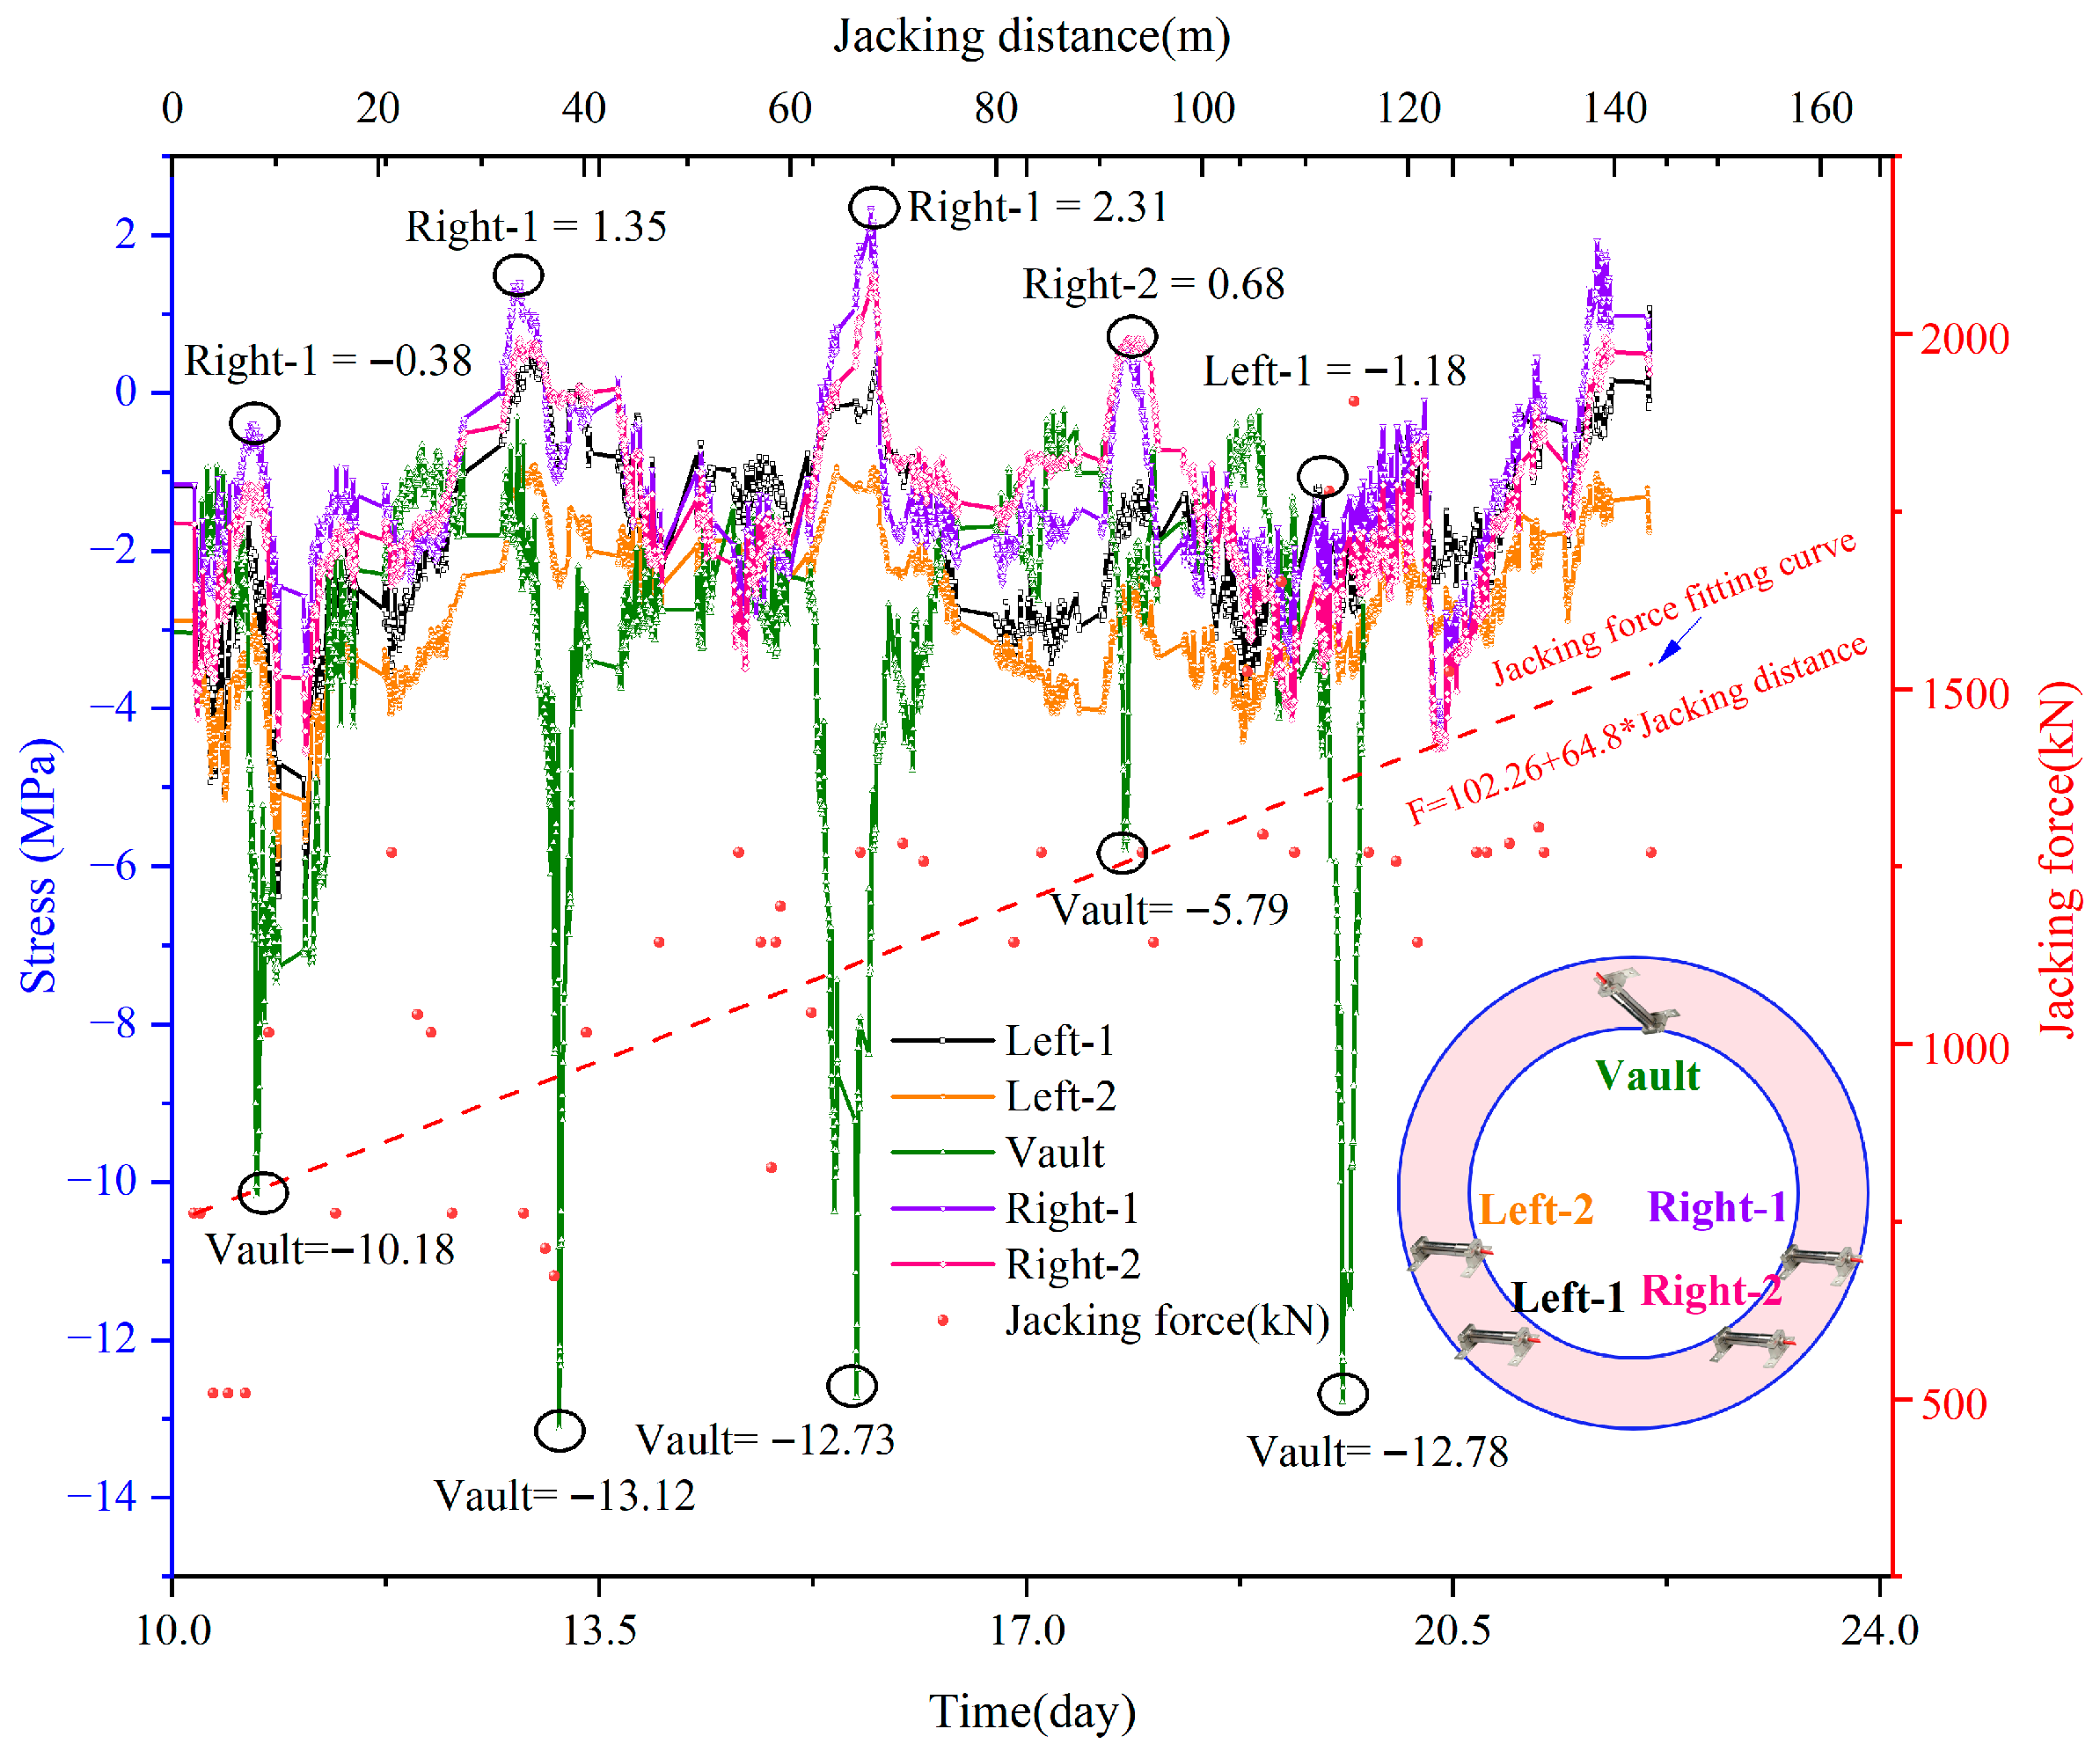
The typical stress characteristic curve is shown in Figure 16. From the perspective of stress changes, the stresses at different monitoring locations exhibit complex spatiotemporal similarity variation characteristics. For example, the stress at the top location reached −10.18 MPa during the initial construction period (approximately 10.0 days), and subsequently exhibited stress peaks at different time points (such as 13.5 days, 17.0 days, 20.5 days, etc.), among which around 13.5 days the stress dropped to −13.12 MPa, after which it fluctuated and recovered; the stress at the right-1 location also showed significant fluctuations at different time points, such as approximately 1.35 MPa around 12 days and 2.31 MPa around 17 days.
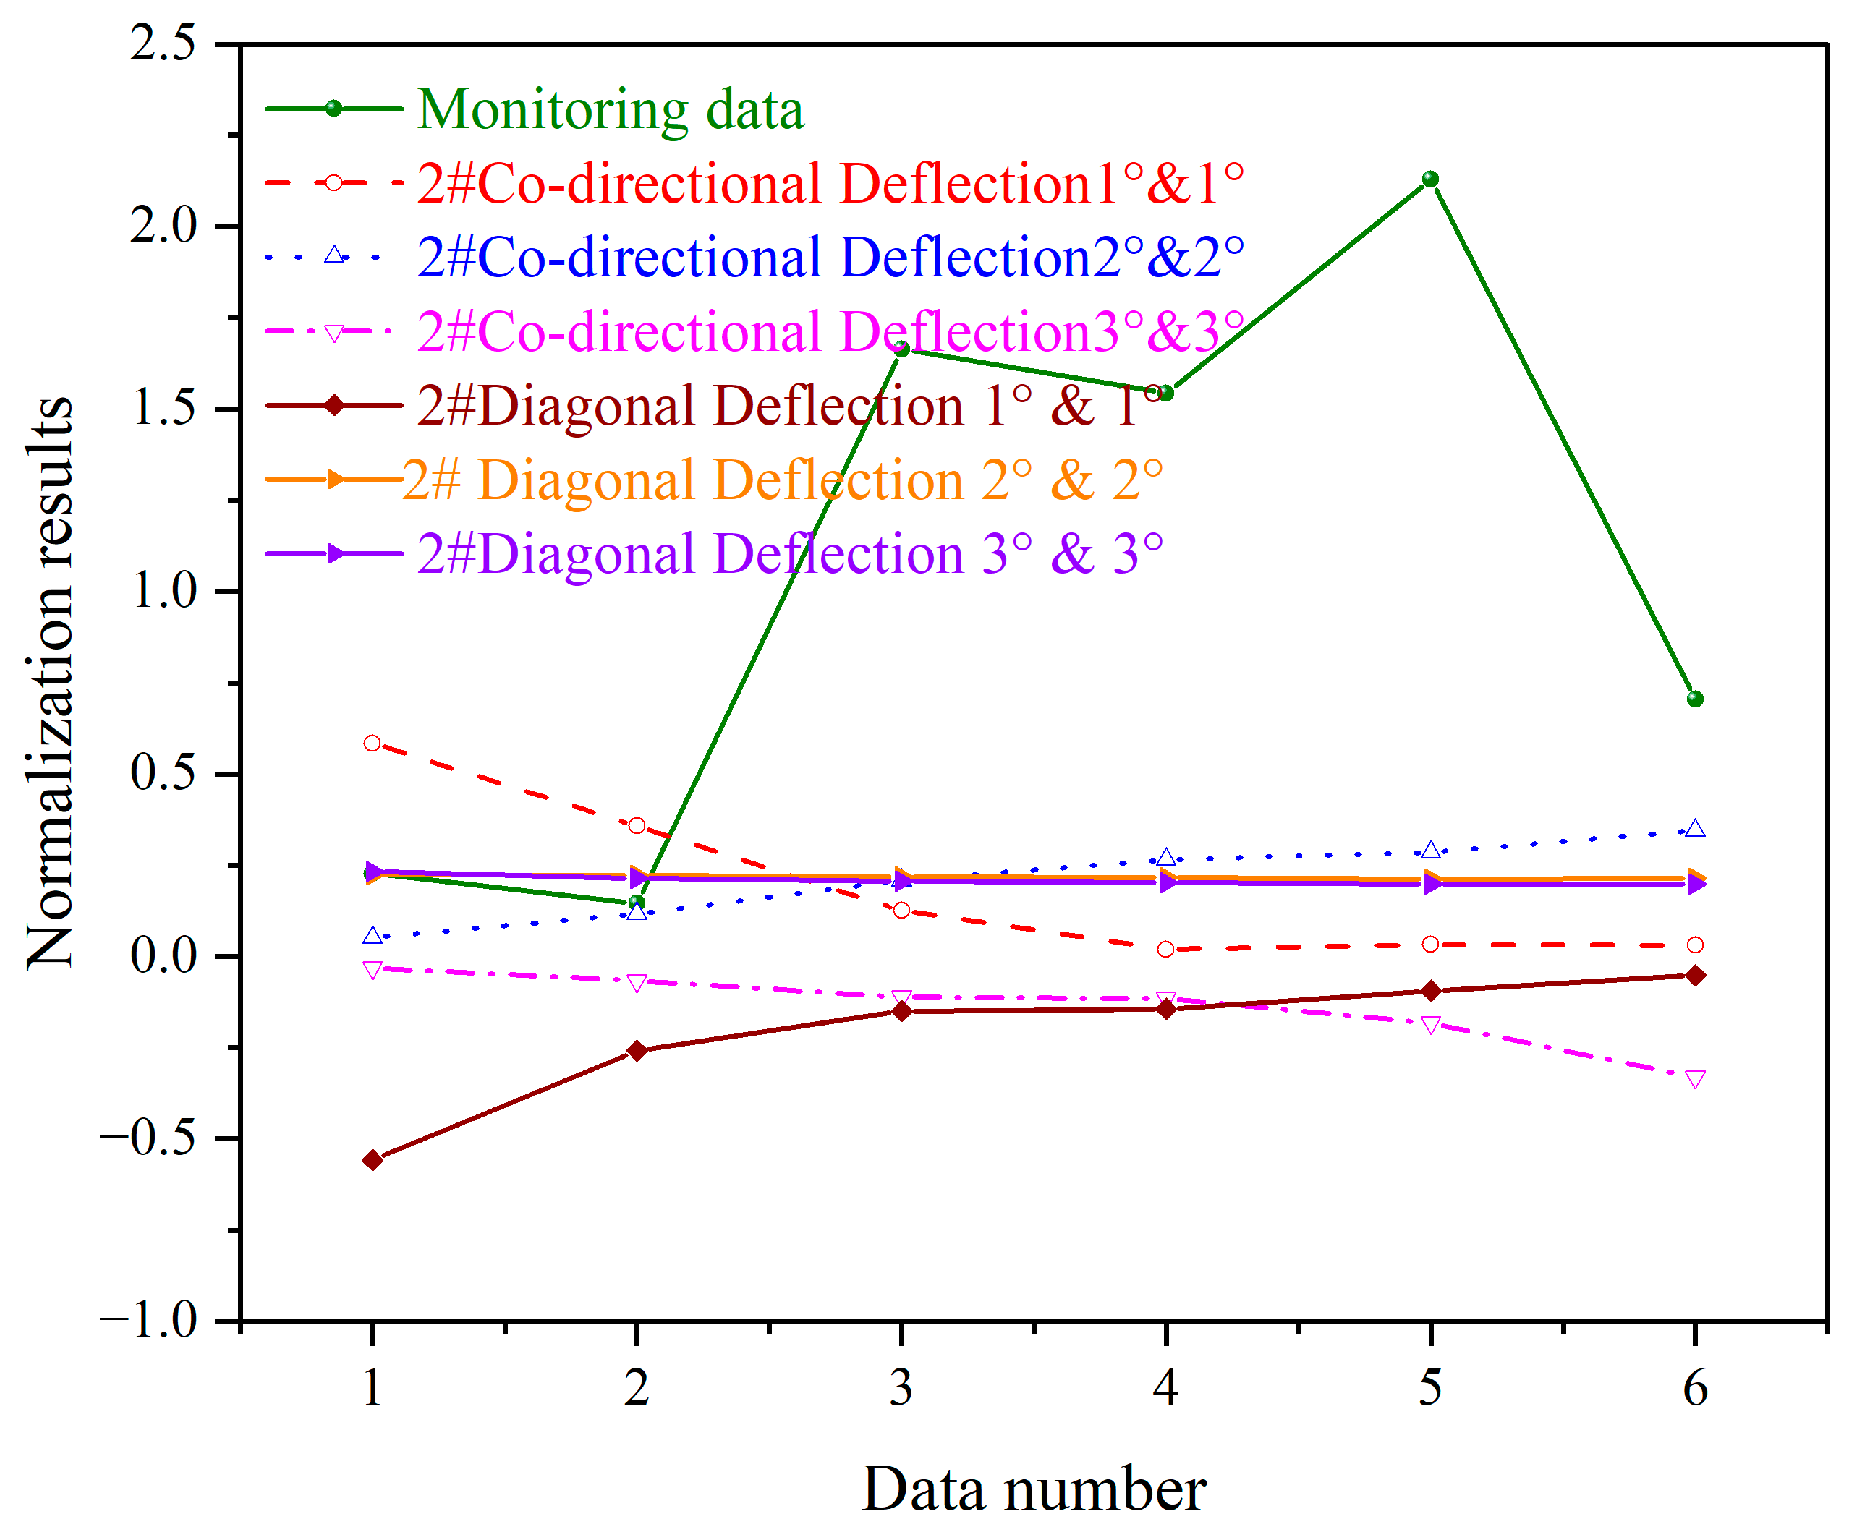
The normalized stress is defined as the ratio of the measured stress to the nominal axial stress (Equation (5)), facilitating a direct comparison between model test results and field data trends. To compare the differences in stress response between field test results and laboratory test results, denormalization analysis was adopted to reflect the variations in the test results and laboratory tests with load levels.
α = J A σ
In the formula, J is the load level, A is the cross-sectional area of pipe, σ is the stress level.
The analysis of normalization results is shown in Figure 17. Partial results regarding the normalized analysis and discussion are available in the Supplementary Materials file, “Discussion”. The normalization values range from −1 to 2.5. The normalized values of the monitoring results exhibit significant fluctuations. This reflects the complexity of field testing and the diversity of influencing factors. Both co-directional deflection and diagonal deflection remain in a relatively stable state. Their variation range is small. This to some extent reflects the reliability and repeatability of the processed laboratory test results. However, the development trends of diagonal deflection and co-directional deflection differ. Diagonal deflection tends to approach zero as the deflection angle increases. In contrast, co-directional deflection shows a trend of moving away from zero. This indicates that more stringent control methods should be adopted after the occurrence of co-directional deflection. This avoids the expansion of this unstable trend.

5.4. Analysis and Recommendations for the Mechanical Response of Pipe Jacking Structures

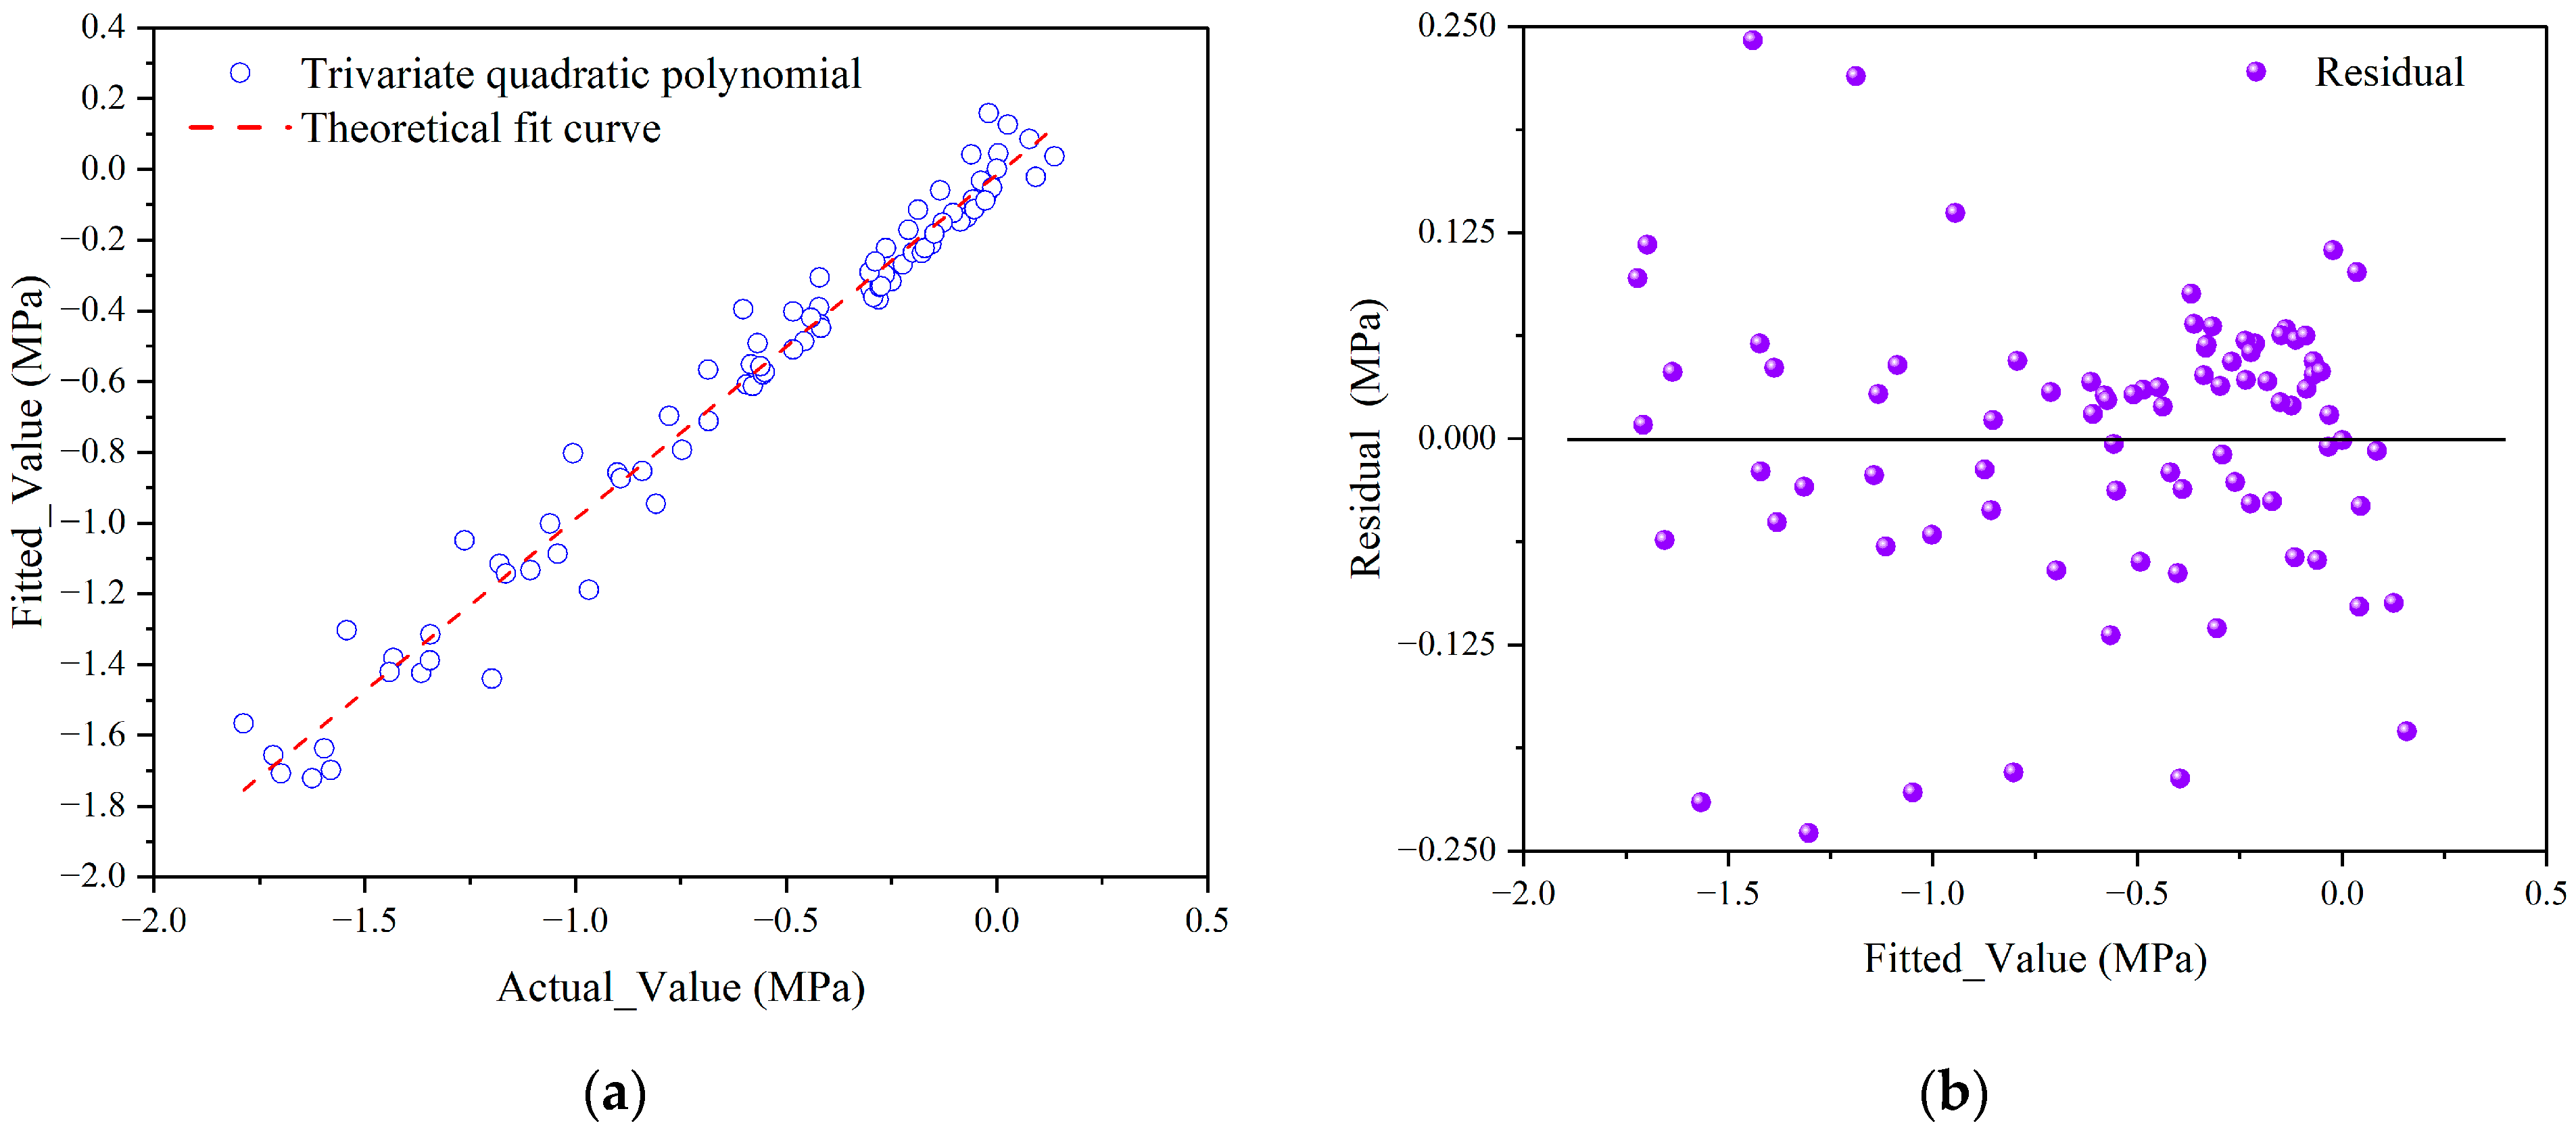
To quantify the influence of deflection angles on the stress of pipe segments, a quadratic polynomial method was adopted to perform response surface analysis on the stress of pipe segment 1# under diagonal deflection conditions.
The load level is denoted as x1, the pipe segment deflection angle as x2, the pipe segment location as x3, and the pipe segment stress as Y. The values of x1 are 1 kN, 2 kN, 3 kN, 4 kN, 5 kN, and 6 kN. The values of x2 are 0°, 0.5°, 1.0°, 1.5°, 2.0°, 2.5°, and 3.0°. The values of x3 are 90°, 135°, 180°, 225°, 270°, 315°, 0°, and 45°.
It can be seen from Figure 18 that R2 = 0.973 > 0.95, indicating a good fit. The fitted equation is:
Y = β 1 x 1 + β 2 x 2 + β 3 x 3 + β 4 x 1 2 + β 5 x 2 2 + β 6 x 3 2 + β 7 x 1 x 2 + β 8 x 1 x 3 + β 9 x 2 x 3
As can be seen from Table 4, the pipe segment stress response exhibits a strong correlation with load and deflection angle, but a weak correlation with location.
Based on laboratory tests combined with field engineering and relevant experience, this study provides the following recommendations:
(1) In engineering practice, it is recommended to control the deflection angle below 1.5° whenever possible. Exceeding this angle leads to significant deterioration in stress concentration and force transmission efficiency.
(2) Construction quality control should ensure that initial defect angles remain below 60°. Testing indicates that exceeding this threshold causes a sharp deterioration in stability.
(3) The identified three-stage deformation process can be utilized for real-time adjustment of the jacking force. This ensures that the stress growth in the pipe joint remains within the linear growth stage.

6. Conclusions

A simplified indoor model test was conducted to address the issues of pipe jacking deflection and defects. The influence of segment deflection and segment defects on the structural mechanical characteristics was investigated. The main research conclusions are as follows:
(1) The stress distribution in segments is governed by the combined effect of deflection mode and jacking force, with more pronounced stress concentration under co-directional deflection. Segment stress response strongly correlates with deflection mode, angle, and load magnitude. Co-directional deflection induces a horizontal cone-shaped stress distribution with notable eccentric compression, whereas diagonal deflection generates symmetric stress concentrations along the 90–270° axis. Co-directional deflection yields higher stress due to effect superposition at sections 1-2 and 2-3, unlike the weakening effect under diagonal deflection.
(2) Segment joint deformation exhibits a three-stage evolution under loading, modulated by deflection angle and load. The data from DIC and virtual extensometers reveal three distinct deformation stages. The linear growth stage shows a linear relationship between strain and load below 2 kN. The accelerated deformation stage exhibits nonlinear strain growth between 2–4 kN with a slowing deformation rate. The deformation de-celeration stage demonstrates a slow, linear strain increase under loads exceeding 4 kN. Increased load and deflection angle amplify axial joint deformation, producing a “thick-middle, thin-edge” compression profile near the vault. Deflection angle critically influences force transfer efficiency.
(3) Segment defects—single or combined—aggravate stress non-uniformity, with defect angle and configuration dictating the stress state and stability. Single defects reduce vault stress uniformity and intensify local stress fluctuations and concentrations. For defect angles ≥ 60°, vault compressive peaks rise sharply and tensile stress at the bottom decays rapidly, impairing stability. Combined defects involving 90° bottom and varying vault angles produce distinct stress patterns; vault defects ≥45° exacerbate stress non-uniformity and peak-valley divergence across loads.
This study focused on segment behavior under deflection without considering soil–structure interaction. Subsequent research should investigate structural performance under geotechnical–structural coupling. Future work will involve full-scale concrete pipeline tests to validate the ultimate failure load and extend the research findings to practical engineering applications.

Supplementary Materials

The following supporting information can be downloaded at: https://www.mdpi.com/article/10.3390/app152312465/s1.

Author Contributions

Conceptualization, Z.L. and X.Z.; methodology, Y.Z.; software, J.C.; validation, Z.L., J.C. and H.W.; formal analysis, Z.L.; investigation, J.C.; resources, Y.Z.; data curation, H.W.; writing—original draft preparation, Z.L., X.Z., H.W. and J.C.; writing—review and editing, Z.L., Y.Z. and J.C.; visualization, H.W.; supervision, Y.Z.; project administration, Y.Z.; funding acquisition, Y.Z. All authors have read and agreed to the published version of the manuscript.

Funding

This research was funded by Southwest Municipal Engineering Design & Research Institute of China Limited Project (2023GH-JSHZ-01).

Institutional Review Board Statement

Not applicable.

Informed Consent Statement

Not applicable.

Data Availability Statement

The data presented in this study are available on request from the corresponding author. The data is not publicly available due to the ongoing project assessment restrictions.

Acknowledgments

We acknowledge for the support from the Southwest Municipal Engineering Design & Research Institute of China Limited Project (2023GH-JSHZ-01).

Conflicts of Interest

The authors declare no conflicts of interest.

References

  1. Ong, D.E.L.; Barla, M.; Cheng, J.W.C.; Choo, C.S.; Sun, M.; Peerun, M.I. Sustainable Pipe Jacking Technology in the Urban Environment: Recent Advances and Innovations; Springer: Singapore, 2022. [Google Scholar] [CrossRef]
  2. Thakre, G.; Kaushal, V.; Karkhanis, E.; Najafi, M. A Data-Driven Visualization Approach for Life-Cycle Cost Analysis of Open-Cut and Trenchless CIPP Methods for Sanitary Sewers: A PRISMA Systematic Review. Appl. Sci. 2025, 15, 1765. [Google Scholar] [CrossRef]
  3. Wang, L.; Chen, X.; Su, D.; Liu, S.; Liu, X.; Jiang, S.; Gao, H.; Yang, W. Mechanical performance of a prefabricated subway station structure constructed by twin closely-spaced rectangular pipe-jacking boxes. Tunn. Undergr. Space Technol. 2023, 135, 105062. [Google Scholar] [CrossRef]
  4. Zhang, X.; Fang, H.; Hu, Q.; Ma, B.; Hu, S.; Du, M.; Du, X.; Yang, K.; Li, B.; Shi, M. Mechanical performance of corroded reinforced concrete pipelines rehabilitated with sprayed-on cementitious liners subjected to combined loads. Tunn. Undergr. Space Technol. 2022, 120, 104266. [Google Scholar] [CrossRef]
  5. Zhen, L.; Chen, J.-J.; Qiao, P.; Wang, J.-H. Analysis and remedial treatment of a steel pipe-jacking accident in complex underground environment. Eng. Struct. 2014, 59, 210–219. [Google Scholar] [CrossRef]
  6. Feng, X.; Zhang, P.; Chen, X.; Zhang, Y.; Ma, B.; Liu, K.; Xu, T.; Zeng, C. Field mechanical properties of large section concrete pipes during jacking in fractured moderately weathered siltstone. Tunn. Undergr. Space Technol. 2023, 131, 104818. [Google Scholar] [CrossRef]
  7. Chen, Q.; Ni, P.; Qin, X. Numerical investigation on failure modes of bell-spigot jointed ductile iron pipelines subjected to dip-slip faults with different dip angles. Tunn. Undergr. Space Technol. 2023, 133, 104982. [Google Scholar] [CrossRef]
  8. Yu, B.; Shimada, H.; Sasaoka, T.; Hamanaka, A.; Matsumoto, F.; Morita, T. A jacking force study based on interpretation of box jacking records: A case study of curved rectangular box jacking in soft soil in Saitama, Japan. Tunn. Undergr. Space Technol. 2023, 139, 105228. [Google Scholar] [CrossRef]
  9. Becerril García, D.; Moore, I.D. Behaviour of bell and spigot joints in buried reinforced concrete pipelines. Can. Geotech. J. 2014, 52, 609–625. [Google Scholar] [CrossRef]
  10. Ma, P.; Zhao, Y.; Song, Z.; Shimada, H.; Zhou, H.; Ma, B. Experimental Study and Performance Comparison of Different Jacking Pipes under the Effects of Concentrated Loads. J. Pipeline Syst. Eng. Pract. 2025, 16, 04025054. [Google Scholar] [CrossRef]
  11. Zheng, S.; Wang, C.; Luo, Z.; Zhang, Y.; Chen, J.; Li, X. Factors Influencing Pipe Stress Responses in Pipe Jacking in Bedrock: Field Monitoring and Numerical Simulation. J. Pipeline Sci. Eng. 2025; 100320, in press. [Google Scholar] [CrossRef]
  12. Nyrkova, L. Stress-corrosion cracking of pipe steel under complex influence of factors. Eng. Fail. Anal. 2020, 116, 104757. [Google Scholar] [CrossRef]
  13. Li, B.; Wang, F.; Fang, H.; Yang, K.; Zhang, X.; Ji, Y. Experimental and numerical study on polymer grouting pretreatment technology in void and corroded concrete pipes. Tunn. Undergr. Space Technol. 2021, 113, 103842. [Google Scholar] [CrossRef]
  14. Becerril García, D.; Moore, I.D.; Cortés-Pérez, J. Modeling and Parametric Study of Gasketed Bell and Spigot Joint in Buried RC Pipeline. J. Pipeline Syst. Eng. Pract. 2019, 10, 04019015. [Google Scholar] [CrossRef]
  15. Zhang, P.; Behbahani, S.S.; Ma, B.; Iseley, T.; Tan, L. A jacking force study of curved steel pipe roof in Gongbei tunnel: Calculation review and monitoring data analysis. Tunn. Undergr. Space Technol. 2018, 72, 305–322. [Google Scholar] [CrossRef]
  16. Wang, L.; Wu, Z.; Chen, Y.; Wang, Z.; Yan, C.; Tong, T. Pipe for Pipe Jacking. Technology Standard of Pipe Jacking; Springer Nature: Singapore, 2024; pp. 23–59. [Google Scholar]
  17. DeGrande, V.; Nervik, A.; Fogg, D.; Mah, R. Fabrication of Large-Diameter, Thick-Walled Pipe to Meet Special Fault-Crossing Design Requirements for San Francisco Hetch Hetchy Water System. Pipelines 2013, 576–587. [Google Scholar] [CrossRef]
  18. Ong, D.E.L.; Barla, M.; Cheng, J.W.-C.; Choo, C.S.; Sun, M.; Peerun, M.I. Deep Shaft Excavation: Design, Construction, and Their Challenges. Sustainable Pipe Jacking Technology in the Urban Environment: Recent Advances and Innovations; Springer: Singapore, 2022; pp. 103–145. [Google Scholar]
  19. Wang, L.; Chen, X.; Su, D.; Zhou, W.; Sun, B.; Pan, J.; Wu, Y.; Feng, M. Construction of a super-large prefabricated rectangular tunnel beneath a box culvert using pipe jacking: A case study. Tunn. Undergr. Space Technol. 2024, 152, 105913. [Google Scholar] [CrossRef]
  20. Hu, F.; Yang, T.; Adagunodo, T.A.; Zhu, D.; Huang, R. Practice and theoretical analysis of ground penetrating radar in voids detection of urban underground pipe-jacking. J. Appl. Geogr. 2025, 233, 105639. [Google Scholar] [CrossRef]
  21. Lin, Y.; Qiu, H.; He, Y.; Huang, R.; Wei, J.; Zhou, W. Current Status of Inspection and Repair of Difficult Drainage Pipelines in China. J. Pipel. Syst. Eng. Pract. 2024, 15, 03124002. [Google Scholar] [CrossRef]
  22. Su, D.; Chen, J.; Chen, P.; Wang, L.; Zhou, J.; Chen, X. Real-time attitude control of large rectangular pipe-jacking machines using a mechanics-informed digital twin. Autom. Constr. 2025, 177, 106373. [Google Scholar] [CrossRef]
  23. Qiu, D.; Wang, L.; Zu, Y.; Qing, Y. The Development of the Pipe Jacking Guidance Technology. Appl. Sci. 2025, 15, 2137. [Google Scholar] [CrossRef]
  24. Xu, Y.; Xu, C.; Zhang, C.; Zhang, X. Experimental and numerical study on the mechanical properties of F type socket joints for rectangular pipe jacking with steel screw connection. Sci. Rep. 2024, 14, 30952. [Google Scholar] [CrossRef]
  25. Wang, X.; Zhao, Y.; Ariaratnam, S.T.; Yan, X. Study on the impact of ovality defect on structural stability of CIPP liner of drainage pipeline. Tunn. Undergr. Space Technol. 2023, 140, 105338. [Google Scholar] [CrossRef]
  26. Arumugam, T.; Vijaya Kumar, S.D.; Karuppanan, S.; Ovinis, M. The Influence of Axial Compressive Stress and Internal Pressure on a Pipeline Network: A Review. Appl. Sci. 2023, 13, 3799. [Google Scholar] [CrossRef]
  27. Faisal, A.; Abbas, S.; Ahmed, A. Mechanical performance of spun-cast full-scale precast pipes incorporating hybrid conventional rebar cage and steel fibers. Structures 2023, 52, 104–116. [Google Scholar] [CrossRef]
  28. Zhai, K.; Fang, H.; Fu, B.; Wang, F.; Hu, B. Mechanical response of externally bonded CFRP on repair of PCCPs with broken wires under internal water pressure. Constr. Build. Mater. 2020, 239, 117878. [Google Scholar] [CrossRef]
  29. Li, B.; Fang, H.; Zhang, X.; Yang, K.; Dong, B.; Pang, G.; Zhai, K. Prediction model for maximum shear displacement of pipe joints with preexisting defects based on finite element–multiple nonlinear regression method. Struct. Concr. 2021, 22, 3727–3745. [Google Scholar] [CrossRef]
  30. Zhou, H.; Huang, S.; Ma, B.; Zhao, Y.; Tan, X.; Zhang, H. Prestressed steel wires impact on axial bearing capacity of ultra-large section jacking prestressed concrete cylinder pipe (JPCCP): Field experiment and simulation. Eng. Fail. Anal. 2025, 167, 109046. [Google Scholar] [CrossRef]
  31. Shen, Y.; Ling, J.; Lu, X.; Zhang, Y.; Yan, Z. Steel wire prestress analysis of large section jacking prestressed concrete cylinder pipe (JPCCP): Site experiment and numerical investigation. Thin-Walled Struct. 2023, 184, 110420. [Google Scholar] [CrossRef]
  32. Jibreen, A.; Najafi, M.; Aljaberi, M.; Mohammadagha, M. Study of Rehabilitation of Broken Wires in Prestressed Concrete Cylinder Pipe (PCCP) and Its Effect on the Structural Continuity of the Pipe. Pipelines 2025, 82–90. [Google Scholar] [CrossRef]
  33. Dong, X.; Dou, T.; Dong, P.; Su, Y.; Li, Y.; Ning, J.; Wei, J.; Li, K.; Cheng, B. Experimental study on the influence of scattered broken wires on the structural performance of prestressed concrete cylinder pipe. Structures 2023, 47, 52–62. [Google Scholar] [CrossRef]
  34. Fang, H.; Tan, P.; Du, X.; Li, B.; Yang, K.; Zhang, Y. Mechanical response of buried HDPE double-wall corrugated pipe under traffic-sewage coupling load. Tunn. Undergr. Space Technol. 2021, 108, 103664. [Google Scholar] [CrossRef]
  35. Zhai, K.; Zhang, C.; Fang, H.; Ma, H.; Ni, P.; Wang, F.; Li, B.; He, H. Mechanical responses of bell-and-spigot joints in buried prestressed concrete cylinder pipe under coupled service and surcharge loads. Struct. Concr. 2021, 22, 827–844. [Google Scholar] [CrossRef]
  36. Rakitin, B.; Xu, M. Centrifuge testing to simulate buried reinforced concrete pipe joints subjected to traffic loading. Can. Geotech. J. 2015, 52, 1762–1774. [Google Scholar] [CrossRef]
  37. Wu, H.; Zhai, K.; Fang, H.; Wang, F.; Yu, X.; Li, B. Bell-and-spigot joints mechanical properties study of PCCP under the uneven settlement of foundation: Simulation and full-scale test. Structures 2022, 43, 1692–1703. [Google Scholar] [CrossRef]
  38. Batsaikhan, U.; Hashikawa, H.; Shimada, H.; Sasaoka, T.; Hamanaka, A. Numerical Study on the Applicability of the Pipe-Jacking Method for the Main Gate of an Underground Coal Mining in Weak Rock Mass. Appl. Sci. 2022, 12, 1719. [Google Scholar] [CrossRef]
  39. Chen, Q.; Ni, P. Three-dimensional modeling of joint kinematic of ductile iron pipelines subjected to normal faulting. Tunn. Undergr. Space Technol. 2023, 132, 104863. [Google Scholar] [CrossRef]
  40. Kalisz, P.; Zięba, M. Influence of Soil Deformation Caused by Mining on Sewage Pipelines Built Using the Pipe Jacking Method. Stud. Geotech. Mech. 2018, 40, 147–153. [Google Scholar] [CrossRef]
  41. Ye, M.; Ni, P.; Maitra, S. Response of flexible pipes buried in sand under multi-directional movement: Understanding fault-pipeline interaction. Soil Dyn. Earthq. Eng. 2024, 187, 108978. [Google Scholar] [CrossRef]
  42. Robert, D.J.; Rajeev, P.; Kodikara, J.; Rajani, B. Equation to predict maximum pipe stress incorporating internal and external loadings on buried pipes. Can. Geotech. J. 2016, 53, 1315–1331. [Google Scholar] [CrossRef]
  43. Chen, Y.; Li, J.; Chen, Q.; Lin, C.; Ni, P.; Lu, Z. Simplified analytical method for bell-spigot jointed pipeline response to normal faults using two-layer Winkler foundation model. Tunn. Undergr. Space Technol. 2026, 168, 107063. [Google Scholar] [CrossRef]
  44. Lin, W.; Li, P.; Xie, X. A Novel Detection and Assessment Method for Operational Defects of Pipe Jacking Tunnel Based on 3D Longitudinal Deformation Curve: A Case Study. Sensors 2022, 22, 7648. [Google Scholar] [CrossRef]
  45. Liu, W.; Tan, J.; Shi, J.; Huang, X.; Chen, W. A Method for calculating jacking force of parallel pipes considering Soil Arching Effect and Pipe-Slurry-Soil Interaction. Comput. Geotech. 2024, 173, 106528. [Google Scholar] [CrossRef]
  46. Zhang, Y.; Tao, L.; Zhao, X.; Liu, J.; Liao, W.; Guo, F.; Yang, X.; Zhong, R. Analytical model of vertical load acting on jacked pipe considering soil arching effect in cohesionless soil. Undergr. Space 2024, 14, 263–284. [Google Scholar] [CrossRef]
  47. Sheil, B. Prediction of microtunnelling jacking forces using a probabilistic observational approach. Tunn. Undergr. Space Technol. 2021, 109, 103749. [Google Scholar] [CrossRef]
  48. Sheil, B.B.; Suryasentana, S.K.; Templeman, J.O.; Phillips, B.M.; Cheng, W.-C.; Zhang, L. Prediction of Pipe-Jacking Forces Using a Bayesian Updating Approach. J. Geotech. Geoenviron. Eng. 2022, 148, 04021173. [Google Scholar] [CrossRef]
  49. Zhang, Y.; Zhang, P.; Xu, Y.; Mei, J. Model Test on Excavation Face Stability of Shallow-Buried Rectangular Pipe Jacking in Sand Layer. Appl. Sci. 2025, 15, 7847. [Google Scholar] [CrossRef]
  50. Tang, J.; Xu, J.; Zhou, D.; Huang, D.; Zeng, K.; Li, Y.; Chen, Z. Ground Surface Deformation Caused by Pipe Jacking Construction in a Soft Soil Area: An Experiment-Based Study. Buildings 2023, 13, 1628. [Google Scholar] [CrossRef]
  51. Shahin, H.M.; Nakai, T.; Ishii, K.; Iwata, T.; Kuroi, S. Investigation of influence of tunneling on existing building and tunnel: Model tests and numerical simulations. Acta Geotech. 2016, 11, 679–692. [Google Scholar] [CrossRef]
  52. Guo, W.; Feng, K.; Lu, X.; Qi, M.; Liu, X.; Fang, Y.; He, C.; Xiao, M. Model test investigation on the longitudinal mechanical property of shield tunnels considering internal structure. Tunn. Undergr. Space Technol. 2023, 140, 105293. [Google Scholar] [CrossRef]
  53. Ashoor, F.; Abdollahipour, A.; Khosravi, M.H. Numerical and experimental analysis of contact pressure in rock-disc cutter interaction using displacement discontinuity method and digital image correlation. Transp. Geotech. 2025, 52, 101583. [Google Scholar] [CrossRef]
  54. Peshave, A.; Pierron, F.; Lava, P.; Moens, D.; Vandepitte, D. Practical Uncertainty Quantification Guidelines for DIC-Based Numerical Model Validation. Exp. Tech. 2025, 49, 437–457. [Google Scholar] [CrossRef]
  55. Huang, X.; Li, S.; Zhu, G.; Xu, D.; Feng, Z. Internal Pressure Drives Tensile-to-Shear Transition in Time-Dependent Failure of Deep-Buried Pressurized Tunnels: An AE–DIC Physical Modeling. Rock Mech. Rock Eng. 2025, 1–24. [Google Scholar] [CrossRef]
  56. Dong, X.; Dou, T.; Dong, P.; Wang, Z.; Li, Y.; Ning, J.; Wei, J.; Li, K.; Cheng, B. Failure experiment and calculation model for prestressed concrete cylinder pipe under three-edge bearing test using distributed fiber optic sensors. Tunn. Undergr. Space Technol. 2022, 129, 104682. [Google Scholar] [CrossRef]
  57. Liu, K.; Chen, X.; Zhang, P.; Ma, B.; Feng, X.; Zhang, Y.; Liu, H.; Tan, X.; Xu, T. Axial mechanical response of concrete pipe jacking considering the deflection of the bell-and-spigot joint: Full-scale test and numerical simulation. Tunn. Undergr. Space Technol. 2024, 149, 105805. [Google Scholar] [CrossRef]
  58. Li, C.; Zhong, Z.; Bie, C.; Liu, X. Field performance of large section concrete pipes cracking during jacking in Chongqing—A case study. Tunn. Undergr. Space Technol. 2018, 82, 568–583. [Google Scholar] [CrossRef]
  59. Kiriella, S.; Manalo, A.; Tien, C.M.T.; Ahmadi, H.; Wham, B.P.; Salah, A.; Tafsirojjaman, T.; Karunasena, W.; Dixon, P.; O’Rourke, T.D. Lateral deformation behaviour of structural internal replacement pipe repair systems. Compos. Struct. 2023, 319, 117144. [Google Scholar] [CrossRef]
  60. Zhao, Y.; Ma, P.; Chen, Y.; Liu, K.; Yan, X.; Ma, B.; Wang, F. Stability assessment of CIPP liner under varied boundary conditions: A theoretical and simulation study. Results Eng. 2024, 22, 102187. [Google Scholar] [CrossRef]
  61. Zhao, Y.; Ma, B.; Ariaratnam, S.T.; Zeng, C.; Yan, X.; Wang, F.; Wang, T.; Zhu, Z.; He, C.; Shi, G.; et al. Structural performance of damaged rigid pipe rehabilitated by centrifugal spray on mortar liner. Tunn. Undergr. Space Technol. 2021, 116, 104117. [Google Scholar] [CrossRef]
  62. Deng, Z.; Liu, X.; Zhou, X.; Yang, Q.; Chen, P.; de la Fuente, A.; Ren, L.; Du, L.; Han, Y.; Xiong, F.; et al. Main engineering problems and countermeasures in ultra-long-distance rock pipe jacking project: Water pipeline case study in Chongqing. Tunn. Undergr. Space Technol. 2022, 123, 104420. [Google Scholar] [CrossRef]
  63. Zare, M.R.; Iseley, D.T.; Najafi, M. Trenchless Limitations on Postearthquake Repair and Rehabilitation of Unpressurized Networks: Christchurch, New Zealand. J. Pipeline Syst. Eng. Pract. 2019, 10, 05019002. [Google Scholar] [CrossRef]
  64. Jia, P.; Guan, Y.; Lu, B.; Zhao, W.; Bai, Q.; Du, X. Flexural performance of steel tube roof slab and parameter optimization. Case Stud. Constr. Mater. 2023, 18, e01726. [Google Scholar] [CrossRef]
  65. Sterling, R.L. Developments and research directions in pipe jacking and microtunneling. Undergr. Space. 2020, 5, 1–19. [Google Scholar] [CrossRef]
  66. GB/T 11836-2009; Concrete and Reinforced Concrete Sewer Pipes. Standardization Administration of China: Beijing, China, 2009.
  67. Hebert, J.; Khonsari, M. The application of digital image correlation (DIC) in fatigue experimentation: A review. Fatigue Fract. Eng. Mater. Struct. 2023, 46, 1256–1299. [Google Scholar] [CrossRef]
  68. Huang, F.; Wu, C.; Ni, P.; Wan, G.; Zheng, A.; Jang, B.-A.; Karekal, S. Experimental analysis of progressive failure behavior of rock tunnel with a fault zone using non-contact DIC technique. Int. J. Rock Mech. Min. Sci. 2020, 132, 104355. [Google Scholar] [CrossRef]
  69. Zaletelj, K.; Slavič, J.; Boltežar, M. Full-field DIC-based model updating for localized parameter identification. Mech. Syst. Signal Process. 2022, 164, 108287. [Google Scholar] [CrossRef]
Figure 1. Plan and profile of the Meixi Lake sewage pipe jacking construction section.
Applsci 15 12465 g001
Figure 2. Structural damage and failure phenomena on construction.
Applsci 15 12465 g002
Figure 3. Indoor deflection test system for pipe jacking.
Applsci 15 12465 g003
Figure 5. Monitoring point layout diagram.
Applsci 15 12465 g005
Figure 7. Segment defect stress test.
Applsci 15 12465 g007
Figure 8. Axial stress distribution diagram at the mid-point of the pipe segment under co-directional deflection: (a) 0° & 0°, Segment 1#; (b) 0° & 0°, Segment 2#; (c) 0° & 0°, Segment 3#; (d) 1° & 1°, Segment 1#; (e) 1° & 1°, Segment 2#; (f) 1° & 1°, Segment 3#; (g) 2° & 2°, Segment 1#; (h) 2° & 2°, Segment 2#; (i) 2° & 2°, Segment 3#; (j) 3° & 3°, Segment 1#; (k) 3° & 3°, Segment 2#; (l) 3° & 3°, Segment 3#.
Applsci 15 12465 g008aApplsci 15 12465 g008b
Figure 9. Axial strain distribution diagram at the mid-point of the pipe segment under diagonal deflection: (a) 1° & 1° combination: Segment #1; (b) 1° & 1° combination: Segment #2; (c) 1° & 1° combination: Segment #3; (d) 2° & 2° combination: Segment #1; (e) 2° & 2° combination: Segment #2; (f) 2° & 2° combination: Segment #3; (g) 3° & 3° combination: Segment #1; (h) 3° & 3° combination: Segment #2; (i) 3° & 3° combination: Segment #3.
Applsci 15 12465 g009
Figure 10. Strain curve at the midpoint of the vault compression zone.
Applsci 15 12465 g010
Figure 11. Cloud diagram of axial strain distribution at DIC measurement point DS1: (a) 0.5°; (b) 1°; (c) 1.5°; (d) 2.0°.
Applsci 15 12465 g011
Figure 12. Mechanical characteristics of the segment structure under single defect conditions: (a) Vault stress of segment #2 with 0° defect. (b) Bottom stress of segment #2 with 0° defect. (c) Vault stress of segment #2 with bottom 30° defect. (d) Bottom stress of segment #2 with bottom 30° defect. (e) Vault stress of segment #2 with bottom 45° defect. (f) Bottom stress of segment #2 with bottom 45° defect. (g) Vault stress of segment #2 with bottom 60° defect. (h) Bottom stress of segment #2 with bottom 60° defect. (i) Vault stress of segment #2 with bottom 75° defect. (j) Bottom stress of segment #2 with bottom 75° defect. (k) Vault stress of segment #2 with bottom 90° defect. (l) Bottom stress of segment #2 with bottom 90° defect.
Applsci 15 12465 g012aApplsci 15 12465 g012b
Figure 13. Mechanical characteristics of the segment structure under combined defect conditions: (a) Vault stress of segment #2 with bottom 90° & vault 30° defects. (b) Bottom stress of segment #2 with bottom 90° & vault 30° defects. (c) Vault stress of segment #2 with bottom 90° & vault 45° defects. (d) Bottom stress of segment #2 with bottom 90°& vault45° defects. (e) Vault stress of segment #2 with bottom 90° & vault 60° defects. (f) Bottom stress of segment #2 with bottom 90° & vault 60° defects. (g) Vault stress of segment #2 with bottom 90° & vault 75° defects. (h) Bottom stress of segment #2 with bottom 90° & vault 75° defects. (i) Vault stress of segment #2 with bottom 90° & vault 90° defects. (j) Bottom stress of segment #2 with bottom 90° & vault 90° defects.
Applsci 15 12465 g013aApplsci 15 12465 g013b
Figure 14. Comparison of theoretical values with indoor test results.
Applsci 15 12465 g014
Figure 15. Distribution pattern of diagonal deflection stress nephogram.
Applsci 15 12465 g015
Figure 16. The typical stress characteristic curve on monitoring.
Applsci 15 12465 g016
Figure 17. Normalized Analysis of Results.
Applsci 15 12465 g017
Figure 18. Deflection Stress Fitting Analysis: (a) Analysis of Trivariate Quadratic Polynomial Fitting Effectiveness; (b) Residual Analysis Plot.
Applsci 15 12465 g018
Table 1. Test condition settings for segment deflection.
Test Condition Deflection Angle
Co-directional Deflectionα0.51.01.52.02.53.0
β0.5~3.00.5~3.00.5~3.00.5~3.00.5~3.00.5~3.0
Diagonal Deflectionα′0.51.01.52.02.53.0
β′0.51.01.52.02.53.0
Table 2. Test condition settings for segment defect.
Test ConditionsCentral Angle/°Defect Location
Defect Angles 3045607590
Scope of Defects 8.33%12.5%16.7%20.8%25%
Single Defect Angle θ 3045607590Vault
Combined Defect Angle θ 9090909090Vault &
η 3045607590Bottom
Table 3. The difference between the measured stress and the theoretical value.
Load /kNTheoretical Values/MPa1# 90°Testing/MPa1# 135°Testing/MPa 1# 180°Testing/MPa
1−0.20 −0.22 −0.25 −0.22
2−0.40 −0.46 −0.46 −0.35
3−0.60 −0.68 −0.65 −0.45
4−0.80 −0.81 −0.74 −0.47
5−0.99 −0.97 −0.88 −0.57
6−1.19 −1.20 −1.09 −0.75
Average error rate (%)06.743.73−24.27
Error rate = (Testing − Theoretical)/Theoretical. The average error rate represents the average result across different load levels.
Table 4. Fitting Parameters and Values.
Fitting Parameters β 1 β 2 β 3 β 4 β 5 β 6 β 7 β 8 β 9
Values−0.296−0.106−0.001−0.0040.0750.000008−0.0230.01−0.0005
Disclaimer/Publisher’s Note: The statements, opinions and data contained in all publications are solely those of the individual author(s) and contributor(s) and not of MDPI and/or the editor(s). MDPI and/or the editor(s) disclaim responsibility for any injury to people or property resulting from any ideas, methods, instructions or products referred to in the content.