Article

Moisture Behaviour of Glulam Made from Mixed Species

Department of Wood Processing and Design of Wooden Products, Faculty of Furniture Design and Wood Engineering, Transilvania University of Brasov, 500036 Brasov, Romania
*
Author to whom correspondence should be addressed.
Appl. Sci. 2025, 15(23), 12432; https://doi.org/10.3390/app152312432
Submission received: 24 October 2025 / Revised: 17 November 2025 / Accepted: 21 November 2025 / Published: 24 November 2025

Abstract

The objective of this study was to determine the moisture content gradient over the thickness of glued laminated timber structures, manufactured as five-layer structures from two different species. Beech (Fagus sylvatica L.) or oak (Quercus robur L.) were used for the faces, and fir (Abies alba Mill.) or lime (Tilia cordata L.) were used for the core layers. Thus, four types of mixed glulam structures resulted. The layers were glued with a polyurethane adhesive for outdoor uses, and then cold-pressed. Samples were also prepared from each individual species as control specimens. All samples were exposed to two types of climate conditions, having cyclic and constant parameters. The first climate test involved cyclic variation in temperature and relative air humidity: 30 °C/40%/12 h, alternating with 10 °C/80%/12 h. The second climate test involved constant exposure conditions, but with higher humidity over a longer period: 15 °C/90%/3 weeks. The moisture content gradient between the layers of the structure was determined and correlated to the delamination effect, assessed by visual analysis. Based on the findings in this work, the lowest values of the moisture gradient were determined for the oak–fir mixed structures, resulting in the total absence of delamination and cracks between the outer oak layers and the inner fir layers.

1. Introduction

Glulam (glued laminated timber—GLT) is a structural engineered product made of solid wood layers with parallel grain orientation to the product length, glued together on their faces with a moisture-resistant adhesive. Such a configuration results in a multi-layer beam-type structure, with characteristics that make it useful as a raw material for structural elements. Glulam is used in most types of construction, namely in columns, beams, arches of medium and large buildings, bridges, canopies, and pavilions. Glulam has excellent advantages regarding its strength, stability, and different length options that facilitate design flexibility [1], as well as from the viewpoint of sustainability. It allows the use of smaller trees to create large beams, it reduces construction time and costs because of the prefabrication process, it is durable, it requires low maintenance, and it does not require covering with other materials as it is aesthetically pleasing.
The growing concern for the environment and the multiple benefits of using mass timber are leading to an increase in the use of wood in construction applications [2].
Glulam markets have continued to grow as more residential constructions are adopting the use of this material. The world production of glulam was around 7 million m3 in 2023 [3].
Europe remains the largest regional industry with a 47% global industry share in 2024, due to Austria, Germany, and countries in the Nordic area having high glulam production volumes and decades-old policy support. It is followed by North America at 28%, because of advantages created by the increasing adoption of the Type IV solid wood construction code [4].
Glulam beams have high mechanical strength. The most common classes are GL24, GL28, and GL32. Laminated beams generally have a strength similar to the wood from which they are made.
The durability of the glulam beams should be considered related to the durability of the solid wood they are made from. The species generally used for glulam are softwoods (especially spruce and pine) because they have low density, fast growth rate, good workability, and low price [5].
Hardwoods have been introduced into glulam production in a smaller proportion. According to a previous study [6], forming durable bonds with hardwoods is a challenging task in comparison to glueing softwoods. Higher wood density indicates higher cell wall thickness and lower porosity, resulting in less penetration of the adhesive, which can lead to weaker bonds [7,8].
However, there is a growing interest in using hardwoods due to their increased availability because of changes in reforestation policies, their superior mechanical properties, and the increasing costs of softwoods.
A series of studies on the application of hardwoods for the production of glulam were conducted [6,9,10,11,12]. Species like European beech (Fagus sylvatica L.), sessile oak (Quercus petraea L.), pedunculate oak (Quercus robur L.), chestnut (Castanea sativa L.), and ash (Fraxinus excelsior L.) were analysed. These studies show that the flexural strength of glulam made from European hardwood species at least equals and generally exceeds that of the highest strength classes of European softwood glulam.
As far as the dimensional stability is concerned, considering that it is made of solid wood layers kiln-dried down to a moisture content (MC) of 10 ± 2%, glulam does not change its dimensions significantly. In higher humidity conditions, it is considered that the dimensions of laminated beams change by 0.24% for a 1% change in humidity [13].
The tendency to crack is also smaller in a typical glulam than in solid wood. The presence of cracks due to wood shrinkage, because of exposure to the environment and frequent climate changes, is possible. These cracks are acceptable if they are parallel to the wood grain and have a depth of up to 15% of the beam width for lateral cracks. The cracks near the ends of glulam beams can reduce the shear strength. The shear-critical areas are at each end of a simply supported glulam beam, in a length of 3 times the beam depth, and within the middle half of the beam depth [13].
The dimensional stability of glulam is guaranteed when using a single, homogenous resinous species such as pine or spruce. However, it is also important to evaluate the behaviour of glulam made with faces and cores from different species, since these mixed glulam structures are more durable than homogeneous resinous glulam, and cheaper than homogeneous hardwood glulam. This approach allows the use of higher-strength species in the outer layers, which are subjected to higher stresses, while using lower-cost species in the core.
The main problem is adhesion when combining different wood species in the glulam structure. Glueing issues are induced mainly by the extractive content of the wood, its anatomical structure, and differences in its swelling and shrinkage coefficients. This variation in swelling and shrinkage coefficients can lead to significant internal stresses that intensify with increases in moisture gradient, the formation of cracks, and delamination of the adhesive joints [14,15]. The structural integrity and functionality of glulam members can be affected by delamination, and can also lead to safety hazards in load-bearing applications.
Generally, glulam products are exposed to extreme outdoor conditions during the transportation and installation phase on the construction site when changes in moisture content can occur. Major delamination of the finger-joint bonding in beech glulam, caused by the moisture gradient that occurred between the inner and near-surface wood layer during a three-week alternating climate regime (43% to 85% relative humidity, and 16 °C to 44 °C temperature), was reported in a previous study [16].
Wetting and drying cycles induce stresses as well as restrained and released strains in glulam, as concluded after tests performed with spruce glulam [17]. The changing conditions during long-term storage also affect the glulam’s properties. After 30 months of storage of pine glulam, it was observed that the modulus of elasticity (MOE) of the outer lamellas differed significantly from that of the middle layer, due to the fact that the outer layers are more susceptible to stresses resulting from changing conditions [18].
Previous studies have mostly explored the properties and the behaviour of homogenous glulam structures made of a single species. The main objective of this research was to analyse the behaviour of different mixed glulam structures made of softwood (the core layers) and hardwood (the face layers), when exposed to a humid environment.

2. Materials and Methods

The materials used in this research consisted of fir, lime, beech, and oak lumber boards, previously conditioned at a moisture content of 8%. The dimensions of the solid wood slats prepared for glueing were 500 × 145 × 23 mm, after planing. Thus, the dimensions of the resulting glulam structures were 500 × 145 × 115 mm.
The boards were graded, so that those with small defects (knots, cracks, and inclined fibre) were allowed only for the softwood parts, and used only for the core of the glulam structures. The boards were first straightened, then planed on the faces and edges, and finally cut to length.
Three replicates were made for each mixed structure (coded BF for beech–fir, BL for beech–lime, OF for oak–fir, and OL for oak–lime). Homogeneous structures, using a single species for the faces and the core, were manufactured as well (coded F for fir, L for lime, B for beech, and O for oak), and used as references for the mixed ones.
The adhesive used for bonding the layers was SOUDAL 66A, a one-component polyurethane-based moisture-resistant (D4) adhesive. The adhesive was applied on the lamella faces by brushing. The specific consumption according to the technical sheet was 150 mL/m2, meaning 8 g/surface. The adhesive is resistant to temperatures between −30 °C and 100 °C. It has an assembly time of 15 min between applying and pressing. The required pressing time is a minimum of 3 h. To avoid movement of the lamellas during pressing, a fixing device was constructed as shown in Figure 1.
Immediately after glueing, each glulam structure was introduced into a GL6 cold press by Italpresse (Bagnatica, Italy), presented in Figure 2, and pressed at a pressure of 0.5 MPa for 4 h. After pressing, the Glulam specimens were sized and trimmed to remove the adhesive excess.
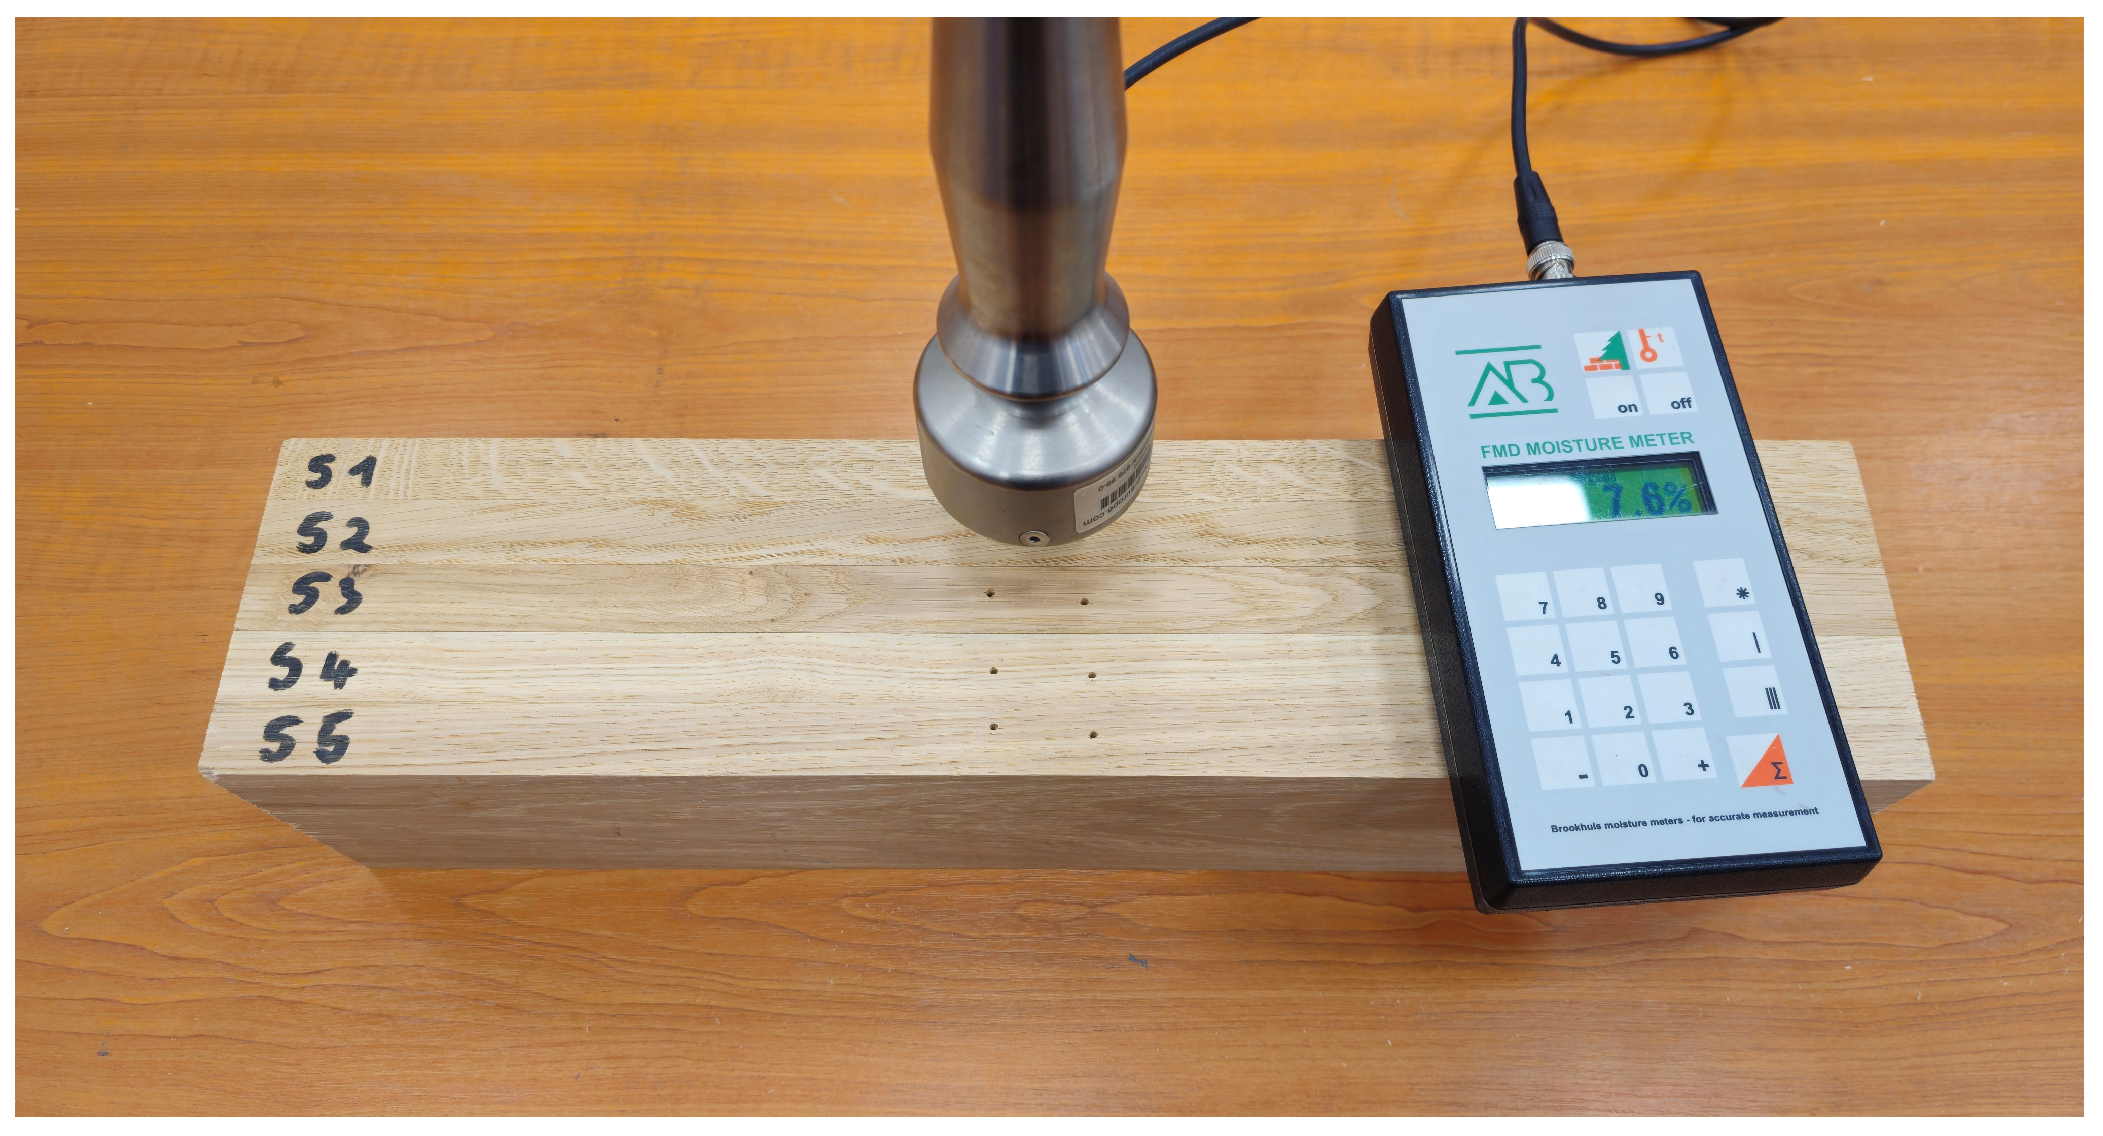
In the next step, the moisture content (MC) of each layer was determined using a resistive moisture meter, type FMD6, from Brookhuis (Almelo, The Netherlands), as shown in Figure 3. The moisture content was measured at a depth of 30 mm on the edge surface of each layer, and the moisture meter was re-calibrated after each species. Also, all structures were visually analysed to identify any existing delamination before exposure.
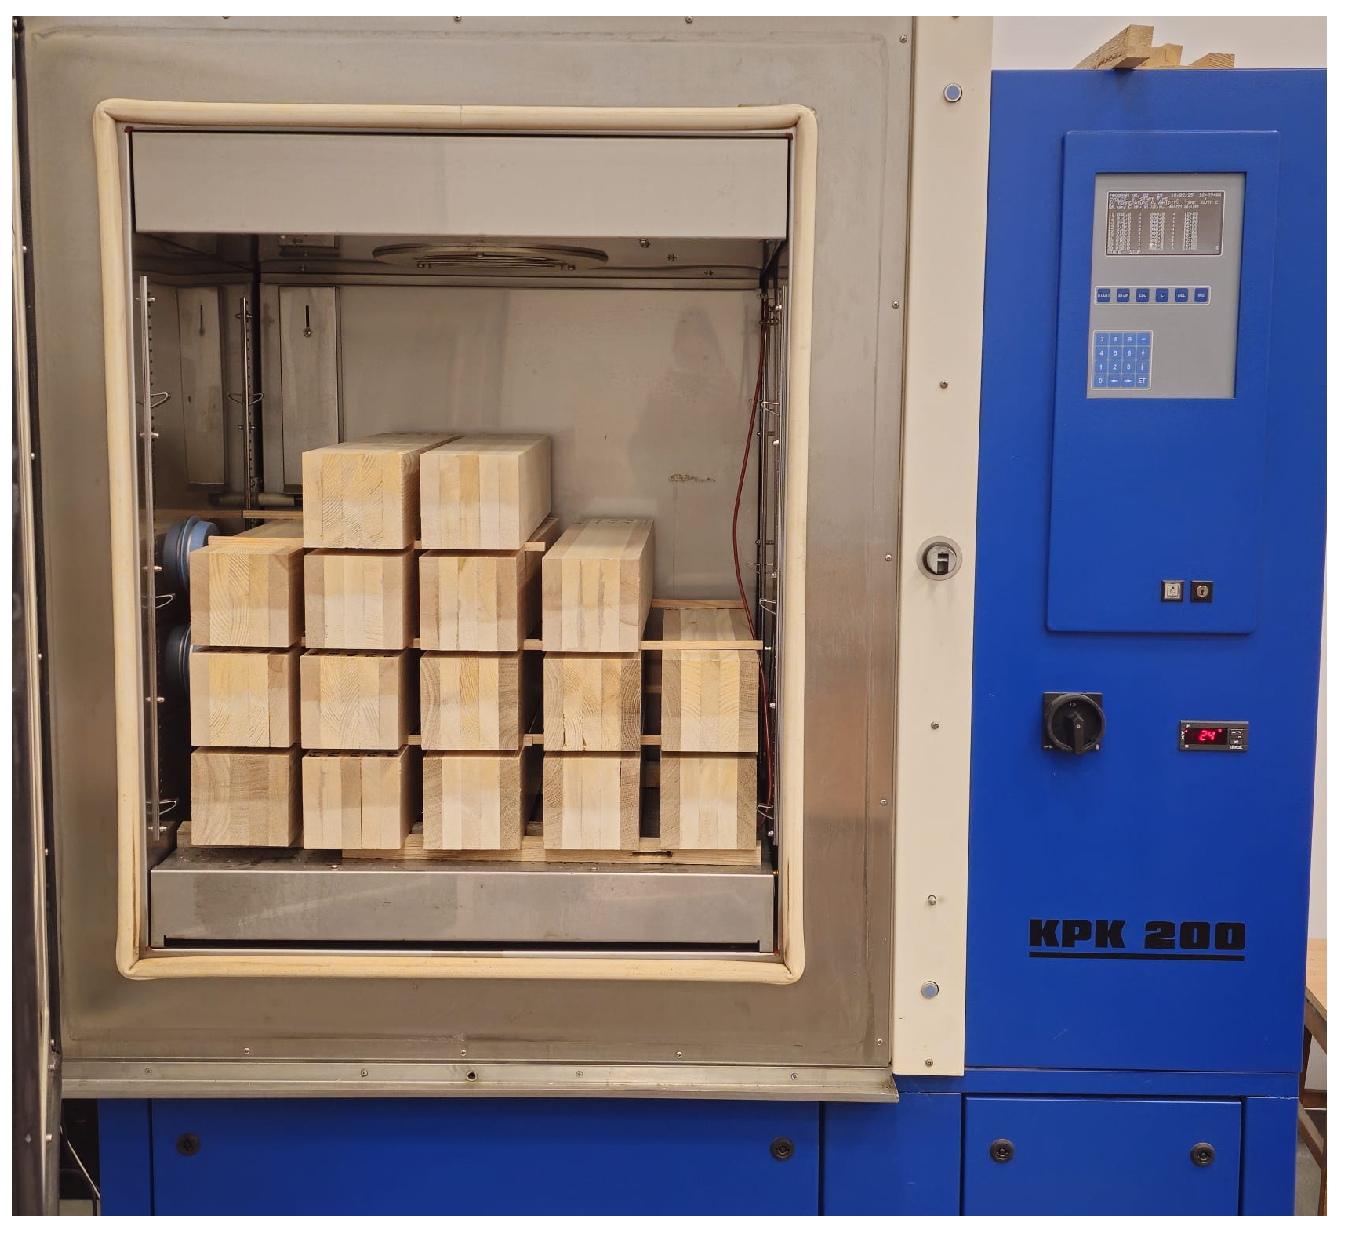
Hereinafster, the glulam specimens were placed in a KPK200 climate chamber by FEUTRON (Langenwetzendorf, Germany) (Figure 4) to be exposed for one month to a climate cycle similar to diurnal/nocturnal exposure in an external environment: a temperature of 30 °C and relative humidity (RH) of 40% for 12 h, followed by a temperature of 10 °C and RH = 80% for 12 h.
After exposure, the moisture content of each layer of all structures was re-measured with a resistive-type moisture meter, and the structures were visually analysed to identify any delamination.
A second climate test consisted of exposing the same glulam structures to a more aggressive humid environment, with constant parameters of temperature t = 20 °C and a relative air humidity of RH = 90% for 3 weeks. After exposure, the moisture content of each layer was measured again with the same resistive moisture meter and the structures were visually analysed for any delamination. The visual analysis was repeated after 8 weeks of laboratory conditioning.
The difference in moisture content (ΔMC) between the layer with the highest moisture content (always one of the surface layers) and the one with the lowest moisture content (the core layer) was determined:
M C = M C s u r f a c e M C c o r e   [ % ]
This indicator is very important for structural stability. Therefore, it was determined for each structure after each climate test, to create a correlation between the ΔMC values and the degree of delamination.
The Data Analysis ToolPack, Microsoft Excel®, was used as a statistical tool to reveal if there is a significant difference among analysed groups [19]. Initially, One-Way Analysis of Variance (ANOVA) was run to reveal if there is a significant difference among the analysed groups. Finally, the t-test for two independent groups was chosen as a post hoc test. The Bonferroni correction was considered to determine if the mean differences are statistically significant. According to the literature [20], the Bonferroni correction suggests to divide the significant alpha level (5%) by the number of compared groups. Consequently, the significant alpha level during the post hoc analysis was equal to 0.0125.

3. Results

3.1. Initial Evaluation of the Glulam Samples

Each glulam structure was visually examined for defects, focussing on the glue line regions. The results are summarised in Table 1.
All defects found were due to bonding, and it was important to record them, even if they were minor, to correctly track the evolution of the structure quality after exposure to a humid environment.
The average moisture content values of the samples recorded for each species after the manufacturing of the glulam structures are presented in Table 2.

3.2. Moisture Content Evaluation of the Samples After the First Climate Test

The moisture content values recorded for each layer of each structure after the first climate test are presented in Table 3.
In the case of the mixed structures with beech faces and fir cores (BF), a clear difference is observed between the moisture content of the beech face layers, which reached values in the range of 9.6–10.6%, (with an average of 10.1%, identical to that of the unstrained beech specimen), while the core layers reached lower moisture content levels of 7.9–9.9%. The average moisture gradient across the thickness was ΔMC = 1.9%, three times higher than for the homogenous fir structure (Table 4). However, this type of mixed structure displayed fairly scattered values of ΔMC. The highest recorded value (for the BF 3 sample) was ΔMC = 2.6%, which is one of the highest values recorded after the first climate test.
The mixed structures with beech faces, and lime cores (BL) registered a higher average moisture gradient across the thickness, namely ΔMC = 2.27%. In this case, the beech faces reached moisture values ranging from 9.1 to 10.5% (similarly to the beech–fir structures), but the lime core layers reached lower moisture levels than fir (7.4–8.8%).
The mixed structures with oak faces and fir cores (OF) displayed the most homogeneous moisture distribution, with an average ΔMC of 1.63%, and less scattered values (Table 4). The moisture gradient value for these mixed structures was even lower than for the homogenous oak structure.
On the contrary, the mixed structures with oak faces and lime cores (OL) displayed the least homogeneous moisture distribution, with an average ΔMC of 2.67%.
None of the structures experienced delamination after the first climate test. On the contrary, the minor swelling following moisture absorption led to the closure of pre-existing cracks, so that the appearance of the structures after the climate test was better than in the initial state (Figure 5).
Following the results obtained after the first climate test, it can be concluded that the oscillating humid environment with cycles of 30 °C/40%/12 h and 10 °C/80%/12 h leads to a reduced moisture absorption in all glulam structures (Figure 6). The maximum moisture content was attained by the oak layers (with a maximum of 10.8%), and the lowest moisture content was reached by the lime layers (with a minimum of 7.4%). This is why the oak–lime structures revealed the highest moisture gradient value across the structure thickness (Figure 6d and Table 4).
However, all the values recorded for the moisture gradient across the thickness (ΔMC) were below 2.67% (Table 4), which correlates well with the total lack of delamination among the mixed structures after the first climate test.
The ANOVA results regarding the moisture gradients after the first climate test are presented in Table 5. There is no significant difference between the analysed structures (p-value > 0.05).

3.3. Moisture Content Evaluation of the Samples After the Second Climate Test

The moisture content values recorded for each layer and for each structure after the second climate test are presented in Table 6.
The moisture content values after the second test are visibly higher than after the first test, which shows that the second chosen exposure environment is more aggressive, and may cause more damage to the glulam structures. The homogenous fir and lime structures displayed 7-times higher moisture gradients across the thickness. The most stable was again the oak–oak structure, with ΔMC = 3.20% (Table 7).
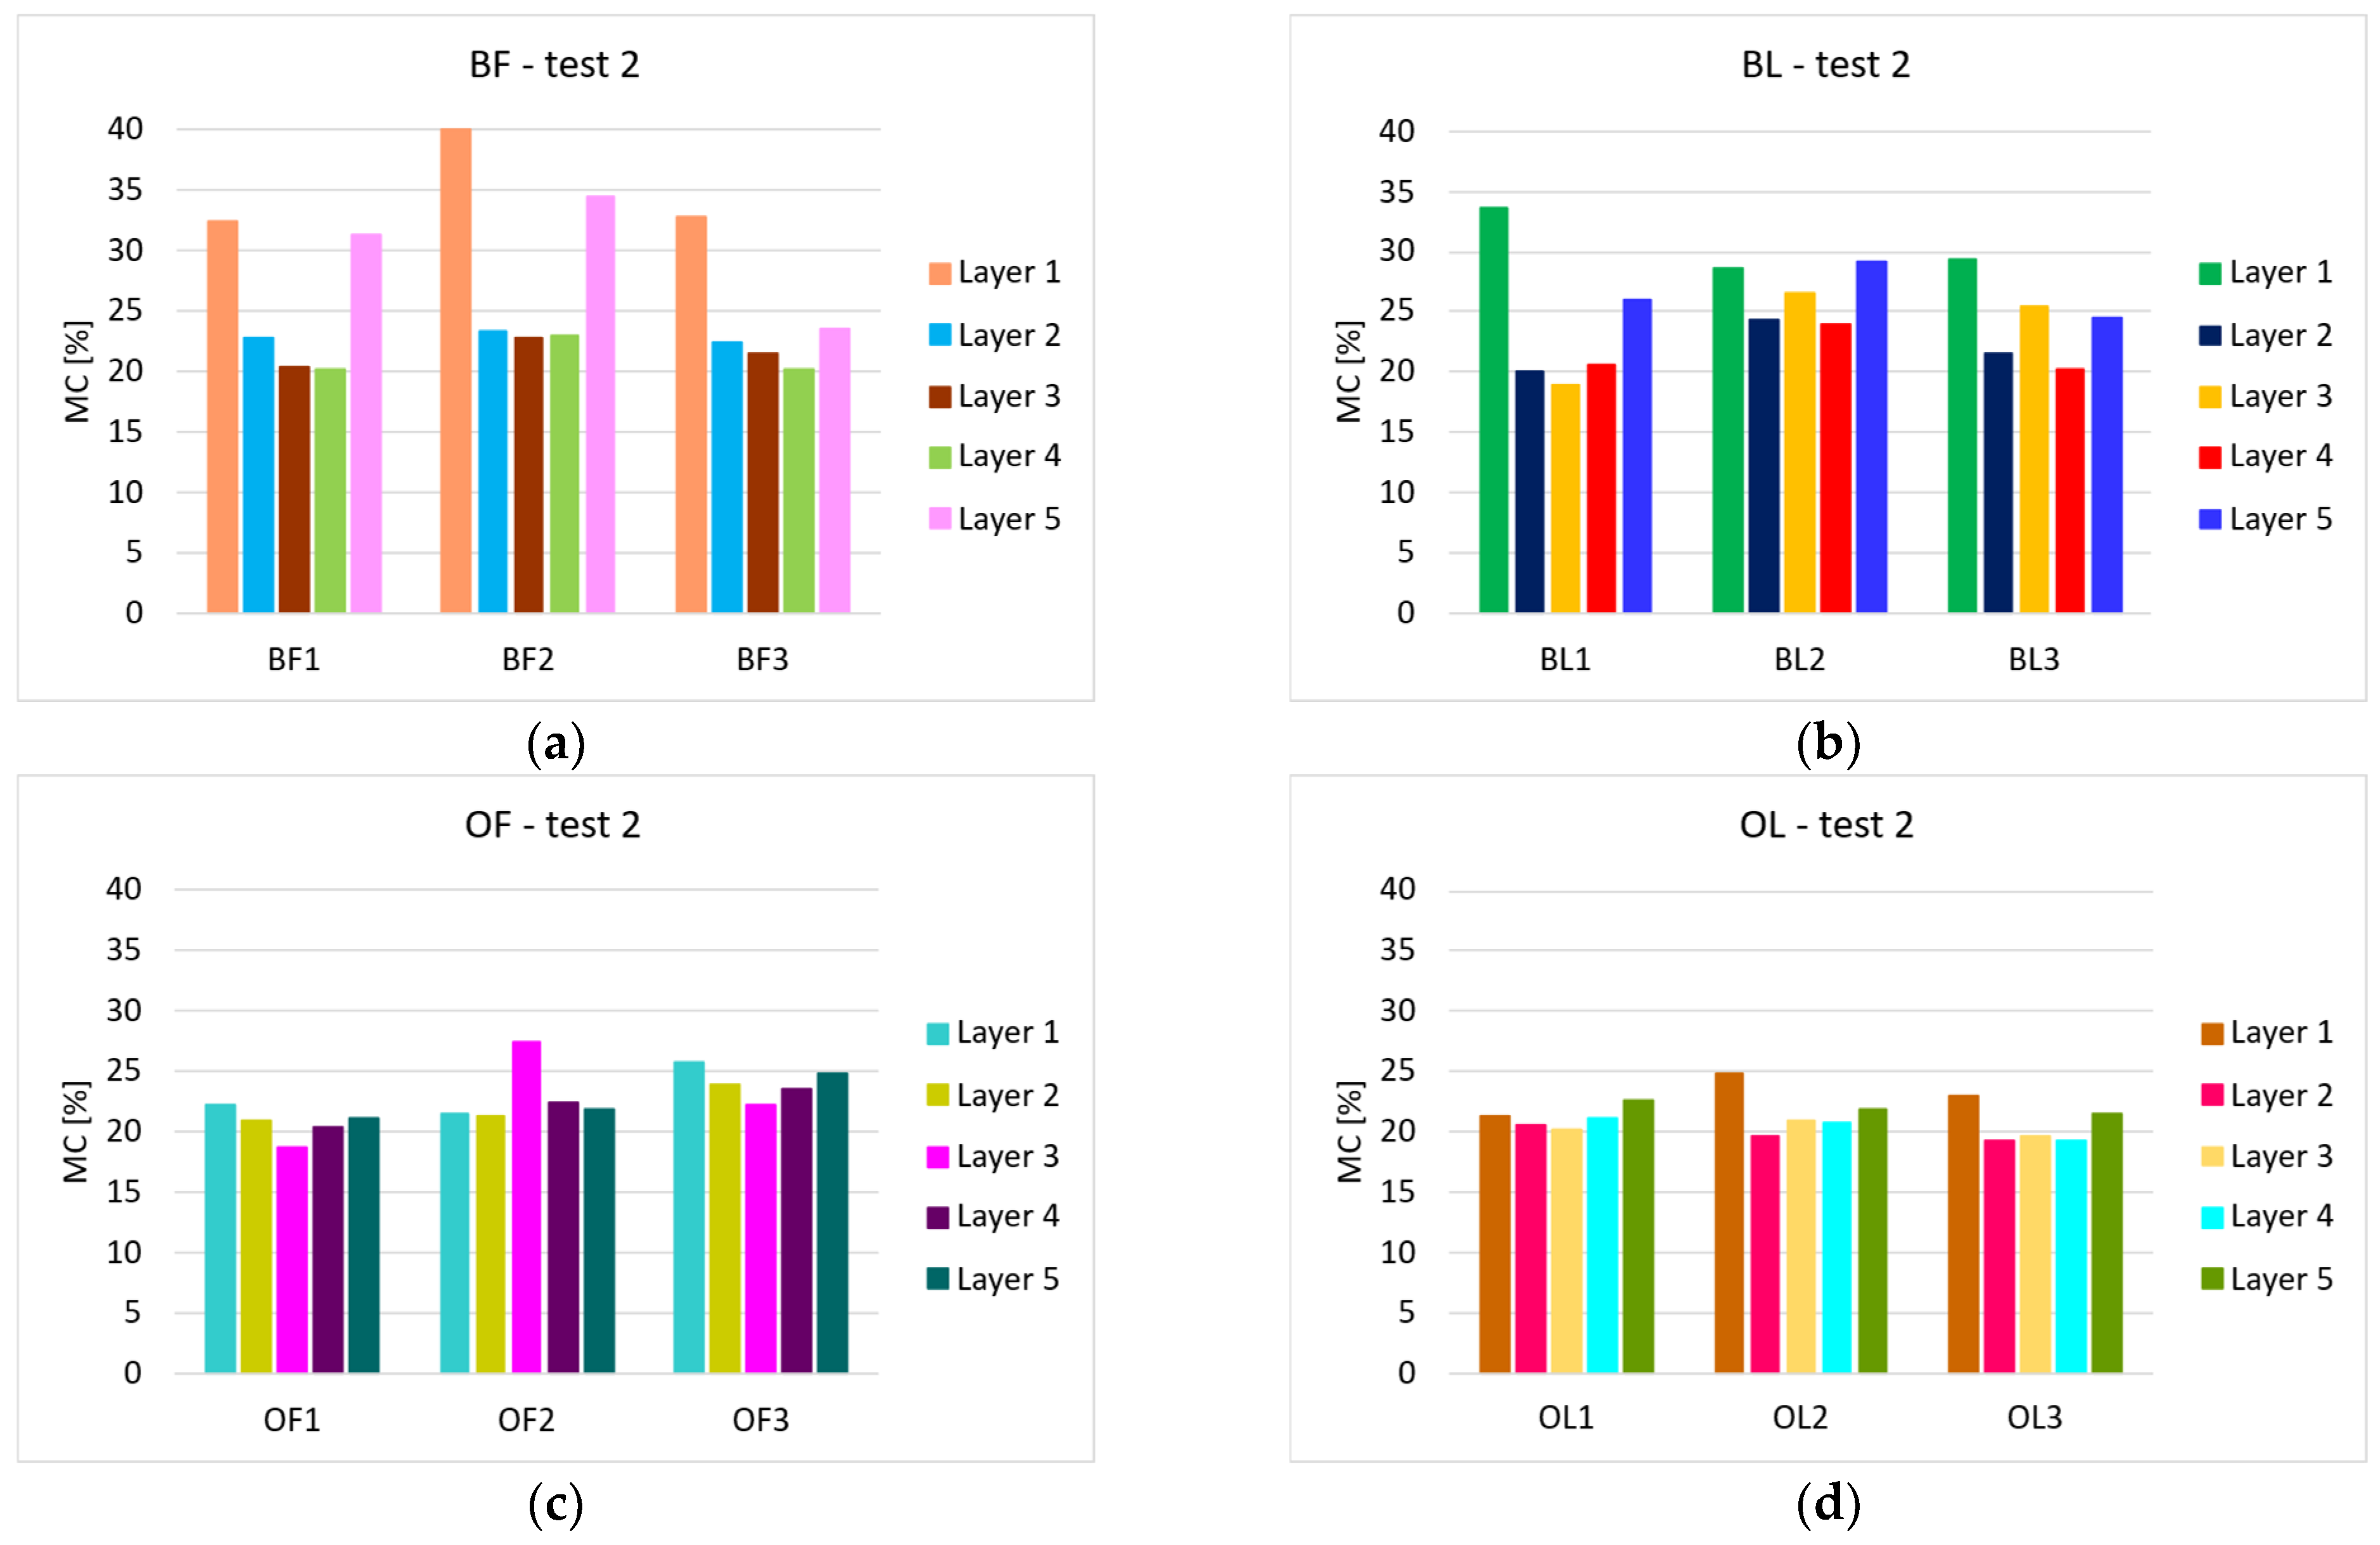
In the case of the mixed structures with beech faces and fir cores (BF), a clear difference is observed between the moisture content of the beech face layers, which reached values in the range of 23.6–40.0% (on average 32.4%), while the fir core layers remained at a lower moisture level, in the range of 20.2–23.4% (Figure 7a). This type of mixed structure registered the highest moisture gradient across the thickness (Table 6). Mould attack was present on the beech wood layers. Two of the replicates suffered deformations (BF 2 and BF 3), but no delamination occurred.
The mixed structures with beech faces, and lime cores (BL) also showed high differences in moisture content between the beech faces, which reached values ranging between 24.5 and 33.6%, and the core layers, which reached lower moisture content levels, between 19.0 and 26.5% (Figure 7b). Structures BL 1 and BL 2 suffered deformations (twist) and both species (all layers) showed signs of mould attack.
In the case of the mixed structures with oak faces and fir cores (OF) (Figure 7c), the oak face layers reached values in the range of 21.1–25.7% (on average 22.8%, similar to that of the free oak specimen), while the fir core layers reached a moisture content of 18.7–27.5%. Thus, the highest value of the moisture gradient across the thickness was ΔMC = 6.1%, which is very low compared to the other mixed structures. Correlated with the results after the first climate test, one can affirm that the oak–fir structures displayed the best results concerning the moisture behaviour out of the four analysed variants. None of the oak–fir structures suffered delamination or deformation. Similar results were obtained by other researchers [18], who noticed that combined glulam, made of oak external layers with pine inside the structure, performed favourably after exposure to different climate conditions and no adverse signs of cracking or delamination were observed.
Unlike after the first test, the samples having mixed structures with oak faces and lime cores (OL) displayed better results after the second climate test and showed minor differences in moisture content between the oak faces, which reached values ranging from 21.4 to 24.8%, and the core layers, which reached moisture contents of 19.3–21.1% (Figure 7d). However, the results of the visual analysis are less favourable than for the oak–fir structures, considering the presence of deformations (twist), and the mould attack on the lime wood layers.
Following the results obtained after the second climate test, it can be concluded that a more humid environment, even with constant parameters (t = 20 °C, RH = 90%), leads to a significantly higher moisture absorption in the glulam structures, and significantly higher moisture gradients across the structure thickness (Table 7).
The ANOVA results regarding the moisture gradients after the second climate test are presented in Table 8. According to these results, there is a significant difference among the analysed structures (p-value < 0.05). The post hoc test reveals that there is a significant difference between Beech–Fir and Oak–Fir, and also between Beech–Fir and Oak–Lime (Table 8).
Table 9 correlates the values of the average moisture gradient and the results of visual analysis, obtained for each structure. According to the obtained results, a moisture gradient below 8% can be associated with a lack of delamination, while a moisture gradient above 9–10% indicates a high delamination risk.
Figure 8. Experimental glulam structures after the second climate test: (a) beech, displaying total delamination, cracks, and mould; (b) beech–lime, displaying delamination and mould; (c) oak–fir, with no defects.
Applsci 15 12432 g008

4. Conclusions

Based on the findings in this work, the following conclusions can be drawn:
  • Stable glulam structures can be obtained even when using two different species for the faces and for the core layers, but not all combinations are suitable.
  • The worst results were obtained when using beech in a mixed glulam structure. Both the beech–lime and the beech–fir combination lead to high moisture gradients, a high degree of delamination, cracks, and mould.
  • The oak–lime combination had a low moisture gradient within the structure thickness, but the lime layers showed high biological vulnerability and developed mould. These structures were also prone to deformation (twist).
  • The best results were obtained with the oak–fir glulam structures, which showed the lowest moisture content gradient values between the faces and the core, and also no delamination or cracks. This finding indicates a strong compatibility between oak and fir in mixed-species glulam and suggests this combination as a promising solution where moisture-induced stresses are a concern.
Overall, the study shows that the moisture gradient between the faces and the core layers is a reliable predictor of delamination risk. ΔMC-values exceeding 9–10% were consistently associated with significant structural defects.
These insights contribute to the optimisation of species selection and structural design for mixed glulam products used in environments subject to fluctuating or sustained high humidity.

Author Contributions

Conceptualization, R.G. and M.C.; methodology, R.G., M.I. and M.C.; software, B.B.; formal analysis, R.G. and M.C.; investigation, R.G., O.Z. and S.G.; writing—original draft preparation, R.G.; writing—review and editing, O.Z. and M.C.; visualisation, M.I.; supervision, M.C. All authors have read and agreed to the published version of the manuscript.

Funding

This research received no external funding.

Institutional Review Board Statement

Not applicable.

Informed Consent Statement

Not applicable.

Data Availability Statement

The original contributions presented in this study are included in the article. Further inquiries can be directed to the corresponding author.

Acknowledgments

The authors acknowledge the project “Digital Transformation for Innovation and Competitiveness”, funded by the EU through the PNRR, in Grants for the digitization of universities, contract no. 14039/16.09.2022, for providing the infrastructure used in this study.

Conflicts of Interest

The authors declare no conflicts of interest.

References

  1. Quesada, H. Glue-Laminated Timber. Virginia Cooperative Extension 2022. Available online: https://www.pubs.ext.vt.edu/content/dam/pubs_ext_vt_edu/CNRE/cnre-151/CNRE-151.pdf (accessed on 30 July 2025).
  2. Baño, V.; Pérez-Gomar, C.; Godoy, D.; Moya, L. Structural Yield of Fast-Growing Hardwood vs. Softwood Glulam Beams. Forests 2025, 16, 8. [Google Scholar] [CrossRef]
  3. FAOSTAT. Forest Product Statistics. Available online: https://www.fao.org/faostat/en/#data/FO (accessed on 27 August 2025).
  4. Report 2025. Glue Laminated Timber Market Analysis by Type, by Shape, by Application and by Region from 2025 to 2035. Available online: https://www.factmr.com/report/glue-laminated-timber-market#:~:text=Europe% (accessed on 27 August 2025).
  5. Glavinić, I.U.; Boko, I.; Vranković, J.L.; Torić, N.; Abramović, M. An Experimental Investigation of Hardwoods Harvested in Croatian Forests for the Production of Glued Laminated Timber. Materials 2023, 16, 1843. [Google Scholar] [CrossRef] [PubMed]
  6. Aicher, S.; Christian, Z.; Dill-Langer, G. Hardwood Glulams—Emerging Timber Products of Superior Mechanical Properties. In Proceedings of the World Conference on Timber Engineering, Quebec City, QC, Canada, 10–14 August 2014. [Google Scholar]
  7. Sikora, K.S.; McPolin, D.O.; Harte, A.M. Shear Strength and Durability Testing of Adhesive Bonds in Cross-Laminated Timber. J. Adhes. 2016, 92, 758–777. [Google Scholar] [CrossRef]
  8. Dugmore, M.; Nocetti, M.; Brunetti, M.; Naghizadeh, Z.; Wessels, C.B. Bonding quality of cross-laminated timber: Evaluation of test methods on Eucalyptus grandis panels. Constr. Build. Mater. 2019, 211, 217–227. [Google Scholar] [CrossRef]
  9. Ehrhart, T.; Fink, G.; Steiger, R.; Frangi, A. Strength grading of European beech lamellas for the production of GLT & CLT. In Proceedings of the International Network on Timber Engineering Research, Graz, Austria, 16–19 August 2016. [Google Scholar]
  10. Knorz, M.; Schmidt, M.; Torno, S.; van de Kuilen, J.W. Structural bonding of ash (Fraxinus excelsior L.): Resistance to delamination and performance in shearing tests. Eur. J. Wood Wood Prod. 2014, 72, 297–309. [Google Scholar] [CrossRef]
  11. Uzelac, I.; Boko, I.; Torić, N.; Vranković, J.L. Application of hardwood for glued laminated timber in Europe. Gradevinar 2020, 72, 607–616. [Google Scholar]
  12. EOTA (European Organisation for Technical Assessment). Glued Laminated Timber Made of Solid Hardwood; EOTA: Bruxelles, Belgium, 2018; Available online: https://www.eota.eu/download?file=/2017/17-13-0320/for%20ojeu/ead%20130320-00-0304_ojeu2021.pdf (accessed on 31 August 2025).
  13. Megwood. Available online: https://www.megwood.ro/2019/08/22/glulam-grinzi-lamelare-avantaje-si-performante/ (accessed on 30 July 2025).
  14. Schaffrath, J. Investigations into Moisture Transport Processes and Moisture-Induced Deformation as Well as Stresses When Considering Different Wood Species and Different Climatic Boundary Conditions. Ph.D. Thesis, Technische Universität München, München, Germany, 2015. [Google Scholar]
  15. Kytka, T.; Gašparík, M.; Sahula, L.; Karami, E.; Teterin, D.; Das, S.; Novák, D.; Kvietková, M.S. Bending characteristics of glued laminated timber depending on the alternating effects of freezing and heating. Constr. Build. Mater. 2022, 350, 128916. [Google Scholar] [CrossRef]
  16. Stolze, H.; Schuh, M.; Kegel, S.; Fürkötter-Ziegenbein, C.; Brischke, C.; Militz, H. Monitoring of Beech Glued Laminated Timber and Delamination Resistance of Beech Finger-Joints in Varying Ambient Climates. Forests 2021, 12, 1672. [Google Scholar] [CrossRef]
  17. Angst, V.; Malo, K.A. The effect of climate variations on glulam—An experimental study. Eur. J. Wood Wood Prod. 2012, 70, 603–613. [Google Scholar] [CrossRef]
  18. Mirski, R.; Kuliński, M.; Kawalerczyk, J.; Walkiewicz, J.; Czarnecki, R. The Effect of Storage Conditions on the Strength Characteristic of Glulam Beams. Forests 2023, 14, 897. [Google Scholar] [CrossRef]
  19. Oleksik, M.; Roșca, L. Data Analysis with Microsoft Excel (in Romanian Language); Pro Universitaria Publishing House: Bucharest, Romania, 2023. [Google Scholar]
  20. Pallant, J. SPSS. Survival Manual. A Step-by-Step Guide to Data Analysis Using SPSS Version 15, 3rd ed.; McGraw Hill, Open University Press: London, UK, 2007. [Google Scholar]
Figure 1. Fixing device for the experimental glulam structures.
Applsci 15 12432 g001
Figure 2. Manufacturing of the glulam specimens. (a) GL6 Cold press (by Italpresse, Italy); (b) Pressed structures.
Applsci 15 12432 g002
Figure 3. Resistive measurement of the moisture content of the solid wood layers.
Applsci 15 12432 g003
Figure 4. Positioning of the glulam specimens in the climate chamber.
Applsci 15 12432 g004
Figure 5. Detail of glueline cracks before the first climate test (a), and their reduced appearance after the first climate test (b).
Applsci 15 12432 g005
Figure 6. Moisture content of the mixed glulam structures after the first climate test: (a) beech–fir; (b) beech–lime; (c) oak–fir; (d) oak–lime.
Applsci 15 12432 g006
Figure 7. Moisture content of the glulam structures after the second climate test: (a) beech–fir; (b) beech–lime; (c) oak–fir; (d) oak–lime.
Applsci 15 12432 g007
Table 1. Visual analysis of experimental glulam structures before exposure to humid environment.
SampleObservations
FirNo defects
LimeOne fine crack between layers 4 and 5
BeechFine cracks between all layers
OakNo defects
Beech–Fir 1Fine cracks between layers 4 and 5
Beech–Fir 2Fine cracks between layers 4 and 5
Beech–Fir 3No defects
Beech–Lime 1Fine cracks between all layers
Beech–Lime 2One fine crack between layers 4 and 5
Beech–Lime 3No defects
Oak–Fir 1No defects
Oak–Fir 2No defects
Oak–Fir 3No defects
Oak–Lime 1One fine crack between layers 1 and 2
Oak–Lime 2Fine cracks between layers 2 and 3, 3 and 4, 4 and 5
Oak–Lime 3One fine crack between layers 1 and 2
Table 2. Average moisture content (MC) before the climate tests.
SampleMC [%]SampleMC [%]SampleMC [%]SampleMC [%]
Fir7.64 ± 0.4Lime6.74 ± 0.2Beech7.96 ± 0.7Oak8.42 ± 0.3
Table 3. Moisture content of the glulam structure layers after the first climate test.
Sample CodeMC [%]Sample CodeMC [%]Sample CodeMC [%]Sample CodeMC [%]Sample CodeMC [%]
F19BF 1-110.6BL 1-19.9OF 1-110.1OL 1-110.3
F29.2BF 1-29.5BL 1-27.8OF 1-29OL 1-28
F38.7BF 1-39.9BL 1-37.4OF 1-38.2OL 1-38.3
F48.6BF 1-48.9BL 1-48.4OF 1-49.2OL 1-48.1
F59.1BF 1-510.4BL 1-59.7OF 1-59.8OL 1-510.3
L18.1BF 2-110.5BL 2-19.8OF 2-110OL 2-110.1
L27.8BF 2-29.2BL 2-28.8OF 2-29OL 2-27.4
L38.9BF 2-39.5BL 2-38.5OF 2-310.4OL 2-38.3
L48.5BF 2-49.3BL 2-48.6OF 2-49.2OL 2-48
L58.1BF 2-510.6BL 2-510.4OF 2-58.8OL 2-59.8
B19.1BF 3-110.5BL 3-110.2OF 3-110.2OL 3-19.9
B210BF 3-28.3BL 3-27.9OF 3-29.4OL 3-27.8
B311.1BF 3-38.5BL 3-38.7OF 3-39OL 3-38.6
B410.9BF 3-47.9BL 3-47.8OF 3-49.3OL 3-48
B59.9BF 3-59.6BL 3-59.1OF 3-58.8OL 3-510.8
O19.1
O29.3
O310.7
O49
O58.7
Table 4. Moisture content gradient across the structure thickness (ΔMC) after the first climate test (average value ± standard deviation).
Structure TypeΔMC [%]Structure TypeΔMC [%]
Fir–Fir0.60Beech–Fir1.90 ± 0.62
Lime–Lime1.10Beech–Lime2.27 ± 0.32
Beech–Beech2.00Oak–Fir1.63 ± 0.25
Oak–Oak2.00Oak–Lime2.67 ± 0.35
Table 5. ANOVA results for the comparison between the analysed glulam structures after the first climate test.
GroupsCountSumAverageVarianceSD
Beech–Fir structures35.71.90.390.62
Beech–Lime structures36.82.260.100.32
Oak–Fir structures34.91.630.060.25
Oak–Lime structures382.660.120.35
Source of VariationSSdfMSFp-ValueF Crit
Between Groups1.8130.603.560.0664.06
Within Groups1.3680.17
Total3.1711
Table 6. Moisture content of the glulam structure layers after the second climate test.
Sample CodeMC [%]Sample CodeMC [%]Sample CodeMC [%]Sample CodeMC [%]Sample CodeMC [%]
F122.5BF 1-132.5BL 1-133.6OF 1-122.2OL 1-121.4
F221.7BF 1-222.8BL 1-220.1OF 1-221OL 1-220.6
F320.3BF 1-320.5BL 1-319OF 1-318.7OL 1-320.2
F422BF 1-420.2BL 1-420.7OF 1-420.4OL 1-421.1
F523.2BF 1-531.4BL 1-526OF 1-521.1OL 1-522.6
L130.3BF 2-140BL 2-128.7OF 2-121.6OL 2-124.8
L222.2BF 2-223.4BL 2-224.3OF 2-221.4OL 2-219.6
L326BF 2-322.9BL 2-326.5OF 2-327.5OL 2-321
L424.2BF 2-423.1BL 2-424OF 2-422.5OL 2-420.7
L529.1BF 2-534.5BL 2-529.1OF 2-521.9OL 2-521.8
B127.3BF 3-132.8BL 3-129.3OF 3-125.7OL 3-123
B226.2BF 3-222.4BL 3-221.6OF 3-224OL 3-219.3
B334.5BF 3-321.6BL 3-325.5OF 3-322.2OL 3-319.7
B432BF 3-420.2BL 3-420.2OF 3-423.5OL 3-419.3
B531.3BF 3-523.6BL 3-524.5OF 3-524.8OL 3-521.6
O122
O219.9
O322.1
O420.8
O523.1
Table 7. Moisture content gradient across the structure thickness (ΔMC) after the second climate test (average value ± standard deviation).
Structure Type (Homogenous)ΔMC [%]Structure Type (Mixed)ΔMC [%]
Fir2.90Beech–Fir14.00 ± 2.69 a
Lime8.10Beech–Lime9.60 ± 4.77 a,b
Beech8.30Oak–Fir4.37 ± 1.50 b
Oak3.20Oak–Lime3.77 ± 1.40 b
The average values that do not share the same letter are significantly different one from another.
Table 8. ANOVA results regarding the comparison among the analysed structures after the second climate test.
GroupsCountSumAverageVarianceSD
Beech–Fir structures3.0042.0014.007.232.69
Beech–Lime structures3.0028.809.6022.754.77
Oak–Fir structures3.0013.104.372.251.50
Oak–Lime structures3.0011.303.771.961.40
Source of VariationSSdfMSFp-ValueF Crit
Between Groups208.99369.668.140.0084.06
Within Groups68.3988.54
Total277.3811
Table 9. Correlation between the moisture gradient across the structure thickness and the defects assessed after the second climate test.
Structure TypeΔMC [%]Defects
Fir2.90No defects
Lime8.10No delamination; mould
Beech8.30Delamination; cracks, mould (Figure 8a)
Oak3.20No delamination
Beech–Fir14.00Major deformations; delamination
Beech–Lime9.60Major deformations; mould; delamination (Figure 8b)
Oak–Fir4.37No defects (Figure 8c)
Oak–Lime3.77Major deformations (twist); mould
Disclaimer/Publisher’s Note: The statements, opinions and data contained in all publications are solely those of the individual author(s) and contributor(s) and not of MDPI and/or the editor(s). MDPI and/or the editor(s) disclaim responsibility for any injury to people or property resulting from any ideas, methods, instructions or products referred to in the content.