Article

Impact of Tire Microplastics on Aerobic Granular Sludge Structure and EPS Composition Under Continuous and Intermittent Aeration

by
Job Oliver Otieno
*,
Zuzanna Maja Nowak
,
Katarzyna Parszuto
and
Agnieszka Cydzik-Kwiatkowska
*
Department of Environmental Biotechnology, University of Warmia and Mazury in Olsztyn, Słoneczna 45G, 10-709 Olsztyn, Poland
*
Authors to whom correspondence should be addressed.
Appl. Sci. 2025, 15(23), 12410; https://doi.org/10.3390/app152312410 (registering DOI)
Submission received: 23 September 2025 / Revised: 18 November 2025 / Accepted: 19 November 2025 / Published: 22 November 2025
(This article belongs to the Section Chemical and Molecular Sciences)

Abstract

Tire microplastics (TMPs) are a widespread pollutant with growing concern due to their diverse sources, persistence, and potential risks to the environment and human health. This study investigated the impact of TMPs (50–500 mg/L) on the sludge structure, activity, and extracellular polymeric substance (EPS) dynamics in granular sequencing batch reactors (GSBRs) under continuous aeration (CA) and intermittent aeration (IA) conditions. Increased TMP concentration reduced granule size and increased the specific surface area under CA, but under IA, it increased granule size and lowered specific surface area. Total EPS declined as TMP concentration increased in both aeration regimes, but the reduction was more pronounced under CA. Protein levels in the soluble EPS fraction were consistently higher during IA than CA across all GSBRs. Aeration regimes had contrasting effects on EPS polysaccharides, as TMP dose increased; polysaccharide content increased during IA and decreased during CA. During CA, TMP presence enhanced dehydrogenase activity to over five times that of the control, while during IA, activity remained stable despite TMP addition. Overall, biomass under IA showed greater tolerance to TMP stress than CA, as evidenced by enhanced granulation, stable dehydrogenase activity, and preserved EPS.

1. Introduction

Tire microplastics (TMPs) have become a significant form of microplastic (MP) pollution [1]. TMP generation has been estimated at approximately 1.33 million tonnes per year in the European Union, 1.12 million tonnes in the United States, and 133,000 tonnes in Germany [2]. TMPs emissions ranged from 0.9 to 2.5 kg/year per capita across 14 countries [3]. Global emissions from automobiles rose from 2.11 to 2.89 million tons between 2010 and 2019 [4], and with tire production projected to rise from 1.5 billion tires in 2024 to 5 billion tires by 2030 [5], TMPs emissions will continue to rise. MPs primarily accumulate on roads and are washed into surface waters via runoff (10–150 mg TMPs/g runoff) [6], with a portion entering wastewater pathways and 2–10% becoming airborne [7,8]. TMP-leached compounds such as zinc, benzo(a)pyrene, fluoranthene, benzothiazole, mercaptobenzothiazole, 4-methylaniline, naphthalene, and arylamines have shown toxic effects in biological tests [9,10,11,12]. Recent reviews highlighted that TMPs are insufficiently characterized in terms of quantity, properties, and environmental impact compared to other MPs [3,9], leaving their risks in wastewater treatment and receiving waters largely unknown.
Wastewater treatment plants (WWTPs) are major collection points and secondary sources of MPs, including TMPs. In biological wastewater treatment systems, aeration is essential for microbial degradation of organic matter and nutrients, accounting for 60–80% of total energy consumption [13]. In a full-scale activated sludge WWTP, model simulations comparing continuous aeration (CA) and intermittent aeration (IA) demonstrated that while both strategies achieved total nitrogen (TN) levels below 10 mg/L, IA reduced energy consumption by approximately 50% and extending non-aeration phases from 1 to 12 h improved TN removal efficiency by 72% [14]. In an integrated fixed film activated sludge reactor treating municipal wastewater, a comparison of the effect of CA and three IA cycles of 150/30, 120/60, and 90/60 min (aeration/pause), the 150/30 cycle achieved the highest chemical oxygen demand (COD) and biological oxygen demand removal rates (97% and 93.8%) [15]. Aerobic granular sludge (AGS) has higher functional diversity than conventional activated sludge and has shown potential for micropollutant transformation in wastewater treatment [16]. In granular sequencing batch reactors (GSBRs) under CA, TMP-derived compounds, including N-(1,3-dimethylbutyl)-N′-phenyl-1,4-phenylenediamine, benzothiazole, and 2-hydroxybenzothiazole, were effectively degraded, with only benzothiazole and aniline remaining in the effluent [17]. Granular sludge systems enhance MPs aggregation and capture through self-immobilized, well-settling microbial granules [18]; however, MPs can alter sludge structure by disrupting microbial aggregation, leading to changes in granule size and stability [19]. For instance, relative to the control GSBR, exposure to 20 mg/L polystyrene MPs caused granule breakage and instability, reducing biomass concentration from 4.0 g/L to 3.0 g/L [20].
Dehydrogenase activity correlates with the static respiration index [21], making it a reliable indicator of microbial activity under the contrasting oxygen conditions such as CA and IA. While the effect of toxic substances such as phenyltetrazolium chloride on dehydrogenase activity in sludge has been tested [22,23], dehydrogenase response to MPs remains largely unknown, although such an impact has been documented for soil microbial communities [24,25]. While some studies, primarily focusing on plants, have identified enzymes like glucose-6-phosphate dehydrogenase as key to extracellular polymeric substances (EPS) synthesis [26], research linking dehydrogenase activity to EPS production in wastewater treatment systems remains limited.
EPS facilitates microbial aggregation and biofilm development, forming the structural framework of aerobic granules. EPS are composed of various organic compounds, including proteins (PNs), polysaccharides (PSs), lipids, nucleic acids, and glycoproteins [1]. Among the main EPS components, PSs improve EPS hydration and strengthen structural cohesion under fluctuating environmental conditions, and their degradation leads to granule disintegration [27]. PNs, on the other hand, contribute to hydrophobicity and enhance granule compactness and settling, particularly when substrates like glucose and lactate are present [28]. The PN to PS ratio (PN/PS) near 4 indicates a dominance of hydrophobic components in EPS, which promotes cell aggregation in granules [29,30,31]. A higher PN/PS ratio generally indicates stronger, more compact granules with improved settling properties, making it a critical indicator of AGS performance [32].
EPS production in wastewater treatment systems can be influenced by both the aeration regime and the presence of MPs. In moving bed biofilm reactors, IA led to higher humic substances to carbohydrates ratios (0.72 ± 0.16) compared to CA (0.52 ± 0.13) in EPS, due to increased microbial lysis and reduced sludge discharge, resulting in structurally weaker biofilms more prone to sloughing and impaired nitrification [33]. EPS exhibited distinct affinities for various MPs, with polyvinyl chloride and polyethylene terephthalate interacting primarily through hydrocarbon groups, whereas polyethylene and polystyrene were preferentially bound through PS and amide I group interactions, respectively [34]. In GBSRs under CA, increasing polyethylene terephthalate MPs concentrations from 0 to 50 mg/L led to a rise in EPS production from 51 to 77 mg/L, with the PN/PS ratio increasing from 1.96 to 5.40 at the highest dose [35]. In a continuously operated up-flow anaerobic granular sludge blanket system, polyethylene terephthalate MPs led to increased EPS production at 15 particles/L, while higher concentrations from 75 to 300 particles/L inhibited EPS secretion [36].
Within the EPS matrix, alginate-like exopolysaccharides (ALEs) form an important component believed to enhance the mechanical strength, elasticity, and surface hydrophobicity of AGS [37]. ALE content in AGS from a full-scale WWTP varied seasonally, peaking at over 150 mg/g MLSS during the winter–spring transition, with intra-cycle levels reaching 120 mg/g MLSS two hours into aeration before dropping by half by cycle end [38]. A study on a continuous-flow AGS system showed that IA improved treatment performance, supported granule formation through increased ALE accumulation in comparison with CA [39]. ALE content increased from 238.7 to 441.6 mg/g MLSS under 50 mg/L polyethylene MPs exposure [40].
To date, no study has examined the effect of TMPs on sludge characteristics and EPS dynamics in GSBRs under different aeration regimes. Given growing concerns about TMPs as an emerging environmental micropollutant, this study investigates their effects on the sludge structure, activity, and EPS dynamics in GSBRs under CA and IA. The obtained results will help optimize biomass performance in WWTPs in the presence of MPs.

2. Materials and Methods

2.1. Experimental Setup and Operation

The experiments were conducted in GSBRs with a diameter of 10 cm, a height of 50 cm, and a working volume of 3.0 L (Figure 1A). Each cycle lasted 8 h with a 50% volumetric exchange ratio. To eliminate the risk of external MPs contamination, the GSBRs were fed with synthetic wastewater prepared with adjustments according to Coelho et al. [41], with influent characteristics of 1200–1300 mg COD/L, 40–50 mg N-NH4/L, and 7–8 mg P-PO4/L. Tire crumbs were sourced from a tire recycling facility in Vienna, then ground and sieved to obtain TMP with a maximum size of 300 µm, consistent with typical environmental MPs sizes [42,43]. Five GSBRs, labeled R1, R2, R3, R4, and R5, were operated with influent TMP concentrations of 0 (control), 50, 100, 250, and 500 mg/L, respectively (Figure 1A). The concentrations were selected based on reported TMP levels in surface runoff (0.3–179 mg/L [44]) and in sediments (up to 155 mg/kg DW [45]). The highest concentration (500 mg/L), which was above typical environmental levels, was selected in case lower concentrations did not produce detectable effects.
Two aeration regimes (CA and IA) were tested in each reactor. Fresh AGS from the WWTP in Lubawa, Poland, was used as seed biomass. The CA series was conducted for 454 cycles. Upon completion, the IA series was initiated independently using biomass from R1 of the CA series as the inoculum and ran for 454 cycles. The CA cycle consisted of feeding (5 min), anoxic (90 min), aerobic (370 min), settling (10 min), and discharge (5 min) (Figure 1B). The IA cycle consisted of feeding (5 min), anoxic (70 min), aerobic (240 min), anoxic (30 min), aerobic (45 min), anoxic (30 min), and aerobic (45 min), settling (10 min), and discharge (5 min) (Figure 1C). In both regimes, aeration during the aerobic phase was set at 2 L/min, while mixing during the anoxic phase was maintained at 100 rpm.

2.2. Analytical Measurements

Wastewater parameters were analyzed using Hach-Lange cuvette tests, LCK 514 for COD, LCK 350 for total phosphorus (TP), and LCK 338 for TN in combination with the DR/3900 spectrophotometer and HT 200s mineralizer (Hach-Lange, Berlin, Germany). The mixed liquor suspended solids (MLSS) and the effluent total suspended solids (TSS) were measured gravimetrically using the HE53 Moisture Analyzer (Mettler Toledo, Greifenfesee, Switzerland). The sludge volume index after 30 min of sedimentation (SVI30) was measured following the standard guidelines [46]. To quantify TMP accumulated in the GSBRs, 30 mL of thickened biomass was treated with 100 mL of 30% H2O2 at 60 °C for 72 h to disintegrate organic matter, with pure ground TMPs included as a control to confirm if the TMP material was lost during the procedure. Fourier Transform Infrared Spectroscopy (FTIR, Shimazu IRSpirit, Kyoto Japan) was used to analyze functional group changes in pristine and aged TMPs from the GSBRs.

2.3. Biomass Characteristics and Activity Analysis

The specific surface area (SSA) of AGS and particle size distribution in GSBR samples were measured using a Mastersizer 2000 (Malvern Instruments Ltd., Worcestershire, UK) equipped with a Hydro 2000S dispersion unit. Samples were dispersed in reverse osmosis water with continuous stirring and brief ultrasonic treatment during measurement. Six consecutive measurements were recorded at 5 s intervals and averaged for each reactor. Wet sieve analysis was also carried out according to the procedure described by Jachimowicz et al. [35], to verify the reliability of the Mastersizer measurements. The morphological characteristics of the sludge were observed using an optical microscope. The enzymatic activity under both CA and IA conditions was assessed during the second hour following TMP addition, in accordance with the methodology described in our previous study [47].

2.4. EPS Extraction and Analysis

At the end of the cycle, biomass for EPS and ALE analysis was collected from the GSBRs at the midpoint of the operation period (cycles 214–295), when both aeration regimes demonstrated optimal stability. For each reactor, one measurement was performed weekly over three consecutive weeks during this stable period. Following the method in Rusanowska et al. [48], from each reactor, PN and PS contents were measured in three distinct EPS fractions: soluble EPS (SOL-EPS), loosely bound EPS (LB-EPS), and tightly bound EPS (TB-EPS). PN was determined by the Lowry method, and PS by the anthrone method, with results averaged across the three measurements. ALEs were isolated and measured as described by Jachimowicz et al. [40]. The TOC in the EPS fractions was determined using a TOC Fusion analyzer (Teledyne Tekmar, Ohio, USA).

2.5. Statistical Analysis

All samples were measured in triplicate to ensure data reliability and analyzed using Statistica 13.3 (StatSoft, Oklahoma, USA). Within each aeration regime, comparisons among the five GSBRs were performed using a one-way ANOVA, and significant differences were identified using Tukey’s post hoc test (p < 0.05). Correlations between TMP dose, removal efficiencies, and operational parameters were assessed using Pearson’s coefficient, with significance set at p < 0.05. Comparisons between CA and IA were quantitatively compared for descriptive purposes.

3. Results and Discussion

3.1. GSBRs Performance

The GSBRs’ performance was evaluated using COD, TP, and TN measurements. The average removal efficiencies for these parameters across 450 cycles (~150 days) are summarized in Table 1. In the absence of TMPs (R1), GSBRs performed better under IA than CA in COD (94.53 ± 2.44% vs. 87.32 ± 5.86%) and TP removal (66.4 ± 17.9% vs. 61.8 ± 12.0%). IA likely enhanced TP removal as anoxic phases in the GSBR promoted strictly anaerobic conditions in granule cores, which led to increased phosphorus uptake by phosphorus-accumulating organisms [49], whereas the increased COD removal in IA may have resulted from more effective use of organic carbon for phosphorus release [50]. Conversely, GSBRs under CA achieved higher TN removal (66.7 ± 6.6%) than IA (63.7 ± 8.8%), with TN removal positively correlating with SSA of AGS under CA but negatively under IA. The larger granules observed under CA (Section 3.2) likely formed stable oxygenated surface layers and oxygen-limited inner regions. As a result, multiple nitrogen transformation pathways occurred, enhancing TN removal. In both regimes, the highest TN removal was recorded at the highest TMP dose (500 mg TMP/L, R5), reaching 71.7 ± 7.6% under CA and 69.8 ± 6.1% under IA. The impact of MPs on GSBRs’ performance varies depending on the concentration and type of MPs. For instance, polyvinyl chloride MPs (0–50 mg/L) did not affect COD removal but significantly reduced TP and TN removal by about 52% and 47%, respectively [51], while polystyrene MPs (1–100 mg/L) had no impact on both COD and TP removal [52]. In our study, under both aeration regimes, the removal efficiencies for COD, TN, and TP remained high and consistent across all TMP doses, showing that GSBRs can still perform well under TMP stress. The long-term trends of COD, TP, and TN removal efficiencies under AI mirrored those previously reported for CA [47].

3.2. AGS Particle Size Distribution

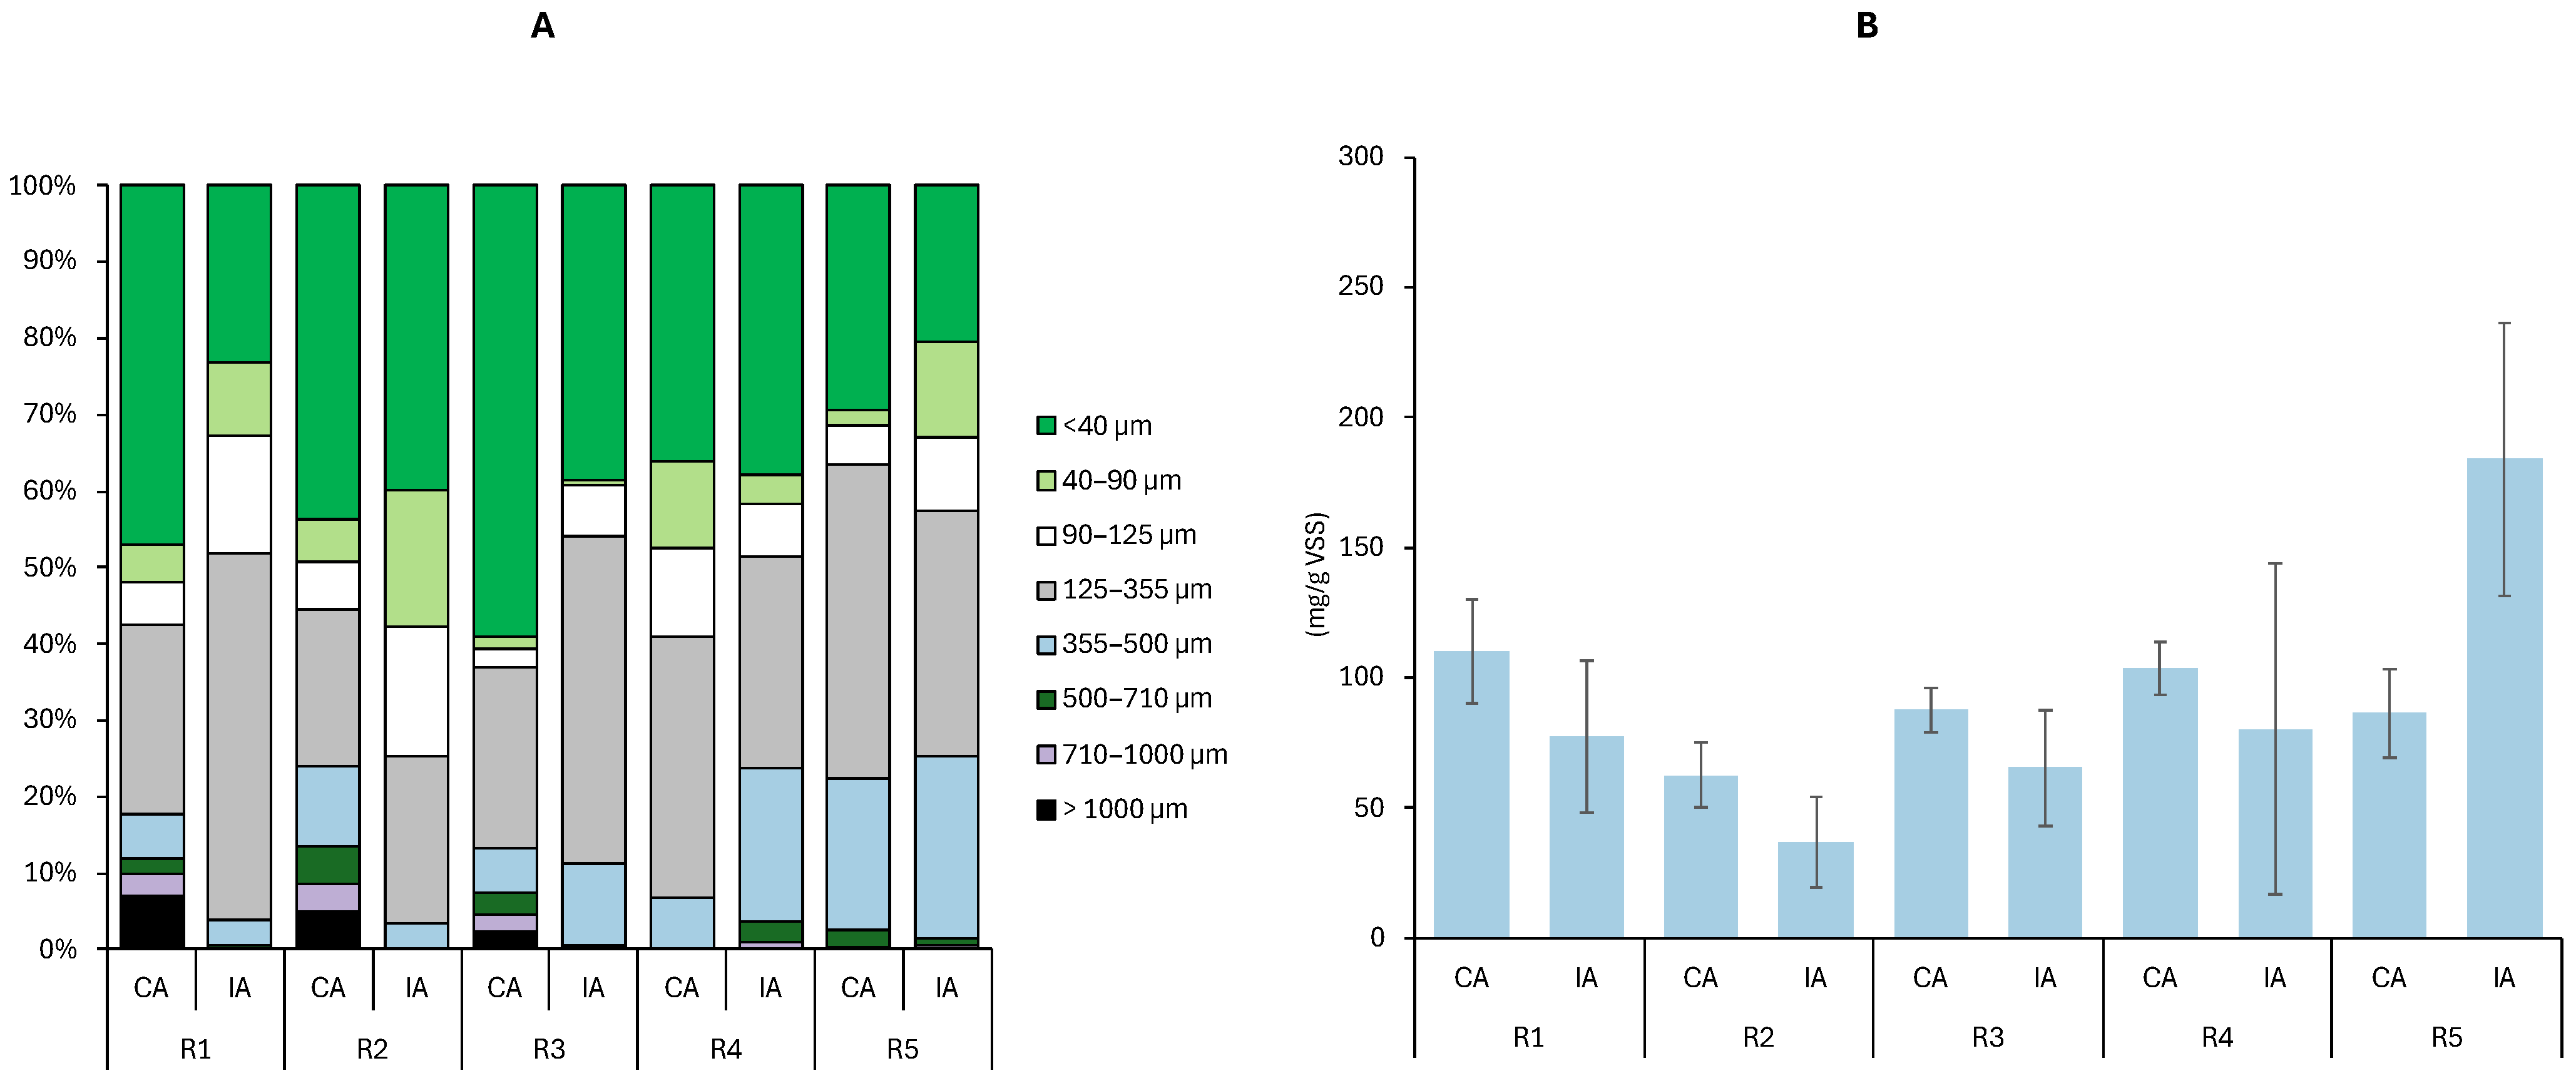
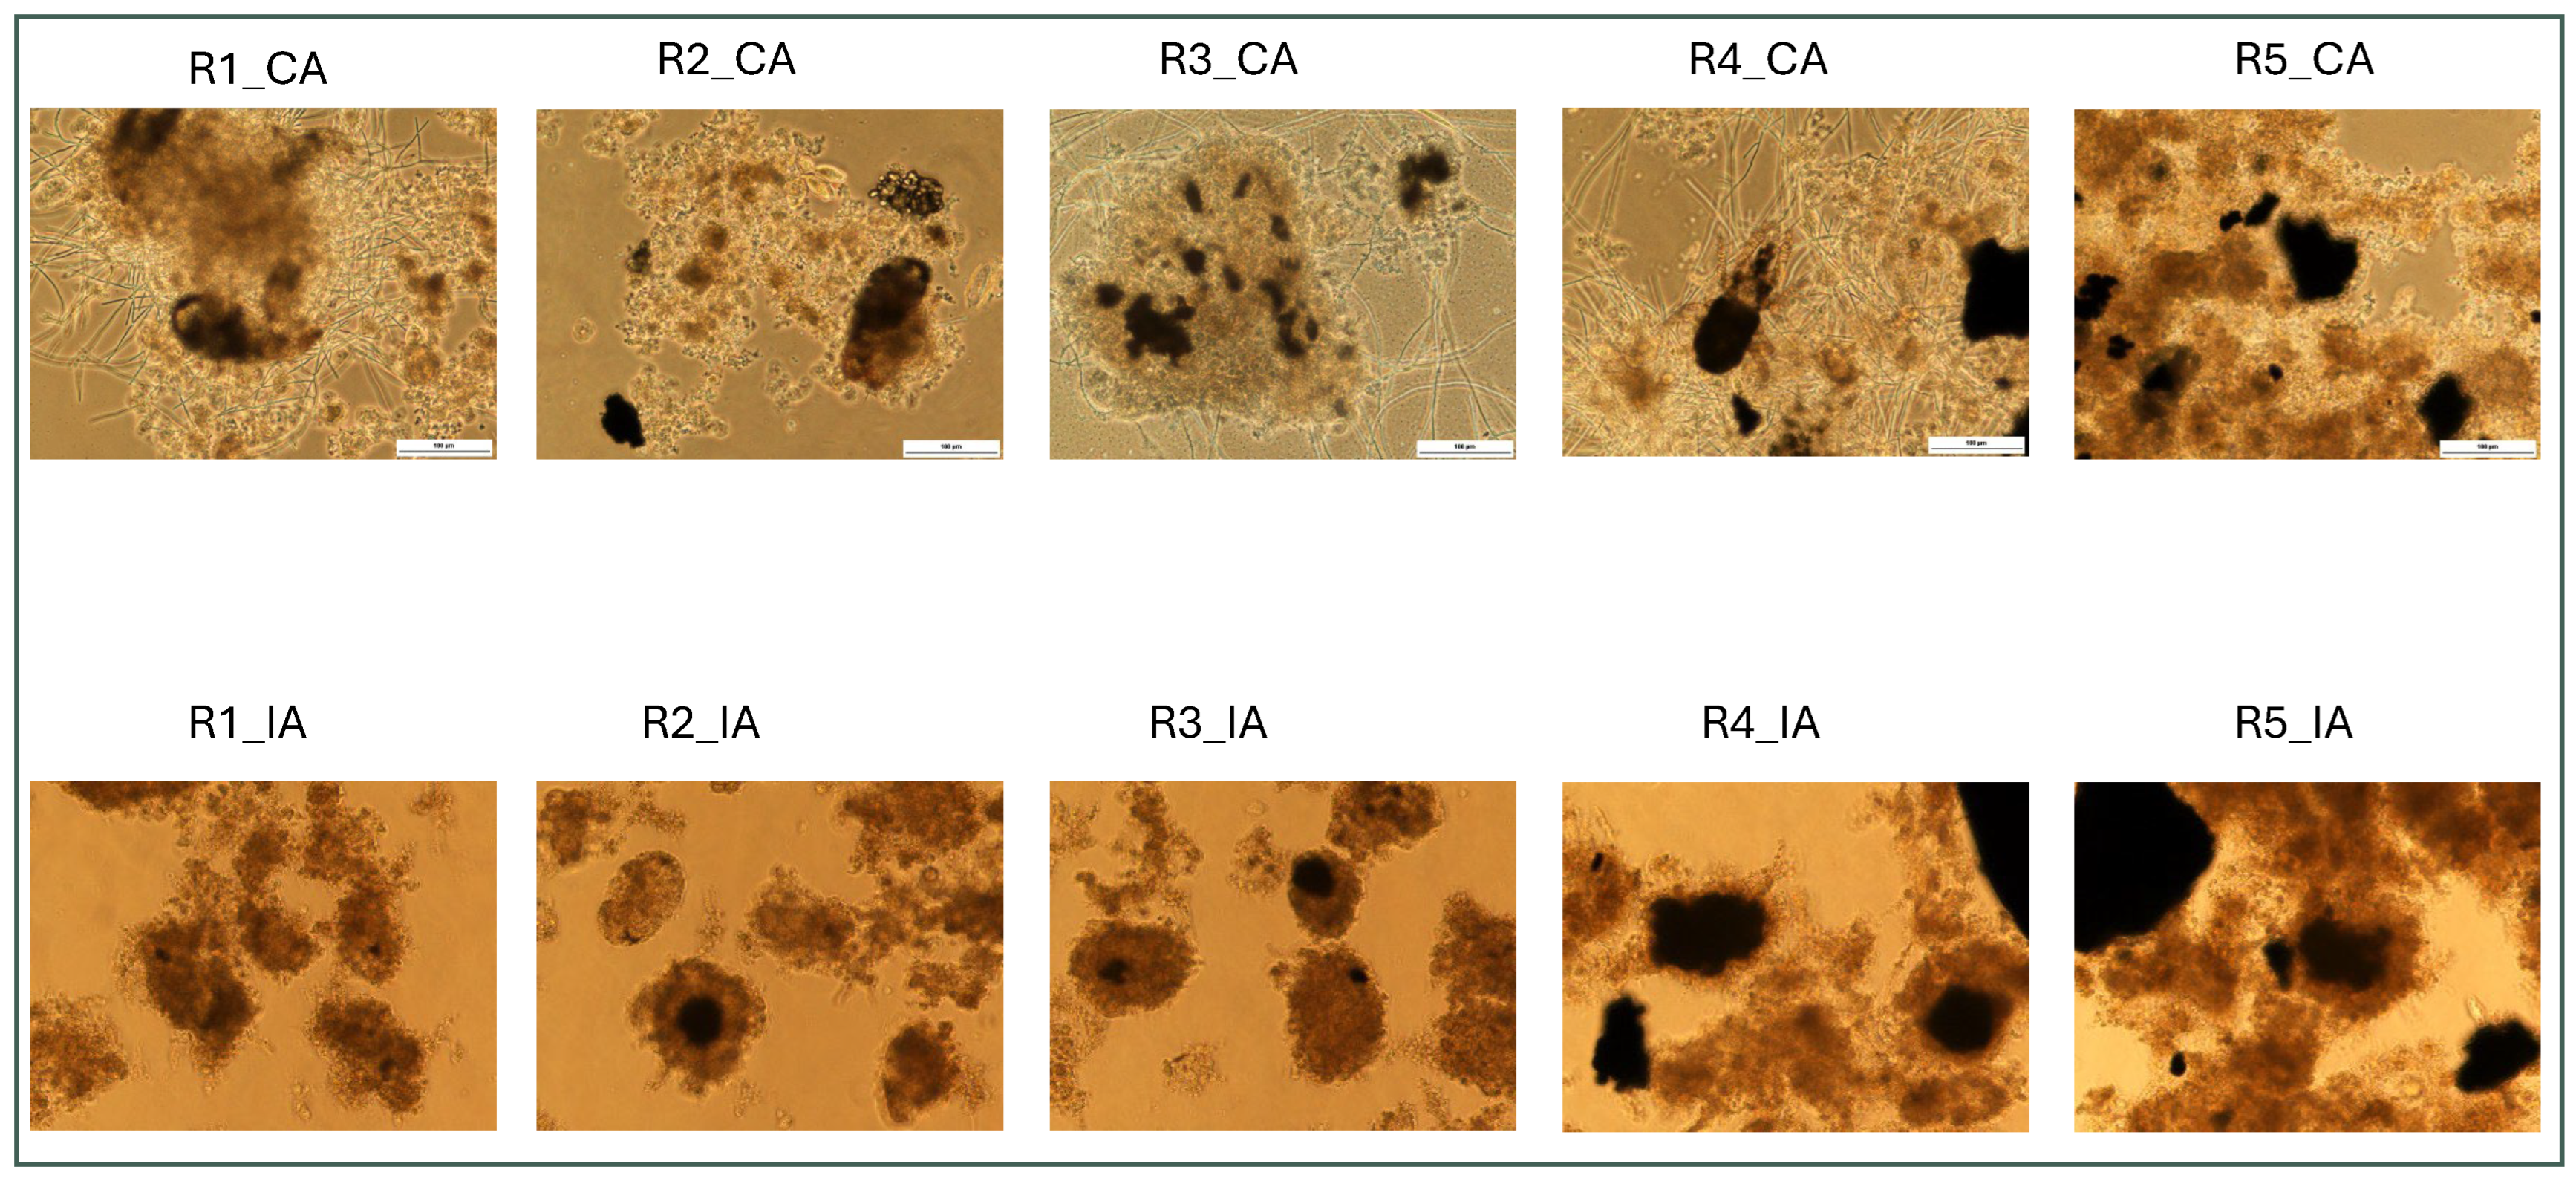
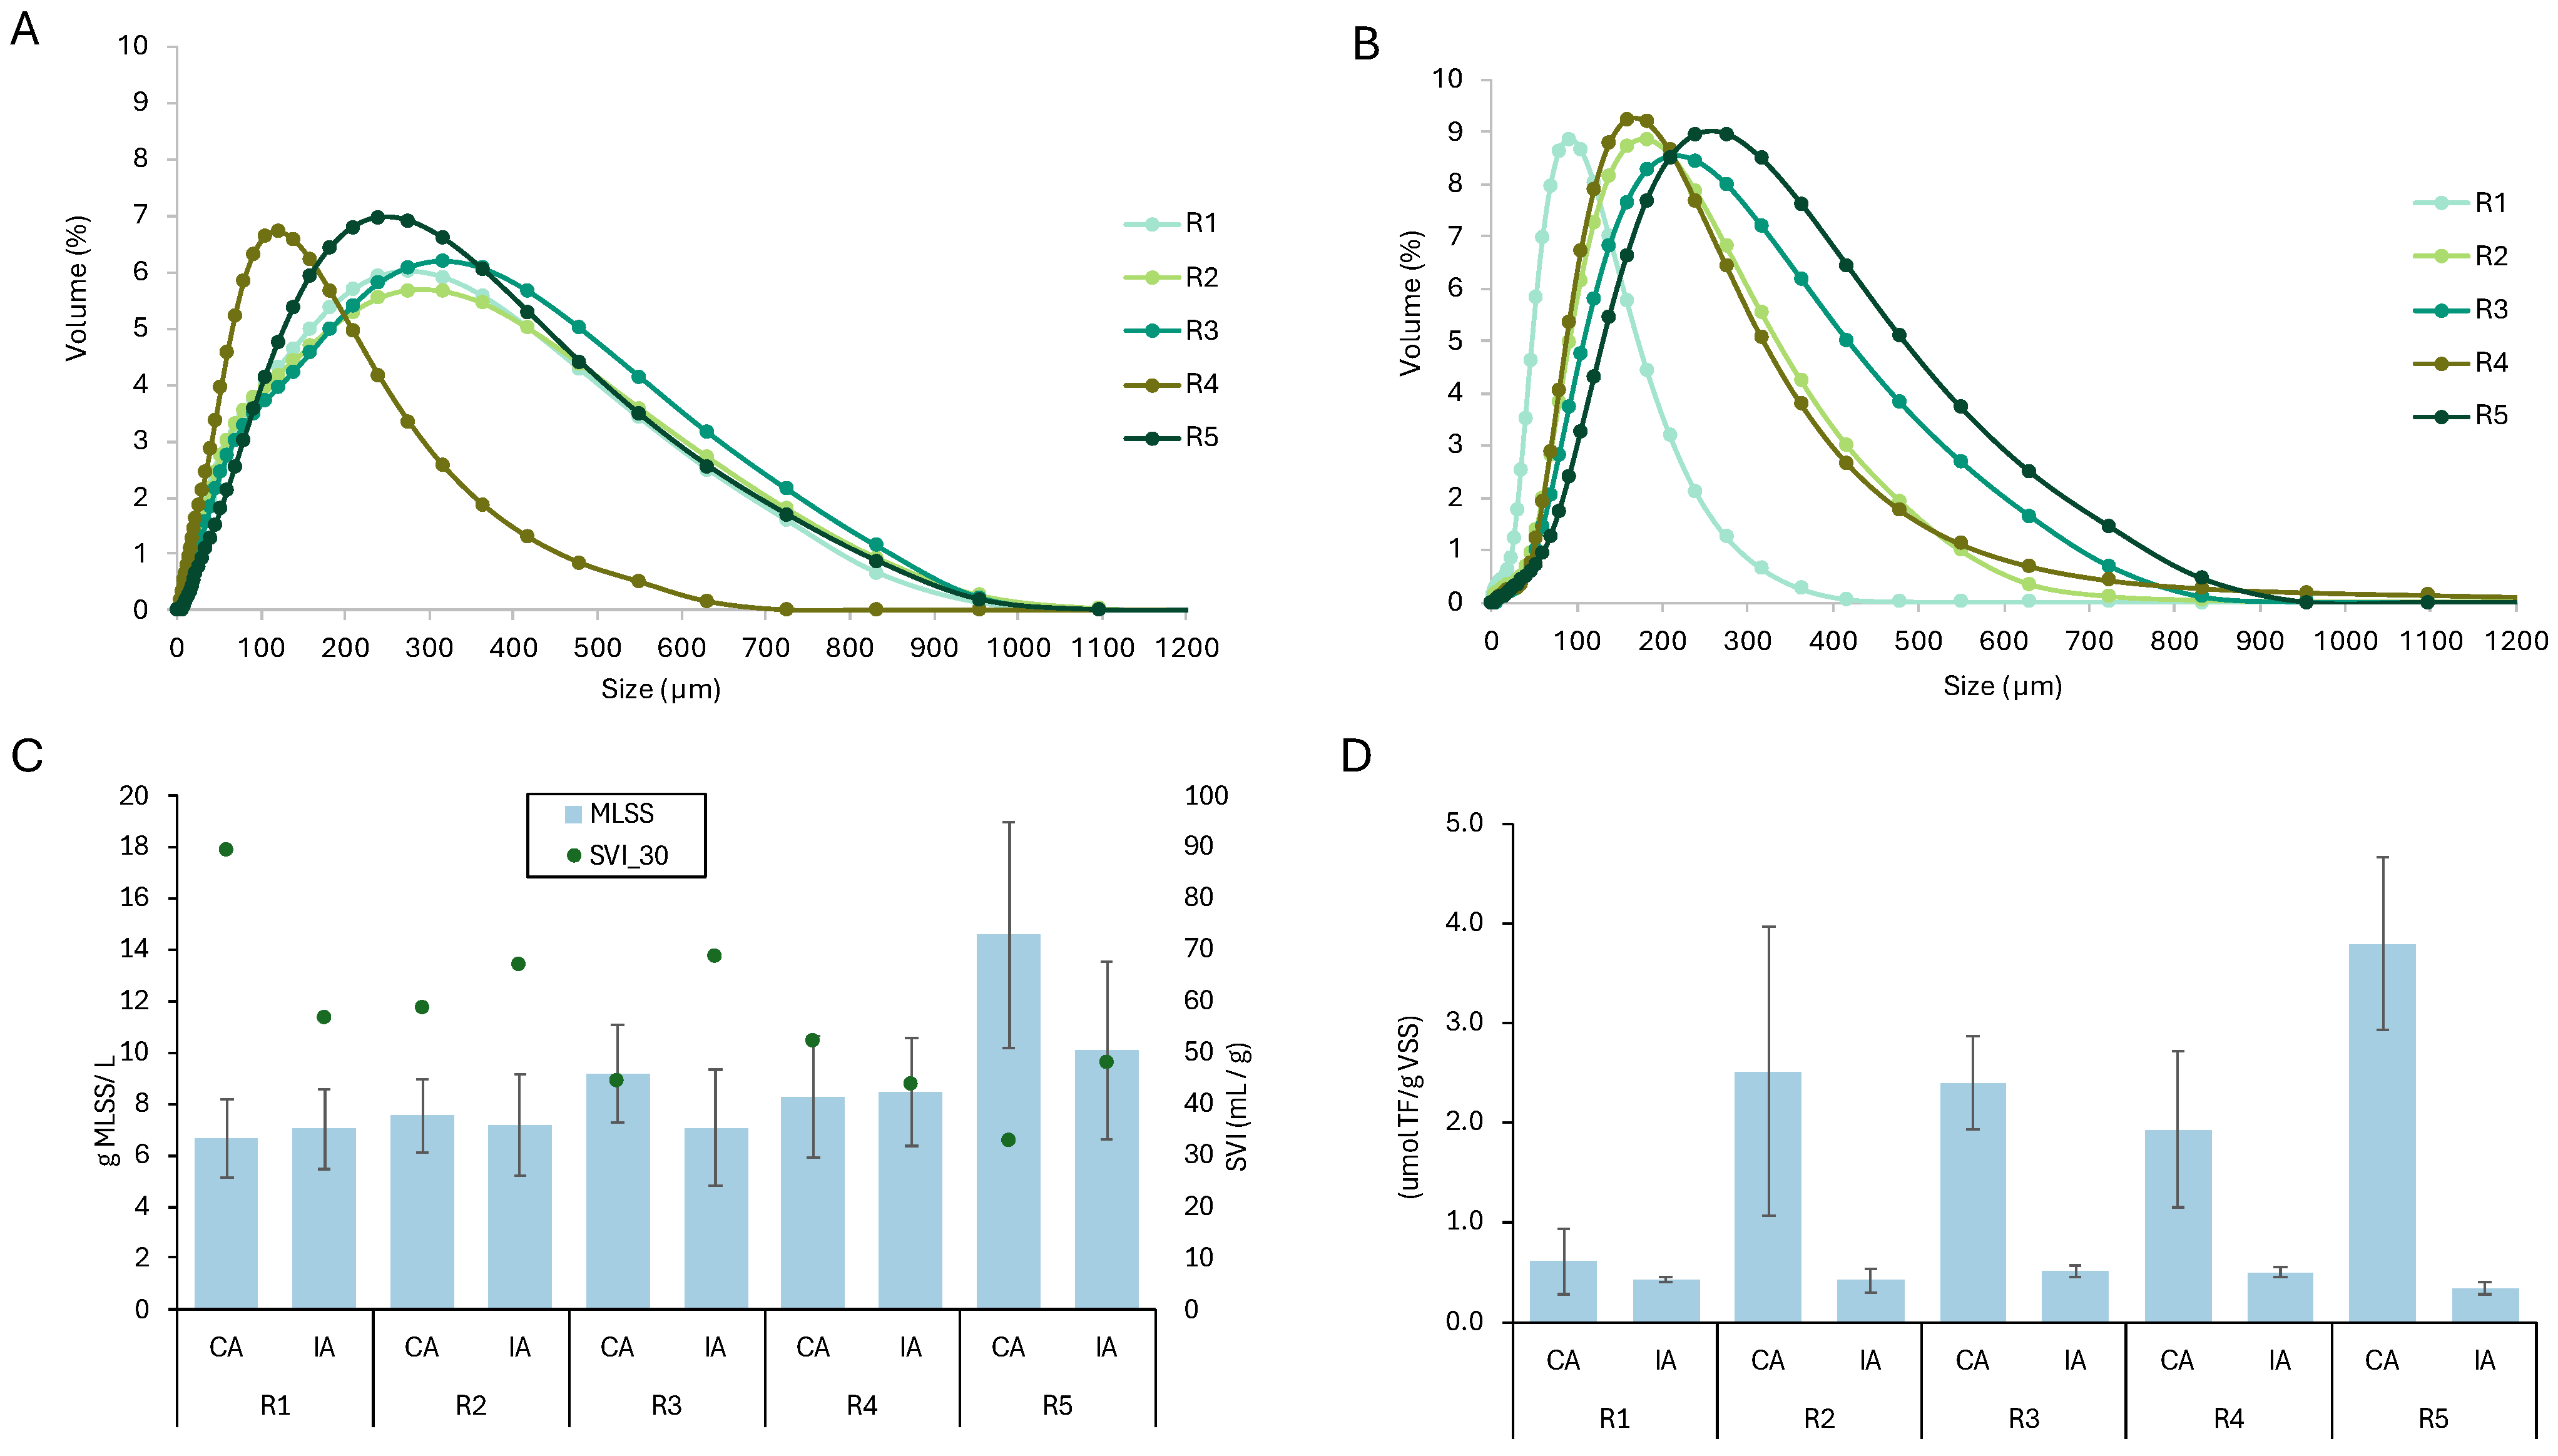
Monitoring granule size distribution is essential, as it affects granule stability and nutrient removal [53]. AGS particle size distributions from Mastersizer analysis are presented in Figure 2, and complementary wet sieve analysis (Figure A1A) showed similar patterns. AGS particles were generally larger and exhibited a broader size distribution under CA than IA. TMPs caused distinct changes in the granule size distribution and SSA of AGS depending on the aeration mode. Under CA, the volume-weighted mean diameter (curve peak) decreased as the TMPs concentration increased from 319.0 µm in R1 to 245.5 µm in R5 (Figure 2A), while the SSA increased from 0.053 m2/g MLSS in R1 to 0.353 m2/g MLSS in R5 (Table A1). The larger particles likely reduced in size due to more shear forces caused by continuous aeration and friction between TMPs and sludge flocs, which disrupted floc structure and promoted breakage. Zheng et al. [54] also observed that the AGS structure gradually loosened as the concentration of polyethylene MP increased up to 200 particles/L in GSBRs under CA. In contrast, under IA, AGS particles showed narrower distributions, with the volume-weighted mean diameter increasing with increasing TMP concentration from 105.1 µm in R1 to 286.2 µm in R5 (Figure 2B), while the SSA decreased from 0.121 m2/g in R1 to 0.036 m2/g in R5 (Table A2). The initially smaller particles likely increased in size as TMPs facilitated floc aggregation during non-aeration periods, especially since the TMPs were approximately 300 µm in size. Svierzoski et al. [39] reported that, compared to CA, IA promoted the formation of compact, optimally sized granules, enhancing oxygen penetration, settling, and overall reactor performance. Three different polymer types of MPs caused a significant decrease in sludge floc size compared with the control, with PVC producing the smallest flocs [55]. Excessive filamentous proliferation can disrupt the EPS by reducing PN content and increasing PS, weakening floc cohesion and contributing to smaller and less stable AGS particle sizes [56]. Regardless of the TMP dose, the optical microscope images (Figure A2) showed that GSBRs under CA had more filamentous materials than those under IA, indicating that IA promoted more stable AGS formation and inhibited filamentous bulking. Overall, compared to IA, CA produced larger particles but higher SSA, likely because TMPs did not bind tightly to flocs under CA, resulting in loose structures with a greater surface area. Such porous MP environments create favorable niches that enhance the persistence and spread of antibiotic resistance genes [47,57]. In contrast, IA promoted stronger TMP–floc interactions, forming denser, less porous aggregates with lower SSA despite smaller particle sizes.

3.3. Impact of TMP on Granular Biomass

The impact of TMPs on GSBRs’ biomass and TSS was more pronounced under CA, although similar trends were observed under IA. Under CA, MLSS exhibited a strong positive correlation with TMP concentration (r = 0.72, p < 0.05), with significant increases in R3, R4, and R5 compared to R1 (Figure 2C). All TMP-dosed reactors (R2–R5) exhibited a significant decrease in SVI30, ranging from 80 ± 4 mL/g MLSS in R1 to as low as 40 ± 12 mL/g MLSS in R5. The increase in MLSS and improved settleability under CA were attributed to the accumulation of “heavy” TMPs in the GSBRs, ranging from 17.1% in R2 to 52.6% in R5, as detailed in our previous publication [47]. Under IA, MLSS also showed a positive correlation with TMP concentration (r = 0.65, p < 0.05), but only R5 (10075 ± 3455 mg MLSS/L) demonstrated a significant increase compared to R1 (7021 ± 1545 mg MLSS/L). SVI30 values under IA remained statistically unchanged across all GSBRs. TMP accumulation remained consistently lower than in the corresponding CA GSBRs but still showed a dose-dependent increase, reaching 13.39% (±1.54) in R2, 16.16% (±1.93) in R3, 27.29% (±1.74) in R4, and 33.03% (±1.88) in R5. Overall, the better TMP accumulation in biomass under CA promoted higher MLSS and significantly improved settling (lower SVI30), whereas IA resulted in lower TMP retention, smaller MLSS increases, and stable SVI30. The better TMP accumulation under CA was likely due to the larger granules, which provided more matrix space for TMP embedding.
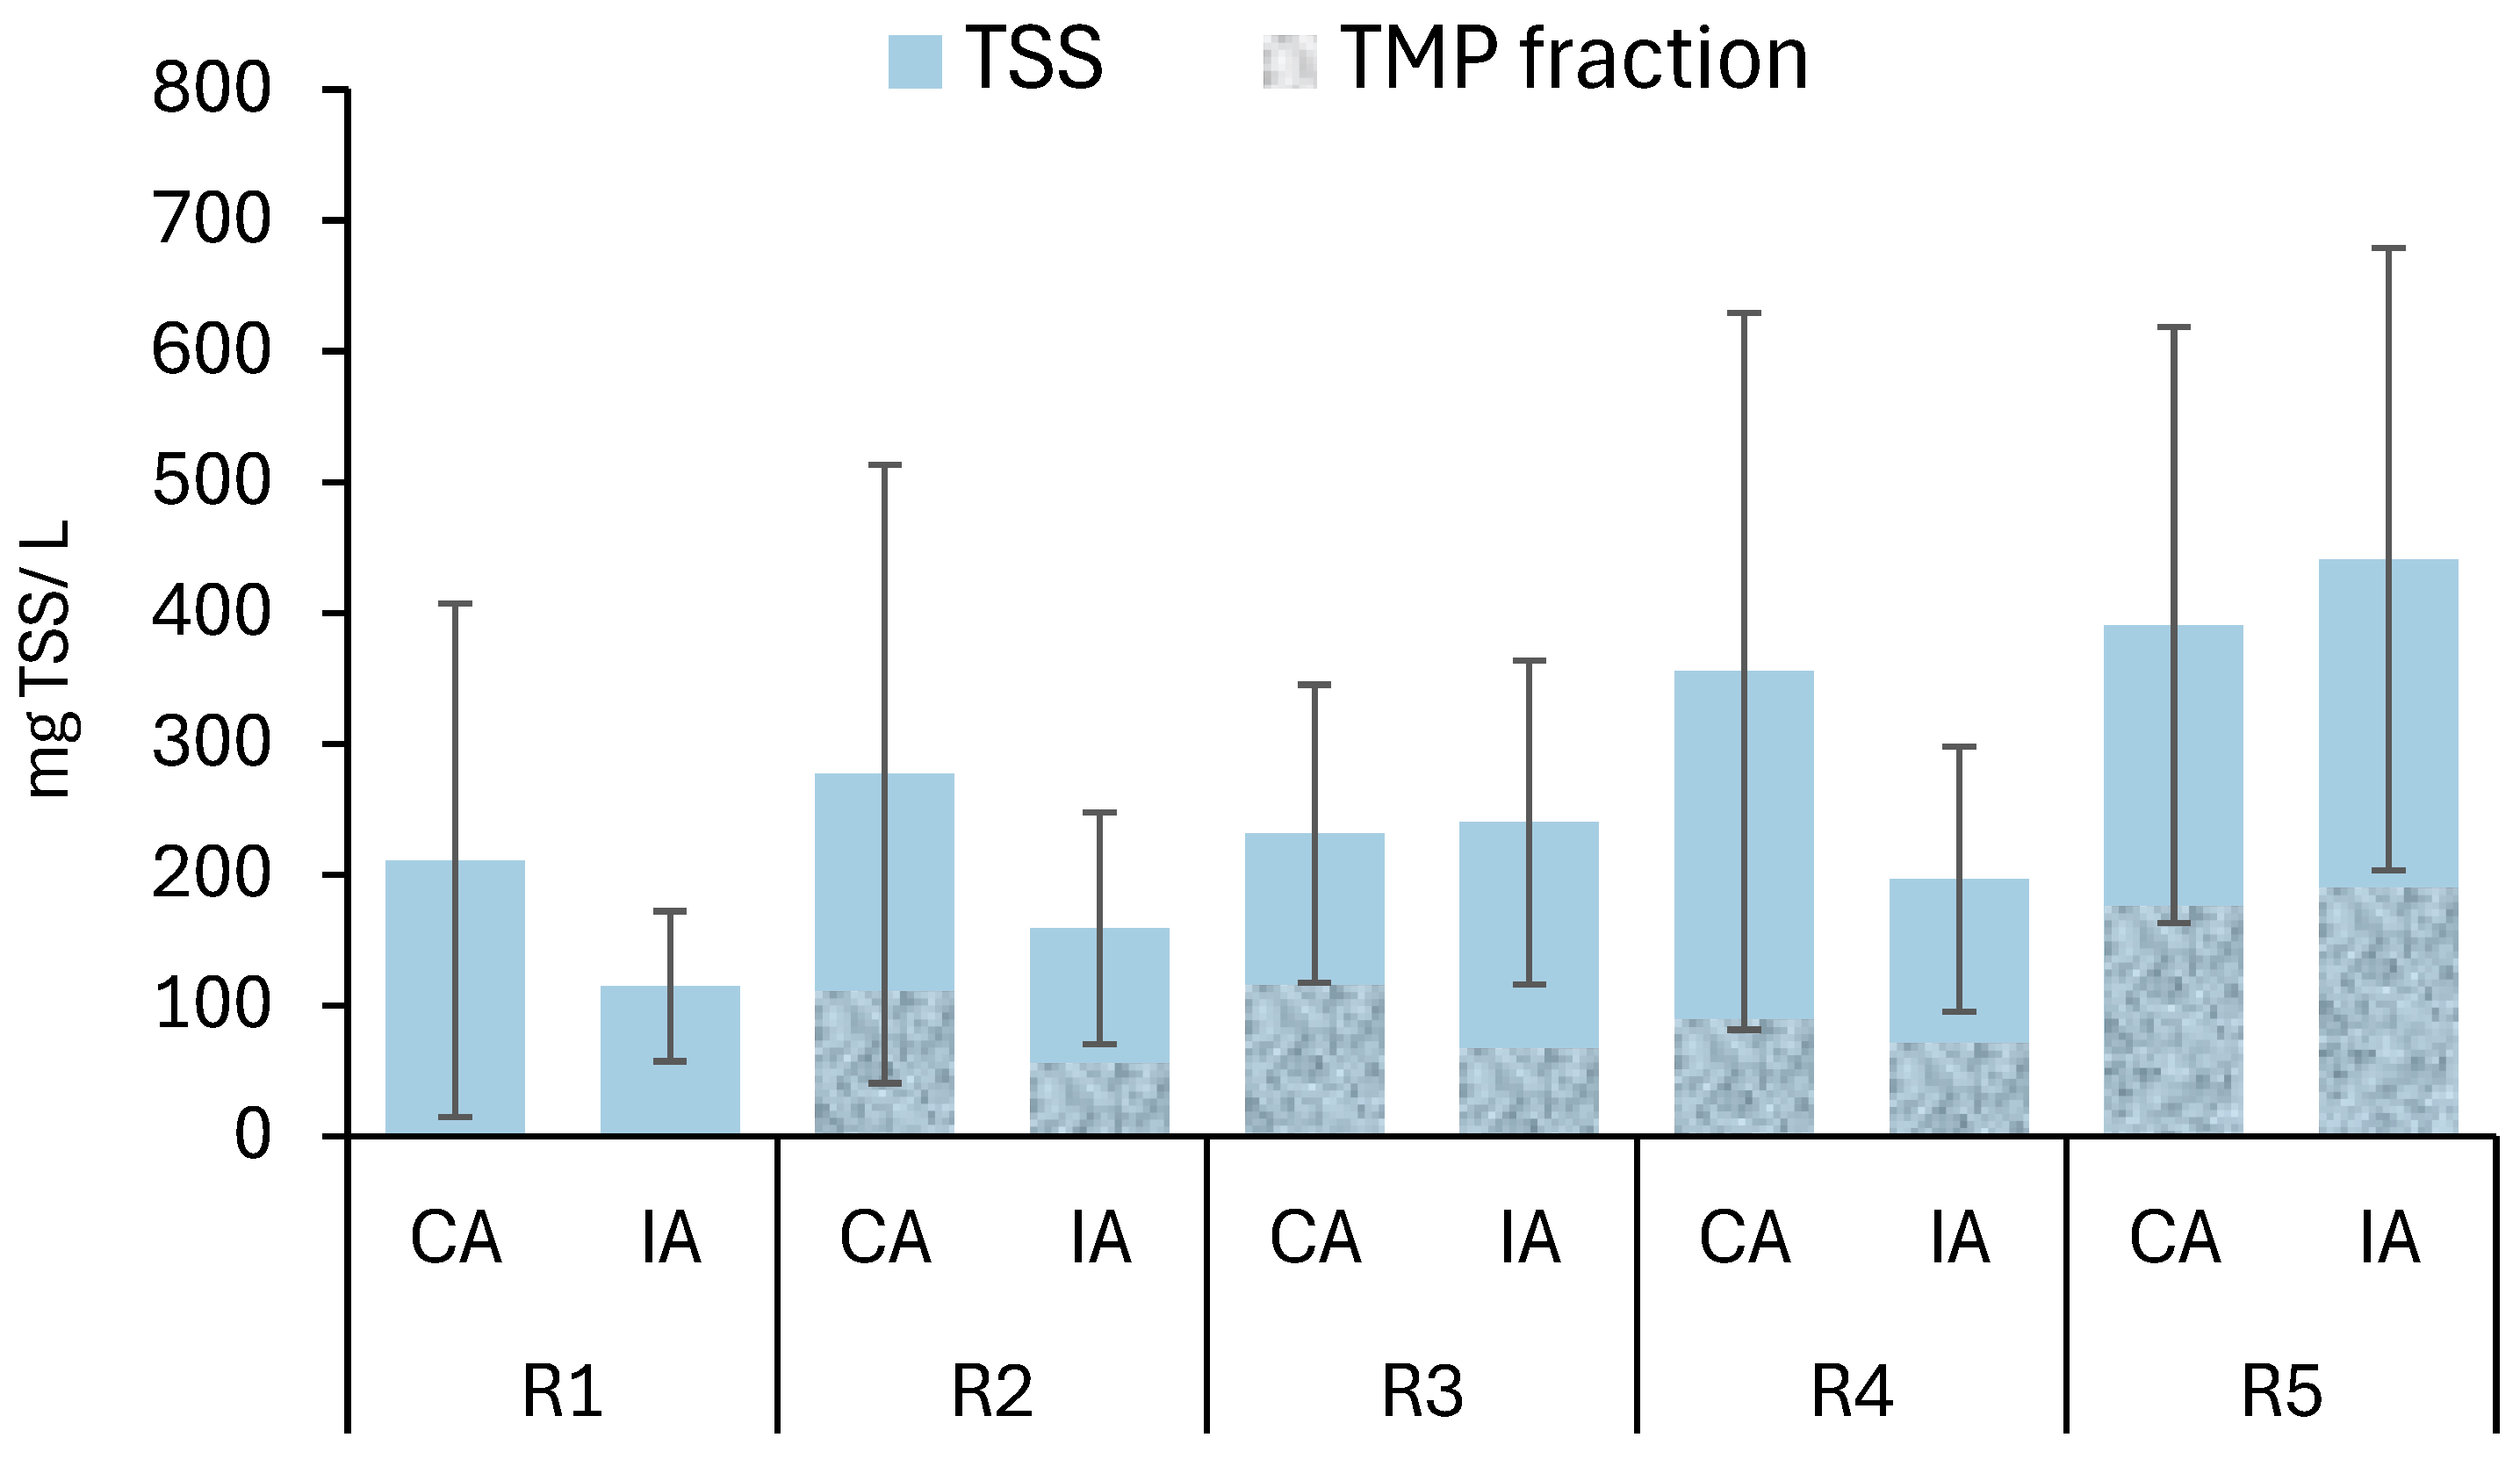
Under CA, effluent TSS generally increased with TMPs dose, from 210.8 mg/L in R1 to 390.6 mg/L in R5. Under IA, effluent TSS was more variable, ranging from 114.7 mg/L in R1 to 441 mg/L in R5 (Figure A3). In both aeration regimes, the TMP fraction within TSS did not strictly correspond to the applied TMP doses, exceeding 40% of effluent TSS in R5. The higher TSS observed under CA (R1–R4) compared to IA may be related to the greater presence of filamentous materials (Figure A2), which likely contributed to increased suspended solids in the effluent. Unlike other MPs, TMPs increased MLSS and enhanced settling at high concentrations. For instance, in GSBRs under CA, polyethylene MPs (10–50 mg/L) did not affect MLSS (4.1–8.8 g/L) but, at 50 mg/L, significantly increased SVI30 (56.3 ± 5.9 mL/g vs. 46.1 ± 4.8 mL/g in the control), deteriorating settling, promoting larger granule formation, and causing biomass washout [40]. While our results suggest that CA is more effective than IA at incorporating TMPs into biomass, some TMPs can still be lost in the effluent, regardless of the aeration regime, suggesting a potential need for further polishing, such as membrane filtration.

3.4. Dehydrogenase Activity

Dehydrogenase is an intracellular enzyme that plays a central role in the oxidation of organic compounds during cellular respiration, making its activity a valuable indicator of microbial growth and metabolic function [24,58]. Under CA, a linear correlation was observed between TMP dose and dehydrogenase activity (r = 0.78, p < 0.05), whereas under IA, microbial activity remained stable despite increasing TMP concentration (Figure 2D). Under CA conditions, all TMP-dosed GSBRs compared to the control (0.61 ± 0.32 μmol TF/g VSS), exhibited an elevated dehydrogenase activity reaching 3.79 ± 0.87 μmol TF/g VSS in R5. The elevated activity likely resulted from TMP-induced stress, with continuous oxygen supply providing the energy needed to maintain cellular responses. In contrast, under IA, enzymatic activity was highest in R1 (0.42 ± 0.03 μmol TF/g VSS) and remained consistently low across all GSBRs. The limited oxygen and lower TMP accumulation under IA likely compelled microbes to prioritize survival over energy-intensive metabolic responses, thereby maintaining dehydrogenase activity at a low and stable level. Gan et al. [59] observed that exposure to polystyrene MPs (50–200 mg/L) increased lactate dehydrogenase levels, indicating altered permeability and membrane damage. The higher SSA under CA may have increased microbial exposure to TMP, further stimulating metabolic processes and, consequently, heightened dehydrogenase activity.

3.5. EPS Composition

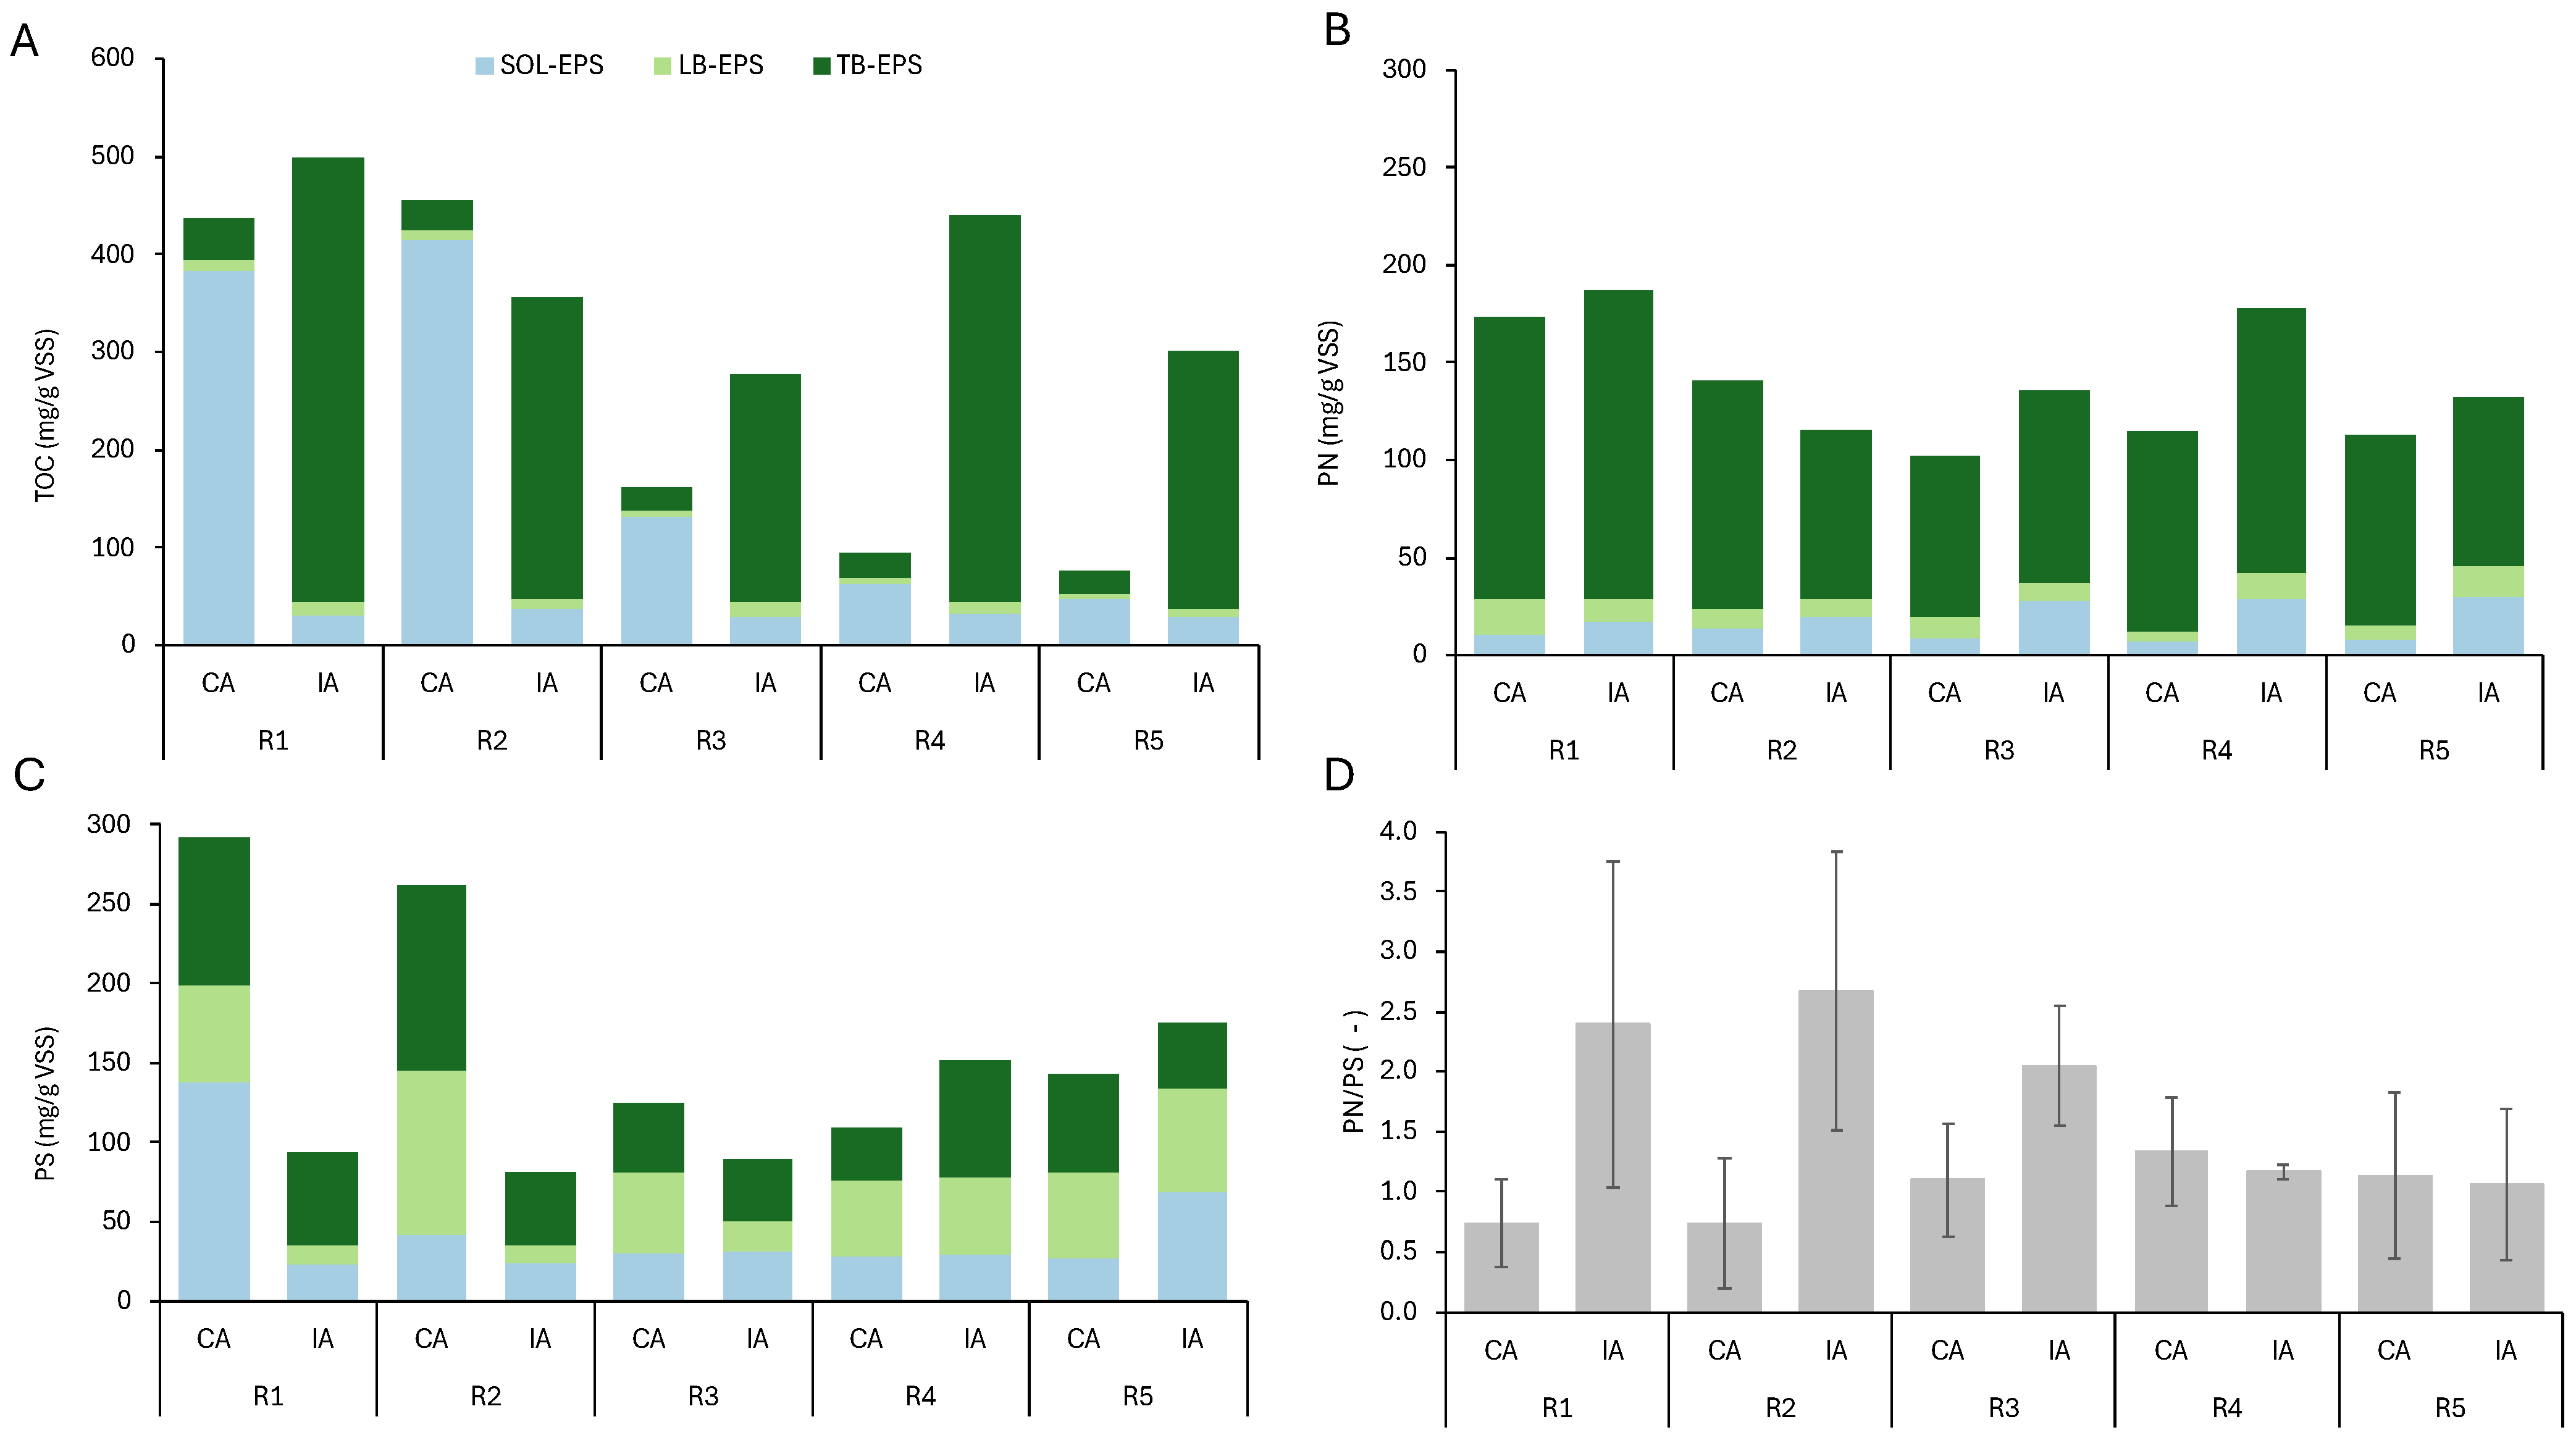
At high TMP concentrations (R3–R5), total EPS (expressed as TOC) was significantly reduced under both aeration regimes, with a greater reduction under CA (66–84%) than under IA (45–49%) (Figure 3A). The smaller impact of TMP on total EPS under IA was likely due to the dominance of TB-EPS, which contributed 81–91% of the total EPS in all IA GSBRs, compared with only 9–30% under CA. The continuous oxygen supply during CA may have stimulated microbial lysis or the release of soluble microbial products [60], contributing to the predominance of SOL-EPS. Consequently, the pronounced EPS reductions under CA were mainly associated with decreases in the SOL-EPS fraction, indicating that cells increasingly utilized easily accessible organic carbon for growth and repair rather than secreting EPS as a protective response to TMP. EPS is crucial for granulation and stability of AGS, and its reduction can lead to granule disintegration [61]. The dense, compact structure of TB-EPS and its strong association with cells and other matrix components likely made it more resistant to TMP disruption, thereby limiting EPS degradation and loss during IA.
Regardless of TMP concentration or aeration regime, the TB-EPS fraction contributed over 70% of PN content across all GSBRs (Figure 3B). The high TB-EPS proportion helped sustain and prevent any significant changes in the overall PN levels. The observed share of PN content in TB-EPS was similar to levels observed in other studies on AGS [31,35]. While the PN content in LB-EPS and TB-EPS fractions showed no clear aeration or TMP-related trends, levels of PN in SOL-EPS fraction were consistently higher under IA than CA across all GSBRs, increasing from 38% (R1) to 71% (R5) as the TMP dose increased. The increase likely resulted from partial detachment or leakage of proteinaceous materials from cells due to the fluctuating forces associated with IA, rather than complete cell lysis. A similar phenomenon was observed in a fixed-film activated sludge bioreactor, where the overall PN content remained stable while enhanced shear and hydrodynamic stress under IA increased the SOL-EPS fraction [62].
Both the aeration regime and TMP influenced EPS PS content (Figure 3C). In the absence of TMPs (R1), PS levels were higher under CA (291.88 ± 118.38 mg/g VSS) than under IA (93.07 ± 27.53 mg/g VSS). Similarly, PS levels in EPS from activated sludge rose with increased airflow, whereas PN levels remained largely unchanged across the same air intensities in modified sequential batch reactors [63]. The higher, more stable oxygen supply in CA likely promoted greater energy production, facilitating increased PS synthesis. TMPs caused distinct changes in total PS content depending on the aeration regime. Compared to the control (R1), under CA, total PS content decreased significantly in GBSRs with high TMP concentrations, with reductions of around 57%, 62%, and 51% in R3, R4, and R5, respectively. In contrast, under IA, total PS content rose by around 38% and 46% in R4 and R5. Since PS is predominantly located on the outer layer of AGS [50,64], it was likely more impacted by TMP under CA. The increasing granule sizes observed as the TMP concentration rose may explain the increasing PS content under IA, as larger granules typically contain more EPS [32], particularly PS, to maintain structural stability.
Under IA, lower PS relative to PN resulted in a higher PN/PS ratio (2.39–2.05) in the control GSBR and at low TMP doses (R1–R3), nearly twice that under CA (0.74–1.10) (Figure 3D). A similar trend was reported by Svierzoski et al. [39], who found that the PN/PS ratio in a continuous-flow AGS system increased from 1.8 under CA to 2.8–3.1 under various IA regimes, attributed to IA-induced PN formation. Wang et al. [65] also reported that switching aeration from CA to IA caused the PN/PS ratio to increase from 4.58 ± 0.15 to 5.22 ± 0.39, followed by a slight decrease to 4.83 ± 0.33. The PN/PS ratio under IA decreased significantly at high TMP concentrations, dropping to 1.17 (R4) and 1.07 (R5), compared with 2.39 in the control. A higher PN/PS ratio is typically associated with improved sludge compactness and settling ability [32], which may explain why SVI30 under IA remained relatively stable in R1–R3, despite lower TMP accumulation, and showed settling performance comparable to R4 and R5, where TMP buildup was higher. Despite this reduction, the PN/PS ratios in GSBRs with high TMP doses under IA were still comparable to those under CA (1.34 in R4 and 1.14 in R5), indicating a similar EPS compositional balance across both aeration regimes.
As depicted in Figure A1B, ALE levels were higher under CA (110.13 ± 19.71 mg/g VSS) than under IA (86.92 ± 34.58 mg/g VSS) in the control GSBRs (R1). Following TMP addition, under CA, ALE content significantly decreased in R2 (62.47 ± 12.37 mg/g VSS) compared to R1 but remained relatively stable at higher TMP doses (R3–R5), ranging between 86.30 and 103.58 mg/g VSS. In contrast, under IA, ALEs also dropped at R2 (45.62 ± 20.76 mg/g VSS), but then progressively increased with TMP dose, peaking at R5 (215.09 ± 60.40 mg/g VSS). Stable and elevated ALE content in sludge promoted granulation as reported by Schambeck et al. [66]. The observed decrease in particle size under CA and the corresponding increase under IA may explain the ALE trends, as ALE levels followed a similar pattern. The higher ALE content under CA (R1–R4) compared to IA was likely due to the consistently larger and more developed granules formed under CA conditions. ALEs function as hydrogels, enhancing granule strength, elasticity, and hydrophobicity, while forming a dense matrix that shields microorganisms [27,55]. The elevated ALEs in R5 under IA likely resulted from the high TMP dose, combined with progressive granule aggregation, which promoted the selective accumulation of ALEs as a protective matrix relative to other EPS components. In contrast to our study, polyethylene MPs at a low concentration (50 mg/L) significantly doubled ALEs from 238.7 to 441.6 mg/g MLSS in AGS under CA [40], indicating that ALE levels in AGS vary with MP type. Overall, TMP concentrations of 50–250 mg/L affected ALE content similarly under both aeration modes; however, at 500 mg/L, GSBRs accumulated more ALE.

3.6. EPS Interactions with Physicochemical Parameters

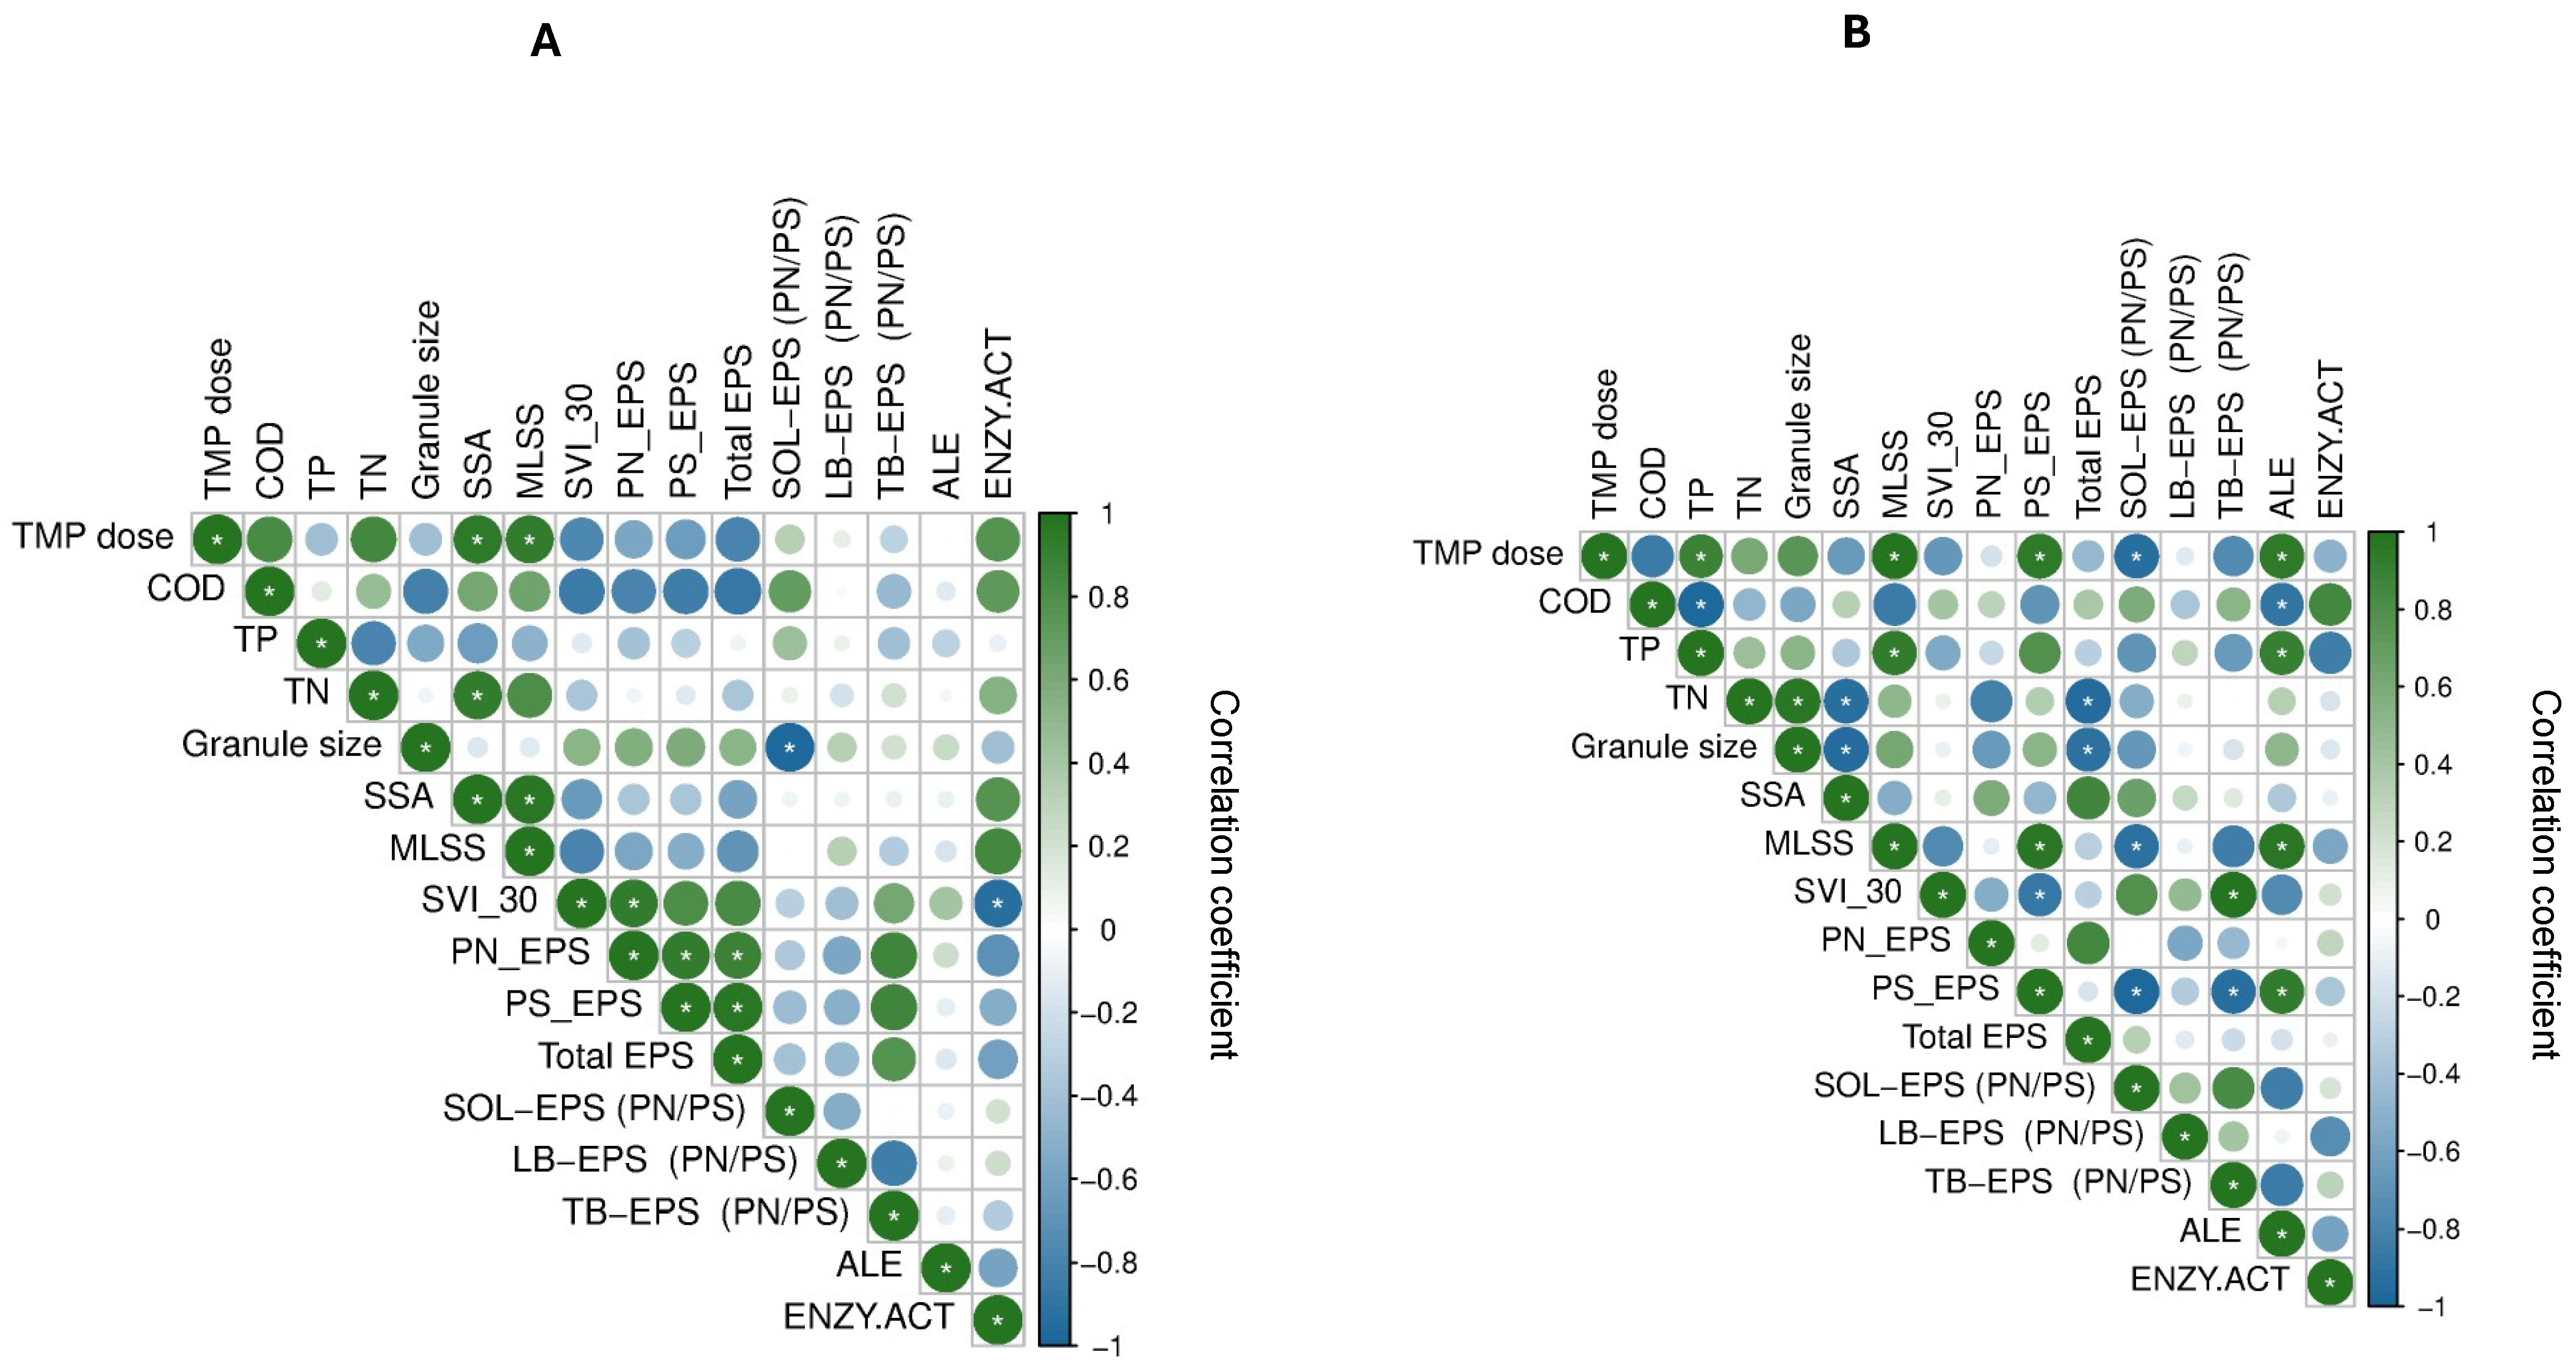
More correlations between EPS compounds and physicochemical parameters were observed under IA than under CA (Figure 4). Under CA, only the PN/PS of SOL-EPS showed a negative correlation with granule size. Under IA, total EPS correlated negatively with granule size and TN removal efficiency. ALE content correlated positively with TMP dose and TP removal efficiency, but negatively with COD removal efficiency. The positive correlation of PS content with TMP dose, MLSS, and ALE, alongside its negative correlation with SVI30, confirmed that elevated PS promotes sludge aggregation and enhances structural stability under stress. Moreover, PS and amide III PN are key to AGS stability [67], while TMP exposure increased EPS PS in algae Chlorella vulgaris by 1.3–7.5 times at 20–160 mg/L [68].
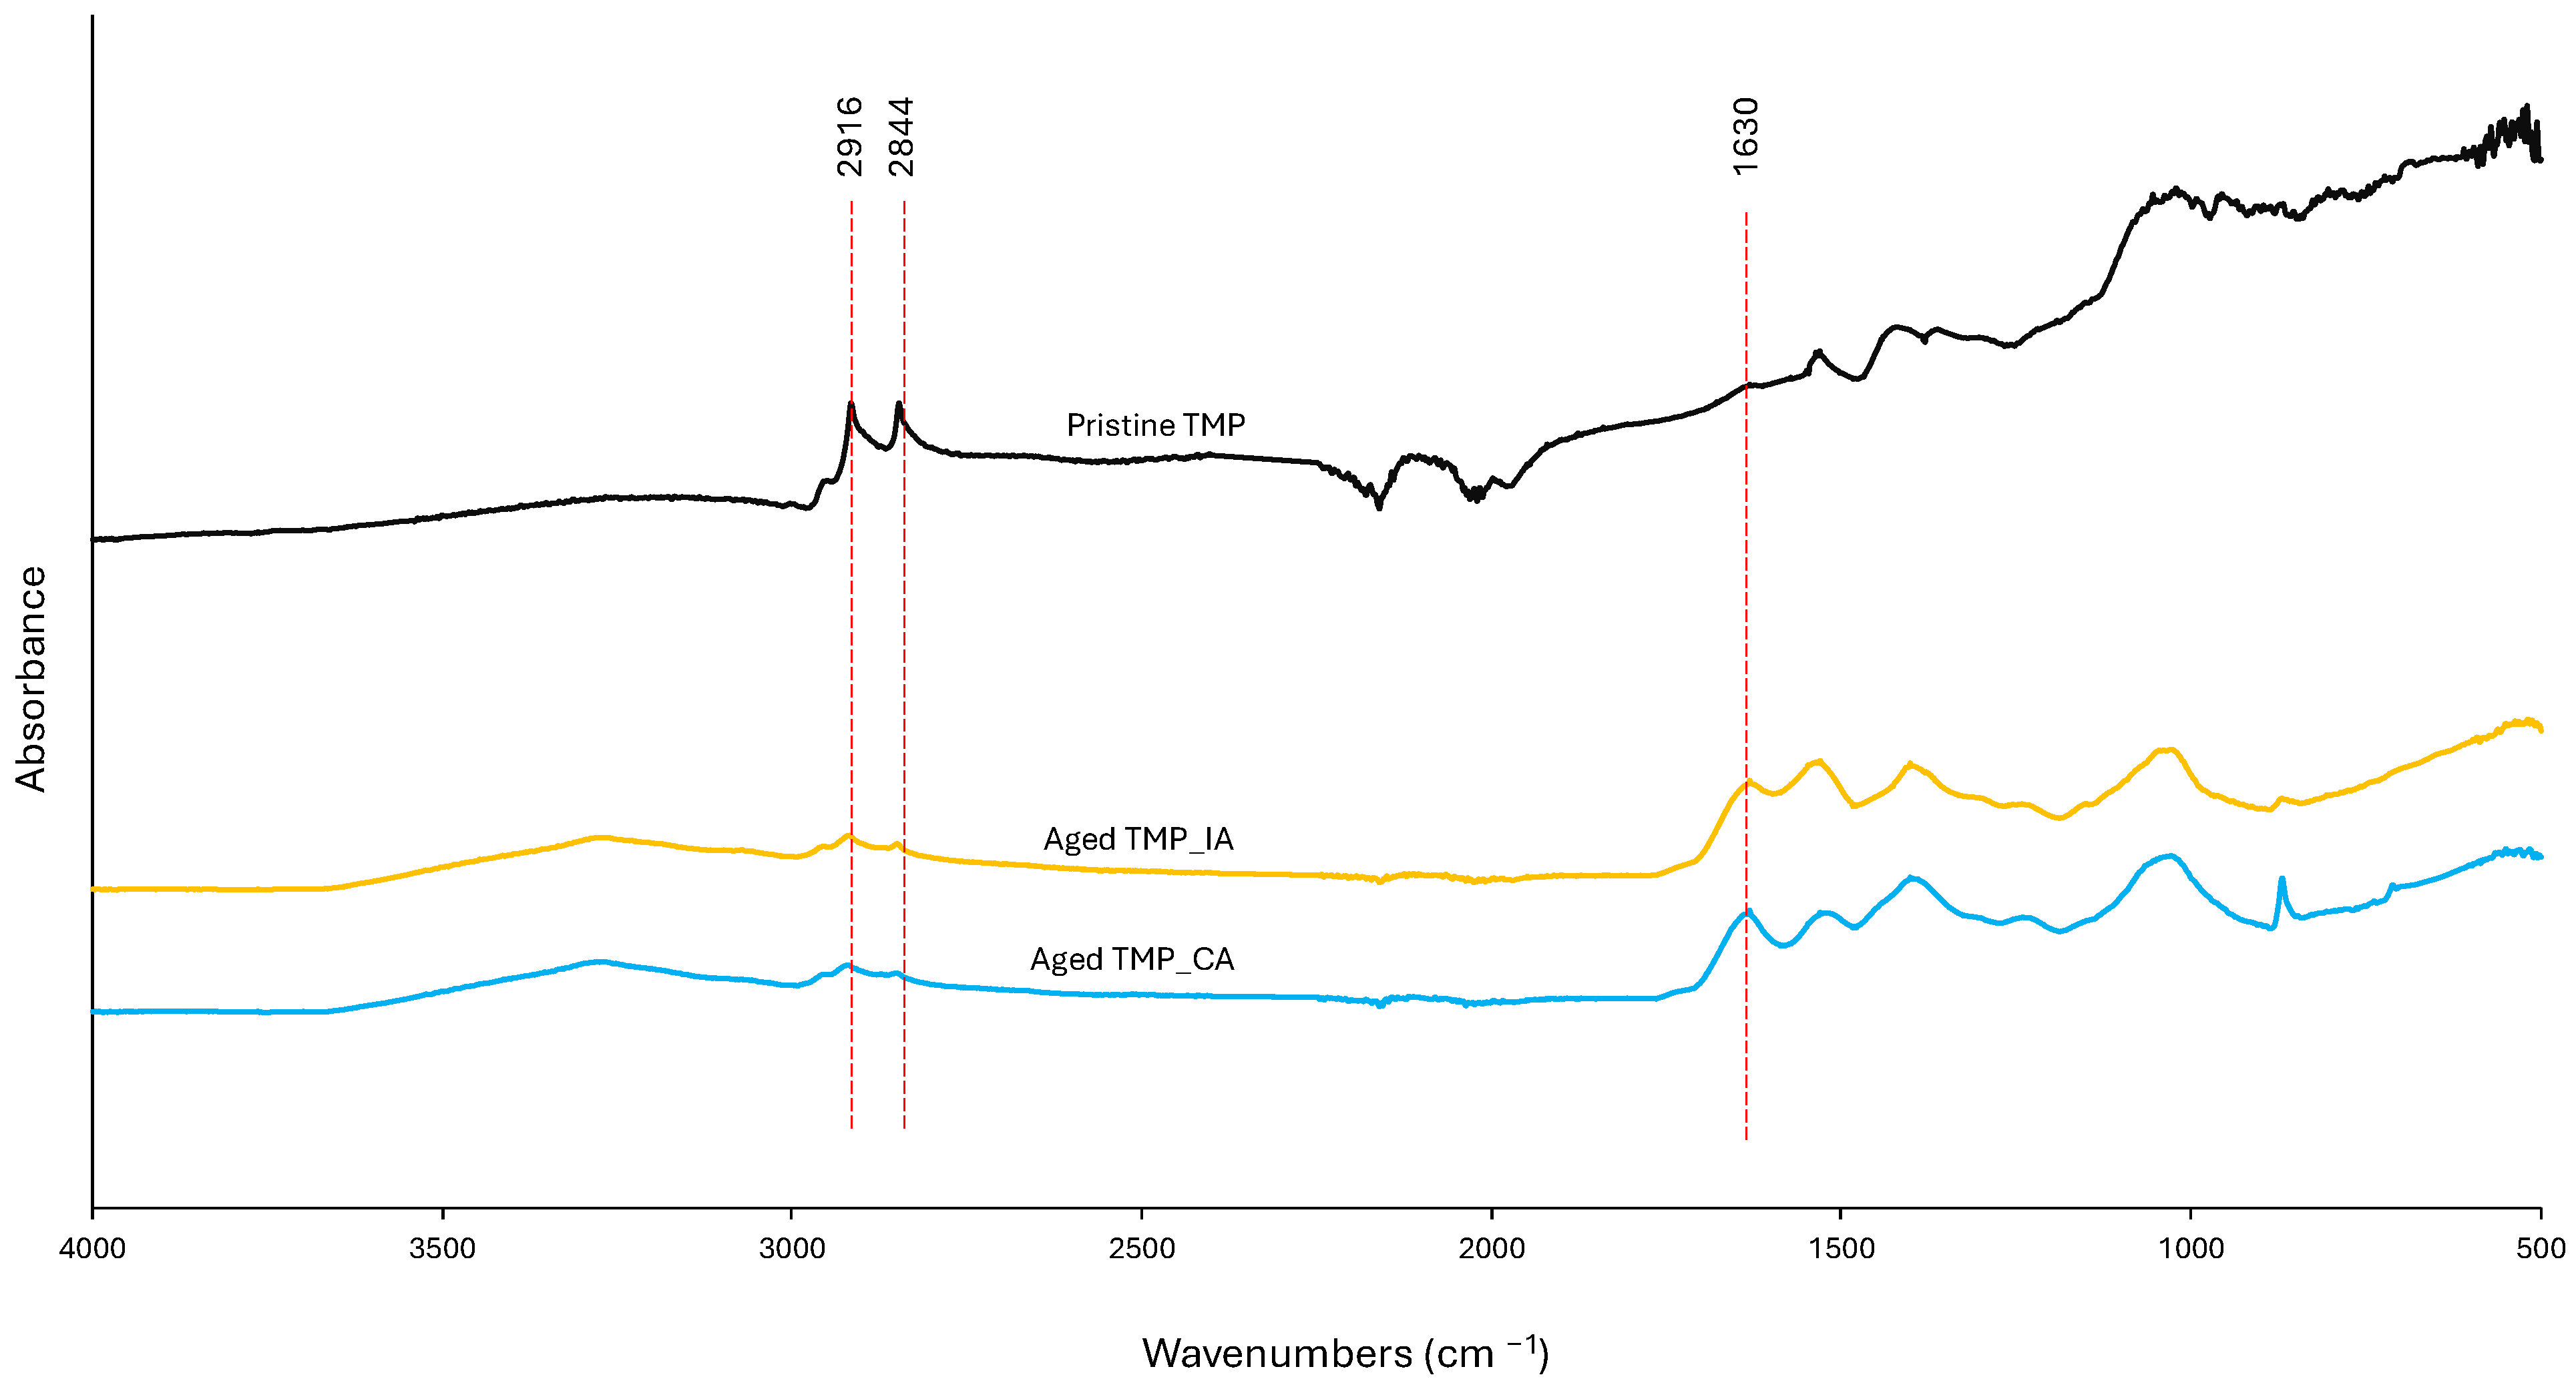
The FTIR spectra of aged TMPs from both aeration regimes (R5) were similar but differed from those of the pristine TMPs (Figure A4). Peaks at 2844 and 2916 cm−1, present on the pristine TMPs, disappeared in the aged samples, indicating degradation of saturated C–H (sp3) bonds and oxidative transformation of the rubber surface [69]. Additionally, a new peak at 1630 cm−1 appeared on the aged TMPs, corresponding to –NH2 bending [69]. The changes observed in TMPs suggest possible chemical interactions between leached TMP components and EPS, warranting further investigation. Overall, the observed correlations indicate that aeration conditions influence AGS responses to TMP-induced stress.

4. Conclusions

AGS exhibited greater resilience to TMP stress under IA than under CA, maintaining granule structure, a higher PN/PS ratio, and total EPS content. COD, TN, and TP removal efficiency remained unaffected under both aeration regimes, indicating that IA can be applied effectively while saving energy. Granules were generally larger under CA than under IA, but decreased in size and increased in SSA as the TMP dose rose due to floc breakage. In contrast, IA inhibited filamentous bulking and promoted TMP-induced aggregation, resulting in larger particles and lower SSA. Dehydrogenase activity remained stable under IA despite rising TMP levels, whereas under CA, it increased with TMP dose, suggesting enhanced microbial activity driven by higher TMP accumulation and continuous oxygen availability. TMP accumulation was higher under CA than under IA. However, some TMPs were still lost in the effluent under both aeration regimes, highlighting the need for further polishing, such as membrane filtration. Unlike other types of MPs, TMP exposure reduced total EPS in AGS across both aeration regimes; however, the reduction, driven by decreases in the dominant SOL-EPS fraction, was more pronounced under CA. The total PN content in EPS remained relatively stable across both aeration regimes and TMP doses. At high TMP concentrations, driven by changes in TMP-induced granule size changes, the total PS content decreased by more than half under CA but increased under IA. ALE content dropped significantly at low TMP concentrations (50 mg/L) under both aeration regimes, but remained stable as concentrations increased. These findings highlight the importance of optimizing aeration strategies in AGS systems to better withstand MP contamination. Overall, the enhanced stability and performance observed under IA suggest its value as an energy-efficient operational approach that can support future advances in wastewater treatment design and contribute to broader efforts to mitigate MP pollution.

Author Contributions

Conceptualization, J.O.O. and A.C.-K.; methodology, J.O.O. and A.C.-K.; software, J.O.O.; validation, J.O.O. and A.C.-K.; formal analysis, J.O.O.; investigation, J.O.O., Z.M.N. and K.P.; resources, A.C.-K.; data curation, J.O.O.; writing—original draft preparation, J.O.O.; writing—review and editing, Z.M.N., K.P. and A.C.-K.; visualization, J.O.O.; supervision, A.C.-K.; project administration, A.C.-K.; funding acquisition, A.C.-K. All authors have read and agreed to the published version of the manuscript.

Funding

This research was funded by the NATIONAL SCIENCE CENTRE POLAND, grant number 2021/43/B/NZ9/01300.

Institutional Review Board Statement

Not applicable.

Informed Consent Statement

Not applicable.

Data Availability Statement

The original contributions presented in this study are included in the article. Further inquiries can be directed to the corresponding authors.

Acknowledgments

The authors have reviewed and edited the output and take full responsibility for the content of this publication.

Conflicts of Interest

The authors declare no conflicts of interest. The funders had no role in the design of the study; in the collection, analyses, or interpretation of data; in the writing of the manuscript; or in the decision to publish the results.

Appendix A

Table A1. Particle size distribution in the granular sludge batch reactors under Continuous aeration (n = 5).
GSBRTMPs
Concentration
mg/L
Obscuration
(%)
SpanD[4.3]—Volume Weighted Mean
(µm)
UniformityD[3.2]—Surface Weighted Mean
(µm)
d(0.1)
(µm)
d(0.5)
(µm)
d(0.9)
(µm)
Specific Surface Area
(m2/g)
R1014.22.164319.00.664128.860.2277.7638.90.053
R25013.92.503227.00.79088.140.5176.7481.90.068
R310012.22.385267.40.738102.947.8221.6558.40.063
R425012.62.460174.30.75069.632.3137.4369.80.102
R550014.02.235245.50.690107.652.0203.5503.90.353
Table A2. Particle size distribution in the granular sludge batch reactors under Intermittent aeration (n = 5).
GSBRTMPs
Concentration
mg/L
Obscuration
(%)
SpanD[4.3]—Volume Weighted Mean
(µm)
UniformityD[3.2]—Surface Weighted Mean
(µm)
d(0.1)
(µm)
d(0.5)
(µm)
d(0.9)
(µm)
Specific Surface Area
(m2/g)
R1018.91.715105.10.53949.635.591.7192.80.121
R25013.41.693203.20.53498.070.6177.6371.20.061
R310013.31.728250.70.534151.988.9217.3464.20.040
R425015.11.678212.50.554130.180.4177.3378.00.046
R550016.11.645286.20.508165.3102.1254.0519.90.036
List of Symbols in Table A1 and Table A2. Obscuration—beam shading; Span—the width of the particle size distribution = d 0.9 d 0.1 d ( 0.5 ) ; D[4.3]—De Brouckere mean diameter, average particle size based on volume (μm); Uniformity—population uniformity = d 0.1 d ( 0.5 ) ; D[3.2]—Sauter mean diameter, average particle size based on surface area (μm); d(0.1)—particle size below which 10% of the sample is found; d(0.5)—particle size below which 50% of the sample is found; median; d(0.9)—particle size below which 90% of the sample is found.
Figure A1. Mid-experiment: (A) granule particle size distribution (n = 2) and (B) alginate-like exopolysaccharide content in AGS (n = 4).
Applsci 15 12410 g0a1
Figure A2. AGS structure observed by optical microscopy (scale bar = 100 µm).
Applsci 15 12410 g0a2
Figure A3. TSS and TMP Fractions in GSBR Effluent.
Applsci 15 12410 g0a3
Figure A4. FTIR spectra of TMPs before and after aging in the GSBRs.
Applsci 15 12410 g0a4

References

  1. Purba, L.D.A.; Ibiyeye, H.T.; Yuzir, A.; Mohamad, S.E.; Iwamoto, K.; Zamyadi, A.; Abdullah, N. Various applications of aerobic granular sludge: A review. Environ. Technol. Innov. 2020, 20, 101045. [Google Scholar] [CrossRef]
  2. Wagner, S.; Hüffer, T.; Klöckner, P.; Wehrhahn, M.; Hofmann, T.; Reemtsma, T. Tire wear particles in the aquatic environment—A review on generation, analysis, occurrence, fate and effects. Water Res. 2018, 139, 83–100. [Google Scholar] [CrossRef]
  3. Mennekes, D.; Nowack, B. Tire wear particle emissions: Measurement data where are you? Sci. Total Environ. 2022, 830, 154655. [Google Scholar] [CrossRef] [PubMed]
  4. Luo, Z.; Zhou, X.; Su, Y.; Wang, H.; Yu, R.; Zhou, S.; Xu, E.G.; Xing, B. Environmental occurrence, fate, impact, and potential solution of tire microplastics: Similarities and differences with tire wear particles. Sci. Total Environ. 2021, 795, 148902. [Google Scholar] [CrossRef] [PubMed]
  5. Mayer, P.M.; Moran, K.D.; Miller, E.L.; Brander, S.M.; Harper, S.; Garcia-Jaramillo, M.; Carrasco-Navarro, V.; Ho, K.T.; Burgess, R.M.; Hampton, L.M.T.; et al. Where the rubber meets the road: Emerging environmental impacts of tire wear particles and their chemical cocktails. Sci. Total Environ. 2024, 927, 171153. [Google Scholar] [CrossRef]
  6. Giechaskiel, B.; Grigoratos, T.; Mathissen, M.; Quik, J.; Tromp, P.; Gustafsson, M.; Franco, V.; Dilara, P. Contribution of road vehicle tyre wear to microplastics and ambient air pollution. Sustainability 2024, 16, 522. [Google Scholar] [CrossRef]
  7. Baensch-Baltruschat, B.; Kocher, B.; Stock, F.; Reifferscheid, G. Tyre and road wear particles (TRWP)—A review of generation, properties, emissions, human health risk, ecotoxicity, and fate in the environment. Sci. Total Environ. 2020, 733, 137823. [Google Scholar] [CrossRef] [PubMed]
  8. Järlskog, I.; Jaramillo-Vogel, D.; Rausch, J.; Gustafsson, M.; Strömvall, A.M.; Andersson-Sköld, Y. Concentrations of tire wear microplastics and other traffic-derived non-exhaust particles in the road environment. Environ. Int. 2022, 170, 107618. [Google Scholar] [CrossRef]
  9. Tamis, J.E.; Koelmans, A.A.; Dröge, R.; Kaag, N.H.B.M.; Keur, M.C.; Tromp, P.C.; Jongbloed, R.H. Environmental risks of car tire microplastic particles and other road runoff pollutants. Microplast. Nanoplast. 2021, 1, 10. [Google Scholar] [CrossRef]
  10. Page, T.S.; Almeda, R.; Koski, M.; Bournaka, E.; Nielsen, T.G. Toxicity of tyre wear particle leachates to marine phytoplankton. Aquat. Toxicol. 2022, 252, 106299. [Google Scholar] [CrossRef]
  11. Capolupo, M.; Sørensen, L.; Jayasena, K.D.R.; Booth, A.M.; Fabbri, E. Chemical composition and ecotoxicity of plastic and car tire rubber leachates to aquatic organisms. Water Res. 2019, 169, 115270. [Google Scholar] [CrossRef]
  12. Du-Carrée, J.L.; Palacios, C.K.; Rotander, A.; Larsson, M.; Alijagic, A.; Kotlyar, O.; Engwall, M.; Sjöberg, V.; Keiter, S.H.; Almeda, R. Cocktail effects of tire wear particles leachates on diverse biological models: A multilevel analysis. J. Hazard. Mater. 2024, 471, 134401. [Google Scholar] [CrossRef]
  13. Gu, Y.; Li, Y.; Yuan, F.; Yang, Q. Optimization and control strategies of aeration in WWTPs: A review. J. Clean. Prod. 2023, 418, 138008. [Google Scholar] [CrossRef]
  14. Bianco, F.; Giuliani, A.; Martucci, I.; Pucci, L.; Race, M. Comparing continuous and intermittent aeration using BioWinTM model simulation in a full-scale wastewater treatment plant. J. Water Process Eng. 2024, 68, 106530. [Google Scholar] [CrossRef]
  15. Singh, N.K.; Bhatia, A.; Kazmi, A.A. Effect of intermittent aeration strategies on treatment performance and microbial community of an IFAS reactor treating municipal waste water. Environ. Technol. 2017, 38, 2866–2876. [Google Scholar] [CrossRef]
  16. Burzio, C.; Ekholm, J.; Modin, O.; Falås, P.; Svahn, O.; Persson, F.; Van Erp, T.; Gustavsson, D.J.I.; Wilén, B.-M. Removal of organic micropollutants from municipal wastewater by aerobic granular sludge and conventional activated sludge. J. Hazard. Mater. 2022, 438, 129528. [Google Scholar] [CrossRef] [PubMed]
  17. Jachimowicz, P.; Peng, R.; Hüffer, T.; Hofmann, T.; Cydzik-Kwiatkowska, A. Tire materials disturb transformations of nitrogen compounds and affect the structure of biomass in aerobic granular sludge reactors. J. Hazard. Mater. 2023, 465, 133223. [Google Scholar] [CrossRef] [PubMed]
  18. Liu, S.; Su, C.; Lu, Y.; Xian, Y.; Chen, Z.; Wang, Y.; Deng, X.; Li, X. Effects of microplastics on the properties of different types of sewage sludge and strategies to overcome the inhibition: A review. Sci. Total Environ. 2023, 902, 166033. [Google Scholar] [CrossRef]
  19. Kedves, A.; Kedves, O.; Mikó, E.; Kónya, Z. Micro- and nanoplastics in granular sludge systems: Mechanisms of disruption, retention, and microbial adaptation in wastewater treatment technologies. Water Res. 2025, 28, 100374. [Google Scholar] [CrossRef]
  20. Huang, S.; Zhang, B.; Cui, F.; He, Y.; Shi, J.; Yang, X.; Lens, P.N.L.; Shi, W. Mechanisms underlying the detrimental impact of micro(nano)plastics on the stability of aerobic granular sludge: Interactions between micro(nano)plastics and extracellular polymeric substances. J. Hazard. Mater. 2024, 478, 135512. [Google Scholar] [CrossRef]
  21. Barrena, R.; Vazquez, F.; Sanchez, A. Dehydrogenase activity as a method for monitoring the composting process. Bioresour. Technol. 2007, 99, 905–908. [Google Scholar] [CrossRef]
  22. Chukhchin, D.; Varakin, E.; Rudakova, V.; Vashukova, K.; Terentyev, K. Express-Method for determination of the oxidizing capacity of activated sludge and its biofilms in pulp and paper mill. Water 2021, 13, 1553. [Google Scholar] [CrossRef]
  23. Lopez, J.M.; Koopman, B.; Bitton, G. INT–dehydrogenase test for activated sludge process control. Biotechnol. Bioeng. 1986, 28, 1080–1085. [Google Scholar] [CrossRef] [PubMed]
  24. Kumar, R.S.; Sheela, A.M. Microplastics alter dehydrogenase, urease, and cellulase activities in soil. Natl. Acad. Sci. Lett. 2023, 46, 325–328. [Google Scholar] [CrossRef]
  25. Tan, X.; Liu, Y.; Yan, K.; Wang, Z.; Lu, G.; He, Y.; He, W. Differences in the response of soil dehydrogenase activity to Cd contamination are determined by the different substrates used for its determination. Chemosphere 2016, 169, 324–332. [Google Scholar] [CrossRef]
  26. Guo, W.; Zou, L.F.; Cai, L.L.; Chen, G.Y. Glucose-6-phosphate dehydrogenase is required for extracellular polysaccharide production, cell motility and the full virulence of Xanthomonas oryzae pv. oryzicola. Microb. Pathog. 2014, 78, 87–94. [Google Scholar] [CrossRef] [PubMed]
  27. Flemming, H.C.; Wingender, J. The biofilm matrix. Nat. Rev. Microbiol. 2010, 8, 623–633. [Google Scholar] [CrossRef]
  28. Adav, S.S.; Lee, D.J.; Tay, J.H. Extracellular polymeric substances and structural stability of aerobic granule. Water Res. 2007, 42, 1644–1650. [Google Scholar] [CrossRef] [PubMed]
  29. Dong, J.; Zhang, Z.; Yu, Z.; Dai, X.; Xu, X.; Alvarez, P.J.J.; Zhu, L. Evolution and functional analysis of extracellular polymeric substances during the granulation of aerobic sludge used to treat p-chloroaniline wastewater. Chem. Eng. J. 2017, 330, 596–604. [Google Scholar] [CrossRef]
  30. Liu, X.; Pei, Q.; Han, H.; Yin, H.; Chen, M.; Guo, C.; Li, J.; Qiu, H. Functional analysis of extracellular polymeric substances (EPS) during the granulation of aerobic sludge: Relationship among EPS, granulation and nutrients removal. Environ. Res. 2022, 208, 112692. [Google Scholar] [CrossRef]
  31. Peng, T.; Wang, Y.; Wang, J.; Fang, F.; Yan, P.; Liu, Z. Effect of different forms and components of EPS on sludge aggregation during granulation process of aerobic granular sludge. Chemosphere 2022, 303, 135116. [Google Scholar] [CrossRef]
  32. Rusanowska, P.; Cydzik-Kwiatkowska, A.; Świątczak, P.; Wojnowska-Baryła, I. Changes in extracellular polymeric substances (EPS) content and composition in aerobic granule size-fractions during reactor cycles at different organic loads. Bioresour. Technol. 2018, 272, 188–193. [Google Scholar] [CrossRef] [PubMed]
  33. Wang, J.; Jiang, Z.; Wang, W.; Wang, H.; Zhang, Y.; Wang, Y. The connection between aeration regimes and EPS composition in nitritation biofilm. Chemosphere 2020, 265, 129141. [Google Scholar] [CrossRef]
  34. Fan, X.; Wang, C.; Kong, L.; Wang, J.; Tan, Y.; Yu, Z.; Xu, X.; Zhu, L. Spatial heterogeneity of EPS-mediated microplastic aggregation in phycosphere shapes polymer-specific Trojan horse effects. Water Res. 2025, 281, 123686. [Google Scholar] [CrossRef] [PubMed]
  35. Jachimowicz, P.; Cydzik-Kwiatkowska, A. Impact of polyethylene terephthalate microplastics on aerobic granular sludge structure and EPS composition in wastewater treatment. Water 2025, 17, 270. [Google Scholar] [CrossRef]
  36. Zhang, Y.T.; Wei, W.; Huang, Q.S.; Wang, C.; Wang, Y.; Ni, B.J. Insights into the microbial response of anaerobic granular sludge during long-term exposure to polyethylene terephthalate microplastics. Water Res. 2020, 179, 115898. [Google Scholar] [CrossRef]
  37. Lin, Y.; De Kreuk, M.; Van Loosdrecht, M.C.M.; Adin, A. Characterization of alginate-like exopolysaccharides isolated from aerobic granular sludge in pilot-plant. Water Res. 2010, 44, 3355–3364. [Google Scholar] [CrossRef]
  38. Cydzik-Kwiatkowska, A.; Gusiatin, M.Z.; Zielińska, M.; Wojnowska-Baryła, I.; Kulikowska, D.; Bernat, K. Alginate-like polymers from full-scale aerobic granular sludge: Content, recovery, characterization, and application for cadmium adsorption. Sci. Rep. 2022, 12, 22260. [Google Scholar] [CrossRef]
  39. Svierzoski, N.D.S.; Castellano-Hinojosa, A.; Gallardo-Altamirano, M.J.; Mahler, C.F.; Bassin, J.P.; González-Martínez, A. Evaluating the effects of aeration intermittency on treatment performance and the granule microbiome in continuous-flow aerobic granular sludge systems. J. Environ. Chem. Eng. 2025, 13, 117660. [Google Scholar] [CrossRef]
  40. Jachimowicz, P.; Jo, Y.J.; Cydzik-Kwiatkowska, A. Polyethylene microplastics increase extracellular polymeric substances production in aerobic granular sludge. Sci. Total Environ. 2022, 851, 158208. [Google Scholar] [CrossRef]
  41. Jandacka, D.; Durcanska, D.; Cibula, R. Concentration and inorganic elemental analysis of particulate matter in a road tunnel environment (Žilina, Slovakia): Contribution of non-exhaust sources. Front. Environ. Sci. 2022, 10, 952577. [Google Scholar] [CrossRef]
  42. Kreider, M.L.; Panko, J.M.; McAtee, B.L.; Sweet, L.I.; Finley, B.L. Physical and chemical characterization of tire-related particles: Comparison of particles generated using different methodologies. Sci. Total Environ. 2009, 408, 652–659. [Google Scholar] [CrossRef]
  43. Leads, R.R.; Weinstein, J.E. Occurrence of tire wear particles and other microplastics within the tributaries of the Charleston Harbor Estuary, South Carolina, USA. Mar. Pollut. Bull. 2019, 145, 569–582. [Google Scholar] [CrossRef]
  44. Sun, W.; Wang, B.; Ouyang, W.; Liu, Z.; Zhang, H. Tire wear particles in aquatic environments: A systematic review of sources, detection, distribution, and toxicological impacts. Ecotoxicol. Environ. Saf. 2025, 305, 119236. [Google Scholar] [CrossRef]
  45. Wik, A.; Dave, G. Occurrence and effects of tire wear particles in the environment—A critical review and an initial risk assessment. Environ. Pollut. 2008, 157, 1–11. [Google Scholar] [CrossRef] [PubMed]
  46. American Public Health Association (APHA). Standard Methods for the Examination of Water and Wastewater, 22nd ed.; Rice, E.W., Baird, R.B., Eaton, A.D., Clesceri, L.S., Bridgewater, L., Eds.; American Public Health Association: Washington, DC, USA, 2012; ISBN 978-087553-013-0. [Google Scholar]
  47. Otieno, J.O.; Jachimowicz, P.; Zielińska, M.; Mądzielewska, W.I.; Cydzik-Kwiatkowska, A. The effect of tire microplastics on aerobic granular sludge performance. Emerg. Contam. 2025, 11, 100513. [Google Scholar] [CrossRef]
  48. Rusanowska, P.; Cydzik-Kwiatkowska, A.; Wojnowska-Baryła, I. Microbial origin of excreted DNA in particular fractions of extracellular polymers (EPS) in aerobic granules. Water Air Soil Pollut. 2019, 230, 203. [Google Scholar] [CrossRef]
  49. Izadi, P.; Izadi, P.; Eldyasti, A. Enhancement of simultaneous nitrogen and phosphorus removal using intermittent aeration mechanism. J. Environ. Sci. 2021, 109, 1–14. [Google Scholar] [CrossRef] [PubMed]
  50. Wang, Y.L.; Yu, S.L.; Shi, W.X.; Bao, R.L.; Zhao, Q.; Zuo, X.T. Comparative performance between intermittently cyclic activated sludge-membrane bioreactor and anoxic/aerobic-membrane bioreactor. Bioresour. Technol. 2009, 100, 3877–3881. [Google Scholar] [CrossRef] [PubMed]
  51. Dai, H.H.; Gao, J.F.; Wang, Z.Q.; Zhao, Y.F.; Zhang, D. Behavior of nitrogen, phosphorus and antibiotic resistance genes under polyvinyl chloride microplastics pressures in an aerobic granular sludge system. J. Clean. Prod. 2020, 256, 120402. [Google Scholar] [CrossRef]
  52. Zhang, B.; Huang, S.; Wu, L.; Guo, Y.; Shi, W.; Lens, P.N.L. Micro(nano)plastic size and concentration co-differentiate the treatment performance and toxicity mechanism in aerobic granular sludge systems. Chem. Eng. J. 2022, 457, 141212. [Google Scholar] [CrossRef]
  53. Feng, H.; Yang, H.; Sheng, J.; Pan, Z.; Li, J. A bioreactor designed for restricting oversize of aerobic granular sludge. Processes 2021, 9, 374. [Google Scholar] [CrossRef]
  54. Zheng, X.; Han, Z.; Shao, X.; Zhao, Z.; Zhang, H.; Lin, T.; Yang, S.; Zhou, C. Response of aerobic granular sludge under polyethylene microplastics stress: Physicochemical properties, decontamination performance, and microbial community. J. Environ. Manag. 2022, 323, 116215. [Google Scholar] [CrossRef] [PubMed]
  55. Xu, J.; Wang, X.; Zhang, Z.; Yan, Z.; Zhang, Y. Effects of chronic exposure to different sizes and polymers of microplastics on the characteristics of activated sludge. Sci. Total Environ. 2021, 783, 146954. [Google Scholar] [CrossRef]
  56. Li, W.; Liao, X.; Guo, J.; Zhang, Y.; Chen, Y.; Fang, F.; Yan, P. New insights into filamentous sludge bulking: The potential role of extracellular polymeric substances in sludge bulking in the activated sludge process. Chemosphere 2020, 248, 126012. [Google Scholar] [CrossRef]
  57. Zhu, D.; Ma, J.; Li, G.; Rillig, M.C.; Zhu, Y.G. Soil plastispheres as hotspots of antibiotic resistance genes and potential pathogens. ISME J. 2021, 16, 521–532. [Google Scholar] [CrossRef]
  58. Zhang, Y.; Li, B.; Xu, R.X.; Wang, G.X.; Zhou, Y.; Xie, B. Effects of pressurized aeration on organic degradation efficiency and bacterial community structure of activated sludge treating saline wastewater. Bioresour. Technol. 2016, 222, 182–189. [Google Scholar] [CrossRef]
  59. Gan, Y.; Gong, B.; Huang, X.; Fang, F.; Peng, T.; Liu, Z. Response of aerobic granular sludge under acute inhibition by poly-styrene microplastics: Activity, aggregation performance, and microbial analysis. Environ. Pollut. 2024, 349, 123923. [Google Scholar] [CrossRef] [PubMed]
  60. He, J.Y.; Zhang, H.L.; Wang, H.; Hu, Y.Q.; Zhang, Y. Characteristics of the extracellular products of pure oxygen aerated activated sludge in batch mode. Water Sci. Technol. 2021, 83, 1946–1957. [Google Scholar] [CrossRef]
  61. Li, Z.; Li, H.; Zhao, L.; Liu, X.; Wan, C. Understanding the role of cations and hydrogen bonds on the stability of aerobic granules from the perspective of the aggregation and adhesion behavior of extracellular polymeric substances. Sci. Total Environ. 2021, 795, 148659. [Google Scholar] [CrossRef]
  62. Singh, N.K.; Pandey, S.; Singh, R.P.; Dahiya, S.; Gautam, S.; Kazmi, A.A. Effect of intermittent aeration cycles on EPS production and sludge characteristics in a field scale IFAS reactor. J. Water Process Eng. 2018, 23, 230–238. [Google Scholar] [CrossRef]
  63. Shin, H.S.; Kang, S.T.; Nam, S.Y. Effect of carbohydrate and protein in the EPS on sludge settling characteristics. Water Sci. Technol. 2001, 43, 193–196. [Google Scholar] [CrossRef]
  64. Chen, M.Y.; Lee, D.J.; Tay, J.H. Distribution of extracellular polymeric substances in aerobic granules. Appl. Microbiol. Biotechnol. 2006, 73, 1463–1469. [Google Scholar] [CrossRef] [PubMed]
  65. Wang, H.; Liu, X.; Xu, H.; Liu, H.; Chen, L.; Hua, Y.; Yang, D.; Dai, X. Revealing the impacts of intermittent aeration on nitrogen and phosphorus removal in powder carrier system from interfacial thermodynamics and metagenomic analysis. Chem. Eng. J. 2024, 495, 153399. [Google Scholar] [CrossRef]
  66. Schambeck, C.M.; Magnus, B.S.; De Souza, L.C.R.; Leite, W.R.M.; Derlon, N.; Guimarães, L.B.; Da Costa, R.H.R. Biopolymers recovery: Dynamics and characterization of alginate-like exopolymers in an aerobic granular sludge system treating municipal wastewater without sludge inoculum. J. Environ. Manag. 2020, 263, 110394. [Google Scholar] [CrossRef]
  67. Yin, Y.; Liu, F.; Wang, L.; Sun, J. Overcoming the instability of aerobic granular sludge under nitrogen deficiency through shortening settling time. Bioresour. Technol. 2019, 289, 121620. [Google Scholar] [CrossRef]
  68. Yang, Y.; Liu, J.; Lu, H.; Hou, J.; Fan, X.; Liu, Q.; Zhao, M.; Ren, L.; You, G. Effects of tire wear particle on growth, extracellular polymeric substance production and oxidation stress of algae Chlorella vulgaris: Performance and mechanism. Aquat. Toxicol. 2024, 276, 107118. [Google Scholar] [CrossRef]
  69. Naz, I.; Khatoon, N.; Ali, M.I.; Saroj, D.P.; Batool, S.A.; Ali, N.; Ahmed, S. Appraisal of the tire derived rubber (TDR) medium for wastewater treatment under aerobic and anaerobic conditions. J. Chem. Technol. Biotechnol. 2014, 89, 587–596. [Google Scholar] [CrossRef]
Figure 1. Experimental setup (A) and GSBR operation: CA (B) and IA (C).
Applsci 15 12410 g001
Figure 2. AGS particle size distribution profiles under CA (A) and IA (B) MLSS and SVI30 (C), and enzymatic activity (D).
Applsci 15 12410 g002
Figure 3. Total EPS expressed as TOC (A), the PN (B), PS (C) content in EPS fractions, and the PN/PS ratio of EPS (D); all data are the average of 3 measurements.
Applsci 15 12410 g003
Figure 4. Pearson correlations between EPS compounds and physicochemical parameters under (A) CA and (B) IA. * indicated significance levels greater than 0.05.
Applsci 15 12410 g004
Table 1. Granular sequencing batch reactors average pollutant percent (%) removal efficiency (n = 50).
ParameterAeration RegimeR1R2R3R4R5
CODCA87.32 ± 5.8688.84 ± 5.6489.04 ± 5.7290.66 ± 5.1490.56 ± 5.31
IA94.53 ± 2.4494.58 ± 1.8994.59 ± 1.4594.66 ± 1.9893.48 ± 2.93
TPCA61.8 ± 12.066.8 ± 12.767.5 ± 16.067.4 ± 15.460.6 ± 19.2
IA66.4 ± 17.966.6 ± 20.765.7 ± 20.466.7 ± 15.970.5 ± 19.9
TNCA66.7 ± 6.665.9 ± 9.464.2 ± 9.266.7 ± 13.671.7 ± 7.6
IA63.7 ± 8.868.4 ± 6.268.9 ± 9.267.2 ± 5.869.8 ± 6.1
Disclaimer/Publisher’s Note: The statements, opinions and data contained in all publications are solely those of the individual author(s) and contributor(s) and not of MDPI and/or the editor(s). MDPI and/or the editor(s) disclaim responsibility for any injury to people or property resulting from any ideas, methods, instructions or products referred to in the content.