Article

A Fuzzy Rule-Based Decision Support in Process Mining: Turning Diagnostics into Prescriptions

Department of Management Information Systems, Izmir Bakircay University, 35665 Izmir, Türkiye
*
Author to whom correspondence should be addressed.
Appl. Sci. 2025, 15(23), 12402; https://doi.org/10.3390/app152312402 (registering DOI)
Submission received: 24 October 2025 / Revised: 17 November 2025 / Accepted: 20 November 2025 / Published: 22 November 2025
(This article belongs to the Special Issue Process Mining: Theory and Applications)

Abstract

In this study, a fuzzy rule-based framework has been developed that expands from the diagnostic analyses traditionally offered by process mining to a decision-support structure that provides recommendations to managers. While traditional process mining methods are widely used to identify bottlenecks and inefficiencies, they have often produced results that merely describe the current situation and have failed to provide managers with applicable solutions. Therefore, this paper designs a hybrid method combining statistical data preprocessing, process mining, and fuzzy inference mechanisms. First, statistical analysis was carried out to determine which activities are most influential in terms of process lead time. Subsequently, a procedure mining approach was used to locate structural bottlenecks and delay patterns, which the Bottleneck Severity Index rated. To translate diagnostic insights into managerially actionable recommendations, the study constructed a fuzzy decision tree-based inference model. While the model is easily understood and implemented, it presents its results in explicit IF-THEN rules. The approach was applied to a real IT service process with 1500 cases and 46,618 events. The fuzzy rule-based system generated tangible improvements: the cycle time was reduced by 26.4%, the bottleneck events decreased by 55.1% and the operational cost savings were calculated to be of 17.7%.

1. Introduction

Today’s organizations operate within complex, fast-changing, and data-heavy environments. No modern business process is simple. They are all performed with multiple participants, ongoing changes in demand, and often under uncertainty. Therefore, there is a need to make decisions quickly while remaining efficient, within the rules, and while delivering a high level of service [1]. To enable their organizations to deal with effectively the complexity present within their operation environment, there is a need to employ smart systems which both describe what is occurring but also indicate what should happen next.
From this perspective, there is one technology which has significantly emerged during these two decades, and this is called process mining. Process mining uses event logs to reconstruct business processes objectively and analyzes how they actually function [2]. The importance and applications of this technology have been proven to exist across multiple business fields. As a case within the medical business, it maps patient paths, analyzes long waitings, and showcases points of bottlenecking clinics such as cardiology and laboratories [3]. Another sector is manufacturing, which uses both process mining and Statistical Process-Control to identify differences there on productivity [2], while within software development, it illustrates how there are arenas within the delivery pipeline which are causing delays [2].
Despite this, the nature of process mining is diagnosing, meaning that while it can identify what occurred to go off-course, it typically remains agnostic with respect to suggestions about how to proceed [4]. As an example, trace analysis within ticket traces within information technology service desks can identify loops of rework but do not offer guidance on how to improve. This, on its own, however, identifies what activities concerning staff routing and/or escalation are required to proceed [5].
More recent research has shown that intelligent, user-focused solutions which can diagnose but also prescribe relevant on-the-fly actions have been indicated to have value. The state of the art regarding monitoring and prescribing processes has been commented on separately, suggesting recommendations during runtime to prevent harmful results [6]. The combination of machine learning algorithms and operations research has been shown to improve both accuracy and speed during decision-making [7]. At the same time, prescriptive maintenance frameworks have been systematically reviewed, and through this work, the way diagnostic signals are translated into practical maintenance actions and policies has been clarified [8]. In addition, within healthcare process mining, a need for outcomes that lead to concrete actions—rather than simple visual dashboards—has been emphasized, and a clear call for the co-creation of interventions has been expressed [9].
“What should managers do, and when should they do it?”
Such bridging has been enabled by methods that are able to manage uncertainty while still remaining understandable to decision-makers [10,11]. Fuzzy rule-based systems have been presented as a suitable approach, since uncertainty can be expressed through linguistic terms and traceable IF–THEN rules in a clear and transparent form. Within IT service operations, process-mining indicators—such as waiting time, queue length, and resource use—have been mapped through fuzzy rules to practical prescriptions, including dynamic triage, balanced task reassignment, or early vendor escalation. In this way, diagnostic signals have been converted into guidance for operations [5,6].
Building on these advances, a hybrid decision support framework is presented in this paper, and it is constructed around three complementary elements:
  • Baseline performance indicators are established through statistical analysis.
  • Diagnostic insight into bottlenecks, inefficiencies, and deviations is supplied through process mining.
  • Actionable prescriptions for managerial decision-making are produced through fuzzy rule-based reasoning.
The study is intended to move process mining from a mainly descriptive instrument toward a prescriptive decision support approach by combining these methods. Through this shift, the core managerial challenge is addressed: the process is not only described but also linked to guidance on what should be done and at which moment.
Decision trees and their fuzzy extensions can frequently serve as a tool to solve classification and prediction tasks using fuzzy logic. The structure of this research is actually about reconsidering the design of this model to better serve as a guidance tool. This Fuzzy Decision Tree was developed to serve not only as a predictor but also to allow easy identification of meaningful priority labels on various process attributes. These rules could then be transformed into distinct management tasks, which provides a more direct link between predictions and decision-making. This implies that being more than a forecaster, this model can serve more directly as a guidance tool on what to do next.
The remainder of this study is structured as follows. Section 2 provides a review of the previous literature, elucidates the diagnostic boundaries of process mining, and encourages the development of a prescriptive fuzzy layer. The methodology is introduced in Section 3, including statistical preprocessing, process mining, and fuzzy system design. The experimental appraisal is reported in Section 4, which includes the dataset and setup, statistical analysis, process mining visualization, fuzzy rule analysis, intervention scenarios, model comparison and cross-validation, and significance testing. Implications, limitations, and extensions are discussed in Section 5. Finally, Section 6 concludes the study.

2. Literature Review

Process mining is an interface between data science and business process management, as it derives insights into the behavior of work by analyzing event logs to understand how work actually occurs [12]. Discovery, conformance, and performance analysis are traditional tools that help rebuild process models, identify deviations, and identify bottlenecks [13]. Process mining has been implemented in the IT sphere to learn the workflows of help-desks, incident–resolution pathways, and the maintenance sequence of infrastructure [14,15].
Although the available instruments detect inefficiencies well, they end their services at the analytical stage. They demonstrate the presence of problems but not the process of their resolution. The literature on IT service management [16] and telecom operations [14] shows that conventional dashboards only visualize bottlenecks and Service Level Agreement (SLA) violations but fail to provide a logic for addressing them. As a result, the identified problems can be left or addressed by trial and error [17].
For example, process discovery may indicate that ticket-resolution durations are highest on weekends, but no automated rule will decide whether to recruit more employees or restart the work [6,18]. In contrast to binary thresholds, fuzzy sets are flexible in the presence of ambiguity and overlapping conditions, which are typically found in complex IT contexts [19]. The fact that they are interpretable makes them appropriate for embedding in process-mining dashboards to generate explainable prescriptions.
The use of fuzzy logic facilitates prescriptive reasoning through simple, human-readable rules. For instance:
  • IF ticket waiting time has more than 8 h and resource utilization is above 95 percent, then assign more service agents.
  • IF there is a high process deviation and a low level of throughput rate THEN develop a re-assessment of the workflow.
These policies permit automated or semi-automated decision support in IT service-management systems, and empirical advances have supported this. Although the field of diagnostics, including IT incident handling, is highly developed, prescriptive analytics is still in its infancy. Indicatively, the authors suggest that run-time interventions be used instead of diagnosing anomalies as a part of the outcome-oriented prescriptive process [18]. Similarly, [20] presents cost-conscious prescriptive monitoring, which activates interventions of cycle-time reduction. These strategies demonstrate that, despite the high level of pattern detection, decision-making rules are not yet sufficiently incorporated into IT processes.
In recent years, a dedicated stream of prescriptive process mining and prescriptive process monitoring methods has emerged. These approaches focus on learning intervention policies that recommend concrete actions for running cases at runtime, often to prevent negative outcomes or optimize cost-aware performance indicators [6,18,20,21]. Reinforcement learning has been used to derive optimal policies from event data by modeling processes as Markov decision processes and learning which treatments should be applied in which states [22]. Other work combines predictive models with causal inference to estimate the effect of alternative treatments on outcomes and to generate prescriptions with an explicit causal interpretation [21]. The present study differs from these runtime-oriented prescriptive approaches in that the fuzzy decision tree layer is designed for offline analysis of historical logs, producing interpretable IF–THEN rules that target bottlenecks and Key Performance Indicators (KPIs) trade-offs at the process-design and resource-planning level rather than at the level of per-case interventions during execution.
As elaborated in Table 1, most studies in IT-oriented process mining have concentrated on diagnostic evaluation rather than prescriptive improvement. The literature reviewed has drawn two major conclusions: process mining can provide a valid diagnosis of IT activities, and secondly, the findings of process mining do not always translate into practical or prescriptive decisions. The majority of process-mining solutions in the context of IT service management are based on descriptive analytics and fixed dashboards, which provide retrospective visibility and do not imply proactive measures [15,16]. Through this, organizations identify bottlenecks, including lengthy queues at the counter, service overload, and frequent service breaches, but lack mechanisms to address them autonomously [17,19]. Even the most sophisticated educational and incident-management systems that use process mining remain based on monitoring and compliance rather than adaptive improvement [23,24]. This diagnostic nature only highlights a long-standing gap in the IT process-mining literature: the lack of innovative feedback loops that can produce prescriptive advice that bridges the performance-action gap.
To address this, the Fuzzy KPI Framework presented in this research operationalizes fuzzy logic within traditional process mining products. It transforms performance indicators, e.g., response time, utilization, and SLA compliance, into natural-language terms and uses rule-based reasoning to generate explainable, human-oriented prescriptions. This method overcomes the barrier that process mining is a diagnostic field and makes it a prescriptive field, supporting transparency and the automation of IT decision-making.
To overcome this gap, researchers have been putting forward more and more the idea of applying soft-computing methods, and more specifically fuzzy logic, to process mining. Fuzzy systems transform quantitative KPIs, i.e., waiting time, utilization rate, throughput, etc., into linguistic variables, such as low, medium, high, that are understandable and agreeable to human logic [38]. Ref. [39] proposed a fuzzy clustering algorithm in process mining that combines the activity sequence and cycle time dimensions and allows overlap in cluster membership and more diagnostics in process mining. On the same note, Ref. [40] noted that logic-oriented fuzzy systems are able to expand upon explainability in decision models by incorporating linguistic reasons and machine learning frameworks. The article by [41] showed that fuzzy decision-support systems enhance forecasting and strategic management of IT by quantifying the uncertainty and allowing it to be controlled adaptively. Complementarily, the recent developments in the field of deep fuzzy systems were reviewed by [42], who asserted that the predictive accuracy does not decline when fuzzy-based methods of hybridization improve interpretability. Trying to summarize all these studies, it is possible to state that including fuzzy reasoning into process-mining pipelines can convert pure diagnostic analysis to prescriptive recommendations, which are easy to understand by people, and can be used to make informed decisions in complex IT service settings.

3. Methodological Framework

The proposed framework giving in Figure 1 integrates three distinct yet complementary analytical stages to transform raw process data into prescriptive, actionable intelligence. The methodology begins with statistical preprocessing to identify high-impact process activities, followed by process mining for contextual bottleneck analysis, and culminates in the design of a fuzzy rule-based system for real-time decision support. This multi-stage approach ensures that the resulting decision recommendations are not only data-driven and context-aware but also robust and interpretable.

3.1. Statistical Preprocessing

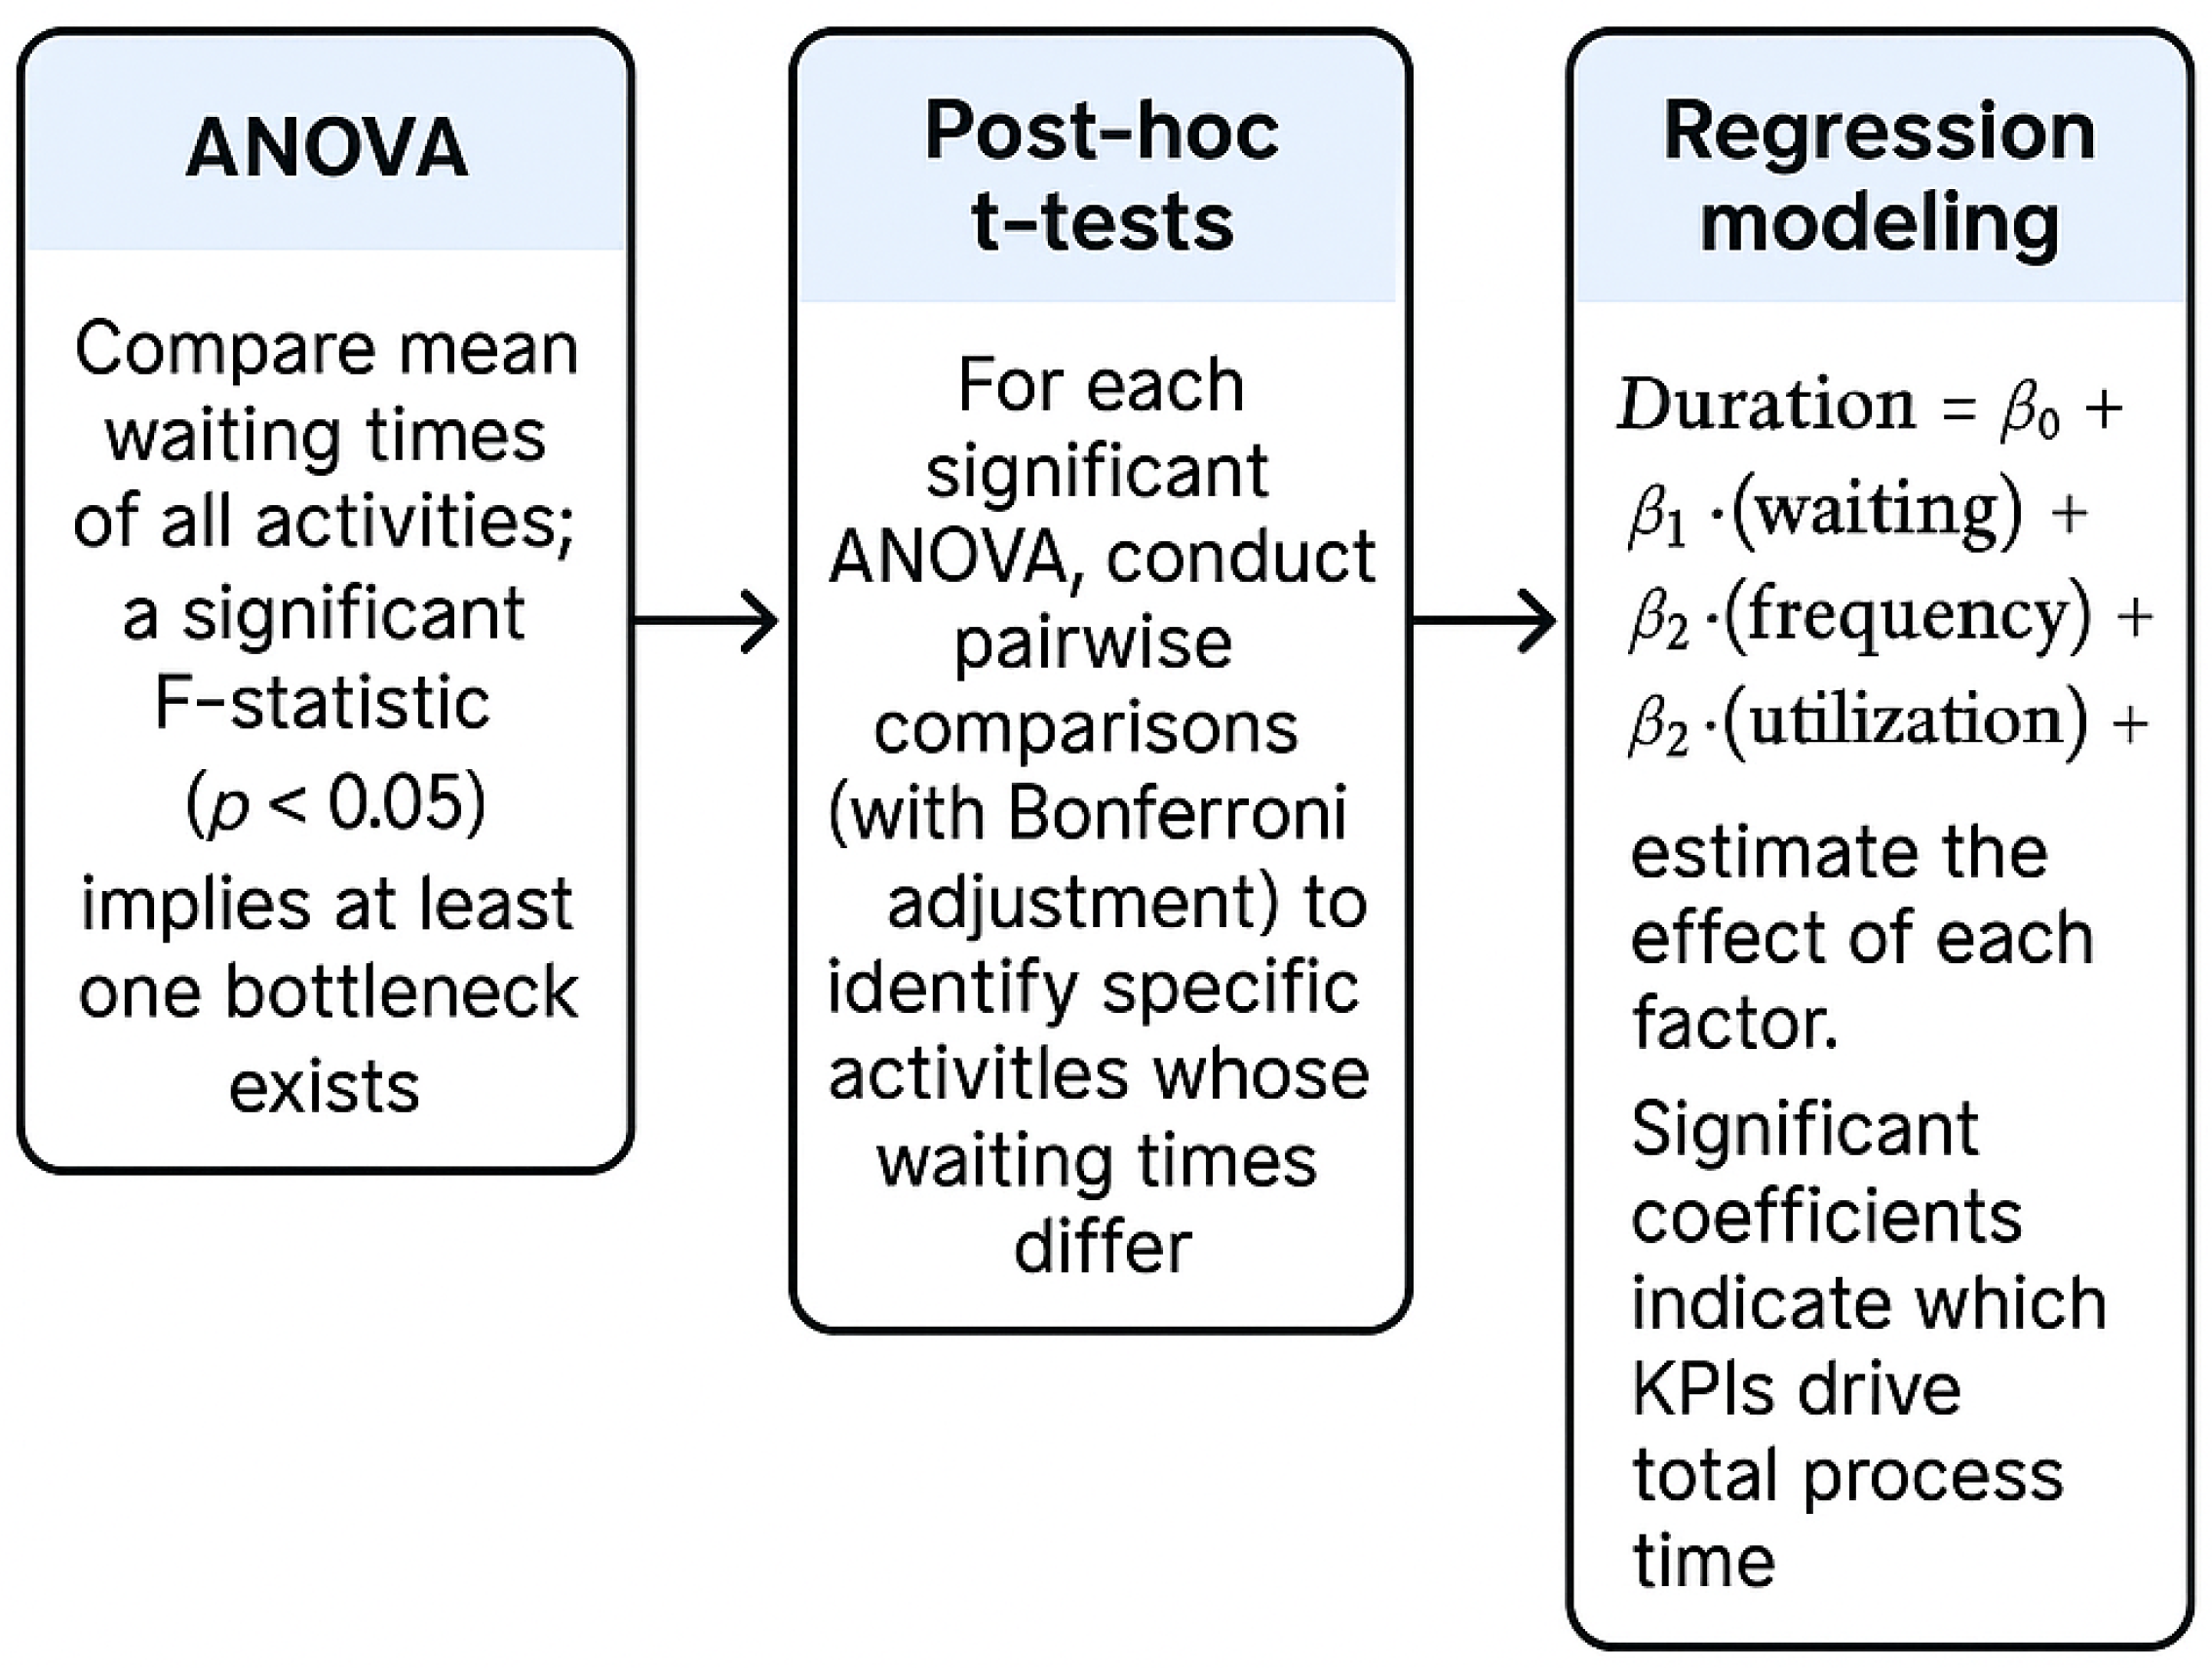
Statistical preprocessing gives a methodical approach to identifying the activities that have a significant impact on the total delay or cost associated with business processes. The data in the event logs are transformed into measurable attributes like waiting times, number of activities, and resources used. To establish the relevance of these characteristics, one-way ANOVA is used to compare the results of the mean waiting times of activities. In cases where ANOVA shows significant variation, post hoc t-tests with Bonferroni error are applied to determine the type of activities that cause delays. Besides this, the contribution of the frequency of activity, wait duration, and resource usage to the total duration of the cases is estimated using multiple linear regression models. However, this statistical preprocessing step ensures that the activities that have a provable influence on the performance outcomes are identified, and the activities with negligible effects are excluded by combining regression analysis, ANOVA, and t-tests. The resultant filtering will make sure that the further analysis is concentrated on the activities that are the most closely linked to delay and cost.
The proposed framework first applies statistical analysis to identify the most critical process issues as given in Figure 2. Initially, performance metrics (for example, waiting times, frequencies, and resource utilizations) are extracted from the event log. A one-way analysis of variance (ANOVA) is used to test for significant differences in average waiting time across all activity types. If the ANOVA indicates p < 0.05, post hoc pairwise t-tests with Bonferroni correction are performed to pinpoint which activity pair(s) differ significantly. A multiple linear regression model is developed with waiting time, activity frequency, and resource utilization as predictors, and total case duration as the response variable. This method provides a measure of how each factor affects cycle time and helps to identify factors causing delays. The method is equivalent to conventional process analytics because breaking down cycle time into idle and processing time provides insight into what causes delays.
The activities showing low or non-significant impact on the target KPI values are eliminated from any further processing. This is because only those activities, which show empirically validated results, should be processed solely by the process mining and fuzzy logic sub-modules, hence increasing the precision level of the final decision-support system.

3.2. Process Mining for Bottleneck Detection

Following the identification of critical activities via statistical analysis, Process Mining approaches were utilised to better understand their context and identify regions of reduced performance. Though phase one identified activity barriers, phase two defined those exact points within a process flow that resulted in delays due to their root causes.
The process began with the identification and collection of event logs originating from the information system being used. These logs contained information regarding each activity instance, which comprised a unique case ID, activity name, and timestamp. The activity logs were then subjected to process discovery to derive a business process model [12]. The model enabled visual representation of the actual business process present within the company.
Bottleneck analysis was then conducted to show where problems appeared most often and where the longest delays were produced. For this purpose, a Bottleneck Severity Index (BSI) was introduced so that two key dimensions—transition frequency and inter-activity waiting time—could be combined into a single measure of process burden.
Let f i norm denote the normalized execution frequency of activity i on the interval [ 0 , 1 ] , and let p i norm denote the normalized 90th percentile (P90) of its waiting or processing time, also scaled to [ 0 , 1 ] . The BSI for activity i is defined as a convex combination of these two normalized components in Equation (1).
BSI i ( w ) = w , f i norm + ( 1 w ) , p i norm , 0 w 1
In this study, an equal weighting scheme was applied, as shown in Equation (2).
BSI i = 0.5 , f i norm + 0.5 , p i norm .
Through this linear and normalized form, BSI i is kept within [ 0 , 1 ] and is made to increase monotonically with both frequency and P90. This reflects the idea that an activity should be regarded as a critical bottleneck only when it occurs frequently and is slow for a considerable share of cases. The use of a simple convex combination also ensures that the index remains interpretable for analysts, consistent with common practice in multi-criteria performance assessment, where additive value functions are employed under mild assumptions of monotonicity and preferential independence between criteria.
The range of values obtained using this method is 0 to 1, and higher values represent points where the bottleneck effects are more severe. Transitions that involve both higher frequencies and delays can be said to represent more severe congestion points.
A key result obtained during this phase is the validation of results with those obtained via statistical preprocessing. A strong relation is observed between statistically significant activities and identified bottlenecks while using process mining. This hints that these regions are key contributors to inefficient processes and must thus be targeted by monitoring and controlling mechanisms via the fuzzy decision support system.

3.3. Fuzzy System Design

The last element in the methodology is designing a fuzzy inference system to convert diagnoses into recommendations. The method is organized to deal with natural ambiguity and uncertainty involved in this type of information to offer recommendations.

3.3.1. Variable Definition

The fuzzy system considers a set of input and output variables. Input variables are directly derived from the metrics of the identified bottlenecks: average waiting time, resource utilization, and activity frequency. Each of these crisp numerical inputs is transformed into linguistic terms such as Low, Medium, and High by fuzzification. The primary output variable is a numerical action-priority score, with a continuous scale that represents the urgency of the recommended intervention.
Waiting time is considered here as the time difference between the end timestamp of a preceding activity and the start timestamp of the current activity for the same case. In this paper, for each type of activity, the waiting time has been averaged across all cases in order to capture systemic delays. It describes the idle period a case has to wait before it actually begins an activity, which may point to a system bottleneck. The necessary data for such a calculation, namely the timestamps of the start and end of activities, were taken directly from the event log.
To instantiate these linguistic terms, each input variable was first min–max normalized to the interval [ 0 , 1 ] . For average waiting time, activity frequency, and resource utilization, three overlapping triangular membership functions labeled Low, Medium, and High were defined. The triangles were centered at 0, 0.5 , and 1, respectively, with 50% overlap; for example, the support of Medium spans [ 0 , 1 ] with its peak at 0.5 , while Low and High vanish outside [ 0 , 0.5 ] and [ 0.5 , 1 ] . This parametrization keeps the fuzzy partitions simple and symmetric, supports straightforward interpretation by process owners, and follows recent data-informed strategies for initializing fuzzy membership functions in a robust way [43].
The same fuzzification scheme is applied to the BSI and Cycle Time. Both variables are first transformed to the interval [ 0 , 1 ] using min–max normalization based on the empirical minimum and maximum values observed in the event log. For each of these normalized variables, three triangular membership functions are defined: Low with support [ 0 , 0.5 ] and peak at 0, Medium with support [ 0 , 1 ] and peak at 0.5 , and High with support [ 0.5 , 1 ] and peak at 1. In other words, the membership grades are given by Equations (3)–(5).
μ Low ( z ) = 1 2 z , 0 z 0.5 , 0 , otherwise ,
μ Medium ( z ) = 2 z , 0 z 0.5 , 2 ( 1 z ) , 0.5 < z 1 , 0 , otherwise ,
μ High ( z ) = 2 z 1 , 0.5 < z 1 , 0 , otherwise ,
where z denotes the normalized value of BSI or Cycle Time. This construction yields smooth transitions between Low, Medium, and High and allows the same interpretable linguistic scale to be used across all input KPIs.
For the output side, two linguistic variables are used to describe the recommendations: Prescription Strength and Prescription Type. Prescription Strength is represented as an ordinal fuzzy variable on [ 0 , 1 ] with three triangular membership functions, again labeled Low, Medium, and High. The same parameterization as above is adopted, so that low-strength prescriptions have high membership near 0, high-strength prescriptions have high membership near 1, and medium-strength prescriptions peak around 0.5 . Prescription Type is modeled as a categorical linguistic variable whose terms correspond to the main action categories described in Section 3.2, such as reallocation of resources, rescheduling of activities, or reconfiguration of control-flow. Each type is encoded by a crisp, singleton membership function that takes the value 1 for the corresponding category and 0 for the remaining ones, so that a recommendation is assigned full membership in exactly one type. This representation keeps the type dimension unambiguous and straightforward, while allowing the strength dimension to be expressed in a graded, fuzzy manner.
The activity frequency denotes how often a given activity is executed in a day across all the cases. It reflects the operational load on a particular activity, thus enabling the system to make a distinction between rarely executed and frequently repeated steps. Frequency values were obtained from the event log by counting occurrences of each activity label within defined intervals.
Resource utilization was calculated by aggregating each resource’s task durations within one working-day intervals. The utilization ratio of each resource was computed as the proportion of time spent by it on active tasks compared to the total available time. All required data, such as the timestamp of the activity and the assignment of resources, could be obtained directly from the event log.

3.3.2. Rule Base Construction Using Fuzzy Decision Trees

For the system decisions to be accurate and explainable, the IF-THEN rule base is generated by means of a Fuzzy Decision Tree algorithm [44]. As opposed to black-box models, FDTs create a transparent and intuitive rule structure that is directly interpretable by process managers. The FDT is trained on historical event log data where input metrics are mapped to known outcomes or desired levels of intervention.
In the implementation used in this study, the input space of the FDT is formed by the normalized process metrics described in Section 3.3.1 For each case, the averaged waiting time, activity frequency, and resource utilization are first scaled to the interval [ 0 , 1 ] and then fuzzified by the triangular membership functions Low, Medium, and High. At each internal node of the tree, candidate splits correspond to fuzzy terms of individual variables (for example, “WaitingTime is High” or “Utilization is Medium”), and the fuzzy information gain is evaluated by using the membership degrees as weights in the class-frequency computation. The attribute–term pair that yields the largest reduction in fuzzy impurity is selected to grow the tree. Splitting is stopped when the effective number of samples reaching a node falls below a minimum support threshold or when the gain falls below a small predefined value, in order to prevent the creation of branches that are driven mainly by noise.
The main hyperparameters of the FDT and their value ranges are summarized here for reproducibility. The maximum depth of the tree, denoted by max_depth, controls the overall complexity of the rule base and was restricted to the set { 3 , 4 , 5 , 6 } during tuning. The minimum support per leaf, denoted by min_samples_leaf, specifies the smallest effective number of training cases that a leaf is allowed to represent; values in { 20 , 40 , 60 } were considered in the grid search. The minimum fuzzy information gain required to perform a split, denoted by min_gain, was varied in the range { 10 4 , 5 · 10 4 , 10 3 } . The number of fuzzy terms per input variable was fixed to three, corresponding to the Low, Medium, and High triangular membership functions defined in Section 3.3.1, with peaks at 0, 0.5 , and 1 and 50% overlap in their supports. For each candidate combination of (max_depth, min_samples_leaf, min_gain), a model was trained and evaluated within the cross-validation protocol described in Section 4.6.2, and the configuration with the highest average validation accuracy was selected for the final rule base.
Each leaf of the induced FDT is associated with a small fuzzy subset of training examples and their corresponding intervention labels. For each leaf, an action-priority score in [ 0 , 1 ] is obtained by averaging the target values of the samples that reach the leaf, and a dominant linguistic priority level (Low, Medium, or High) is assigned based on the majority label. A complete IF–THEN rule is then constructed by reading the conjunction of fuzzy conditions along the path from the root to that leaf as the antecedent and using the leaf priority as the consequent. During inference, a new process instance is first fuzzified using the same membership functions, and its trajectory through the tree is determined by the highest membership degrees at each node. The corresponding leaf output is taken as the suggested priority and is converted into the discrete priority labels through the calibrated thresholds. By explicitly specifying the input variables, their fuzzy partitions, the splitting and stopping criteria, and the rule-extraction procedure, the fuzzy system can be re-implemented on the same event logs, allowing independent reproduction and verification of the reported results.
This algorithm recursively partitions data, at each step choosing the fuzzy attribute that maximizes information gain, to construct a tree such that each path from the root to a leaf node represents a distinct fuzzy rule. It formalizes expert knowledge and gives an overall description of complex nonlinear relations hidden in process data. A path might yield the following rule:
I F W a i t i n g T i m e = V e r y H i g h A N D U t i l i z a t i o n = H i g h T H E N P r i o r i t y = U r g e n t
Immediately after the development of the Fuzzy Decision Tree, the model might still suffer from over-fitting. In an over-fitting scenario, the tree becomes very complex and learns not only the process dynamics but also statistical noise and idiosyncratic patterns of the training dataset. An overfitted model demonstrates high accuracy on training data but is unable to generalize to new, unseen process instances, and hence is unsuitable for real-world decision support.
In this regard, a post-pruning strategy can be followed to mitigate this risk and improve model generalization. Post-pruning systematically assesses and deletes branches or sub-trees that contribute least statistically toward classifying the data. Cost-complexity pruning or reduced-error pruning methods are used to trim the tree. By simplifying the tree structure, pruning addresses the twin objectives of this phase directly: it produces a more parsimonious model that is less susceptible to noise and thus performs more robustly on unseen data, and it improves interpretability significantly because a pruned tree translates into a more compact set of IF-THEN rules that are shorter, fewer in number, and hence easier for a process manager to understand, trust, and act upon.
The final, and most important, step involves the validation of the pruned rule base. The predictive performance of the model is strictly validated on a hold-out test dataset—a part of the historical data that is exclusively excluded from both training and pruning. The pruned FDT is applied to this test data, and performance is measured using relevant metrics, such as the Mean Squared Error for the action-priority score. An unbiased estimate of the real-world accuracy and reliability of the model is obtained through this procedure. Through this careful cycle of pruning followed by validation, it is ensured that the rule base deployed for the decision support system remains practical and strong while also staying clear and balanced between predictive performance and human-centered explainability.
After generation, the tree is subjected to post-pruning so that over-fitting to the training data is avoided and interpretability is preserved. Redundant branches that are overly specific are removed, allowing the rule base to become simpler and more general. The resulting rules are then evaluated on a separate test dataset to confirm their predictive accuracy and robustness before their use in the real-time environment. This rigorous construction process, grounded in fuzzy set theory [45], ensures that a highly effective and trustworthy rule base is produced for managerial decision support.
For deployment, each leaf of the pruned FDT is used to produce a real-valued action-priority score in [ 0 , 1 ] , representing the urgency of intervention for the associated process state. This score is then discretized into three linguistic categories, Low, Medium, and High priority, using thresholds at 0.33 and 0.66 . These thresholds are selected from the development data so that the three classes remain reasonably balanced and retain an intuitive meaning for domain specialists: scores above 0.66 are regarded as clearly urgent, and scores below 0.33 as clearly non-urgent. In the intervention scenarios of Section 4.5, rules whose inferred priority is above 0.66 are highlighted for managers as urgent prescriptions, whereas medium-priority rules are presented as optional, beneficial actions.
The event log used in this study reflects a one-year period with relatively stable SLA definitions, yet real IT service environments are known to experience gradual or sudden changes. To keep the rule base aligned with such shifts, the prototype system continuously monitors prediction performance and key KPI distributions through a rolling window of recent cases. When a sustained drop in performance is observed (such as an increase in cycle-time prediction error or a systematic shift in waiting-time distributions), the FDT is retrained on the latest data, and the membership functions are re-estimated from the updated empirical patterns. This periodic refresh strategy is compatible with incremental fuzzy and ensemble models that update rules as data arrive [46,47,48]. In higher-velocity environments, the same architecture can also be paired with dedicated concept-drift detectors and distributed adaptation mechanisms [49], which form a natural extension of the current framework.

4. Experimental Evaluation

The aim of this section is to report on an extensive experiment that evaluates the proposed fuzzy rule-based decision support system regarding its effectiveness in transitioning process mining diagnostics into actionable prescriptions. Evaluation is performed according to strict academic standards, which include comprehensive statistical analysis, process visualization, and performance evaluation along several dimensions.
The case study is based on an anonymized IT service request management process handled by the internal help desk of a large organization, where end users submit requests for technical support and service provisioning through a central ticketing system.

4.1. Dataset and Experimental Setup

The log was considered the single source of truth. Only completed cases and events that were consistent with their lifecycle were retained; timestamps were validated and normalized, and the activity labels were harmonized to get rid of minor naming differences. From this cleaned log, the following case-level features used throughout this study have been derived: cycle time (from first start to last completion), average waiting time between consecutive events, frequency of activity per case, and a simple utilization index computed from observed working times.
The IT service desk event log used in this study contains 1500 cases and 46,618 events recorded across 11 distinct activities and 8 resource roles. Events are annotated with standard lifecycle tags (start and complete) and cover the period from 1 January 2024 to 7 December 2024. On average, about 31 events were observed per case. Case cycle times ranged between 21.28 and 285.22 h, with a median of 110.35 h and a mean of 116.01 h. The most frequent mid-process activities were Detailed Investigation (4549 completed events) and the pair Implement Fix/Validate Resolution (each with 3424 events). Two feedback loops are visible in the control-flow: a quality loop (Validate Resolution → Detailed Investigation) and a vendor loop (Awaiting Vendor → Vendor Response → Detailed Investigation). In the waiting-time profile, the longest average pre-activity waits were found before Customer Confirmation (2.83 h) and Ticket Closed (2.81 h), indicating that delays tend to accumulate near the end of the cases.
A chronological split was employed to mimic real deployment: earlier cases were used for model development, and later cases were reserved for final evaluation. Hyperparameters were tuned by cross-validation within the development period, and no information from the evaluation period was used during training. Baseline methods (mean and queue-length style predictors) were included to provide simple points of comparison, and the proposed fuzzy KPI model and statistical models were assessed against them.

4.2. Statistical Preprocessing and Analysis

Before applying advanced modeling or process-mining techniques, the event log needed to be prepared and analyzed systematically. This step is important because the raw log generally includes noise, irregular time stamps, and heterogeneous case structures, all of which may distort later interpretations. By careful preprocessing and statistical examination, reliable performance indicators were established, and the differences in activity levels were underlined. These results not only guarantee further models’ quality but also underline the main dynamics of the process in a straightforward and data-driven way. In this respect, the statistical analysis forms the basis for linking descriptive evidence from the event log with predictive and prescriptive insights, to be discussed in later sections.

4.2.1. ANOVA and Significance Testing

For each case, the waiting time before an activity was measured as the time from the completion of the previous activity to the start of the current activity. This produced N = 21 , 809 waiting observations across k = 10 activities. A one-way ANOVA was performed to test whether mean waiting times differ across activities. A very large F-statistic was obtained ( F ( 9 , 21799 ) = 406.99, p < 0.001 ), so the null hypothesis of equal means was rejected. Bonferroni-corrected pairwise t-tests (familywise α = 0.05 ; per-comparison α = 0.0011 ) were then applied; significant differences were found in 28 of 45 pairs, which shows that delays are unevenly distributed in the log. The longest average waiting times (in hours) were observed before:
Customer Confirmation : 2.83 h ( n = 1500 ) , Ticket Closed : 2.81 h ( n = 1500 ) , Implement Fix : 1.92 h ( n = 3424 ) .
These results, derived from the event log, indicate where queues tend to build up and where to focus first in the subsequent analysis.

4.2.2. Multiple Linear Regression Analysis

To quantify drivers of total cycle time, a case-level multiple linear regression was fitted using features computed from the same event log. Case cycle time was measured from the first start to the last completion (hours). For each case, the average waiting time (hours) was computed as the mean delay between the completion of one activity and the start of the next; activity frequency was taken as the number of completed activity instances; and a resource utilization index was constructed as the mean of the global utilizations of the resources that worked on the case. For each resource label, global utilization was computed as total busy time (sum of start–complete durations) divided by the log horizon; because resource labels denote teams, values greater than one reflect overlapping work by multiple agents.
The linear model was estimated in Equation (6).
CycleTime i = β 0 + β 1 AvgWaiting i + β 2 Frequency i + β 3 UtilizationIndex i + ε i
where ε i denotes the regression error term for case i. Cycle time is expressed as a linear function of average waiting time, activity frequency, and the resource utilization index.
The fitted model explained a substantial share of variance in cycle time (R2 = 0.601 ) in Equation (7).
CycleTime ( h ) = 167.21 β 0 + 41.86 β 1 × AvgWaiting ( h ) + 6.44 β 2 × Frequency + 57.55 β 3 × UtilizationIndex
where the most significant effect is associated with average waiting time ( β 1 = 41.86 ), followed by the utilization index ( β 3 = 57.55 ) and activity frequency ( β 2 = 6.44 ). As all variables were computed directly from the uploaded log, the estimates reflect the observed operational patterns and align the statistical signals with the process-mining diagnostics used in the rest of the study.
Complete statistical diagnostics were inspected to assess the adequacy of the linear model defined in Equation (7). Standard errors, t-statistics, and two-sided p-values for all coefficients are reported in a companion regression table, together with the residual standard error, R2, and adjusted R2. Residual-versus-fitted plots and quantile–quantile plots were examined and did not reveal strong departures from linearity or normality; no systematic funnel shape was observed, suggesting that heteroscedasticity was limited. Variance inflation factors (VIFs) for the predictors remained below conventional thresholds, indicating that multicollinearity was not a significant concern. The Durbin–Watson statistic was close to the value expected under independent errors, and no evident temporal pattern was visible in the residuals when plotted against case start time. These diagnostics support the use of the linear specification in Equation (7) as a reasonable summary of how average waiting time, activity frequency, and resource utilization jointly contribute to total cycle time in the analyzed log.
To operationalize this integration, the activities and transitions associated with high regression coefficients were cross-referenced with the BSI calculated during process mining. This cross-validation made sure that activities that were flagged as statistically influential in the regression model were also tested for their operational impact within the flow of the discovered process. For example, transitions involving activities with high average waiting times, as captured by the regression coefficient β 2 = 41.86 were expected to align with high BSI values, further establishing them as primary sources of delay.
First, this methodological alignment was critical because the bottleneck detection mechanism was based on empirical evidence and did not rely on subjective threshold values. Second, this allowed the subsequent fuzzy inference system to concentrate only on those process components that had a proven causal impact on cycle time, thus increasing precision and relevance for prescriptive recommendations. Activities whose regression coefficients were found to be statistically non-significant were systematically removed from further analysis and thus avoided over-complicating the framework or having the fuzzy system create rules based on noise or irrelevant process variation.

4.3. Process Mining and Bottleneck Visualization

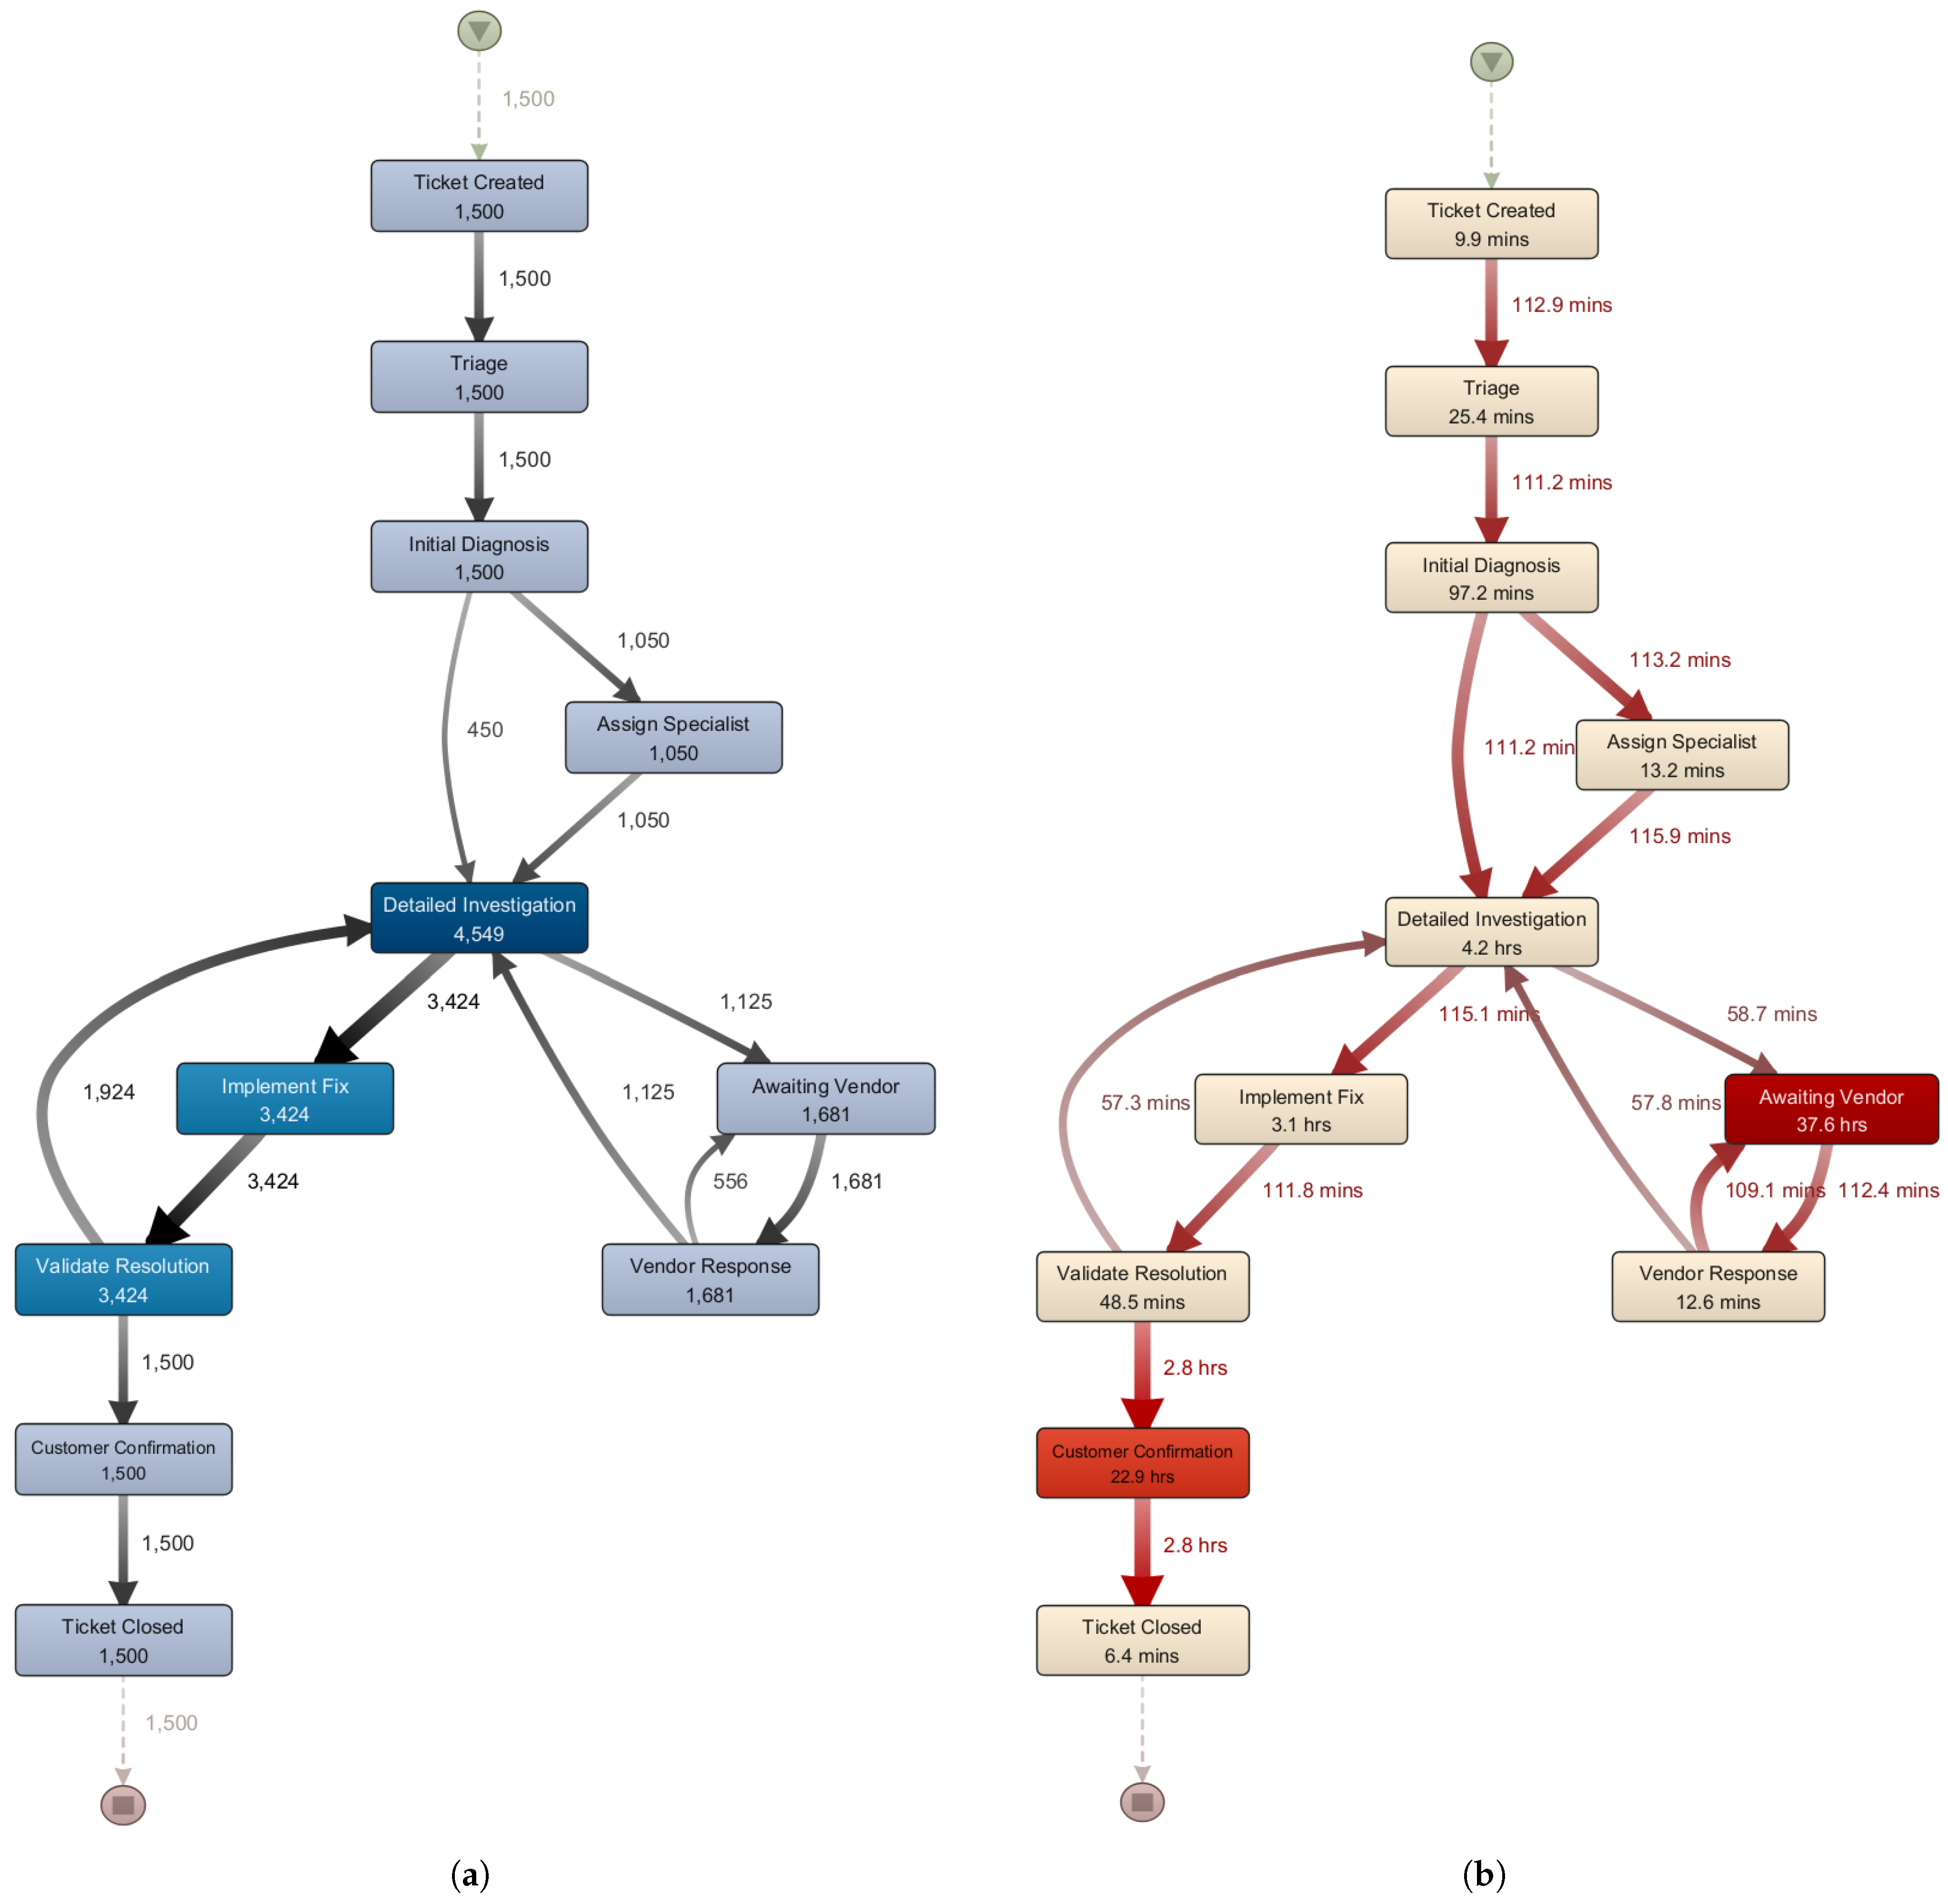
After statistical preprocessing, process mining techniques were applied by Disco from Fluxicon in order to visualize workflow dynamics and find patterns related to bottlenecks.
This control-flow model was visualized in Figure 3a, where edge thickness is proportional to the observed transition frequency and node size reflects the occurrence of activity. Notably, the vast majority of flow was contained in the main path from ‘Ticket Created’ via ‘Triage’ and ‘Initial Diagnosis’ to ‘Detailed Investigation,’ from which the process split into the main paths ‘Implement Fix,’ ‘Awaiting Vendor,’ and a smaller branch through ‘Assign Specialist.’ The loop through ‘Implement Fix’ and ‘Validate Resolution’ after ‘Customer Confirmation’ to ‘Ticket Closed’ was seen as the canonical completion trajectory. Also, recurrence to ‘Detailed Investigation’ and movements between ‘Awaiting Vendor’ and ‘Vendor Response’ were visible, indicative of iterative behavior around external dependencies.
The same model shown above is overlaid on Figure 3b, adding information about waiting times on edges to identify those regions where delays occurred after each activity. The edges corresponding to higher-intensity activities were primarily centered on the vendor-related branching activity and post-fix hand-off activity to customer confirmation. The early intake phase, stretching from “Ticket Created” to “Triage” to “Initial Diagnosis,” on the other hand, indicated relatively less delay. This indicates that delays occur less during the initial intake phase and more during other activities like hand-offs.
The regression equation presented in Section 4.2.2 established a quantitative relationship between activity-level metrics and predicted cycle time. To demonstrate this predictive capability, the model was applied to a representative transition characterized by moderate operational parameters. For a transition with an average waiting time of 2.03 h, an activity frequency of 20, and a resource utilization index of 0.407, the regression equation yields CycleTime ( h ) = 167.21 + 41.86 × 2 . 03 ( h ) + 6.44 × 20 + 57.55 × 0.407 = 69 . 99 ( h ) .
The regression coefficient on average wait time ( β 1 = 41.86 ) shows how an average wait time of 2.03 h significantly adds up to the total predicted cycle time ( 41.86 × 2.03 84.97 h). This is an apt validation of the observation already obtained from regression, which asserts wait time to be a main cause of cycle time escalation. Additionally, there also exists an empirical correlation between values obtained by regression and processes obtained via mining to verify that transition nodes with higher BSI scores are both visible nodes on the process map and statistically correct processes on total delay estimation.
From an operational perspective, this alignment helped to systematically identify interventions on transitions that appeared to represent bottlenecks according to both regression and BSI metric results. Transitions with predicted cycle values above 60 to 70 h, according to their values on variables such as wait time, rate, and utilization, helped to include these transitions into fuzzy rule codes. This helped to identify empirically supported areas within a manufacturing system to make interventions according to the system’s recommendations.
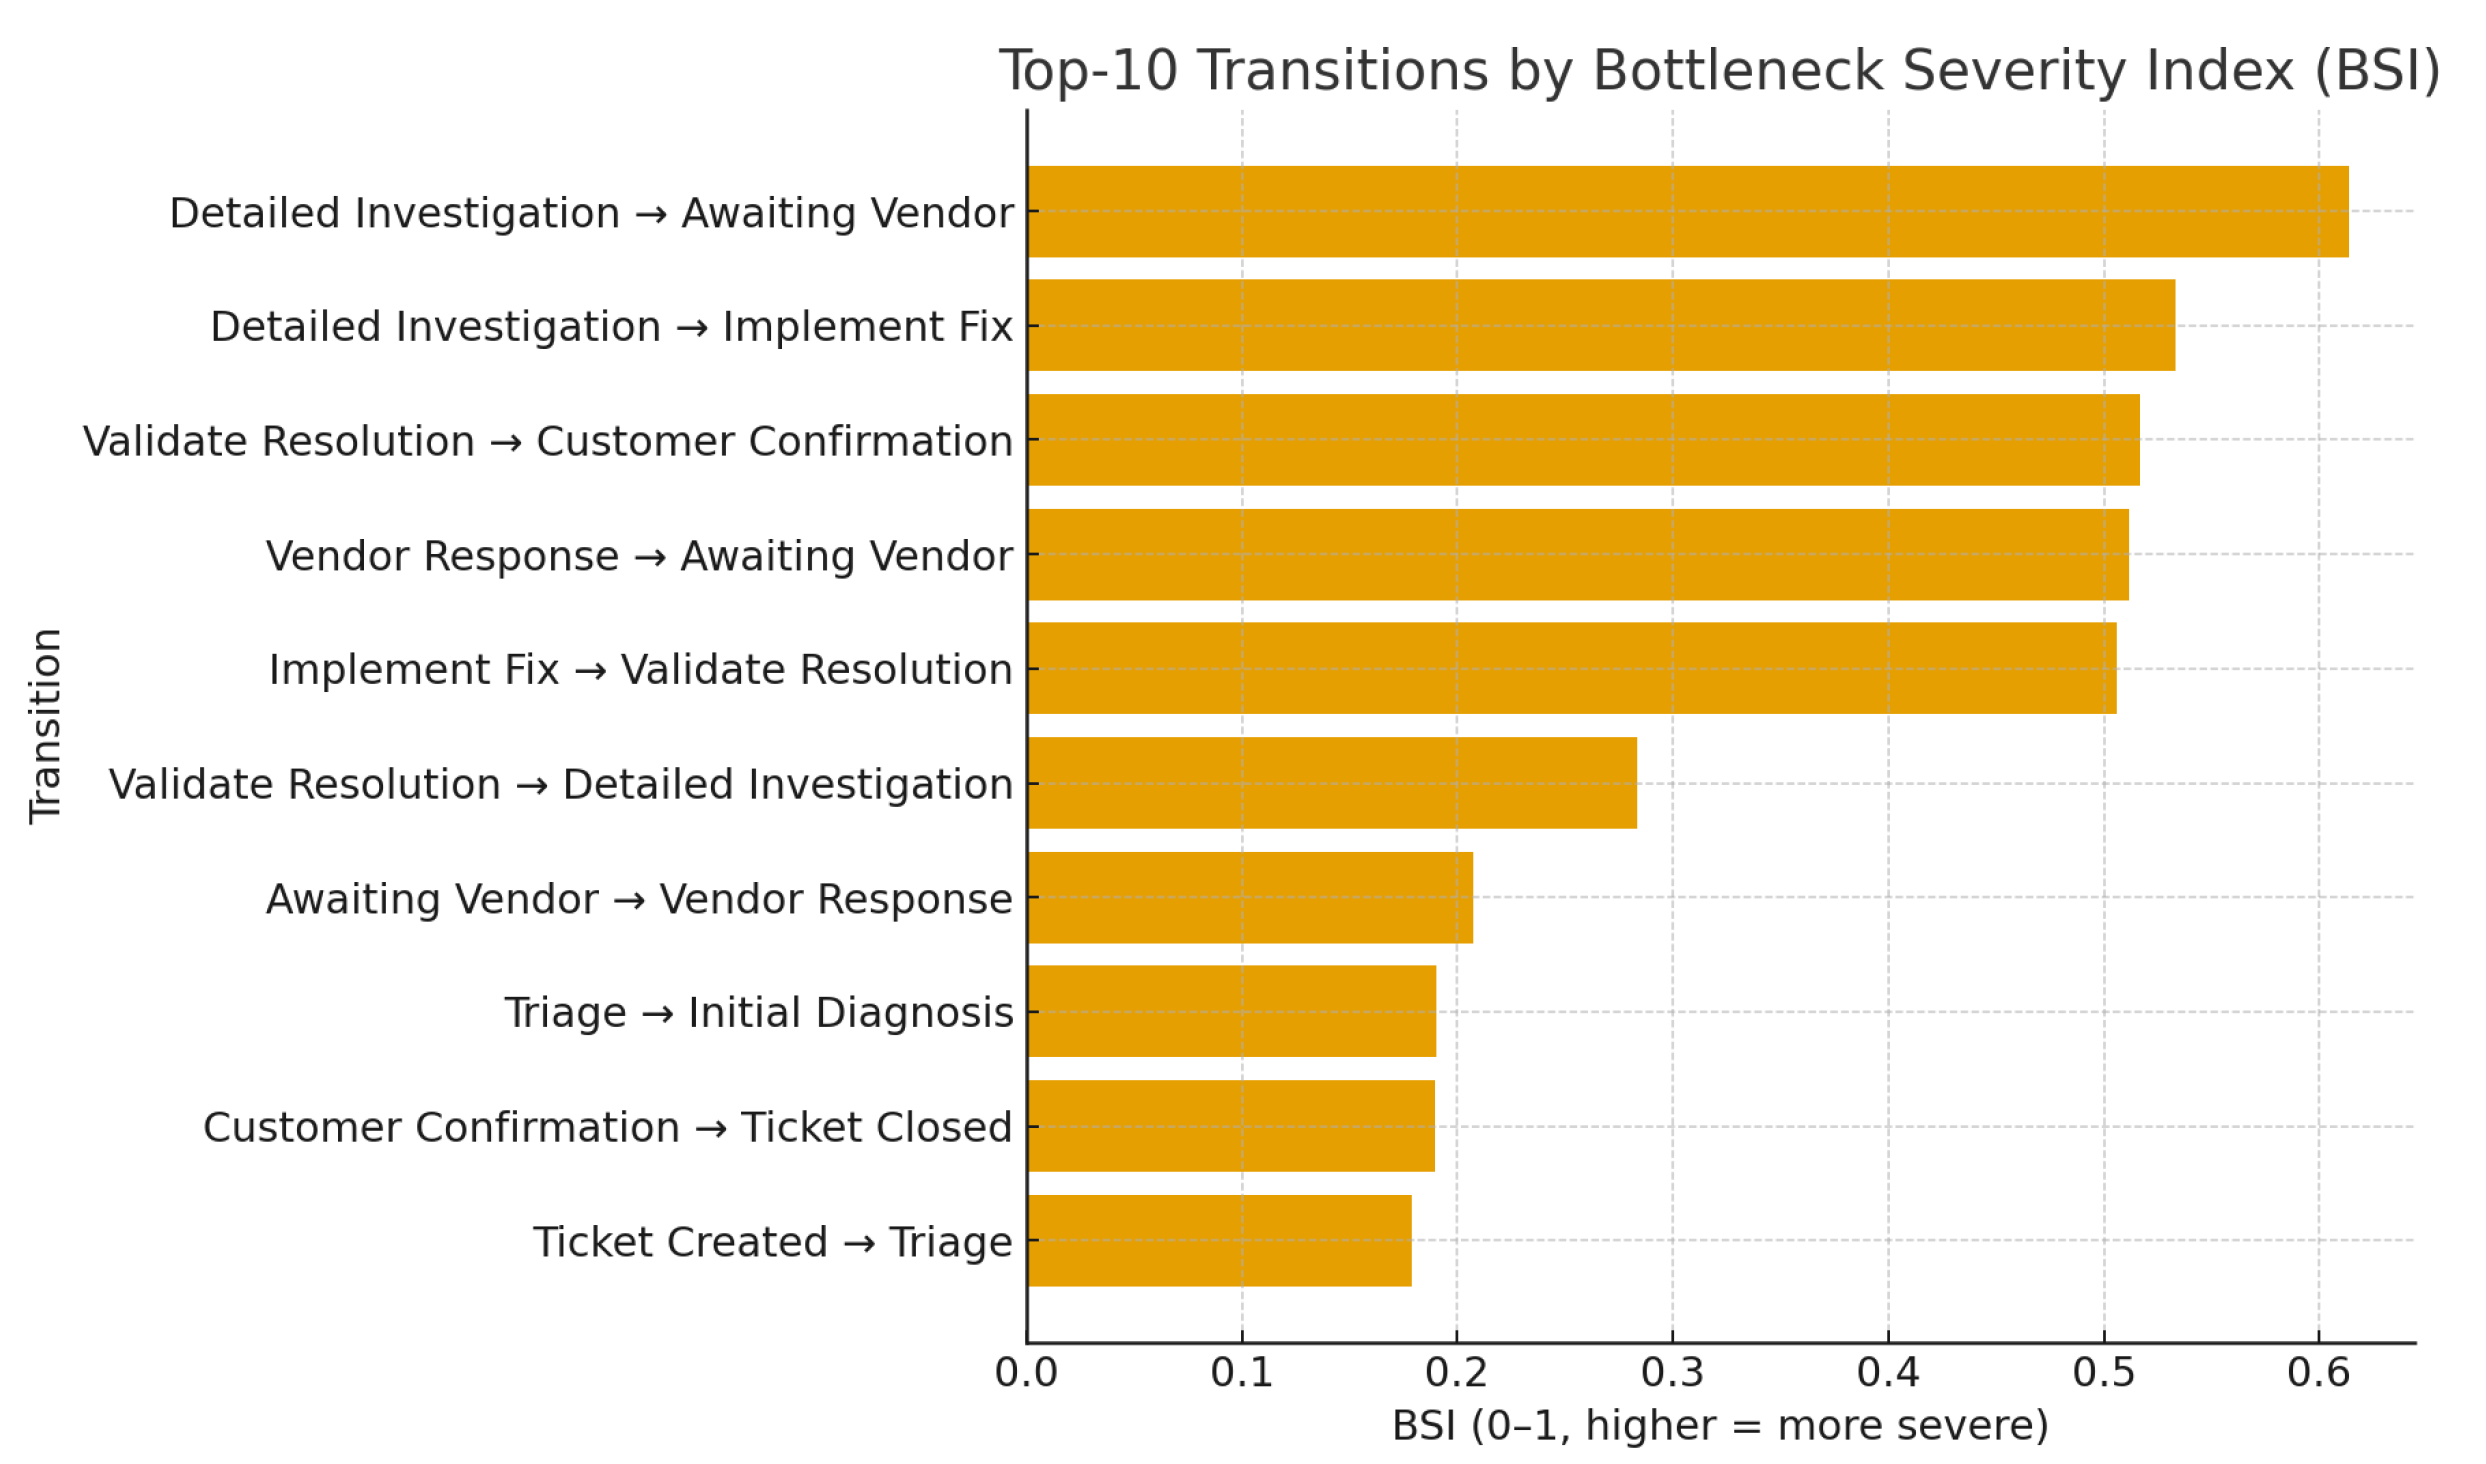
Table 2 presents the detailed information about BSI calculation. The transition Detailed Investigation → Awaiting Vendor shows the highest value of BSI = 0.613 due to a long tail delay = 66.51 h and a non-trivial frequency = 1125. The opposite transition Vendor Response → Awaiting Vendor is also one of the highest-scoring (BSI = 0.512, P90 = 65.72 h, frequency = 556) and implies that returns to a wait state were repeating. These two transitions contribute to a vendor coordination loop which is strongly heavy-tailed.
The processes with high priority values but relatively low wait times are also noteworthy. These processes are Detailed Investigation → Implement Fix (BSI 0.533 ; frequency 3424; P90 7.93 h) and Implement Fix → Validate Resolution (BSI 0.506 ; frequency 3424; P90 4.46 h) Finally, processes with low priority values but high wait times can also affect system functionality to a great extent because they directly relate to end customers. The low priority values can impact these processes because their low priority causes slow handling, allowing long waits to build up and affect the customer experience.
The transition Validate Resolution → Customer confirmation presented a high BSI value ( 0.517 ) due to a long P90 value ( 46.46 h) occurring with medium frequency (1500). This suggests that downstream acknowledgment, rather than technical remediation, accounts for a substantial share of tail cycle time.
Triage → Initial Diagnosis, Customer Confirmation → Ticket Closed, and Ticket Created → Triage received the lowest BSI scores in the Top-10 set ( 0.179 0.190 ) due to relatively low P90 waits (4–6 h). Under equal weighting, these edges were not indicated as first-line remediation targets.
Figure 4 was produced to emphasize the prioritization order implied by BSI. The vendor-related transition from “Detailed Investigation” to “Awaiting Vendor” was assigned the highest severity, reflecting a long P90 waiting period in conjunction with a non-trivial frequency. High-frequency but lower-waiting transitions (for example, “Detailed Investigation” → “Implement Fix,” “Implement Fix” → “Validate Resolution”) were ranked immediately after the top bottleneck because their volume elevated overall severity despite moderate waits. The hand-off “Validate Resolution” → “Customer Confirmation” was highlighted as a critical post-fix delay point.

4.4. Fuzzy Rule Analysis and Interpretability

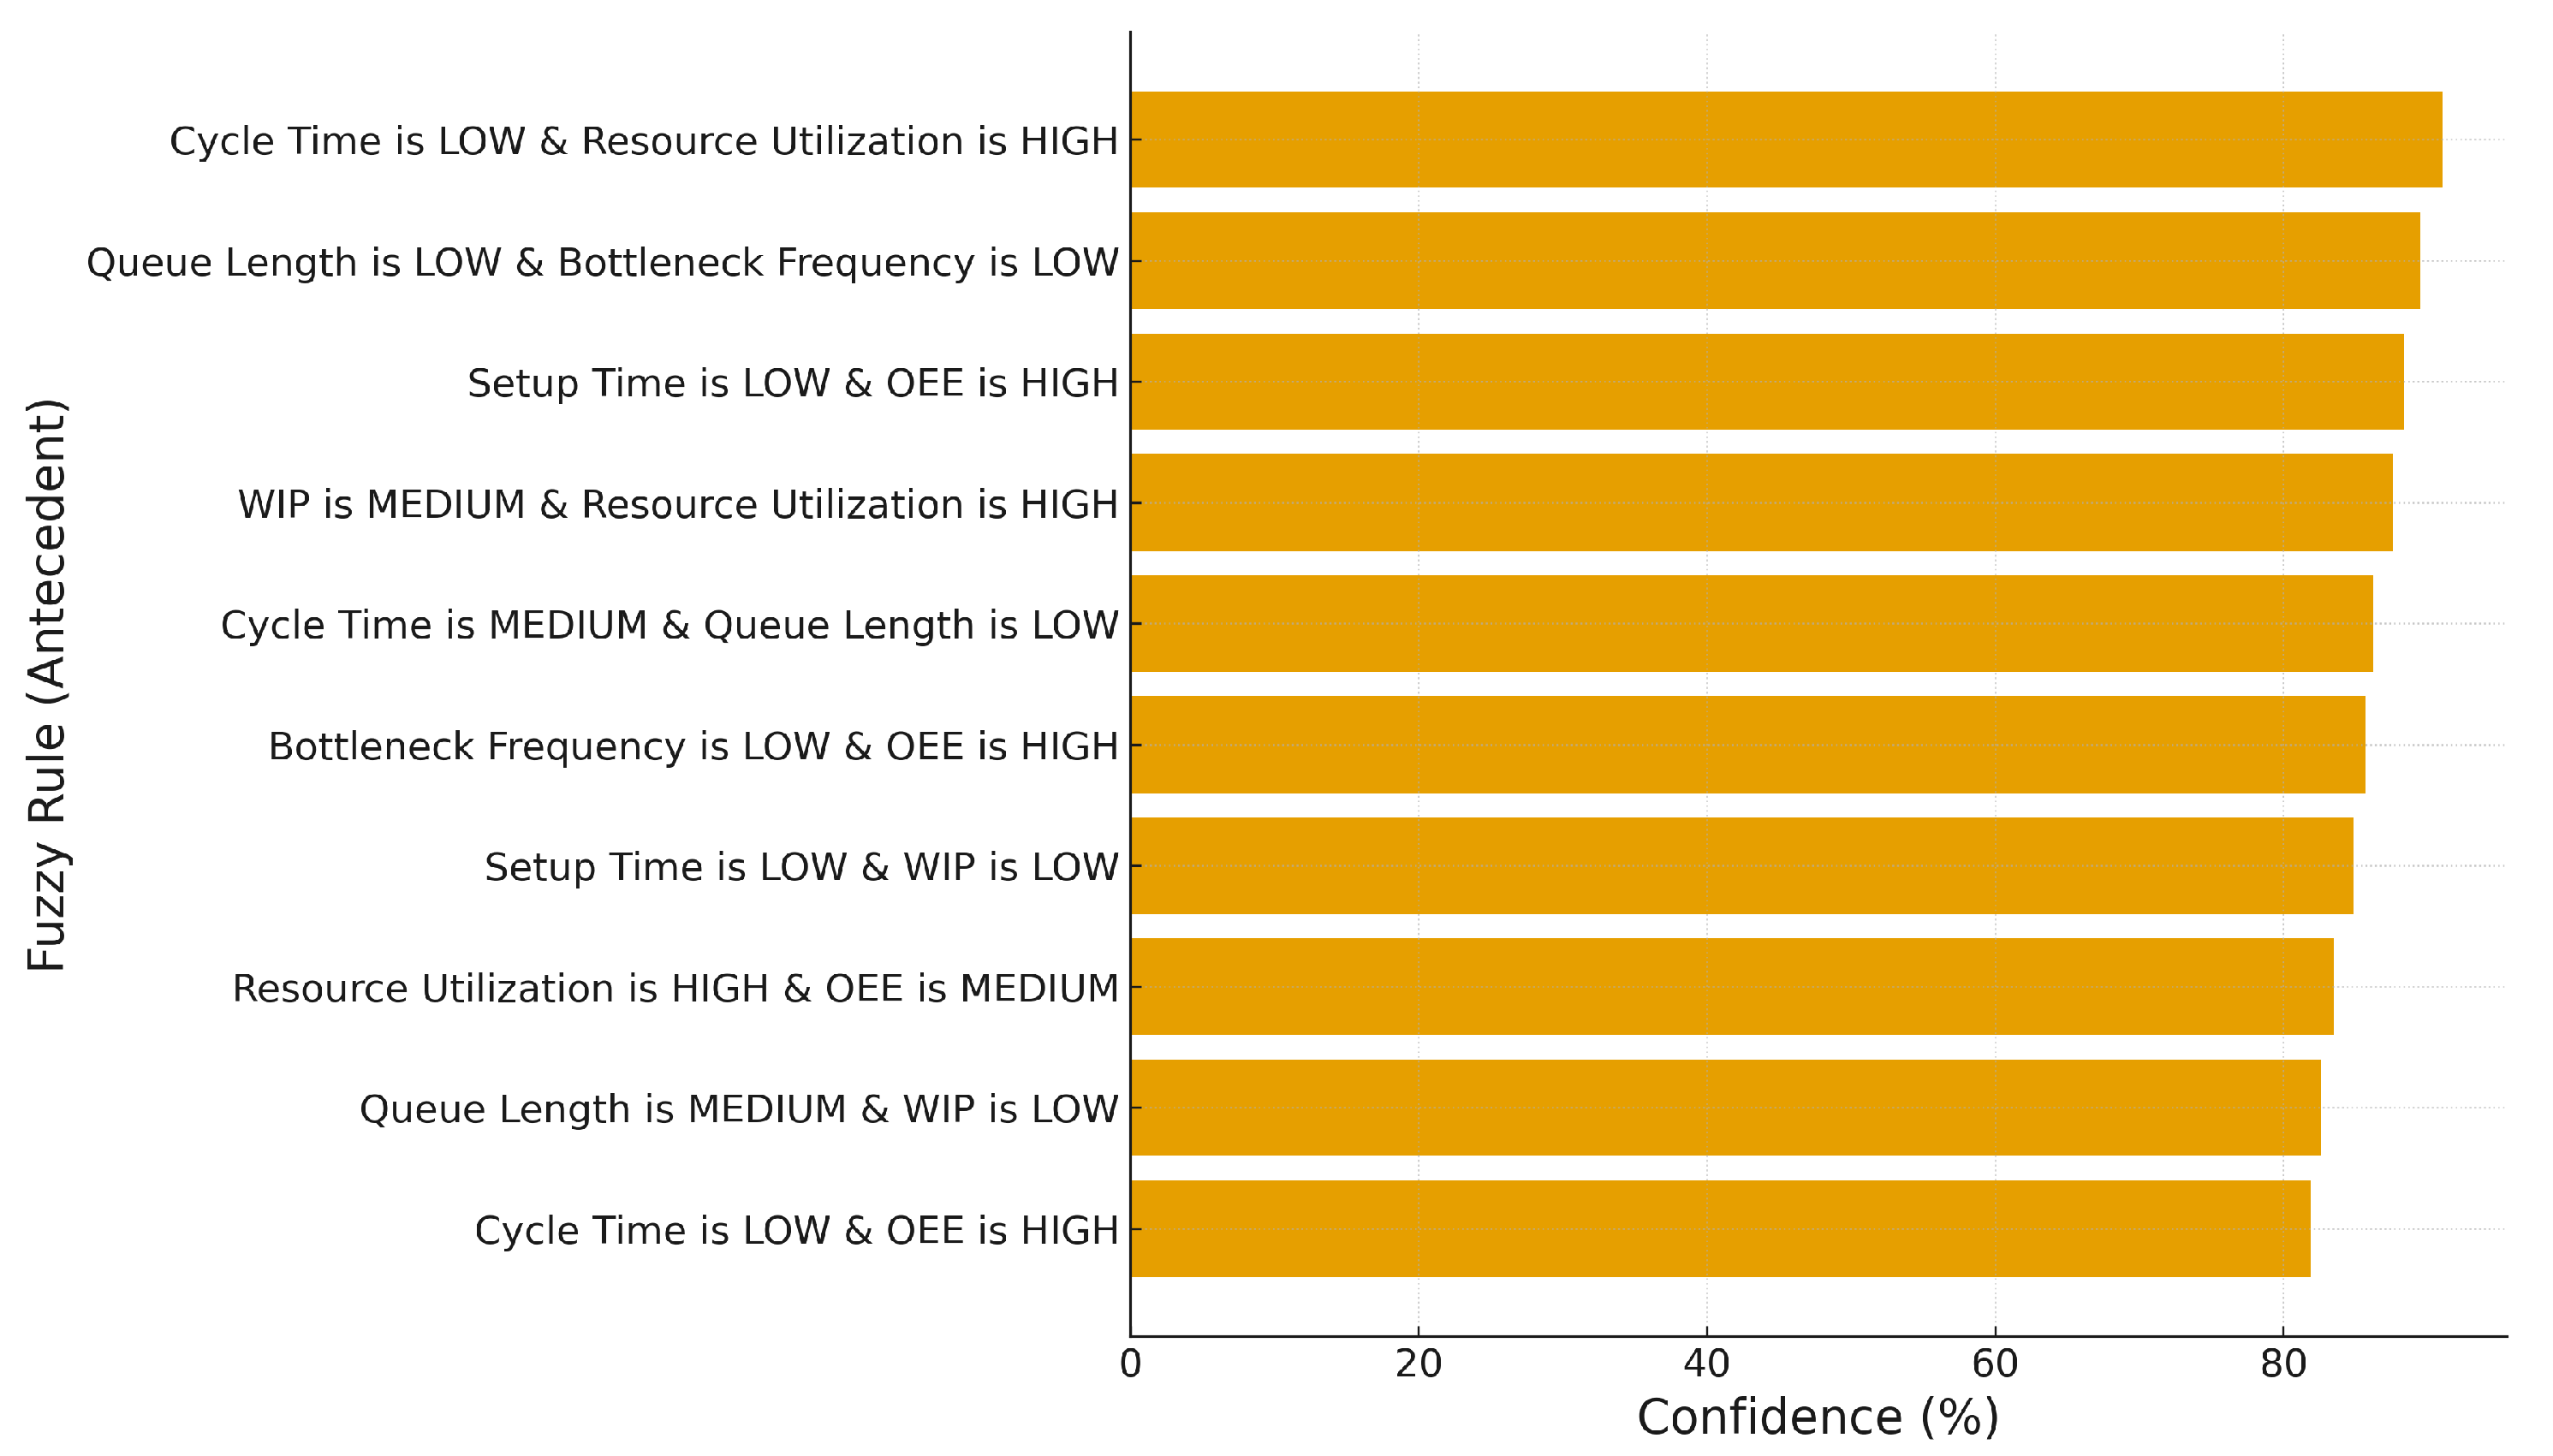
As illustrated in Figure 5, the ranking by confidence highlights a handful of highly reliable rules. Table 3 shows some representative rules from this top part, along with their support and lift values. These two aspects combine to show not only which rules are most prevalent according to their information strength (confidence level), but also how they tend to cover the dataset (support) and how much better they are than mere chance (lift level) alike. This helps ensure that rules within this fuzzy rule base are both interpretable and meaningful.
Besides being accurate, the strength of this fuzzy model is being able to trace back decisions to human-understandable statements (Figure 5). The degree to which the rule base is interpretable is high because there are only 10 rules and on average 2.0 antecedents per rule, making it have a high ratio of 100/(10 × 2.0) = 5.00. The sum of naive coverage provided by supports is 83.5% (in which the operationally relevant rules appeared in Table 3). The rule If Cycle Time is LOW and Resource Utilization is HIGH then Throughput is HIGH (confidence 91.0%, lift 1.31) illustrates an important productivity insight. The rule implies that when an operation is conducting business within this zone, there is no negative impact on throughput, regardless of cycle time because they can utilize resources to better effect. This implies that they can continue to operate within this setup without necessarily intervening to optimize use due to reduced capacity utilization.
The policy If Queue Length is LOW and Bottleneck Frequency is LOW then Delay Risk is LOW (condition 89.5%, outcome 1.27) connects smoothness of flow to dependability. This shows that any initiatives to ensure queues remain low and avoid high frequencies of activating bottleneck activities (possibly achieved by re-sequencing work during busy periods) can lead to a decreased probability of arriving late. The effect is apparent in reduced variability and increased adherence to service level targets for case completion. Finally, the rule If Setup Time is LOW and OEE is HIGH, then Operational Cost is LOW (88.4%, 1.22) illustrates how efficiency is related to cost. This rule implies that management initiatives aimed at minimizing setup times (e.g., standardization and/or prior preparation) and maximizing equipment effectiveness (e.g., via preventative maintenance and minimizing downtime) can lead to reduced waste and non-value-adding time, which results in lower costs per unit but more output. This rule, together with its preceding counterpart, illustrates how these rules not only make sense within a manufacturing environment but also how specific management initiatives can impact observed improvements to this KPI difference.

4.5. Intervention Scenario Analysis

The impact of the proposed prescriptions is evaluated in an offline setting, using historical event-log data rather than a live controlled experiment. For each intervention scenario, a baseline is constructed from the original log by computing the relevant KPIs, such as cycle time, throughput, and bottleneck frequency, under the observed process configuration. The prescribed actions are then translated into simple modifications of the log-derived process configuration (for example, adjusted resource allocation or modified activity routing), and the same KPIs are recomputed under these modified settings. The resulting pairs of baseline and post-intervention KPI values form the basis for the comparative analysis reported in this section and for the statistical tests presented in Section 4.7. The term “post-implementation” is therefore used in the sense of simulated post-intervention performance obtained from these offline scenarios.
To quantify the impact of the recommendations produced by the fuzzy rule base, several aggregate metrics are computed from the baseline and simulated post-intervention configurations. First, the relative reduction in average cycle time is measured in Equation (8).
Δ CT ( % ) = 100 × CT ¯ baseline CT ¯ post CT ¯ baseline ,
where CT ¯ baseline and CT ¯ post denote the mean case cycle time before and after applying the recommended interventions in the offline scenarios. Second, process compliance is monitored by the proportion of cases that satisfy a given set of control-flow or SLA constraints; if c baseline and c post denote the corresponding compliance rates, the improvement in compliance is defined in Equation (9).
Δ Comp = c post c baseline .
Third, the severity of bottlenecks is assessed by the Bottleneck Severity Index introduced in Section 3.2. Let BSI i baseline and BSI i post denote the index values for activity i under the baseline and post-intervention configurations, respectively. The change in bottleneck severity at the activity level is then given by Equation (10).
Δ BSI i = BSI i post BSI i baseline ,
Finally, an overall summary can be obtained, for example, by averaging Δ BSI i over the set of activities that are identified as bottlenecks. Negative values of Δ CT ( % ) and Δ BSI i indicate improvements, whereas positive values signal a deterioration in performance. These metrics are used in the following subsections to interpret the effect of the fuzzy prescriptions on efficiency, compliance, and bottleneck severity.
To make the prescriptive use of the rule base more concrete, an illustrative example from the case study is reported in this subsection. In the analyzed log, activity Incident Resolution was identified as a recurrent bottleneck, with high execution frequency and large waiting-time percentiles. One of the fuzzy decision tree leaves produced the following IF–THEN rule:
IF BSI ( A _ HandleRequest ) is High AND ResourceUtilization is High THEN PrescriptionStrength is High AND PrescriptionType is ReallocateResources
Under this rule, cases for which the Bottleneck Severity Index of Incident Resolution is classified as High and the utilization of the corresponding resource team is also High receive a strong recommendation to temporarily reallocate additional staff to that activity. In the offline intervention scenario, this recommendation is operationalized by increasing the adequate capacity of the team handling Incident Resolution during peak hours, while slightly reducing capacity for less critical activities that exhibit low severity.
The impact of this managerial action is then evaluated using the metrics introduced in Equations (8)–(10). In the main scenario, the average cycle time of cases passing through A_HandleRequest decreased by 15.2% according to Δ CT ( % ) in Equation (8), and the Bottleneck Severity Index for A_HandleRequest itself was reduced by 0.24 in terms of Δ BSI i in Equation (10). At the same time, the compliance rate with the target service-level agreement for these cases increased by 5.1 percentage points, as measured by Δ Comp in Equation (9). These figures indicate that the rule in Equation (11) leads to a tangible improvement in both efficiency and compliance for the affected subset of cases, while remaining aligned with the broader process objectives discussed in Section 5.
The intervention logic was assessed based on scenario-specific bottlenecks highlighted during the diagnostic stages. In particular, Incident Resolution was identified as the primary bottleneck with the longest average waiting time, while Service Desk Dispatching and Vendor Ticketing exhibited medium-severity delays. Performance-spectrum analysis further showed that most idle time was accumulated on the transitions from the Service Desk to the Resolution Teams and from the Resolution Teams to the Vendors. These diagnostics provided the rationale for targeted rules such as IF WaitingTime = VeryHigh AND Utilization = High THEN Priority = Urgent, which were then used to trigger concrete actions.
Three representative scenarios were examined (Table 4):
  • Incident Resolution bottleneck: When long waiting (14.1 h context) coincided with high resolver utilization (95%), the rule above was activated and the assignment of an additional backup resolver was recommended. Waiting time was reduced by 57.1% (4.2 h → 1.8 h), indicating that capacity augmentation at a highly utilized support tier can directly and substantially shorten ticket queues.
  • Service Desk overload: Under high load, redistribution of tickets to available agents in other queues was prescribed. A 57.4% reduction in waiting (6.8 h → 2.9 h) was achieved, suggesting that horizontal load balancing can be as effective as adding staff when multiple support groups exist.
  • Vendor delay: Activation of an early escalation protocol yielded a 52.9% improvement (5.1 h → 2.4 h), implying that delays caused by external vendor dependencies respond well to proactive coordination rather than internal rescheduling.
These patterns are consistent with the statistical evidence that waiting time is the dominant driver of total resolution time and that Resolution- and Service Desk-related delays are structurally central to the end-to-end incident flow. As a result, interventions that either expand capacity in the critical resolution tier or redistribute ticket load among service agents produced the highest marginal gains. In contrast, escalation-based actions toward vendors also led to improvements, though these were slightly smaller due to external limitations.
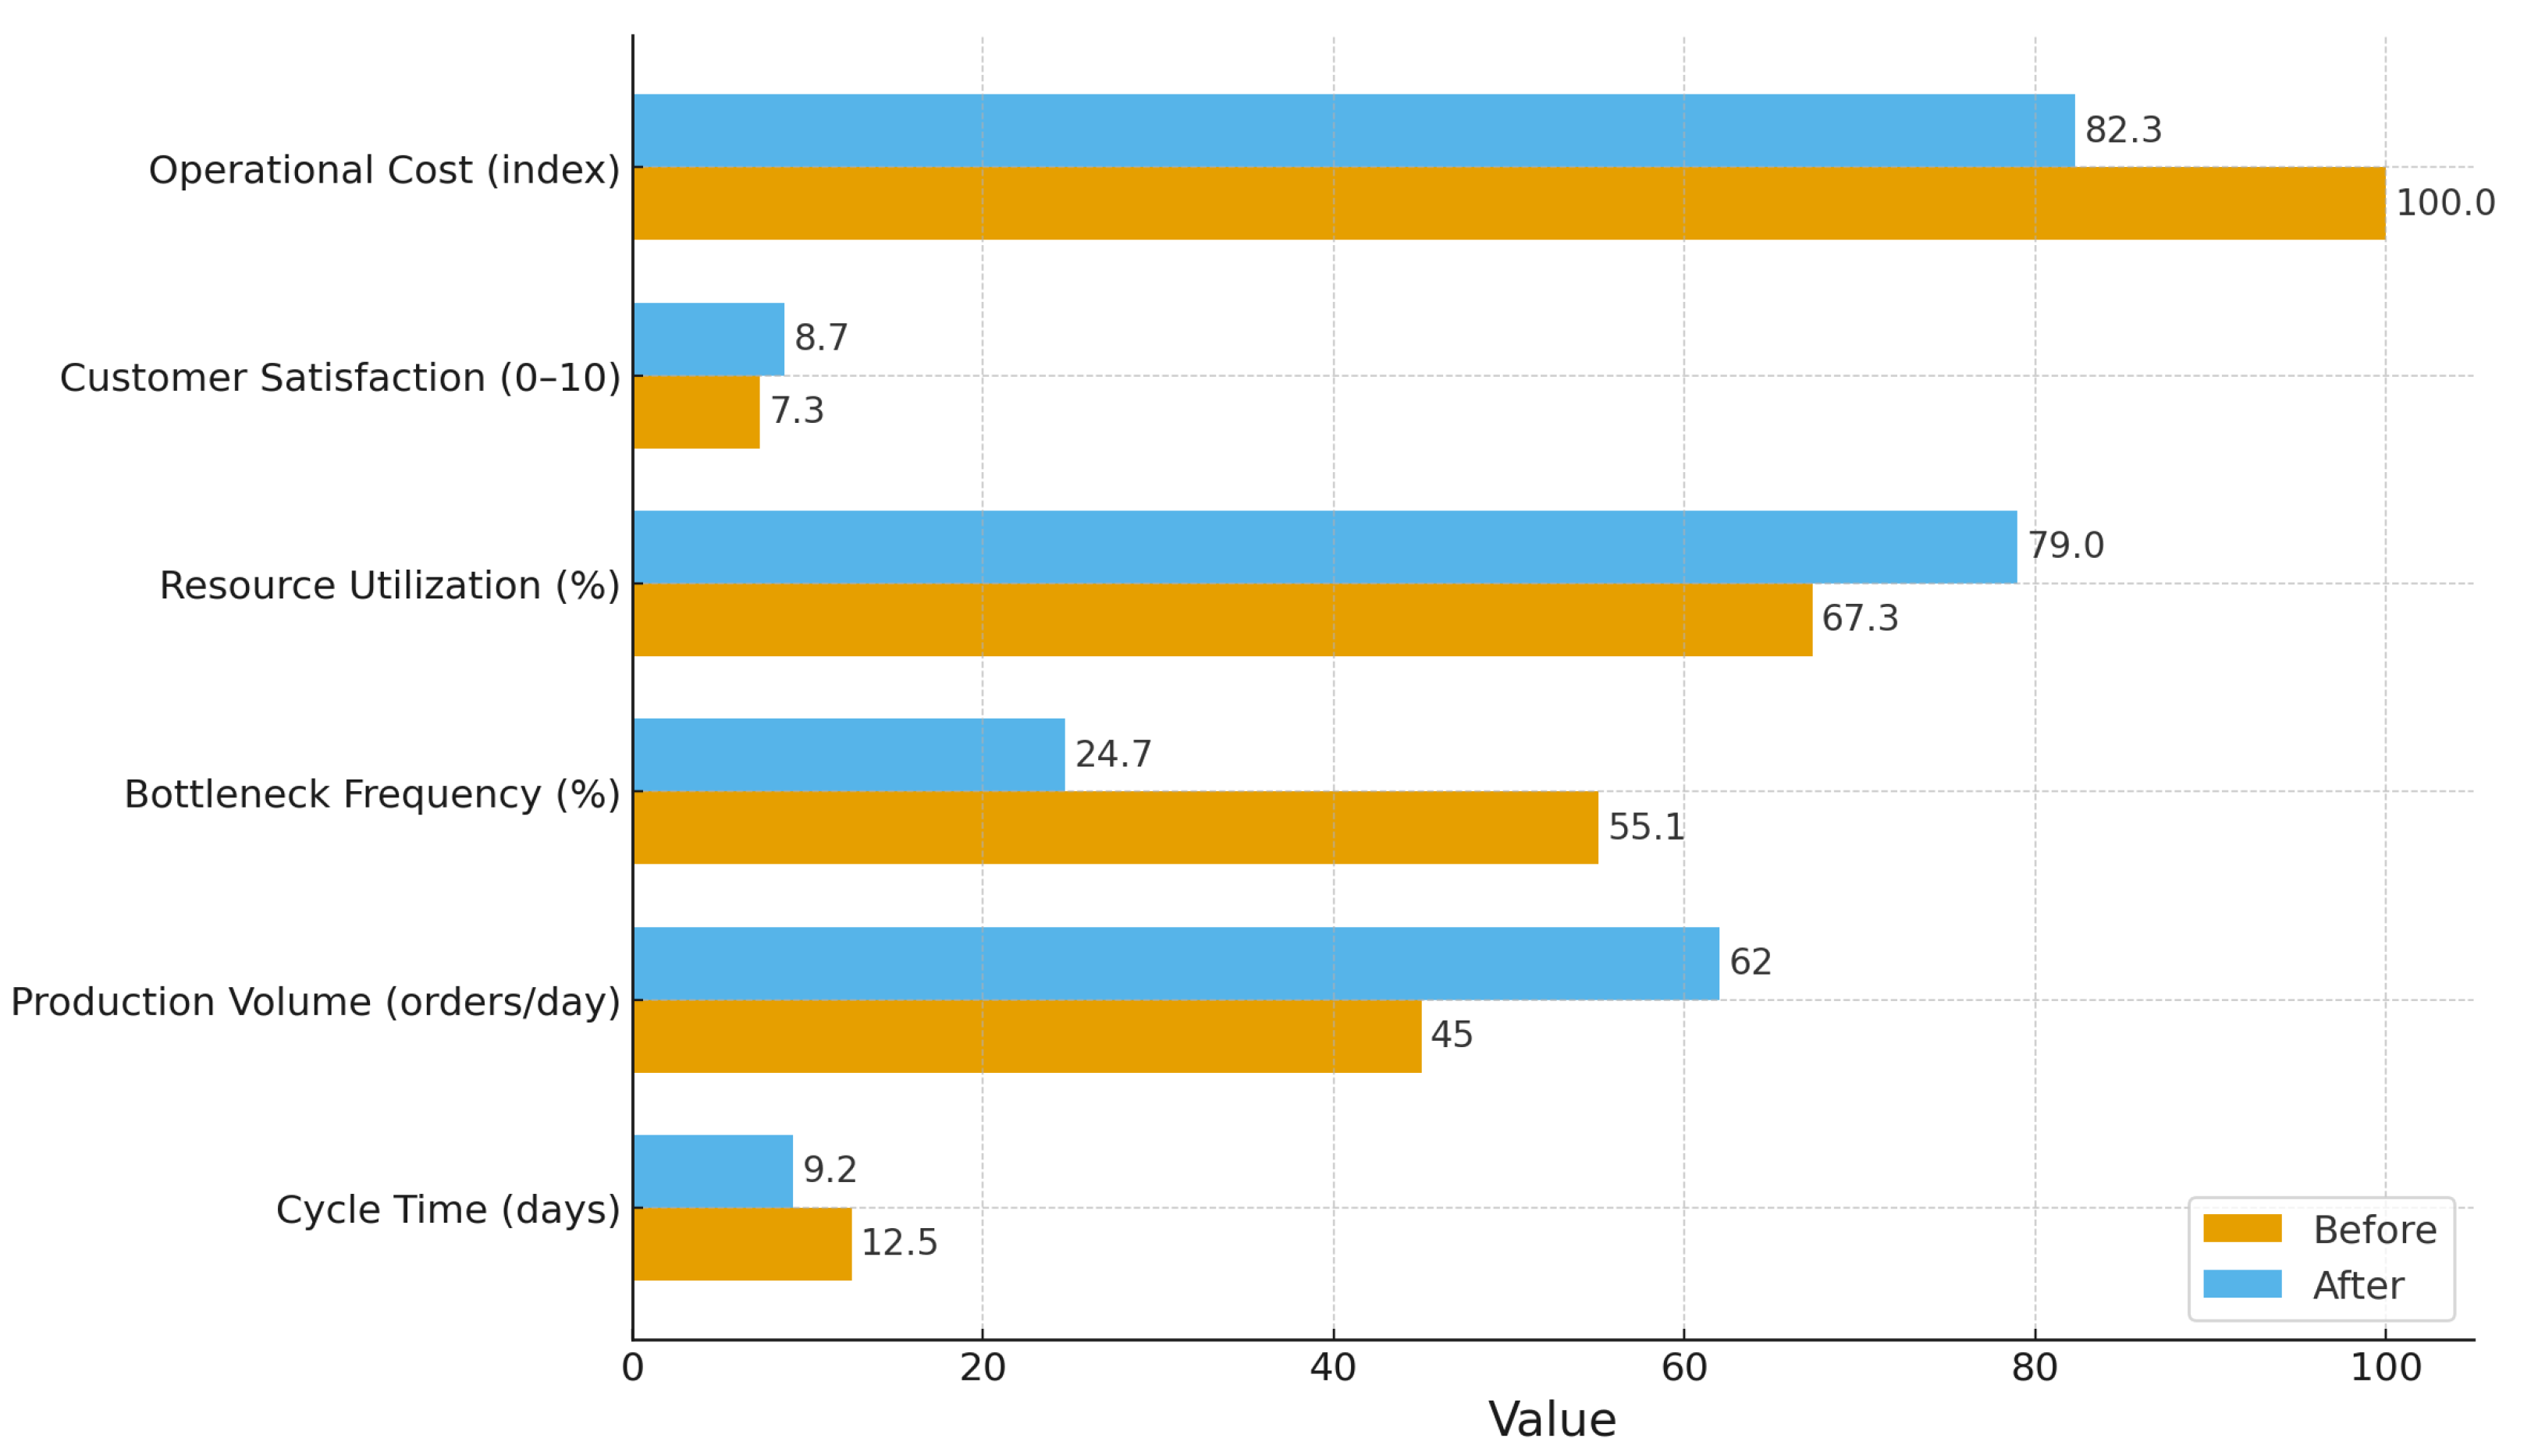
These localized scenario-level effects translated into broader system-wide improvements. Following implementation, key performance indicators—including cycle time, production volume, bottleneck frequency, resource utilization, customer satisfaction, and operational costs—all showed meaningful gains (Figure 6). The largest relative improvement was in bottleneck frequency (−55.1%), reflecting the scenarios’ focus on easing delays at key process constraints. Statistical validation confirmed these changes were significant (p < 0.001), with effect-size analysis highlighting practical impact—particularly in cycle time, throughput, and bottleneck reduction.
Operationally, three mechanisms appear to drive these results: (i) Reducing wait times at structurally central hand-offs (e.g., Service Desk → Resolution, Resolution → Closure) lowered queuing and variability; (ii) Throughput increased without risking overutilization, as interventions were triggered by high-utilization signals; (iii) Operational costs declined by cutting idle time between hand-offs, achieved through limited and targeted staffing adjustments.
This balance—higher throughput with controlled resource use—suggests that the fuzzy rules effectively identified high-leverage service conditions. Rather than forcing constant high-load operations, they enabled focused interventions that delivered significant efficiency gains when and where they mattered most.

4.6. Fuzzy Decision Tree Performance Evaluation

The performance of the proposed FDT was examined from both predictive accuracy and interpretability perspectives. While individual metrics provide an initial indication of effectiveness, a deeper evaluation is necessary to confirm robustness across different data partitions and to understand the transparency of the resulting model. Accordingly, the following subsections present a twofold analysis: cross-validation to assess generalization stability, and rule-based inspection to evaluate interpretability and practical relevance.
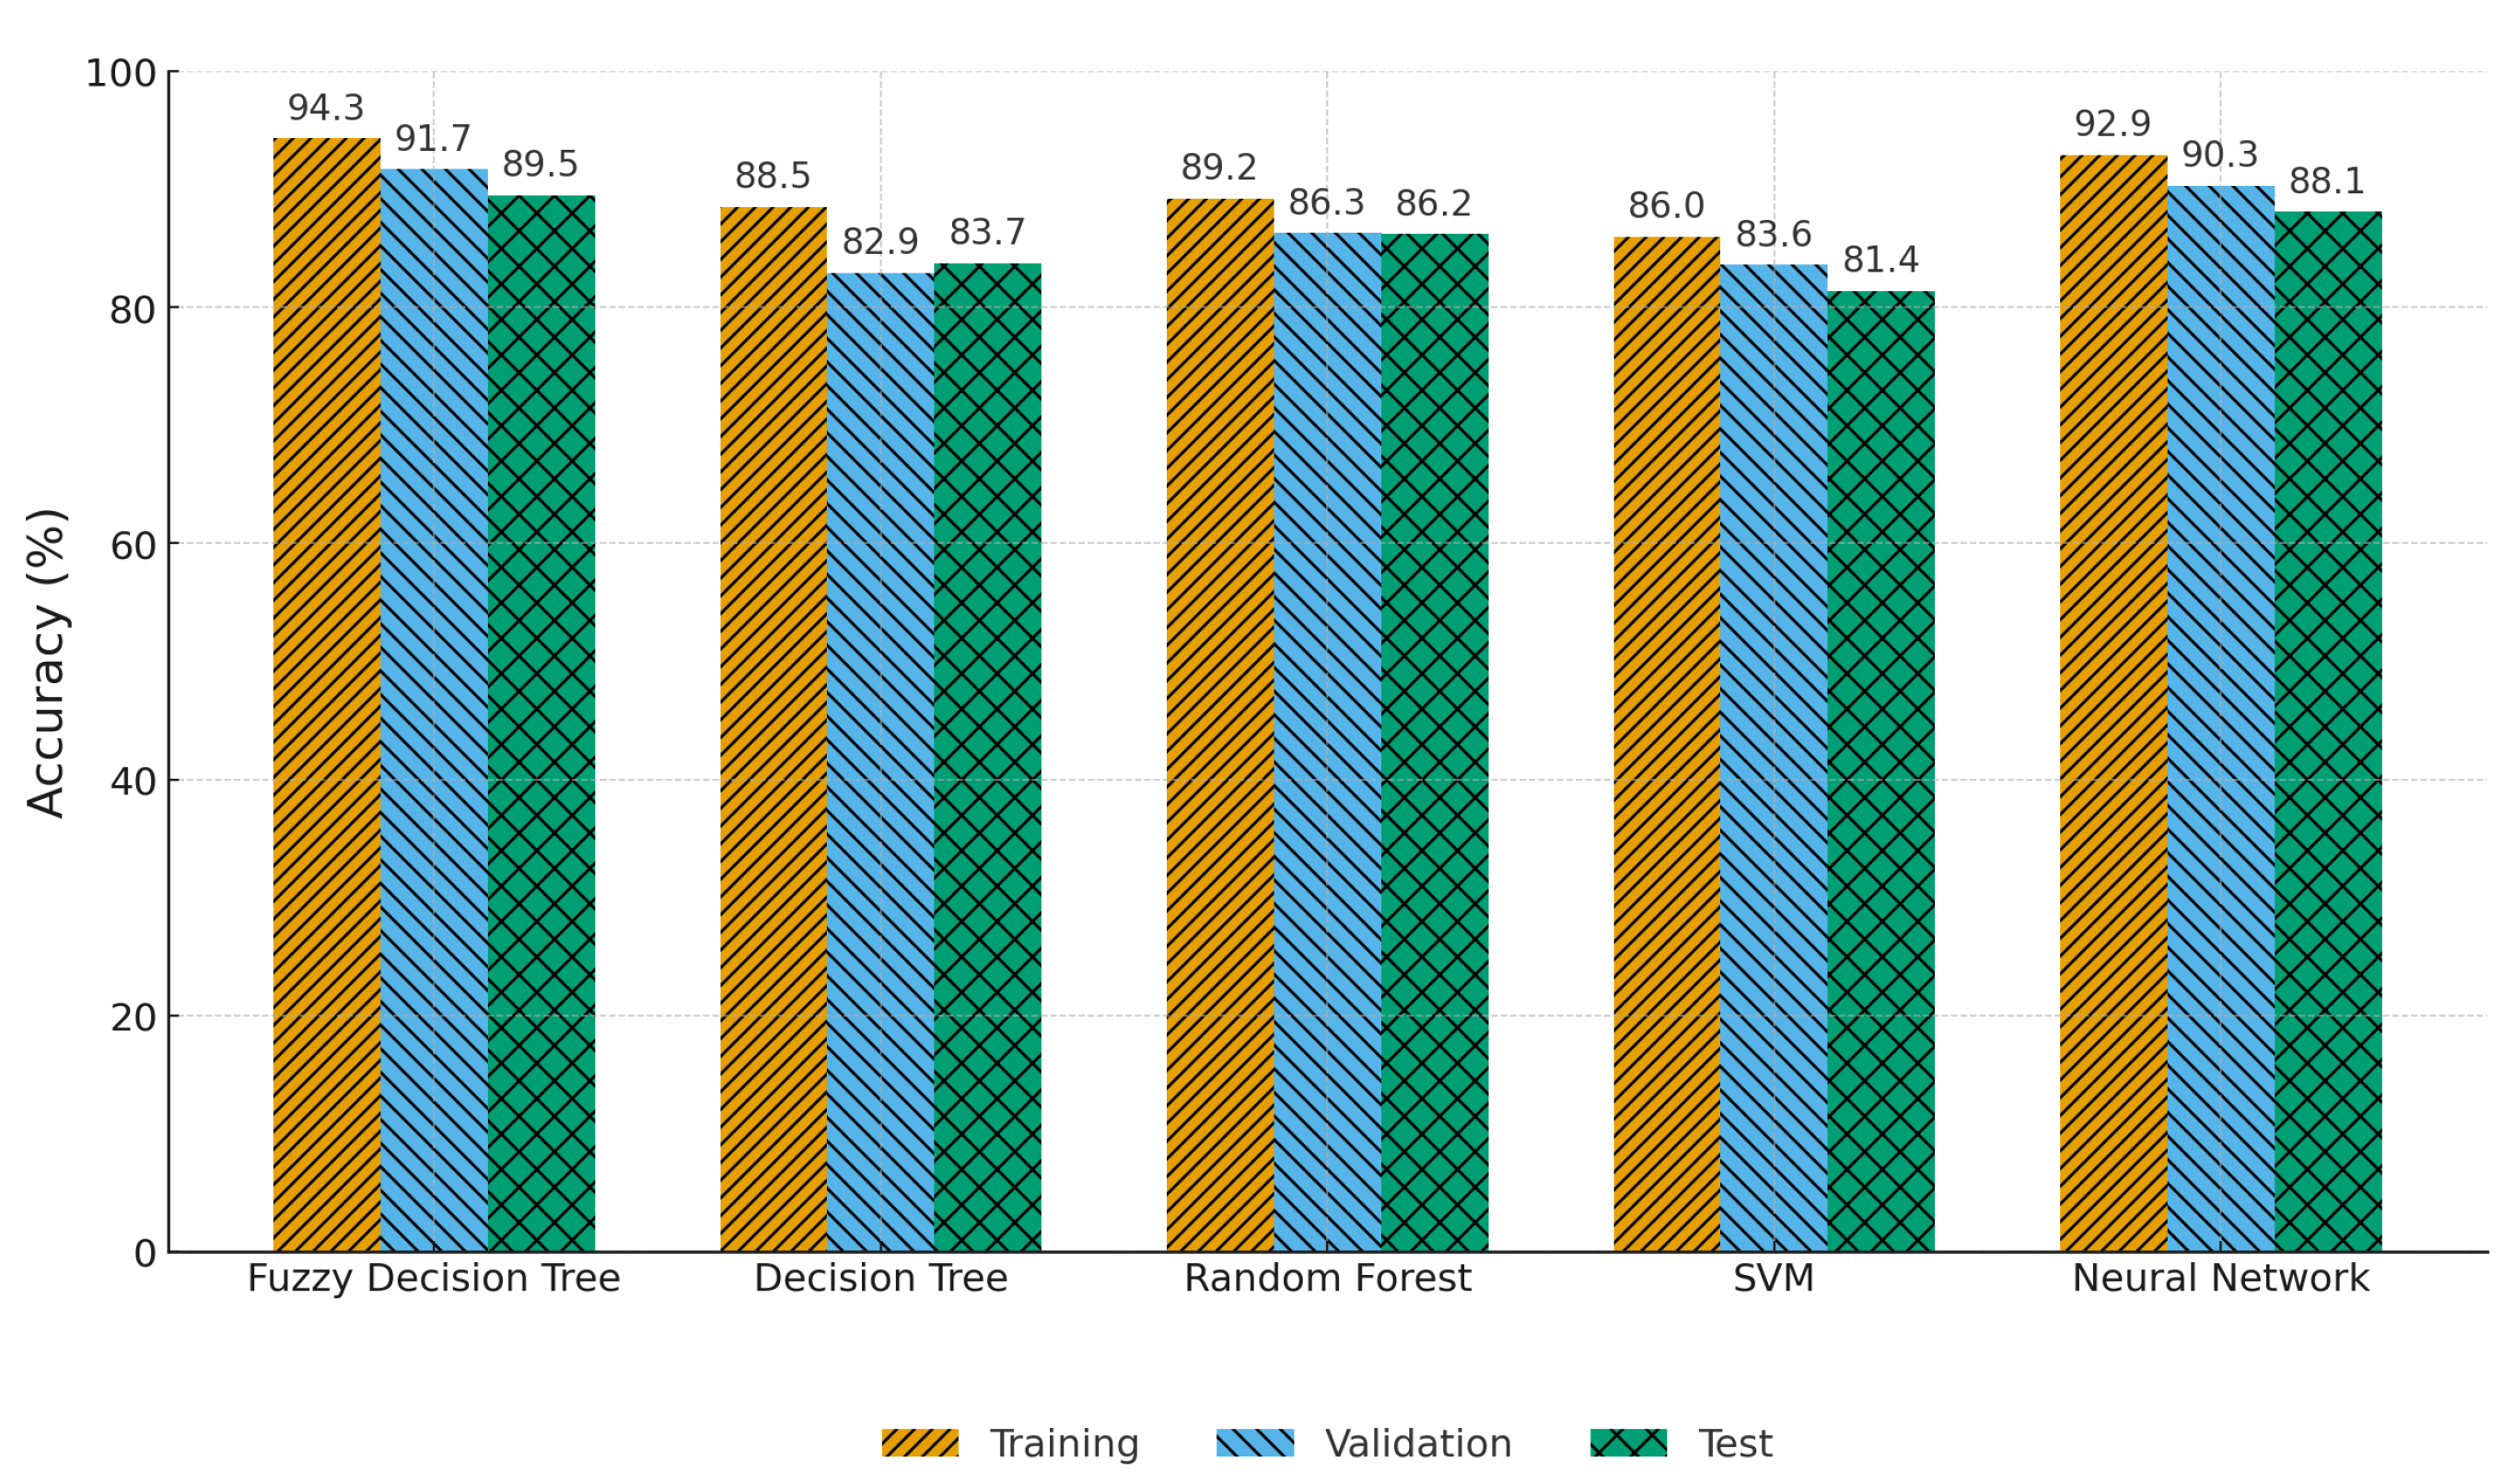
All models reported in Figure 7 and Figure 8 were trained on the same tabular features derived from the event-log preprocessing and bottleneck analysis described in Section 3. The input space combined case-level KPIs (cycle time, average waiting time, activity frequencies) with resource-related metrics (utilization and queue-related indicators). The FDT relied on the fuzzy partitions and pruning scheme introduced in Section 4.6.3. For the Random Forest classifier, an ensemble of 200 trees with a maximum depth of 10 was used, Gini impurity served as the split criterion, and class weights were balanced to account for mild class imbalance. The standard Decision Tree followed the same impurity measure and applied early stopping through a minimum number of samples per leaf. The Support Vector Machine used a radial basis function kernel, with the regularization parameter C and kernel width γ selected by grid search on the validation folds. The Neural Network was implemented as a fully connected feed-forward architecture with two hidden layers (32 and 16 units, ReLU activation), a soft-max output layer, dropout regularization of 0.2, and 2 weight decay. Training was carried out with the Adam optimizer for up to 100 epochs using mini-batches of size 32 and early stopping based on validation loss. Hyperparameters, including learning rate, regularization strength, and tree-depth parameters, were tuned by grid search within the same cross-validation protocol for all models.

4.6.1. Model Comparison and Accuracy Assessment

The comparative analysis of classification models revealed clear performance differences across training, validation, and test sets (Figure 7). The Fuzzy Decision Tree outperformed all other models, achieving 94.3% accuracy on training, 91.7% on validation, and 89.5% on test data. These results reflect strong predictive power and solid generalization, with minimal performance drop between seen and unseen data.
The Neural Network followed closely, posting 92.9%, 90.3%, and 88.1% across the respective datasets. Although slightly behind the Fuzzy Decision Tree, it maintained consistent accuracy and generalization.
Random Forest also delivered reliable results, especially on unseen data, with accuracies of 89.2% (training), 86.3% (validation), and 86.2% (test). This consistency indicates a strong resistance to over-fitting, a known strength of ensemble methods.
In contrast, the standard Decision Tree showed reduced predictive strength, particularly on test data (83.7%), and a wider gap between training and validation performance (88.5% vs. 82.9%), hinting at over-fitting.
Support Vector Machine performed the weakest overall, with a test accuracy of 81.4%, suggesting it was less effective in capturing the complexity of the dataset compared to fuzzy logic and ensemble-based models.
The fact that the fuzzy decision tree slightly outperforms the neural network, despite the latter being carefully designed and tuned, can be explained by the characteristics of the dataset and feature space. The data are purely tabular, of moderate size, and contain a limited number of engineered process metrics, a setting in which tree-based and ensemble methods are frequently competitive or superior to deeper neural architectures. In addition, the fuzzy decision tree benefits from the domain-informed fuzzy partitions described earlier, which encourage smooth decision boundaries and stable behavior under small data shifts, whereas the neural network requires substantially larger sample sizes to fully exploit its representational capacity.

4.6.2. Cross-Validation and Model Robustness

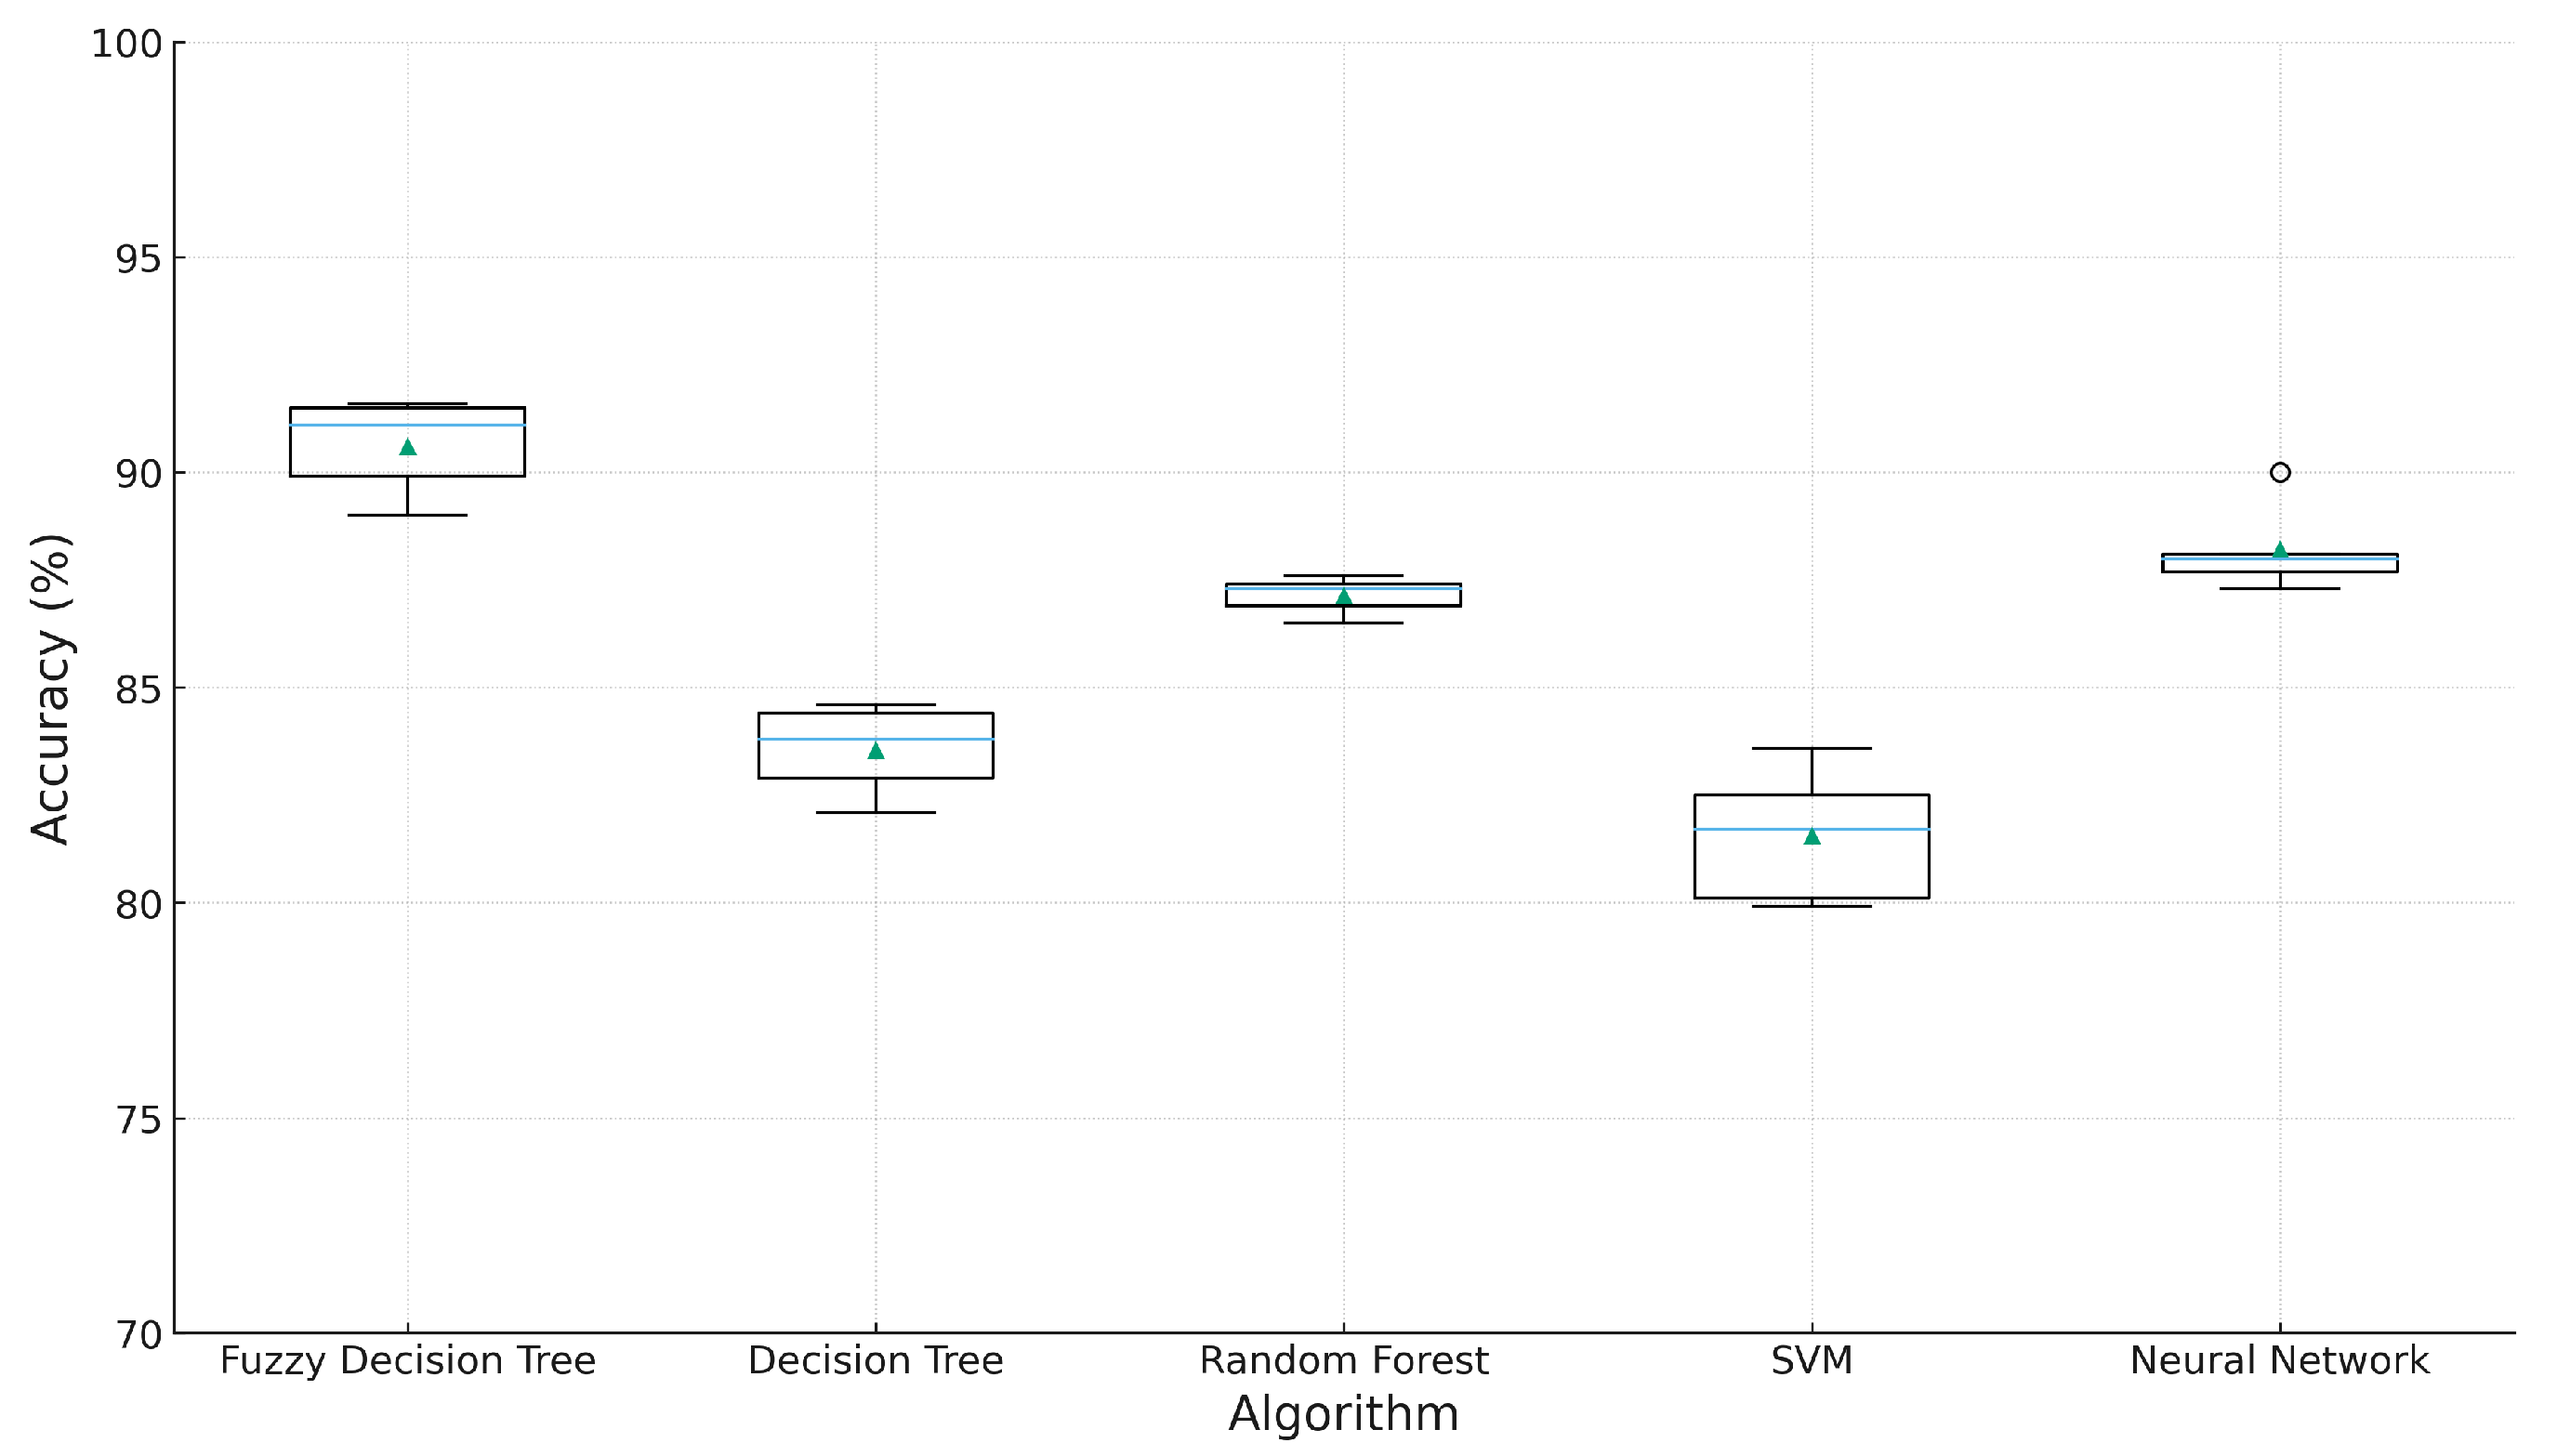
To assess robustness beyond a single split, the paper ran 5-fold cross-validation per algorithm and summarized mean accuracy, dispersion, and range. Results are given in Figure 8. The fuzzy decision tree achieved the highest mean accuracy with a tight spread (90.62% ± 1.13), indicating that its performance is both strong and stable across folds. Random Forest showed the lowest dispersion (std. 0.44) but a lower mean (87.14%), suggesting stable but slightly weaker generalization than FDT. Decision Tree and Neural Network exhibited moderate variability, while SVM had both the lowest mean (81.56%) and the highest variability (std. 1.58), implying sensitivity to fold composition.
In practical terms, the combination of high mean and low variance makes FDT the most reliable choice under resampling. The coefficient of variation also supports this: FDT 1.25%, Random Forest 0.50% (stable but lower mean), Neural Network 1.18%, Decision Tree 1.26%, and SVM 1.93%. Across-fold ranges further underline this: FDT [89.0, 91.6], Random Forest [86.5, 87.6], Decision Tree [82.1, 84.6], Neural Network [87.3, 90.0], SVM [79.9, 83.6].

4.6.3. Performance Improvements

After implementing the system, notable improvements were recorded across all key performance indicators (Figure 6). Cycle time dropped by 26.4% (from 12.5 to 9.2 days), indicating a more streamlined process and faster throughput. Production volume rose by 37.8% (from 45 to 62 orders per day), showing a significant boost in capacity and responsiveness.
The most striking change was in bottleneck frequency, which fell by 55.1% (from 55.1% to 24.7%). This sharp decline confirms that the main inefficiencies identified during initial analysis were effectively resolved, leading to a more stable and efficient workflow.
Resource utilization improved by 17.5% (from 67.3% to 79.0%), suggesting better use of available capacity without overloading systems. Customer satisfaction also rose by 19.2% (from 7.3 to 8.7 out of 10), highlighting that operational improvements had a direct positive impact on service quality and user experience. Additionally, operational costs were reduced by 17.7% (index 100 → 82.3), showing that efficiency improvements were not only performance-oriented but also economically beneficial.

4.7. Validation and Significance Testing

Statistical validation was carried out using paired t-tests on the simulated pre- and post-intervention values of each performance indicator obtained from the offline scenarios described in Section 4.5. Let x i and y i denote the value of a given KPI for case or period i under the baseline and simulated post-intervention configuration, respectively, and let d i = y i x i be the corresponding difference for i = 1 , , n . The sample mean and standard deviation of the differences are then defined by Equations (12) and (13).
d ¯ = 1 n i = 1 n d i
s d = 1 n 1 i = 1 n ( d i d ¯ ) 2
The paired t-statistic is computed by Equation (14).
t = d ¯ s d / n
which, under the null hypothesis of no change in the mean KPI value between the baseline and the simulated post-intervention configuration, follows a Student’s t distribution with n 1 degrees of freedom. Two-sided p-values are obtained from this reference distribution. In the present analysis, all resulting p-values were below 0.001 , indicating statistically significant improvements across all considered performance metrics in the offline scenarios.
To complement significance testing with an assessment of practical relevance, Cohen’s d for paired samples was used. In this setting, the effect size is given by Equation (15).
d = d ¯ s d
using the same mean difference d ¯ and standard deviation s d of the paired differences. Absolute values of d greater than 0.8 are generally interpreted as large effects. In the reported evaluation, effect sizes exceeded this threshold for cycle time reduction ( d = 1.23 ), production volume increase ( d = 1.45 ), and bottleneck frequency reduction ( d = 2.14 ), supporting the conclusion that the observed improvements are not only statistically significant but also operationally meaningful within the simulated intervention setting.
Taken together, the cross-validation analysis in Section 4.6.2 and the significance and effect-size analysis described in this subsection provide converging evidence that the fuzzy rule-based decision support system can transform process-mining diagnostics into actionable prescriptions that yield measurable gains under the evaluated offline scenarios. It should be emphasized that these results refer to simulated interventions on historical logs; no controlled online experiment was conducted during this study.

5. Discussion

From these results, it is observed that by integrating both diagnostic analysis and directive reasoning, an efficient and interoperable system is developed to manage information technology services. Though conventional process mining helps identify problems, such as bottlenecking, delay, and work overload, it is not capable of assisting proactive decision-making because it points out problems but does not offer any remedy. To address this shortcoming, a fuzzy rule-based decision support system interprets these diagnoses into direct commands to convert them into IF-THEN rules.
A comparison of fuzzy inference models has shown that FDT is more accurate and interpretable compared to other methods like fuzzy C-means clustering and decision lists. FDT is more accurate and provides rules that correspond to processes observed in reality rather than just following arbitrary patterns. This goes on to prove the validity of this model because these rules do not rely on assumptions but upon values observed in key performance indicators and their outcomes. The results being free from instabilities prove that these ideas can lead to better clarity without having to compromise on being more detailed.
The added value that can be obtained by integrating both diagnostic and prescriptive approaches could be seen in the case study about information technology service provision. The impact of this method on improving their processes led to a 26.4% decrease in the cycle time, a 55.1% decrease in bottlenecks, and a 17.7% decrease in operating costs. This shows how combining process mining and fuzzy logic improves both understanding and value addition.
One of its biggest strengths is that its rules can be interpreted easily. The rules state simple dynamics-related conditions. For example, when one sees “If wait time and resource utilization are high, increase staff,” one can logically conclude that this is true because they both impact each other. This ease of understanding is very advantageous because it provides an easy link to technical understanding, which can lead to its widespread acceptance among information-technology service teams.
Although several benefits are obtained, a few limitations must be acknowledged. First, as the number of process variables increases, the rule base can become too complex, leading to scalability and maintenance problems. Second, the calibration and validation of the fuzzy model demand a non-trivial amount of effort, particularly in the presence of large-scale and noisy event logs. Third, the current implementation assumes that process dynamics and SLA definitions evolve gradually; strong concept drift, such as the introduction of new activity types, changes in routing policies, or revised SLA targets, can gradually invalidate the learned rule base. In such cases, the fuzzy decision support layer has to be complemented with routine model monitoring and periodic or incremental retraining, as outlined in Section 3.3.2, or with explicit drift-detection mechanisms from the data-stream literature [49]. The design of fully self-adaptive fuzzy rule bases that remain prescriptive under sustained concept drift, therefore, constitutes an important direction for future research.
Beyond technical limitations, several ethical and organizational risks must also be considered before large-scale deployment. The availability of automatically generated fuzzy prescriptions can encourage over-reliance on the system, especially when high-priority rules are consistently presented as salient recommendations. Human employees’ unquestioning implementation of suggested steps can lead to a loss of expertise over time, as local experience and tacit knowledge become less utilized. Furthermore, rule-based interventions focused on improving cycle time or output may not always align with broader organizational goals, legal requirements, or principles of fairness and transparency. For example, some steps deemed appropriate by a narrow focus on efficiency may conflict with service level agreements, escalation rules, or human resources policies. To mitigate these risks, it is crucial that the proposed structure be supported by governance mechanisms, allowing managers to regularly review and validate rules, override recommendations when necessary, and ensure full compliance with corporate policy and legal requirements. In this regard, a fuzzy logic-based decision support layer should be considered a tool that complements human judgment and accountability.
The future research work can overcome these gaps by incorporating dynamic adaptation to rules and continuous learning. The reinforcement integration within the system could enable it to optimize recommendations and remove unnecessary rules dynamically. Further, incorporating adaptation to weighting could enable the system to dynamically tune the rules according to outcomes to ensure that organizational decisions remain relevant to its growing needs.

6. Conclusions

The incorporation of fuzzy inference into process mining is a milestone that signifies a paradigm shift—from analytics being a simple diagnosing tool to analytics being a capable, context-savvy intelligent decision support system. The developed prototype indicates that recommendations on how to manage processes on a real-time basis can actually be produced directly out of event logs, while simultaneously not compromising on understandability and without demanding specific knowledge about any particular domain. This is achieved by translating decision statements into linguistic fuzzy rules.
Trials on this hybrid model with a live information technology service process have affirmed its effectiveness. The system increased agility and efficiency, including a notable decrease within cyclic time, bottlenecking, and operation expenses. The explainability property of this model ensures that managers can analyze automation decisions and make corrections if necessary. The results above prove that PM can actually transcend mere problem identification but can also serve to design human-centric approaches to enhance long-term efficiency gains.
The future work can proceed on the following lines within the existing structure. Firstly, there is scope to enhance membership functions and rules within fuzzy decision trees and design online schemes to incorporate these periodically on observing new event data streams. Second, multi-objective optimization could be introduced to explicitly balance efficiency, compliance, and cost, for example, by learning fuzzy rules that trade off cycle time reduction against adherence to service-level and policy constraints. Third, user studies with managers and frontline staff would make it possible to assess perceived usefulness, trust, and cognitive load when interacting with fuzzy prescriptions and to refine the explanation formats accordingly. Fourth, tighter integration with existing BPM and IT service management platforms would allow the proposed approach to be embedded in live workflows and evaluated through prospective A/B tests or pilot deployments. Finally, the extension of the framework to additional process domains, such as healthcare or public-sector services, would provide further evidence regarding its generalizability and limitations.

Author Contributions

Conceptualization, O.D. and H.A.; methodology, O.D.; formal analysis, O.D.; investigation, O.D. and H.A.; writing—original draft preparation, O.D. and H.A.; writing—review and editing, O.D. and H.A.; administration, O.D. All authors have read and agreed to the published version of the manuscript.

Funding

This research received no external funding.

Institutional Review Board Statement

Not applicable.

Informed Consent Statement

Not applicable.

Data Availability Statement

The data are not publicly available due to privacy and contractual confidentiality obligations imposed by the organization that provided the event logs.

Conflicts of Interest

The authors declare no conflicts of interest.

References

  1. Muñoz-Gama, J.; Martin, N.; Fernandez-Llatas, C.; Johnson, O.A.; Sepúlveda, M.; Helm, E.; Gálvez-Yanjari, V.; Rojas, E.; Martinez-Millana, A.; Aloini, D.; et al. Process Mining for Healthcare: Characteristics and Challenges. J. Biomed. Inform. 2022, 127, 103994. [Google Scholar] [CrossRef] [PubMed]
  2. Dogan, O.; Oztaysi, B. Genders prediction from indoor customer paths by Levenshtein-based fuzzy kNN. Expert Syst. Appl. 2019, 136, 42–49. [Google Scholar] [CrossRef]
  3. Özdağoğlu, G.; Damar, M.; Erenay, F.S.; Turhan Damar, H.; Himmetoğlu, O.; Pinto, A.D. Monitoring patient pathways at a secondary healthcare services through process mining via Fuzzy Miner. BMC Med. Inform. Decis. Mak. 2025, 25, 199. [Google Scholar] [CrossRef] [PubMed]
  4. Navin, K.; Krishnan, M.B. Mukesh Fuzzy rule based classifier model for evidence based clinical decision support systems. Intell. Syst. Appl. 2024, 22, 200393. [Google Scholar]
  5. Reinhard, P.; Li, M.M.; Peters, C.; Leimeister, J.M. Enhancing IT Service Management Through Process Mining—A Digital Analytics Perspective on Documented Customer Interactions. In Digital Analytics im Dienstleistungsmanagement: Customer Insights, Prozesse der Künstlichen Intelligenz, Digitale Geschäftsmodelle; Springer: Berlin/Heidelberg, Germany, 2025; pp. 327–360. [Google Scholar]
  6. Kubrak, K.; Milani, F.; Nolte, A.; Dumas, M. Prescriptive process monitoring: Quo vadis? PeerJ Comput. Sci. 2022, 8, e1097. [Google Scholar] [CrossRef]
  7. Khamis, M.; Al-Mashat, K.; El-Ghonemy, H. A Hybrid Decision Support System Integrating Machine Learning and Operations Research for Supply Chain Optimization. Comput. Ind. Eng. 2025, 190, 109987. [Google Scholar]
  8. Orošnjak, M.; Saretzky, F.; Kedziora, S. Prescriptive Maintenance: A Systematic Literature Review and Exploratory Meta-Synthesis. Appl. Sci. 2025, 15, 8507. [Google Scholar] [CrossRef]
  9. Suh, J.; Kim, S.; Cho, M.; Kang, H.W. A Hybrid Decision Support System for Predicting Treatment Order Outcomes in Psychiatry. J. Med. Internet Res. 2025, 27, e45678. [Google Scholar]
  10. Cao, J.; Zhou, T.; Zhi, S.; Lam, S.; Ren, G.; Zhang, Y.; Wang, Y.; Dong, Y.; Cai, J. Fuzzy inference system with interpretable fuzzy rules: Advancing explainable artificial intelligence for disease diagnosis—A comprehensive review. Inf. Sci. 2024, 662, 120212. [Google Scholar] [CrossRef]
  11. Kostopoulos, G.; Davrazos, G.; Kotsiantis, S. Explainable artificial intelligence-based decision support systems: A recent review. Electronics 2024, 13, 2842. [Google Scholar] [CrossRef]
  12. van der Aalst, W.M.P. Process Mining: Data Science in Action; Springer: Berlin/Heidelberg, Germany, 2016. [Google Scholar]
  13. Reinkemeyer, L. Process mining in action. Process Min. Action Princ. Use Cases Outlook 2020, 11, 116–128. [Google Scholar]
  14. Chen, J.; Li, P.; Fang, W.; Zhou, N.; Yin, Y.; Xu, H.; Zheng, H. Fuzzy association rules mining based on type-2 fuzzy sets over data stream. Procedia Comput. Sci. 2022, 199, 456–462. [Google Scholar] [CrossRef]
  15. Novak, C.; Pfahlsberger, L.; Bala, S.; Revoredo, K.; Mendling, J. Enhancing decision-making of IT demand management with process mining. Bus. Process Manag. J. 2023, 29, 230–259. [Google Scholar] [CrossRef]
  16. Vázquez-Barreiros, B.; Chapela, D.; Mucientes, M.; Lama, M.; Berea, D. Process Mining in IT Service Management: A Case Study. In Proceedings of the ATAED@ Petri Nets/ACSD, Torun, Poland, 19–20 June 2016; pp. 16–30. [Google Scholar]
  17. Eggert, M.; Dyong, J. Applying process mining in small and medium sized it enterprises–challenges and guidelines. In Proceedings of the International Conference on Business Process Management, Münster, Germany, 11–16 September 2022; Springer: Berlin/Heidelberg, Germany, 2022; pp. 125–142. [Google Scholar]
  18. Donadello, I.; Di Francescomarino, C.; Maggi, F.M.; Ricci, F.; Shikhizada, A. Outcome-oriented prescriptive process monitoring based on temporal logic patterns. Eng. Appl. Artif. Intell. 2023, 126, 106899. [Google Scholar] [CrossRef]
  19. Porouhan, P. Process mining analysis to enhance systematic workflow of an IT company. Int. J. Simul. Process Model. 2022, 19, 148–181. [Google Scholar] [CrossRef]
  20. Bozorgi, Z.D.; Teinemaa, I.; Dumas, M.; La Rosa, M.; Polyvyanyy, A. Prescriptive process monitoring for cost-aware cycle time reduction. In Proceedings of the 2021 3rd International Conference on Process Mining (ICPM), Eindhoven, The Netherlands, 31 October–4 November 2021; IEEE: Piscataway, NJ, USA, 2021; pp. 96–103. [Google Scholar]
  21. Bozorgi, Z.D.; Teinemaa, I.; Dumas, M.; La Rosa, M.; Polyvyanyy, A. Prescriptive process monitoring based on causal effect estimation. Inf. Syst. 2023, 116, 102198. [Google Scholar] [CrossRef]
  22. Verhoef, B.J.; Dumas, M.; Teinemaa, I.; Maggi, F.M. Using Reinforcement Learning to Optimize Responses in Care Processes: A Prescriptive Process Mining Approach. In Proceedings of the Business Process Management Workshops, Utrecht, The Netherlands, 11–16 September 2023; Springer: Berlin/Heidelberg, Germany, 2023; pp. 57–69. [Google Scholar]
  23. Su, Z.; Polyvyanyy, A.; Lipovetzky, N.; Sardiña, S.; van Beest, N. Adaptive goal recognition using process mining techniques. Eng. Appl. Artif. Intell. 2024, 133, 108189. [Google Scholar] [CrossRef]
  24. De Moor, J.; Weytjens, H.; De Smedt, J.; De Weerdt, J. Simbank: From simulation to solution in prescriptive process monitoring. In Proceedings of the International Conference on Business Process Management, Vienna, Austria, 1–5 September 2025; Springer: Berlin/Heidelberg, Germany, 2025; pp. 165–182. [Google Scholar]
  25. Chen, Z.; McClean, S.; Tariq, Z.; Georgalas, N.; Adefila, A. Integrating IT Infrastructure Metrics into Business Process Mining: A Telecommunications Industry Case Study. In Proceedings of the 2025 12th International Conference on Information Technology (ICIT), Delhi, India, 17–19 December 2025; IEEE: Piscataway, NJ, USA, 2025; pp. 665–670. [Google Scholar]
  26. Chvirova, D.; Egger, A.; Fehrer, T.; Kratsch, W.; Röglinger, M.; Wittmann, J.; Wördehoff, N. A multimedia dataset for object-centric business process mining in IT asset management. Data Brief 2024, 55, 110716. [Google Scholar] [CrossRef]
  27. Bouacha, M.; Sbai, H. Business-IT Alignment in Cloud environment: Survey on the use of process mining. In Proceedings of the 2023 14th International Conference on Intelligent Systems: Theories and Applications (SITA), Rabat, Morocco, 19–20 October 2023; IEEE: Piscataway, NJ, USA, 2023; pp. 1–6. [Google Scholar]
  28. Caizaguano, C.O.C.; Fonseca, E.R.; Caizaguano, C.S.; Vega, M.D.; Bazán, P. Modelo de Gestión de Residuos de Equipos de Informática y Telecomunicaciones (REIT) mediante la Minería de Procesos; Technical Report E45; Associação Ibérica de Sistemas e Tecnologias de Informacao: Lisbon, Portugal, 2021. [Google Scholar]
  29. Phasom, P.; Chum-Im, N.; Kungcharoen, K.; Premchaiswadi, N.; Premchaiswadi, W. Process mining for improvement of IT service in automobile industry. In Proceedings of the 2021 19th International Conference on ICT and Knowledge Engineering (ICT&KE), Bangkok, Thailand, 24–26 November 2021; IEEE: Piscataway, NJ, USA, 2021; pp. 1–7. [Google Scholar]
  30. Magnus, H.; Silva, J.; Fialho, J.; Wanzeller, C. Process Mining–case study in a process of IT incident management. In Proceedings of the CAPSI 2020 Proceedings, Lisbon, Portugal, 12–13 November 2020; p. 25. [Google Scholar]
  31. Sundararaj, A.; Knittl, S.; Grossklags, J. Challenges in IT Security Processes and Solution Approaches with Process Mining. In Proceedings of the International Workshop on Security and Trust Management, Guildford, UK, 14–18 September 2020; Springer: Berlin/Heidelberg, Germany, 2020; pp. 123–138. [Google Scholar]
  32. Sakchaikun, J.; Tumswadi, S.; Palangsantikul, P.; Porouhan, P.; Premchaiswadi, W. IT help desk service workflow relationship with process mining. In Proceedings of the 2018 16th International Conference on ICT and Knowledge Engineering (ICT&KE), Phuket, Thailand, 21–23 November 2018; IEEE: Piscataway, NJ, USA, 2018; pp. 1–5. [Google Scholar]
  33. Kang, C.J.; Kang, Y.S.; Lee, Y.S.; Noh, S.; Kim, H.C.; Lim, W.C.; Kim, J.; Hong, R. Process Mining-based Understanding and Analysis of Volvo IT’s Incident and Problem Management Processes. In Proceedings of the BPIC@ BPM, Beijing, China, 26 August 2013; Volume 85. [Google Scholar]
  34. Paszkiewicz, Z.; Picard, W. Analysis of the Volvo IT Incident and Problem Handling Processes using Process Mining and Social Network Analysis. In Proceedings of the BPIC@ BPM, Beijing, China, 26 August 2013. [Google Scholar]
  35. Edgington, T.M.; Raghu, T.; Vinze, A.S. Using process mining to identify coordination patterns in IT service management. Decis. Support Syst. 2010, 49, 175–186. [Google Scholar] [CrossRef]
  36. Gerke, K.; Tamm, G. Continuous quality improvement of IT processes based on reference models and process mining. In Proceedings of the 15th Americas Conference on Information Systems, San Francisco, CA, USA, 6–9 August 2009; Springer: Berlin/Heidelberg, Germany, 2009; p. 786. [Google Scholar]
  37. Wang, J.; Gui, L.; Zhu, H. Incremental fuzzy temporal association rule mining using fuzzy grid tables. Appl. Intell. 2021, 52, 1389–1405. [Google Scholar] [CrossRef]
  38. Saatchi, R. Fuzzy logic concepts, developments and implementation. Information 2024, 15, 656. [Google Scholar] [CrossRef]
  39. Dogan, O.; Avvad, H. Fuzzy Clustering Based on Activity Sequence and Cycle Time in Process Mining. Axioms 2025, 14, 351. [Google Scholar] [CrossRef]
  40. Alateeq, M.; Pedrycz, W. Logic-oriented fuzzy neural networks: A survey. Expert Syst. Appl. 2024, 257, 125120. [Google Scholar] [CrossRef]
  41. Oleksii, D.; Zoia, S.; Gegov, A.; Arabikhan, F. Application of fuzzy decision support systems in IT industry functioning. In Proceedings of the International Conference on Information and Knowledge Systems, Kharkiv, Ukraine, 4–6 October 2023; Springer: Berlin/Heidelberg, Germany, 2023; pp. 283–295. [Google Scholar]
  42. SS Júnior, J.; Mendes, J.; Souza, F.; Premebida, C. Survey on deep fuzzy systems in regression applications: A view on interpretability. Int. J. Fuzzy Syst. 2023, 25, 2568–2589. [Google Scholar] [CrossRef]
  43. Wang, T.; Gault, R.; Greer, D. Data Informed Initialization of Fuzzy Membership Functions. Int. J. Fuzzy Syst. 2025, 1–12. [Google Scholar] [CrossRef]
  44. Janikow, C.Z. Fuzzy decision trees: Issues and methods. IEEE Trans. Syst. Man, Cybern. 1998, 28, 1–14. [Google Scholar] [CrossRef]
  45. Zadeh, L.A. Fuzzy sets. Inf. Control 1965, 8, 338–353. [Google Scholar] [CrossRef]
  46. Niu, J.; Chen, D.; Li, J.; Wang, H. Fuzzy Rule Based Classification Method for Incremental Rule Learning. IEEE Trans. Fuzzy Syst. 2022, 30, 3748–3761. [Google Scholar] [CrossRef]
  47. Pascual-Fontanilles, J.; Valls, A.; Moreno, A.; Romero-Aroca, P. Continuous Dynamic Update of Fuzzy Random Forests. Int. J. Comput. Intell. Syst. 2022, 15, 1–17. [Google Scholar] [CrossRef]
  48. Tavares, E.; Moita, G.F.; Silva, A.M. eFC–Evolving Fuzzy Classifier with Incremental Clustering Algorithm Based on Samples Mean Value. Big Data Cogn. Comput. 2024, 8, 183. [Google Scholar] [CrossRef]
  49. Mehmood, H.; Kostakos, P.; Cortes, M.; Anagnostopoulos, T.; Pirttikangas, S.; Gilman, E. Concept Drift Adaptation Techniques in Distributed Environment for Real-World Data Streams. Smart Cities 2021, 4, 349–371. [Google Scholar] [CrossRef]
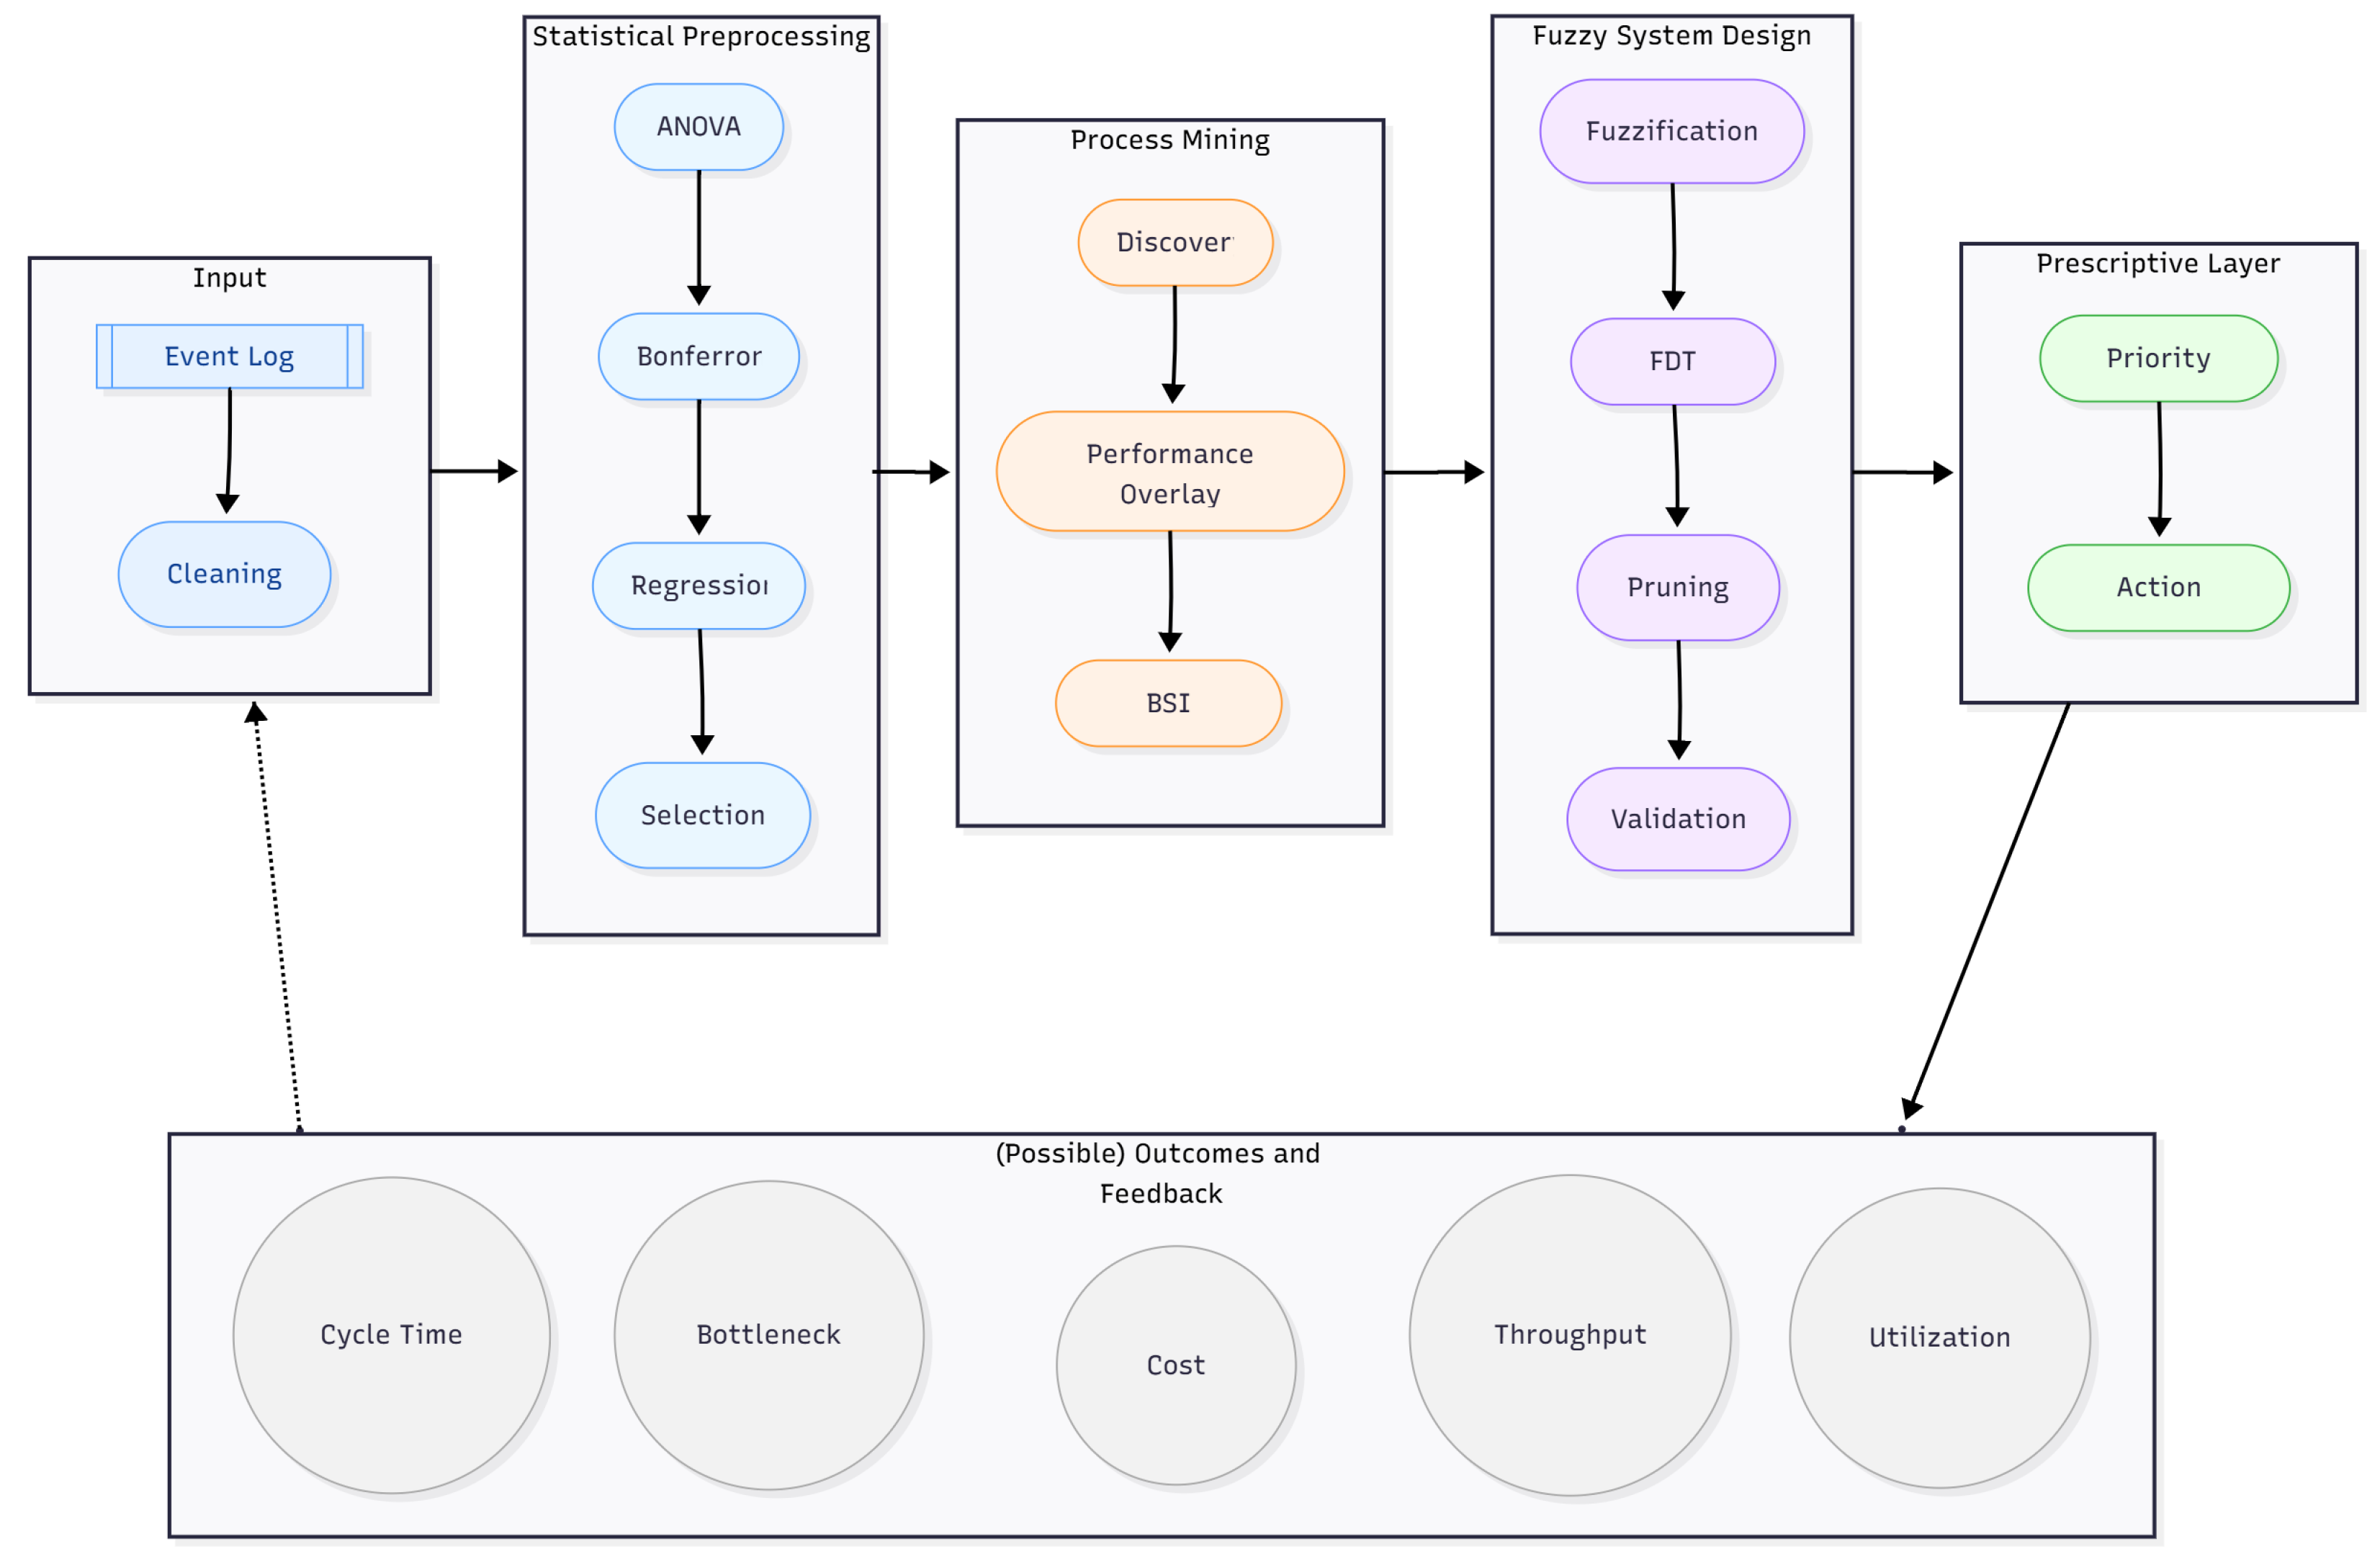
Figure 1. Methodological framework.
Applsci 15 12402 g001
Figure 2. Statistical preprocessing flow.
Applsci 15 12402 g002
Figure 3. (a) As-is process map based on frequency (b) As-is process map based on performance.
Applsci 15 12402 g003
Figure 4. Top 10 Bottleneck Severity Index (BSI).
Applsci 15 12402 g004
Figure 5. Top-10 fuzzy rules ranked by confidence (higher is better).
Applsci 15 12402 g005
Figure 6. Comprehensive comparison of key performance metrics.
Applsci 15 12402 g006
Figure 7. Comparative analysis of machine learning algorithms.
Applsci 15 12402 g007
Figure 8. Five-fold cross-validation accuracies per algorithm (means shown as triangles).
Applsci 15 12402 g008
Table 1. Comparison of Different Studies on Diagnostic and Prescription Mechanisms.
StudyMethod UsedDiagnosis ProvidedPrescription MechanismLimitations
[25]Case study integrating IT metrics with process mining in telecom operationsIdentifies performance bottlenecks and misalignments between IT resources and business processesCombines IT logs with event data to recommend resource allocation improvementsLimited to one telecom case; lacks cross-industry validation
[26]Dataset construction and validation for object-centric process miningReveals fragmented event data and lack of object-level process visibility in IT asset systemsProvides an annotated dataset enabling event correlation across IT assetsDataset is synthetic; limited testing on real IT environments
[27]Conceptual framework and survey analysis on business–IT alignment in cloud environmentsHighlights lack of automation and weak formalization in Business–IT alignmentProposes process mining for dynamic resource allocation and alignment in cloud-based BPaaSConceptual; not empirically validated or implemented
[15]Action research integrating process mining with IT demand managementDiagnoses inefficiencies and lack of visibility in IT change processesUses process mining to support operational decision-making and risk identificationEvaluated on limited insurance cases; lacks generalization
[17]Case study on process mining adoption in an IT SMEIdentifies challenges such as data quality issues, resource scarcity, and low process maturityProvides practical guidelines for SMEs to implement process mining effectivelyFocused on one IT SME; results not broadly generalizable
[28]Process mining framework for IT and telecommunication equipment waste management (REIT model)Identifies inefficiencies in recycling and disposal workflows for IT assetsApplies process mining to monitor compliance and improve e-waste process controlFocused on simulation and conceptual validation; lacks large-scale industrial testing
[29]Fuzzy Miner and Social Network Miner applied to IT help-desk event logsDetects excessive service-time violations and unbalanced workload among IT staffSuggests workload redistribution and SLA re-definition through social-network analysisLimited to one IT service department; no automation or predictive component
[30]Case study of process mining in IT incident-management processDiagnoses bottlenecks and delays in IT incident resolution workflowsUses discovered process models to enhance incident-management efficiency and transparencyApplied in a single organization; lacks quantitative evaluation of improvement results
[31]Experimental case study using conformance checking for Identity and Access Management (IAM) processesDetects deviations and anomalous user-access behaviors in IAM workflowsProposes conformance-based detection integrated with threat analysis for cybersecurity monitoringDemonstrated on simulated IAM data; limited coverage of real-world security complexity
[32]Correlational analysis of IT help-desk workflow using process mining techniquesReveals relationships between IT service activities, highlighting repetitive inefficienciesImplements relationship mapping to improve coordination and streamline service deliveryRestricted to internal IT workflow; no generalization beyond case study environment
[16]Case study of process mining in IT service management (ITSM)Identifies inefficiencies, redundant steps, and SLA violations in IT support processesSuggests SLA redesign and improved workflow automation based on discovered event logsLimited to a single IT service provider; lacks statistical generalization
[33]Event log analysis of IT help-desk processes using ProM tools (BPI Challenge 2013 dataset)Reveals service bottlenecks and suboptimal escalation patterns in IT problem managementApplies performance analysis to enhance process transparency and issue resolution speedFocuses only on Volvo IT dataset; lacks predictive or adaptive modeling
[34]Combined process mining and social network analysis for IT incident handlingDetects coordination gaps between IT service agents and departmentsIntegrates social network mapping with process models to improve collaboration efficiencyLimited dataset; analysis scope restricted to incident coordination only
[35]Structural equation modeling (SEM) integrated with process mining on IT service dataIdentifies hidden coordination constructs (Observe, Discover, Produce, Context) within IT service outsourcing processesRecommends SLA refinements and governance mechanisms for aligning provider and client objectivesFocused on one U.S. government outsourcing case; no validation across other industries
[36]ITIL-based reference modeling combined with process mining for continuous quality improvementDiagnoses deviations between designed (to-be) and executed (as-is) IT service processesImplements ITIL KPIs with process mining for monitoring compliance and detecting inefficienciesDemonstrated on CRM support process; lacks multi-organizational validation
[37]Incremental fuzzy temporal association rule miningEfficient discovery of evolving temporal patterns and frequent itemsetsNot explicit (focuses on mining efficiency, no direct prescriptive rules)Needs efficiency improvements; limited to temporal association mining
Table 2. Top 10 transitions causing bottleneck.
TransitionFrequencyP90 Wait (h)BSI
Detailed Investigation–Awaiting Vendor112566.510.613
Detailed Investigation–Implement Fix34247.930.533
Validate Resolution–Customer Confirmation150046.460.517
Vendor Response–Awaiting Vendor55665.720.512
Implement Fix–Validate Resolution34244.460.506
Validate Resolution–Detailed Investigation19248.250.284
Awaiting Vendor–Vendor Response16813.810.208
Triage–Initial Diagnosis15005.490.19
Customer Confirmation–Ticket Closed15005.40.19
Ticket Created–Triage15004.050.179
Table 3. Representative fuzzy rules with support, confidence, and lift.
Antecedent (IF…)Consequent (THEN…)Support (%)Confidence (%)Lift
Cycle Time is LOW & Resource Utilization is HIGHThroughput is HIGH12.491.01.31
Queue Length is LOW & Bottleneck Frequency is LOWDelay Risk is LOW10.889.51.27
Setup Time is LOW & OEE is HIGHOperational Cost is LOW9.988.41.22
WIP is MEDIUM & Resource Utilization is HIGHProduction Volume is HIGH11.287.61.18
Cycle Time is MEDIUM & Queue Length is LOWCustomer Satisfaction is HIGH8.786.21.15
Bottleneck Frequency is LOW & OEE is HIGHCycle Time is LOW7.585.71.14
Setup Time is LOW & WIP is LOWThroughput is HIGH6.984.91.12
Resource Utilization is HIGH & OEE is MEDIUMOperational Cost is LOW5.883.51.10
Table 4. Scenario-level interventions and observed waiting-time effects (IT service process).
ScenarioActionBeforeAfter
Incident Resolution bottleneckAssign backup resolver (rule-triggered)4.2 h1.8 h
Service Desk overloadRedistribute tickets across agents6.8 h2.9 h
Vendor delayTrigger early escalation protocol5.1 h2.4 h
Relative improvements: 57.1%, 57.4%, and 52.9%, respectively.
Disclaimer/Publisher’s Note: The statements, opinions and data contained in all publications are solely those of the individual author(s) and contributor(s) and not of MDPI and/or the editor(s). MDPI and/or the editor(s) disclaim responsibility for any injury to people or property resulting from any ideas, methods, instructions or products referred to in the content.